Microstructure and tensile properties of grey cast iron
34
Microstructure and tensile properties of grey cast iron Attila Diószegi, Vasilios Fourlakidis and Ingvar L Svensson Department of Mechanical Engineering and Industrial Organisation / Component Technology, Jönköping University Box 1026, SE-551 11 Jönköping, Sweden (Research report 04:1 ISSN 1404-0018, School of Engineering, Jönköping University Sweden, 2004.) Abstract Gray cast iron is a widely used construction material with a unique combination of properties such as very good thermal conductivity, vibration damping ability, and good machinability. The production method of casting is convenient to achieve a near final shape of complex geometries. A significant use of this beneficial construction materials can be found in diesel engine components, including cylinder heads, cylinder blocks and piston rings. Environmental and economic factors necessitate the development and optimization of engine components. The present paper summarizes a study of major process and material parameters to maximize and optimize the mechanical properties under static load of grey cast iron. The tensile strength of grey cast iron has been discussed by revealing the fracture mechanism of the material at failure. The ultimate tensile strength is clearly the result of the intimate collaboration between the graphite flake and the primary phases. Several parameters, including the graphite morphology, carbon content, inoculation, and cooling conditions during solidification influence the ultimate tensile strength by affecting the equilibrium between the major constituents and cracks in the metallic matrix. A model to predict the ultimate tensile strength is developed based on the interpretation of the stress intensity behaviour in a eutectic cell. Keywords: Grey iron, eutectic cell, primary austenite, graphite morphology, carbon content, inoculation, cooling rate, mechanical properties, tensile strength, maximum stress intensity factor. 2
Transcript of Microstructure and tensile properties of grey cast iron
Microstructure and tensile properties of
grey cast iron
Attila Diószegi, Vasilios Fourlakidis and Ingvar L Svensson
Department of Mechanical Engineering and Industrial Organisation / Component Technology, Jönköping University Box 1026, SE-551 11 Jönköping, Sweden
(Research report 04:1 ISSN 1404-0018, School of Engineering, Jönköping University Sweden, 2004.)
Abstract Gray cast iron is a widely used construction material with a unique combination of properties such as very good thermal conductivity, vibration damping ability, and good machinability. The production method of casting is convenient to achieve a near final shape of complex geometries. A significant use of this beneficial construction materials can be found in diesel engine components, including cylinder heads, cylinder blocks and piston rings. Environmental and economic factors necessitate the development and optimization of engine components. The present paper summarizes a study of major process and material parameters to maximize and optimize the mechanical properties under static load of grey cast iron. The tensile strength of grey cast iron has been discussed by revealing the fracture mechanism of the material at failure. The ultimate tensile strength is clearly the result of the intimate collaboration between the graphite flake and the primary phases. Several parameters, including the graphite morphology, carbon content, inoculation, and cooling conditions during solidification influence the ultimate tensile strength by affecting the equilibrium between the major constituents and cracks in the metallic matrix. A model to predict the ultimate tensile strength is developed based on the interpretation of the stress intensity behaviour in a eutectic cell. Keywords: Grey iron, eutectic cell, primary austenite, graphite morphology, carbon content, inoculation, cooling rate, mechanical properties, tensile strength, maximum stress intensity factor.
2
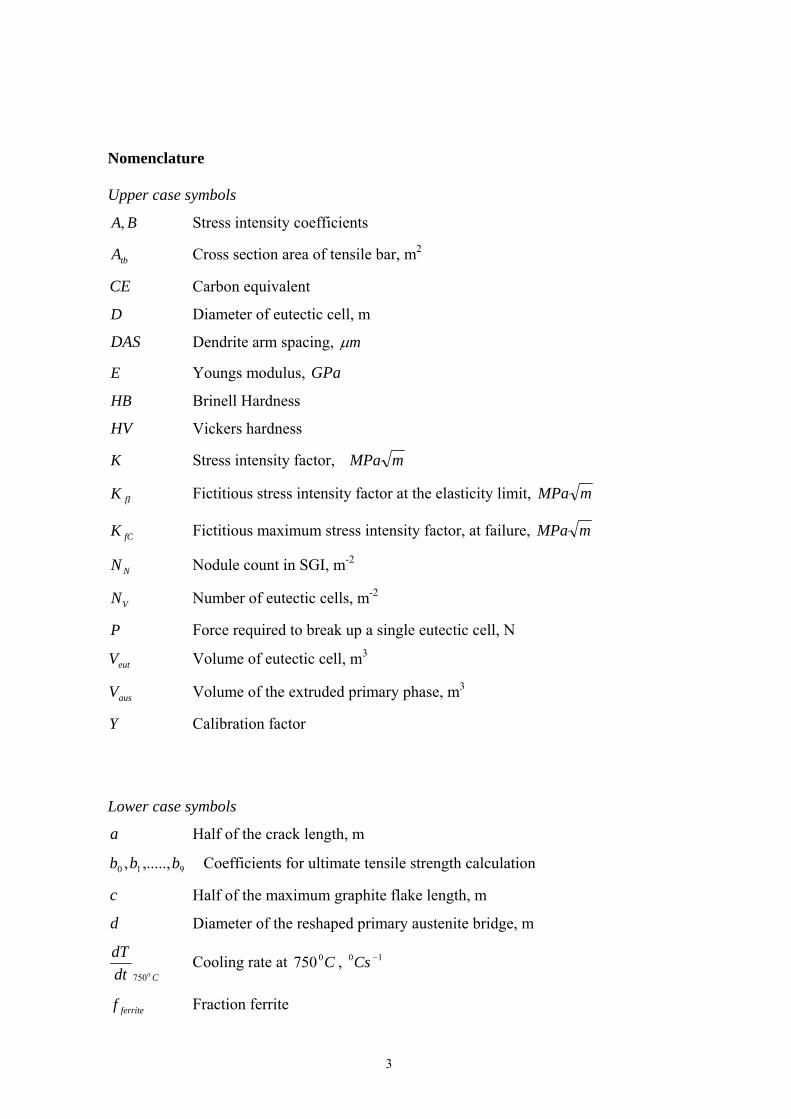
Nomenclature Upper case symbols
BA, Stress intensity coefficients
tbA Cross section area of tensile bar, m2
CE Carbon equivalent
D Diameter of eutectic cell, m
DAS Dendrite arm spacing, mµ
E Youngs modulus, GPa
HB Brinell Hardness
HV Vickers hardness
K Stress intensity factor, mMPa
fIK Fictitious stress intensity factor at the elasticity limit, mMPa
fCK Fictitious maximum stress intensity factor, at failure, mMPa
NN Nodule count in SGI, m-2
VN Number of eutectic cells, m-2
P Force required to break up a single eutectic cell, N
eutV Volume of eutectic cell, m3
ausV Volume of the extruded primary phase, m3
Y Calibration factor
Lower case symbols
a Half of the crack length, m
910 ,.....,, bbb Coefficients for ultimate tensile strength calculation
c Half of the maximum graphite flake length, m
d Diameter of the reshaped primary austenite bridge, m
CodtdT
750 Cooling rate at , C0750 10 −Cs
ferritef Fraction ferrite
3

ausf Fraction primary austenite
primf Fraction primary phases including the primary austenite and primary
carbide
whitef Fraction primary carbide
k Material constant, N m-1 m-1/2
yrr, Radius of the plastic zone, m
Greek symbols
γ Specific surface energy, Nm-1
UTSε Ultimate elongation, %
yσσ , Applied stress, MPa
YSσ Yield strength, MPa
UTSσ Ultimate tensile strength, MPa
4
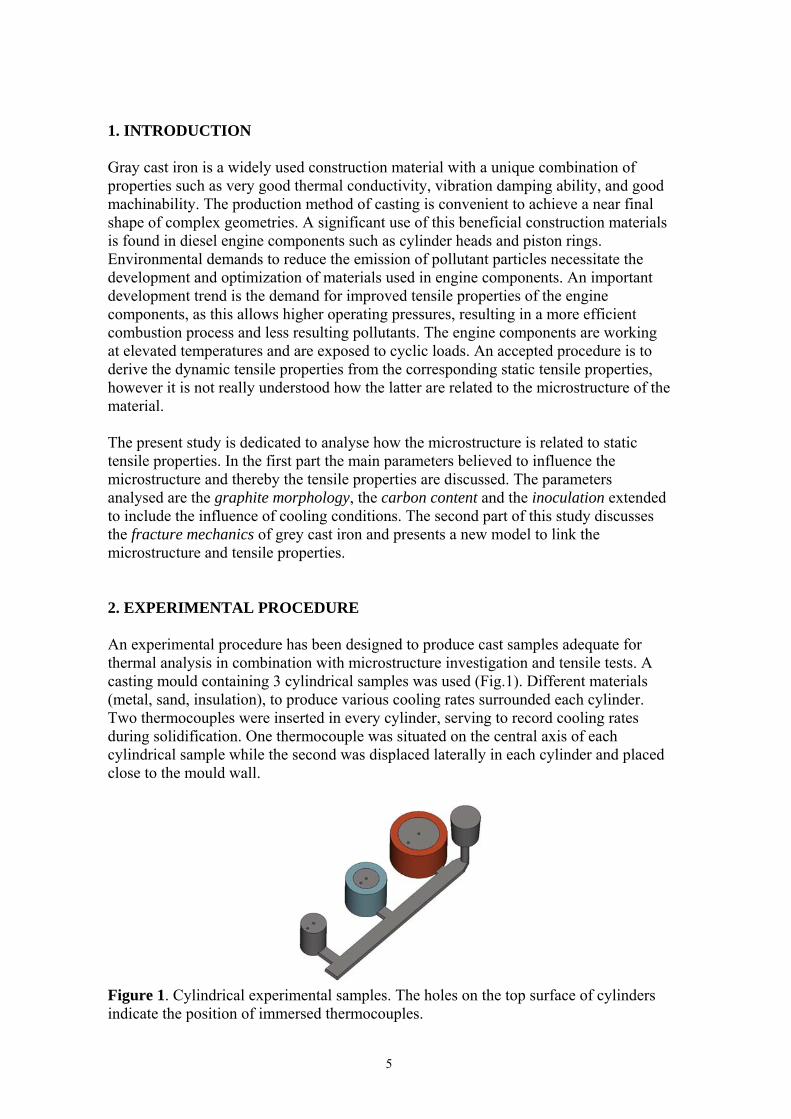
1. INTRODUCTION Gray cast iron is a widely used construction material with a unique combination of properties such as very good thermal conductivity, vibration damping ability, and good machinability. The production method of casting is convenient to achieve a near final shape of complex geometries. A significant use of this beneficial construction materials is found in diesel engine components such as cylinder heads and piston rings. Environmental demands to reduce the emission of pollutant particles necessitate the development and optimization of materials used in engine components. An important development trend is the demand for improved tensile properties of the engine components, as this allows higher operating pressures, resulting in a more efficient combustion process and less resulting pollutants. The engine components are working at elevated temperatures and are exposed to cyclic loads. An accepted procedure is to derive the dynamic tensile properties from the corresponding static tensile properties, however it is not really understood how the latter are related to the microstructure of the material. The present study is dedicated to analyse how the microstructure is related to static tensile properties. In the first part the main parameters believed to influence the microstructure and thereby the tensile properties are discussed. The parameters analysed are the graphite morphology, the carbon content and the inoculation extended to include the influence of cooling conditions. The second part of this study discusses the fracture mechanics of grey cast iron and presents a new model to link the microstructure and tensile properties. 2. EXPERIMENTAL PROCEDURE An experimental procedure has been designed to produce cast samples adequate for thermal analysis in combination with microstructure investigation and tensile tests. A casting mould containing 3 cylindrical samples was used (Fig.1). Different materials (metal, sand, insulation), to produce various cooling rates surrounded each cylinder. Two thermocouples were inserted in every cylinder, serving to record cooling rates during solidification. One thermocouple was situated on the central axis of each cylindrical sample while the second was displaced laterally in each cylinder and placed close to the mould wall.
Figure 1. Cylindrical experimental samples. The holes on the top surface of cylinders indicate the position of immersed thermocouples.
5
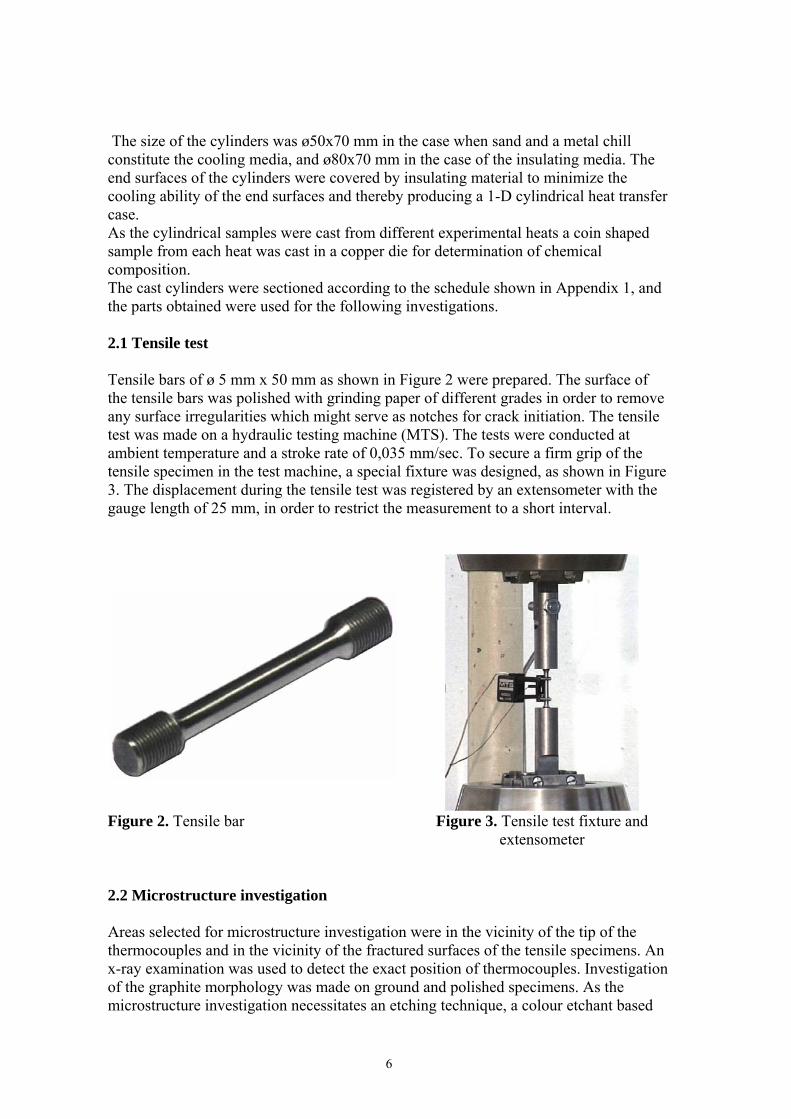
The size of the cylinders was ø50x70 mm in the case when sand and a metal chill constitute the cooling media, and ø80x70 mm in the case of the insulating media. The end surfaces of the cylinders were covered by insulating material to minimize the cooling ability of the end surfaces and thereby producing a 1-D cylindrical heat transfer case. As the cylindrical samples were cast from different experimental heats a coin shaped sample from each heat was cast in a copper die for determination of chemical composition. The cast cylinders were sectioned according to the schedule shown in Appendix 1, and the parts obtained were used for the following investigations. 2.1 Tensile test Tensile bars of ø 5 mm x 50 mm as shown in Figure 2 were prepared. The surface of the tensile bars was polished with grinding paper of different grades in order to remove any surface irregularities which might serve as notches for crack initiation. The tensile test was made on a hydraulic testing machine (MTS). The tests were conducted at ambient temperature and a stroke rate of 0,035 mm/sec. To secure a firm grip of the tensile specimen in the test machine, a special fixture was designed, as shown in Figure 3. The displacement during the tensile test was registered by an extensometer with the gauge length of 25 mm, in order to restrict the measurement to a short interval.
Figure 2. Tensile bar Figure 3. Tensile test fixture and
extensometer 2.2 Microstructure investigation Areas selected for microstructure investigation were in the vicinity of the tip of the thermocouples and in the vicinity of the fractured surfaces of the tensile specimens. An x-ray examination was used to detect the exact position of thermocouples. Investigation of the graphite morphology was made on ground and polished specimens. As the microstructure investigation necessitates an etching technique, a colour etchant based
6
on 10 g picric acid, 10 g NaOH, 40 g KOH and 50 ml distilled water was used. The etching procedure was carried out at elevated temperatures (90 – 120 oC) for various times depending on the chemical composition and solidification condition of the sample. Colour etched samples were used to measure the fraction primary austenite. The area fraction measurement was performed using a manual method to identify the phase designated for measurement and a computer programme to measure the area fraction. The eutectic cell size measurements were made on five of the biggest cells, in two directions to obtain a median value of the cell size. 2.3 Hardness measurements Brinell hardness (2,5/187,5) of specimens has been measured at positions denoted by HB*, shown in Appendix 0.When the hardness values of different microstructure phases was of interest micro-hardness measurements were performed on a test machine equipped with a microscope. The measured values were given in Vickers Hardness (HV) units. The colour etched samples were used for HV measurements, giving an indication of the type of the microstructure features measured. 3. GRAPHITE MORPHOLOGY The main alloying element, carbon, precipitates as graphite during solidification of cast iron. The graphite grows in cooperation with the austenite, forming a eutectic mixture. Graphite is the weakest component of cast iron, and reduces the tensile properties. The brittle graphite phase act as a discontinuity in the relatively tough metallic matrix and has a notching effect on the metallic phase when it is loaded. The fracture mechanics which invoke Griffith’s crack theory1 consider the presence of notches important for crack initiation and growth. In cast iron three main graphite morphologies are considered, the lamellar, the compact and the spherical shaped. The static tensile properties of cast irons are believed to be influenced by the different graphite morphologies. There are standard technological procedures known to produce cast iron with different graphite morphologies, however the theories as to factors which influence the graphite shape formed during solidification are not entirely determined. The most widely accepted theory2 on graphite shape evolution during solidification reveals the role of surface active atoms on the graphite crystal growth. Graphite has a hexagonal crystal lattice. When graphite growth is favoured on the prism face of the crystal the graphite grows in a lamellar fashion, whereas when growth is favoured in the basal plane the growth morphology is spherical. A balanced growth in both directions results in a compact shape. 3.1 Magnesium treatment The aim of the experiments described in this chapter was to study the transition between different graphite morphologies during cast iron solidification, to investigate the material properties for the transient morphologies and the properties of the metallic matrix. The experimental setup was based on a standard cast iron alloy intended for grey cast iron production. The liquid iron was produced in a cupola furnace and held in an electric holding furnace before tapping to a hand ladle prior to casting. The base experiment heat used liquid iron with the addition of standard, Sr-based inoculant and was poured in the test equipment described in the experimental procedure. Subsequent
7

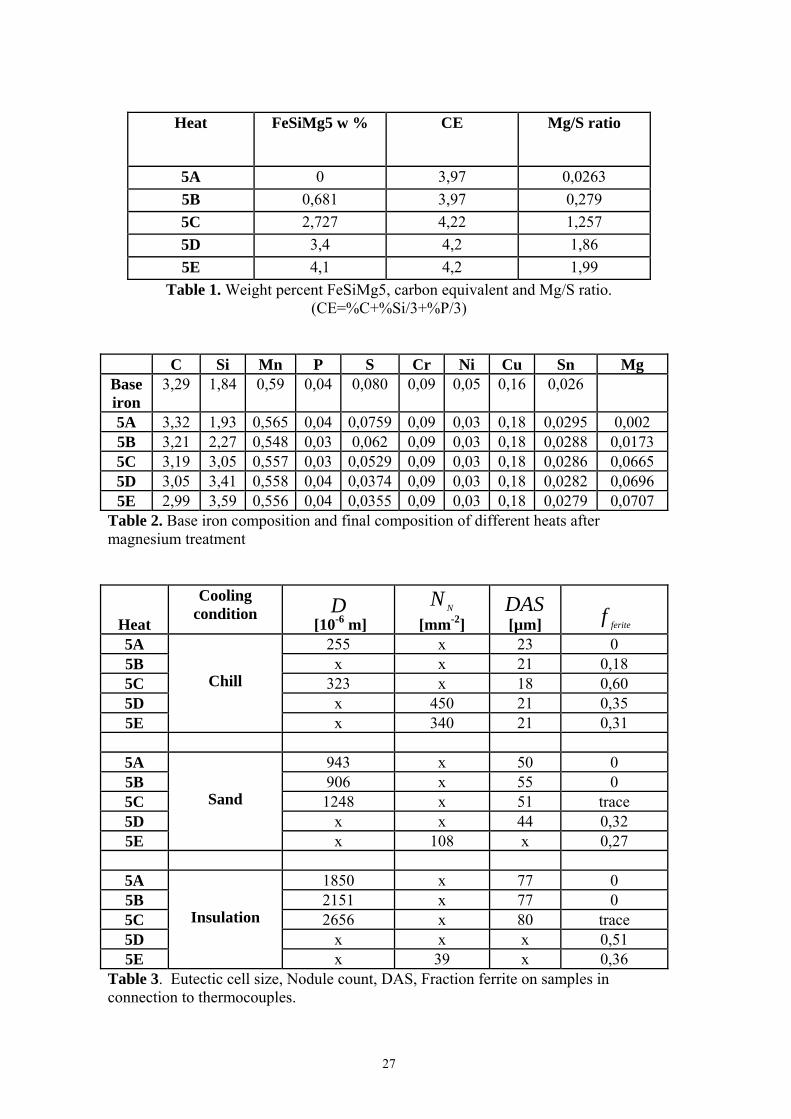
heats used the same liquid iron and the same addition of inoculant, with an extra addition of FeSiMg5, which is a standard modifying powder for producing nodular cast iron. Four different levels of FeSiMg5 were studied. The amount of FeSiMg5 is given in Table 1, and the chemical composition in Table 2. The FeSiMg5 and inoculant were added to the hand ladle before tapping from the holding furnace. 3.2 Microstructure close to the thermocouples A sample cross-section of the cylinder close to the thermocouple has been investigated by optical microscopy. Micrographs of non-etched surfaces from the five different experimental heats are collated in Appendix 1 for the insulated casting, Appendix 2 for the chilled casting and Appendix 3 for the sand casting. The micrographs presented scan the cylindrical samples from the surface to the centre of cylinder. The samples taken close to the central thermocouple were colour etched and colour micrographs at two magnifications are collated in Appendix 4 for the insulated casting, Appendix 5 for the chilled casting and Appendix 6 for the sand casting. Considering the shape of the graphite, flake graphite is obtained in experiments 5A, 5B and 5C, compacted graphite in 5D and nodular graphite in 5E. The addition of different amounts of FeSiMg5 has provoked a transition from flake to compact and thereafter to spherical graphite. The transition from flake to compacted graphite shows intermediary stages where the untreated base iron results in the well known curved lamellar graphite (5A), while increasing additions of FeSiMg5 promote longer and straight graphite lamella (5B, 5C). This transition can also be related to the chemical composition of the treated alloys. The sulphur content decreases while the magnesium, which is the remaining magnesium content, increases. This observation is in agreement with literature data which indicates reduced free sulphur results in spherical graphite growth. The role of sulphur in the graphite shape transition process is assumed to be due to its influence on the liquid iron surface tension, so that the liquid iron wets the growing austenite-graphite interface and promotes carbon diffusion to the graphite phase. These theories are supported by reports3 on the influence of sulphur content on grey cast iron morphology and tensile strength properties, where lowering the sulphur content induces low tensile properties and straight graphite lamellae. Variation in carbon and silicon content are assumed to depend on the various amounts of FeSiMg5 added. The colour micrographs have been used for measurement of the eutectic cell size of the lamellar graphite, the graphite nodule count of nodular graphite, the dendrite arm spacing (DAS) and the area fraction ferrite in the samples where they appear. The results are presented in table 3. A clear influence of cooling condition can be observed where an increase in cooling rate refines all the microstructure features. The cooling condition also influences the graphite shape transition. The graphite shape in heat 5D is compact under every cooling condition excepting the chilled sample where the graphite shape is predominantly nodular. This observation underlines the temperature dependence of the compact graphite nucleation and the difficulty to obtain a homogeneous compact graphite distrubution when the casting wall thickness varies within large values. The eutectic cell size was measured as the mean value of the five largest cells observed. Comparing the eutectic cell sizes of heats 5A, 5B and 5C, an increase of cell size is observed with increasing additions of FeSiMg5 under any cooling condition. This indicates a reduction of nucleation efficiency. The metallic matrix observed is mainly pearlitic, but
8
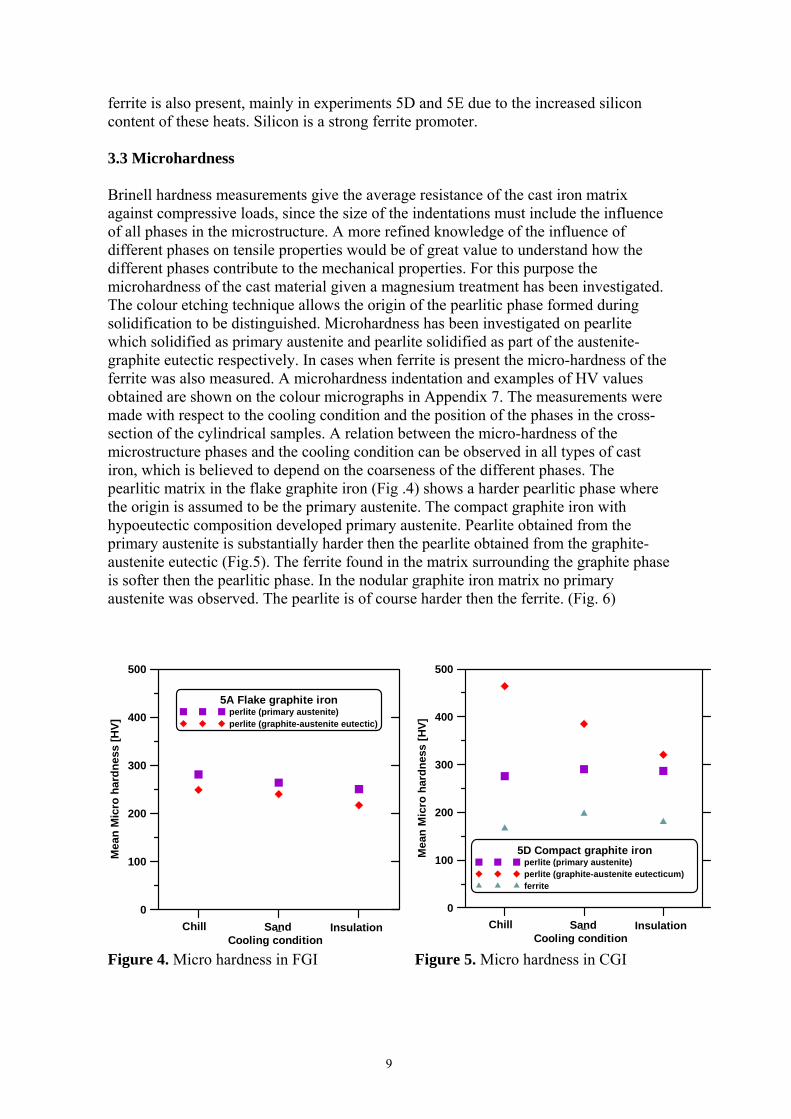
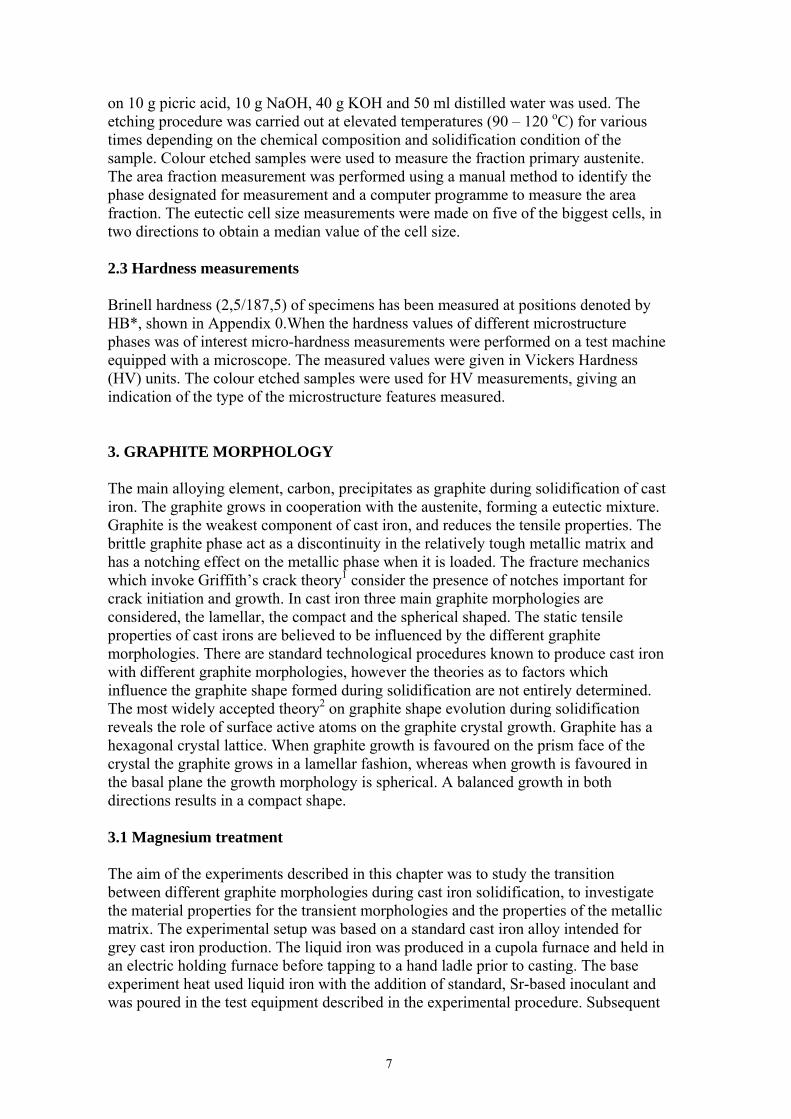
ferrite is also present, mainly in experiments 5D and 5E due to the increased silicon content of these heats. Silicon is a strong ferrite promoter. 3.3 Microhardness Brinell hardness measurements give the average resistance of the cast iron matrix against compressive loads, since the size of the indentations must include the influence of all phases in the microstructure. A more refined knowledge of the influence of different phases on tensile properties would be of great value to understand how the different phases contribute to the mechanical properties. For this purpose the microhardness of the cast material given a magnesium treatment has been investigated. The colour etching technique allows the origin of the pearlitic phase formed during solidification to be distinguished. Microhardness has been investigated on pearlite which solidified as primary austenite and pearlite solidified as part of the austenite-graphite eutectic respectively. In cases when ferrite is present the micro-hardness of the ferrite was also measured. A microhardness indentation and examples of HV values obtained are shown on the colour micrographs in Appendix 7. The measurements were made with respect to the cooling condition and the position of the phases in the cross-section of the cylindrical samples. A relation between the micro-hardness of the microstructure phases and the cooling condition can be observed in all types of cast iron, which is believed to depend on the coarseness of the different phases. The pearlitic matrix in the flake graphite iron (Fig .4) shows a harder pearlitic phase where the origin is assumed to be the primary austenite. The compact graphite iron with hypoeutectic composition developed primary austenite. Pearlite obtained from the primary austenite is substantially harder then the pearlite obtained from the graphite-austenite eutectic (Fig.5). The ferrite found in the matrix surrounding the graphite phase is softer then the pearlitic phase. In the nodular graphite iron matrix no primary austenite was observed. The pearlite is of course harder then the ferrite. (Fig. 6)
1 2 3Cooling condition
0
100
200
300
400
500
Mea
n M
icro
har
dnes
s [H
V]
5A Flake graphite ironperlite (primary austenite)perlite (graphite-austenite eutectic)
Chill Sand Insulation 1 2 3Cooling condition
0
100
200
300
400
500
Mea
n M
icro
har
dnes
s [H
V]
5D Compact graphite ironperlite (primary austenite)perlite (graphite-austenite eutecticum) ferrite
Chill Sand Insulation
Figure 4. Micro hardness in FGI Figure 5. Micro hardness in CGI
9
1 2 3Cooling condition
0
100
200
300
400
500
Mea
n M
icro
har
dnes
s [H
V]
5E Nodular graphite ironperlite (graphite-austenite eutecticum)ferrite
Chill Sand Insulation
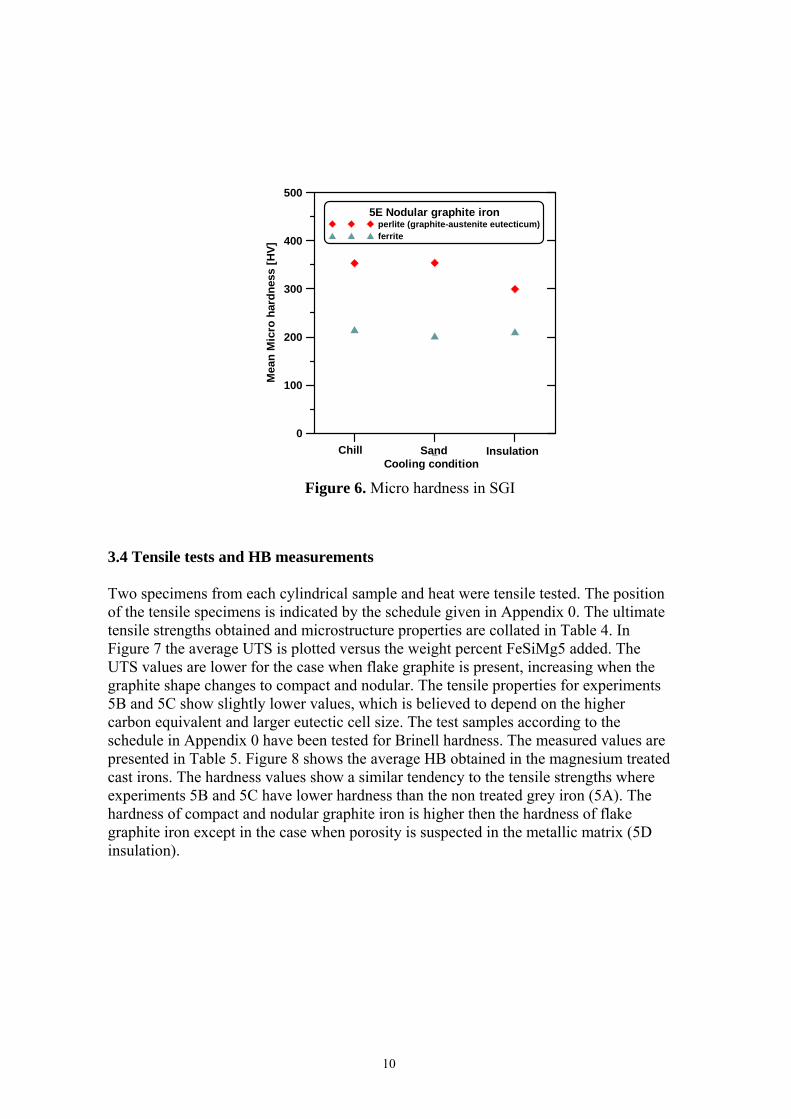
Figure 6. Micro hardness in SGI
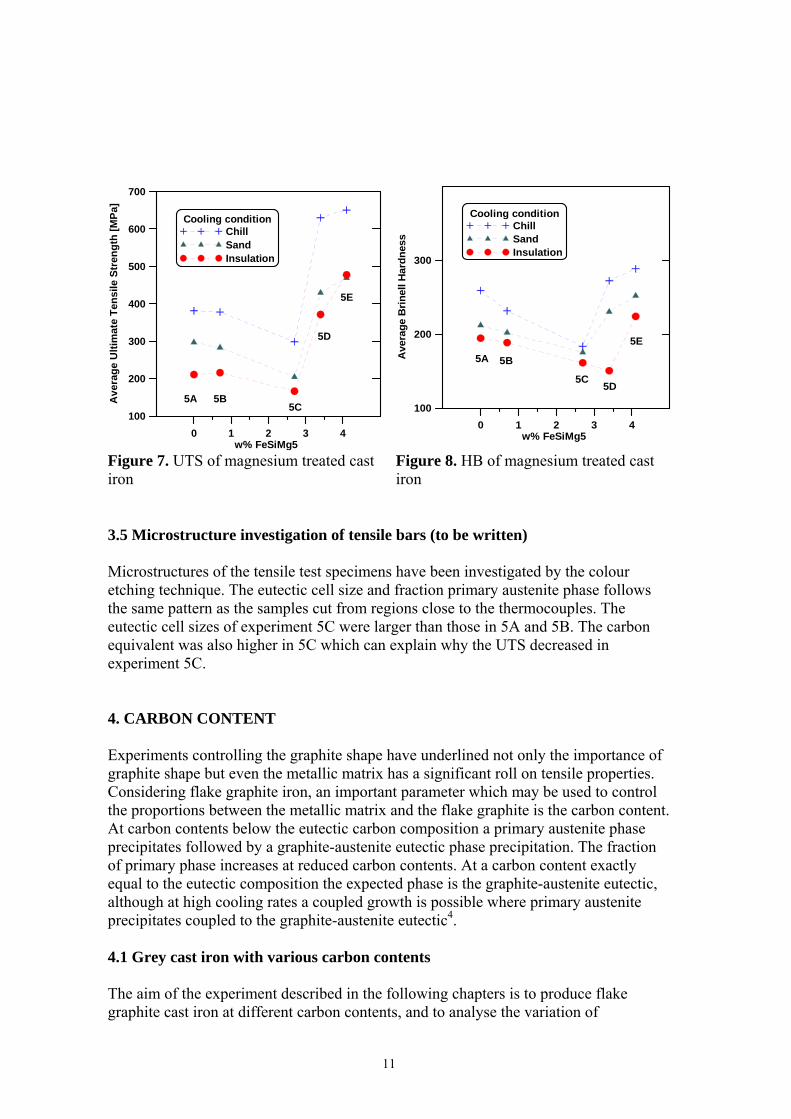
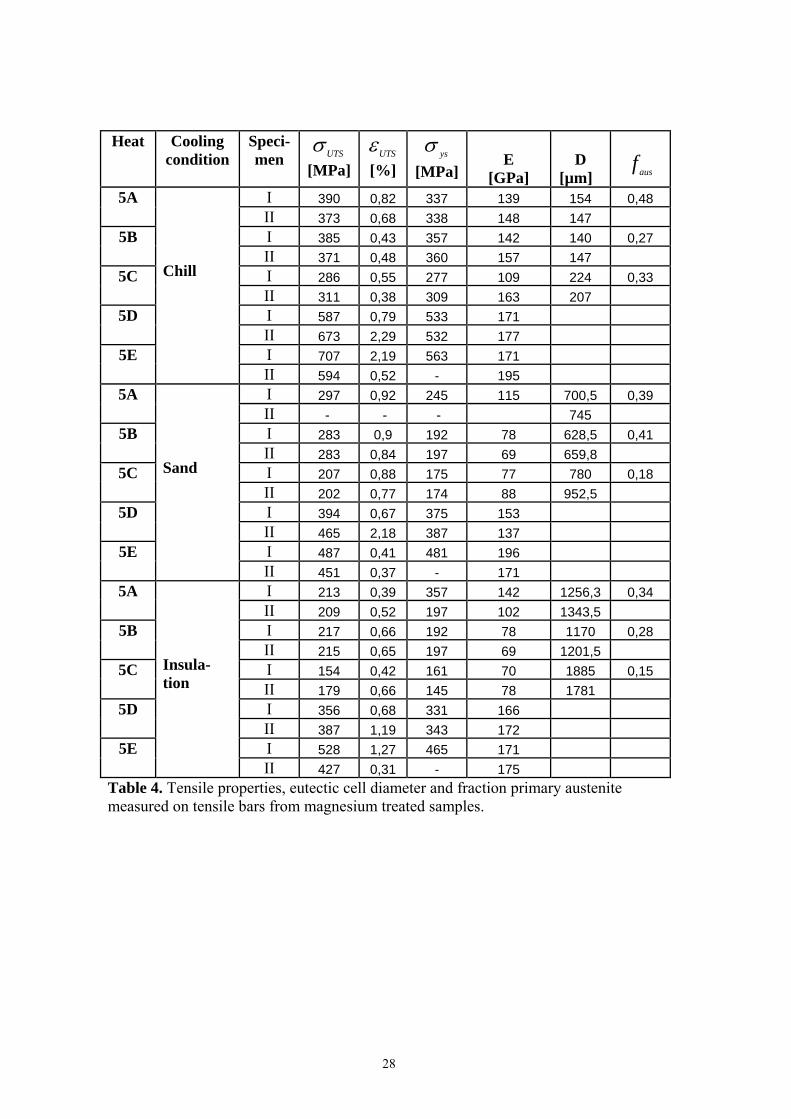
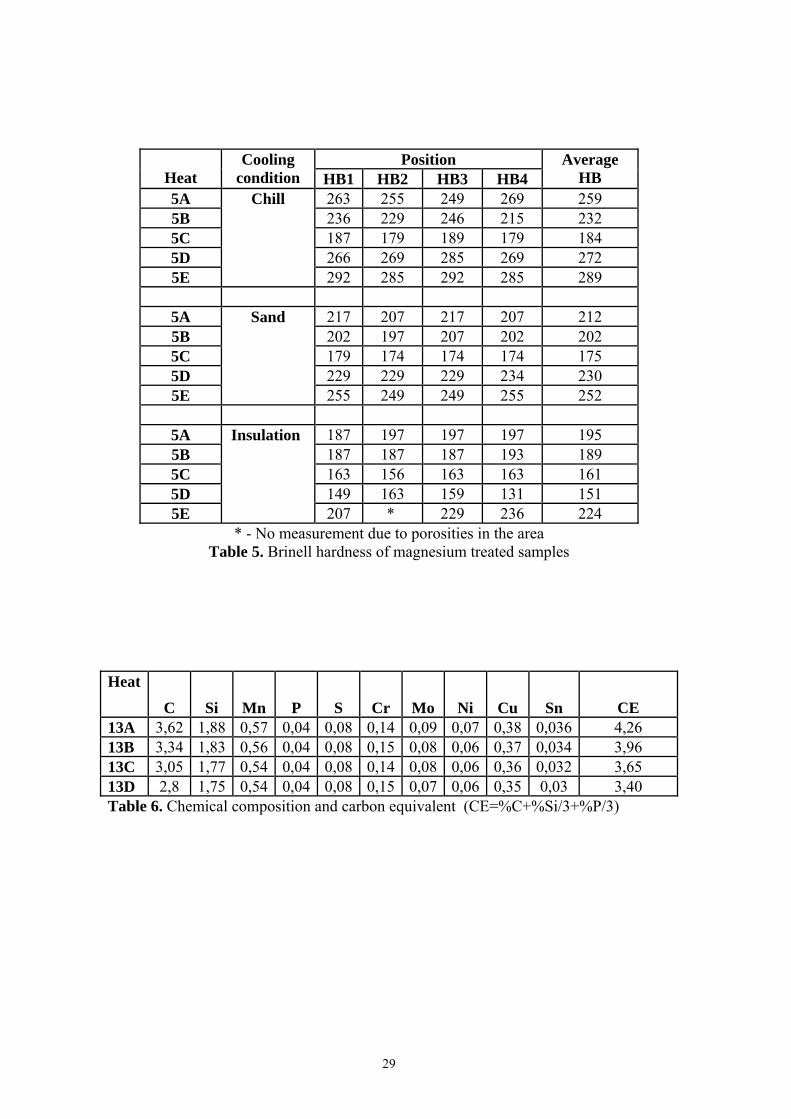
3.4 Tensile tests and HB measurements Two specimens from each cylindrical sample and heat were tensile tested. The position of the tensile specimens is indicated by the schedule given in Appendix 0. The ultimate tensile strengths obtained and microstructure properties are collated in Table 4. In Figure 7 the average UTS is plotted versus the weight percent FeSiMg5 added. The UTS values are lower for the case when flake graphite is present, increasing when the graphite shape changes to compact and nodular. The tensile properties for experiments 5B and 5C show slightly lower values, which is believed to depend on the higher carbon equivalent and larger eutectic cell size. The test samples according to the schedule in Appendix 0 have been tested for Brinell hardness. The measured values are presented in Table 5. Figure 8 shows the average HB obtained in the magnesium treated cast irons. The hardness values show a similar tendency to the tensile strengths where experiments 5B and 5C have lower hardness than the non treated grey iron (5A). The hardness of compact and nodular graphite iron is higher then the hardness of flake graphite iron except in the case when porosity is suspected in the metallic matrix (5D insulation).
10
0 1 2 3 4w% FeSiMg5
100
200
300
400
500
600
700
Ave
rage
Ulti
mat
e Te
nsile
Str
engt
h [M
Pa]
Cooling conditionChillSandInsulation
5A 5B5C
5D
5E
0 1 2 3 4w% FeSiMg5
100
200
300
Ave
rage
Brin
ell H
ardn
ess
Cooling conditionChillSandInsulation
5A 5B
5C5D
5E
Figure 7. UTS of magnesium treated cast iron
Figure 8. HB of magnesium treated cast iron
3.5 Microstructure investigation of tensile bars (to be written) Microstructures of the tensile test specimens have been investigated by the colour etching technique. The eutectic cell size and fraction primary austenite phase follows the same pattern as the samples cut from regions close to the thermocouples. The eutectic cell sizes of experiment 5C were larger than those in 5A and 5B. The carbon equivalent was also higher in 5C which can explain why the UTS decreased in experiment 5C. 4. CARBON CONTENT Experiments controlling the graphite shape have underlined not only the importance of graphite shape but even the metallic matrix has a significant roll on tensile properties. Considering flake graphite iron, an important parameter which may be used to control the proportions between the metallic matrix and the flake graphite is the carbon content. At carbon contents below the eutectic carbon composition a primary austenite phase precipitates followed by a graphite-austenite eutectic phase precipitation. The fraction of primary phase increases at reduced carbon contents. At a carbon content exactly equal to the eutectic composition the expected phase is the graphite-austenite eutectic, although at high cooling rates a coupled growth is possible where primary austenite precipitates coupled to the graphite-austenite eutectic4. 4.1 Grey cast iron with various carbon contents The aim of the experiment described in the following chapters is to produce flake graphite cast iron at different carbon contents, and to analyse the variation of
11
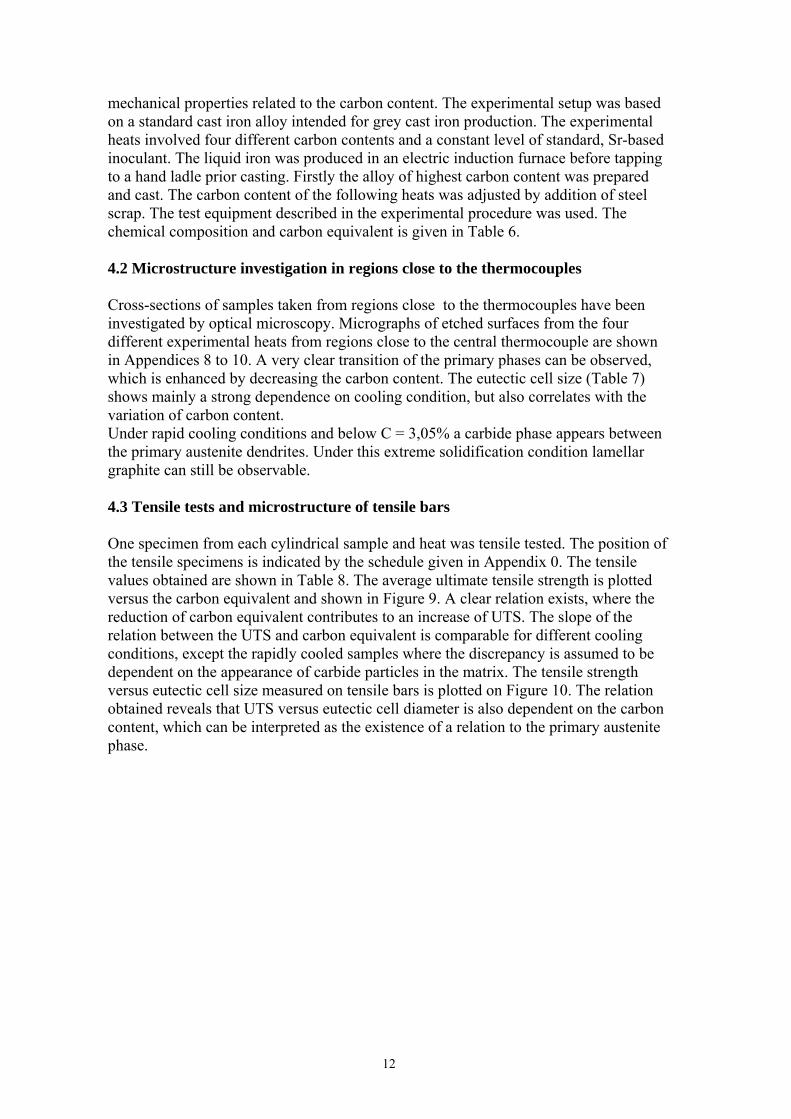
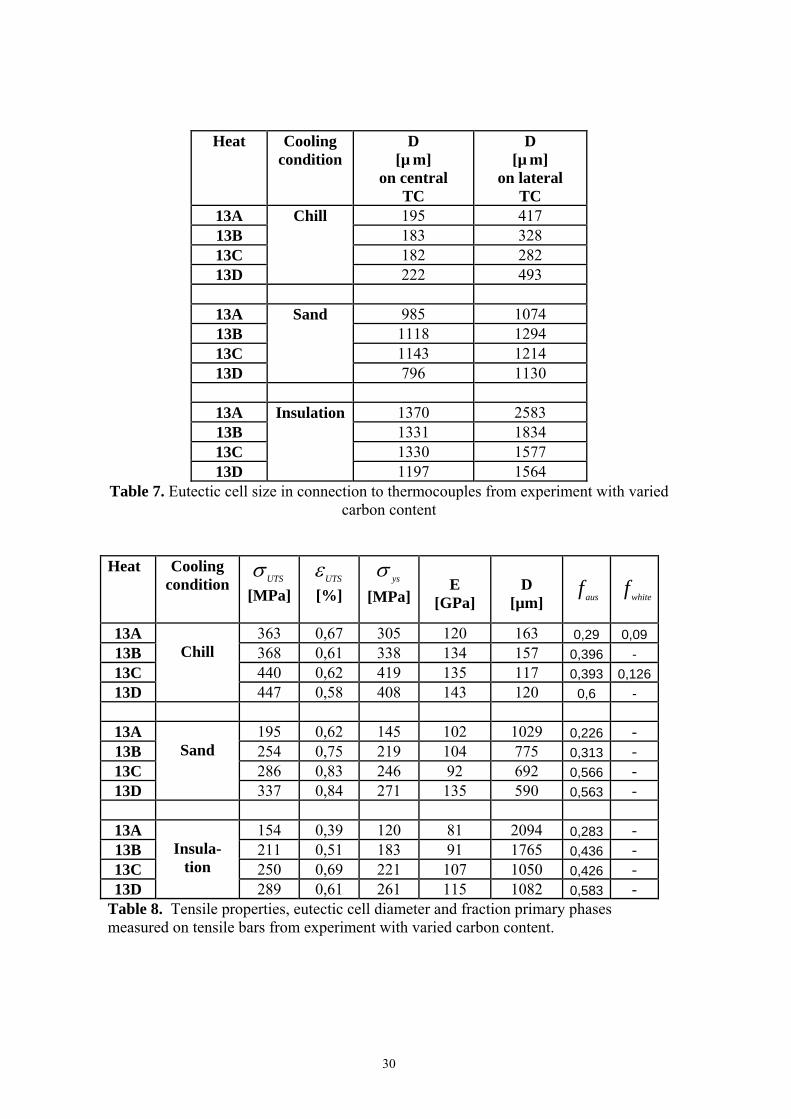
mechanical properties related to the carbon content. The experimental setup was based on a standard cast iron alloy intended for grey cast iron production. The experimental heats involved four different carbon contents and a constant level of standard, Sr-based inoculant. The liquid iron was produced in an electric induction furnace before tapping to a hand ladle prior casting. Firstly the alloy of highest carbon content was prepared and cast. The carbon content of the following heats was adjusted by addition of steel scrap. The test equipment described in the experimental procedure was used. The chemical composition and carbon equivalent is given in Table 6. 4.2 Microstructure investigation in regions close to the thermocouples Cross-sections of samples taken from regions close to the thermocouples have been investigated by optical microscopy. Micrographs of etched surfaces from the four different experimental heats from regions close to the central thermocouple are shown in Appendices 8 to 10. A very clear transition of the primary phases can be observed, which is enhanced by decreasing the carbon content. The eutectic cell size (Table 7) shows mainly a strong dependence on cooling condition, but also correlates with the variation of carbon content. Under rapid cooling conditions and below C = 3,05% a carbide phase appears between the primary austenite dendrites. Under this extreme solidification condition lamellar graphite can still be observable. 4.3 Tensile tests and microstructure of tensile bars One specimen from each cylindrical sample and heat was tensile tested. The position of the tensile specimens is indicated by the schedule given in Appendix 0. The tensile values obtained are shown in Table 8. The average ultimate tensile strength is plotted versus the carbon equivalent and shown in Figure 9. A clear relation exists, where the reduction of carbon equivalent contributes to an increase of UTS. The slope of the relation between the UTS and carbon equivalent is comparable for different cooling conditions, except the rapidly cooled samples where the discrepancy is assumed to be dependent on the appearance of carbide particles in the matrix. The tensile strength versus eutectic cell size measured on tensile bars is plotted on Figure 10. The relation obtained reveals that UTS versus eutectic cell diameter is also dependent on the carbon content, which can be interpreted as the existence of a relation to the primary austenite phase.
12
3.2 3.4 3.6 3.8 4 4.2 4.4Carbon equivalent
0
100
200
300
400
500U
TS [M
Pa]
Cooling conditionChillSandInsulation
0 500 1000 1500 2000 2500
Eutectic cell diameter [ m*10-6]
100
200
300
400
500
UTS
[MPa
]
Cooling conditionChill Sand Insulation
C = 2,8%
C = 3,6%
C = 3,05%
C = 3,34%
C = 2,8%
C = 3,05
C = 3,34%
C = 3,6%
C = 2,8%
C = 3,05%
C = 3,34%
C = 3,6%
Figure 9. UTS of grey cast iron vs. carbon equivalent
Figure 10. UTS of grey cast iron vs. eutectic cell size.
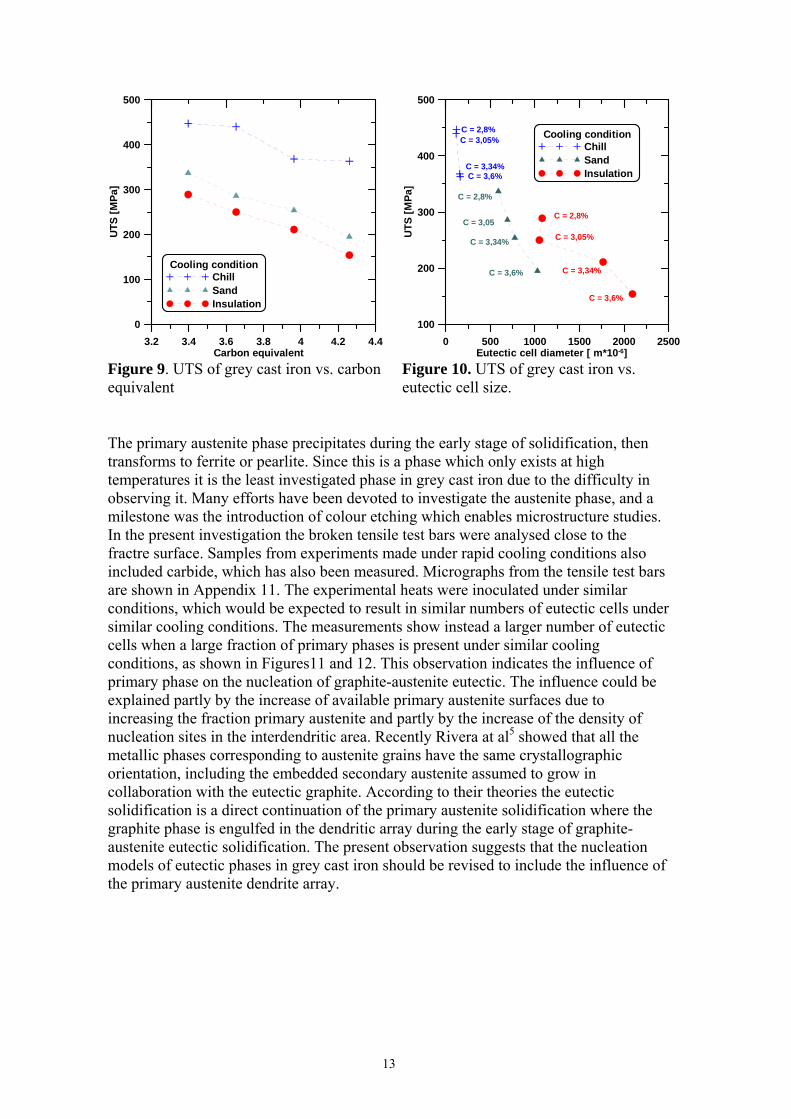
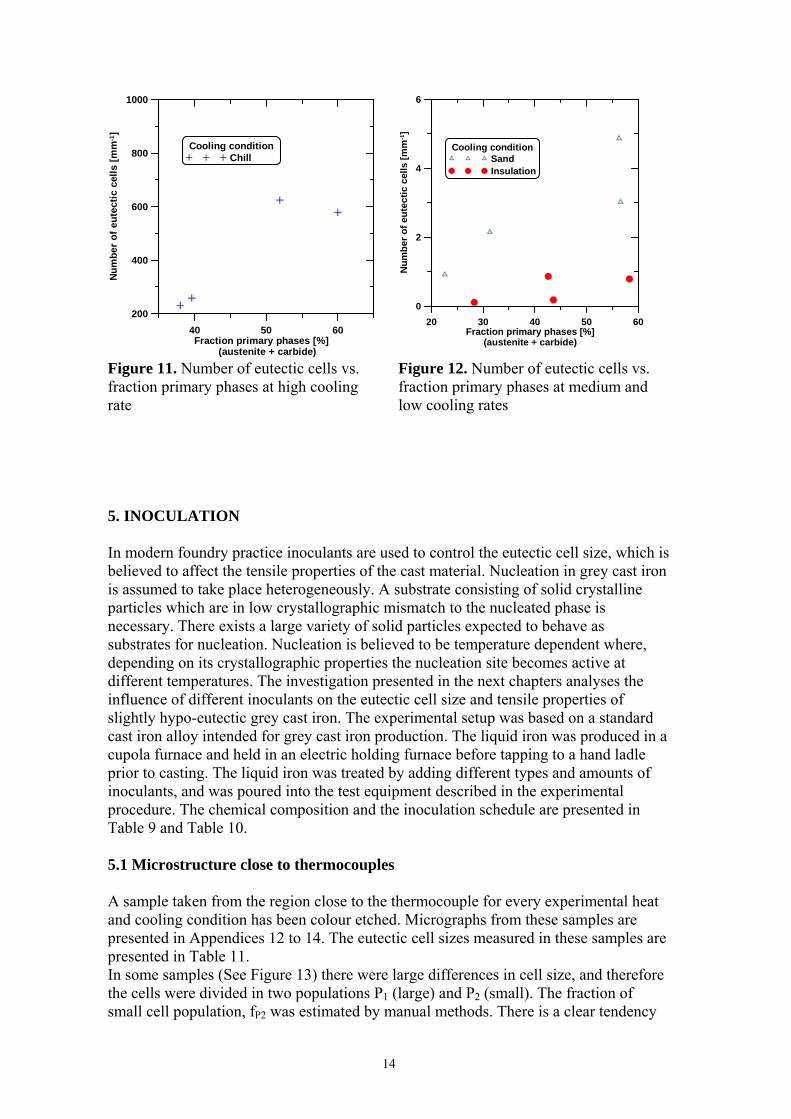
The primary austenite phase precipitates during the early stage of solidification, then transforms to ferrite or pearlite. Since this is a phase which only exists at high temperatures it is the least investigated phase in grey cast iron due to the difficulty in observing it. Many efforts have been devoted to investigate the austenite phase, and a milestone was the introduction of colour etching which enables microstructure studies. In the present investigation the broken tensile test bars were analysed close to the fractre surface. Samples from experiments made under rapid cooling conditions also included carbide, which has also been measured. Micrographs from the tensile test bars are shown in Appendix 11. The experimental heats were inoculated under similar conditions, which would be expected to result in similar numbers of eutectic cells under similar cooling conditions. The measurements show instead a larger number of eutectic cells when a large fraction of primary phases is present under similar cooling conditions, as shown in Figures11 and 12. This observation indicates the influence of primary phase on the nucleation of graphite-austenite eutectic. The influence could be explained partly by the increase of available primary austenite surfaces due to increasing the fraction primary austenite and partly by the increase of the density of nucleation sites in the interdendritic area. Recently Rivera at al5 showed that all the metallic phases corresponding to austenite grains have the same crystallographic orientation, including the embedded secondary austenite assumed to grow in collaboration with the eutectic graphite. According to their theories the eutectic solidification is a direct continuation of the primary austenite solidification where the graphite phase is engulfed in the dendritic array during the early stage of graphite-austenite eutectic solidification. The present observation suggests that the nucleation models of eutectic phases in grey cast iron should be revised to include the influence of the primary austenite dendrite array.
13
40 50 60Fraction primary phases [%]
(austenite + carbide)
200
400
600
800
1000N
umbe
r of
eut
ectic
cel
ls [m
m-1]
Cooling conditionChill
20 30 40 50 60Fraction primary phases [%]
(austenite + carbide)
0
2
4
6
Num
ber o
f eut
ectic
cel
ls [m
m-1]
Cooling conditionSandInsulation
Figure 11. Number of eutectic cells vs. fraction primary phases at high cooling rate
Figure 12. Number of eutectic cells vs. fraction primary phases at medium and low cooling rates
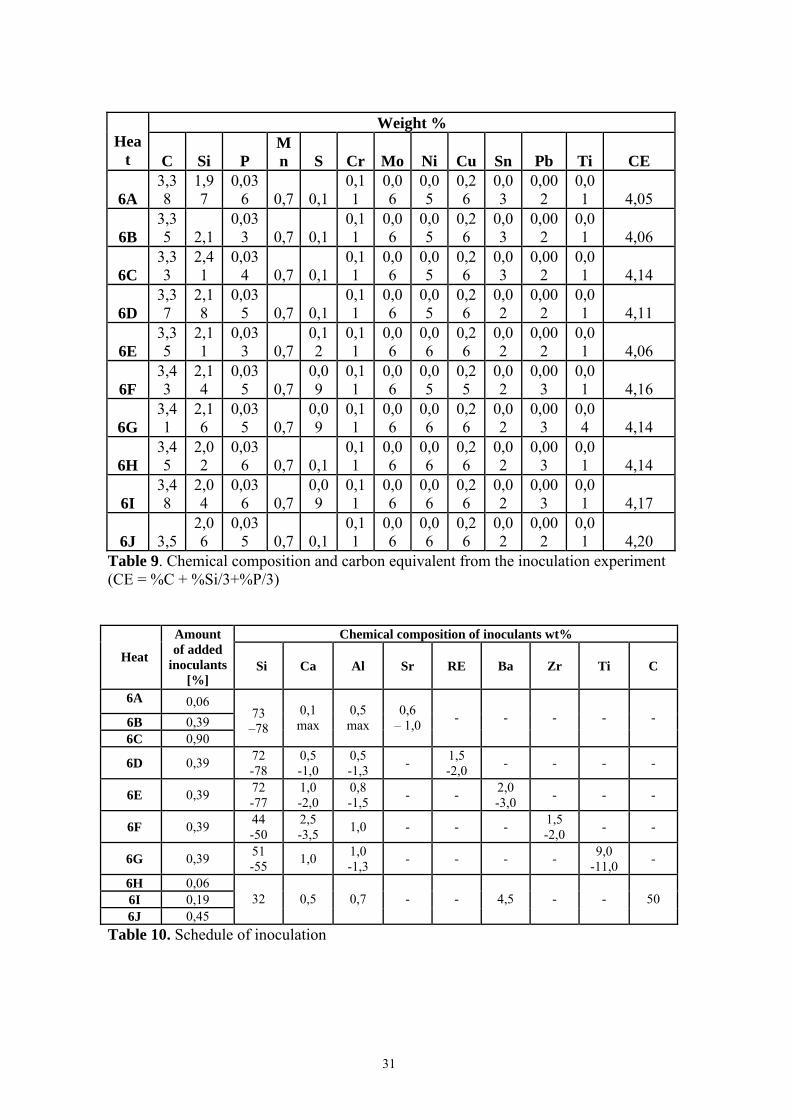
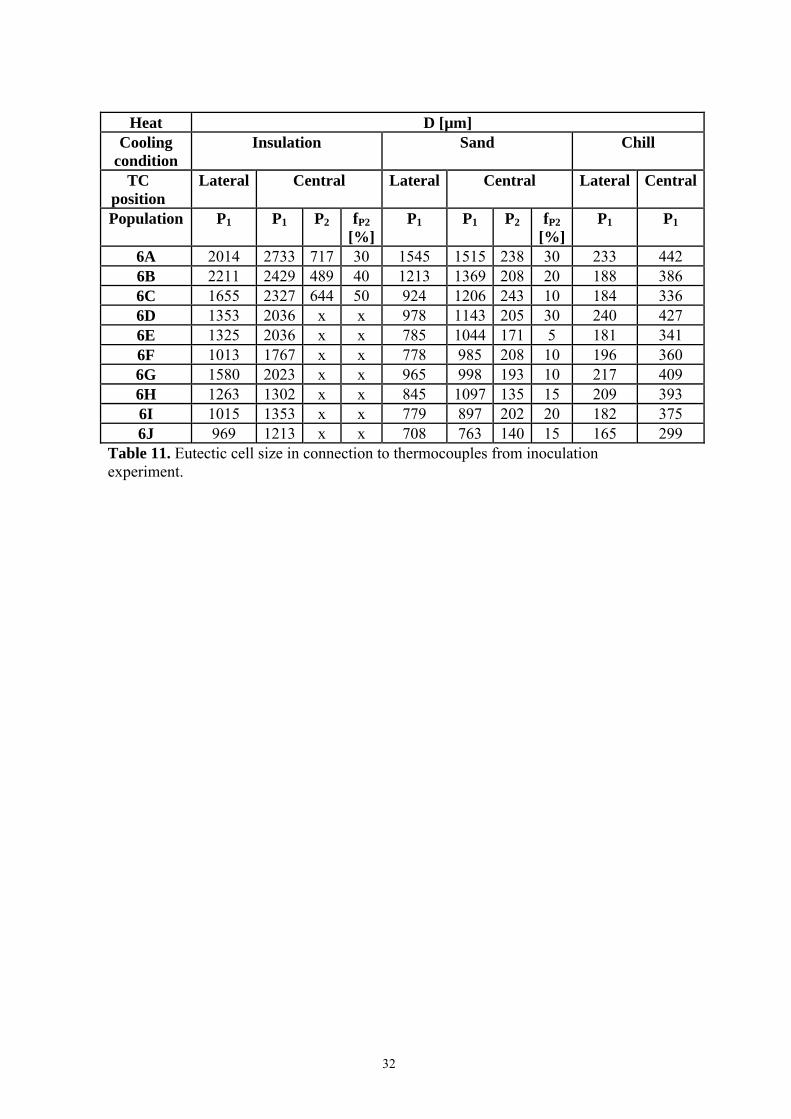
5. INOCULATION In modern foundry practice inoculants are used to control the eutectic cell size, which is believed to affect the tensile properties of the cast material. Nucleation in grey cast iron is assumed to take place heterogeneously. A substrate consisting of solid crystalline particles which are in low crystallographic mismatch to the nucleated phase is necessary. There exists a large variety of solid particles expected to behave as substrates for nucleation. Nucleation is believed to be temperature dependent where, depending on its crystallographic properties the nucleation site becomes active at different temperatures. The investigation presented in the next chapters analyses the influence of different inoculants on the eutectic cell size and tensile properties of slightly hypo-eutectic grey cast iron. The experimental setup was based on a standard cast iron alloy intended for grey cast iron production. The liquid iron was produced in a cupola furnace and held in an electric holding furnace before tapping to a hand ladle prior to casting. The liquid iron was treated by adding different types and amounts of inoculants, and was poured into the test equipment described in the experimental procedure. The chemical composition and the inoculation schedule are presented in Table 9 and Table 10. 5.1 Microstructure close to thermocouples A sample taken from the region close to the thermocouple for every experimental heat and cooling condition has been colour etched. Micrographs from these samples are presented in Appendices 12 to 14. The eutectic cell sizes measured in these samples are presented in Table 11. In some samples (See Figure 13) there were large differences in cell size, and therefore the cells were divided in two populations P1 (large) and P2 (small). The fraction of small cell population, fP2 was estimated by manual methods. There is a clear tendency
14
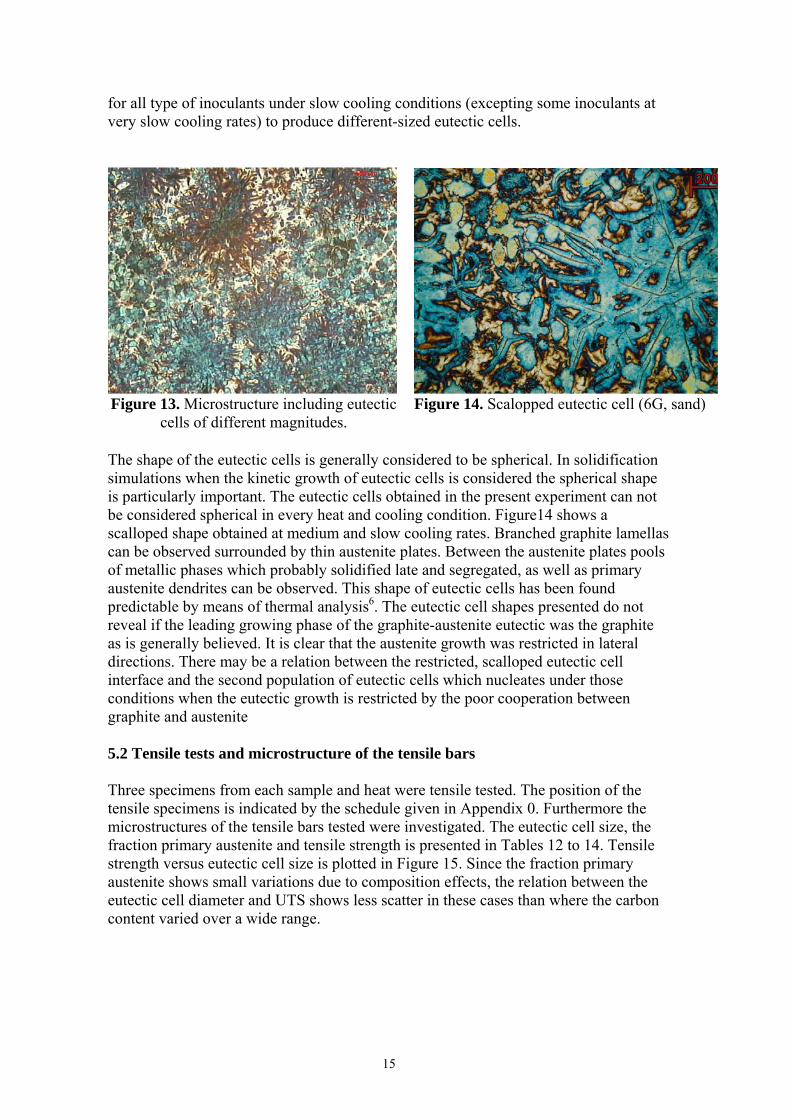
for all type of inoculants under slow cooling conditions (excepting some inoculants at very slow cooling rates) to produce different-sized eutectic cells.
Figure 13. Microstructure including eutectic
cells of different magnitudes. Figure 14. Scalopped eutectic cell (6G, sand)
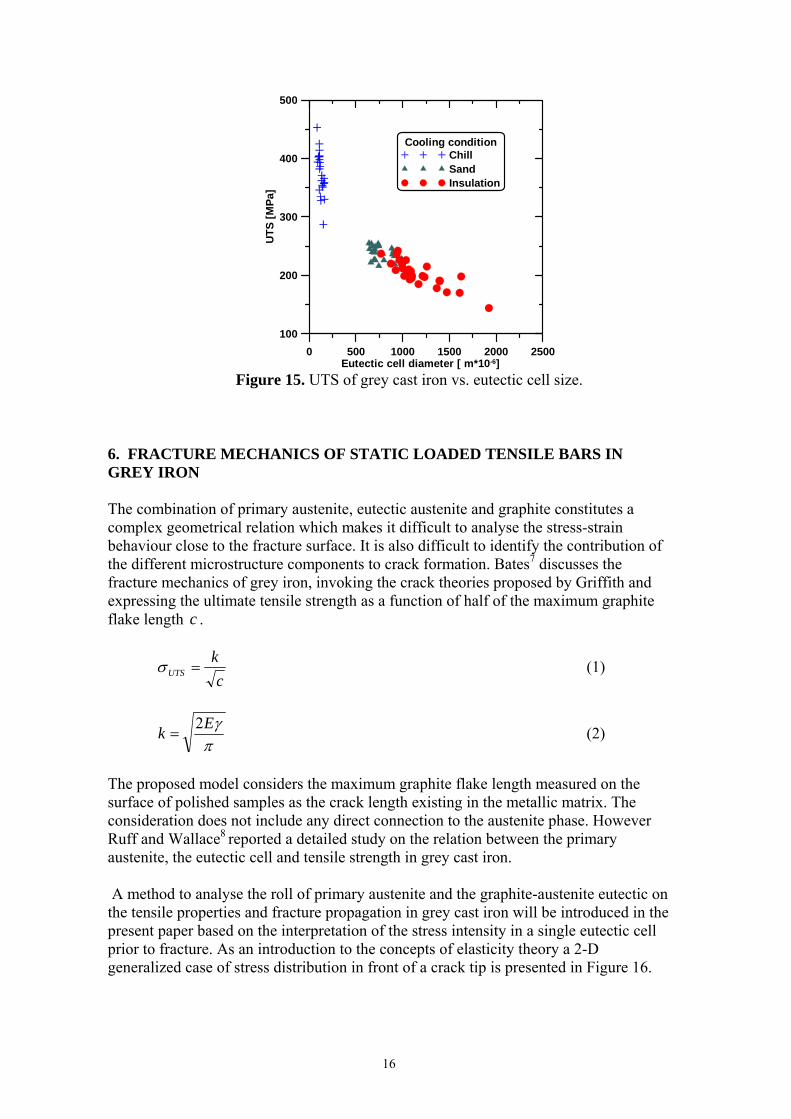
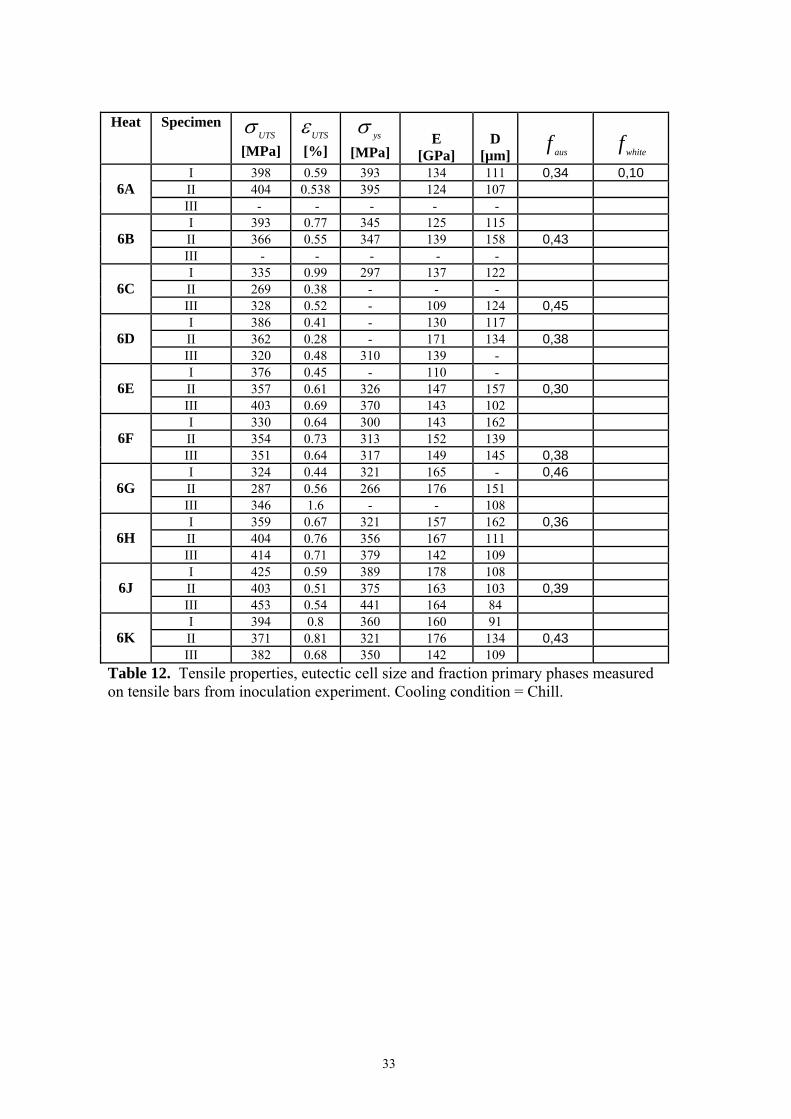
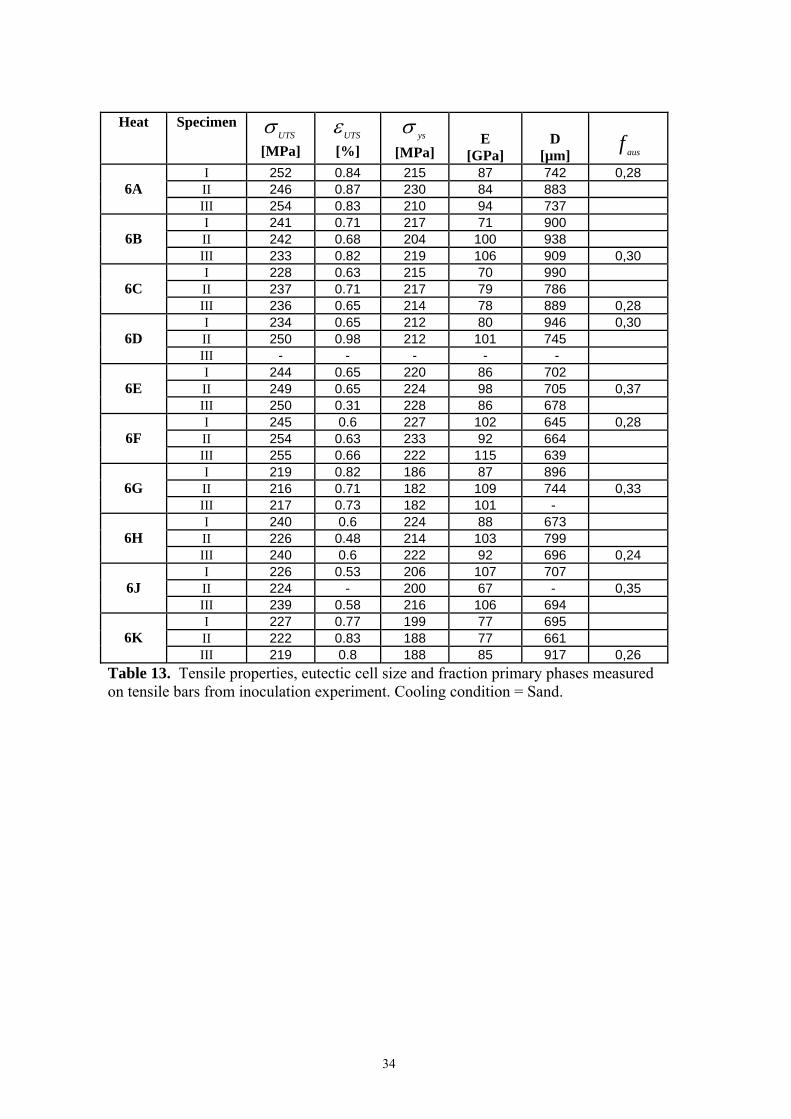
The shape of the eutectic cells is generally considered to be spherical. In solidification simulations when the kinetic growth of eutectic cells is considered the spherical shape is particularly important. The eutectic cells obtained in the present experiment can not be considered spherical in every heat and cooling condition. Figure14 shows a scalloped shape obtained at medium and slow cooling rates. Branched graphite lamellas can be observed surrounded by thin austenite plates. Between the austenite plates pools of metallic phases which probably solidified late and segregated, as well as primary austenite dendrites can be observed. This shape of eutectic cells has been found predictable by means of thermal analysis6. The eutectic cell shapes presented do not reveal if the leading growing phase of the graphite-austenite eutectic was the graphite as is generally believed. It is clear that the austenite growth was restricted in lateral directions. There may be a relation between the restricted, scalloped eutectic cell interface and the second population of eutectic cells which nucleates under those conditions when the eutectic growth is restricted by the poor cooperation between graphite and austenite 5.2 Tensile tests and microstructure of the tensile bars Three specimens from each sample and heat were tensile tested. The position of the tensile specimens is indicated by the schedule given in Appendix 0. Furthermore the microstructures of the tensile bars tested were investigated. The eutectic cell size, the fraction primary austenite and tensile strength is presented in Tables 12 to 14. Tensile strength versus eutectic cell size is plotted in Figure 15. Since the fraction primary austenite shows small variations due to composition effects, the relation between the eutectic cell diameter and UTS shows less scatter in these cases than where the carbon content varied over a wide range.
15
0 500 1000 1500 2000 2500Eutectic cell diameter [ m*10-6]
100
200
300
400
500
UTS
[MPa
]
Cooling conditionChillSandInsulation
Figure 15. UTS of grey cast iron vs. eutectic cell size.
6. FRACTURE MECHANICS OF STATIC LOADED TENSILE BARS IN GREY IRON The combination of primary austenite, eutectic austenite and graphite constitutes a complex geometrical relation which makes it difficult to analyse the stress-strain behaviour close to the fracture surface. It is also difficult to identify the contribution of the different microstructure components to crack formation. Bates7 discusses the fracture mechanics of grey iron, invoking the crack theories proposed by Griffith and expressing the ultimate tensile strength as a function of half of the maximum graphite flake length c .
ck
UTS =σ (1)
πγEk 2
= (2)
The proposed model considers the maximum graphite flake length measured on the surface of polished samples as the crack length existing in the metallic matrix. The consideration does not include any direct connection to the austenite phase. However Ruff and Wallace8 reported a detailed study on the relation between the primary austenite, the eutectic cell and tensile strength in grey cast iron. A method to analyse the roll of primary austenite and the graphite-austenite eutectic on the tensile properties and fracture propagation in grey cast iron will be introduced in the present paper based on the interpretation of the stress intensity in a single eutectic cell prior to fracture. As an introduction to the concepts of elasticity theory a 2-D generalized case of stress distribution in front of a crack tip is presented in Figure 16.
16
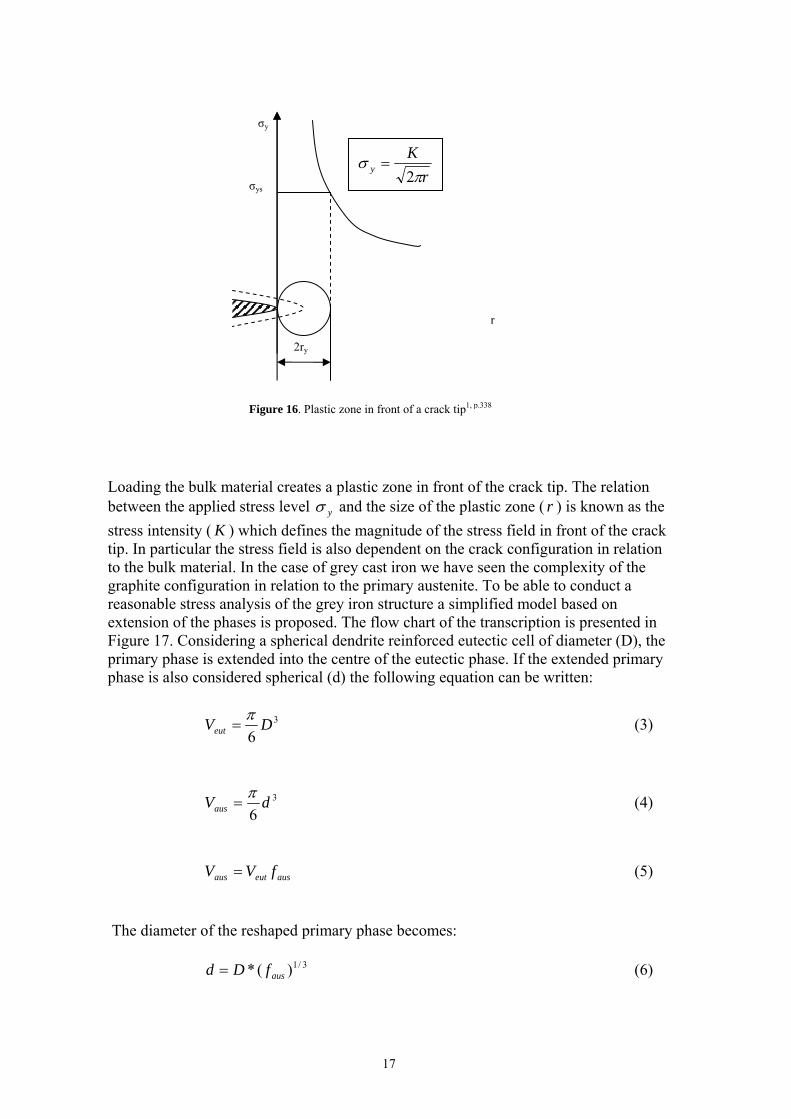
Loading the bulk material creates a plastic zone in front of the crack tip. The relation between the applied stress level yσ and the size of the plastic zone ( r ) is known as the stress intensity ( K ) which defines the magnitude of the stress field in front of the crack tip. In particular the stress field is also dependent on the crack configuration in relation to the bulk material. In the case of grey cast iron we have seen the complexity of the graphite configuration in relation to the primary austenite. To be able to conduct a reasonable stress analysis of the grey iron structure a simplified model based on extension of the phases is proposed. The flow chart of the transcription is presented in Figure 17. Considering a spherical dendrite reinforced eutectic cell of diameter (D), the primary phase is extended into the centre of the eutectic phase. If the extended primary phase is also considered spherical (d) the following equation can be written:
3
6DVeut
π= (3)
3
6dVaus
π= (4)
auseutaus fVV = (5) The diameter of the reshaped primary phase becomes:
3/1)(* ausfDd = (6)
2ry
r
σys
σy
rK
y πσ
2=
Figure 16. Plastic zone in front of a crack tip1, p.338
17
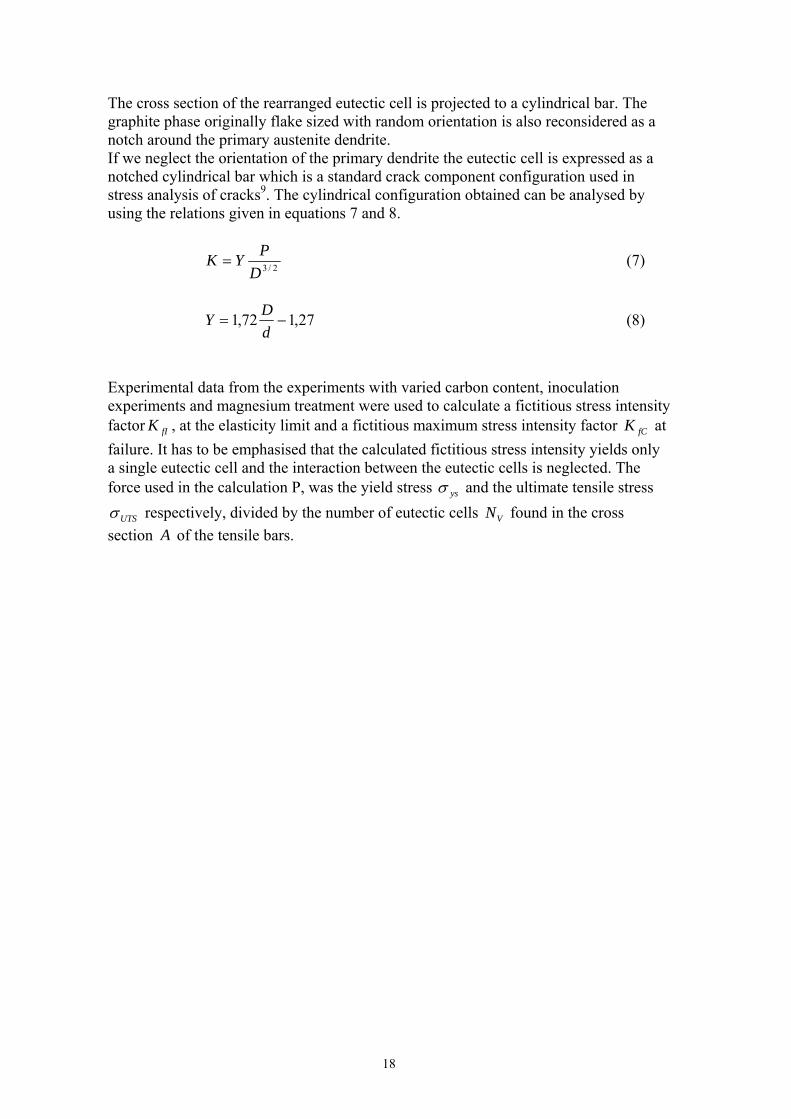
The cross section of the rearranged eutectic cell is projected to a cylindrical bar. The graphite phase originally flake sized with random orientation is also reconsidered as a notch around the primary austenite dendrite. If we neglect the orientation of the primary dendrite the eutectic cell is expressed as a notched cylindrical bar which is a standard crack component configuration used in stress analysis of cracks9. The cylindrical configuration obtained can be analysed by using the relations given in equations 7 and 8.
2/3DPYK = (7)
27,172,1 −=dDY (8)
Experimental data from the experiments with varied carbon content, inoculation experiments and magnesium treatment were used to calculate a fictitious stress intensity factor , at the elasticity limit and a fictitious maximum stress intensity factor at failure. It has to be emphasised that the calculated fictitious stress intensity yields only a single eutectic cell and the interaction between the eutectic cells is neglected. The force used in the calculation P, was the yield stress
fIK fCK
ysσ and the ultimate tensile stress
UTSσ respectively, divided by the number of eutectic cells found in the cross section
VNA of the tensile bars.
18
dD
Graphite
Primaryaustenite
P
Primary austenite
bridge
P
Graphite Notch
Eutectic austenite
Figure 17. A transcription model of gray cast iron phases for stress intensity analyze of cracks crossing the primary austenite.
19
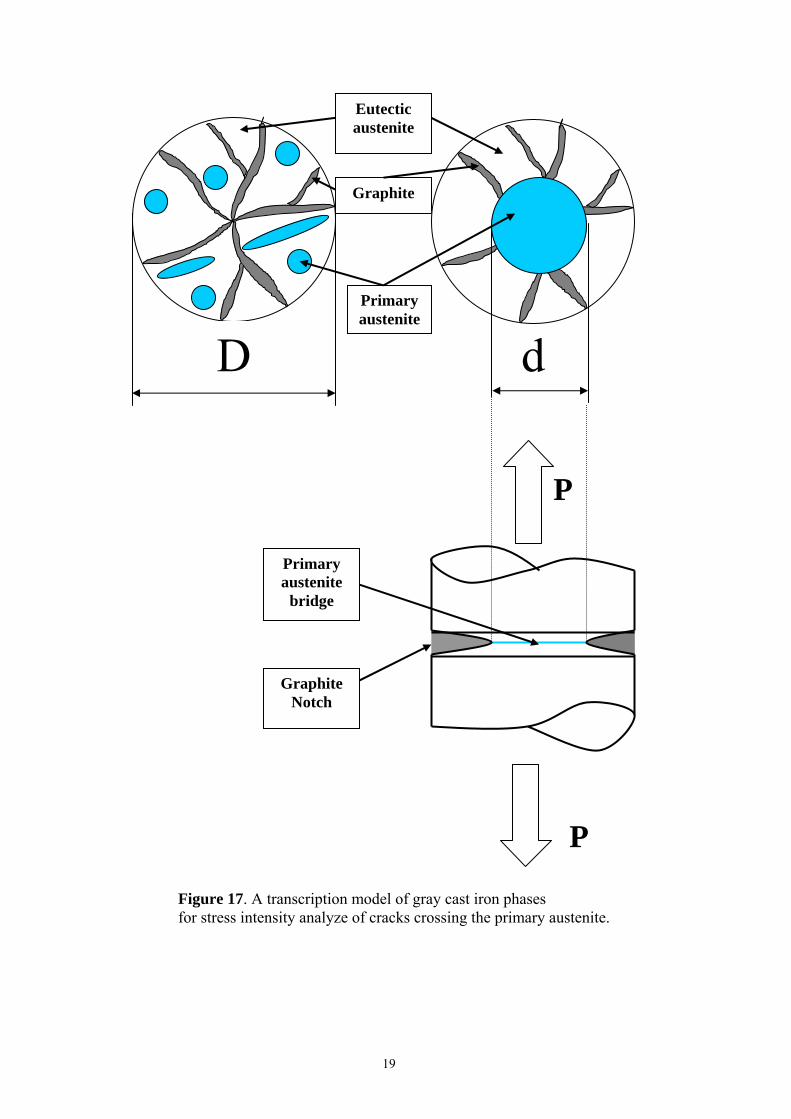
The calculated and values are plotted as a function of the relation in Figure 18 and Figure 19. In spite of these simplifications the values obtained are comparable to fracture toughnesses for grey cast iron reported by Bradley and Srinivasan
fIK fCK dD /
10. ( mMPa2212 ÷ ). The relations obtained indicate clearly that a low fraction reduces the fictitious stress intensity at both yield and failure. It seems that two different relations exist for the samples from chilled cooling and sand and insulated cooling respectively. The reason for these differences is not known at present, but the presence of tough carbide phases in the chilled samples could act to reduce the stress intensity level.
dD /
1 1.2 1.4 1.6 1.8 2D/d
0
5
10
15
20
25
30
35
KfI F
ictit
ious
str
ess
inte
nsity
fact
or[M
Pa*m
1/2 ]
Cooling conditionChill 05Chill 06Chill 13Sand 05Sand 06Sand 13Insulation 05Insulation 06Insulation 13
1 1.2 1.4 1.6 1.8 2
D/d
0
5
10
15
20
25
30
35
KfC
Fic
titio
us m
axim
um s
tres
s in
tens
ity fa
ctor
[MPa
*m1/
2 ]
Cooling conditionChill 05Chill 06Chill 13Sand 05Sand 06Sand 13Insulation 05Insulation 06Insulation 13
Figure 18. Fictitious stress intensity at yield for a single eutectic cell
Figure 19. Fictitious stress intensity at failure for a single eutectic cell
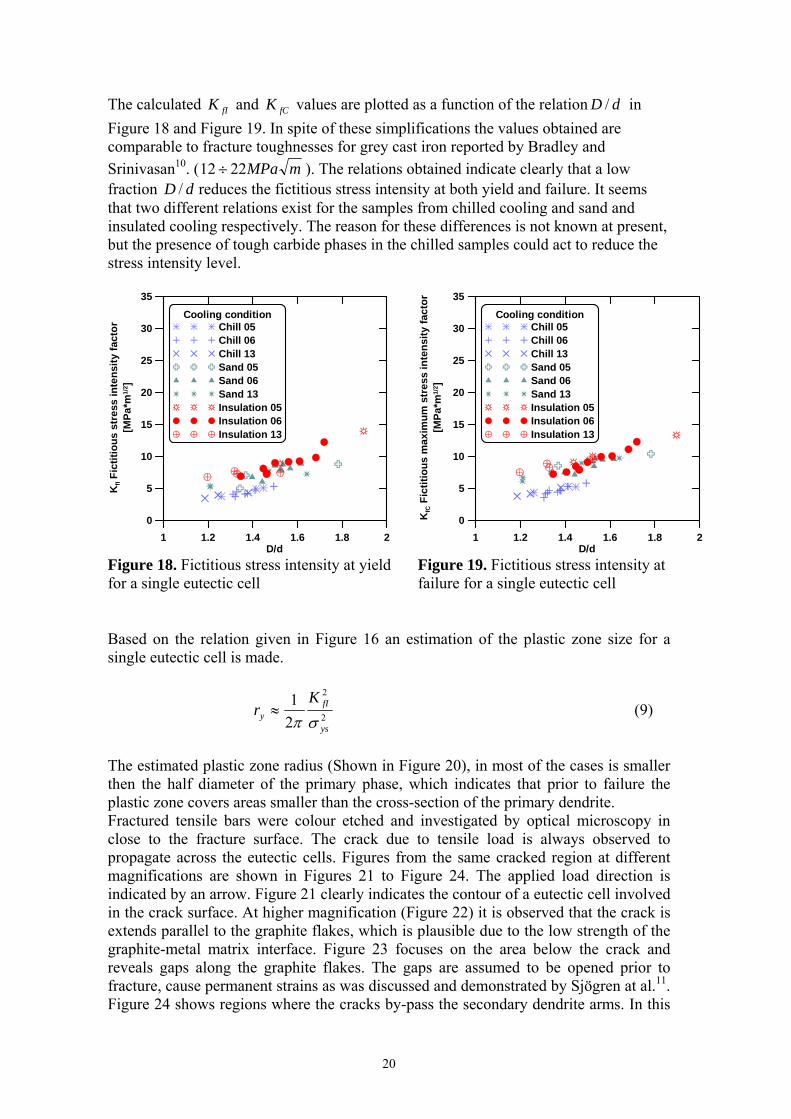
Based on the relation given in Figure 16 an estimation of the plastic zone size for a single eutectic cell is made.
2
2
21
ys
fIy
Kr
σπ≈ (9)
The estimated plastic zone radius (Shown in Figure 20), in most of the cases is smaller then the half diameter of the primary phase, which indicates that prior to failure the plastic zone covers areas smaller than the cross-section of the primary dendrite. Fractured tensile bars were colour etched and investigated by optical microscopy in close to the fracture surface. The crack due to tensile load is always observed to propagate across the eutectic cells. Figures from the same cracked region at different magnifications are shown in Figures 21 to Figure 24. The applied load direction is indicated by an arrow. Figure 21 clearly indicates the contour of a eutectic cell involved in the crack surface. At higher magnification (Figure 22) it is observed that the crack is extends parallel to the graphite flakes, which is plausible due to the low strength of the graphite-metal matrix interface. Figure 23 focuses on the area below the crack and reveals gaps along the graphite flakes. The gaps are assumed to be opened prior to fracture, cause permanent strains as was discussed and demonstrated by Sjögren at al.11. Figure 24 shows regions where the cracks by-pass the secondary dendrite arms. In this
20
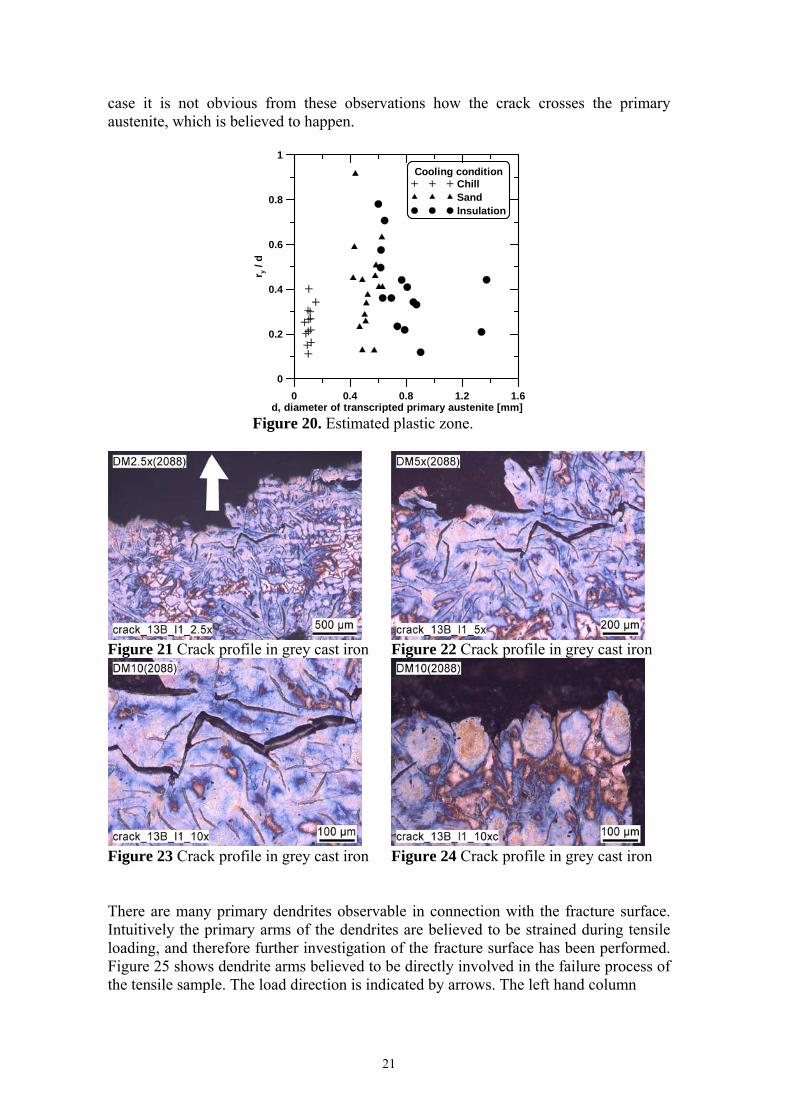
case it is not obvious from these observations how the crack crosses the primary austenite, which is believed to happen.
0 0.4 0.8 1.2 1.6d, diameter of transcripted primary austenite [mm]
0
0.2
0.4
0.6
0.8
1
r y /
d
Cooling conditionChillSandInsulation
Figure 20. Estimated plastic zone.
Figure 21 Crack profile in grey cast iron Figure 22 Crack profile in grey cast iron
Figure 23 Crack profile in grey cast iron Figure 24 Crack profile in grey cast iron There are many primary dendrites observable in connection with the fracture surface. Intuitively the primary arms of the dendrites are believed to be strained during tensile loading, and therefore further investigation of the fracture surface has been performed. Figure 25 shows dendrite arms believed to be directly involved in the failure process of the tensile sample. The load direction is indicated by arrows. The left hand column
21
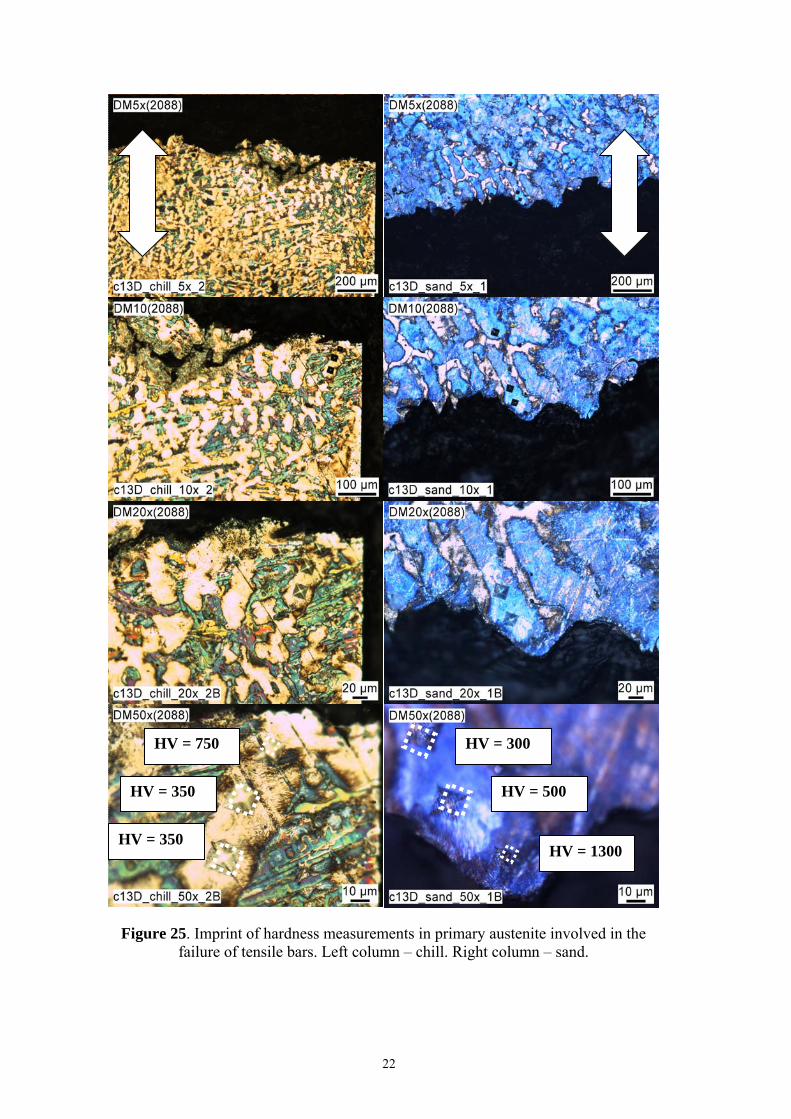
Figure 25. Imprint of hardness measurements in primary austenite involved in the failure of tensile bars. Left column – chill. Right column – sand.
HV = 300
HV = 500
HV = 1300
HV = 750
HV = 350
HV = 350
22
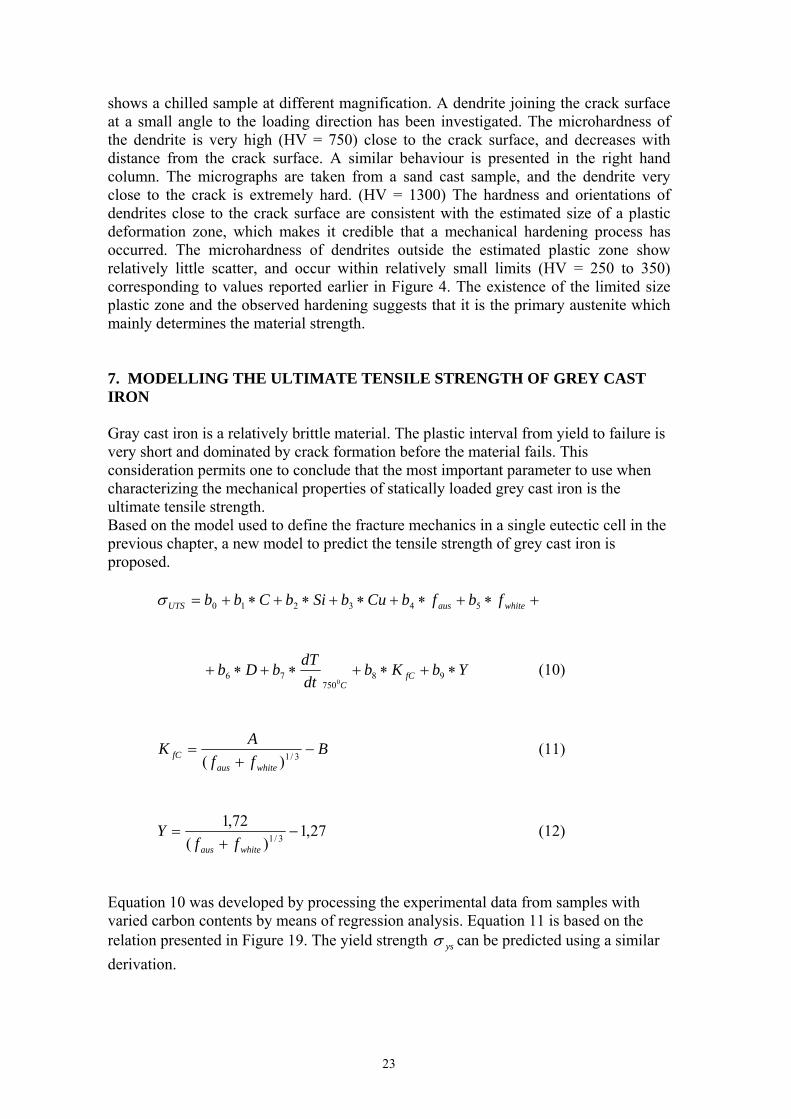
shows a chilled sample at different magnification. A dendrite joining the crack surface at a small angle to the loading direction has been investigated. The microhardness of the dendrite is very high (HV = 750) close to the crack surface, and decreases with distance from the crack surface. A similar behaviour is presented in the right hand column. The micrographs are taken from a sand cast sample, and the dendrite very close to the crack is extremely hard. (HV = 1300) The hardness and orientations of dendrites close to the crack surface are consistent with the estimated size of a plastic deformation zone, which makes it credible that a mechanical hardening process has occurred. The microhardness of dendrites outside the estimated plastic zone show relatively little scatter, and occur within relatively small limits (HV = 250 to 350) corresponding to values reported earlier in Figure 4. The existence of the limited size plastic zone and the observed hardening suggests that it is the primary austenite which mainly determines the material strength. 7. MODELLING THE ULTIMATE TENSILE STRENGTH OF GREY CAST IRON Gray cast iron is a relatively brittle material. The plastic interval from yield to failure is very short and dominated by crack formation before the material fails. This consideration permits one to conclude that the most important parameter to use when characterizing the mechanical properties of statically loaded grey cast iron is the ultimate tensile strength. Based on the model used to define the fracture mechanics in a single eutectic cell in the previous chapter, a new model to predict the tensile strength of grey cast iron is proposed. +∗+∗+∗+∗+∗+= whiteausUTS fbfbCubSibCbb 543210σ
YbKbdtdTbDb fC
C∗+∗+∗+∗+ 98
75076
0 (10)
BffAK
whiteausfC −
+= 3/1)(
(11)
27,1)(
72,13/1 −
+=
whiteaus ffY (12)
Equation 10 was developed by processing the experimental data from samples with varied carbon contents by means of regression analysis. Equation 11 is based on the relation presented in Figure 19. The yield strength ysσ can be predicted using a similar derivation.
23

8. CONCLUSIONS Cast iron has been investigated by variation of some major parameters believed to influence the microstructure and thereby the tensile strength. The parameters studied were the graphite morphology, carbon content, inoculation and solidification conditions. The graphite shape transition from flake to compact and spherical contributes to increase the tensile properties, but the graphite shape is not exclusively responsible for the differences. Let us suppose that the tensile strength is correlated to the microhardness. The microhardness of the metallic matrix shows a significantly higher value in CGI and SGI compared to FGI, which indicates that the metallic matrix contributes to the tensile strength. Focusing on FGI and considering the origin of the pearlitic matrix, the pearlite resulting from primary austenite is harder than the pearlite resulting from the graphite-austenite eutectic. Carbon content mainly influences the amount of primary austenite and indirectly the UTS as is shown in Figure 26. The primary austenite dendrite network has also been observed to influence the eutectic cell nucleation. Eutectic nucleation has until now been considered to be dependent mainly on the inoculant used, but the increase in fraction primary austenite also promotes the number of nucleated eutectic cells. The various inoculants added to slightly hypo-eutectic alloys indicate the possibility to optimize the eutectic cell size by inoculation. A frequently used comparison found in the literature relating the eutectic cell size and UTS and based on the present experiments is shown in Figure 27. An effective inoculant compensates for a reduction of carbon content. The effect of inoculants on eutectic nucleation and growth is observed to provoke, in special cases, unwanted eutectic morphologies, including double populations of eutectic cells and non-spherical eutectic shapes the effect of which on the tensile properties is not known. The experimental results have been influenced by the solidification conditions. At higher solidification rates a refinement of the microstructure is observed, which indirectly increases the tensile properties. The highest cooling rate used in the experiments caused the precipitation of primary carbides in some of the cases, but in most cases equilibrium solidification prevailed.
3.2 3.4 3.6 3.8 4 4.2 4.4Carbon equivalent
0
200
400
600
800
UTS
[MPa
]
Cooling conditionChill 05, 06, 13Sand 05, 06, 13Insulation 05, 06, 13
0 500 1000 1500 2000 2500Eutectic cell diameter [ m*10-6]
200
400
600
800
UTS
[MPa
]
Cooling conditionChill 05, 06, 13Sand 05, 06, 13Insulation 05, 06, 13
Figure 26. UTS vs. carbon equivalent Figure 27. UTS vs. eutectic cell diameter
24
The tensile strength of grey cast iron has been discussed by revealing the fracture mechanism of the material at failure. It was found that the most important microstructure components determining the strength of grey cast iron are the primary solidification phases and the graphite flakes. By primary phases is meant primary austenite and primary carbide. The tensile load acts on the primary austenite network. Dendrites with an orientation close to the tensile direction are highly stressed. The surrounding graphite flakes act as notchs on the highly stressed areas. The size of the graphite flakes influences the stress intensity. Restricted areas smaller then the primary austenite dendrite arm circumference develop a plastic zone. Inside the plastic zone, hardening of the pearlite which is derived from primary austenite is observed, before failure. The ultimate tensile strength is clearly a result of the intimate collaboration between the graphite flake and the primary phases. Parameters including the graphite morphology, carbon content, inoculation, and solidification conditions influence the ultimate tensile strength by offsetting the equilibrium between the major constituents, and the cracks embedded in the metallic matrix. Finally a predictive model of ultimate tensile strength is developed based on an interpretation of the stress intensity behaviour in a single eutectic cell prior to fracture. The authenticity of the model is proven by the fact that there exists direct physical relations between the factors involved. 9. FUTURE WORK The experiments conducted and conclusions presented in this paper are based on unalloyed and very low alloyed grey cast iron. Since the effect of primary austenite has been found to dominate the tensile strength, a study of strengthening of the primary austenite is of interest. Silicon segregates to the austenite and is expected to improve the property of austenite and thereby the tensile properties. Alloying elements which segregate to the eutectic cell boundary are expected to form a novel network of highly alloyed phases. An investigation of major alloying elements such as Cr, Cu, Mo, and Ni in the light of the theories presented is expected to give an additional dimension towards understanding the relation between the microstructure and tensile properties. 10. ACKNOWLEDGEMENT The present work is part of a research project for development of elevated material properties in cast iron, supported by the Volvo Powertrain Division Foundry, Daros Piston Rings AB and the Swedish Knowledge and Competence Foundation (KK-stiftelsen), which are gratefully acknowledged. 11. REFERENCES 1 R.W.Hertzberg: Deformation and Fracture Mechanics of Engineering Materials,
John Wiley & Sons, Inc.,1995, p.315.
2 J.R.Davis, ASM Speciality Handbook, Cast Irons, 1996, p.17.
25
3 H Nakea, H Shin, Effect of graphite morphology on mechanical properties of cast iron, 64th World foundry congress, Paris 2000.
4. H.Jones, W.Kurtz, Growth Temperature and the Limits of Coupled Growth in Unidirectional Solidification of Fe-C Eutectic alloys, Metall.Trans.A, Vol 11, 1980, p.1265
5. G.L.Rivera, R.E.Boeri, J.A.Sikora, Solidification of grey cast iron, Scripta Materialia 50 (2004) 331-335.
6. A. Diószegi, Evaluation of eutectic growth in grey cast iron by means of inverse modelling. (Journal of Cast Metals Research 2003 volume 16, 301-306.)
7. C.E. Bates, Alloy element effects on grey iron properties: part II., AFS vol.94, pp 889-905, 1986.
8 G.F.Ruff, J.F. Wallace: Effects of Solidification Structures on the Tensile Properties of Grey Iron, AFS Transactions, 77-56B, p.179-202.
9. R.W.Hertzberg: Deformation and Fracture Mechanics of Engineering Materials, John Wiley & Sons, Inc ,1995, p.326. OBS! Saknas förlag
10. W.L.Bradley and M.N.Srinivasan: Fracture and Fracture Toughness of Cast Irons, International Materials Reviews, Vol.35(No.3) 1990, p.129-159.
11. T. Sjögren, P. Vomacka, L.I. Svensson: Comparison of mechanical properties in flake graphite and compacted graphite cast irons for piston rings. (Accepted for publication in Journal of Cast Metals Research 2004)
26
Heat FeSiMg5 w % CE
Mg/S ratio
5A 0 3,97 0,0263 5B 0,681 3,97 0,279 5C 2,727 4,22 1,257 5D 3,4 4,2 1,86 5E 4,1 4,2 1,99
Table 1. Weight percent FeSiMg5, carbon equivalent and Mg/S ratio. (CE=%C+%Si/3+%P/3)
C Si Mn P S Cr Ni Cu Sn Mg Base iron
3,29 1,84 0,59 0,04 0,080 0,09 0,05 0,16 0,026
5A 3,32 1,93 0,565 0,04 0,0759 0,09 0,03 0,18 0,0295 0,002 5B 3,21 2,27 0,548 0,03 0,062 0,09 0,03 0,18 0,0288 0,0173 5C 3,19 3,05 0,557 0,03 0,0529 0,09 0,03 0,18 0,0286 0,0665 5D 3,05 3,41 0,558 0,04 0,0374 0,09 0,03 0,18 0,0282 0,0696 5E 2,99 3,59 0,556 0,04 0,0355 0,09 0,03 0,18 0,0279 0,0707
Table 2. Base iron composition and final composition of different heats after magnesium treatment
Heat
Cooling condition D
[10-6 m] NN
[mm-2] DAS [µm] feritef
5A 255 x 23 0 5B x x 21 0,18 5C 323 x 18 0,60 5D x 450 21 0,35 5E
Chill
x 340 21 0,31
5A 943 x 50 0 5B 906 x 55 0 5C 1248 x 51 trace 5D x x 44 0,32 5E
Sand
x 108 x 0,27
5A 1850 x 77 0 5B 2151 x 77 0 5C 2656 x 80 trace 5D x x x 0,51 5E
Insulation
x 39 x 0,36 Table 3. Eutectic cell size, Nodule count, DAS, Fraction ferrite on samples in connection to thermocouples.
27
Heat Cooling
condition Speci-men UTSσ
[MPa]UTSε
[%] ysσ
[MPa]
E
[GPa]
D
[µm]
ausf
I 390 0,82 337 139 154 0,48 5A II 373 0,68 338 148 147 I 385 0,43 357 142 140 0,27 5B II 371 0,48 360 157 147 I 286 0,55 277 109 224 0,33 5C
II 311 0,38 309 163 207 I 587 0,79 533 171 5D II 673 2,29 532 177 I 707 2,19 563 171 5E
Chill
II 594 0,52 - 195 I 297 0,92 245 115 700,5 0,39 5A II - - - 745 I 283 0,9 192 78 628,5 0,41 5B II 283 0,84 197 69 659,8 I 207 0,88 175 77 780 0,18 5C
II 202 0,77 174 88 952,5 I 394 0,67 375 153 5D II 465 2,18 387 137 I 487 0,41 481 196 5E
Sand
II 451 0,37 - 171 I 213 0,39 357 142 1256,3 0,34 5A II 209 0,52 197 102 1343,5 I 217 0,66 192 78 1170 0,28 5B II 215 0,65 197 69 1201,5 I 154 0,42 161 70 1885 0,15 5C II 179 0,66 145 78 1781 I 356 0,68 331 166 5D II 387 1,19 343 172 I 528 1,27 465 171 5E
Insula-tion
II 427 0,31 - 175 Table 4. Tensile properties, eutectic cell diameter and fraction primary austenite measured on tensile bars from magnesium treated samples.
28
Position Heat
Cooling condition HB1 HB2 HB3 HB4
Average HB
5A 263 255 249 269 259 5B 236 229 246 215 232 5C 187 179 189 179 184 5D 266 269 285 269 272 5E
Chill
292 285 292 285 289
5A 217 207 217 207 212 5B 202 197 207 202 202 5C 179 174 174 174 175 5D 229 229 229 234 230 5E
Sand
255 249 249 255 252
5A 187 197 197 197 195 5B 187 187 187 193 189 5C 163 156 163 163 161 5D 149 163 159 131 151 5E
Insulation
207 * 229 236 224 * - No measurement due to porosities in the area
Table 5. Brinell hardness of magnesium treated samples Heat
C Si Mn P S Cr Mo Ni Cu Sn
CE 13A 3,62 1,88 0,57 0,04 0,08 0,14 0,09 0,07 0,38 0,036 4,26 13B 3,34 1,83 0,56 0,04 0,08 0,15 0,08 0,06 0,37 0,034 3,96 13C 3,05 1,77 0,54 0,04 0,08 0,14 0,08 0,06 0,36 0,032 3,65 13D 2,8 1,75 0,54 0,04 0,08 0,15 0,07 0,06 0,35 0,03 3,40 Table 6. Chemical composition and carbon equivalent (CE=%C+%Si/3+%P/3)
29
Heat Cooling condition
D [µ m]
on central TC
D [µ m]
on lateral TC
13A 195 417 13B 183 328 13C 182 282 13D
Chill
222 493
13A 985 1074 13B 1118 1294 13C 1143 1214 13D
Sand
796 1130
13A 1370 2583 13B 1331 1834 13C 1330 1577 13D
Insulation
1197 1564 Table 7. Eutectic cell size in connection to thermocouples from experiment with varied
carbon content Heat Cooling
condition UTSσ [MPa]
UTSε [%]
ysσ [MPa]
E
[GPa]
D
[µm]
ausf
whitef
13A 363 0,67 305 120 163 0,29 0,09 13B 368 0,61 338 134 157 0,396 - 13C 440 0,62 419 135 117 0,393 0,126 13D
Chill
447 0,58 408 143 120 0,6 -
13A 195 0,62 145 102 1029 0,226 - 13B 254 0,75 219 104 775 0,313 - 13C 286 0,83 246 92 692 0,566 - 13D
Sand
337 0,84 271 135 590 0,563 -
13A 154 0,39 120 81 2094 0,283 - 13B 211 0,51 183 91 1765 0,436 - 13C 250 0,69 221 107 1050 0,426 - 13D
Insula-
tion 289 0,61 261 115 1082 0,583 -
Table 8. Tensile properties, eutectic cell diameter and fraction primary phases measured on tensile bars from experiment with varied carbon content.
30
Weight %
Heat C Si P
Mn S Cr Mo Ni Cu Sn Pb Ti CE
6A 3,38
1,97
0,036 0,7 0,1
0,11
0,06
0,05
0,26
0,03
0,002
0,01 4,05
6B 3,35 2,1
0,033 0,7 0,1
0,11
0,06
0,05
0,26
0,03
0,002
0,01 4,06
6C 3,33
2,41
0,034 0,7 0,1
0,11
0,06
0,05
0,26
0,03
0,002
0,01 4,14
6D 3,37
2,18
0,035 0,7 0,1
0,11
0,06
0,05
0,26
0,02
0,002
0,01 4,11
6E 3,35
2,11
0,033 0,7
0,12
0,11
0,06
0,06
0,26
0,02
0,002
0,01 4,06
6F 3,43
2,14
0,035 0,7
0,09
0,11
0,06
0,05
0,25
0,02
0,003
0,01 4,16
6G 3,41
2,16
0,035 0,7
0,09
0,11
0,06
0,06
0,26
0,02
0,003
0,04 4,14
6H 3,45
2,02
0,036 0,7 0,1
0,11
0,06
0,06
0,26
0,02
0,003
0,01 4,14
6I 3,48
2,04
0,036 0,7
0,09
0,11
0,06
0,06
0,26
0,02
0,003
0,01 4,17
6J 3,5 2,06
0,035 0,7 0,1
0,11
0,06
0,06
0,26
0,02
0,002
0,01 4,20
Table 9. Chemical composition and carbon equivalent from the inoculation experiment (CE = %C + %Si/3+%P/3)
Chemical composition of inoculants wt%
Heat
Amount of added
inoculants [%]
Si
Ca
Al
Sr
RE
Ba
Zr
Ti
C
6A 0,06 6B 0,39 6C 0,90
73
–78 0,1 max
0,5 max
0,6 – 1,0 - - - - -
6D 0,39 72 -78
0,5 -1,0
0,5 -1,3 - 1,5
-2,0 - - - -
6E 0,39 72 -77
1,0 -2,0
0,8 -1,5 - - 2,0
-3,0 - - -
6F 0,39 44 -50
2,5 -3,5 1,0 - - - 1,5
-2,0 - -
6G 0,39 51 -55 1,0 1,0
-1,3 - - - - 9,0 -11,0 -
6H 0,06 6I 0,19 6J 0,45
32 0,5 0,7 - - 4,5 - - 50
Table 10. Schedule of inoculation
31
Heat D [µm]
Cooling condition
Insulation Sand Chill
TC position
Lateral Central Lateral Central Lateral Central
Population P1 P1 P2 fP2 [%]
P1 P1 P2 fP2 [%]
P1 P1
6A 2014 2733 717 30 1545 1515 238 30 233 442 6B 2211 2429 489 40 1213 1369 208 20 188 386 6C 1655 2327 644 50 924 1206 243 10 184 336 6D 1353 2036 x x 978 1143 205 30 240 427 6E 1325 2036 x x 785 1044 171 5 181 341 6F 1013 1767 x x 778 985 208 10 196 360 6G 1580 2023 x x 965 998 193 10 217 409 6H 1263 1302 x x 845 1097 135 15 209 393 6I 1015 1353 x x 779 897 202 20 182 375 6J 969 1213 x x 708 763 140 15 165 299
Table 11. Eutectic cell size in connection to thermocouples from inoculation experiment.
32
Heat Specimen
UTSσ [MPa]
UTSε [%]
ysσ
[MPa]
E
[GPa]
D
[µm]
ausf
whitef
I 398 0.59 393 134 111 0,34 0,10 II 404 0.538 395 124 107 6A III - - - - - I 393 0.77 345 125 115 II 366 0.55 347 139 158 0,43 6B III - - - - - I 335 0.99 297 137 122 II 269 0.38 - - - 6C III 328 0.52 - 109 124 0,45 I 386 0.41 - 130 117 II 362 0.28 - 171 134 0,38 6D III 320 0.48 310 139 - I 376 0.45 - 110 - II 357 0.61 326 147 157 0,30 6E III 403 0.69 370 143 102 I 330 0.64 300 143 162 II 354 0.73 313 152 139 6F III 351 0.64 317 149 145 0,38 I 324 0.44 321 165 - 0,46 II 287 0.56 266 176 151 6G III 346 1.6 - - 108 I 359 0.67 321 157 162 0,36 II 404 0.76 356 167 111 6H III 414 0.71 379 142 109 I 425 0.59 389 178 108 II 403 0.51 375 163 103 0,39 6J III 453 0.54 441 164 84 I 394 0.8 360 160 91 II 371 0.81 321 176 134 0,43 6K III 382 0.68 350 142 109
Table 12. Tensile properties, eutectic cell size and fraction primary phases measured on tensile bars from inoculation experiment. Cooling condition = Chill.
33
Heat Specimen
UTSσ [MPa]
UTSε [%]
ysσ
[MPa]
E
[GPa]
D
[µm]
ausf
I 252 0.84 215 87 742 0,28 II 246 0.87 230 84 883 6A III 254 0.83 210 94 737 I 241 0.71 217 71 900 II 242 0.68 204 100 938 6B III 233 0.82 219 106 909 0,30 I 228 0.63 215 70 990 II 237 0.71 217 79 786 6C III 236 0.65 214 78 889 0,28 I 234 0.65 212 80 946 0,30 II 250 0.98 212 101 745 6D III - - - - - I 244 0.65 220 86 702 II 249 0.65 224 98 705 0,37 6E III 250 0.31 228 86 678 I 245 0.6 227 102 645 0,28 II 254 0.63 233 92 664 6F III 255 0.66 222 115 639 I 219 0.82 186 87 896 II 216 0.71 182 109 744 0,33 6G III 217 0.73 182 101 - I 240 0.6 224 88 673 II 226 0.48 214 103 799 6H III 240 0.6 222 92 696 0,24 I 226 0.53 206 107 707 II 224 - 200 67 - 0,35 6J III 239 0.58 216 106 694 I 227 0.77 199 77 695 II 222 0.83 188 77 661 6K III 219 0.8 188 85 917 0,26
Table 13. Tensile properties, eutectic cell size and fraction primary phases measured on tensile bars from inoculation experiment. Cooling condition = Sand.
34
Heat Specimen
UTSσ [MPa]
UTSε [%]
ysσ
[MPa]
E
[GPa]
D
[µm]
ausf
I 226 0.57 208 100 965 0,26 II 198 0.36 194 90 1625 6A III 220 0.69 203 95 - I 209 0.52 193 89 925 0,32 II 195 0.42 - 85 1095 6B III 190 0.41 - 84 1395 I 191 0.4 186 88 1395 II 197 0.44 189 95 1233 0,33 6C III 144 0.4 - - 1922 I 199 0.48 182 85 1016 0,32 II 170 0.34 - 80 1609 6D III 205 0.56 184 88 1047 I 199 0.67 197 68 1212 0,30 II 178 0.41 174 107 1364 6E III 210 0.66 183 100 1065 I 237 0.56 215 117 936 II 219 0.52 209 86 993 0,41 6F III 228 0.67 204 88 - I 171 0.47 - 62 1472 0,36 II 185 0.58 164 83 1169 6G III - - - - - I 215 0.58 198 95 1258 II 226 0.42 225 111 1035 0,20 6H III 242 0.77 207 103 948 I 220 0.53 208 98 873 II 212 0.5 195 96 999 0,24 6J III 237 0.62 213 112 767 I 193 0.63 171 75 1075 II 207 0.65 183 109 1088 0,21 6K III 199 0.53 188 81 1100
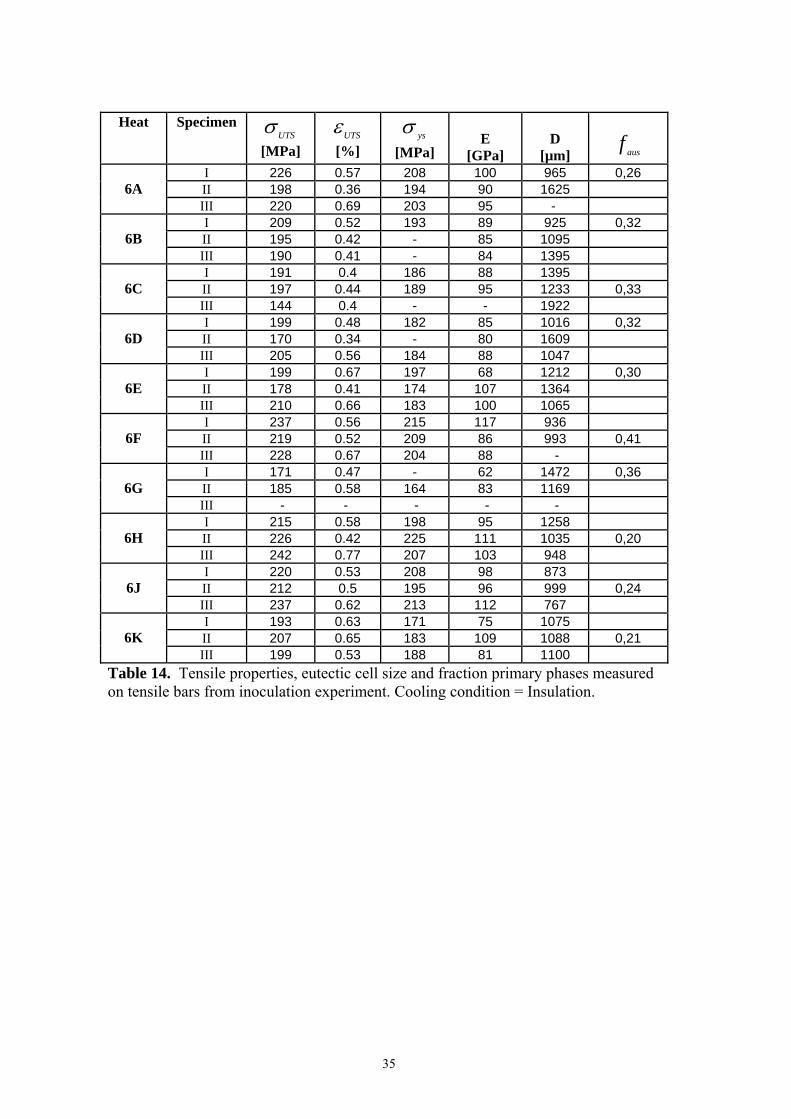
Table 14. Tensile properties, eutectic cell size and fraction primary phases measured on tensile bars from inoculation experiment. Cooling condition = Insulation.
35