Microstructure and Mechanical Properties of Nano...
22
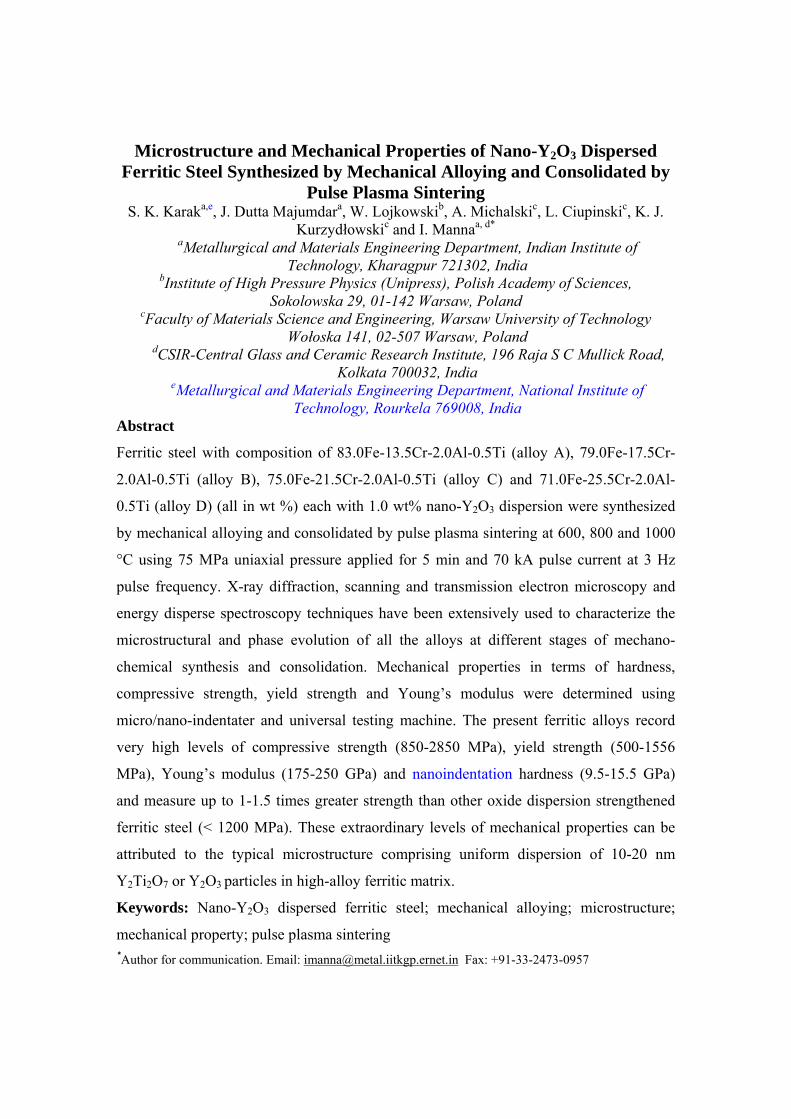
Microstructure and Mechanical Properties of Nano-Y 2 O 3 Dispersed Ferritic Steel Synthesized by Mechanical Alloying and Consolidated by Pulse Plasma Sintering S. K. Karak a,e , J. Dutta Majumdar a , W. Lojkowski b , A. Michalski c , L. Ciupinski c , K. J. Kurzydłowski c and I. Manna a, d* a Metallurgical and Materials Engineering Department, Indian Institute of Technology, Kharagpur 721302, India b Institute of High Pressure Physics (Unipress), Polish Academy of Sciences, Sokolowska 29, 01-142 Warsaw, Poland c Faculty of Materials Science and Engineering, Warsaw University of Technology Wołoska 141, 02-507 Warsaw, Poland d CSIR-Central Glass and Ceramic Research Institute, 196 Raja S C Mullick Road, Kolkata 700032, India e Metallurgical and Materials Engineering Department, National Institute of Technology, Rourkela 769008, India Abstract Ferritic steel with composition of 83.0Fe-13.5Cr-2.0Al-0.5Ti (alloy A), 79.0Fe-17.5Cr- 2.0Al-0.5Ti (alloy B), 75.0Fe-21.5Cr-2.0Al-0.5Ti (alloy C) and 71.0Fe-25.5Cr-2.0Al- 0.5Ti (alloy D) (all in wt %) each with 1.0 wt% nano-Y 2 O 3 dispersion were synthesized by mechanical alloying and consolidated by pulse plasma sintering at 600, 800 and 1000 °C using 75 MPa uniaxial pressure applied for 5 min and 70 kA pulse current at 3 Hz pulse frequency. X-ray diffraction, scanning and transmission electron microscopy and energy disperse spectroscopy techniques have been extensively used to characterize the microstructural and phase evolution of all the alloys at different stages of mechano- chemical synthesis and consolidation. Mechanical properties in terms of hardness, compressive strength, yield strength and Young’s modulus were determined using micro/nano-indentater and universal testing machine. The present ferritic alloys record very high levels of compressive strength (850-2850 MPa), yield strength (500-1556 MPa), Young’s modulus (175-250 GPa) and nanoindentation hardness (9.5-15.5 GPa) and measure up to 1-1.5 times greater strength than other oxide dispersion strengthened ferritic steel (< 1200 MPa). These extraordinary levels of mechanical properties can be attributed to the typical microstructure comprising uniform dispersion of 10-20 nm Y 2 Ti 2 O 7 or Y 2 O 3 particles in high-alloy ferritic matrix. Keywords: Nano-Y 2 O 3 dispersed ferritic steel; mechanical alloying; microstructure; mechanical property; pulse plasma sintering * Author for communication. Email: [email protected] Fax: +91-33-2473-0957
Transcript of Microstructure and Mechanical Properties of Nano...
Microstructure and Mechanical Properties of Nano-Y2O3 Dispersed Ferritic Steel Synthesized by Mechanical Alloying and Consolidated by
Pulse Plasma Sintering S. K. Karaka,e, J. Dutta Majumdara, W. Lojkowskib, A. Michalskic, L. Ciupinskic, K. J.
Kurzydłowskic and I. Mannaa, d* aMetallurgical and Materials Engineering Department, Indian Institute of
Technology, Kharagpur 721302, India bInstitute of High Pressure Physics (Unipress), Polish Academy of Sciences,
Sokolowska 29, 01-142 Warsaw, Poland cFaculty of Materials Science and Engineering, Warsaw University of Technology
Wołoska 141, 02-507 Warsaw, Poland dCSIR-Central Glass and Ceramic Research Institute, 196 Raja S C Mullick Road,
Kolkata 700032, India eMetallurgical and Materials Engineering Department, National Institute of
Technology, Rourkela 769008, India Abstract
Ferritic steel with composition of 83.0Fe-13.5Cr-2.0Al-0.5Ti (alloy A), 79.0Fe-17.5Cr-
2.0Al-0.5Ti (alloy B), 75.0Fe-21.5Cr-2.0Al-0.5Ti (alloy C) and 71.0Fe-25.5Cr-2.0Al-
0.5Ti (alloy D) (all in wt %) each with 1.0 wt% nano-Y2O3 dispersion were synthesized
by mechanical alloying and consolidated by pulse plasma sintering at 600, 800 and 1000
°C using 75 MPa uniaxial pressure applied for 5 min and 70 kA pulse current at 3 Hz
pulse frequency. X-ray diffraction, scanning and transmission electron microscopy and
energy disperse spectroscopy techniques have been extensively used to characterize the
microstructural and phase evolution of all the alloys at different stages of mechano-
chemical synthesis and consolidation. Mechanical properties in terms of hardness,
compressive strength, yield strength and Young’s modulus were determined using
micro/nano-indentater and universal testing machine. The present ferritic alloys record
very high levels of compressive strength (850-2850 MPa), yield strength (500-1556
MPa), Young’s modulus (175-250 GPa) and nanoindentation hardness (9.5-15.5 GPa)
and measure up to 1-1.5 times greater strength than other oxide dispersion strengthened
ferritic steel (< 1200 MPa). These extraordinary levels of mechanical properties can be
attributed to the typical microstructure comprising uniform dispersion of 10-20 nm
Y2Ti2O7 or Y2O3 particles in high-alloy ferritic matrix.
Keywords: Nano-Y2O3 dispersed ferritic steel; mechanical alloying; microstructure;
mechanical property; pulse plasma sintering
*Author for communication. Email: [email protected] Fax: +91-33-2473-0957
1. Introduction
There is a growing technological interest in nano-oxide dispersed ferritic steels
for applications as heat exchanger parts, superheater tubes, and similar structural
components in thermal or fast-breeder nuclear reactors [1-4]. Though ferritic steels
possess excellent oxidation and corrosion resistance, dispersion of nanometric rare-earth
oxide like Y2O3 or CeO2 further enhance the creep strength at elevated temperature.
Usually austenitic or ferritic steels tend to undergo a marked loss in creep strength at
temperatures above 600 ºC. However, nano-oxide dispersed ferritic steels can be used at
much higher temperature. The excellent high temperature oxidation and hot corrosion
resistance of ferritic steels is attributed to high Cr (and also Al) content conducive for the
formation of stable, dense and tightly adherent Cr2O3 or Al2O3 protective oxide film. This
oxide film/layer forms during the final heat treatment of the mill products [5]. The high
stability of oxide dispersoids within the alloy matrix allows retention of usable strength at
temperatures almost up to 90 % of its solidus temperature [6,7]. In comparison,
conventional ferritic steels can be used only up to an operating temperature of 550-600
ºC. Carbide strengthened steels are not safe in the above mentioned application because
carbon can leach out or dissolve in liquid sodium environment in fast-breeder nuclear
reactor. The usual melting and casting route is not suitable for developing nano-oxide
dispersed high-alloy ferritic steels due to significant difference in melting points, density,
solubility and chemical reactivity of the concerned components. In this regard,
mechanical alloying involve mutual dissolution of an elemental powder blend by high
energy planetary ball milling is an inexpensive, convenient and effective method of
producing such nano-oxide dispersed high Cr-Al-Ti ferritic alloy/steel at ambient
temperature [4]. Indeed, oxide dispersion strengthened steels produced by mechanical
alloying with Y2O3 dispersion have recorded higher creep resistance and elevated
temperature tensile strength compared to traditional ferritic/martensitic steels of similar
compositions [8–11].
However, the mechanically alloyed powders are not suitable for structural and
engineering applications, unless bulk components can be produced from such powders.
Several possible routes exist which can be utilized to consolidate mechanically alloyed
powders into bulk or finished components like hot extrusion [12], cold compaction and
pressure-less sintering [13], high pressure sintering [14,15], equi-channel angular
pressing [16,17], laser sintering [18], hot isostatic pressing [19] and pulse plasma
sintering [20]. The last one is quite suitable to develop dense isotropic, homogeneous and
near-net shape solid bodies from mechanically alloyed powders with dispersion of
ultrafine and light oxide particles. During this particular sintering process, an electric
field is applied (~ 600 MW) to activate and heat the powder mass by high current
discharge pulses. The process is characterized by very high thermal efficiency and is
quite similar to other plasma assisted sintering processes like spark plasma sintering and
field assisted sintering, but differs in terms of the quantum of energy delivered and
crucible design [21,22]. During the short pulses, the powder compact is subjected to
cycles of very rapid heating and cooling with very short holding time at the sintering
temperature, lower than that used in normal spark plasma sintering [23].However, studies
on pulse plasma sintering of nano-oxide dispersed mechanically alloyed ferritic steel are
rather limited. Furthermore, composition of the ferritic steel itself needs optimization in
terms of relative proportion of Fe and Cr with minor addition of Ti and Al. Hence,
extensive studies are warranted to optimize both alloy composition and consolidation
process for manufacturing components from ferritic steel powders with nanometric oxide
dispersion that can offer the desired range of mechanical and physical properties at
ambient and elevated temperatures. Recently, we have explored consolidation of the
same set of mechanically alloyed ferritic steels by high pressure sintering at 600-1000 C
under 8 GPa uniaxial pressure [24] and hot isostatic pressing at 600-1000 C under 1.2
GPa uniaxial pressure [25,26].
In the present investigation, a series of nano-Y2O3 dispersed ferritic steel powders
(with varying Fe and Cr contents) was synthesized by mechanical alloying and
consolidated using pulsed plasma sintering at different temperatures. Subsequently, the
density, microstructures, hardness, compressive deformation and failure modes of the
present steels have been extensively investigated to arrive at a conclusive microstructure-
property-process parameter correlation and assessment of the present steels for possible
application as structural components in nuclear reactors.
2. Experimental Procedure Four different elemental powder (>99.9 wt% purity and 30-80 m size) blends with
initial composition of 83.0Fe-13.5Cr-2.0Al-0.5Ti (alloy A), 79.0Fe-17.5Cr-2.0Al-0.5Ti
(alloy B), 75.0Fe-21.5Cr-2.0Al-0.5Ti (alloy C), and 71.0Fe-25.5Cr-2.0Al-0.5Ti (alloy D)
(all in wt %) each with 1.0 wt % nano-Y2O3 addition/dispersion were subjected to
mechanical alloying by high energy ball milling in a multi vial Fritsch PM400 planetary
ball mill, operated at 300 rpm using a new set of stainless steel vials and balls (10 mm
diameter). Milling was conducted with a ball to powder ratio of 10:1 in wet (toluene)
medium to avoid agglomeration of powders and ensure maximum yield of milled
product. The identity and sequence of phase evolution in different stages of mechanical
alloying of all the alloys were monitored by X-ray assisted diffraction and reported
elsewhere in our earlier studies with the same set of alloys [25-26].
Following mechanical alloying, the milled powders were consolidated in a
vacuum chamber (vacuum level 5.5 10-3 Pa) by spark discharges that occur between
the particles across the pores present in the green compact. Figure 1 shows the schematic
representation of the apparatus for this pulse plasma sintering. Similar technique was
reported elsewhere by Michalski et al. [27,28]. Prior to sintering, the nano-size powder
was subjected to preparatory cold compaction under a pressure of 200 MPa. The
preforms of powder mixture were placed in a graphite die (diameter 20 mm and height 15
mm), between two punches to which electrical energy was delivered from a battery of
capacitors (300 F) each. The powder preforms were heated by high-current discharge
pulses, generated periodically from the capacitor battery, charged to a minimum of 10
kV.
The duration of each pulse was several hundred microseconds with high electric
current intensity (in few tens of kA). Figure 2 shows the thermal cycle and load variation
at different temperature during pulse plasma sintering process. Before the onset of
sintering, the chamber was pumped down to a pressure 5.5 10-3 Pa. The process was
carried out by a two-stage method; firstly the powder compacts were loaded to 30 MPa
pressure at 500 ºC for 3 min so as to remove the absorbed gases within the powder
particles or around their surfaces. After degassing, the compacts were further heated to
the final sintering temperature in between (600 ºC and 1000 ºC) with a uniaxial pressure
of 75 MPa applied for 5 min (shown in Figure 2). The temperature on the surface of the
graphite die was measured using Ahlborn IR AMIR 7838-51 pyrometer. During
sintering, the temperature and heating rate of the samples were varied by controlling the
pulse discharge energy and the pulse repetition frequency.
As already stated, the identity and sequence of phase evolution/transformation
during mechanical alloying and/or pulse plasma sintering (at appropriate stages) were
determined by using a Panalytical X’Pert Pro-diffractometer with Co-K (0.179 nm)
radiation. The density was determined by using a helium pycnometer (AccuPyc 1330)
[29]. Morphology, size, shape and distribution of the phases in the sintered components
and surface damage in worn tracks were studied using a field emission gun assisted
scanning electron microscopy (FESEM, Zeiss, Supra 40 V). Electron transparent thin
foils were prepared for transmission electron microscopy studies initially by mechanical
polishing followed by argon ion thinning using a GATAN precision ion mill for about 30
min. Selected foils prepared from alloys sintered at 1000oC were examined under a JEOL
JEM 2100 high resolution transmission electron microscope (HRTEM) operated at 200
kV, using both bright and dark field as well as high resolution lattice imaging mode.
Selected area diffraction (SAD) analysis was conducted to identify the phases present in
the milled/sintered product. Qualitative information on chemical compositions at
different locations was obtained using the energy dispersive spectroscopy (EDS) units
(Oxford, UK) equipped with an ultra-thin window and attached to both the FESEM and
HRTEM.
Mechanical properties in terms of nanoindentation hardness and elastic/Young’s
modulus were determined from nano-indentation test on selected sintered samples using
standard nano-indentation hardness (TriboIndenter with MultiRange NanoProbe,
Hysitron) with a Berkovitz indenter at 200 mN load. Each hardness value was measured
from an average of 15 point measurements for nano-indentation and repeated 3-5 times at
equivalent locations to ensure precision. The nanoindentation experimental data were
converted into Young’s/elastic modulus (E) and Poisson’s ratio () by the standard
equation:
ssiir E/)( E/)(E/ 22 111 (1)
where rE = reduced elastic modulus calculated from the experimental data (average), i =
Poisson’s ratio of diamond indenter tip (0.07), iE = elastic modulus of diamond (1140
GPa), s = Poisson’s ratio ODS ferritic alloy (0.294) and sE = elastic modulus of the
ODS ferritic alloy. Es reported here is evaluated by considering the elastic properties of
the ODS alloys and not the indenter.
Compression tests were carried out at a strain rate of 1 10-3 s-1 at room
temperature using a universal testing machine (Zwick/Roell Z 250). The dimension of the
cylindrical specimens for compression test was 4.0 mm diameter and 6.0 mm height to
maintain height/diameter = 1.5 (ASTM standard). The fracture surfaces of the ferritic
alloys subjected to compression tests were studied using an FESEM.
3. Results and Discussions
Figure 3 to Figure 6 show the results of XRD analysis of alloys A, B, C and D
consolidated by pulse plasma sintering at 600 °C, 800 °C and 1000 °C, respectively. A
close scrutiny of the XRD profile of each alloy reveals that BCC-Fe(Cr) phase is the
predominant constituent of the all the sintered product along with intermetallic phases
like Fe11TiY and Al9.22Cr2.78Y and mixed oxide phase like Y2Ti2O7. Prior to sintering, the
present alloys were synthesized from elemental powder blends of pre-determined
composition by mechanical alloying for different cumulative time periods (0 to 40 h).
XRD of the as-milled powders clearly reveal that the milled product in each case is a
single phase body centre cubic (BCC) solid solution indicating that Cr, Al and Ti
completely dissolve in Fe in course of high-energy ball milling for 30-40 h. The amount
(1.0 wt %) Y2O3 is too small to produce separate peaks in the XRD patterns. The detailed
characterization of the four alloys during synthesis by mechanical alloying was recently
reported elsewhere by Karak et al. [25-26], and hence not repeated here. Yet it is relevant
to point out that during mechanical alloying solute elements like Cr, Ti, and Al gradually
dissolve in the bcc-Fe matrix/lattice and the lattice parameter of bcc-Fe gradually
increases in all the four alloys up to about 10 h of milling indicating possible effects of
solid solution strengthening.
Figures 7 (a, b) show the bright field and corresponding dark field TEM image of
alloy A sintered at 600oC. These micrographs clearly confirm the presence of 10-20 nm
ultrafine Y2Ti2O7 particles distributed uniformly in the matrix. Figures 8 (a, b) show the
bright field image and corresponding SAD pattern of alloy A sintered at 1000ºC. Figure
8(a) evidences the presence of Y2Ti2O7 particles (10-20 nm) as well as Al9.22Cr2.78Y and
Fe11TiY intermetallic phases along the grain boundary and grain boundary triple point.
The details analysis of bulk SAD patterns (Figure 8(b)) confirms the presence of
corresponding phases, namely, the (110), (200) and (211) planes for the BCC Fe-Cr
phase, (222) for the Y2Ti2O7 mixed oxide phase, (040) for the Al9.22Cr2.78Y and (321) for
the Fe11TiY intermetallic phases, respectively. The calculated interplanar spacing (d) of
BCC Fe-Cr phase matches with the standard d-values of 0.2020 nm for (110), 0.1430 nm
for (200) and 0.1010 nm for (220) planes, respectively. Similarly, the measured d-values
of Y2Ti2O7 mixed oxide match with the standard values of 0.2914 nm for (222) and
0.2115 nm for (321) planes in Fe11TiY, and 0.2257 nm for (040) planes in Al9.22Cr2.78Y
intermetallic phases, respectively.
It may be noted that distribution of nano-Y2O3 or Y2Ti2O7 is quite uniform though
varying in size within a narrow range. This size variation may arise as these particles
could be both ex-situ Y2O3, or, in-situ Y2Ti2O7 phases produced during sintering. It may
be pointed out that presence of such ultrafine oxide is desirable to induce resistance to
grain boundary sliding at elevated temperature (creep deformation). It is apparent that
increase in sintering temperature from 600 ºC to 1000 ºC leads to significant grain growth
(Figure 7a vis-à-vis Figure 8a). This is due to enhanced diffusion activity at higher
sintering temperature (1000 ºC) which can be easily estimated through the usual
Arrhenius relation as follows:
D = D0 exp (-E/RT) (2)
where D is the diffusion coefficient at an isothermal temperature (T), D0 is the pre-
exponential factor and E is the activation energy. The standard values for diffusional
kinetic analysis are: D0 = 3.56 10-6 m2/s and E =185 kJ/mol at 600 oC [30] and D0 = 2.1
10-4 m2/s and E = 240 kJ/mol at 1000 oC [31], respectively. Accordingly, the calculated
values of diffusion coefficients from equation (2) at 600 oC and 1000 oC are 3.45 10-6
m2/s and 1.97 10-4 m2/s, respectively. Assuming the steady state isothermal growth
dominated by volume diffusion of Cr in -Fe, the diffusion distance (X) covered at time
(t) at these reference temperatures, calculated as per the relation: X = 21
)Dt( is found an
order of magnitude larger at 1000 oC ( 190 m) than that at 600 oC (30 m). It is
obvious that average grain size at 1000 oC will be significantly higher at 1000 oC,
compared to that at 600 oC or at 800 oC as per usual growth kinetics relation.
The grain coarsening kinetics during isothermal sintering of oxide dispersed
strengthened alloys may follow the usual grain growth kinetic relation [32]
nn dd 0 = kt (3)
where d and 0d are average grain diameter at a given time and initial time period, n is the
power exponent, and K is temperature dependent rate constant, respectively K in turn is a
function of diffusion coefficient (D) of the growth controlling species, equilibrium
solubility of the precipitate/solute in the matrix (Ce) and the concerned matrix-
precipitate/dispersoid interfacial energy ().
The coarsening rate during sintering can be studied by volume-controlled
coalescence of particles driven by curvature, as described by the Lifshitz-Sloyzov-
Wanger theory [33,34]. In the present case coarsening of these nanocrystalline oxide
dispersed strengthened alloys can be expressed as
3 30d d kt (4)
The nanomatric oxide particles (Y2Ti2O7) can act as a pinning agent during the
course of high temperature deformation or use of oxide dispersed alloys. This pinning or
frictional action can be correlated to a simple Zener pinning [33] type of strengthening
mechanism expressed as
2 / 3( / )rd r f (5)
where d is the grain size, r is the particle radius and rf is the volume fraction of the
dispersed particle. There is no substantial difference in size between the particles residing
within the grain and those along the boundary. These particles can offer significant
strengthening at elevated temperature provided they are harder than the matrix and do not
dissolve in or react with the matrix.
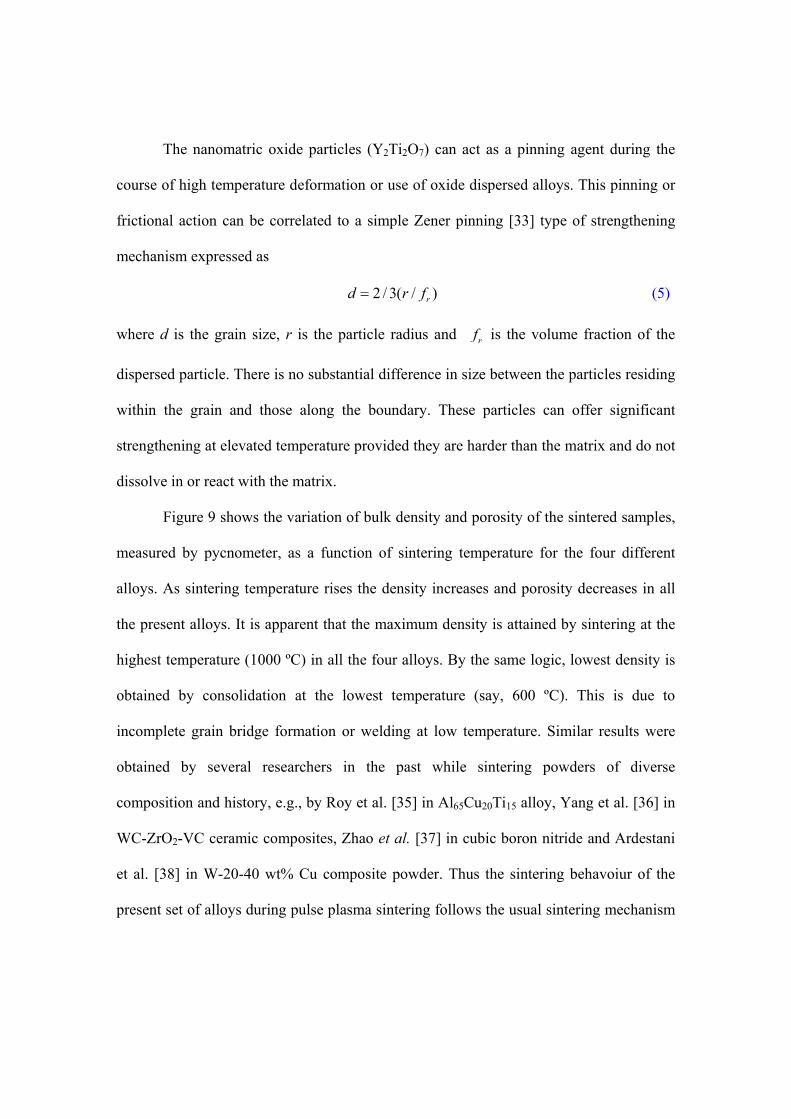
Figure 9 shows the variation of bulk density and porosity of the sintered samples,
measured by pycnometer, as a function of sintering temperature for the four different
alloys. As sintering temperature rises the density increases and porosity decreases in all
the present alloys. It is apparent that the maximum density is attained by sintering at the
highest temperature (1000 ºC) in all the four alloys. By the same logic, lowest density is
obtained by consolidation at the lowest temperature (say, 600 ºC). This is due to
incomplete grain bridge formation or welding at low temperature. Similar results were
obtained by several researchers in the past while sintering powders of diverse
composition and history, e.g., by Roy et al. [35] in Al65Cu20Ti15 alloy, Yang et al. [36] in
WC-ZrO2-VC ceramic composites, Zhao et al. [37] in cubic boron nitride and Ardestani
et al. [38] in W-20-40 wt% Cu composite powder. Thus the sintering behavoiur of the
present set of alloys during pulse plasma sintering follows the usual sintering mechanism
as observed in conventional long duration at elevated temperature and by pressureless
sintering.
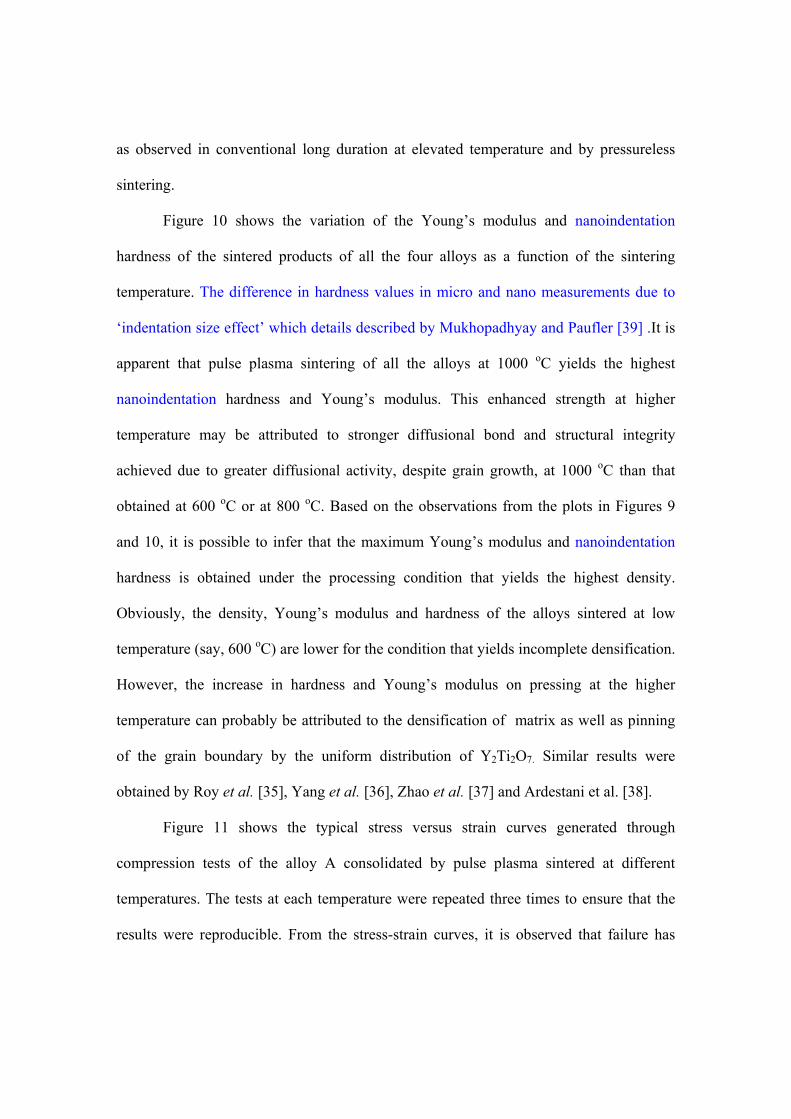
Figure 10 shows the variation of the Young’s modulus and nanoindentation
hardness of the sintered products of all the four alloys as a function of the sintering
temperature. The difference in hardness values in micro and nano measurements due to
‘indentation size effect’ which details described by Mukhopadhyay and Paufler [39] .It is
apparent that pulse plasma sintering of all the alloys at 1000 oC yields the highest
nanoindentation hardness and Young’s modulus. This enhanced strength at higher
temperature may be attributed to stronger diffusional bond and structural integrity
achieved due to greater diffusional activity, despite grain growth, at 1000 oC than that
obtained at 600 oC or at 800 oC. Based on the observations from the plots in Figures 9
and 10, it is possible to infer that the maximum Young’s modulus and nanoindentation
hardness is obtained under the processing condition that yields the highest density.
Obviously, the density, Young’s modulus and hardness of the alloys sintered at low
temperature (say, 600 oC) are lower for the condition that yields incomplete densification.
However, the increase in hardness and Young’s modulus on pressing at the higher
temperature can probably be attributed to the densification of matrix as well as pinning
of the grain boundary by the uniform distribution of Y2Ti2O7. Similar results were
obtained by Roy et al. [35], Yang et al. [36], Zhao et al. [37] and Ardestani et al. [38].
Figure 11 shows the typical stress versus strain curves generated through
compression tests of the alloy A consolidated by pulse plasma sintered at different
temperatures. The tests at each temperature were repeated three times to ensure that the
results were reproducible. From the stress-strain curves, it is observed that failure has
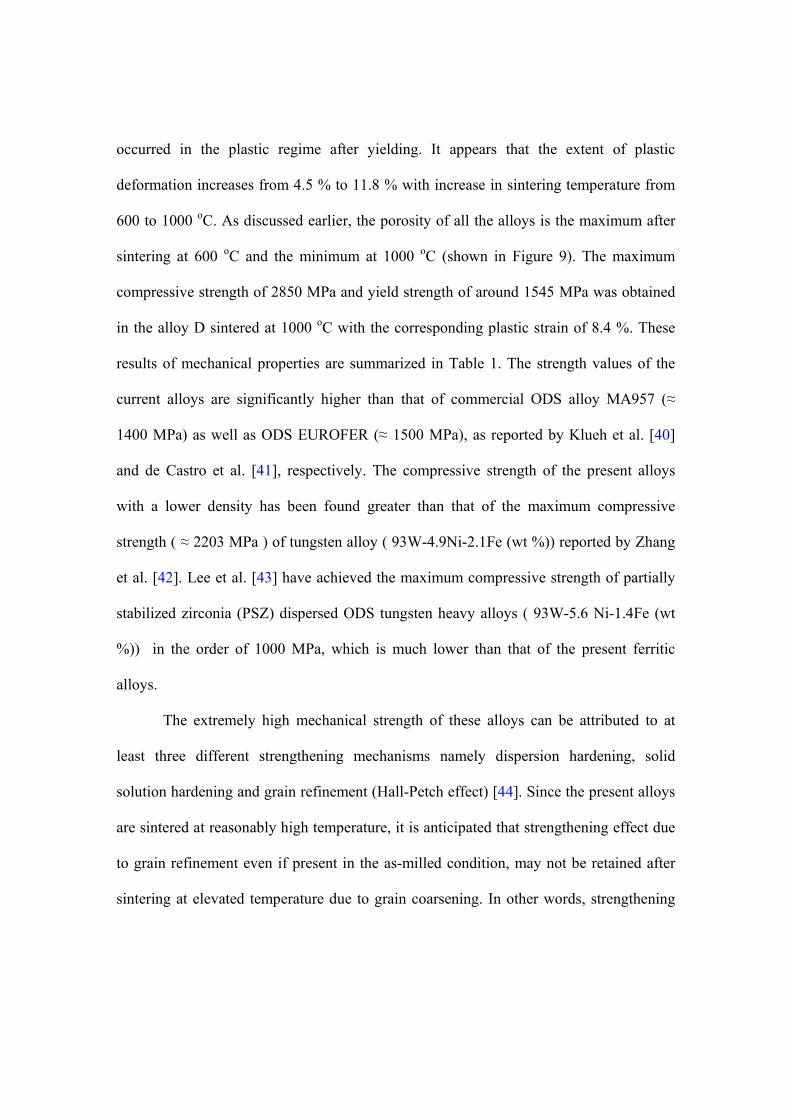
occurred in the plastic regime after yielding. It appears that the extent of plastic
deformation increases from 4.5 % to 11.8 % with increase in sintering temperature from
600 to 1000 oC. As discussed earlier, the porosity of all the alloys is the maximum after
sintering at 600 oC and the minimum at 1000 oC (shown in Figure 9). The maximum
compressive strength of 2850 MPa and yield strength of around 1545 MPa was obtained
in the alloy D sintered at 1000 oC with the corresponding plastic strain of 8.4 %. These
results of mechanical properties are summarized in Table 1. The strength values of the
current alloys are significantly higher than that of commercial ODS alloy MA957 (≈
1400 MPa) as well as ODS EUROFER (≈ 1500 MPa), as reported by Klueh et al. [40]
and de Castro et al. [41], respectively. The compressive strength of the present alloys
with a lower density has been found greater than that of the maximum compressive
strength ( ≈ 2203 MPa ) of tungsten alloy ( 93W-4.9Ni-2.1Fe (wt %)) reported by Zhang
et al. [42]. Lee et al. [43] have achieved the maximum compressive strength of partially
stabilized zirconia (PSZ) dispersed ODS tungsten heavy alloys ( 93W-5.6 Ni-1.4Fe (wt
%)) in the order of 1000 MPa, which is much lower than that of the present ferritic
alloys.
The extremely high mechanical strength of these alloys can be attributed to at
least three different strengthening mechanisms namely dispersion hardening, solid
solution hardening and grain refinement (Hall-Petch effect) [44]. Since the present alloys
are sintered at reasonably high temperature, it is anticipated that strengthening effect due
to grain refinement even if present in the as-milled condition, may not be retained after
sintering at elevated temperature due to grain coarsening. In other words, strengthening
due to dispersion hardening and solid solution effects would be dominating factors
compared to grain refinement effect in the present alloys.
The total strength ( ) can be expressed by the generally accepted relation [45-50]
s d (6)
where s and d represent the critical resolved shear stress of the solid solution (matrix)
and dispersion hardening, respectively. The general equation for solid solution
strengthening has the form
m ns G c (7)
where G is the matrix shear modulus, = (rmatrix -rsoulte)/ rmatrix is the misfit strain based
on radius (r) of concerned spices (matrix or solute), c is the atomic fraction of solute and
is a constant, m and n depend on assumptions made about solute spacing and statistical
averaging of the solute-dislocation interactions [51]. For the mean solute spacing, m = 1
and n = 0.5, Friedel statistics (Fleischer model) yield m = 1.5 and n = 0.5 and the
Labusch analysis [51] in the limit of strong localized interactions yields m = 1.33 and n =
0.667.
Dispersion strengthening in the current ferritic steel is primarily dependent on the
volume fraction, particle size and interparticle spacing of fine nano-Y2O3 or Y2Ti2O7 in
the matrix. Beside the ex-situ nano-Y2O3, several in-situ mixed oxide (Y2Ti2O7) or
intermetallic Fe11TiY and Al9.22Cr2.78Y particles have also been detected in the sintered
microstructure (Figures 3-7). The size and distribution of these ultrafine phases are
determined by nucleation, growth and coarsening rates during pulse plasma sintering.
The essential parameter governing the variation in nucleation rate is chemical driving
force, while that governing growth and coarsening is the prevailing diffusion rate.
Strengthening (d) through the dispersed particles (when the size of the dispersoids or
second-phase particles is less than the grain size) is governed by the Orowan mechanism
[52]. The critical stress for Orowan process d is a function of volume fraction of second
phase particles f and average radius r of the spherical incoherent particles and sintering
temperature (T).
' /d k Gb (8)
where, G is the shear modulus of the matrix, b is the magnitude Burgers vector of the
dislocation, is the interparticle spacing and 'k is a numerical constant.
4(1 ) / 3f r f (9)
The strengthening mechanism of these alloys are very much complex. Hardening of the
current alloys not only depends on dispersion, solid solution and grain boundary
strengthening but also on precipitation hardening due to presence or precipitation of
intermetallic phases in the microstructure. Analysis of the XRD patterns (Figures 3 to 6)
and TEM images (Figures 8 (a, b)) confirm the presence of intermetallic (Fe11TiY and
Al9.22Cr2.78Y), which are likely to contribute to increasing the strength of the ferritic
matrix by precipitation strengthening.
Figures 12 (a, b) show the low and high magnification views of the fracture
surface generated during compression tests carried out on the alloy A consolidated at
1000 oC by pulse plasma sintering. These fractographs confirm that void formation
precede fracture during compression test and suggest that the failure is not totally brittle
in nature. Figure 12a reveals evidence of some dimple formation along with interfacial
decohesion of the Y2Ti2O7 particles from the Fe-Cr alloy matrix during localized plastic
deformation. The small size (nanometric scale) and uniform distribution of dispersoids
seem to restrict the slip process within the matrix during bulk deformation. As suggested
by Hawk et al. [53], higher plastic deformation and ductility can arise only through a
dislocation climbing process over the intermetallic dispersoids in such dispersion
strengthened matrix. Such interactions affect the matrix deformation behaviour resulting
in an increased flow stress but decreased capacity for strain hardening. The mechanical
properties (nanoindentation hardness, compressive strength, elastic/Young’s modulus)
are functions of the sintering temperature. This trend is confirmed by the level of
improvement of mechanical properties of all the alloys as the sintering temperature
increases from 600 to 1000 C. The mechanical properties (Table 1) of alloy D sintered at
1000 C are the best. It is interesting to note that the percent elongation decreases with
increase in Cr content of all the alloys. The compressive strength of the current alloys is
maximum for alloy D (Table 2) consolidated by hot isostaic pressing at 1000 oC as
compared to that obtained after consolidation by other two techniques namely, high
pressure and pulse plasma sintering. It is important to note that our earlier studies showed
that the same alloys following sintering by hot isostatic pressing [25,26] and high
pressure sintering [24] were very strong but fairly brittle. However, the same alloys seem
to yield comparable or higher compressive strength with marginally higher ductility
following consolidation by pulse plasma sintering. Thus, it is interesting to note that the
same set of mechanically alloyed powders with identical composition and microstructural
state can eventually produce widely different mechanical properties when sintered by
different techniques using the optimum process parameters.
4. Conclusions
The present study suggests that pulse plasma sintering is a promising technique for
consolidation of mechanically alloyed powders of nano-Y2O3 dispersed Fe-Cr-Al-Ti
ferritic alloys. Density, hardness and compressive stress of all the alloys increase with
increase in sintering temperature. The present ferritic alloys record extremely high ranges
of compressive strength (850-2850 MPa), yield strength (525-1545 MPa), Young’s
modulus (175-250 GPa) and nanoindentation hardness (8.5-17.5 GPa) and measure up to
1.5-2 times greater compressive strength with a lower density (~ 7.4 Mg/m3) than other
oxide dispersion strengthen ferritic steel (< 1200 MPa) or tungsten based alloys (< 2200
MPa). The novelty of the present consolidation route lies in the unique microstructure
comprising uniform distribution of 10-20 nm Y2Ti2O7 or Y2O3 particles, recommended
for grain boundary pinning and creep resistance. Substantial grain coarsening occurs in
all the alloys consolidated at 1000 oC as compared to that at 600 oC or at 800 oC due to
greater extent of volume diffusion of Cr in -Fe at this higher temperature. These
mechanical properties compare well with those from the same set of alloys consolidated
by high pressure sintering [24] and hot isostatic pressing [25, 26], earlier reported by us.
However, the extent of plastic deformation prior to failure recorded in the present study is
higher than that obtained in the earlier studies based on other consolidation methods.
Acknowledgements:
The authors would like to thankfully acknowledge partial financial support provided for
this research work by CSIR, New Delhi (project no. OLP 0280 at CSIR-CGCRI) and
INAE (Visvesvarya Chair Professorship).
Reference:
[1] J.J. Huet, and V. Leroy, Nucl. Tech. 24 (1974) p. 216. [2] S. Ukai, T. Nishida, T. Okunda and T. Yoshitake, J. Nucl. Mater 258-263 (1998) p.
1745. [3] A. Kimura, T. Sawai, K. Shiba, A. Hishinuma, S. Jitsukawa, S. Ukai and A.
Kohyama, Nucl. Fusion 43 (2003) p.1246. [4] C. Capdevila, Y. L. Chen, N. C. Krieger Lassen, A. R. Jones and H. K. D. H.
Bhadeshia, ISIJ International 43 (2003) p.777. [5] R. F. Singer, R. C. Benn, and S. K. Kang, Frontiers of High Temperatures Materials
II, Incomap, London, p.336 1983. [6] G. M. McColvin, and G.D. Smith, Elsevier Applied Science (1985) p.139. [7] E. Arzt, Acta. Mat. 46 (1998) p.5611. [8] T. Allen, R.L.Klueh, and S. Ukai, Fuels and Materials for Transmutation, OECD
NEA Report Number 5419 (2005) p.135. [9] S.Ohtuska, S. Ukai, M. Fujiwara, T. Kaito and T. Narita, Mater. Trans. A 46 (2005)
p. 487. [10] S. Ukai, S. Mizuta, T. Yoshitake, T. Okuda, M. Fujiwara, S. Hagi and S.T.
Kobayashi, J. Nucl. Mater. 283–287(2000) p.702. [11] M. K. Miller, D.T.Hoelzer, E. A. Kenik, and K.F. Russell, Intermetallics 13 (2005)
p.387 [12] J. R. Weertman, D.Farkas, K. Hemker, H. Kung, M. Mayo and R. Mitra, MRS
Bulletin 24 (1999) p.44.
[13] M. Legros, B. R. Elliott, M. N. Rittner, J. R. Weertman and K. J. Hemker, Philos Mag A. 80 (2000) p.1017.
[14] S. Bera, W.Lojkowski and I. Manna, Metal. Mater. Trans. A 40 (2009) p.3276. [15] D. Roy, R.Mitra, T. Chudoba, Z. Witczak, W. Lojkowski, H.J.Fetch and I. Manna,
Mater. Sci. Engg A. 497 (2008) p. 93. [16] S. Z. Han, M. Goto, C. Lim, C. J. Kim, and S. Kim, J. Alloys Comp.434-435 (2007)
p.304. [17] E. Hosseini and M. Kazeminezhad, Comp. Mater. Sci., 44 (2009) p.962. [18] S. S. Singh, D.Roy, R.Mitra, R.V.Subba Rao, R.K.Dayal, Baldev Raj and I.Manna,
Mater. Sci. Engg A. 501 (2009) p. 242. [19] C. Cayron, E. Rath, I. Chu and S. Launois, J. Nucl. Mater. 335 (2004) p. 83. [20] A. Michalski and D. Siemiaszko, Inter. J. Refra. Met. Hard Mater. 25 (2007) p.153. [21] M. Rosinski, and A. Michalski, Sol. Stat. Phenom. 114 (2006) p. 233. [22] M. Rosinski, A. Michalski, D. Siemiaszko, J. Jaroszewicz and K. J. Kurzydlowski,
Sol. Stat. Phenom. 114 (2006) p. 239. [23] C.Y. Xu, S. S. Jia and Z. Y. Cao, Mater. Character. 54 (2005) p. 394. [24] S. K. Karak, T. Chudoba, Z. Witczak, W. Lojkowski, L. Ciupinski, K. J.
Kurzydlowski and I.Manna, (2010) unpublished data, soon to be communicated. [25] S. K. Karak, C. S. Vishnu, Z. Witczak, W. Lojkowski, J. Dutta Majumdar and I.
Manna, Wear 270 (2010) p.5. [26] S. K. Karak, T. Chudoba, Z. Witczak, W. Lojkowski and I. Manna, Mater. Sci.Engg
A. 528 (2011) 7475. [27] A. Michalski, J. Jaroszewicz, M. Rosinski and D. Siemiaszko, Intermeallics 14
(2006) p.603 [28] A. Michalski, and M. Rosinski, J. Am.Ceram.Soc 91 (2008) p.3560. [29] A. Presz, M. Sikibska, M. Pilecki, Powder. Hand. Proc. 7 (1995) p. 321. [30] Y. M. Kulish, D.G. Sherman and Y. S. Tibabsheva, 66 (1969) p.85 Fiz. Metallov
Metalloved., 41 (1976) p.1261.
[31] A. M. Huntz, P. Guiraldenq, M. Aucouturier and P. Lacombe, Mem. Sci. Rev. Met. 66 (1969) p. 85.
[32] C. H. Shek, J. K Lai and G. M. Lin, Nanostruct. Mater. 11 (1999) p.887. [33] C. Zener, Private communication to C. S. Smith, Trans. Am. Inst. Min. Metall.Eng
175 (1949) p. 15. [34] C. Z.Wagner and Z. Elektrochem.65 (1961) p.581. [35] D. Roy, D. Chakravarty, R. Mitra and I. Manna, J. Alloys Comp. 460 (2008) p.320. [36] F. Z.Yang, J. Zhao and X. Ai, J. Mater. Proc. Tech. 209 (2009) p. 4531. [37] Y. Zhao and M. Wang, J. Mater. Proc. Tech. 209 (2009) p. 355. [38] M. Ardestani, H. R. Rezaie, H. Arabi and H. Razavizadeh, Int. J. Refr. Met Hard
Mat. 27, (2009) p. 862. [39] N. K. Mukhopadhyay, P. Paufler, Int. Mater. Rev. 51(2006)209 [40] R. L. Klueh, J. P. Shingledecker, R.W.Swindeman and D.T Hoelzer, J. Nucl.
Mater. 341 (2005) p.103. [41] V. De Castro, T. Leguey, M.A. Monge, A. Muñoz, R. Pareja, D. R. Amador, J. M.
Torralba and M.Victoria, J. Nucl. Mater. 322 (2003) p. 228. [42] Z. Zhaohui and W. Fuchi, Int. J. Refr. Met. Hard Mat. 19 (2001) p.177. [43] H. Lee Kyong, I. Cha Seung, J. Ryub Ho, F. Dilmore Morris and H. Honga Soon, J.
Alloys Comp. 434-435, (2007) p. 433. [44] George E. Dieter (George Ellwood), Mechanical metallurgy SI Metric ed. McGraw
Hill Co, Singapore, 1928, pp.189-193. [45] L. A. Gypen and A. Deruyttere, J. Mat. Sci. 12 (1977) p.1028. [46] A. J. Ardell, Met. Trans. A 16 (1985) p.2131. [47] E. Nembach and G. Neite, Prog. Mat. Sci. 29 (1985) p.177. [48] B. Reppich, in: R.W.Cahn, P. Haasen and E.J.Kramer (Eds.), Mat. Sci. Tech., 6,
VCH VerlagsgesellschaftmbH, Weinheim(1993) p. 311. [49] A. J. Ardell, in: J. H. Westbrook, R. L. Fleischer (Eds.), Intermetallic Compounds:
Principles and Practice, 2 (1994) p. 257.
[50] E. Nembach, Particle Strengthening of Metals and Alloys, Wiley, New York, 1996
p. 253. [51] R. Labusch, Phys. Stat. Sol. 41 (1970) p. 659. [52] E. Orowan, In: Symposium on Internal Stresses in Metals and Alloys, Institute of
Metals, London, 1948 p. 451. [53] J. A. Hawk, L. M. Angers and H. G. F Wilsdorf, Dispersion strengthened
aluminium alloys (PA, USA: TMS) 1988 p. 337
Figure Captions Figure 1: The schematic representation of the apparatus for pulse plasma sintering
Figure 2: Schematic of thermal cycle and load variation at different isothermal
temperature during pulse plasma sintering
Figure 3: XRD patterns of alloy A consolidated by pulse plasma sintering at different
temperatures
Figure 4: XRD patterns of alloy B consolidated by pulse plasma sintering at different
temperatures
Figure 5: XRD patterns of alloy C consolidated by pulse plasma sintering at different
temperatures
Figure 6: XRD patterns of alloy D consolidated by pulse plasma sintering at different
temperatures
Figure 7: (a) Bright field and (b)dark field TEM image of alloy A sintered at 600 oC
Figure 8: (a) Bright field TEM image and (b) corresponding SAD patterns of alloy A
sintered1000 oC
Figure 9: Variation of density and porosity as function of sintering temperature used for
pulse plasma sintering
Figure 10: Variation of nanoindentation hardness and Young’s modulus as function of
sintering temperature used for pulse plasma sintering
Figure 11: The variation of engineering stress with strain of alloy A at different sintering
temperature by pulse plasma sintering
Figure 12: FESEM images of the fracture surfaces generated during compression tests
carried out on the alloy A consolidated by pulse plasma sintering at 1000 oC
(a) low and (b) high magnification
Table Captions Table 1: Summary of mechanical properties of alloys A, B, C and D sintered by pulse
plasma sintering (PPS) at different temperature
Table 2: Comparison of compressive strengths of alloys A, B, C and D consolidated at
1000 C by high pressure sintering (HPS), hot isostatic pressing (HIP) and
pulse plasma sintering (PPS) techniques.