
MICROSTRUCTURE AND MECHANICAL PROPERTIES OF 2024-T3 …
191
MICROSTRUCTURE AND MECHANICAL PROPERTIES OF 2024-T3 AND 7075-T6 ALUMINUM ALLOYS AND AUSTENITIC STAINLESS STEEL 304 AFTER BEING EXPOSED TO HYDROGEN PEROXIDE Except where reference is made to the work of others, the work described in this dissertation is my own or was done in collaboration with my advisory committee. This dissertation does not include proprietary, restricted or classified information. ______________________________ Nofrijon Bin Imam Sofyan Certificate of Approval: _________________________ _________________________ Jeffrey W. Fergus William F. Gale, Chair Associate Professor Alumni Professor Mechanical Engineering Mechanical Engineering _________________________ _________________________ Barton C. Prorok ZhongYang Cheng Associate Professor Associate Professor Mechanical Engineering Mechanical Engineering _________________________ _________________________ German Mills George T. Flowers Associate Professor Interim Dean Chemistry and Biochemistry Graduate School
Transcript of MICROSTRUCTURE AND MECHANICAL PROPERTIES OF 2024-T3 …

MICROSTRUCTURE AND MECHANICAL PROPERTIES OF 2024-T3 AND 7075-T6
ALUMINUM ALLOYS AND AUSTENITIC STAINLESS STEEL 304
AFTER BEING EXPOSED TO HYDROGEN PEROXIDE
Except where reference is made to the work of others, the work described in this
dissertation is my own or was done in collaboration with my advisory
committee. This dissertation does not include proprietary,
restricted or classified information.
______________________________
Nofrijon Bin Imam Sofyan
Certificate of Approval:
_________________________ _________________________
Jeffrey W. Fergus William F. Gale, Chair
Associate Professor Alumni Professor
Mechanical Engineering Mechanical Engineering
_________________________ _________________________
Barton C. Prorok ZhongYang Cheng
Associate Professor Associate Professor
Mechanical Engineering Mechanical Engineering
_________________________ _________________________
German Mills George T. Flowers
Associate Professor Interim Dean
Chemistry and Biochemistry Graduate School

MICROSTRUCTURE AND MECHANICAL PROPERTIES OF 2024-T3 AND 7075-T6
ALUMINUM ALLOYS AND AUSTENITIC STAINLESS STEEL 304
AFTER BEING EXPOSED TO HYDROGEN PEROXIDE
Nofrijon Bin Imam Sofyan
A Dissertation
Submitted to
the Graduate Faculty of
Auburn University
in Partial Fulfillment of the
Requirements for the
Degree of
Doctor of Philosophy
Auburn, Alabama
August 9, 2008

iii
MICROSTRUCTURE AND MECHANICAL PROPERTIES OF 2024-T3 AND 7075-T6
ALUMINUM ALLOYS AND AUSTENITIC STAINLESS STEEL 304
AFTER BEING EXPOSED TO HYDROGEN PEROXIDE
Nofrijon Bin Imam Sofyan
Permission is granted to Auburn University to make copies of this dissertation at its
discretion, upon the request of individuals or institutions and at their expense.
The author reserves all publication rights.
_______________________ Signature of Author
_______________________ Date of Graduation

iv
This dissertation is dedicated to my parents Rosnah and Imam Sofyan, my wife Linda,
and my children Aga and Fiona. My parents have been an inspiration to me and instilled
a sense of commitment to reach my goals. My wife has tolerated my absence for far too
long and has maintained her support of my goals. I hope that my success in obtaining this
degree will make my children proud of me and aware that no goal is too high to obtained.

v
VITA
Nofrijon Bin Imam Sofyan, son of Rosnah and Imam Sofyan of Taeh Bukik, was
born on December 15, 1967 in Taeh Bukik, West Sumatera, Indonesia. He graduated
from SMA Dangung-Dangung High School in 1987 and immediately entered Andalas
University, Padang. He graduated with honors from Andalas University in April 1992
with a bachelor degree in chemistry. He then worked as a teacher at Indonesian College
of the Arts and Sciences, Surakarta, Central Java, for 5 years. During the last two years of
that period, he also served as the head of office of information and technology at the
same school. He entered graduate school at the University of Indonesia, Jakarta, in 1997
and received a masters degree in materials science in 1999. He worked on the staff of the
Research Center for Materials Science at the same school before entering the Doctoral
program in 2000. In October 2001 he joined Materials Engineering at Auburn University
as a research scholar in his effort to finish his doctoral degree, but then he decided to join
Materials Engineering as a full time graduate student. He entered Materials Engineering
Doctoral Program in Spring 2003. He married Lindawati, S., daughter of Janilas and
Syamsuar of Ampang Godang, on January 11, 1995 and have two lovely children. Their
son Aga Ridhova was born on May 3, 1996 and their daughter Fiona Angellinnov was
born on December 1, 1997.

vi
DISSERTATION ABSTRACT
MICROSTRUCTURE AND MECHANICAL PROPERTIES OF 2024-T3 AND 7075-T6
ALUMINUM ALLOYS AND AUSTENITIC STAINLESS STEEL 304
AFTER BEING EXPOSED TO HYDROGEN PEROXIDE
Nofrijon Bin Imam Sofyan
Doctor of Philosophy, August 9, 2008
(M.S., University of Indonesia, 1999)
(B.S., Andalas University, 1992)
191 Typed Pages
Directed by William F. Gale
The effect of hydrogen peroxide used as a decontaminant agent on selected
aircraft metallic materials has been investigated. The work is divided into three sections;
bacterial attachment behavior onto an austenitic stainless steel 304 surface; effect of
decontamination process on the microstructure and mechanical properties of aircraft
metallic structural materials of two aluminum alloys, i.e. 2024-T3 and 7075-T6, and an
austenitic stainless steel 304 as used in galley and lavatory surfaces; and copper
dissolution rate into hydrogen peroxide. With respect to bacterial attachment, the results
show that surface roughness plays a role in the attachment of bacteria onto metallic
surfaces at certain extent. However, when the contact angle of the liquid on a surface

vii
increased to a certain degree, detachment of bacteria on that surface became more
difficult. In its relation to the decontamination process, the results show that a corrosion
site, especially on the austenitic stainless steel 304 weld and its surrounding HAZ area,
needs more attention because it could become a source or a harborage of bio-contaminant
agent after either incidental or intentional bio-contaminant delivery. On the effect of the
decontamination process on the microstructure and mechanical properties of aircraft
metallic structural materials, the results show that microstructural effects are both
relatively small in magnitude and confined to a region immediately adjacent to the
exposed surface. No systematic effect is found on the tensile properties of the three
alloys under the conditions examined. The results of this investigation are promising with
respect to the application of vapor phase hydrogen peroxide as a decontaminant agent to
civilian aircraft, in that even under the most severe circumstances that could occur; only
very limited damage was observed. The results from the dissolution of copper by
concentrated liquid hydrogen peroxide showed that the rate of copper dissolution
increased for the first 15 minutes of the reaction time with an activation energy of 19
kJ/mol, and then the fraction of copper dissolved became constant. This constant
dissolution was expected to be due to the formation of copper hydroxide, which was
observed to precipitate after the solution settled for some time. However, because the
final consumption of hydrogen peroxide was not controlled, the exact reason for this
constant dissolution cannot be determined at this time. The value of activation energy is
within the range of activation energy found in the literature for other dissolution process.
The low activation energy for dissolution of pure copper correlates with the observation
of dissolution of copper from intermetallic particles in the aluminum alloys.

viii
ACKNOWLEDGMENTS
All the praises and thanks be to Allah, the Almighty. Following, the author would
like to express his deep sense of gratitude to Dr. William F. Gale for his constant support,
guidance and encouragement during the period of work, and for his genuine concern for
the well-being and success of his students. The author is indebted to Dr. Jeffrey W.
Fergus for his invaluable help and advice throughout the course of work; without him the
author would not be where he is now. Thanks are also due to the committee members Dr.
ZhongYang Cheng, Dr. Barton C. Prorok, and Dr. German Mills for their versatility in
tackling a different field of research and in their understanding through the projects; to
Dr. Curtis G. Shannon, Dr. Michael L. McKee and Dr. David M. Stanbury for their help
and valuable discussion; to Dr. Hyacinth S. Gale for her constant help and support; to his
colleagues in Dr. Gale’s group, not only for their assistance, but also for their friendship
during his time in Materials Engineering Program: Daniel A. Butts, Venu Krishnardula,
Rajeev Aluru, Chad Callender, Raghu Viswanathan, ShihFeng Chou, and Mobbassar
Hassan SK; and to Mr. Roy Howard for being a source of constant help. The author
would also like to express his sincere thanks to his parents for their love, prayers, and
endless support and to his wife Linda and his two beloved children Aga and Fiona for
their unconditional love, devotion, understanding, and patience for the past five years.

ix
Style manual or journal used: Metallurgical and Materials Transactions A
Computer software used: Microsoft Office 2007, SAS 9.0, and Image Pro 4.3

x
TABLE OF CONTENTS
LIST OF FIGURES ..............................................................................................................xiv
LIST OF TABLES ............................................................................................................. xviii
LIST OF ACRONYMS ........................................................................................................xix
1. INTRODUCTION ............................................................................................................ 1
2. LITERATURE REVIEW ................................................................................................ 8
2.1 Factors Affecting Bacterial Attachment to Surfaces .............................................. 9
2.2 Surface Roughness and Bacterial Attachment ...................................................... 11
2.2.1 Surface Roughness ........................................................................................ 11
2.2.2 Wettability and Adhesion ............................................................................. 14
2.2.3 Wettability and Bacterial Attachment .......................................................... 16
2.3 Decontamination Technology ................................................................................ 18
2.3.1 Chemical Methods for Decontamination ..................................................... 20
2.3.2 Process Selection ........................................................................................... 21
2.3.3 Efficacy .......................................................................................................... 23
2.3.4 Affordability .................................................................................................. 25
2.3.5 Materials Compatibility ................................................................................ 26
2.4 Hydrogen Peroxide ................................................................................................. 29

xi
2.4.1 Advantages of Vapor Phase Hydrogen Peroxide ........................................ 30
2.4.2 Limitations of Vapor Phase Hydrogen Peroxide......................................... 31
2.5 Selected Aircraft Metallic Materials ...................................................................... 32
2.5.1 Aluminum and Aluminum Alloys ................................................................ 32
2.5.2 2024 and 7075 Aluminum Alloys ................................................................ 49
2.5.3 Other Metallic Materials Used in Airframes and Cabin Fittings ............... 50
2.6 Copper Dissolution in Hydrogen Peroxide ........................................................... 50
2.7 Effect of Hydrogen Peroxide on Fatigue Life ....................................................... 59
3. OBJECTIVES OF THE RESEARCH .......................................................................... 61
4. MATERIALS AND METHODS .................................................................................. 63
4.1 Bacterial Attachment Behavior to a Surface ......................................................... 63
4.1.1 Specimens Preparation .................................................................................. 63
4.1.2 Surface Roughness and Contact Angle Measurements .............................. 67
4.1.3 Attachment of L. monocytogenes ................................................................. 68
4.1.4 Statistical Analysis ........................................................................................ 70
4.2 Effect of Decontamination on Aircraft Structural Materials Properties .............. 70
4.2.1 Specimen Preparation ................................................................................... 71
4.2.2 Metallographic Preparation .......................................................................... 72
4.2.3 Vaporized Hydrogen Peroxide (VHP) Exposure ........................................ 73
4.2.4 Dip-Testing Using the Liquid Peroxide Feedstock ..................................... 78
4.2.5 Weight Change and Surface Roughness ...................................................... 79
4.2.6 Microstructure and Mechanical Properties .................................................. 80
4.2.7 Statistical Analysis ........................................................................................ 80

xii
4.3 Copper Dissolution in Hydrogen Peroxide ........................................................... 82
4.3.1 Specimens Preparation .................................................................................. 82
4.3.2 Testing Procedures ........................................................................................ 83
4.3.3 Data Analysis................................................................................................. 83
4.3.4 Modeling ........................................................................................................ 84
5. RESULTS AND DISCUSION ...................................................................................... 85
5.1 The Impact of Surface Roughness and Wetting Phenomena on Bacterial
Attachment .............................................................................................................. 85
5.1.1 Surface Roughness and Contact Angle ........................................................ 86
5.1.2 Wettability Phenomena ................................................................................. 92
5.1.3 Wettability and Bacterial Attachment .......................................................... 96
5.2 Effect of Decontamination on Materials Properties ........................................... 110
5.2.1 Effect of Decontamination on Surface Composition Change .................. 110
5.2.2 Effect of Decontamination on Weight Change and Surface Roughness . 116
5.2.3 Effect of Decontamination on Surface Microstructural Change .............. 122
5.2.4 Effect of Decontamination on Mechanical Properties .............................. 127
5.3 Copper Dissolution in Hydrogen Peroxide ......................................................... 140
5.3.1 Effect of Stirring.......................................................................................... 141
5.3.2 Effect of Temperature ................................................................................. 142
6. CONCLUSIONS .......................................................................................................... 153
6.1 Bacterial Attachment ............................................................................................ 153
6.2 Effect of Decontamination on Materials Properties ........................................... 154
6.3 Copper Dissolution in Hydrogen Peroxide ......................................................... 156

xiii
7. SUGGESTIONS FOR FUTURE WORK................................................................... 157
7.1 Bacterial Attachment ............................................................................................ 157
7.2 Effect of Decontamination on Materials Properties ........................................... 158
7.3 Copper Dissolution in Hydrogen Peroxide ......................................................... 159
REFERENCES ..................................................................................................................... 160

xiv
LIST OF FIGURES
Figure 1–Schematic of surface texture profile from where the surface roughness
average (Ra) is derived [54]. .................................................................................................. 13
Figure 2–Illustration of corrosion pit buried into the mass of the metal, not drawn
to scale. ................................................................................................................................... 45
Figure 3–Stereo-light microscope setup oriented to permit a side view of the
inoculum droplet. ................................................................................................................... 69
Figure 4–Equipment set up for vapor hydrogen peroxide exposure; left side is the
Steris VHP 1000ED unit with the hoses into the test chamber. The test chamber
(right side) containing the test samples, consisted of a glove box from Purified
Micro Environment (a div. of Germfree Labs., Inc., Miami FL) modified by the
vendor, and the sensors. ......................................................................................................... 76
Figure 5–Typical Steris VHP 1000ED bio-decontamination cycle [71]. ........................... 77
Figure 6–Decomposition of hydrogen peroxide into harmless by-products of
water and oxygen [71]. .......................................................................................................... 77
Figure 7–Schematic of tensile test specimen with nominal dimensions. ........................... 81
Figure 8–Surface roughness measurements for the as-polished (a) and polish-
corroded (b) surfaces; see Table II for coupon series detail. Error bars show
standard deviation. ................................................................................................................. 87
Figure 9–Sessile drop of 10 µl BHI containing 107 CFU/ml of L. monocytogenes
on the as-polished (a) and polish-corroded (b) surfaces that results in different
contact angles. ........................................................................................................................ 90
Figure 10–Contact angle measurements for the as-polished and polish-corroded
surfaces; see Table II for coupon series detail. Error bars show standard deviation. ........ 91
Figure 11–Derivation of normalization equation was based on spreading of a
liquid drop on the surface of a substrate [201]. .................................................................... 93

xv
Figure 12–Means of bacterial counts before (a) and after (b) normalization on the
field of view of tested surfaces; see Table II for coupon series detail. Different
letters indicate significant differences (P < 0.05) in number of bacteria on the
surfaces. .................................................................................................................................. 98
Figure 13–Secondary electron images of the attachment of bacteria on the as-
polished base metal (a) and polish-corroded base metal (b) coupons. ............................... 99
Figure 14–Secondary electron images of the attachment of bacteria on the as-
polished HAZ (a) and polished-corroded HAZ (b) coupons. ............................................ 100
Figure 15–Secondary electron images of the attachment of bacteria on the as-
polished welded (a) and polished-corroded welded (b) coupons. ..................................... 101
Figure 16–Secondary electron images of surfaces following the application of
bacterial suspension drop on No. 2B finish (a), No. 4 satin (b), and No. 8 mirror
(c, see next page) coupons. .................................................................................................. 107
Figure 17–Surface roughness of the materials after dip testing at two different
temperatures (a) and after VHP exposure and dip testing at room temperature (b).
The error bar for each of the graphs shows the standard deviations from 5
samples.................................................................................................................................. 119
Figure 18–Weight change of the materials after exposure and dip testing (a) and
coarse particle size data change for 2024-T3 and 7075-T6 aluminum alloys after
dip testing (b). The horizontal lines on the weight change graph show the limit of
measurable percentage weight changes for combination of balance and sample
employed.The error bar for each of the graphs shows the standard deviations from
5 samples. ............................................................................................................................. 120
Figure 19–Particle size distribution of 2024-T3 aluminum alloy (a) and 7075-T6
aluminum alloy (b) before and after dip testing. ................................................................ 121
Figure 20–Light microscopy images of 2024-T3 aluminum alloy (top), 7075-T6
aluminum alloy (middle), and SS-304 (bottom). Left to right is as-received, as-
polished, and polish-etched materials respectively. ........................................................... 123
Figure 21–Secondary electron images of 2024-T3 aluminum alloy (above), 7075-
T6 aluminum alloy (middle), and SS-304 (below). Left to right is as-polished, dip
testing for 24 hours, and 168 hours respectively. ............................................................... 124
Figure 22–Secondary electron images of intermetallic particles on the surface of
2024-T3 aluminum alloy (top) and 7075-T6 aluminum alloy (bottom) after VHP
exposure. Left to right is as-polished, 10-cycle, and 25-cycle respectively. .................... 125
Figure 23–Secondary electron images of intermetallic particles on the surface of
2024-T3 aluminum alloy (top) and 7075-T6 aluminum alloy (bottom) after dip

xvi
testing. Left to right is as-polished, dip testing for 24 hours, and 168 hours
respectively. .......................................................................................................................... 126
Figure 24–Vicker’s microhardness (a) and nano indentation (b) of the materials
before and after exposure. The error bar for each of the bar graphs shows the
standard deviations from 5 samples. ................................................................................... 129
Figure 25–Charts are the 0.2% offset yield stress of the longitudinal (a) and
transversal (b) direction of the materials tensile specimens before and after
exposure and dip testing. The error bar for each of the bar graphs shows the
standard deviations from 10 samples. ................................................................................. 132
Figure 26–Charts are ultimate tensile strength of the longitudinal (a) and
transversal (b) direction of the materials tensile specimens before and after
exposure and dip testing. The error bar for each of the bar graphs shows the
standard deviations from 10 samples. ................................................................................. 133
Figure 27–Charts are elongation to failure of the longitudinal (a) and transversal
(b) direction of the materials tensile specimens before and after exposure and dip
testing. The error bar for each of the bar graphs shows the standard deviations
from 10 samples. .................................................................................................................. 134
Figure 28–Secondary electron images of 2024-T3 aluminum alloy on the
longitudinal direction after tensile testing: machined side (top), plan-edge
(middle), and fracture surfaces (bottom). Left to right is the as-received, 25-cycle
VHP exposure, and 168 hours of dip testing, respectively. ............................................... 137
Figure 29–Secondary electron images of 7075-T6 aluminum alloy on the
longitudinal direction after tensile testing: machined side (top), plan-edge
(middle), and fracture surfaces (bottom). Left to right is the as-received, 25-cycle
VHP exposure, and 168 hours of dip testing, respectively. ............................................... 138
Figure 30–Secondary electron images of austenitic stainless steel 304 on the
longitudinal direction after tensile testing: machined side (top), plan-edge
(middle), and fracture surfaces (bottom). Left to right is the as-received (a), 25-
cycle VHP run (b), and 168 hours of dip testing (c), respectively. ................................... 139
Figure 31–Effect of stirring speed on the fraction of copper dissolved into 35%
liquid hydrogen peroxide. .................................................................................................... 144
Figure 32–Effect of temperature in the range of 283-323 K on the fraction of
copper dissolved into 35% liquid hydrogen peroxide........................................................ 145
Figure 33–The variation of 1 – (1 – X)1/3
with time for various copper dissolution
by 35% liquid hydrogen peroxide at different stirring speeds. In this case, X
represents [C]t/[C] as in Equation 14. ............................................................................... 146

xvii
Figure 34–The variation of 1 – (1 – X)1/3
with time for various copper dissolution
by 35% liquid hydrogen peroxide at different temperatures. In this case, X
represents [C]t/[C] as in Equation 14. ............................................................................... 147
Figure 35–Activation energy determined from Arrhenius plot of linear data for the
time 0 – 15 minutes of reaction. .......................................................................................... 148
Figure 36–Fraction of copper plate dissolved into 35% liquid hydrogen peroxide
as function of reaction time. ................................................................................................ 151
Figure 37– Activation energy of copper plate dissolution into 35% liquid
hydrogen peroxide determined from empirical theory. ..................................................... 152

xviii
LIST OF TABLES
Table I. Crystallographic properties of particles found on 2024-T3 and 7075-T6
aluminum alloys that have been identified so far [137, 138]. The crystallographic
parameters of a, b, and c are in pm, whilst is in degree. .................................................. 48
Table II. Parameters for the TIG welded austenitic stainless steel 304 .............................. 65
Table III. The average number of bacteria attached to each of the surfaces before
normalization. Standard deviation is given in parenthesis. ................................................. 97
Table IV. The average number of bacteria attached to each of the surfaces after
normalization. Standard deviation is given in parenthesis. ................................................. 97
Table V. Surface roughness, contact angle measurements, and means of bacterial
counts per field of view (FOV) before normalization (BN) and after normalization
(AN). Different letters indicate significant differences (P ≤ 0.05). Standard
deviation for surface roughness and contact angle is shown. ............................................ 106
Table VI. Nominal chemical compositions [141] and chemical compositions
obtained experimentally using EDS analysis for 2024-T3 aluminum alloy, wt.%.
Standard deviations (5 samples), given for elements of interest only, are in
parenthesis. ........................................................................................................................... 113
Table VII. Nominal chemical compositions [141] and chemical compositions
obtained experimentally using EDS analysis for 7075-T6 aluminum alloy, wt.%.
Standard deviations (5 samples), given for elements of interest only, are in
parenthesis. ........................................................................................................................... 114
Table VIII. Nominal chemical compositions [151] and chemical compositions
obtained experimentally using EDS analysis for austenitic stainless steel 304,
wt.%. Standard deviations (5 samples) of all the large composition elements are
below 0.5............................................................................................................................... 115

xix
LIST OF ACRONYMS
ACER: Airliner Cabin Environment Research
AEM: Analytical Electron Microscopy
ANOVA: Analysis of Variance
ASTM: American Society for Testing Materials
ATCC: American Type Culture Collection
BHI: Brain Heart Infusion
BIs: Biological Indicators
BWA: Biological Warfare Agents
CBED: Convergent Beam Electron Diffraction
CFU: Colony Forming Unit
CWA: Chemical Warfare Agent
EDM: Electrical Discharge Machine
EDS: Energy Dispersive Spectrometry
EDA: Ethylene Diamine
EDTA: Ethylene Diamine Tetraacetic Acid
EPA: Environmental Protection Agency
FAA: Federal Aviation Administration
FE-SEM: Field Emission Scanning Electron Microscope

xx
FIFRA: Federal Insecticide, Fungicide, and Rodenticide Act
GP: Guinier-Preston
HALT: High Accelerated Life Testing
HAZ: Heat Affected Zone
HPAI: Highly Pathogenic Avian Influenza
HPV: Hydrogen Peroxide Vapor
kJ: Kilojoules
QCT: Quantitative Carrier Test
RH: Relative Humidity
RPM: Revolutions per Minute
SAD: Selected Area Diffraction
SARS: Severe Acute Respiratory Syndrome
SAS: Statistical Analysis System
SCC: Stress Corrosion Cracking
SCFM: Standard Cubic Feet per Minute
SCMM: Standard Cubic Meter per Minute
SEM: Scanning Electron Microscope
SSSS: Supersaturated Solid Solution
TEM: Transmission Electron Microscope
TIG: Tungsten Inert Gas
UTW: Ultrathin Window
VHP: Vaporized Hydrogen Peroxide
WHO: World Health Organization

1
1. INTRODUCTION
There has been a long history of biological and chemical agents use for warfare
and terrorism along with the growth and modernization of human life. The use of these
agents has increased significantly during the World War I [1]. Fortunately, with the
awareness of people who wanted to live peacefully, the use of biological and chemical as
warfare agents has decreased after World War II, especially after the United Nations
Convention on the “Prohibition of the Development, Production, and Stockpiling of
Bacteriological and Toxin Weapons and Their Destruction” was ratified by member
nations in 1972 [2].
The achievements in the field of biotechnology, biochemistry, and genetic
engineering nowadays have brought human race to a new era and bright future.
Nevertheless, like many other things, there will be a dark side of this technology. One
aspect of this “dark side” is the application of science and technology for illegal
manufacture and abuse in biological and chemical weapons by terrorists or by rogue
nation leaders [1]. For that reason the use of chemical or biological warfare agents in
either a domestic terrorist attack or military conflict for the purpose of causing people to
die remains a threat [3].

2
Chemical warfare agents may be defined as poisonous chemicals that may
generate irritating or debilitating effects, make materials deteriorate or areas unusable, or
may cause lethal effects to human and other living organisms. According to the United
States Military [4], chemical warfare agents that may cause lethal effects can be classified
into four categories: nerve agents, blister agents, choking agents, and blood agents. This
classification is basically based on the effects of the agents have on human or living
animals as indicated by the agent names. For example, nerve agents will attack nerves
and muscle system; blister agents will attack and destroy cell tissues resulting in severe
blisters; choking agents cause irritation and inflammation of the bronchial tubes and
lungs causing choking; and blood agents will react and disrupt the oxygen-carrying
properties of the blood resulting in lethal effect. The damaging effect of these agents to
human and/or to other animals depends on the type, concentration, and method of
delivery.
Biological agents, on the other hand, are actually pathogens or toxins derived
and/or produced by living microorganisms. These agents may cause disease or poisoning
in people, animals or plants, and may also cause materials to deteriorate. Depending on
the type of agents used, when used directly, these agents can be used to cause diseases
such as anthrax, cholera, plague, or diphtheria, and when used indirectly can be used to
infect crops or livestock and so to reduce the supply of food. Several other living
microorganisms that can be used for biological warfare purpose include bacteria,
rickettsiae, viruses, and fungi [4]. The diseases caused by these agents may spread in a
variety of ways including ingestion of the infected plants or animals, bites from infected
animals and/or insects, or inhaling the microorganisms that produce the toxin.

3
The threat of using chemical and biological warfare agents for the purpose of
causing other people to die has been transformed into reality and made particularly
evident by the Bacillus antharacis spores attack by terrorist to civilians in Washington
D.C. and Sterling, Virginia, in 2001 [5, 6]. As a matter of fact, other than these two
attacks, several other terrors that caused massive disruption and widespread fear into a
society had also been released at several other places. For example, the Aum Shinrikyo
Sarin attack on the Tokyo subway in 1995 and, most recently, employment of chlorine
tankers by insurgent elements in Iraq [7-11].
Apart from intentional abuse of chemical and biological warfare agents for
terrorist purposes, there are also natural occurrences of epidemics that need to be taken
care of very carefully. Some examples are given as following. In 2003, severe acute
respiratory syndrome (SARS) that initiated as endemic in Hong Kong has became
epidemic and emerged as a new acute respiratory disease that spread rapidly across the
world [12]. Only one year after the SARS outbreak, in 2004, highly pathogenic avian
influenza (HPAI) viruses of the H5N1 subtype were spreading and circulating in eastern
and South East Asia causing epidemic effects [13]. In the case of HPAI viruses, several
Asian countries in that area including Cambodia, China, Indonesia, Japan, Laos,
Malaysia, South Korea, Thailand, and Vietnam have reported outbreaks in their poultries
[14]. It is suspected that this HPAI type of virus could have resulted from development of
a pandemic strain because it was never detected before [15-16]. Even though the biggest
impact was on poultry, however, animal-to-human and human-to-human transmission of
the virus also has been described, most recently in families who live close to the poultry

4
in Thailand and Indonesia; many of them were fatal including 52 of which have been
reported to the World Health Organization (WHO) [17-18].
The rapid spreading of these epidemics is believed by many investigators to be
due to the weak control of the outbreak at the early stages of the epidemic [19-23]. SARS
for example, at the early stage and even during the outbreak, was transmitted efficiently
among workers, patients, and visitors at the healthcare facility. The weak control also has
been acknowledged through documented hospital outbreaks of SARS that occurred in
several countries following the outbreaks. The affected countries including Canada,
China, Hong Kong, Singapore, Taiwan, and Vietnam also have highlighted the weak
infection control of infrastructure present in their healthcare facilities [24-26]. Some data
from researchers also have indicated that the SARS virus is largely spread by direct or
indirect contact with the infected person, while other researchers have found that the
airborne transmission of the virus could also responsible for the spread of SARS
outbreaks [27-29].
If one were to take a look back to the time, long before these two epidemics, in
1918/1919, the world was swept by an influenza pandemic that killed more than 40
million of people in its wake [30]. This influenza pandemic almost circled the world that
most of humanity felt and suffered from it. In the U.S. alone, an estimated 675,000
people died of influenza during this pandemic [31]. The interesting part is that,
circulation of the virus followed the mass movements of the armies and aboard ships
during the World War I. Because of that it is believed the mass movement of the armies
probably caused the pandemic’s rapid diffusion and attack [32-34].

5
As so many people travel nowadays using air transportation, airliners could again
be one of the terrorist targets as was the case when they were used for attacking the
World Trade Center in New York in 2001. At the same time, if pathogen control over the
flight is weak, aircraft may become a vector for spreading an endemic, which then can be
easily transformed into an epidemic, or even a pandemic. Thus, with the background of
these recent events, the possibility of more biological and chemical emergencies, either
incidental or deliberate, cannot be ignored [35].
Hence, there will be always growing concerns related to both naturally occurring
pathogens and unintentional bio-chemical contamination or deliberate terrorist attacks
that involve these chemical and biological warfare agents. These growing concerns have
necessitated consideration and implementation of science and technology as a response to
chemical and biological terrorism and/or epidemics/pandemics in which civil aviation
represents a key potential vector. This response is needed especially to counter the attack
and/or at least to reduce the possibility of lingering effects in case an incident or attack
occurs unexpectedly, whilst at the same time trying to prevent such events in the future.
One of the possibilities to counter these horrific bio-chemical events is by developing
effective sensors and at the same time a decontamination defense.
As part of their role in the Air Transportation Center of Excellence for Airliner
Cabin Environment Research (ACER), under funding received from the U.S. Office of
Aerospace Medicine, Federal Aviation Administration (FAA), Auburn University, Boise
State University, and Purdue University are surveying, selecting, and testing sensor and
decontamination technologies for further evaluation or implementation on the civilian

6
aircraft. This dissertation focuses on the latter, so called on-the-ground airliner
decontamination.
The main idea of this project is basically to be able to take the action of
decontaminating an airliner on-the-ground following either deliberate or unintentional
incidents of biological contamination and enable return to service. Due to the inherent
properties of the chemical used as a decontaminant agent, it possibly could affect the
airliner materials during or after the decontamination process. Hence, to enable return to
service after decontamination it is desirable to be able to predict the effect of this
chemical on the aircraft’s flightworthiness at least qualitatively and ideally quantitatively.
The present research, based on the main idea outlined previously, actually does
not yet address the entire goals, especially with respect to the prediction of effect of the
chemical used as the decontaminant agent on the aircraft’s flightworthiness. However,
what has been performed in the present project is a necessary precursor step. Thus, future
work that needs to be done to accomplish all of these goals is presented in section 7,
“Suggestions for Future Work”.
Although the use of high-performance polymer-matrix fiber composites in aircraft
structures has grown, for example, the Boeing 787 aircraft has a polymer-matrix fiber
composite fuselage, aluminum alloys will continue to be used widely for the foreseeable
future [36]. The main reason for this is the high fabrication cost of composite materials
compared to those of metallic materials. In addition to this fabrication cost, certification
of new aircraft components, require a long time and high costs. Metallic materials, on the
other hand, have been proven to be reliable for decades. Up to the present time, metallic
materials still have the advantages of being superior over composite materials in terms of

7
resistance to mechanical damage, high strength, and relatively high temperature
limitation. Furthermore, even composite materials are being developed; however, there
are also ongoing developments in structural metallic materials that still make metallic
structures relatively more affordable than composite structures, at least for the time being,
in terms of financial aspect [37]. Thus, metals will continue to be used widely and still
the materials of choice for many airframe applications in the near future. For those
reasons, in the present research, the focus is only on the airliner metallic structural
materials.

8
2. LITERATURE REVIEW
The main objective of this present research is to find out if there is any immediate
loss or degradation in aircraft metallic structural materials properties and hence
performance after on-the-ground airliner decontamination has been performed. At the
same time, it is also to consider whether there is incipient damage that raises the
possibility of degradation during long term service. In this chapter, therefore, it is of
interest to seek the background of the work and several other factors that would be likely
to be involved in the process, including review of the materials used, processing
procedures, and materials characterization. Some other factors that would likely affect the
materials used in the near future but have not been investigated in the present research are
also presented. There are three different topics that have been carried out in this study,
i.e. bacterial attachment behavior onto surfaces, effect of decontamination on the
microstructure and mechanical properties of aircraft metallic structural materials, and
dissolution of copper into liquid hydrogen peroxide. The following sections provide
literature reviews on each of these topics. The information given and reviewed in this
chapter is then used in subsequent chapters for experimental design and implementation.

9
2.1 Factors Affecting Bacterial Attachment to Surfaces
The attachment of spoilage and/or pathogenic bacteria to a surface has always
been troublesome and has serious implications in terms of safety within the food industry,
domestic area, institutional locations such as hospitals, and public transportation such as
aircraft [38, 39]. In general, it has been recognized that bacteria become attached to
surfaces with several factors influencing the attachment. However, explanations on the
mechanisms governing the attachment are rarely available and have not been fully
understood [40]. Because of this, a number of studies have been performed by many
investigators to more clearly define, explain, and evaluate factors affecting bacterial
attachment to surfaces. Several factors that have been considered in the studies included
electrolyte, surface charge differences, hydrophobicity, wettability, and surface roughness
[40-49]. Results of these studies were quite different from study to study, mostly because
of differences in experimental techniques, materials being used, and wide range of factors
in consideration. However, in general, the results have shown that both materials and
bacterial surface properties have an influence on the way bacteria attached to surfaces.
Many attempts also have been made by investigators to explain the mechanisms behind
the attachment process. Some explanations of the mechanisms that have been described
including passive Van der Waals attractive forces, electrostatic interactions, dipole
interactions, chemical bonding, hydrophobic interactions, steric forces, and in terms of
bacterial properties itself including external appendages and extracellular polymer [50-
53].
In terms of surface roughness, it has been reported that surface roughness affects
bacterial ability to attach to a surface; the increase in surface roughness increases the

10
number of bacteria attached to a surface [49]. It was believed that increase in surface
roughness accounted for higher wettability, while higher wettability of the surface
allowed bacteria to distribute to a larger area. At the same time, it was found that surface
of higher wettability had lower contact angle than that of surface of less wettability. By
this fact, it can be considered that surface roughness has an important influence on the
wettability and thus to the way bacteria attached to surfaces. Hence, surface roughness
could be used as an initial indicator whether or not bacteria would be easily attached to a
surface.
In this dissertation, the effect of surface roughness on bacterial attachment and its
likely impact on the civilian aircraft decontamination process is discussed. The discussion
is based on our two previous results on the effect of different surface roughness of
austenitic stainless steel 304 on bacterial attachments [47, 48]. The first is related to the
effect of surface roughness resulting from welding and accelerated corrosion and the
second is related to the effects exerted by different types of surface finish commercially
available on bacterial attachment.
In its relation to the decontamination process development for civilian aircraft, the
effects of surface roughness on bacterial attachment are particularly interesting. The most
important reason for this is because surface roughness could impact the decontamination
process. However, at the time this work was performed, it was originally thought that this
bacterial attachment research would be most relevant to the food industry area. Later on,
as the work progressed to decontamination development for civilian aircraft, there arose a
need to understand how bio-contaminants would behave on attachment to aircraft
material surfaces. This understanding is needed especially in relation to the

11
decontamination process itself. In this regard, different surface properties might impact
the way bacteria attach to a surface1, and thus could require modification of the
decontamination process, or it might influence the efficacy of any given decontamination
setup. For that reason, this part of the bacterial attachment work was also included in this
dissertation.
2.2 Surface Roughness and Bacterial Attachment
2.2.1 Surface Roughness
Surface roughness is a term used to describe the smoothness of a surface finish or
irregularities of a surface texture. The term has been widely used for both practical and
scientific purposes. In general, irregularities of a surface texture account for surface
roughness. Surface texture itself can be repetitive or random patterns that are usually
developed as inherent actions during manufacturing procedures, finishing processes, or as
a result of surface damage due to say corrosion [54, 55].
There are many different parameters due to the differences in a wide variety of
machining operations and need. For examples, roughness average (Ra) and root mean
square roughness (Rq) are calculated based on the roughness amplitude parameter; while
mean spacing of profile irregularities (Sm) and average wavelength of the profile (λa) are
calculated based on the spacing parameter [56]. The roughness average is one of the most
widely used terms, which is calculated based on the roughness amplitude parameter, and
is used to indicate roughness value of a surface; the larger the value, the rougher surface
of a material.
1 In this regard, different surface properties might affect bacterial ability to attach to a surface due to a
different mechanism of attachment and/or due to a different of the bond strength between the bacterial cells
and the surface.

12
The value of a roughness average comes from the integral area within the average
center line between top and valley of a surface topography, the shaded area in Figure 1,
and the evaluation length of measurement; which is why sometimes it also called center
line average. In mathematical expression this gives [54, 56]:
𝑅𝑎 = 1
𝐿 𝑦(𝑥)
𝐿
0
𝑑𝑥
Equation 1
where:
Ra = value of the roughness average
y = ordinate of the profile
L = length of the measurement

13
Figure 1–Schematic of surface texture profile from where the surface roughness average
(Ra) is derived [54].
x
y
L

14
In many applications, surface roughness plays an important role in the
performance of material itself. For examples, surface roughness greatly affects fatigue
and creep life in terms of mechanical properties of a component bearing a load [54]. In
the food industry area, surface roughness is of great importance in terms of the hygiene of
food contact surfaces because of easiness of certain foodborne pathogens to attach to
certain type of surface roughness [57].
The influence of a surface roughness on spreading of a liquid, thus
microorganisms within the liquid, and how it could influence the decontamination
process or efficacy of any given decontamination setup in civilian aircraft is discussed in
the next section.
2.2.2 Wettability and Adhesion
Wettability is a term that refers to the ability of a liquid or fluid to wet or coat a
surface. A more applicable definition is given by US Environmental Protection Agency
(EPA) as “the relative degree to which liquid or fluid will spread onto or coat a solid
surface in the presence of other immiscible fluids” [58]. Sometimes the term of wetting is
used instead of wettability. In this regard, two or more dissimilar materials need to be in
contact, either directly or through an interlayer, creating a new interface. In order to be
able to predict the equilibrium wetting condition on the interface between these two
dissimilar materials, the thermodynamic and kinetic implications of wettability and
several other factors affecting this wettability, such as interfacial energy, adhesion, and
tension, need to be considered [59-61].
15
A useful scientific foundation for this interfacial studies, wettability, adhesion,
and spreading phenomena basically comes from the application of Young's equation [61-
64]:
sv – ls = lv cos
Equation 2
where:
= contact angle
sv = interfacial tensions at the boundaries between solid - vapor
ls = interfacial tensions at the boundaries between liquid - solid
lv = interfacial tensions at the boundaries between liquid - vapor
The equation is used to predict the equilibrium contact angle values at the interface in
terms of thermodynamic consideration. In the Young equation, the equilibrium contact
angle is obtained from a balance of interfacial tensions for a liquid droplet on a solid
surface, in which a low interfacial energy between liquid and solid yields a lower value of
contact angle. In this regard, wettability of a liquid over a solid substrate surface can be
characterized in terms of contact angle that the liquid makes on that solid surface; lower
contact angles imply higher wettability.
The Young’s model, however, can only be applied to an ideal surface, i.e.
perfectly smooth, and the substrate should not have any internal stress that causes
substrate deformation. Lester [62] has shown that when a solid has deformability within a

16
certain range, the experimentally measured contact angle would change inducing change
of the interfacial energy in consideration. Young’s model also neglects a number of
factors, which in fact may alter the extent of wettability in real surfaces [63]. In real
surfaces, the extent of wettability may be influenced by gravitational effects, substrate
deformation, chemical inhomogeneity, contaminants present on the surface such as oxide
film formation, mixing between the phases involved, and formation of second phases at
solid-liquid interfaces or ahead of the spreading front [59, 63]. Because of that, a number
of attempts have been made by many investigators to refine the Young’s approach [59,
64]. Nevertheless, as has been mentioned, Young’s approach had given a useful scientific
foundation for wettability, adhesion, and spreading phenomena of a liquid over a
substrate surface.
2.2.3 Wettability and Bacterial Attachment
As has been implied in the previous section, wettability and adhesion have an
important influence on the bacterial attachment behavior onto surfaces. At the same time,
wettability and adhesion are governed by the surface properties, including surface
roughness and its combined properties with liquid and vapor phase, which basically can
be characterized in terms of contact angle [63, 65]. It has been recognized that surface
physical properties, in this regard surface roughness, have an important impact on
bacterial attachment. Several attempts have been made by investigators to explain the
effect of surface roughness on the bacterial attachment behavior. For example, Wenzel
[66] has proposed that the effect of surface roughness on wettability is simply
proportional to the surface area and thus to the wettability behavior on that surface. Even
this proposition seems to simplify the matters; however, he has given the basic idea on

17
how to solve the wettability phenomena. This proposition was later elucidated by
Johnson and Dettre, who studied contact angle hysteresis of specific geometry on
idealized, rough, and real surfaces [67-68]. Their results implied that surface roughness
was not the only factor to account for the wettability phenomena. They further suggested
that factors such as surface roughness direction and liquid pressure on the surface, which
might increase the spreading of the liquid according to the surface roughness direction,
also need to be considered. In this case, liquid pressure parallel to the surface roughness
direction will reduce the contact angle and enhance the liquid spreading and thus the
wettability. In contrast, perpendicular to the surface roughness direction, the local contact
angle changes as a liquid spreads over a surface and a series of metastable contact angles
are established, thus results in a barrier to further spreading [67-68].
In terms of biological decontamination, the effects of surface roughness are
particularly interesting, especially in relation to the adhesion and wettability phenomena
of bio-contaminant/bacterial attachment. As has been mentioned previously, a low
interfacial energy between liquid and solid give the implication of higher wettability and
thus promotes wetting. In this case, when a drop of liquid containing bacteria spreads
over a surface, surfaces of higher wettability will distribute the bacteria suspension over
larger area than that of the surface of lower wettability. Therefore, surface roughness
would affect the decontamination process according to which bacteria attach to that
surface. In this regard, physical and chemical properties of a surface at one side and
bacterial properties on the other side will have a big impact on the bacterial attachment
and thus to the decontamination process that needs to be performed. On the other hand,
these two factors need to be considered carefully in designing an effective

18
decontamination process. In this regard, Rogers et al. has found that different surface
properties result in different viability of bacterial cells attached to surfaces [69]. Even
though Rogers’ work on different surface properties focused on differences in the
materials used, it is likely that attachment of bacterial cells to the different surface
properties of the same materials still affect their viability during decontamination because
of different mechanisms and/or strength of the bond between bacterial cells and surface
as has been mentioned earlier.
2.3 Decontamination Technology
Decontamination2 may be defined as the destruction or complete elimination of
any form of harm contaminants from a material, environment, and/or area under
consideration to a safe level. Decontamination has been developed as a new discipline
since Charles Chamberland invented the steam autoclave in 1879 [70]. Since then, much
effort has been made by many researchers to improve the decontamination technology so
it can be used for many specific purposes such as in military, medical and health care
facility, and food industry [71, 72]. Several decontamination technologies, especially in
the area of pharmaceutical, medical, food technology, and packaging, have been
developed and are available commercially in the market nowadays. However, there is no
decontamination technology that is specifically built for the civilian aircraft available up
to the present time. At the same time, there is an urgent need in developing
decontamination technology for civilian aircraft, especially with the lately elevated
2 In many publications, the terms of decontamination, sterilization, sanitization, and disinfection are often
considered from different point of perspective and thus defined differently. In this dissertation, however,
all of these terminologies are referred to as decontamination.

19
tension of terrorist activities and the ongoing threat of epidemic and/or pandemic in
which civil aviation would likely represent a key potential vector.
The available decontamination technologies in the market nowadays can be
divided into several categories: physical processes such as heat and ionizing radiation,
physicochemical processes such as steam and glow-discharge plasma, and chemical
processes such as hydrogen peroxide and chlorine dioxide [72-77]. Other methods use
combination of the different processes to achieve a synergetic effect, such as combination
of low-temperature steam and formaldehyde or combination of chemical and thermal
processes [73]. All of these categories, in general, are based on the characteristics of the
decontamination process and response of decontaminant agents with bio-contaminants.
Among these categories, the most promising candidate for the civilian aircraft
decontamination is a chemical method. The main reason for this is that the other
processes most likely cannot be used for the purposes of aircraft decontamination because
of their incompatibility issues. For example, physical processes involve thermal or
ionizing radiation. In thermal decontamination process, the temperatures for moist heat
and dry heat need to be 121-134oC and 160-180
oC respectively [73]. This range of
temperatures would likely be not suitable to be used in aircraft, especially the heat
involving moisture, because it would damage the electronic devices within aircraft. In the
case of ionizing radiation, the method involves generating of radiation for the
decontamination process. For example, -rays use radioactive isotope or high speed
electron beam as a source of radiation [74]. It would be impractical, if not impossible, to
generate the source of radiation to be used for such a large aircraft fuselage. This physical
process is usually used as decontamination method in small product designs, food

20
packaging, and pharmaceutical or medical products. One of the methods in
physicochemical processes involves generating a plasma from a chemical that is used for
decontamination process [75]. In this case, to achieve a low temperature plasma, the
enclosure needs to be in high vacuum; a process that would be impossible to achieve with
a large fuselage aircraft. In the chemical methods, however, not all of the processes can
be applied for aircraft decontamination purpose. Many of them are either too toxic and
environmentally unsafe or too aggressive in terms of materials compatibility. In this case
only the methods that are compatible with the aircraft structure and systems, without
compromising safety and health in any way, can be selected and tested for further
evaluation and implementation. Thus, the challenge of selecting a decontamination
method requires a compromise between materials compatibility and biocidal activities of
a decontaminant agent.
Several decontamination methods that are based on chemical processes and their
process selection for the purpose of aircraft decontamination are discussed in the
following section. The discussion will also include efficacy, affordability, and materials
compatibility issues on the available chemical decontamination technologies that can be
applied on civilian aircraft.
2.3.1 Chemical Methods for Decontamination
As was noted above, the potential candidate to be used for the purpose of civilian
aircraft decontamination is the chemical method. As the matter of fact, the use of
chemicals as decontaminant agents, which are known to have biocidal effect to the bio-
contaminants, has been started long time ago even before the Federal Insecticide,
Fungicide, and Rodenticide Act (FIFRA) was enacted in 1947 [78]. FIFRA, administered

21
by the Environmental Protection Agency (EPA), is a law that provides federal control
over the constituents and use of any chemicals used as pesticides, and thus any
decontaminant agents, in the United States [79]. In this regard, any chemicals to be used
in the decontamination process need to follow this regulation. Up to the present time,
chemicals are still widely used as decontaminant agents for many purposes [80].
The chemical methods for decontamination are basically based on either reaction
of alkylating agents or oxidative compounds with the bio-contaminants [75]. Several
methods involving chemicals as decontaminant agents also have been used for a long
time in pharmaceutical, medical or healthcare facilities, and in the food industry. The
chemicals of consideration include ethylene oxide, peracetic acid, chlorine dioxide,
hydrogen peroxide, and formaldehyde [81-82].
2.3.2 Process Selection
There is no decontamination technology that is specifically designed for civilian
aircraft available up to the present time. At the same time, there is an urgent need for
using this technology because civilian aircraft could become a target of bioterrorist
activities or due to the continuing threat of epidemic and/or pandemic. In this regard, if
an aircraft becomes contaminated with a bio-contaminant from a terrorist attack or
pandemic virus from a disease outbreak, decontamination is the only way to neutralize
the incident. For example, if an aircraft becomes contaminated via either a deliberate
terrorist activity or an outbreak, the worst possibility is just to dispose that aircraft. Yet,
there is still a need to neutralize or to decontaminate the aircraft before disassembling the
aircraft so the bio-contaminant will not spread, or at least the bio-contaminant will not
harm people working with the aircraft. In case of numerous aircraft becoming

22
contaminated, disposing of the aircraft would not likely be an option either in terms of
financial considerations or availability of numerous replacement aircraft in a short time
[83]. Hence, the primary question that needs to be answered is how to decontaminate it
within a reasonable time, in a financially viable manner and without compromising safety
and health in any way.
There are several methods involving chemical agents that have been used for
microbial decontamination in the area of pharmaceutical and medical industry for a long
time. These available methods can be modified for use in civilian aircraft instead of
building the decontamination technology from the scratch. For the chemical agents, the
selections firstly would be based on the possible choices of what is legal according to
U.S. Environmental Protection Agency (EPA), under Section 18 of the Federal
Insecticide, Fungicide and Rodenticide Act (FIFRA) [84]. In this case, several chemical
decontaminants are already available and have been used for specific use, i.e. for anthrax
spore decontamination, such as ethylene oxide, peracetic acid, chlorine dioxide, hydrogen
peroxide, and formaldehyde [85]. Unfortunately, most of these chemicals, except for the
hydrogen peroxide, are either too toxic and environmentally unsafe or appear too
aggressive in terms of materials compatibility to be used for aircraft decontamination
purpose. Because of that, hydrogen peroxide delivered in the vapor phase [86], appears to
be the most promising potential candidate to find application in civilian aircraft
decontamination [83]. The reasons being are because of its excellent biocidal effect,
especially in the vapor phase, and most importantly it is environmentally safe. Other
advantages and disadvantages of hydrogen peroxide use can be found in sections 2.4.1,

23
Advantages of Vapor Phase Hydrogen Peroxide, and 2.4.2, Limitations of Vapor Phase
Hydrogen Peroxide, respectively.
Several methods have been developed by several companies in order to deliver
the hydrogen peroxide in the form of vapor phase. Most of them use the same principle of
an isolator. An isolator is defined as a confined room which has a physical barrier
preventing contact from outside contamination [87]. Two of those isolators are vaporized
hydrogen peroxide from Steris Corporation with their product of VHP generator [71] and
hydrogen peroxide vapor from Bioquell Inc. with their product the HPV generator [88].
The main difference between these two systems is the relative humidity (RH) prior to
generating the vapor phase of hydrogen peroxide. The Steris VHP generator maintains a
low humidity in the enclosure, i.e. below 30% RH at the start of fumigation, in an effort
to keep the peroxide in the vapor phase and so to improve penetration of substrate
surfaces [71]. Bioquell HPV generator, on the other hand, permits higher RH values in an
attempt to achieve “micro-condensation” of a microscopic film of hydrogen peroxide
over the surface to be decontaminated [88]. In this dissertation, however, all of the work
was performed using the Steris VHP generator, although it is possible that at least some
of the results may also be applicable to HPV.
2.3.3 Efficacy
In this dissertation, efficacy is defined as the ability of decontaminant agents
through a decontamination process to reduce biological and/or chemical contaminants to
a safe or assurance level without causing any degradation or detrimental effect to the
aircraft structural materials and systems. A safe level is characterized as a circumstance
in which the decontamination process renders the contaminant agents to a condition

24
where it would be of no harm to passengers entering the aircraft on the subsequent flight
[89].
In a specific terminology, the efficacy of a chemical used as a decontaminant
agent is usually expressed in terms of either log10 kills or D-values [90]. A one log10 kill
is a term expressed to represents 90 percent efficiency of reduction or killing a
contaminant population. As a reference, the criterion used in the sanitizer efficiency test
as applied in the food industry is 5 log10, in which decontamination process will kill
99.999% in the number of Escherichia coli or Staphylococcus aureus bacteria within 30
seconds after application at 20oC [91]. Another criterion is the standard quantitative
carrier test (QCT) method from ASTM International [92], which stipulates a performance
of 6 log10 reduction or 99.9999% in the viability of a bacteria population. A D-value, on
the other hand, is a term use to express the contact time required to achieve a one log10
kill or 90 percent efficiency. In this case, a short contact time3 D-value is desirable [71].
In developing the efficacy standard for civilian aircraft decontamination process,
in this work, the first consideration would be factors that affect the main process such as
operational cycle and ambient environment within the aircraft cabin. The next
consideration includes the presence of porous materials such as textiles and foams,
surface roughness, and possibility of biofilm formation on the metallic surfaces. As a
starting point for this efficacy development, data for any given agent that have been
published or reported in the literature was sought and considered. But because not all
such data are available, the efficacy for aircraft decontamination, in this dissertation, is
3 For a short contact time, it is assumed that there is a linear relationship between log10 kill and time, which
may or may not occur in practice.

25
then defined as being capable to render 8 log10 reductions4 of a bacteria population within
a reasonable time and manner. This efficacy in fact has exceeded the sanitizer efficacy
test of 5 log10 reductions or 6 log10 reductions as used in the standard QCT from ASTM
International. However, there is actually still the ongoing question about “How clean is
clean enough?” [93]; and thus the criteria used in this killing efficiency are still
debatable.
2.3.4 Affordability
In this term, affordability refers to a determination in which the decontamination
cycles process is practical to deliver within financial framework of the airliner industry.
Implementation of practicality is basically a function of selected technology and operator
consideration, while financial aspects loop back to the efficacy and economically realistic
within airliner industry acceptance. Based on the survey by Gale et al. [89], financial
consideration would likely be more stressed in terms of routine activity instead of
incidental decontamination. In terms of incident response or emergency use, as has been
mentioned earlier, if an aircraft becomes contaminated by either a deliberate terrorist
activity or due to disease outbreak, the cost consideration would be which one the most
cost effective; disposing the aircraft or decontaminating it. However, consideration of
disposing would not be an option if it were necessary to scrap numerous aircraft. Thus, it
is likely that there would be little financial option in the case of emergency use but to
proceed with decontamination. For routine decontamination activities, the financial
aspect would be significant and need to be considered in terms of operator considerations,
4 ACER’s work in the field used a reduction of 6 log10 metal backed biological indicators (BIs) in
determining the viability of bacteria population [89].

26
including required operator skill and how to achieve the necessary level of skill for the
operator; assurance level in terms of how thorough the decontamination needs to be
carried out; and the total time needed to perform the decontamination process, including
cycle time and time needed for post-operational cleanup procedures. In this regard,
capital cost per unit would decrease when production volumes increase, while operational
cost per cycle would seem to change somewhat with process equipment parameters,
which is in fact influenced by operator requirements in terms of efficacy and assurance
level determination [89].
2.3.5 Materials Compatibility
As surfaces of all aircraft structural materials and systems will be exposed to the
decontaminant agent, in this case vapor phase of hydrogen peroxide, during the
decontamination process, the compatibility issues between the decontaminant agent and
the aircraft structural materials need to be examined. In this context, compatibility issues
will be referred to generally as materials compatibility, which is a measure of how
aircraft structural materials or systems would stand up to the exposure of a decontaminant
agent with no significant changes in physical or chemical properties. The physical
consideration of this materials compatibility is measured in terms of microstructure and
mechanical properties, while chemical properties is measured in terms of chemical
composition changes of the aircraft structural materials. If aircraft structural materials
properties are greatly affected by the decontaminant agent, either physical or chemical
properties, the decontaminant agent is then considered incompatible and will not be
tested and evaluated any further.

27
In developing the test case for materials compatibility, the starting point is from
the fact that the structural aircraft are complex and consist of a number of metallic and
non-metallic materials [36, 37, 94]. The first task is then to classify these materials in
terms of what is important as an entire unit and would be likely the most affected by the
decontamination process. In this regard, the consideration would be aircraft as a complete
unit such as structure, frame, stringers, fuselage, wings, and the systems inside the cabin
such as wires, electronic devices, and all of the accessories within the aircraft. However,
there will be a long list of these materials. Thus, as the initial point, the selection will be
down to the main structural aircraft materials, i.e. the materials that are used to build the
skin, frame, longerons or stringers, ribs, and wings. Up to the present time, these parts
still consist of metallic materials, mostly aluminum alloys. For that reason, the test case
within this dissertation will be only on those metallic structural materials; in this regard
the materials were represented by 2024-T3 and 7075-T6, with the addition of austenitic
stainless steel 304 as used in lavatory and galley surfaces.
Initial data on the relative compatibility issues of various materials with hydrogen
peroxide can be obtained from several sources [95, 96]. It needs to be stressed that these
data are not sufficient, especially in terms of whole effect of decontamination and its
subsequent impact on the materials properties due to the different, and often very crude,
method in determining the compatibility issues and purposes. Data from these sources,
however, can be used as initial guidelines since published references in this subject are
very limited.
In order to determine materials compatibility with the decontaminant agent, in this
case aircraft metallic structural materials and hydrogen peroxide respectively, the

28
following data are needed as the starting point [89]. The first is the immediate effect of
decontaminant agent on the material’s structure properties. This immediate effect can be
evaluated by performing a tensile testing after exposure, which will be sufficient to reveal
immediate loss on mechanical properties such as strength or ductility. However this
would not be enough to reveal subtle, incipient damage that might induce subsequent
degradation in materials performance. Thus, microstructure and mechanical investigation
of the aircraft structural materials by using a standard method such as ASTM are needed
after decontamination process has been performed. The second is the effect of multiple
decontamination cycles on the material’s properties. Single aircraft might encounter
multiple decontamination cycles in case it needs to do numerous flights to a contaminated
region, or at least to reduce the possibility of becoming a vector for spreading the disease
concerned. The data needed would be the effect of cumulative damage on the aircraft
structural materials after numerous decontamination processes. There are several more
data needed in order to completely determine the materials compatibility after
decontamination on the aircraft metallic structural materials such as fatigue strength,
highly accelerated life testing (HALT), and subsequent corrosion and environmental
effects; however these first two tests would likely be sufficient as the initial point. If these
first two tests show an incompatibility issue, then there will be no point in pursuing
further measurements.
In classifying the materials compatibility criteria, within ACER team
perspectives, a change or reduction in any given mechanical materials property of up to 5
percent or more would be regarded as a significant damage [89].

29
2.4 Hydrogen Peroxide
Liquid hydrogen peroxide has been long use in industrial applications such as
bleaching and nonpolluting agents for wastewater treatment [97]. It also has been use for
a long time in household applications as an antiseptic. Hydrogen peroxide is a weak acid
but one of the strongest oxidizing agents that is commercially available in aqueous
solution. The use of this hydrogen peroxide, within the U.S., is controlled under EPA
regulation. With the elevated tension of terrorist activities, especially with the spreading
of Bacillus anthracis, EPA had issued a crisis exemption for the use of hydrogen
peroxide as a decontaminant agent on a case-by-case basis [85].
The vapor phase of hydrogen peroxide has been well known to be used in
decontaminating medical, pharmaceutical, and biological instruments in healthcare
facilities and other medical equipments and products [98-101]. Several works by
investigators have also shown that hydrogen peroxide is indeed effective in killing
bacteria [98, 101, 102]. The use of hydrogen peroxide vapor by means of an isolator for
decontamination was started in the early 1990’s [87]. After the introduction of hydrogen
peroxide isolator equipment, several publications in the related issues and validation
techniques have been published. Following these, the use of vapor phase of hydrogen
peroxide by means of an isolator has been developing and is now gaining acceptance for
decontamination of larger areas such as rooms and small buildings [103, 104]. In this
regard, hydrogen peroxide vapor has been proven to be effective when used for
deactivating Bacillus anthracis spores employed in the attack at the General Service
Administrations’ Building in Washington D.C. and the U.S. State Department Mail
Facility in Sterling, Virginia, in 2001 [90, 105].

30
Based on the selection process explained previously, hydrogen peroxide vapor is
one of the potential candidates that have been proposed by the ACER team to be used as
a decontaminant agent for treating civilian aircraft, and now is being tested and its impact
on the aircraft structural materials properties is being evaluated [105]. The results of this
work are expected to contribute towards a potential response to bioterrorism and
epidemics/pandemics in which civil aviation would likely represent a key vector. Within
the framework of ACER goals and objectives, the result of this study is also expected to
provide at least part of the answer to the question whether VHP can be used as
decontaminant safely in civilian aircraft.
2.4.1 Advantages of Vapor Phase Hydrogen Peroxide
Some advantages of using vapor phase of hydrogen peroxide as a decontaminant
agent, for the purpose of civilian aircraft decontamination, are given in the following:
1. Hydrogen peroxide is one of the strongest oxidizing agents that produce free hydroxyl
radicals. This free hydroxyl radical attacks essential cell components resulting in an
excellent biocidal effect [97, 106].
2. It has been proven that the effectiveness of hydrogen peroxide is increased in the
gaseous phase [71, 69] and it is also impractical to deliver in the form of liquid
decontaminant to large volume spaces.
3. Hydrogen peroxide has been used as a reliable decontaminating or sterilizing agent in
pharmaceutical and medical industry areas for a long time [72].
4. Vapor phase of hydrogen peroxide is a relatively low-temperature decontamination
process, thus it would be potentially compatible for flight hardware [106].

31
5. Vapor phase of hydrogen peroxide easily decomposes into harmless byproducts of
water and oxygen after decontamination process has been completed [71].
6. Vapor phase of hydrogen peroxide has been proven to be effective when used in
cleaning up Bacillus anthracis spores [90, 105].
7. In addition to these, hydrogen peroxide also has been used effectively for neutralizing
chemical G agents, such as agent GB [107].
2.4.2 Limitations of Vapor Phase Hydrogen Peroxide
Some limitations of using hydrogen peroxide vapor are given in the following:
1. As an oxidizing agent, hydrogen peroxide will be expected to have a detrimental
effect on textiles and fabrics color [97].
2. Pores and highly absorptive materials will absorb hydrogen peroxide vapor leading to
a reduction in the VHP concentration or trap the VHP so that it is difficult to remove
during subsequent aeration. In addition, trapped, undecomposed peroxide might
represent a fire hazard due to its inherent properties as an oxidizing agent. In its
application, hence, surfaces must be reasonably clean and dry before the
decontamination process [71].
3. Humidity will affect the decontamination process. The higher the humidity, the
longer the time needed to achieve 1 log10 kill, i.e. 90% of killing efficiency, as less
peroxide can be safely injected [71].
4. At low temperatures, the reaction will be relatively slow [107].
5. Up to the present time, unless delivered by using a large generator, it is not possible
to decontaminate huge spaces, such as large buildings, at one time [71].

32
2.5 Selected Aircraft Metallic Materials
Many modern aircraft are designed to be able to move large loads over long
distances at subsonic high speed. Aircraft components for this purpose can only be
satisfied by materials with a specific combination of high strength and lightweight
properties. Because of that modern aircraft are built with complex structures and consist
of variety of materials [94, 108]. The best materials for these aircraft components, which
have the balance of lightweight and high mechanical strength, are aluminum alloys [36,
37]. Up to the present time, aluminum alloys are still the materials of choice and
constitute the biggest proportion of modern aircraft, followed by steel, titanium alloys,
and structural composites5 [94]. Other components within the cabin such as overhead
luggage compartments, sidewalls, and ceilings usually consist of lightweight plastics and
polymers [109].
Properties of some selected aircraft metallic materials, i.e. aluminum alloys and
austenitic stainless steel, are discussed in the following section.
2.5.1 Aluminum and Aluminum Alloys
Pure aluminum has the properties of lightweight and good resistance to corrosion
and to environmental effect, but with low mechanical strength. Fortunately, the
disadvantageous of being low strength can be overcome by alloying this pure aluminum
with some elements of transition, alkali, and/or alkaline earth groups. Some transition
elements that can readily form alloys with pure aluminum include copper, zinc, and
5 It needs to be noted that, as development of the composite materials progresses, this is changing since the
composite materials is now gaining acceptance widely. Composite materials constitute around 11% and
50% in B-777 and B-787, respectively [94, 108].

33
manganese, while alkali and alkaline earth that can form alloy with aluminum is lithium
and magnesium respectively. These alloying elements, when combined with appropriate
thermo-mechanical processing, greatly improve aluminum mechanical properties and
increase its usefulness especially as materials of choice for aircraft and rockets
applications [110].
In order to give a basic understanding about aluminum and aluminum alloys, in
the following section, designation and temper of aluminum alloys, effect of alloying
elements on the properties of aluminum alloys, mechanical properties of aluminum
alloys, and corrosion of aluminum alloys are given.
2.5.1.1 Aluminum Designations and Tempers
Pure aluminum is highly ductile, but has a low strength. One of the methods to
increase the strength of aluminum alloys is by alloying it with some other elements.
Further improvements, depending upon composition, are possible through a cold working
and/or heat treatment [111]. Different alloying elements and heat treatments would result
in different mechanical properties and/or strength of the alloys. Because of that, there will
be many varieties of aluminum alloys depending upon the alloying elements and/or their
metallurgical conditions and heat treatments. To distinguish between these aluminum
alloy varieties, several designation systems have been created by several associations
and/or companies that gives the alloys a specific nomenclature in a meaningful manner.
In the U.S., aluminum alloys designation and tempers are created by the Aluminum
Association [112].
Basically, the systems differentiate aluminum alloys designation and tempers
according to the sequences of major alloying elements, heat treatments, and other

34
metallurgical condition that have been performed to the alloys. The systems also
distinguish between wrought, casting, and experimental aluminum alloys. The aluminum
designation and temper systems developed by the Aluminum Association are explained
in the following [111-114].
In general, aluminum alloy designations consist of four digit numbers. The first
digit of designations indicates major alloying elements and the second digit indicates
modifications of the major alloying elements in impurity limits. In this regard, if there is
no special control on the individual impurities then the second digit will be written as
zero. Otherwise, numbers from 1 through 9, indicate particular control of one or more
individual impurities. The last two digits, which are assigned as needed, indicate specific
minimum aluminum content for pure aluminum (first series), while for other series are
used only to identify the different alloys in the group.
These four digit nomenclatures are used for both wrought aluminum alloys and
casting aluminum alloys. The difference is stressed for casting aluminum alloys, in which
the fourth digit is separated from the first three digits by a decimal point that indicates
their form, in this regard either casting or ingot. Other nomenclature is for experimental
aluminum alloys. The experimental aluminum alloy designations also use this four digit
system; however the designations are prefixed by the letter X. These experimental
designations only prevail during the investigational time. Once the alloys become
standard and available in the market, the X number will be dropped and the nomenclature
follows the regular designation system.
For wrought aluminum alloys in these designation systems, the first series,
usually written in the form of 1xxx, has no major alloying element. Other series from

35
2xxx, 3xxx, 4xxx, 5xxx, 6xxx, and 7xxx, each of them has major alloying elements of
copper, manganese, silicon, magnesium, magnesium and silicon, and zinc respectively.
Series of 8xxx is used for various major alloying elements other than the previous
alloying elements such as tin, lithium, and or iron, whereas 9xxx series is currently
unused and reserved for future alloys. For casting aluminum alloys, the major alloying
elements are the same such for wrought aluminum alloys except for 3xx.x, 6xx.x, and
8xx.x series. In this regard, 3xx.x has the major elements of silicon and other two
elements of copper and magnesium, 6xx.x is unused series, whilst 8xx.x has a major
element of tin.
Aluminum alloy tempers are written following alloy designations and are usually
separated from the alloy designations by a dash. In general, basic temper designations
consist of five individual capital letters as explained in the following. The letters F
indicates as fabricated; O for annealed; H for strain-hardened; W for unstable solution
heat-treated, which is applicable only to the alloys whose strength naturally changes at
room temperature; and T for stable thermally-treated, sometimes with additional strain-
hardening. These temper designations are further differentiated between non heat-
treatable aluminum alloys and heat-treatable aluminum alloys. The H temper is used for
non heat-treatable aluminum alloys, while F, O, and T are used for heat-treatable
aluminum alloys. The H and T tempers are usually followed by one or more digits to
indicate their particular method used to produce the tempers.
2.5.1.2 Effects of Alloying Elements
Alloying elements are usually added in certain amount to improve aluminum
mechanical properties. In general, alloying elements increase the strength of aluminum

36
alloys through three separate mechanisms, i.e. solid solution hardening, dispersion
hardening, and precipitation hardening or also called age-hardening [113]. These
strengthening mechanisms basically differ in the way they were formed and depend on
the alloying elements and the thermo-mechanical condition involved during the alloying
process. Some impurities also will give impact on the alloys properties.
Several alloying elements and their effect on aluminum alloys properties are
given in the following [111-115].
1. Copper is one of the transition metals and is one of the most important alloying
elements in aluminum alloys, either as a major addition such as in 2xxx series or as
an additional alloying element in other families of aluminum alloys. It considerably
improves the strength of aluminum through age-hardening characteristics by forming
metastable phases of θ” and θ’. Depending upon the alloy contents, the maximum
strength of the alloy usually will be also influenced by the presence of other elements.
2. Manganese is one of the transition metals. Manganese actually has limited solid
solubility in aluminum, but even with the amount of only up to 1% forms an
important 3xxx series of aluminum alloys. Manganese forms either solid solution or
fine precipitated intermetallic phase, such as Al6Mn, in aluminum alloys and thus
increases strength of the alloys.
3. Silicon is in group IV of periodic system. It is a major element in 4xxx series of
wrought aluminum alloys, and along with magnesium forms important 6xxx series of
aluminum alloys. Basically silicon lowers the melting point while at the same time
increases the fluidity and moderate strength of aluminum alloys. In aluminum alloy,
silicon forms a very small, coherent cluster in solid solution. Furthermore, from this

37
cluster, silicon transforms into diamond structure precipitates in the form of rods or
triangular plates on several planes of the aluminum matrix. These precipitates
improve the strength of aluminum.
4. Magnesium is in alkaline earth group. It is also one of the important alloying
elements in aluminum alloys. Magnesium is a major element in 5xxx series of
aluminum alloys. In this series, the strength is developed mainly through a work
hardening. Along with silicon, magnesium forms important 6xxx series of aluminum
alloys. Due to formation of rod-shaped precipitates of ’-phase, magnesium provides
significant strengthening and improvement of the work-hardening characteristics of
aluminum alloys, especially with the presence of other constituents such as copper
and zinc.
5. Zinc is one of the transition metals and is a major element in 7xxx series of aluminum
alloys. The addition of zinc itself into aluminum alloys has the drawback of hot-
cracking, especially in aluminum casting. However, along with magnesium, zinc
develops improvement in the strength of the alloy system through the precipitation of
η’-phase. The addition of copper to the aluminum-zinc-magnesium system greatly
improves mechanical properties, although with the price of corrosion resistance. But
this can be overcome by the addition of small amount of chromium and zirconium.
6. Other alloying elements for different aluminum alloys properties include iron,
lithium, tin, and titanium. Aluminum alloys containing these alloying elements fall
into 8xxx series of aluminum alloys when these alloying elements are in the greatest
proportion, but when these alloying elements are in smaller proportion than other
elements, the designations follow the elements with the greatest proportion. Other

38
alloying elements in small amount include nickel, chromium, zirconium, indium, and
lead. Sometimes these elements are found as trace elements and regarded as
impurities from the aluminum process. In the case of chromium and zirconium, in
small amount is needed for 7xxx aluminum alloy series in order to improve their
corrosion resistance.
2.5.1.3 Mechanical Properties of Aluminum Alloys
Mechanical properties of aluminum alloys can be improved in several ways, but
in general this can be done through a process of solid-solution hardening, grain-boundary
hardening, work or strain hardening, aging or precipitation hardening, and/or a
combination of these processes [113]. The basic principles of these methods are given in
the following.
Strengthening from solid-solution comes from the fact that solute and solvent
atoms may have differences in atomic size. The differences in this atomic size might
cause misfit and induce elastic interaction between strain fields of the solute atoms and
dislocations present in the lattice such as edge and screw dislocations [116]. In this
regard, solute atoms act to hinder dislocation motion, and thus will affect edge and screw
dislocations to some extents contributing to a solid solution strengthening [117].
In grain-boundary strengthening, the grain boundary acts as a barrier for
dislocations. Most of the time, a dislocation cannot cross a grain boundary because of slip
plane orientation and direction differences between the two neighboring grains; instead
the dislocation will pile up near the grain boundary [117]. Hall and Petch have shown that
grains size plays a major role in the deformation and thus in strengthening the alloys
according to [118-120]:

39
𝜍𝑦 = 𝜍𝑓 + 𝑘
𝑑
Equation 3
where:
y = yield strength
f = frictional stress
k = constant
d = average grain size
On the basis of this equation, the smaller the grain size the smaller the distance that can
be travelled by a dislocation before encountering a grain boundary, and thus the more
barriers that will hinder the dislocation resulting in higher strength. However, this
assumption does not work well for extremely small grain size because it predicts
unrealistic strengths [121]. In this case, key consideration is grain diameter versus grain
boundary area on which dislocations pile up, and the yield strength (y) is given by Li’s
equation [119]:
𝜍𝑦 = 𝜍𝑓 + 𝛼𝐺𝑏 𝜌
Equation 4

40
where:
f = frictional stress
α = constant, in the order of 0.4
G = shear modulus
b = Burgers vector
ρ = dislocation density
Strain or work hardening is a strengthening mechanism that results from an
increase in dislocation density due to dislocation-dislocation interactions [121]. In this
case, deformation occurs by the motion of existing dislocations and/or by the creation of
new dislocations through mechanisms of dislocation multiplication, such as a Frank-Read
source or a Bardeen-Herring climb source [117]. During the deformation process, the
dislocation density increases. This increasing in dislocation density, along with
dislocation-dislocation interactions, causes further deformation to become more difficult
thus strengthening the alloy through strain hardening. The common way to achieve this
strain hardening is by applying a cold-work such as in cold-rolled and/or cold-drawn to
the alloys. Solute atoms from alloying elements in aluminum alloys can also enhance
strain hardening through a process of precipitation during deformation, increasing the rate
of dislocation multiplication, and/or reducing the rate of recovery [122].
Precipitation hardening occurs when the solute concentration in the alloys exceeds
the limit of solubility [121]. Precipitation hardening is achieved by a heat treatment
process, which involves the process of solution treatment at high temperature followed by
a rapid quench to room temperature to form a supersaturated solid solution (SSSS). The

41
strength can then be increased by the aging process, which may involve several stages
including formation of the metastable phases of Guinier-Preston (GP) zones, named after
the scientists who separately revealed them [123, 124]. The effect of precipitation
hardening, and thus the strength of the alloy, depends on several parameters such as time,
alloying elements involved, and temperature of the precipitation heat treatment [125]. In
Al-Cu alloys for example, precipitates other than equilibrium of -phase (CuAl2) can be
produced during the aging process. In this regard, three metastable precipitates of GP-I,
GP-II (θ”-phase), and ’-phase can be produced in addition to the stable -phase. In
general, the process takes place according to the sequence of GP-I zone → GP-II zone
(θ"-phase) → θ'-phase → θ-phase [126]. GP zones of the first kind (GP-I) are platelike
arrays of copper layers oriented parallel to {100} planes in the aluminum matrix, while
GP zones of the second kind (GP-II) consist of an ordered tetragonal structure of
aluminum and copper layers arrangements [125, 126]. During deformation, depending on
the size, spacing, and degree of coherency, these precipitates are either sheared or looped
and bypassed by the dislocation motion. This mechanism of dislocation motion is called
Orowan bypass [114, 121, 127].
2.5.1.4 Corrosion of Aluminum Alloys
In general, corrosion is a chemical process due to interaction between a metal and
its environment that may cause deterioration to the properties of the metal. Pure
aluminum has low strength but has high corrosion resistance due to its continuous oxide
film on the surface. This oxide film obstructs further reaction of aluminum with
environment as long as the film covers its surface; otherwise corrosion will take place

42
[112]. As has been mentioned previously, to improve mechanical properties of pure
aluminum, especially for an application that needs high strength components; other
elements are added to pure aluminum. The addition of these alloying elements followed
by heat treatments, in principle, will promote formation of solid solution and/or small
solid hard precipitate to the alloys but in the form of heterogeneous microstructure. Thus,
the heterogeneous microstructures are intentionally developed to achieve the high
strength and especially to optimize mechanical properties of the alloys. Unfortunately,
this heterogeneous microstructure in some extent might interrupt the oxide film
protection on surface of the aluminum, and thus renders the alloys vulnerable to localized
attack. This vulnerability comes from the fact that microflaws due to the nature and
discontinuity of oxide scale in the surface oxide film might exist, especially within the
heterogeneous microstructure. Heterogeneous microstructure also presents galvanic
issues between matrix and precipitates. In this regard, potential difference between
intermetallic particles and the matrix might also exist, which causes galvanic couple, and
further renders the alloys to be more susceptible to localized corrosions such as pitting
and intergranular corrosions, particularly when the alloys are exposed to environment
during service. It has also been found that transport, such as proton migration, through
the oxide film induces deterioration of the oxide film and thus would also render the
alloys to become vulnerable to corrosion attack [128-130]. This corrosion would result in
deterioration and damaging effect to the properties of aluminum alloys, especially for
load bearing components [131].
Several types of corrosion might occur to aluminum alloys, depending on the
condition of the alloys and environments where the alloys are being used. In general,

43
corrosion of aluminum alloys may be divided into uniform corrosion, localized corrosion,
and combination with other processes such as environmentally assisted corrosion and/or
mechanically assisted corrosion [111]. The first type, uniform corrosion of aluminum
alloys, occurs in the presence of acidic or alkaline solutions and/or relatively high
chloride concentration. The presence of acidic or alkaline solutions and/or high chloride
concentration basically will destroy aluminum oxide film on the surface and thus uniform
attack will form on the aluminum alloys surface [131]. Localized corrosion can be
divided further into several sub types of pitting, intergranular, crevice, filiform, galvanic,
exfoliation, and biologically induced corrosion [111, 132]. The other forms of aluminum
alloys corrosions are environmentally assisted and/or mechanically assisted corrosions.
The corrosion forms include abrasion, erosion, or fretting corrosions for mechanically
assisted corrosions, while for environmentally assisted corrosions, the forms include
stress corrosion cracking (SCC) and corrosion fatigue [131, 133].
Localized corrosions have always been troublesome for aluminum alloys used in
structural materials, particularly in the form of intergranular and pitting corrosions. It has
been found that intergranular and pitting corrosions occur in commercial aluminum
alloys used in aircraft such as 2024 and 7075 aluminum alloys [112, 134].
While intergranular corrosion occurs at the grain boundary, pitting mostly occurs
on the surface and/or at the intermetallic constituent particles [112, 135]. Intergranular
corrosion takes place when large intermetallic precipitates form at the grain boundary
from a supersaturated solid solution. Formation of these large intermetallic precipitates
causes copper-depleted regions at the adjacent area close to the grain boundary. Large
intermetallic precipitates and copper-depleted regions then develop a potential difference

44
resulting in galvanic processes and further pronounce intergranular corrosions [112].
Although the initial localized attack might be minute and regarded as least damaging,
however the rates of attack can be significant and lead to subsequent stress corrosion
cracking [132].
Pitting corrosion occurs when the oxide film that forms on the surface of
aluminum alloys breaks down locally causing subsequent dissolution of the substrate
material [112, 136]. The dissolution of substrate materials leads the creation of small
holes on the surface of aluminum alloys. This hole has a tendency to bury in the alloy
matrix resulting in lacking of oxygen and become anodic. At the same time, areas with
excess of oxygen become susceptible to cathodic reduction. These two areas then develop
an electrochemical potential leading to pitting corrosion; see the sketch in Figure 2 for
more detail. The primary cause of oxide film breakdown can be from environmental
effects such as high concentration of chlorides and/or from electrochemical potential
between the intermetallic constituent particles of aluminum alloys [137, 138].
Furthermore, even a single pit, if it were on a critical point, will cause a great deal of
damage and result in premature catastrophic failure [112].

45
Figure 2–Illustration of corrosion pit buried into the mass of the metal, not drawn to
scale.
O2 O2 O2 O2
Corrosion pit
Cathode
Matrix
Anode

46
Pitting corrosion also has been found to occur at intermetallic constituent particles
in aluminum alloys [137-145]. Gao et al. [137] have investigated pitting corrosion on
2024-T3 and 7075-T6 aluminum alloys and further divided the constituent particles into
two types, i.e. type A for anodic particles and type C for cathodic particles. Anodic
particles tend to dissolve preferentially while cathodic particles tend to promote
dissolution of the neighboring matrix. For 2024-T3 aluminum alloy, anodic particles are
those that emphasize the content of Mg with an Al2CuMg nominal composition. Whereas
cathodic particles are those that emphasize the content of Fe and Mn with more complex
and varying compositions, but they are principally (Cu,Mn,Fe)Al6 or Cu2FeAl2 [137].
These two types of intermetallic particles, especially Al2CuMg particles (also known as S
phase), are the main source for pitting corrosion on 2024-T3 aluminum alloy [139, 140].
For 7075-T6 aluminum alloy, anodic particles are those that emphasize the content of Mg
such as MgZn2; whereas cathodic particles are those that emphasize the content of Fe and
Mn [138, 145] such as Al7Cu2Fe [136].
Because the particles are important in promoting corrosion, characterization of
their crystal structure, chemical composition, and electrochemical behavior is needed to
better understand the particle-corrosion relationship in commercial aluminum alloys. To
provide a more complete understanding of the interactions of constituent particles and the
matrix during corrosion, which is usually initiated by pitting-type corrosion, it will be
useful to use analytical electron microscopy (AEM) technique [146]. This technique can
be used to study the major constituent particles in aluminum alloys, both structurally and
chemically. The phases are determined according to the crystal structural information
from convergent beam electron diffraction (CBED) and selected area electron diffraction
47
(SAD) analyses. The chemical compositions of the particles can be analyzed by using
EDS and are then compared with the stoichiometric compositions of known compounds
[147]. By using this technique, Gao et al. [137] have been successfully identified
crystallographic properties of several particles in 2024-T3 and 7075-T6 aluminum alloys
(see Table I). Some other particles and or phases, including their stoichiometric
composition and structure, however, are still unclear and require further study [137, 138].
This technique will be also useful to determine the nature and extent of their interactions
following exposure to hydrogen peroxide. However, this work falls beyond the scope of
the present dissertation, which focuses on the specific effect of decontamination on
aviation materials, rather than on the general mechanisms of corrosion of aluminum
alloys.

48
Table I. Crystallographic properties of particles found on 2024-T3 and 7075-T6
aluminum alloys that have been identified so far [137, 138]. The crystallographic
parameters of a, b, and c are in pm, whilst is in degree.
Alloys Particles Structure a
(pm)
b
(pm)
c
(pm)
(deg)
2024-T3 Al2CuMg Orthorhombic 431 956 747 90
Al2Cu Tetragonal 607 488 90
(Fe,Mn)x-Si(Al,Cu)y*
Rhombohedral 1,598 75
7075-T6 Al23CuFe4 Orthorhombic 759 666 884 90
SiO2 Amorphous
* Composition of this particle does not conform to any of the known compounds; hence
further study is needed.

49
2.5.2 2024 and 7075 Aluminum Alloys
2024 aluminum alloy has a major alloying element of copper with a concentration
of up to 4.9 wt.% [148]. Other alloying elements include silicon, iron, manganese,
magnesium, chromium, and zinc. This alloy was developed in 1931 due to the increasing
demand in aircraft industry and was the first exclusively used to build the DC-3. This was
then followed by more general use by Boeing in the late 1970s. Nowadays, the most
common application of this alloy, beside aircraft, is for other aerospace and industrial
applications needing the lightweight and high strength components [149]. The work that
is still ongoing about this alloy in today research is due to the vulnerability of this alloy to
corrosion, especially to localized corrosion. The susceptibility of this alloy to corrosion is
due to the nature and discontinuity of oxide scale in the surface as has been explained in
the previous sections. For that reason, many efforts have been made by investigators to
increase the corrosion resistance of 2024 without losing its high strength [145, 150].
7075 aluminum alloy has a major alloying element of zinc with the concentration
of up to 6.1 wt.% [148]. Some other alloying elements include silicon, iron, copper,
manganese, magnesium, chromium, and titanium. This alloy was first introduced in
Germany in 1920s and then was further developed in the U.S. for use in airplane wings.
Like 2024 aluminum alloy, 7075 aluminum alloys is also susceptible to localized
corrosion; however, compared to 2024 aluminum alloy, this alloy has more corrosion
resistance due to its chromium content while at the same time containing less copper.
Nowadays, the main use of this alloy is for aircraft application including circumferential
frames, stringers, lower wing spars, and upper wing skins.

50
2.5.3 Other Metallic Materials Used in Airframes and Cabin Fittings
There are several metals alloys used in aircraft materials for specific use other
than aluminum alloys mentioned in the previous sections. One of them is austenitic
stainless steel 304 as used in lavatory and galley surfaces. Stainless steels are basically
ferrous-base alloys with a minimum content of 10% chromium [151]. This minimum
content of chromium is the amount needed to prevent the corrosion of the alloys, which is
basically where the term of stainless comes from. There are actually many types of
stainless steels depending on their compositions, treatments, and/or metallurgical
condition. Austenitic stainless steel can be divided into two types: chromium-nickel
based alloys and chromium-manganese-nitrogen based alloys. Austenitic stainless steel
304 belongs to austenitic chromium-nickel based stainless steel group with a chromium
content of up to 20 wt.%. Other alloying elements include carbon, manganese, silicon,
phosphor, sulfur, and nickel [152]. It has high ductility, excellent drawing, forming, and
spinning properties. In aircraft, as has been mentioned previously, austenitic stainless
steel 304 is used for lavatory and galley surface applications. Other common uses are in
the applications of tubing, flexible metal hose, food processing equipment, kitchen sinks,
refrigeration equipment, and sanitary fittings [153].
2.6 Copper Dissolution in Hydrogen Peroxide
Copper is one of important alloying elements in aluminum alloys. In 2xxx
aluminum alloys, copper is a major element alloying element with concentration of up to
4.9 wt.%. In 7xxx aluminum alloys, copper is one of the alloying elements with the
concentration of up to 2.0 wt.%. Several investigators have investigated the dissolution

51
of pure copper and its properties in several acidic solutions such as sulfuric acid [154,
155], hydrochloric acid [156, 157], and ethylene diamine tetra acetic acid/ethylene
diamine (EDTA/EDA) base solutions [158]. Several others have investigated the copper
dealloying and or nucleation and growth behaviors in aluminum alloys in the presence of
sodium chloride [159-162]. No data have been found, however, to the best of the author’s
knowledge, about the dissolution of copper or alloys containing copper into hydrogen
peroxide solution. To better understand the mechanism involved during the reaction,
identification, separation, and kinetic quantification of the reactions are needed. It would
be a challenge to resolve all of these problems since most of the processes are
complicated, especially when more than apparent rate data are sought. For this reason,
copper dissolution rate into hydrogen peroxide is investigated in the present work to help
understanding the corrosion process.
The dissolution of a solid is often of great interest for both natural and industrial
purposes. Dissolution occurs when the bonding within a solute material breaks down into
ions, atoms, or molecules due to heterogeneous process of chemical reactions [163]. The
heterogeneous chemical reactions may take place in several stages depending on the
reactions involved. However, in general, the reactions involve the processes of
detachment of atoms from the solid at the solid-liquid interface and the mass transfer
from this interface into the solution. Most of dissolution processes are controlled by the
second process, which is basically a diffusion process [164]. From chemical point of
view, the chemical reaction kinetics is of great interest, while diffusion control is the
usual situation in the majority reactions of industrial importance [165]. However, despite
the importance of the reactions, the kinetic theory for diffusion in liquids has not been as

52
well developed as that for dilute gases, and thus it has been always difficult to give
analytical predictions of diffusivities in the dissolution process [166].
The basic diffusion model was firstly enunciated by Fick in 1855 [167]. Fick’s
model has been used and applied by investigators for solving diffusion problems in many
areas. In 1897, Noyes and Whitney developed a diffusion model for a substance that
dissolves into its own solution [168]. Noyes and Whitney’s model has been applied by
many investigators to measure the rate of diffusion of a substance into a solution, and
several improvements have been made by several other researchers such as Nernst and
Brunner [169, 170] and King [171].
Diffusion model of a plate specimen into a solution can be solved by using a
rotating disc/cylinder technique, where a solid sample is rotated in a liquid capable of
dissolving the solid. The basic theory for a diffusion of a plate specimen into a liquid
comes from an empirical equation [172]:
𝑚
𝑡= 𝑘(𝐶𝑠 − 𝐶𝑡)𝐴
Equation 5

53
where:
m = amount of the material dissolved
t = time
k = constant
Cs = concentration of the saturated solution
Ct = concentration of the solution at time t
A = surface area of the dissolving body
Nernst [172] has shown that, in this empirical theory, the constant k is proportional to D,
the diffusion coefficient, or:
𝑚
𝑡= 𝐷
(𝐶𝑠 − 𝐶𝑡)
𝛿𝐴
Equation 6
where is another constant, which represents the thickness of the diffusion layer.
Diffusivity of a static solid in a liquid is very small [172]; because of that, the constant
need to be resolved in a moving media. The experiment for this purpose can be
performed by using a rotating disk. In a rotating disk experiment, in order to obtain the
thickness of this diffusion layer, the equations for the tangential, radial, and axial
contributions to the fluid flow near the surface of a rotating disk need to be firstly solved
by applying a boundary condition. The equation for this model was derived by Cochran

54
in 1934 [173]. In 1962, Levich [172], with the use of Cochran equations, obtained the
equations for boundary layer thickness of a solute species dissolving from a rotating disk:
𝛿 = 0.5 𝐷
13𝛿0
Equation 7
where:
0 = thickness of hydrodynamic layer, and 0
= kinematic viscosity
𝛿0 = 3.6
12
Equation 8
where:
= angular velocity
On the basis of powder particles, three diffusion control models have been
developed: the cube-root law derived by Hixson and Crowell [167, 174], the two-thirds-
root law derived by Higuchi and Hiestand [175, 176], and the square-root law derived by
Niebergall et al. [177]. Wang and Flanagan [178, 179] have shown that the cube-root

55
model is the most suitable for the long range diffusion when the particle size is much
larger than the thickness of the diffusion layer; the two-thirds model is the most suitable
for very fine particle; while the square-root model is the most applicable for particulate
with different particle size. Nevertheless, the cube-root model has been the most used by
many investigators because of its simplicity and applicability to a wide range of
dissolution process [180-184]. The cube-root model is also called the surface reaction
control shrinking core model and has been widely used in hydrometallurgy processes
[185-188]. In this dissertation, the rate of copper dissolution by hydrogen peroxide was
calculated by using the cube-root law. In order to use this model, the reaction of copper
with hydrogen peroxide is assumed to be homogeneous and isotropic with a constant
diffusion layer thickness. It is also assumed that in the solution there will be Cu+ and/or
Cu2+
, but these two ions are not differentiated; i.e. the concentration measured is the total
concentration from these two ions.
Reaction of copper and hydrogen peroxide is basically an oxidative reaction.
According to the table of standard electrode reduction and oxidation, half reactions that
involve metallic copper and hydrogen peroxide are as follows [189]:
Cu(s) = Cu2+
(aq) + 2e-
Equation 9
H2O2(aq) + 2 H+
(aq) + 2e- = 2 H2O(l)
Equation 10

56
Adding the two half reactions together then gives the overall reaction:
Cu(s) + H2O2(aq) + 2 H+
(aq) = Cu2+
(aq) + 2 H2O(l)
Equation 11
Because the reaction involves powder particles, it is also assumed that the rate of copper
diffusion at the particle surface away into the bulk liquid as the controlling step; therefore
is proportional to the instantaneous surface area. In this regard, the rate will be given by
[180, 185]:
𝑑𝑚
𝑑𝑡= −𝑛𝑘𝐴
Equation 12
where:
m = mass of the undissolved copper particle
n = number of the particle
k = dissolution rate constant
A = instantaneous surface area
Surface area of a sphere is 4r2. Substitution of 4r
2 into Equation 12 and then solving it
by integration gives the straight forward cube-root law [180, 185]:

57
1 − 𝑚𝑡
𝑚0
13
=𝑘𝑡
𝑟0𝜌
Equation 13
where:
m0 = total mass of the undissolved particle at time zero
mt = total mass of the undissolved particle at time t
r0 = initial size of the particle at time zero
ρ = copper density
The dissolved copper is measured in terms of Cu2+
concentration, in this case the
dissolution product based on the reaction in Equation 11. Based on this dissolution
product, Equation 13 can be rewritten in the form [181, 185]:
1 − 𝐶 𝑡 𝐶 ∞
13
= 1 −𝑘𝑡
𝑟0𝜌
Equation 14
where:
[C]t = copper concentration at time t
[C] = copper concentration at infinite time

58
As has been mentioned previously, this straight forward cube-root law can be
applied when the powder suspension disperse homogeneously in the solution; in this
regard plot of 1– (1– [C]t/[C])1/3
vs. t will be linear with a gradient of k/(r0ρ). Activation
energy for the dissolution of copper can be determined by plotting ln k vs. 1/T from
Arrhenius equation [185]:
𝑘 = 𝐴 exp −𝑄
𝑅𝑇
Equation 15
where:
k = rate constant
A = pre-exponential factor
Q = activation energy
R = gas constant
T = temperature in Kelvin
In practice, however, when the powder suspension disperses heterogeneously, the
observed kinetics for the dissolution will deviate from the simple cube-root law.

59
2.7 Effect of Hydrogen Peroxide on Fatigue Life
The majority of service failures are due to fatigue. It has been well known that
corrosion pits have a detrimental effect on fatigue life [190-194]. Different from high-
cycle fatigue that usually occurs without any prior macroscopic symptoms; in corrosion
fatigue pits are usually found as the crack origin [194]. This implies that introduction of
pits on the surface components bearing load would trigger fatigue crack initiation.
Because of that, establishment of life prediction after decontamination on the aircraft
structural materials would be desirable. Hence, to get a quantitative understanding on the
nature of crack growth after a decontamination process, fatigue testing is also needed,
especially to reveal subtle, incipient damage that could induce subsequent degradation in
the airliner structural materials performance [89].
Several other works on fatigue properties that involve corrosion process on
aluminum alloys have been done by several researchers. Du et al. [195] have investigated
the damaging effect of sequential exposure to fatigue, corrosion and fatigue in 2024-T3
aluminum alloy. In their work, 2024-T3 aluminum alloy was intermittently subjected to
sequential corrosion and fatigue process where the specimens were first subjected to
various degrees of fatigue damage in air, then immersed in a corrosive solution of 3.5
wt% NaCl and 10v% H2O2 for a fixed amount of time, and subsequently further fatigued
in air to failure. Bystritskii et al. [196] also have studied the change in tensile and fatigue
properties of 2024 and 7075 aluminum alloy samples modified using plasma-enhanced
ion beams. The bending fatigue test was carried out both in air and in a 0.5 M NaCl
aqueous solution which acted as a corrosive media. Interestingly enough, their results
showed that exposure to the corrosive media after an initial fatigue increase the sum of

60
fatigue life of aluminum alloys specimens as compared to that of the sample without
corrosion treatments. However, no studies or sufficient explanations on the mechanism
have been performed so far. Some explanations of the mechanisms behind the increase of
this fatigue life that still need to be tested experimentally are the blunting of fatigue-
generated microcracks, oxide induced closure, which would be significant with short
cracks, and the removal of other mechanical surface micro-damage by the corrosion
process, such as intrusion or extrusions [195] created at the initial stage of fatigue.

61
3. OBJECTIVES OF THE RESEARCH
In general, the objective of this present research is to find out if there is any
immediate loss or degradation in materials properties and hence performance after the
decontamination process has been applied to the airliner, and if there is any possibility of
cumulative damage from multiple decontamination cycles following either deliberate or
unintentional incidents of biological on-the-ground airliner decontamination. This study
was focused on the evaluation of airliner metallic structural materials; i.e. aluminum
alloys that cover around 80% on Boeing 747 or around 70% on Boeing 777 and austenitic
stainless steel as used for galley and lavatory surfaces [94].
There are three specific objectives of this present research. The three specific
objectives are associated with three distinct but related works that have been done and
explained as following:
The first objective is to study the effect of surface roughness and wetting phenomena
on bacterial attachment and its likely impact on the decontamination process. Within
the framework of the study, the work is divided into two parts; the first part is aimed
at investigating the effect of welding and subsequent corrosion on bacterial
attachment, while on the second part is aimed at investigating the effect of different
types of surface finish on the bacterial attachment.

62
The second objective is to evaluate the effect of decontamination, at the same time
the effect of chemicals used as decontaminants, in this case hydrogen peroxide, on the
airliner metallic structural materials after a decontamination process has been applied
to civilian aircraft.
The third objective is to assess the dissolution rate of copper induced by hydrogen
peroxide. Copper is the main alloying element in the 2024-T3 aluminum alloy and
one of alloying elements in the 7075-T6 aluminum alloy; thus, any effect to this main
alloying element would likely have an impact on the properties of the two aluminum
alloys.

63
4. MATERIALS AND METHODS
4.1 Bacterial Attachment Behavior to a Surface
4.1.1 Specimens Preparation
There were two activities that have been performed in an effort to assess the
behavior of bacterial attachments to a surface. The first was the attachment of Listeria
monocytogenes to an austenitic stainless steel surface after welding and accelerated
corrosion treatments. L. monocytogenes is a Gram-positive bacterium that may cause
listeriosis with the dose of about 1000 total organisms; however, the exact pathogenic
dose would vary with the strain and the victim’s susceptibility [197]. The main purpose
of this work was to investigate the effect of welding and subsequent corrosion on the
bacterial attachment. For this work, pieces of 300 mm by 300 mm and 2-mm thick
austenitic stainless steel 304 sheet and fillers with the same composition (McMaster-Carr,
Atlanta, GA., USA) were subjected to four different welding protocols of heat input and
travel speed. Welding was performed in Auburn University Engineering Shop with
tungsten inert gas (TIG) equipment with current of 40~190 A, orifice diameter of 1.6 mm
(1/16 inch), shielding gas Ar with the rate of about 0.92 ml/s (14 cup/hr), a standoff
distance of about 3.2 mm (1/8 inch), and the welding parameters are listed in Table II.
The weld treatments were high heat input at low speed (L1), low heat input at low speed

64
(L2), high heat input at high speed (S1), and low heat input at high speed (S2). The size
of the weld metal and the microstructure of the entire weld (i.e., weld metal plus the
unmelted HAZ surrounding it) are affected by a combination of the welding current and
the welding speed (i.e., how fast the welding rod is moved along the weld seam) [198-
199].
After the welding, the plate was cut into smaller parts with an electric discharge
machine (EDM HS-300, Brother, Inc., Bridgewater, N.J., USA), and coupons of 24 mm
by 9 mm containing a portion of weld, HAZ, and base metal were sectioned with a
ISOMET 2000 Precision Saw (Buehler, Lake Bluff, IL, USA). Base metal coupons that
were not subjected to welding were included as controls. All welded coupons were final
polished to a mirror surface finish by using 40 nm colloidal silica suspension on a
TegraForce-1 attached to a TegraDoser-5 system (Struers, Westlake, OH, USA). The
coupons were divided into two categories of uncorroded and corroded. To prepare the
corroded coupons, the welded-polished coupons were electroetched for 60 seconds in
20% nital (nitric acid and ethanol) solution at 5 V and 0.5 A prior to the corrosion test,
which consisted of exposure to 60% nitric acid at 90oC for 1 week.

65
Table II. Parameters for the TIG welded austenitic stainless steel 304
Coupon
Series
Description Welding Parameters
Bead Size Heat Input Bead width
(mm) Time (s)
Speed
(mm/min)
L1 Large High (190 A) 7.5 25 62
L2 Large Low (40 A) 5.0 25 62
S1 Small High (190 A) 5.5 15 104
S2 Small Low (40 A) 3.0 15 104
66
After the corrosion treatment, the coupons were prepared for bacterial attachment,
which was done by Ms. Tam Mai in the Auburn University Poultry Science Department.
The procedure is as follows: Following the corrosion process, the acidic coupons were
neutralized ultrasonically 10 successive times for 2 minutes each in a saturated solution
of sodium bicarbonate. All coupons were cleaned with acetone and then with 10
successive changes of deionized water for 2 minutes each in a sonicator (Cole-Parmer,
Vernon Hills, IL, USA). The coupons were autoclaved at 121oC for 15 minutes,
aseptically transferred onto sterile petri dishes containing a layer of Whatman No. 2 filter
paper, and dried in a desiccator at 42oC for 24 hours. The coupons were then ready for
bacterial attachment process.
A second activity was a study of the attachment of L. monocytogenes to an
austenitic stainless steel with three different types of commercially available surface
finish. The main purpose of this work was to investigate the effect of different types of
surface finish on the bacterial attachment. For this work, sheets of austenitic stainless
steel type 304 of 305 mm by 305 mm and 1 mm thick with a No. 2B finish, a No. 4 satin
finish, and a No. 8 mirror finish were obtained from McMaster-Carr (Atlanta, GA, USA).
All of the surfaces except for No. 2B finish were covered with a plastic film. These sheets
were sectioned into coupons of 24 mm × 9 mm by using a Buehler ISOMET 2000
Precision Saw (Lake Bluff, IL, USA). For No. 2B finish, coupons were cleaned with
acetone twice, for 10 minutes each time, in a sonicator (Cole-Parmer, Vernon Hills, IL,
USA). The coupons were sonicated twice in deionized water, for 10 minutes each time,
and then were autoclaved at 121oC for 15 minutes. The coupons were then aseptically
transferred onto sterile Petri dishes matted with a layer of Whatman No. 2 filter paper and

67
dried in a desiccator at 42oC for 24 hours before exposure to bacteria. For No. 4 satin
finish and No. 8 mirror finish, the plastic films were removed from coupons, which were
then soaked for 3 hours and then sonicated (Cole-Parmer, Vernon Hills, IL) twice, for 10
minutes each time in Mötsenböcker Lift Off®6
Tape Remover liquid (Mötsenböcker
Advanced Developments, San Diego, CA, USA) to remove any residual glue on the
surface. The coupons were soaked for 1 hour and sonicated twice for 10 minutes each
time, in hot hand soap solution (70oC). After being rinsed with deionized water to
eliminate soap, coupons were soaked in acetone for 15 minutes and then sonicated twice,
for 10 minutes each time, in deionized water. The coupons were autoclaved and then
ready for bacterial attachment process, which was done by Ms. Tam Mai in the Auburn
University Poultry Science Department.
4.1.2 Surface Roughness and Contact Angle Measurements
Surface roughness measurements were performed by using a profilometer Alpha
Step 200 model (KLA-Tencor, San Jose, CA, USA) available in Electrical Engineering
Department. For contact angle measurements, the sterilized and dried coupons were
positioned on a light microscope stage. A drop consisting of 10 µl of brain heart infusion
(BHI) containing 107 CFU/ml of L. monocytogenes was deposited on each coupon test
surface. Surface contact angles were evaluated at 23oC with a 4-megapixel digital camera
(Nikon USA, Melville, N.Y., USA) attached to a stereo microscope (Olympus America,
Melville, N.Y., USA) oriented to permit a side view of the inoculum droplet, see Figure 3
for detail. Photographs were taken 30 seconds after the droplet deposition, and a direct
6 Mötsenböcker Lift Off is a registered trademark of and distributed by Mötsenböcker Advanced
Developments Inc., San Diego, CA 92169, USA.
68
contact angle measurement was made from the recorded image. Each surface roughness
and contact angle reported in this work was the average of six measurements.
4.1.3 Attachment of L. monocytogenes
For the bacterial attachment, L. monocytogenes ATCC 19111 was used. The
bacteria was inoculated into brain heart infusion (BHI) and incubated for 24 hours at
37oC to obtain a stationary-phase cell culture of about 109 cells per ml. The testing
suspension was prepared by diluting 1 ml of this L. monocytogenes culture in 49 ml of
BHI. Bacterial attachment was performed by using a drop technique. A drop consisting of
10 µl of BHI containing 107 CFU/ml was placed on each tested surface of the coupon.
After incubation under saturated humidity conditions for 3 hours at 23oC, the samples
were washed three successive times for 2 minutes each with 200 ml of sterile water at
100 rpm. As has been mentioned previously, this bacterial attachment process was done
by Ms. Tam Mai in the Auburn University Poultry Science Department. After washing,
the coupons were treated with a fixative agent, which consisted of 2 ml of 2% osmium
tetroxide (OsO4), for 45 minutes. The clean and dried coupons were then coated with
gold using a sputter coater (ESM 550X, Hatfield, PA, USA.) and examined with a
scanning electron microscope (JSM 840, JEOL, Peabody, MA, USA) to determine the
number of L. monocytogenes cells attached to each of the test surface.
A total of 18 different surface types were tested. For each type of weld, four
different surfaces were tested, i.e. HAZ-uncorroded, weld-uncorroded, HAZ-corroded,
and weld-corroded. Uncorroded and corroded base metal coupons were included as
controls.

69
Figure 3–Stereo-light microscope setup oriented to permit a side view of the inoculum
droplet.

70
4.1.4 Statistical Analysis
For each surface treatment, six coupons were tested, and 60 fields of view were
evaluated to determine bacterial concentrations. The number of bacteria attached to each
of the surfaces under the field of view was counted by Ms. Tam Mai. All concentration
data were normalized to account for differences in the surface area of the inoculum due to
differences in interfacial energy as reflected in the differences in measured contact angle.
For statistical purpose, the SAS System package (SAS Institute Inc., Cary, NC, USA)
was used to run the ANOVA and Duncan’s test analyses to determine the significant
differences, if any, between the treatments.
4.2 Effect of Decontamination on Aircraft Structural Materials Properties
On the effect of decontamination process, as has been mentioned previously, the
main purpose is basically to examine the effect of the decontamination process and the
chemical used as the bio-decontaminant, in this case hydrogen peroxide, on the properties
of aircraft structural materials. The selected metallic structural materials were two
aluminum alloys and an austenitic stainless steel 304 as used for galley and lavatory
surfaces. Thus, because the focus was on the materials properties, there were no bacteria
or bio-contaminant involved during the process.

71
4.2.1 Specimen Preparation
The airliner structural metallic materials are represented by 2024 aluminum and
7075 aluminum sheets, each with dimensions of 610 mm x 610 mm (24”x24”) and 1.27
mm (0.050”) thick and with a heat treatment that conforms to T3 and T6 temper
respectively, and an austenitic stainless steel 304 sheet W/#8 mirror finish with
dimension of 610 mm x 610 mm (24”x24”) and 1.22 mm (0.048”) thick that conforms to
ASTM A240 [151]. The austenitic stainless sheet is used as a stand in for galley and
lavatory surfaces. All of these materials were obtained from McMaster-Carr (Atlanta,
GA, USA). In addition to these materials, to ascertain the effects of composition versus
heat treatment, some of the 2024-T3 aluminum alloy specimens were reheat-treated into
2024-T6 aluminum alloy. As-received 2024-T3 aluminum alloy was re-annealed at
493oC for 3 hours and then water quenched (15
oC). This as-quenched condition is called
the O-temper. For the T-6 temper, the O-tempered material was artificially aged at 190oC
for one day, and then air cooled to room temperature. All of the heat-treated materials
were kept in freezer at -22oC to prevent natural aging before the treatments. Except for
the tensile specimens, the large sheets were cut into smaller parts in the Auburn
University Engineering Shops and then into 12.7 mm x 25.4 mm (½” x 1”) coupons by
using Buehler ISOMET 2000 Precision Saw. Tensile specimens, both in the longitudinal
and transversal direction, were prepared from the sheets in accordance to ASTM standard
E8M-00b [200].

72
4.2.2 Metallographic Preparation
All of the aluminum metallographic specimens were polished by using non-water
based polishing materials followed by final polishing of 1:1 40 nm colloidal silica
suspension and ethanol. Non-water based polishing materials were used because copper
tends to accumulate on the intermetallic particle grooves when the specimen was polished
using water based materials. Austenitic stainless steel 304 was polished by using 4000
grit silicon carbide followed by final polishing of 40 nm colloidal silica suspension. All
of polishing activities were performed on a Struers TegraForce-1 attached to a
TegraDoser-5 system. After polishing, the specimens were ultrasonically cleaned using
ethanol and dried by using compressed air and then kept in desiccators for 24 hours.
Metallographic samples were compared before and after exposure. In case of etching, the
etchants used were Keller’s reagent (2.5 ml HNO3, 1.5 ml HCl, 1 ml HF, and 95 ml H2O)
and mixed acids (2.5 ml HF, 10 ml HNO3, 10 ml HCl, and 27.5 ml H2O) for the two
aluminum alloys and the austenitic stainless steel 304 respectively. The metallographic
samples were characterized by both light microscopy and using JEOL JSM 7000F field
emission scanning electron microscope (FE–SEM) operated at 15 kV for imaging,
together with energy dispersive x-ray spectroscopy (EDS) employing an ultrathin
window (UTW) detector and Princeton Gamma-Tech (PGT) analyzer operated at 20 kV.

73
4.2.3 Vaporized Hydrogen Peroxide (VHP) Exposure
A Steris VHP®7
1000ED unit from Steris Corporation, operated using cycle
parameters explained in the following paragraph was used to introduce the hydrogen
peroxide into a test chamber. The test chamber, containing the test samples, consists of a
glove box, from Purified Micro Environment (a division of Germfree Labs., Inc., Miami,
FL, USA) with a total volume of approximately 0.38 m3 (13.4 ft
3) and modified by the
vendor to include inlet and outlet ports to connect to the Steris unit. The objective of this
test is to evaluate the materials compatibility to hydrogen peroxide by comparing the
materials after exposure and control (non-exposure).
There are four phases that are performed automatically by Steris VHP 1000ED
unit to carry out one cycle of decontamination process, namely (see Figure 5 for detail):
1. Dehumidification phase. At this stage, relative humidity in the enclosure was reduced
up to 10-30%; the lower the humidity, the better to minimize the probability of
unintended condensation of the hydrogen peroxide. During this dehumidification
phase, the temperature inside the enclosure and hoses will also warm up and so to
allow higher H2O2 vapor concentrations. For the enclosure size of 0.38 m3 and air
flow rate of 0.37 standard cubic meters per minute, SCMM (13 standard cubic feet
per minute, SCFM), the time needed for this phase was around 10 minutes.
2. Conditioning phase. At this stage, hydrogen peroxide was flash vaporized by the VHP
1000 ED from 35% liquid hydrogen peroxide (VAPROX®8
Sterilant, STERIS
7 VHP is a registered trademark of STERIS Corporation, 5960 Heisley Road, Mentor, Ohio 44060-1834
USA.
8 VAPROX is a registered trademark of STERIS Corporation, 5960 Heisley Road, Mentor, Ohio 44060-
1834 USA.

74
Corporation, Mentor, OH, USA) and then was injected into the chamber at a rate of
60 mg s–1
to establish an inlet concentration of 2,000 ppm and a chamber
concentration of 450 ppm.
3. Decontamination phase. After a concentration of vapor phase of 450 ppm inside the
enclosure was achieved, the phase was then held for 4 hours and 48 minutes to
achieve 8 log10 kill by injecting 21 mg s–1
steady vapor phase concentration.
Hydrogen peroxide concentrations in the vapor phase were monitored using ATI
sensors (ATI Inc, Collegeville, PA, USA), which are capable of sensing
concentrations above around 50 ppm with a nominal accuracy of ± 0.1 ppm, at the
hydrogen peroxide inlet and outlet inside the chamber.
4. Aeration phase. After 4 hours and 48 minutes, in which the decontamination has been
done, the next phase is to remove the H2O2 vapor from the enclosure by breaking
H2O2 down catalytically into non-harmful by-products of water vapor and oxygen
(see the reaction in Figure 6). With the enclosure size of 0.38 m3, it took
approximately 75 minutes to complete this aeration phase. At the end of the run, after
the hydrogen peroxide concentration in the chamber was below 1 ppm, as measured
using a Dräger CMS sensor and Dräger tubes (Dräger, Luebeck, Germany),
supplemented by peripheral monitoring via a Dräger accuro®9
detector, the water and
oxygen byproducts were then vented safely into the lab atmosphere.
9 Dräger accuro is a registered trademark of Drägerwerk AG, Moislinger Allee 53-55, D-23542 Lübeck,
Germany.

75
During the process, temperature was monitored by putting 8 thermocouples at 8
different locations inside the chambers chosen so as to represent the entire enclosure.
This was done to ensure that the temperature inside the chamber was homogenous and no
condensation occurs during the decontamination process. Time, pressure, relative
humidity, and hydrogen peroxide concentrations was adjusted by using the Steris unit and
data collected with respect to the parameters can be printed by the Steris unit. In order to
examine the effect of multiple decontamination processes on a given aircraft, up to 25
VHP exposure cycles were performed.

76
Figure 4–Equipment set up for vapor hydrogen peroxide exposure; left side is the Steris
VHP 1000ED unit with the hoses into the test chamber. The test chamber (right side)
containing the test samples, consisted of a glove box from Purified Micro Environment (a div. of Germfree Labs., Inc., Miami FL) modified by the vendor, and the sensors.

77
Figure 5–Typical Steris VHP 1000ED bio-decontamination cycle [71].
Figure 6–Decomposition of hydrogen peroxide into harmless by-products of water and
oxygen [71].
Rel
ativ
e
hu
mid
ity
Relative humidity
1 2 3 4
100%
0%
VH
P c
on
cen
trat
ion
VHP concentration
Condensation point
Time
Hydrogen
peroxide
35%
Low temperature
decontamination process
2H2O2
Vaporization
2H2O
+
O2
Non-toxic residue,
vent to atmosphere

78
4.2.4 Dip-Testing Using the Liquid Peroxide Feedstock
Dip testing is immersion of a specimen into a liquid, in this case the submergence
of metallic specimens into hydrogen peroxide for a certain time. In most cases, the
decontamination process was done using hydrogen peroxide vapor with a concentration
of approximately 2000 ppm in the inlet and 450 ppm inside the chamber. However, dip
testing employing the liquid hydrogen peroxide feedstock with a concentration of
approximately 35% is needed to simulate the worst possible case, i.e. spillage of the
liquid concentrate due to the operator abuse, or conditions where large-scale
condensation of the peroxide takes place due to failure of the decontamination process
control. Since hydrogen peroxide decomposes photochemically under light, dip testing
was done in opaque containers (NALGENE HDPE, Nalge Nunc International, Rochester,
NY, USA) containing 250 ml of analytical grade 35% hydrogen peroxide solution (Fisher
Scientific, Fair Lawn, NJ, USA) for short time of 24 hours and longer time of 168 hours.
Dip testing was conducted at both room temperatures (~ 22oC), at which the hydrogen
peroxide would be expected to be relatively unstable but any reaction with the metallic
samples relatively rapid, and refrigeration temperature (0 to –2 ºC), at which hydrogen
peroxide would be expected to be relatively stable but any reaction with the metallic
samples would be slower. After dip testing the samples were ultrasonically cleaned in
high purity water (ARIES High-Purity D.I. Loop, ResinTech, West Berlin, NJ, USA).

79
4.2.5 Weight Change and Surface Roughness
Those chemicals that oxidize biological agents will also tend to oxidize exposed
metal surfaces and metallic components of the electronic equipment. The direct exposure
to an oxidizing agent will cause metal to oxidize and/or to undergo aqueous corrosion. It
may not cause immediate problems or failures; however, since hydrogen peroxide is a
strong oxidizing agent, then it will be a wise consideration to measure the weight change
of the metals after the exposure as well as its surface roughness. The main reason for this
is that during exposure the materials could be affected by the hydrogen peroxide. An
increasing weight change could indicate that there is some oxidation on the surface, while
a decreasing weight change could indicate some dissolution or leaching of particles from
the surface.
For the purpose of weight change and surface roughness, the samples were
ultrasonically cleaned in acetone and ethanol before the exposure to remove any residual
debris from machining or polishing that would affect the measurements and then dried in
a desiccator for 24 hours. Weight change was measured by using a Fisher Scientific
analytical balance (accuSeries 124, Arvada, CO, USA) with a nominal accuracy of ± 100
µg. After the exposure the samples were cleaned in high purity water and dried in a
desiccator for 24 hours and weighed again. The same cleaning procedure was done on the
specimens for the surface roughness measurement. Surface roughness was measured by
using an Alpha Step 200 profilometer (KLA-Tencor, San Jose, CA, USA). It needs to be
mentioned that weight change work on the VHP exposure was performed by Mr.
Mobbassar Hassan SK of the Auburn University Materials Research and Education
Center.

80
4.2.6 Microstructure and Mechanical Properties
Microstructural characterization was performed through visual inspection by
using light microscope (Olympus PME3, Melville, N.Y., USA) and/or scanning electron
microscope (JEOL JSM 7000F FE–SEM, Peabody, MA, USA), and observations were
recorded before and after the exposure. At the same time, chemical composition change
on the surface before and after treatments were also observed by using an energy
dispersive X-ray spectrometer (EDS) on a JEOL JSM 7000F FE–SEM employing an
ultrathin window (UTW) detector and Princeton Gamma-Tech (PGT) analyzer operated
at 20 kV. For mechanical purposes, the properties were observed through changes in
microhardness (LECO DM-400 Hardness Tester, Lakeview, MI, USA), nanoindentation
(NANO Indenter XP, MTS System, Eden Prairie, MN, USA), and tensile testing (Q Test
100 universal testing machine, MTS Systems, Eden Prairie, MN, USA) in accordance
with ASTM standard E8M-00b [200] before and after treatments. The specimen
geometry for this tensile testing is shown in Figure 7.
4.2.7 Statistical Analysis
For statistical purposes, whenever needed, the SAS System package from SAS
Institute Inc., Cary, NC, USA, was used to run the ANOVA and Dunnett’s test analyses
for determining the significant differences, if any, between the treatments.

81
L – Total length, 100 mm
W – Width, 6 mm
A – Length of grip section, 30 mm
B – Width of grip section, 10 mm
R – Radius of fillet, 6 mm
T – Thickness, 1.27 mm for aluminum and 1.22 mm for stainless steel
Figure 7–Schematic of tensile test specimen with nominal dimensions.
AR
W
T
L
B

82
4.3 Copper Dissolution in Hydrogen Peroxide
The copper dissolution rate into hydrogen peroxide was determined after an initial
study of the impact of decontamination on the properties of aircraft structural materials,
in which some leaching of copper into hydrogen peroxide during the dip testing was
observed. Dip testing is immersion of a specimen into liquid hydrogen peroxide for a
certain time. This was done to simulate the worst possible condition, i.e. spillage of the
liquid concentrate due to operator abuse or conditions where large-scale condensation of
the peroxide takes place due to the failure of decontamination process control. This
leaching was expected because of copper dissolution into hydrogen peroxide. Since
copper is one of the important alloying elements in the aluminum alloys, to get the idea
how fast the process takes place and so to help understanding the subsequent corrosion
process, if any, this work was also performed. For this purpose, an atomic absorption
spectrometer (Varian AA240, Varian Inc., Palo Alto, CA, USA) was used to analyze the
copper concentrations at different stirring speed, times, and temperatures.
4.3.1 Specimens Preparation
A 325 mesh copper powder with a metal basis grade (99%) from Alfa Aesar
(Ward Hill, MA, USA) was used as a reference material. For the aluminum alloys, a 3
mm diameter circular specimen was cut from the sheet using EDM and ultrasonically
cleaned in acetone and ethanol each for 5 minutes, dried up, and then kept in desiccators
for 24 hours. All of the aluminum alloys surfaces were coated (Micro-Shield from SPI-
Chem, West Chester, PA, USA) except at one side on which copper dissolution
measurement was carried out.

83
4.3.2 Testing Procedures
An amount of 20 mg of copper powder was weighed on an analytical
microbalance (Mettler Toldeo AT20, Mettler-Toledo GmbH, Laboratory & Weighing
Technologies, CH-8606 Greifensee, Switzerland) with a nominal accuracy of ± 1 µg. The
specimen was then put into small glass bottle containing 20 ml of 35% hydrogen
peroxide solution (Fisher Scientific, Fair Lawn, NJ). The bottle containing the specimen
was put into water bath on a plate (Corning Stirrer /Hot Plate model PC-420, Acton, MA,
USA) and stirred at a certain speed, time, and temperature. Thereafter the sample was
removed from the bottle and the solution was filtered using a Whatman No. 2 filter paper.
Copper concentration in the hydrogen peroxide solution, in this case indicating the
dissolved copper, was analyzed by using AAS with a copper standard diluted from
copper standard solution 1000 ppm (Copper standard solution 1000 ppm, Fisher
Scientific, Fair Lawn, NJ). The same testing procedures were applied to both 2024-T3
and 7075-T6 aluminum alloys.
4.3.3 Data Analysis
Data from the dissolution studies were grouped into three different categories of
stirring speeds, reaction times, and temperatures. Each of the categories was statistically
analyzed using ANOVA to find any difference within the groups, while Dunnet’s test
was using to find the difference among the groups. Results from this analysis were then
used as an input for a simple theoretical model of the dissolution rate.
84
4.3.4 Modeling
The objective of this task is basically to study the kinetics of copper dissolution
into hydrogen peroxide. Result from this work was then compared to those of two
aluminum alloys of 2024-T3 and 7075-T6 in order to get deeper understanding of
reaction step and so to provide basis knowledge on how the subsequent corrosion of those
two aluminum alloys occurs in the presence of hydrogen peroxide. For this purpose, the
dissolution of copper powder hydrometallurgically dissolved in hydrogen peroxide
solution was measured. The dissolution rate was obtained from the dissolving of copper
in the solution analyzed by atomic absorption spectrometer.

85
5. RESULTS AND DISCUSION
This section provides results and discussion for the three different topics
explained in the previous section. The first part will discuss the effect of surface
roughness and wetting phenomena on bacterial attachment, and its likely impacts on the
decontamination process. The second part will present the effect of decontamination and
thus the decontaminant, in this case hydrogen peroxide, on the microstructure and
mechanical properties of aircraft metallic structural materials, which covers 2024-T3
aluminum alloy, 7075-T6 aluminum alloy, and austenitic stainless steel 304 as used in
lavatory and galley surfaces. The third part deals with copper dissolution rate into
hydrogen peroxide. Based on the copper dissolution rate into hydrogen peroxide, this
third part will also discuss the possibility of two aluminum alloys of 2024-T3 and 7075-
T6 becoming corroded in the presence of liquid hydrogen peroxide.
5.1 The Impact of Surface Roughness and Wetting Phenomena on Bacterial
Attachment
Several other studies that have been performed by other investigators used an
immersion technique to examine bacterial attachment behavior onto surfaces. In this
technique, samples are immersed fully in a bacterial suspension. As has been mentioned
earlier, wettability is a characteristic of a given surface-liquid combination and can be

86
measured as the contact angle. At the same time, the problem with doing this immersion
technique is that the liquid wetting aspect will be masked and thus the problem may not
be examined correctly; in this case contact angle and thus wetting phenomena cannot be
investigated. For this reason, in order to reveal the wetting phenomena, in this study, the
investigation of bacterial attachment to the surfaces was not done by using the immersion
technique; instead the liquid containing bacteria was deposited onto the surface by the
drop technique. In this technique the effect of wetting phenomena would be clearly
apparent. Results from this study are given in the following section.
5.1.1 Surface Roughness and Contact Angle
Surface roughness (Ra) values obtained by surfaces treatments on the as-polished
samples were about 40 nm, indicating similarities in the surface areas for all of the as-
polished samples. This value of surface roughness is consistent with the use of 40 nm
colloidal silica suspension, which was used for the final polishing. However, Ra values
obtained from the polish-corroded samples ranged from 450 to 480 nm, indicating small
differences in the surface topography according to the specific surface treatments. It is
clear that after being exposed to corrosive media, the surface roughness values of the
corroded samples were much higher than those of the uncorroded samples. More detail
on this surface roughness can be seen in Figure 8. At the same time, contact angles
measurements for the as-polished samples were about 72 degree, while for the polish-
corroded samples ranged from 41 to 54 degree.

87
Figure 8–Surface roughness measurements for the as-polished (a) and polish-corroded (b)
surfaces; see Table II for coupon series detail. Error bars show standard deviation.
30
32
34
36
38
40
42
44
46
L1 L2 S1 S2 BM
Ra
(n
m)
Coupon series
As-polished HAZ
As-polished weld
As-polished base
440
445
450
455
460
465
470
475
480
485
L1 L2 S1 S2 BM
Ra
(n
m)
Coupon series
Corroded HAZ
Corroded weld
Corroded base
b
a

88
There was a strong negative correlation between surface roughness and contact
angle values, which was about -0.97. In this case, it is suspected that the increase in
surface roughness may have accounted for a decrease in contact angles. Even there was
no difference in contact angle measurements of the three surface zones of the uncorroded
samples statistically; however, on the corroded specimens, the corrosion treatment
seemed to substantially reduce the contact angle. The results showed that contact angle
measurements of the corroded HAZ and weld zone of the large bead and high heat input
sample were the lowest. The contact angle difference between the as-polished and
polish-corroded coupons that results in surface area differences can be seen clearly in the
representative pictures in Figure 9 (a) and (b) respectively, while quantitative results on
this contact angle can be seen detail in Figure 10.
Although in the corroded samples, it was not always consistent that the higher
values of surface roughness lead to the lower values of contact angle, however, in certain
extent, the increases of surface roughness seemed to play a role on the decreases of the
contact angle measurements of the samples in this work. Nevertheless, a direct
correlation between surface roughness and wettability cannot be precisely determined in
this work since a detailed statistical analysis of the correlation of surface roughness to
wettability was not included. As has been mentioned in the previous section, the work
involved the acceleration of corrosion process, which would likely entail other factors as
a result of the corrosion induced product(s). Thus, more investigation is actually needed
to fully determine the direct correlation between surface roughness and wettability,
independent of other factors associated with corrosion, for example potential reduction in

89
solid-vapor interfacial energy which may be induced by the formation of corrosion
products.
Effect of different surface roughness of three different zone of TIG welding that
results from the corrosion treatment on the bacterial attachment are discussed more detail
in the following section.

90
Figure 9–Sessile drop of 10 µl BHI containing 107 CFU/ml of L. monocytogenes on the
as-polished (a) and polish-corroded (b) surfaces that results in different contact angles.
b
1 mm
1 mm
a

91
Figure 10–Contact angle measurements for the as-polished and polish-corroded surfaces;
see Table II for coupon series detail. Error bars show standard deviation.
30
35
40
45
50
55
60
65
70
75
80
L1 L2 S1 S2 BM
(d
eg
)
Coupon series
As-polished HAZ
As-polished weld
Corroded HAZ
Corroded weld
As-polished base
Corroded base

92
5.1.2 Wettability Phenomena
The wettability phenomena underlying the spreading of a liquid over a surface
comes from the fact that the higher the surface wettability due to the effect of surface
roughness, the more area covered and thus the more distribution of L. monocytogenes
over the surface area and vice versa. Therefore, in order to investigate the influence of
differences in contact area, normalization of bacterial counts was needed. This
normalization was also required especially to account for differences in the surface area
of the inoculum due to differences in interfacial energy as reflected in the differences in
measured contact angle. The equation was formulated with the assumptions:
1. There was no bio-film formation
2. The solution and thus bacteria spread homogenously
3. The substrate and thus the surface laid over a flat area
For this purpose, the normalization equation was derived based on spreading of a liquid
drop over surface area on the substrate, in which the term of wetting is sometimes used to
describe the propensity instead of wettability [201], and is explained in the following
section.

93
Figure 11–Derivation of normalization equation was based on spreading of a liquid drop
on the surface of a substrate [201].
r
h
0
Substrate

94
Volume of the cap, Vc, the shadow area in the Figure 11, is the volume of the sessile drop
and is given by:
𝑑𝑉𝑐
𝑑ℎ
0
= 𝑆 𝑑ℎ
Equation 16
Where S, the surface area under the cap, is equal to:
𝑆 = 𝜋(𝑟2 − ℎ2)
Equation 17
Combination of Equation 16 and Equation 17 gives the equation of:
𝑉𝑐 = 𝜋
𝑟
𝑟 cos 𝜃
𝑟2 − ℎ2 𝑑ℎ
Equation 18
Since S is also given by:
𝑆 = 𝜋𝑟2 𝑠𝑖𝑛2𝜃
Equation 19

95
Combination of Equation 18 and Equation 19 will give the surface area of:
𝑆 = 𝜋 𝑉𝑐𝑠𝑖𝑛
3 𝜃
23− cos𝜃 +
𝑐𝑜𝑠3 𝜃3
23
Equation 20
Solving this equation will then give the solution for normalized bacterial count as
following:
𝑋 = sin 𝛼
sin 𝜃
2
2 − 3 cos 𝜃 + 𝑐𝑜𝑠3𝜃
2 − 3 cos𝛼 + 𝑐𝑜𝑠3𝛼
23
𝑌
Equation 21
where:
X = normalized bacterial count
Y = bacterial count on the field of view that needs to be normalized
α = contact angle of the inoculum that need to be normalized
θ = contact angle of the inoculum that is used as standard for the normalization

96
5.1.3 Wettability and Bacterial Attachment
Number of bacteria attached to each of the surfaces before and after normalization
is given in Table III and Table IV, respectively, and the accompanying graph with
Duncan’s grouping is shown in Figure 12. Representative SEM micrographs of the
attachment on the base metal, HAZ, and weldment surface areas are given in Figure 13,
Figure 14, and Figure 15, respectively. Although the results showed that there were no
differences (P > 0.05) in the numbers of bacteria attached on the three surface zones of
the uncorroded samples; however, the numbers of bacteria detected on the three zones of
welds exposed to the corrosive media were higher (P < 0.05) than those on the
corresponding three zones of the uncorroded surfaces. Among the corroded surfaces,
attachment to the HAZ surface was consistently higher than that of the weld region, while
the highest attachment occurred on the HAZ corroded sample, which was welded with a
large bead and high heat input (L1). Furthermore, the amount of bacteria on the base
metal was lower (P < 0.05) than those on HAZ and weld regions.

97
Table III. The average number of bacteria attached to each of the surfaces before
normalization. Standard deviation is given in parenthesis.
Coupon series As-polished Polish-corroded
HAZ Weld HAZ Weld
High
heat
Large bead 160 (60) 153 (47) 208 (72) 160 (69)
Small bead 154 (63) 156 (51) 163 (55) 130 (45)
Low heat
Large bead 147 (64) 159 (56) 161 (59) 120 (39)
Small bead 148 (64) 147 (72) 149 (50) 143 (52)
Base metal 148 (40) 131 (37)
Table IV. The average number of bacteria attached to each of the surfaces after
normalization. Standard deviation is given in parenthesis.
Coupon series As-polished Polish-corroded
HAZ Weld HAZ Weld
High heat
Large bead 142 (53) 135 (42) 351 (121) 250 (108)
Small bead 137 (56) 138 (45) 254 (86) 188 (66)
Low heat
Large bead 131 (56) 141 (50) 257 (94) 181 (59)
Small bead 131 (57) 131 (64) 202 (68) 190 (69)
Base metal 131 (36) 170 (48)

98
Figure 12–Means of bacterial counts before (a) and after (b) normalization on the field of
view of tested surfaces; see Table II for coupon series detail. Different letters indicate significant differences (P < 0.05) in number of bacteria on the surfaces.
50
100
150
200
250
L1 L2 S1 S2 BM
Nu
mb
er
of
ba
cte
ria
/ f
ield
of
vie
w
Coupon series
As-polished HAZ
As-polished weld
Corroded HAZ
Corroded weld
As-polished base
Corroded base
BC
BBB
B
BB
B
C
B
BB
B
A
BB
B
BC
50
100
150
200
250
300
350
400
L1 L2 S1 S2 BM
Nu
mb
er
of
ba
cte
ria
/ f
ield
of
vie
w
Coupon series
As-polished HAZ
As-polished weld
Corroded HAZ
Corroded weld
As-polished base
Corroded base
D
C
EE
C D
B
EE
C D
B
EE
B
A
EE
E
C D
b
a

99
Figure 13–Secondary electron images of the attachment of bacteria on the as-polished
base metal (a) and polish-corroded base metal (b) coupons.
a
b
10 m
10 m

100
Figure 14–Secondary electron images of the attachment of bacteria on the as-polished
HAZ (a) and polished-corroded HAZ (b) coupons.
a
b
10 m
10 m

101
Figure 15–Secondary electron images of the attachment of bacteria on the as-polished
welded (a) and polished-corroded welded (b) coupons.
a
b
10 m
10 m

102
In context of bacterial attachment due to the spreading of liquid containing
bacteria onto a surface and its relation to decontamination, the effects of surface
roughness are particularly interesting. As has been mentioned previously, one of the
factors affecting bacterial attachment onto surfaces is wetting and adhesion. In this
regard, the distribution of bacterial cells over the surface of the substrate is affected by
those factors that govern the wetting of the surface, in this case by the factor affecting the
liquid carrying the bacterial cells. Results from this work showed that surfaces of higher
roughness distributed the L. monocytogenes suspension over larger area than the surface
of lower roughness. However, in this work there were several variables that could result
from the material treatment itself, such as surface roughness, wettability, microstructural
changes, and other factors that might be induced by the corrosion process. These
variables unfortunately were not independently controlled. Thus, the dominant parameter
could not be identified precisely; it could be due to increased in surface area, increased in
wettability, microstructural changes or a combination of these variables. Nonetheless, in
this work, the overall wettability of the surfaces appeared to be a primary determinant of
the results. In its relation to the decontamination process, the more the spreading of
bacteria over a surface, the more it likely prevents or at least affects the decontamination
process; and hence, this corrosion site should get more attention than the other surface
areas because it might become a harborage after either incident or intentional release of
bio-contaminant agents.
As can be seen in the selected photomicrographs in Figure 13, Figure 14, and
Figure 15 for the base metal, HAZ, and welded surface areas, respectively, SEM analysis
revealed that bacteria that attached to the surfaces were randomly distributed. It needs to

103
be noted that, however, due to the large contact area under inoculum, only the selected
area within the field of view was considered for the bacterial count purpose.
Comparison of bacterial counts prior to normalization of the data showed that
there were no differences (P > 0.05) in bacterial counts among the different surfaces,
except for corroded HAZs of high heat input at low speed. This zone, as has been
mentioned before, had the highest number of bacteria (P 0.05), while corroded weld
metal of high heat input at high speed had the lowest number of bacteria (P 0.05).
However, when the data were normalized, differences in numbers of bacteria on the
surface were apparent as can be seen in Figure 12 (b).
The results of this first study indicate that welding of austenitic stainless steel 304
followed by mirror polishing does not affect the ability of L. monocytogenes to attach to
the surface under the conditions examined; however, corrosion of the welded stainless
steels does promote the attachment of L. monocytogenes with the largest effect occurring
in the HAZ. In its relation to the decontamination process, results of this work would
likely indicate that corrosion site, especially on the austenitic stainless steel 304 welded
joining and its surrounding HAZ should need more attention because it could become a
source or a harborage after either incident or intentional release of bio-contaminant
agents.
On the second work, a comparison of surface roughness and contact angle values
for the three different types of surface finish tested is shown in Table V, while
representative SEM micrographs of the attachment of bacteria on those three different
surfaces are given in Figure 16. As has been mentioned before, wettability is a
characteristic of the combined properties of a surface, a liquid and a vapor phase and is

104
measured as the contact angle, in which lower contact angle corresponding to better
wetting [63, 65]. Thus, when investigating bacterial attachment with non-immersed
exposure, such as drop contact, which was also used in this work, surface wettability
needs to be considered because it can play an important role in the initial events that will
lead to attachment of bacteria to the surface [47]. In this case, the surface area covered by
droplets of equal composition and volume would vary according to the surfaces
wettability characteristics, i.e. contact angle.
Results of this work showed that the surfaces of higher wettability or lower
contact angle (as observed on a No. 2B surface) allowed distribution of the L.
monocytogenes suspension over a larger area as compared to surfaces of lower wettability
(No. 4 and No. 8 surface finishes). To investigate the influence of differences in contact
area, bacterial counts were also normalized (Equation 21) to account for differences in
the surface area of the inoculum due to differences in interfacial energy as reflected in the
differences in measured contact angle. However, given the small differences in contact
angle, this normalization of the data did not significantly affect the results. As with
normalized data, bacterial counts differed among the different surface finishes, with the
lowest count occurring on the No. 2B finish and the highest count on the No. 8 finish.
It is generally accepted that roughness of surfaces strongly affects the measured
contact angle [202, 203], as also has been supported by the previous work on the weld
corroded surface; however, as can be seen from the values in Table V, the influence of
surface roughness on the measured contact angle was not clear in this second work. The
coupons No. 4 satin and No. 8 mirror finish had the highest and lowest value of surface
roughness respectively, but No. 8 mirror and No. 2B finish had the highest and the lowest

105
value of contact angle, respectively. The number of bacteria attached to No. 8 finish was
significantly greater than those of No. 4 satin and No. 2B finishes, while the lowest
number of bacteria was found on the No. 2B finish.

106
Table V. Surface roughness, contact angle measurements, and means of bacterial counts
per field of view (FOV) before normalization (BN) and after normalization (AN).
Different letters indicate significant differences (P ≤ 0.05). Standard deviation for surface roughness and contact angle is shown.
Steel Surface Finish
Surface roughness (nm)
Contact angle (deg)
BN/FOV AN/FOV
No. 2B 425 ± 2 72 ± 1 70 (A)
79 (A)
No. 4 439 ± 3 79 ± 1 108 (B) 109 (B)
No. 8 39 ±1 80 ± 1 132 (C) 132 (C)

107
Figure 16–Secondary electron images of surfaces following the application of bacterial
suspension drop on No. 2B finish (a), No. 4 satin (b), and No. 8 mirror (c, see next page) coupons.
a
b
10 m
10 m

108
Continued
c
10 m

109
Investigating the sole effect of surface finish on the initial attachment of bacteria
is challenging since it is difficult to separate surface finish from other variables such as
surface roughness, surface wettability, and surface charge if materials of differing
electrical properties are also considered. In terms of solely surface roughness, the result
of this work does not fully agree with the previous results in which more bacterial
attachment occurred on surfaces with higher wettability or lower contact angle. In this
work, it appears that there was a correlation between the value of contact angle and the
number of bacteria attached to the surface; the greater value of contact angle of the
surface, the greater number of bacteria on the surface. However, it is hard to draw
conclusions as to an effect due solely to the surface roughness since each surface
roughness represents a different surface finish. This would likely explain why result of
this work does not fully agree with the previous results. The discrepancy could also be
explained further by the fact that when the contact angle of a surface increased to a
certain degree, detachment of bacteria on that surface was observed to become more
difficult.
In its relation to the decontamination, the major finding of this second work is that
polishing an austenitic stainless steel 304 surface to a certain smoothness, which would
influence wettability, may give rise to more adhesion of bacteria on the surface. Thereby,
it might take more time to decontaminate bio-contaminant on that type of surface finish
compared to other certain type of surface finish. On the other hand, certain type of
surface smoothness might impact the ability of decontamination treatments to remove or
inactivate attached cells. In terms of surface finish, a certain type of surface finish might
be better than the other in terms of the easy of decontamination; thus there would be a

110
need to find an optimum surface roughness. Furthermore, these two works were done
only on an austenitic stainless steel 304; however, since the work concentrated on
fundamental aspects, much of the knowledge obtained herein could possibly also be
applied to other aircraft metallic structural materials.
5.2 Effect of Decontamination on Materials Properties
The effect of decontamination and thus decontaminant agent on material
properties is discussed in this section of the work. The discussion will be divided into
several parts: effect of decontamination on surface chemical composition change, effect
of decontamination on weight change and surface roughness, effect of decontamination
on surface microstructural change, and effect of decontamination on mechanical
properties of aircraft metallic structural materials.
5.2.1 Effect of Decontamination on Surface Composition Change
The nominal chemical composition and the chemical composition determined by
EDS analysis (JEOL JSM 7000F) of the aircraft metallic structural material surfaces is
shown in Table VI, Table VII, and Table VIII for 2024-T3 aluminum alloy, 7075-T6
aluminum alloy, and austenitic stainless steel 304, respectively. In general, the average
surface chemical compositions of 2024-T3 and 7075-T6 aluminum alloys were almost
unaffected by VHP exposure and liquid hydrogen peroxide dip testing. However, an
apparent effect on the surface chemical composition change of large intermetallic
particles containing copper was found on 2024-T3 aluminum alloy after 168 hours of dip
testing as can be seen in Table VI. This copper is the main alloying element in 2024
aluminum alloy. It is suspected that redeposition and/or dissolution of copper might occur

111
during the dip testing since the composition decreases by around 29% as compared to the
as-received sample. For 7075-T6 aluminum alloy, there was no significant statistical
difference. However, a small change in the composition of intermetallic particles
containing copper was also observed as can be seen in Table VII. However, almost there
was no effect in the zinc composition, the main alloying element in this 7075-T6
aluminum alloy.
As has been mentioned in the previous section, in general, these two age
hardenable aluminum alloys are much less corrosion resistant than pure aluminum. This
would be understandable since microflaws due to the nature and discontinuity of oxide
scale in the surface oxide film, induced by alloying elements, might exist. Furthermore, it
needs to be noted that the two main alloying elements, copper and zinc, on the large
intermetallic particles behave differently with respect to the hydrogen peroxide, in which
copper seems to be more vulnerable to hydrogen peroxide as compared to zinc. This
difference might be explained by the fact that copper and zinc differ widely in terms of
their solid-state solubility in aluminum: solid solubility of copper is much smaller than
that of zinc [204]. This solid solubility difference would affect the formation of
intermetallic particles in the alloys. In this case, within aluminum alloys, copper would be
more likely to form intermetallic particles as compared to zinc. At the same time, the
electrochemical potential reduction of these two elements also differs: copper has +0.34
volts while zinc has –0.76 volts [112, 189]. In terms of elemental properties, based on
this electrochemical potential value, zinc is basically more reactive than copper.
However, with this reactivity, zinc reacts readily with oxygen to form an adherent oxide
film on its surface, thus protect it from further corrosion attack [205, 206]. Thus, it would

112
be understandable that copper seems to be more susceptible to hydrogen peroxide
compared to that of zinc. For austenitic stainless steel 304, as can be seen from Table
VIII, almost no surface chemical change was detected. This material has excellent
corrosion resistance; thus, it would be unsurprising that there was almost no change in the
surface chemical composition after the treatments.
The small changes in the large intermetallics particles containing copper on this
2024-T3 and 7075-T6 aluminum alloys may not have a major effect for short time
periods, especially on the alloys mechanical properties. However, in the long term, it
might induce corrosion to the materials, which further trigger fatigue crack initiation
resulting in catastrophic failure. Because of that there is a need for more investigation on
the effect of this composition change on fatigue life after decontamination has been done
(see section 7 on the Suggestions for Future Work).

113
Table VI. Nominal chemical compositions [141] and chemical compositions obtained
experimentally using EDS analysis for 2024-T3 aluminum alloy, wt.%. Standard deviations (5 samples), given for elements of interest only, are in parenthesis.
Al Cr Cu Fe Mg Mn Si Ti Zn
Nominal Bal. 0.1 3.8-4.9 0.5 1.2-
1.8
0.3-
0.9 0.5 0.15 0.25
As-received 93(1) 0 4(1) <1 2 <1 0 <1 0
As-polished
Average 92(1) 0 6(1) <1 1 1 0 <1 0
Spot on Matrix 93(1) <1 4(0) 0 1 <1 0 <1 0
Spot on Particle 23(10) 0 68(14) 3 3 2 <1 0 0
Polished VHP 25 run
Average 92(1) 0 6(1) 0 2 1 0 0 0
Spot on Matrix 93(1) 0 5(0) 0 1 1 0 0 0
Spot on Particle 23(9) 0 68(12) 5 1 3 1 0 0
Polished 168h Dip
Average 91(1) 0 6(1) <1 1 1 0 0 <1
Spot on Matrix 93(1) 0 5(0) <1 1 1 0 <1 0
Spot on Particle 40(9) 0 48(12) 3 6 2 1 0 0
Polish-Etched
Average 92(1) 0 6(1) <1 1 1 0 <1 <1
Spot on Matrix 93(1) 0 5(1) <1 1 1 0 <1 <1
Spot on Particle 88(6) <1 9(5) 1 2 1 0 <1 <1

114
Table VII. Nominal chemical compositions [141] and chemical compositions obtained
experimentally using EDS analysis for 7075-T6 aluminum alloy, wt.%. Standard deviations (5 samples), given for elements of interest only, are in parenthesis.
Al Cr Cu Fe Mg Mn Si Ti Zn
Nominal Bal. 0.18-
0.28 1.2-2 0.5
2.1-
2.9 0.3 0.4 0.2
5.1-
6.1
As-received 89(0) <1 2(0) <1 3 0 0 0 6(0)
As-polished
Average 89(1) <1 2(0) <1 2 0 0 <1 6(0)
Spot on Matrix 89(0) <1 2(0) <1 3 0 0 <1 6(0)
Spot on Particle 47(5) 3 15(10) 28 <1 <1 2 0 5(2)
Polished VHP 25 run
Average 89(1) 0 2(1) 0 2 0 0 0 6(0)
Spot on Matrix 89(1) 0 2(0) 0 2 0 0 0 7(1)
Spot on Particle 46(3) 3 16(13) 27 0 1 2 0 5(1)
Polished 168h Dip
Average 89(0) <1 2(0) <1 2 0 0 <1 7(0)
Spot on Matrix 89(0) <1 2(0) <1 2 0 0 <1 7(0)
Spot on Particle 47(6) 3 12(7) 31 0 <1 1 0 5(4)
Polish-Etched
Average 88(0) <1 2(0) <1 2 <1 0 <1 7(0)
Spot on Matrix 89(0) <1 2(0) <1 2 0 0 <1 7(0)
Spot on Particle 88(0) <1 2(0) <1 2 0 0 <1 7(0)

115
Table VIII. Nominal chemical compositions [151] and chemical compositions obtained
experimentally using EDS analysis for austenitic stainless steel 304, wt.%. Standard deviations (5 samples) of all the large composition elements are below 0.5.
C Co Cr Fe Mn Mo N Nb Ni P S Si
Nominal 0.08 0 18-
20 Bal 2 0 0.1 0
8-
10.
5
0.045 0.03 0.75
As-received 0 1 18 71 1 <1 0 0 8 0 <1 <1
As-polished
Average 0 1 17 71 2 0 0 0 9 0 0 0
Spot 0 1 17 71 2 0 0 0 9 0 0 0
Polished VHP 25 run
Average 0 <1 17 71 2 0 0 0 9 0 0 0
Spot 0 <1 17 71 2 <1 0 0 9 0 0 0
Polished 168h Dip
Average 0 <1 17 71 2 <1 0 0 9 0 0 0
Spot 0 1 17 71 2 0 0 0 9 0 0 0
Polish-Etched
Average 1 1 20 68 1 1 0 <1 6 <1 0 1
Spot 1 1 20 68 1 1 0 <1 6 <1 0 1

116
5.2.2 Effect of Decontamination on Weight Change and Surface Roughness
Figure 17 shows the graphs of surface roughness of the materials after dip testing
at two different temperatures (a) and surface roughness of the materials after VHP
exposure and dip testing (b). As can be seen in Figure 17 (a), statistically there was no
significant difference between dip testing at room temperature (22oC) and under
refrigeration (-2oC). These two treatments at different temperatures were performed to
find the effect of temperature on the decontamination. As has been mentioned in the
previous section, at room temperature hydrogen peroxide would be relatively unstable
and the reaction with metallic samples should be relatively rapid, while at lower
temperature hydrogen peroxide would be relatively stable and the reaction with metallic
samples would be slower. Technically, the treatments are also important in terms of
environmental conditions. The initial ambient conditions, Alaska in the winter versus
Florida in the summer, for example, could be important because the decontamination
process might give different effects on the same aircraft structural materials.
At room temperature, no significant difference was observed for the surface
roughness before and after treatments for both dip testing and VHP exposure; however,
as can be seen from the surface roughness graph in Figure 17 (b), the 2024-T3 aluminum
alloy surface roughness tends to decrease. This material also exhibits the largest weight
change among the three metal alloys, as can be seen in Figure 18 (a). The change in
surface roughness was interesting to note in its relation to the previous works on the
attachment of Listeria monocytogenes to the austenitic stainless steel 304, which have
shown that surface roughness at some point affected the way bacteria attached to the

117
surface. Thus, in its relation to the decontamination, there was a concerned that it could
conceivably affect the decontamination process as well [47-48].
Figure 18 shows the graph of weight change of the materials after exposure and
dip testing (a) and intermetallic coarse particle size data change for 2024-T3 and 7075-T6
aluminum alloys after dip testing (b). The horizontal lines on the weight change graph in
Figure 18 (a) show the limit of measurable percentage weight changes for combination of
balance and sample employed. In the case of liquid hydrogen peroxide dip testing, very
small amount of changes were observed but there was no significant difference observed
between single VHP exposure (4.8 hours) and 24 hours dip testing. There was also no
significant difference observed between refrigeration temperature (-2oC) and room
temperature (22oC); however, there was a significant difference observed between 24
hours dip-testing and 168 hours dip testing. For the 2024-T3 and 7075-T6 aluminum
alloys, some weight loss was observed following dip testing to the liquid hydrogen
peroxide as can be seen in Figure 18 (a). This weight loss, even it was very minor about
0.04% macroscopically, might be able to explain the change in large intermetallic
particles size as can be seen in Figure 18 (b). Figure 19 shows particle size distribution
for 2024-T3 (a) and 7075-T6 (b) aluminum alloys before and after dip testing. As can be
seen from the figures, there is an indication that the coarse particle size indeed has
changed with the shifting of Feret diameter to the left after the dip testing. Furthermore, it
would be much clearer if this weight loss is also correlated with the surface chemical
compositional change of large intermetallic particle containing copper as has been
mentioned previously.

118
Different from the liquid hydrogen peroxide testing, which dissolved some of the
elements from the surface, in the case of VHP exposure, the situation appears to be a little
more complicated. As can be seen in Figure 18 (a), multiple cycles of VHP exposures
result in a small weight gain around 0.01% and 0.02% for 2024-T3 and 7075-T6
aluminum alloys respectively. The increase on this weight change seems to indicate a
limited amount of oxidation on the surface of aluminum alloys by the vapor of hydrogen
peroxide. However, the oxidation product could not be confirmed under SEM; it may be
still too thin to observe within the limit of SEM and so the validity of this indication is
still uncertain at the present time. On the contrary, unlike multiple VHP cycles, a single
VHP run results in a very small (< 0.01%) weight loss but statistically was insignificant.
For the austenitic stainless steel 304, almost no weight change was observed for the VHP
exposure; however, a very small (< 0.01%) and insignificant weight loss after 168 hours
dip testing was also observed.

119
Figure 17–Surface roughness of the materials after dip testing at two different
temperatures (a) and after VHP exposure and dip testing at room temperature (b). The error bar for each of the graphs shows the standard deviations from 5 samples.
0
50
100
150
200
250
300
350
400
2024-T3 7075-T6 SS-304
Su
rfa
ce
ro
ug
hn
es
s, R
a(n
m)
Materials
0h
24h Dip -2C
24h Dip 22C
168h Dip -2C
168h Dip 22C
0
50
100
150
200
250
300
350
400
2024-T3 7075-T6 SS-304
Su
rfa
ce
ro
ug
hn
es
s, R
a(n
m)
Materials
0h
1 run VHP
10 run VHP
25 run VHP
24h Dip
168h Dip
b
a

120
Figure 18–Weight change of the materials after exposure and dip testing (a) and coarse
particle size data change for 2024-T3 and 7075-T6 aluminum alloys after dip testing (b).
The horizontal lines on the weight change graph show the limit of measurable percentage
weight changes for combination of balance and sample employed.The error bar for each
of the graphs shows the standard deviations from 5 samples.
-1.0
-0.8
-0.6
-0.4
-0.2
0.0
0.2
0.4
0.6
2024-T3 7075-T6 SS-304
We
igh
t C
ha
ng
e (
g/m
2)
Materials
1 run VHP
10 run VHP
25 run VHP
24h Dip
168h Dip
0
1
2
3
4
5
6
7
8
9
2024-T3 7075-T6
Pa
rtic
le s
ize
de
cre
as
e (
%)
Materials
24h Dip
168h Dip
b
a

121
Figure 19–Particle size distribution of 2024-T3 aluminum alloy (a) and 7075-T6
aluminum alloy (b) before and after dip testing.
0
500
1000
1500
2000
2500
3000
3500
0.5 1 1.5 2 2.5 3 3.5 4 4.5 5 5.5 6 6.5 7 7.5 8 8.5 9 9.5 10 10.5
Nu
mb
er
of
pa
rtic
le (
mm
-2)
Feret diameter (m)
0h
24h Dip
168h Dip
0
200
400
600
800
1000
1200
1400
1600
1800
0.5 1 1.5 2 2.5 3 3.5 4 4.5 5 5.5 6 6.5 7 7.5 8 8.5 9 9.5 10 10.5
Nu
mb
er
of
pa
rtic
le (
mm
-2)
Feret diameter (m)
0h
24h Dip
168h Dip
b
a

122
5.2.3 Effect of Decontamination on Surface Microstructural Change
Figure 20 shows light microscopy images of 2024-T3 aluminum alloy (top),
7075-T6 aluminum alloy (middle), and austenitic stainless steel 304 (bottom). Left to
right is as-received, as-polished, and polish-etched, respectively. These figures are shown
as a reference for the microstructure of the materials after treatments. Secondary electron
images of the microstructure can be seen in Figure 21 that shows microstructures of the
materials before and after dip testing; 2024-T3 aluminum alloy (above), 7075-T6
aluminum alloy (middle), and austenitic stainless steel 304 (below). Left to right is as-
polished, dip testing for 24 hours, and 168 hours respectively. No surface microstructural
changes, including grain boundaries, were apparent after VHP exposure or liquid
hydrogen peroxide dip testing as can be seen in Figure 22 and Figure 23; but small
change in particle size from intermetallic containing copper were observed after dip
testing around 2.5-6% and 2-2.5% for 2024-T3 and 7075-T6, respectively, as can be seen
in Figure 18 (b) and representative SEM pictures in Figure 23. It needs to be mentioned,
however, the particles in consideration encompass only the coarse insoluble particles that
have the range size from ~ 1 – 10 µm.

123
Figure 20–Light microscopy images of 2024-T3 aluminum alloy (top), 7075-T6
aluminum alloy (middle), and SS-304 (bottom). Left to right is as-received, as-polished, and polish-etched materials respectively.

124
Figure 21–Secondary electron images of 2024-T3 aluminum alloy (above), 7075-T6
aluminum alloy (middle), and SS-304 (below). Left to right is as-polished, dip testing for 24 hours, and 168 hours respectively.

125
Figure 22–Secondary electron images of intermetallic particles on the surface of 2024-T3
aluminum alloy (top) and 7075-T6 aluminum alloy (bottom) after VHP exposure. Left to right is as-polished, 10-cycle, and 25-cycle respectively.

126
Figure 23–Secondary electron images of intermetallic particles on the surface of 2024-T3
aluminum alloy (top) and 7075-T6 aluminum alloy (bottom) after dip testing. Left to right is as-polished, dip testing for 24 hours, and 168 hours respectively.

127
5.2.4 Effect of Decontamination on Mechanical Properties
5.2.4.1 Microhardness and Nanohardness Testing
Figure 24 shows graphs of Vicker’s microhardness (a) and nanohardness from
nanoindentation (b) of the materials before and after treatments of VHP exposure and
liquid hydrogen peroxide dip testing. No significant difference was found for all of the
materials; however, compared to the as-received specimen, there was a consistent
decrease of hardness after dip testing observed for 2024-T3 aluminum alloy from both of
the testing, but not after the VHP exposure. As can be seen from the microhardness data
in Figure 24 (a), there is no apparent trend towards surface softening observed after both
VHP exposure and dip testing for 7075-T6 aluminum alloy despite the fact that there was
also a loss of some copper from coarse intermetallics particles on the surfaces of this
material as has been mentioned in the previous part. Softening on the surface of the
austenitic stainless steel 304 material was also not observed in the microhardness
measurements.
In the case of nanohardness, nanoindentation testing suggested that there may be
some softening on the exposed surface for 2024-T3 after dip testing as can be seen in
Figure 24 (b). In this case, dissolution of copper on the surface after dip testing seems to
affect the hardness very close to the surface of this 2024-T3 aluminum alloy. On the
contrary, since the main alloying element in 7075-T6 aluminum alloy is zinc, which was
not affected by the dip testing, it would be reasonable to say that the hardness of this
7075-T6 aluminum alloy would not be significantly affected. Furthermore, since the
strength of material is usually dominated by the fine intermetallics particle produced by
age hardening, it would be unsurprising that even some loss of copper from

128
intermetmallic coarse particles occurred; the softening close to the surface after dip
testing was insignificant. For the austenitic stainless steel 304, given the corrosion
resistance and high strength of this material, there was almost no effect of the dip testing
to the surface hardness of this material.

129
Figure 24–Vicker’s microhardness (a) and nano indentation (b) of the materials before
and after exposure. The error bar for each of the bar graphs shows the standard deviations from 5 samples.
100
110
120
130
140
150
160
170
180
190
2024-T3 7075-T6 SS-304
Vic
ke
r's
Mic
roh
ard
ne
ss
Materials
0h
1 run VHP
10 run VHP
25 run VHP
24h Dip
168h Dip
0
100
200
300
400
2024-T3 7075-T6 SS-304
Ha
rdn
es
s (H
V)
Materials
0h 1 run VHP 10 run VHP
25 run VHP 24h Dip 168h Dip
b
a

130
5.2.4.2 Tensile Testing
Figure 25, Figure 26, and Figure 27 show 0.2% offset yield stress, ultimate tensile
strength, and elongation to failure of longitudinal (a) and transversal (b) directions,
respectively, of tensile test specimens before and after treatments of VHP exposure and
dip testing on the 2024-T3 and -T6, 7075-T6, and austenitic stainless steel 304. Statistical
results showed that there were no significant differences between the treatments and the
un-exposed material for both the aluminum alloys and austenitic stainless steel 304. As
can be seen from the figures, there was no pattern, systematic effect of exposure by
increasing severity from single VHP exposure up to 168 hour of dip testing on the tensile
properties of any of the materials under the condition examined.
If this result is correlated to the hardness, in which there was some effect on the
hardness very close to the surface of 2024-T3 after dip testing; however, since the
influence was only in the vicinity very close to the surface area, it would be unsurprising
that there was no effect of the liquid hydrogen peroxide dip testing on the tensile
properties, given the result of tensile properties would be dominated by the total load of
the cross section. It would be also unsurprising that the highly ductile, corrosion resistant
austenitic stainless steel 304 was also unaffected by either VHP exposure or liquid
hydrogen peroxide dip testing on its tensile properties.
As has been mentioned in the previous section, to ascertain the effects of
composition versus heat treatment on the mechanical properties, some of the 2024-T3
aluminum alloy specimens were reheat-treated into 2024-T6 aluminum alloy. Results of
the tensile testing on this 2024-T6 aluminum alloy showed that both VHP exposure up to
25-cycle and liquid hydrogen peroxide dip testing up to 168 hours did not have any

131
appreciable effect on the 2024-T6 aluminum alloy. However, as can be seen in Figure 25
and Figure 26, reheat-treating of 2024-T3 into 2024-T6 lowered the ultimate tensile
strength of around 7% and 5% for longitudinal and transversal direction, respectively, but
increased yield stress of around 2% and 13% for longitudinal and transversal direction,
respectively. Elongation to failure also decreased around 46% and 49% for longitudinal
and transversal direction, respectively, as can be seen in Figure 27.

132
Figure 25–Charts are the 0.2% offset yield stress of the longitudinal (a) and transversal
(b) direction of the materials tensile specimens before and after exposure and dip testing.
The error bar for each of the bar graphs shows the standard deviations from 10 samples.
200
300
400
500
600
700
2024-T3 2024-T6 7075-T6 SS-304
0.2
% O
ffs
et
Yie
ld S
tre
ss
(M
Pa
)
Materials
L Direction
0h 1 run VHP
10 run VHP 25 run VHP
24h Dip 168h Dip
200
300
400
500
600
700
2024-T3 2024-T6 7075-T6 SS-304
0.2
% O
ffs
et
Yie
ld S
tre
ss
(M
Pa
)
Materials
T Direction
0h 1 run VHP
10 run VHP 25 run VHP
24h Dip 168h Dip
b
a

133
Figure 26–Charts are ultimate tensile strength of the longitudinal (a) and transversal (b)
direction of the materials tensile specimens before and after exposure and dip testing. The
error bar for each of the bar graphs shows the standard deviations from 10 samples.
200
300
400
500
600
700
2024-T3 2024-T6 7075-T6 SS-304
UT
S (M
Pa
)
Materials
L Direction
0h 1 run VHP
10 run VHP 25 run VHP
24h Dip 168h Dip
200
300
400
500
600
700
2024-T3 2024-T6 7075-T6 SS-304
UT
S (M
Pa
)
Materials
T Direction
0h 1 run VHP
10 run VHP 25 run VHP
24h Dip 168h Dip
b
a

134
Figure 27–Charts are elongation to failure of the longitudinal (a) and transversal (b)
direction of the materials tensile specimens before and after exposure and dip testing. The error bar for each of the bar graphs shows the standard deviations from 10 samples.
10
20
30
40
50
60
70
80
90
2024-T3 2024-T6 7075-T6 SS-304
Elo
ng
ati
on
to
Fa
ilu
re (
%)
Materials
L Direction
0h 1 run VHP
10 run VHP 25 run VHP
24h Dip 168h Dip
10
20
30
40
50
60
70
80
90
2024-T3 2024-T6 7075-T6 SS-304
Elo
ng
ati
on
to
Fa
ilu
re (
%)
Materials
T Direction
0h 1 run VHP
10 run VHP 25 run VHP
24h Dip 168h Dip
b
a

135
Secondary electron images of 2024-T3 aluminum alloy, 7075-T6 aluminum alloy,
and austenitic stainless steel 304 in the longitudinal direction after tensile testing are
given in Figure 28, Figure 29, and Figure 30 respectively. From each of the figure, top
figures are machined sides; middle figures are plan-edge close to the fracture surface; and
fracture surfaces are on the bottom. Left to right are the as-received, 25-cycle of VHP
exposure, and 168 hours of dip testing, respectively. In a thin body, such as used in the
aircraft fuselage, a condition of plane stress is much more dominant than plane strain
condition. In this case, the stress through the thickness cannot vary appreciably as
compared to a thick body, where the material is constraint due to the thickness resulting
in a plane strain condition. Because of that, in a thin specimen, the state of stress tends to
biaxial and the material fractures in a characteristic ductile manner, with a 45o shear lip
being formed at each free surface [207].
For 2024-T3 aluminum alloy, as can be seen from the machined sides of the
tensile specimens (top part in Figure 28), more cleavage cracks are observed the more
severe the treatments from the as-received up to 168 hours of dip testing. Crack
developments are also apparent on the plan-edge surfaces of the tensile specimens.
However, as can be seen from the 0.2% yield stress and ultimate tensile strength in
Figure 25 and Figure 26, both in longitudinal and transversal direction, there was no
evident that this crack development had any effect on the mechanical properties. For the
7075-T6 aluminum alloy, as can be seen in Figure 29, like what has been found in 2024-
T3 aluminum alloy, shows only a moderate ductility; however there was no trend in the
crack development. Austenitic stainless steel 304, as can be seen in Figure 30 in both
machined side and plan-edge, shows a classic ductile elongation of failure as expected.

136
On the fracture surfaces, as can be seen on the bottom part of Figure 28 and
Figure 29, both 2024-T3 and 7075-T6 aluminum alloys showed porosity with fairly
ductile fracture; however, there was not much difference that can be observed among the
samples before and after treatments. Despite the fact that crack propagation of 2024-T3
aluminum alloy was observed on the machined side as mentioned previously, there was
no indication that either VHP exposure or liquid hydrogen peroxide dip testing had an
effect on this propagation of failure. The fracture surface of the austenitic stainless steel
304, as can be seen in the bottom part of Figure 30, again shows a classic ductile fracture
as expected.
In terms of overall effects of decontamination, and thus the effect of hydrogen
peroxide as a decontaminant agent, on the properties of aircraft metallic structural
materials, results of the testing in general are promising. Most of the results under the
condition examined including microstructure and mechanical properties, even under the
most severe circumstances that could occur; in this case prolonged dip testing to the
liquid concentrated hydrogen peroxide up to 168 hours, showed that only very limited
damage was observed. However, as has been mentioned previously, even very small
damage, with combination of fatigue and corrosion attack could result in catastrophic
failure. In addition, it needs to be noted that the range of materials examined is still
inadequate to cover all of complex aircraft structural materials. Thus, further work is
needed as can be read in detail in section 7, “Suggestions for Future Work”.
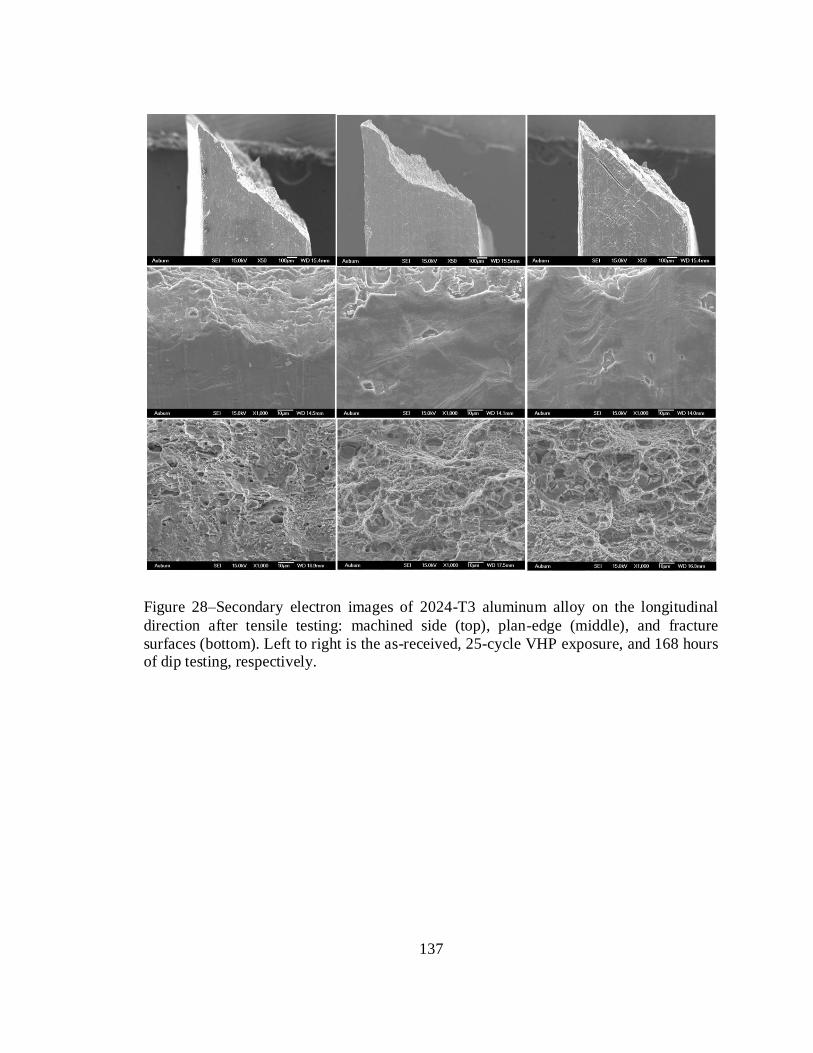
137
Figure 28–Secondary electron images of 2024-T3 aluminum alloy on the longitudinal
direction after tensile testing: machined side (top), plan-edge (middle), and fracture
surfaces (bottom). Left to right is the as-received, 25-cycle VHP exposure, and 168 hours of dip testing, respectively.

138
Figure 29–Secondary electron images of 7075-T6 aluminum alloy on the longitudinal
direction after tensile testing: machined side (top), plan-edge (middle), and fracture
surfaces (bottom). Left to right is the as-received, 25-cycle VHP exposure, and 168 hours of dip testing, respectively.

139
Figure 30–Secondary electron images of austenitic stainless steel 304 on the longitudinal
direction after tensile testing: machined side (top), plan-edge (middle), and fracture
surfaces (bottom). Left to right is the as-received (a), 25-cycle VHP run (b), and 168
hours of dip testing (c), respectively.

140
5.3 Copper Dissolution in Hydrogen Peroxide
In this work, copper dissolution was assessed by using powder method, in which
copper powder particle was dissolved into 35% hydrogen peroxide. For the rate
modeling, the cube-root model [180-184], which is also called the surface reaction
control shrinking core model [185-188], was adopted. As has been mentioned previously,
reaction of copper and hydrogen peroxide is basically an oxidative reaction. In the
following discussion, the effect of stirring speed and temperature on copper dissolution
into hydrogen peroxide is based on this reaction. In order to use the cube-root model, the
following assumptions were made:
1. There will be Cu+ and/or Cu
2+ in the solution, however these two ions are not
differentiated; i.e. the concentration measured is the total concentration of these two
ions.
2. Owing to the slight amount of the copper dissolved, the surface geometrical change of
the particles was considered to be negligible.
3. The concentration was assumed to be uniform or homogeneous throughout the
solution. Because the reaction involves powder particles, it is also assumed that the
rate of dissolution of powder particles at the particle surface as the controlling step;
the dissolution is therefore proportional to the instantaneous surface area.
As has been mentioned previously, the straight forward cube-root law can be
applied when the powder suspension disperse homogeneously in the solution, in this
regard plot of 1– (1– [C]t/[C])1/3
vs. t will be linear with a gradient of k/(r0ρ), see again
Equation 14. In this equation, k is the apparent dissolution rate constant. Activation

141
energy for the dissolution of copper can be derived from Arrhenius relation, see again
Equation 15. In this regard, activation energy is determined by plotting ln k vs. 1/T.
5.3.1 Effect of Stirring
The effect of stirring speed on the copper dissolution was performed in 35%
hydrogen peroxide. There were three different stirring speeds and a control, i.e. 250, 550,
and 1100 rpm for the maximum time of 3 hours. However, as can be seen in Figure 31,
the fraction of copper dissolved becomes constant after one hour of reaction time. At this
point, it is suspected that the dissolution process has been limited by the formation of
copper hydroxide, which was observed through a precipitation after the solution settled
for some time. Because of that, the reactions shown were only for that of maximum time
of 60 minutes. Even in the 60 minutes of dissolution time, the fraction of copper
dissolved tends to increase with the increase of stirring speed is only of up to about 15
minutes of the reaction time. After this time, the fraction of copper dissolved becomes
constant. However, because the final consumption of hydrogen peroxide was not
controlled, the exact reason for this constant dissolution cannot be determined at this
time. The variation of 1 – (1 – X)1/3
, where X represents the fraction of copper dissolved,
in this case [C]t/[C] as in Equation 14, with time for various copper dissolution at
different stirring speeds is given in Figure 33. Slope of the lines in this variation will be
the apparent rate constants of the copper dissolution at different stirring speeds.
The apparent activation energy was determined by carrying out the dissolution at
different time and temperature. To reduce the variability in the temperature effect, the

142
subsequent experiments were carried out without mechanical stirring, except at the
beginning of reaction for particle suspension homogenization purpose.
5.3.2 Effect of Temperature
As has been mentioned previously, on the effect of temperature, the reaction was
performed statically, i.e. no mechanical stirring, except at the beginning of the reaction
for the purpose of homogenization of the particle suspension. The rate of copper
dissolution by hydrogen peroxide was determined by carrying out the reactions at 5
different temperatures: 283, 293, 303, 313, and 323 K for 3 hours. However, as for the
effect of stirring, after one hour of reaction time, the fraction of copper dissolved became
constant. Because of that, the reactions showed were only for that of maximum time of
60 minutes. Even in 60 minutes of dissolution time, as can be seen in Figure 32, the
fraction of copper dissolved increases with the increase of temperature is only of up to
about 15 minutes of the reaction time, after then the fraction of copper dissolved becomes
constant. Hence, the activation energy determination from Arrhenius plot was based on
the fraction of copper dissolved for the reaction time of up to 15 minutes only.
The variation of 1 – (1 – X)1/3
, where X represents the fraction of copper
dissolved, in this case [C]t/[C] as in Equation 14, with time for various copper
dissolution temperatures is shown in Figure 34. Slope of the lines in this variation will be
the apparent rate constant of the copper dissolution. The apparent rate constants obtained
from these slopes were then used in Arrhenius equation (Equation 15) to determine the
apparent activation energy of 19 kJ/mol as can be seen in Figure 35. The activation
energy for copper dissolution in several media has been determined by several

143
investigators: about 5.6 kJ/mol in aqueous ammonia [208], 12.6-16.6 kJ/mol by acidified
iron in acetonitrile-water solutions [209], 18.4 kJ/mol in aqueous alkaline 2-2’-dipyridyl
solutions [210], 36.3 kJ/mol in acidic ferric sulfate solutions [211], 40 kJ/mol from
molybdenite concentrate by sodium dichromate leaching [212], and 54 kJ/mol in
monoethanolamine-complexed cupric ion solution [213]. Thus, it is clear that different
media solution gives different activation energy due to the change in the reaction
pathway [213]. A low value of activation energy, in the range of about 5 kJ up to 45 kJ, is
an indication that the mechanism is a diffusion controlled, while a value of activation
energy higher than 45 kJ is an indication that the mechanism is a chemical reaction-
controlled [187, 208-214]. Since the value of activation energy obtained in this work is in
the range of what have been obtained by others, it is assumed that similar dissolution
mechanism can be applied to the dissolution of copper into hydrogen peroxide, i.e.
diffusion-controlled.

144
Figure 31–Effect of stirring speed on the fraction of copper dissolved into 35% liquid
hydrogen peroxide.
0.0
0.5
1.0
1.5
2.0
2.5
3.0
3.5
0 10 20 30 40 50 60
Co
pp
er
fra
cti
on
dis
so
lve
d (
%)
Time (min)
1100 rpm
550 rpm
250 rpm
No Stirring

145
Figure 32–Effect of temperature in the range of 283-323 K on the fraction of copper
dissolved into 35% liquid hydrogen peroxide.
0.0
0.5
1.0
1.5
2.0
2.5
3.0
3.5
0 10 20 30 40 50 60
Co
pp
er
fra
cti
on
dis
so
lve
d (
%)
Time (min)
323 K
313 K
303 K
293 K
283 K

146
Figure 33–The variation of 1 – (1 – X)1/3
with time for various copper dissolution by 35%
liquid hydrogen peroxide at different stirring speeds. In this case, X represents [C]t/[C]
as in Equation 14.
0.0
0.2
0.4
0.6
0.8
1.0
1.2
0 5 10 15
1 -
(1-X
)1/3
x 1
00
Time (min)
1100 rpm
550 rpm
250 rpm
0 rpm

147
Figure 34–The variation of 1 – (1 – X)1/3
with time for various copper dissolution by 35%
liquid hydrogen peroxide at different temperatures. In this case, X represents [C]t/[C] as
in Equation 14.
0.0
0.1
0.2
0.3
0.4
0.5
0.6
0.7
0.8
0.9
1.0
0 5 10 15
1 -
(1-X
)1/3
x 1
00
Time (min)
323 K
313 K
303 K
293 K
283 K

148
Figure 35–Activation energy determined from Arrhenius plot of linear data for the time 0
– 15 minutes of reaction.
Q = 19 kJ/mol
-12.6
-12.4
-12.2
-12.0
-11.8
-11.6
-11.4
-11.2
-11.0
3.1 3.2 3.3 3.4 3.5
ln k
1000 x 1/T

149
As a comparison, dissolution of metal from a copper plate into the hydrogen
peroxide solution at different time and temperature also has been performed. This
experiment was performed statically by adopting an empirical theory [172] due to the
unavailability of the equipment needed to run the rotating disk experiment. Fraction of
copper plate dissolved into 35% liquid hydrogen peroxide as function of reaction time is
shown in Figure 36. As can be seen from the figure, the fraction of copper dissolved from
the copper plate is much lower compared to that from powder particles due to the smaller
surface area. The activation energy calculated using an empirical theory, see Equation 5,
gives a value of 8.6 kJ/mol as can be seen in Figure 37. However, as has been pointed out
in the previous section, the value calculated by using this method cannot be confirmed
because other factors, such as the diffusion layer thickness and kinematic viscosity,
which would affect the diffusivity, was not included in the calculation.
For the two aluminum alloy plates of 2024-T3 and 7075-T6, as opposed to the
copper powder, the data obtained was inconsistent. This inconsistency was expected to be
due to the small area of the bulk specimens, inhomogeneity of copper distribution on the
specimen surfaces, and/or small amount of copper content within the alloys. It would
have been helpful if those two aluminum alloy samples were also in the form of powder
so the surface area to the volume ratio would be large. Since there was no aluminum
alloy material powders available, while the equipment setup for the rotating disk was not
available, for the time being the data was just discarded. However, in its relation to the
decontamination process, it seems that copper leaching during the aluminum alloys dip
testing in the concentrated liquid hydrogen peroxide is supported by this result.
Nonetheless, cyclic voltammetry test on 2024-T3 and 7075-T6 aluminum alloys in 0.1 M

150
NaCl after dip testing in 35% liquid hydrogen peroxide for up to 120 hours by Gale et.al
[83] has shown that the impact of subsequent corrosion on aluminum alloys was
insignificant.

151
Figure 36–Fraction of copper plate dissolved into 35% liquid hydrogen peroxide as
function of reaction time.
0.0
0.2
0.4
0.6
0.8
1.0
1.2
1.4
0 24 48 72 96 120 144 168
Co
pp
er
fra
cti
on
dis
so
lve
d (
%)
Time (hour)
303 K
293 K
283 K

152
Figure 37– Activation energy of copper plate dissolution into 35% liquid hydrogen
peroxide determined from empirical theory.
Q = 8.6 kJ/mol
-21.9
-21.8
-21.7
-21.6
-21.5
3.3 3.4 3.5
ln k
1000 x 1/T

153
6. CONCLUSIONS
From what have been discussed previously, the outcomes of this work are
summarized in the following.
6.1 Bacterial Attachment
1. The results from the first bacterial attachment work showed that surfaces of higher
roughness distributed the L. monocytogenes suspension over larger area than the
surface of lower roughness and the overall wettability of the surfaces appeared to be a
primary determinant of the bacterial attachment results. The results also indicated that
welding of austenitic stainless steel 304 followed by mirror polishing does not affect
the ability of L. monocytogenes to attach to the surface under the conditions
examined; however, corrosion of the welded stainless steels does promote the
attachment of L. monocytogenes with the largest effect occurring in the HAZ. In its
relation to the decontamination process, the more the spreading of bacteria over a
surface, the more it likely prevents or at least affects the decontamination process.
The results also indicated that corrosion site, especially on the austenitic stainless
steel 304 welded joining and its surrounding HAZ should need more attention
because it could become a source or a harborage after either incident or intentional
release of bio-contaminant agents.

154
2. On the second work of bacterial attachment, the results showed that when the contact
angle of a liquid on a surface increased to a certain degree, detachment of bacteria on
that surface was observed to become more difficult resulting in more bacterial
attachment occurred on surfaces with lower wettability and higher contact angle. This
result might indicate that other factors, such as an optimum value for a surface
roughness and contact angle or rate of spreading, need to be considered. In its relation
to the decontamination, the major finding of this second work is that polishing an
austenitic stainless steel 304 surface to a mirror finish, which would influence contact
angle and rate of spreading, may give rise to more adhesion of bacteria on the surface.
Thereby, it might take more time to decontaminate bio-contaminant on that type of
surface finish compared to other certain type of surface finish. On the other hand, this
mirror finish surface might give impact on decontamination process or any given
decontamination setup by reducing the ability of decontamination treatments to
remove or inactivate attached cells.
6.2 Effect of Decontamination on Materials Properties
On the effect of decontamination, and thus the effect of hydrogen peroxide, on the
aircraft metallic structural materials properties of 2024-T3 and 7075 T-6 aluminum alloys
and austenitic stainless steel 304, as used in galley and lavatory surfaces, the following
conclusions are drawn:
1. There was no effect of vaporized hydrogen peroxide on the surface chemical
composition change of all aircraft metallic materials examined up to 25 cycles of
decontamination process. There was also no effect of concentrated liquid hydrogen
peroxide tested up to 7 days on the surface chemical composition change of austenitic

155
stainless steel 304 and 7075-T6 aluminum alloy; however a significant effect on the
surface chemical composition change of large intermetallic particles containing
copper was found on 2024-T3 aluminum alloy. This compositional change indicates
that copper is leached selectively from coarse intermetallic particles in 2024-T3
aluminum alloy.
2. A small but measurable weight loss occurred on the exposure of the two aluminum
alloys to the concentrate liquid hydrogen peroxide. This weight loss indicates that
some leaching occurs during the dip testing. On the contrary, repeated exposure to the
vaporized hydrogen peroxide produced a small weight gain. This weight gain seems
to indicate a limited amount of oxidation on the surface of aluminum alloys by the
vapor of hydrogen peroxide.
3. There was no significant effect of both liquid and vaporized hydrogen peroxide on the
microhardness and nanohardness of all of aircraft metallic materials; however, little
effect was found on the nanohardness of 2024-T3 aluminum alloy after dip testing.
This effect might indicate that there was a tendency towards surface softening very
slightly after liquid hydrogen peroxide dip testing but was only confined to the
immediate vicinity of the 2024-T3 aluminum alloy surface.
4. There was no significant effect of vaporized hydrogen peroxide exposure on the
microstructure and mechanical properties of all of the metallic airliner materials
examined up to 25 cycles of decontamination process. There was also no significant
effect of concentrated liquid hydrogen peroxide tested up to 7 days on the
microstructure and mechanical properties of austenitic stainless steel 304; however,
little effect on the second phase particles containing copper was found on the 2024-

156
T3 and 7075-T6 aluminum alloys. This negligible effect seems to support copper
leaching during the dip testing; however, there was no immediate loss or degradation
in the materials properties and hence performance of all of aircraft metallic materials
under the conditions examined.
5. In terms of overall effects of decontamination, and thus the effect of hydrogen
peroxide as a decontaminant on the properties of aircraft metallic structural materials,
the results of the testing in general are promising. These are included microstructure
and mechanical properties tested under the most severe circumstances that could
occur; in this case prolonged dip testing to the liquid concentrated hydrogen peroxide
up to 168 hours. Most of the results under the conditions examined showed that only
very limited damage was observed.
6.3 Copper Dissolution in Hydrogen Peroxide
The results from copper dissolution into hydrogen peroxide are concluded in the
following:
1. The dissolution of copper into 35% liquid hydrogen peroxide occurs intensely only
for up to 15 minutes of reaction time with an apparent activation energy of 19 kJ/mol
during that stage of dissolution, after then the rate becomes constant due to the
formation of copper hydroxide, which was observed to precipitate after the solution
settled for some time.
2. In its relation to the decontamination process, it seems that copper leaching during the
aluminum alloys dip testing in concentrated liquid hydrogen peroxide is supported by
this result.

157
7. SUGGESTIONS FOR FUTURE WORK
The following suggestions are encourage to be performed for future expansion in
scope of the project and/or application of the work to other area:
7.1 Bacterial Attachment
1. In the first bacterial attachment work, the results have shown that the increases of
surface roughness plays a role on the decreases of the contact angle measurements of
the samples and thus in the increase of wettability over the surface. However, a direct
correlation between surface roughness and wettability cannot be precisely determined
in this work since a detailed statistical analysis of the correlation of surface roughness
to wettability was not included because the effect of surface roughness in this work
was basically due to the accelerated corrosion process, which would likely entail
other process as a result of the corrosion induced product(s). Thus, more investigation
is needed to fully determine the direct correlation between surface roughness and
wettability, independent of other factors associated with corrosion, for example
potential reduction in solid-vapor interfacial energy which may be induced by the
formation of corrosion products. This work can be used in support of the current
project and/or can also be applied to other areas such as the food industry.

158
2. In terms of solely surface roughness, the result of the second work on the bacterial
attachment does not fully agree with the previous assumption that the increase in the
surface roughness would increase the wettability. Thus, there might be an optimum
value for a surface roughness and contact angle and/or rate of spreading at which the
bacterial attachment would be minimized. The suggestion would be to perform work
to determine the optimum value for a surface roughness, wettability, contact angle,
and/or rate of spreading at which bacterial attachment is minimized. This can be
performed by employing different type and value of a surface roughness and then
evaluating the effect of contact angle and rate of spreading of a liquid on that surface
on the bacterial attachment.
7.2 Effect of Decontamination on Materials Properties
1. The present research actually does not yet address the predictions of effect of the
chemical used as the decontaminant agent on the aircraft’s flightworthiness.
However, what has been performed in the present work is a necessary precursor to
such predictions. Thus, the work on this prediction is suggested to be done to
accomplish all of the goals mentioned in the broader objectives of the research.
2. Establishment of life prediction after decontamination on the aircraft structural
materials would be desirable, especially to get a quantitative understanding on the
nature of decontamination process impact on the material properties. Hence, fatigue
testing is also needed, particularly to reveal subtle, incipient damage that could induce
subsequent degradation in the airliner structural materials performance.
3. Since the range of materials examined in this work is still inadequate to cover all of
complex aircraft structural materials, further work is still needed to cover more

159
aircraft materials such as composite materials, textiles and fabrics, and polymeric
materials. Some of these activities are being performed by others in the same research
group as of the date of writing.
7.3 Copper Dissolution in Hydrogen Peroxide
The result from copper dissolution showed that after 15 minutes of reaction, the
fraction of copper dissolved, became constant. This was expected to be due to the
formation of copper hydroxide, which was observed to precipitate after the solution
settled for some time. However, because the final consumption of hydrogen peroxide was
not controlled, the exact reason for this constant rate cannot be determined at this time.
Hence, the following suggestions need to be addressed:
1. The final consumption of hydrogen peroxide and real time copper concentration
needs to be controlled so the exact reason for the constant rate after 15 minutes of
reaction time can be confirmed. This can be done by using the combination of real
time hydrogen peroxide consumption and copper dissolution rate monitoring so the
rate and mechanism can be determined exactly.
2. Since it was hard to make a comparison between dissolution of pure copper powder
and dissolution of copper from 2024-T3 and 7075-T6 aluminum alloy plates due to
the specimen shape difference and small amount of copper concentration in the
aluminum alloys, it might be helpful if the comparison would have been started from
aluminum copper alloys with the same shape and controlled concentration. Hence, it
is suggested that this work would be also done in the near future so the comparison
can be justified.

160
REFERENCES
1. Bio Warfare, available online from http://library.thinkquest.org/27393/
tqtranslate.htm, accessed on June 7, 2005.
2. United Nations, Convention on the Prohibition of the Development, Production, and
Stockpiling of Bacteriological and Toxin Weapons and Their Destruction, 1972.
3. H.W. Herrmann, et al., Physics of Plasmas, 6 (1999) 2284-2289.
4. The Chemical/Biological Weapons Threat, available online from
http://usmilitary.about.com/od/weapons/a/chemwarfare_4.htm accessed on June 2,
2006.
5. E.A.S. Whitney, et al., Emerg. Infect. Dis., 9 (2003) 623-627.
6. U.S. State Department of State, Decontamination of Sterling Mail Facility,
available online at http://www.state.gov/r/pa/prs/ps/2002/15992.htm, accessed on
December 8, 2007.
7. S. Coll, Ghost Wars: The Secret History of the CIA, Afghanistan, and Bin Laden,
from the Soviet Invasion to September 10, 2001, Penguin Books, New York, 2004,
pp. 240-279.
8. Iraq gas attack makes hundreds ill, available online from http://www.cnn.com/2007/
WORLD/meast/03/17/iraq.main/index.html accessed on July 17, 2007.
9. B. Pfefferbaum, Lancet, 358 (2001) 940.
10. M. Mines, et al., Ophthalmology, 107 (2000) 837-843.
11. J.A. Davis, Accident Emerg. Nursing, 4 (1996) 59-64.
12. M. Varia, et al., Can. Med. Assoc. J., 169 (2003) 285-292.
13. A.A. Edler, J. Clin. Anesthesia, 18 (2006) 1-4.
14. J.C. de Jong, et al., Nature, 389 (1997) 554.

161
15. E.C.J. Claas, et al., Lancet, 351 (1998) 472-477.
16. A.D.M.E. Osterhaus, et al., Vaccine, 20 (2002) S82-S83.
17. K. Ungchusak, et al., N. Engl. J. Med., 352 (2005) 333-340.
18. WHO, Avian influenza – the latest situation in Indonesia – update 21,
http://www.who.int/csr/don/2006_07_04/en/index.html, accessed on July 4, 2006.
19. A.S. Ho, J.J.Y. Sung, and M. Chan-Yeung, Ann. Intern. Med., 139 (2003) 564-567.
20. Z. Zhao, et al., J. Med. Microbiol., 52 (2003) 715-720.
21. G. Gopalakrishna, et al., Emerg. Infect. Dis., 10 (2004) 395-400.
22. S.J. Twu, et al., Emerg. Infect. Dis., 9 (2003) 718-720.
23. L.D. Ha, et al., Emerg. Infect. Dis., 10 (2004) 265-268.
24. P.M. Hawkey, S. Bhagani, and S.H. Gillespie, J. Med. Microbiol., 52 (2003) 609-
613.
25. M. Varia, et al., Can. Med. Assoc. J., 169 (2003) 285-292.
26. T. Wong, et al., Emerg. Infect. Dis., 11 (2005) 322-325.
27. I.T.S Yu, et al., N. Engl. J. Med., 352 (2005) 333-340.
28. S.M. Poutanen, et al., N. Engl. J. Med., 348 (2003) 1995-2005.
29. WHO, Consensus document on the epidemiology of severe acute respiratory
syndrome (SARS). Available from: http://www.who.int/csr/sars/en/WHO
consensus.pdf, accessed on October 10, 2006.
30. A.H. Reid, J.K. Taubenberger, and T.G. Fanning, Microbes Infect., 3 (2001) 81-87.
31. J.K. Taubenberger, A.H. Reid, and T.G. Fanning, Virology, 274 (2000) 241-245.
32. J.K. Taubenberger and D.M. Morens, Emerg. Infect. Dis., 12 (2006) 1-2.
33. C.J. Luke and K. Subbarao, Emerg. Infect. Dis., 12 (2006) 66-72
34. J.K. Taubenberger and D.M. Morens, Emerg. Infect. Dis., 12 (2006) 15-22.
35. Greater New York Hospital Association (GNYHA), Nuclear, biological, and
chemical decontamination; in Joint Commission Perspectives, 21 (2001) 20-21.

162
36. T.H.G. Megson, Aircraft Structures, 3rd
Ed., Butterworth-Heinemann, Burlington,
MA, 2003, pp. 211-232.
37. A. Baker, S. Dutton, and D. Kelly, Composite Materials for Aircraft Structures,
American Institute of Aeronautics and Astronautics, New York, NY 2004, pp. 1-2.
38. H.M. Lappin-Scott, C. Bass, Am. J. Infect. Control, 29 (2001) 250-251.
39. International Air Transport Association (IATA), General Guidelines for Cleaning
Crew, available online at http://www.iata.org/nr/rdonlyres/23ea32b7-ec3e-4eed-
b4fa-efd7c07b58bc/0/guidelines_cleaning_crew_112006.pdf, accessed October 2,
2007.
40. E.A. Zottola and K. C. Sasahara, Int. J. Food Microbiol., 23 (1994) 125–148.
41. A.S. Gordon, F.J. Millero, Appl. Microbiol., 47 (1984) 495-499.
42. E. Sinde and J. Carballo, Food Microbiol., 17 (2000) 439–447.
43. J.W. Arnold and S. Silvers, Poultry Sci., 79 (2000) 1215 – 1221.
44. K. Bidle, H.H. Wickman, and M. Fletcher, J. General Microbiol., 139 (1993) 1891-
1897.
45. L.K. Ista, et al., FEMS Microbiol. Let., 142 (1996) 59-63.
46. C. Tide, et al., J. Food Eng., 42 (1999) 85–96.
47. T.L. Mai, et al., J. Food Prot., 69 (2006) 1527-1532.
48. N.I. Sofyan, et al., Food Prot. Trend, 26 (2006) 926-929.
49. F.W. Hyde, M. Alberg, and K. Smith., J. Ind. Microbiol. Biotech., 19 (1997) 142-
149.
50. S. McEldowney and M. Fletcher, App. Environ. Microbiol., 52 (1986) 460-465.
51. M. Al-Ahmed, et al., Desalination, 132 (2000) 173-179.
52. D.R. Oliveira, in L.F. Melo, et al. (Eds), Biofilm–Science and Technology, Kluwer
Academic Publisher, Durdrecht, the Netherlands, 1992, pp. 45-58.
53. S.H. Flint, J. D. Brooks, and P. J. Bremer, J. Appl. Microbiol., 83 (1997) 508-517.
54. M.S. Lou, J.C. Chen, and C.M. Li, J. Ind. Technol., 15 (1998) 1-6.

163
55. R.F. Anastasi and E.I. Madaras, The 4th
International Workshop on Ultrasonic and
Advanced Methods for Nondestructive Testing and Material Characterization, June
19, N. Dartmouth, MA, 2006, pp. 57-62.
56. Surface Metrology Guide – Profile Parameters, available online at
http://www.predev.com/smg/parameters.htm, accessed on August 19, 2004.
57. J.W. Arnold, D.H. Boothe, and G.W. Bailey, Trans. ASAE, 44 (2001) 347-356.
58. US Environmental Protection Agency, Terms of Environment: Glossary,
Abbreviations and Acronyms, available online at
www.epa.gov/OCEPAterms/wterms.html, accessed 09/13/07.
59. W.F. Gale and D.A. Butts, Sci. Technol. Welding and Joining, 9 (2004) 283-300.
60. J.W. Gibbs, On the Equilibrium of Heterogeneous Substances, 1876, reprinted in
The Scientific Papers of J. Willard Gibbs, Vol. 1: Thermodynamics, Longmans,
Green & Co., London, 1906.
61. T. Young, Philos. Trans. Roy. Soc., 95 (1805) 65–87.
62. G.R. Lester, J. Colloid Sci., 16 (1961) 315-326.
63. W.A. Zisman, Adv. Chem. Ser., 43 (1963) 1-51.
64. I.A. Aksay, C.E. Hoge, and J.A. Pask, J. Phys. Chem, 78 (1974) 1178-1183.
65. V. Roucoules, et al., in K. L. Mittal (Ed.), Contact angle, Wettability, and
Adhesion, Vol. 2. VSP International Science Publishers, Utrecht, The Netherlands,
2002, pp. 387–402.
66. R.N. Wenzel, Ind. Eng. Chem., 28 (1936) 988-994.
67. R.E. Johnson, Jr. and R.H. Dettre, Adv. Chem. Ser., 43 (1963) 112-135.
68. R.H. Dettre and R.E. Johnson, Jr., Adv. Chem. Ser., 43 (1963) 136-144.
69. J.V. Rogers, et al., Environmental Technology Verification Report: CLARUS C
Hydrogen Peroxide Generator, Battelle, Columbus, OH, 2004.
70. C. Chamberland, J. de Médecine, de Chirurgie et de Pharmacologie, 67 (1879) 61-
62.
71. STERIS® Corp., Steris VHP Generator Operator Training Program.
72. R.J.W. Lambert, in A.P. Fraise, P.A. Lambert, and J.-Y.Maillard (Eds), Russell,
Hugo & Ayliffe's Principles and Practice of Disinfection, Preservation &
Sterilization, 4th
Ed., Blackwell Publishing, Malden, MA, 2004, pp. 345-360.

164
73. G.W. Gould, in A.P. Fraise, P.A. Lambert, and J.-Y.Maillard (Eds), Russell, Hugo
& Ayliffe's Principles and Practice of Disinfection, Preservation & Sterilization,
4th ed., Blackwell Publishing, Malden, MA, 2004, pp. 361-383.
74. P.A. Lambert, in A.P. Fraise, P.A. Lambert, and J.-Y.Maillard (Eds), Russell, Hugo
& Ayliffe's Principles and Practice of Disinfection, Preservation & Sterilization, 4th
Ed., Blackwell Publishing, Malden, MA, 2004, pp. 384-400.
75. J.-Y. Dusseau, P. Duroselle, and J. Freney, in A.P. Fraise, P.A. Lambert, and J.-
Y.Maillard (Eds), Russell, Hugo & Ayliffe's Principles and Practice of Disinfection,
Preservation & Sterilization, 4th
Ed., Blackwell Publishing, Malden, MA, 2004, pp.
401-435.
76. G.W. Gould, in A.P. Fraise, P.A. Lambert, and J.-Y.Maillard (Eds), Russell, Hugo
& Ayliffe's Principles and Practice of Disinfection, Preservation & Sterilization,
4th ed., Blackwell Publishing, Malden, MA, 2004, pp. 473-483.
77. T.K. Das, in Kirk-Othmer Encyclopedia of Chemical Technology, Disinfection,
Vol. 8, pp. 605-672.
78. C.H. Shaffer, in Seymour S. Block (Ed), Disinfection, Sterilization, and
Preservation, 2nd Ed., Lea & Febiger, Philadelphia, 1977, pp. 78-99.
79. EPA, Summary of the Federal Insecticide, Fungicide, and Rodenticide Act,
available online at http://www.epa.gov/lawsregs/laws/fifra.html, accessed on
December 25, 2007.
80. N. Omidbakhsh and S.A. Sattar, Am. J. Infect. Control, 34 (2006) 251-257.
81. R.A. Caputo and T.E. Odlaug, in Seymour S. Block (Ed), Disinfection,
Sterilization, and Preservation, 2nd Ed., Lea & Febiger, Philadelphia, 1977, pp. 47-
64.
82. D.M. Portner and R.K. Hoffman, Appl. Microbiol, 16 (1968) 1782-1785.
83. W.F. Gale, et al., The Effect of Vapor Phase Hydrogen Peroxide, as a
Decontaminant for Civil Aviation Applications, on the Microstructure and Tensile
Properties of 2024 and 7075 Age Hardenable Aluminium Alloys and 304 Austenitic
Stainless Steel, Mater. Sci. Technol., in press.
84. FIFRA, as amended through P.L. 110-94, enacted October 9, 2007, available online
at http://agriculture.senate.gov/Legislation/Compilations/Fifra/FIFRA.pdf, accessed
on December 25, 2007.
85. EPA, Pesticides: Topical & Chemical Fact Sheets, available online at
http://www.epa.gov/pesticides/factsheets/chemicals/hydrogenperoxide_peroxyaceti

165
cacid_factsheet.htm and http://www.epa.gov/pesticides/factsheets/chemicals/
vhp_factsheet.htm, accessed on October 3, 2007.
86. EPA, Alphabetical List of Pesticide Fact Sheets, available online at
http://www.epa.gov/pesticides/factsheets/alpha_fs.htm, accessed on October 3,
2007.
87. J.R. Rickloff, J. Valid. Technol., 5 (1998) 61-71.
88. Bioquell HPV Generator, http://www.bioquell.com/lifescience.asp accessed on
November 24, 2007.
89. W.F. Gale, et al., Biosecurity and Bioterrorism: Biodefense Strategy, Practice, and
Science, Mater. Sci. Technol., submitted November 20, 2007.
90. Science Applications International Corporation, Report: EPA/600/R-05/036/2005.
91. E.D. Asbury, in S.S. Block (Ed), Disinfection, Sterilization and Preservation, 3rd
Ed., Lea and Febiger, Philadelphia, 1983, pp. 964-980.
92. ASTM Designation: E2111-05, ASTM International.
93. C.L. Tornblom, Report Executive Research Project F12, The Industrial College of
the Armed Forces, Washington DC., 1992.
94. J.S. Robinson, Elements Magazine, a University of Limerick Publication, 2 (1994)
19-20.
95. EPA's Chemical Compatibility Chart, EPA-600/2-80-076 April 1980.
96. Cole-Parmer Chemical Compatibility, available online at
http://www.coleparmer.com/techinfo/chemcomp.asp, accessed on November 26,
2007.
97. W. Eul, A. Moeller, and N. Steiner, in Kirk-Othmer Encyclopedia of Chemical
Technology, Hydrogen Peroxide, Vol. 13, pp. 1-58.
98. G.L. French, et al., J. Hosp. Infec., 57 (2004) 31-37.
99. B.M. Andersen, J. Hosp. Infec., 62 (2006) 149-155.
100. W. Mueller, U.S. Patent No. 5,792,435, 1998.
101. W. Mueller, WIPO Patent No. WO 98/44958, 1998.
102. F. Bounoure, H. Fiquet, and P. Arnaud, Am. J. Health-Syst. Pharm., 63 (2006) 451-
455.

166
103. J.R. Rickloff, J.P. Dalmasso, and L.W. Lyhte, Proc. PDA Annual Meeting, 1992,
pp. 1-14.
104. J.R. Rickloff, D.C. Upchurch, and R.W. Childers, U.S. Patent No. 5,445,792, 1995.
105. ACER, Center Highlight as of March 23, 2007, available online at http://acer-
coe.org/flyers/acer_highlights_public_release.pdf, accessed on October 3, 2007.
106. M.J. Kempf, et al., Astrobiology, 5 (2005) 391-405.
107. G.W. Wagner and Y.-C. Yang, Ind. Eng. Chem. Res., 41 (2002) 1925-1928.
108. G. Marsh, Reinforced Plastics 50 (2006) 18-23.
109. National Research Council, The Airliner Cabin Environment and the Health of
Passengers and Crew, National Academy Press, Washington, D.C., 2002, pp.98-99.
110. A. Sverdlin, in G.E. Totten and D.S. MacKenzie (Eds), Handbook of Aluminum,
Physical Metallurgy and Process, Vol. 1, Marcel Dekker, Inc., New York, 2003,
pp. 33-80.
111. R. Howard, N. Bogh, and D.S. MacKenzie, in G.E. Totten and D.S. MacKenzie
(Eds), Handbook of Aluminum, Physical Metallurgy and Process, Vol. 1, Marcel
Dekker, Inc., New York, 2003, pp. 881-970.
112. J.R. Davis, Corrosion of Aluminum Alloy and Aluminum Alloys, ASM International,
Materials Park, OH, 1999.
113. L. Katgerman and D. Eskin, in G.E. Totten and D.S. MacKenzie (Eds), Handbook
of Aluminum, Physical Metallurgy and Process, Vol. 1, Marcel Dekker, Inc., New
York, 2003, pp. 259-303.
114. E.A. Starke, Jr., in A.K. Vasudevan and R.D. Doherty (Eds), Aluminum Alloys –
Contemporary Research and Applications, Vol. 31, Academic Press, Inc., San
Diego, 1989, pp. 35-63.
115. D.S. MacKenzie, in G.E. Totten and D.S. MacKenzie (Eds), Handbook of
Aluminum, Alloy Production and Materials Manufacturing, Vol. 2, Marcel Dekker
Inc., New York, 2003, pp. 343-419.
116. R.L. Fleischer, Acta Met., 11 (1963) 203.
117. M. Tiryakioğlu and J.T. Staley, in G.E. Totten and D.S. MacKenzie (Eds),
Handbook of Aluminum, Physical Metallurgy and Process, Vol. 1, Marcel Dekker,
Inc., New York, 2003, pp. 81-209.
118. E.O. Hall, Proc. Phys. Soc., B64, (1951) 747-753.

167
119. J.C.M. Li, Trans. Met. Soc. AIME., 227 (1963) 239-247.
120. R.W. Armstrong, et al., Philos. Mag., 14 (1966) 943-951.
121. R.W. Hertzberg, Deformation and Fracture Mechanics of Engineering Materials,
4th Ed., John Wiley & Sons, Inc., New York, 1996, p. 123.
122. C.G. Schmidt and A.K. Miller, Acta Metall., 30 (1982) 615-625.
123. A. Guinier, Nature 142 (1938) 569–570.
124. G.D. Preston, Proc. Roy. Soc. A 167 (1938) 526–538.
125. T.H. Courtney, Mechanical Behavior of Materials, McGraw-Hill Publishing Inc.,
New York, 1990, pp. 207-212.
126. T.J. Konno, M. Kawasaki, and K. Hiraga, JEOL News, 36E (2001) 14-17.
127. J.D. Embury and J.P. Hirth, Acta Metall. Mater., 42 (1994) 2051-2056.
128. A.R. Despić, et al., Electrochim. Acta, 35 (1990) 1747-1755.
129. M.-H. Wang and K.R. Hebert, J. Electrochem. Soc., 143 (1996) 2827-2834.
130. J.H. Seo and D.N. Lee, J. Electrochem. Soc., 150 (2003) B329-B335.
131. T.D. Burleigh, in G.E. Totten and D.S. MacKenzie (Eds), Handbook of Aluminum,
Alloy Production and Materials Manufacturing, Vol. 2, Marcel Dekker Inc., New
York, 2003, pp. 421-463.
132. W. Zhang and G.S. Frankel, J. Electrochem. Soc., 149 (2002) B510-B519.
133. N.J.H Holroyd, A.K. Vasudevan. And L. Christodoulou, in A.K. Vasudevan and
R.D. Doherty (Eds), Aluminum Alloys – Contemporary Research and Applications,
Vol. 31, Academic Press, Inc., San Diego, 1989, pp. 463-483.
134. G.S. Chen, et al., Mater. Sci. Eng., A219 (1996) 126-132.
135. B.W. Lifka and D.O. Sprowls, Localized Corrosion Cause of Metal Failure, ASTM
STP516 (1972) 120-144.
136. G.S. Chen, M. Gao, and R.P. Wei, Corr. Sci., 52 (1996) 8-15.
137. M. Gao, C.R. Feng, and R.P. Wei, Metall. Mater. Trans. A29 (1998) 1145-1151.
138. R.P. Wei, C.-M. Liao, and M. Gao, Metall. Mater. Trans. A29 (1998) 1153-1160.
139. T. Suter and R.C. Alkire, J. Electrochem. Soc., 148 (2001) B36-B42.

168
140. C. Blanc, S. Gastaud, and G. Mankowski, J. Electrochem. Soc., 150 (2003) B396-
B404.
141. A.F. Padilha and R.L. Plaut, in G.E. Totten and D.S. MacKenzie (Eds), Handbook
of Aluminum, Alloy Production and Materials Manufacturing, Vol. 2, Marcel
Dekker Inc., New York, 2003, pp. 193-220.
142. N. Birbilis and R.G. Buchneit, J. Electrochem. Soc. 152 (2005) B140-B151.
143. H.M. Obispo, et al., J. Mater. Sci., 35 (2000) 3479-3495.
144. C.M. Liao and R.P. Wei, Electrochim. Acta, 45 (1999) 881-888.
145. R.G. Buchheit, et al., J. Electrochem. Soc. 144 (1997) 2621-2628.
146. M. Raghawan, J.Y. Koo, and R Petkovic-Luton, J. Met., 35 (1983) 44-50.
147. P.P. Villars and L.D. Calvert, Pearson's Handbook of Crystallographic Data for
Intermetallic Phases, ASM International, Materials Park OH, 1991.
148. J. T. Staley, in A. K. Vasudevan and R.D. Doherty (Eds), Aluminum Alloys –
Contemporary Research and Applications, Vol. 31, Academic Press, Inc., San
Diego (1989) pp. 1-31.
149. M. Shao, et al., Mater. Sci. Eng. A344 (2003) 323-327.
150. D.G. Harlow and R.P. Wei, Eng. Fracture Mechanics, 59 (1998) 305-325.
151. ASTM Designation: A 240/A 240M-01, ASTM International.
152. J.R. Davis, ASM Specialty Handbook, Stainless Steel, ASM International, Materials
Park, OH, 1996.
153. D. Peckner and I.M. Bernstein, Handbook of Stainless Steels, McGraw-Hill Book
Company, New York, NY, 1977.
154. D.P. Gregory and A.C. Riddiford, J. Electrochem. Soc., 107 (1960) 950-956.
155. P. Miečinskas, Russian J. Electrochem., 41 (2005) 731-735.
156. E. D’Elia, et al., J. Electrochem. Soc., 143 (1996) 961-967.
157. V. Kreizer, et al., Protections of Metal, 39 (2003) 30-33.
158. D.H. Hur, et al., Nuclear Eng. Design, 224 (2003) 207-212.
159. R.L. Cervantes, L.E. Murr, and R.M. Arrowood, J. Mater. Sci., 36 (2001) 4079-
4088.

169
160. M.A. Alodan and W.H. Smyrl,, J. Electrochem. Soc., 145 (1998) 1571-1577.
161. M.B. Vukmirovic, N. Dimitrov, and K. Sieradzki, J. Electrochem. Soc., 149 (2002)
B428-B439.
162. Q. Meng and G.S. Frankel, J. Electrochem. Soc., 151 (2004) B271-B283.
163. K.Y. Tam, J. Am. Chem. Soc., 118 (1996) 4419-4426.
164. R.G. Compton, et al., J. Phys. Chem., 97 (1993) 10416-10420.
165. V.G. Levich, Physicochemical Hydrodynamics, Prentice Hall, Englewood Cliffs,
NJ, 1962, pp. 39-138.
166. R.B. Bird, W.E. Stewart, E.N. Lightfoot, Transport Phenomena, 2nd
Ed., John
Wiley & Son Inc., New York, 2002, pp. 513-542.
167. A.W. Hixson and J.H. Crowell, Ind. Eng. Chem., 23 (1931) 923-931.
168. A. Noyes and W.R. Whitney, J. Am. Chem. Soc., 19 (1897) 930-934.
169. W. D. MacDonald and T. W. Eagar, Annu. Rev. Mater. Sci., 22 (1992) 23-46.
170. S. Chada, et al., J. Elec. Mater., 29 (2000) 1214-1221.
171. C.V. King, J. Am. Chem. Soc., 57 (1935) 828-831.
172. V.G. Levich, Physicochemical Hydrodynamics, Prentice Hall, Englewood Cliffs,
NJ, 1962, pp. 60-78.
173. W.G. Cochran, Proc. Camb. Philos. Soc., 30 (1934) 365–375.
174. A.W. Hixson and J.H. Crowell, Ind. Eng. Chem., 23 (1931) 1002-1009.
175. W.I. Higuchi and E.N. Hiestand, J. Pharm. Sci., 52 (1963) 67-71.
176. W.I. Higuchi, E.L. Rowe, and E.N. Hiestand, J. Pharm. Sci., 52 (1963) 162-164.
177. P.J. Niebergall, et al., J. Pharm. Sci., 52 (1963) 236-241.
178. J. Wang and D.R. Flanagan, J. Pharm. Sci., 88 (1999) 731-738.
179. J. Wang and D.R. Flanagan, J. Pharm. Sci., 91 (2002) 534-542.
180. A. Mills, H.L. Davies, and M.S. Garley, J. Chem. Soc. Faraday Trans., 86 (1990)
2163-2167.
181. M.G. Segal and R.M. Sellers, J. Chem. Soc. Chem. Comm., 21 (1980) 991-993.

170
182. A.B. O’Brien, M.G. Segal, and W.J. Williams, J. Chem. Soc. Faraday Trans. 1, 83
(1987) 371-382.
183. M.G. Segal and W.J. Williams, J. Chem. Soc. Faraday Trans. 1, 82 (1986) 3245-
3254.
184. M.G. Segal and R.M. Sellers, J. Chem. Soc. Faraday Trans. 1, 78 (1982) 1149-
1164.
185. H.Y. Sohn and M.E. Wadsworth, Rate Processes of Extractive Metallurgy, Plenum
Press, New York, 1979, pp. 133-186.
186. M.M. Antonijević, Z.D. Janković, and M.D. Dimitrijević, Hydrometallurgy, 71
(2004) 329-334.
187. M.M. Antonijević, M. Dimitrijević, and Z. Janković, Hydrometallurgy, 46 (1997)
71-83.
188. M. Dimitrijević, M.M. Antonijević, and Z. Janković, Hydrometallurgy, 42 (1996).
189. D.A. McQuarrie and P.A. Rock, General Chemistry, W.H. Freeman & Co., New
York, 1984, pp. 623-657.
190. K.K. Sankaran, R. Perez, and K.V. Jata, Mater. Sci. Eng. A297 (2001) 223-229.
191. D.L. DuQuesnay, P.R. Underhill, and H.J. Britt, Int. J. Fatigue, 25 (2003) 371-377.
192. K. Jones and D.W. Hoeppner, Corr. Sci., 47 (2005) 2185-2198.
193. K. Jones and D.W. Hoeppner, Corr. Sci., 48 (2006) 3106-3122.
194. Y. Kondo, Corr. Sci., 45 (1989) 7-11.
195. M.L. Du, et al., Int. J. Fatigue, 20 (1998) 743-748.
196. V. Bystritskii, et al., Theoretical Appl. Fract. Mech., 32 (1999) 47-53.
197. What is Listeria monocytogenes? Available online at
http://www.bionewsonline.com/f/what_is_listeria_monocytogenes.htm, accessed on
April 20, 2008.
198. A.C. Davies, The Science and Practice of Welding, 10th Ed., Vol. 1, Cambridge
University Press, New York, 1992, pp. 103-105.
199. E.L. Criscuolo, et al., in A.L. Phillips, et al., (Eds), Welding Handbook, 6th Ed.,
Vol. 1., American Welding Society, New York, 1968, pp. 6.1-6.66.
200. ASTM Designation: E8M-00b, ASTM International.

171
201. B. Chalmers, Principles of Solidification, John Wiley & Sons, Inc., New York,
1964, p. 78-79.
202. J. Drelich and J. D. Miller, J. Colloid Interface Sci., 164 (1994) 252–259.
203. J. Drelich, J. D. Miller, and R. J. Good, J. Colloid Interface Sci., 179 (1996) 37–50.
204. D.S. MacKenzie, in G.E. Totten, K. Funatani, and L. Xie, Handbook of
Metallurgical Process Design, CRC Press, Boca Raton, FL, 2004, pp. 765-790.
205. K.R. Trethewey and J. Chamberlain, Corrosion, Longman Scientific & Technical,
Harlow, England, 1988, pp. 241-270.
206. N.N. Greenwood and A. Earnshaw, Chemistry of the Elements, 2nd
Ed.,
Butterworth-Heinemann, Oxford, 1998, pp. 1173-1226.
207. H. Aretz, Modelling Simul. Mater. Sci. Eng., 12 (2004) 491-509
208. J. Halpern, J. Electrochem. Soc., 100 (1953) 421-428.
209. R.A. Couche and I.M. Ritchie, Aust. J. Chem., 37 (1984) 231-238.
210. L.L. Duda, Corr. Sci., 44 (2002) 989-995.
211. F. Arslan, et al., Scandinavian J. Metall., 33 (2004) 6-14.
212. M.C. Ruiz and R. Padilla, Hydrometallurgy, 48 (1998) 313-325.
213. C-W. Shih, Y-Y. Wang, and C-C. Wan, J. App. Electrochem., 32 (2002) 987-992.
214. M.M. Antonijević, Z. Janković, and M. Dimitrijević, Hydrometallurgy, 35 (1994)
187-201.


![NITRIDASI ALUMINIUM AA 2024 T3 DENGAN TEKNIK ......Pro.!idmg Pertemrtan don Preselllasi IImiDh PPN},-BATAN. t'ogyakarta ]3.25 April J996 Bllkll J 15 NITRIDASI ALUMINIUM AA 2024 T3](https://static.fdocuments.net/doc/165x107/60dda33ffb40c83e34080d68/nitridasi-aluminium-aa-2024-t3-dengan-teknik-proidmg-pertemrtan-don-preselllasi.jpg)