Microstructure and Growth Mechanism of Oxide Layers …It is understood that the oxide formed on Zr...
26
Journal of ASTM International, May 2005, Vol. 2, No. 5 Paper ID JAI12375 Available online at www.astm.org Arthur T. Motta, 1 Aylin Yilmazbayhan, 1 Robert J. Comstock, 2 Jonna Partezana, 2 George P. Sabol, 3 Barry Lai, 4 and Zhonghou Cai 4 Microstructure and Growth Mechanism of Oxide Layers Formed on Zr Alloys Studied with Micro-Beam Synchrotron Radiation ABSTRACT: The structures of oxides formed in water and lithiated water on three Zr-based alloys with varied corrosion behavior were studied with micro-beam synchrotron radiation and optical microscopy. Micro-beam synchrotron radiation (0.2 µm spot) has a unique combination of high elemental sensitivity (ppm level) and fine spatial resolution that allowed the determination of various oxide characteristics such as phase content, texture, grain size, and composition as a function of distance from the oxide-metal interface. Micro-beam X-ray fluorescence shows that the oxides formed in lithiated water have increased levels of Fe absorbed from the autoclave environment indicating greater oxide porosity in these oxides. The phase content, texture, and grain size of oxides were studied in detail using synchrotron radiation micro-beam diffraction for samples corroded in water and lithiated water. A remarkable periodicity was observed in the oxide structures using various techniques including X-ray peak intensities for both monoclinic and tetragonal zirconia, texture, and optical microscopy. The periods were similar to the transition period and were less visible in the oxides that behaved worse in lithiated water. These results are discussed in terms of models of oxide growth and of the differences between alloys. KEYWORDS: zirconium alloys, corrosion, synchrotron radiation, X-ray diffraction, oxide microstructure Introduction The extended fuel burnup, longer fuel cycles, power uprates, higher temperatures, and increased lithium in PWR primary water put a premium on the ability of the cladding to withstand in-reactor degradation. Uniform corrosion of Zr alloys and the associated hydrogen pickup has the potential to become a life-limiting degradation mechanism for nuclear fuel cladding. Although the uniform corrosion rate of modern alloys such as ZIRLO TM and M5 TM is significantly lower than that of Zircaloy-4, the reasons for such improved corrosion performance are poorly understood. In fact, the underlying reasons for the improvement of corrosion realized by chemistry changes or by optimization of process variables within an alloy, still elude our comprehension. Manuscript received 19 April 2004; accepted for publication 18 October 2004; published May 2005. Presented at ASTM Symposium on Zirconium in the Nuclear Industry: Fourteenth International Symposium on 13–17 June 2004 in Stockholm, Sweden; B. Kammenzind and P. Rudling, Guest Editors. 1 Professor and Graduate Student, respectively, Department of Mechanical and Nuclear Engineering, 227 Reber Building, The Pennsylvania State University, University Park, PA 16802. 2 Consulting Engineer and Senior Engineer, respectively, Science and Technology Department, Westinghouse Electric Co., 1340 Beulah Rd., Pittsburgh, PA 15235. 3 Consultant, Westinghouse Electric Co., 1340 Beulah Rd., Pittsburgh, PA 15235. 4 Research Scientist, Advanced Photon Source, XFD 401 B3194, Argonne National Laboratory, 9700 South Cass Ave., Argonne, IL 60439. Copyright © 2005 by ASTM International, 100 Barr Harbor Drive, PO Box C700, West Conshohocken, PA 19428-2959.
Transcript of Microstructure and Growth Mechanism of Oxide Layers …It is understood that the oxide formed on Zr...

Journal of ASTM International, May 2005, Vol. 2, No. 5 Paper ID JAI12375
Available online at www.astm.org
Arthur T. Motta,1 Aylin Yilmazbayhan,1 Robert J. Comstock,2 Jonna Partezana,2 George P. Sabol,3 Barry Lai,4 and Zhonghou Cai4
Microstructure and Growth Mechanism of Oxide Layers Formed on Zr Alloys Studied with Micro-Beam Synchrotron Radiation
ABSTRACT: The structures of oxides formed in water and lithiated water on three Zr-based alloys with varied corrosion behavior were studied with micro-beam synchrotron radiation and optical microscopy. Micro-beam synchrotron radiation (0.2 µm spot) has a unique combination of high elemental sensitivity (ppm level) and fine spatial resolution that allowed the determination of various oxide characteristics such as phase content, texture, grain size, and composition as a function of distance from the oxide-metal interface.
Micro-beam X-ray fluorescence shows that the oxides formed in lithiated water have increased levels of Fe absorbed from the autoclave environment indicating greater oxide porosity in these oxides. The phase content, texture, and grain size of oxides were studied in detail using synchrotron radiation micro-beam diffraction for samples corroded in water and lithiated water. A remarkable periodicity was observed in the oxide structures using various techniques including X-ray peak intensities for both monoclinic and tetragonal zirconia, texture, and optical microscopy. The periods were similar to the transition period and were less visible in the oxides that behaved worse in lithiated water. These results are discussed in terms of models of oxide growth and of the differences between alloys.
KEYWORDS: zirconium alloys, corrosion, synchrotron radiation, X-ray diffraction, oxide microstructure
Introduction The extended fuel burnup, longer fuel cycles, power uprates, higher temperatures, and
increased lithium in PWR primary water put a premium on the ability of the cladding to withstand in-reactor degradation. Uniform corrosion of Zr alloys and the associated hydrogen pickup has the potential to become a life-limiting degradation mechanism for nuclear fuel cladding. Although the uniform corrosion rate of modern alloys such as ZIRLOTM and M5TM is significantly lower than that of Zircaloy-4, the reasons for such improved corrosion performance are poorly understood. In fact, the underlying reasons for the improvement of corrosion realized by chemistry changes or by optimization of process variables within an alloy, still elude our comprehension. Manuscript received 19 April 2004; accepted for publication 18 October 2004; published May 2005. Presented at ASTM Symposium on Zirconium in the Nuclear Industry: Fourteenth International Symposium on 13–17 June 2004 in Stockholm, Sweden; B. Kammenzind and P. Rudling, Guest Editors. 1 Professor and Graduate Student, respectively, Department of Mechanical and Nuclear Engineering, 227 Reber Building, The Pennsylvania State University, University Park, PA 16802. 2 Consulting Engineer and Senior Engineer, respectively, Science and Technology Department, Westinghouse Electric Co., 1340 Beulah Rd., Pittsburgh, PA 15235. 3 Consultant, Westinghouse Electric Co., 1340 Beulah Rd., Pittsburgh, PA 15235. 4 Research Scientist, Advanced Photon Source, XFD 401 B3194, Argonne National Laboratory, 9700 South Cass Ave., Argonne, IL 60439.
Copyright © 2005 by ASTM International, 100 Barr Harbor Drive, PO Box C700, West Conshohocken, PA 19428-2959.

JOURNAL OF ASTM INTERNATIONAL 2
It is understood that the oxide formed on Zr alloys has a protective nature, and that this protective character varies periodically during corrosion, as a result of the multiple transitions in oxide kinetics. Different reasons have been mentioned for the origin of the protectiveness of the oxide, including oxide sub-stoichiometry, compressive stresses, and the presence of the tetragonal oxide phase [1,2]. It is also understood that the rate-limiting step for corrosion is the diffusion of oxygen vacancies through the oxide layer, although other rate-limiting steps have been proposed [3]. The influence of the transition on the formation of the new oxide is also not clear, although it is clear that there is a loss of protectiveness in the oxide layer upon transition.
One remarkable fact is that when corrosion tested in a given environment, different alloys can exhibit different pre-transition oxidation rates, different oxide transition times, and different post-transition corrosion rates [4]. This is true in spite of the fact that these alloys are all 97 %-plus Zr and vary only in the compositional changes within the remaining 3 %. Several mechanisms can be invoked for these differences but none are entirely satisfactory. For example, if alloying elements acted as dopants in the oxide, the presence of elements with a lower valence than Zr could cause an increase in the oxygen vacancy concentration in the oxide. This, however, would only be true if the alloying element in question were incorporated as a substitutional element in the oxide layer and were in fact oxidized along with Zr. It has been shown that such is not always the case, as the alloying elements can be incorporated in unoxidized form into the oxide [5,6]. It has also been shown that alloying elements such as Sn can be segregated to oxide-oxide grain boundaries, also removing the alloying element from the possible role of oxide dopant [7]. Other mechanisms have similar objections, and thus the role of alloying elements in promoting or hampering oxide growth is not well understood.
In this work, the structure of the oxide as a function of distance from the oxide-metal interface was studied by use of micro-beam synchrotron radiation. These studies were performed on oxides formed on three Zr alloys that were corroded in pure and lithiated water in order to identify differences between oxides formed on different alloys. The ultimate objective of this project is to relate the observed differences in corrosion behavior (e.g., time to transition, post-transition corrosion rate) to the differences in oxide microstructure and in turn to relate these to the differences in alloy microstructure. The work reported here is a step in that direction.
Experimental Methods
Alloy Materials
Tubing was fabricated from sponge-based ingots of three zirconium alloys: Zircaloy-4, ZIRLO, and Zr2.5Nb (meaning 2.5 weight percent Nb). The chemical analysis of the ingots is shown in Table 1. All tubing was in the cold-worked and stress-relief-annealed condition. Processing of these materials was previously described [8]. In addition to tubing, sheet material of Zircaloy-4 and ZIRLO in the recrystallized condition was also included in this study.
TABLE 1—Chemical composition of zirconium alloy ingots (wt. ppm).
Element Zircaloy-4 ZIRLO Zr-2.5Nb Iron 2100 1000 504
Chromium 1000 <50 ... Niobium ... 9900 25 500
Tin 15 000 9600 10 Oxygen 1300 1430 1330
Zirconium Balance Balance Balance
MOTTA ET AL. ON SYNCHROTRON RADIATION 3
Corrosion Tests
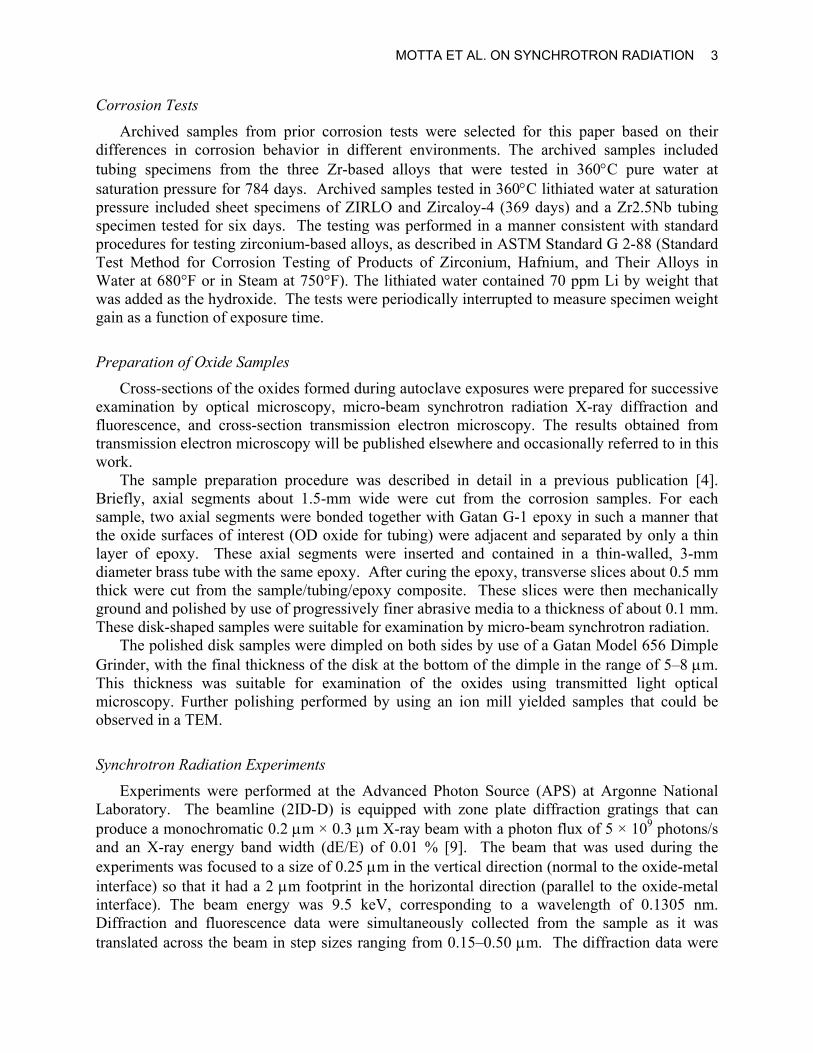
Archived samples from prior corrosion tests were selected for this paper based on their differences in corrosion behavior in different environments. The archived samples included tubing specimens from the three Zr-based alloys that were tested in 360°C pure water at saturation pressure for 784 days. Archived samples tested in 360°C lithiated water at saturation pressure included sheet specimens of ZIRLO and Zircaloy-4 (369 days) and a Zr2.5Nb tubing specimen tested for six days. The testing was performed in a manner consistent with standard procedures for testing zirconium-based alloys, as described in ASTM Standard G 2-88 (Standard Test Method for Corrosion Testing of Products of Zirconium, Hafnium, and Their Alloys in Water at 680°F or in Steam at 750°F). The lithiated water contained 70 ppm Li by weight that was added as the hydroxide. The tests were periodically interrupted to measure specimen weight gain as a function of exposure time.
Preparation of Oxide Samples
Cross-sections of the oxides formed during autoclave exposures were prepared for successive examination by optical microscopy, micro-beam synchrotron radiation X-ray diffraction and fluorescence, and cross-section transmission electron microscopy. The results obtained from transmission electron microscopy will be published elsewhere and occasionally referred to in this work.
The sample preparation procedure was described in detail in a previous publication [4]. Briefly, axial segments about 1.5-mm wide were cut from the corrosion samples. For each sample, two axial segments were bonded together with Gatan G-1 epoxy in such a manner that the oxide surfaces of interest (OD oxide for tubing) were adjacent and separated by only a thin layer of epoxy. These axial segments were inserted and contained in a thin-walled, 3-mm diameter brass tube with the same epoxy. After curing the epoxy, transverse slices about 0.5 mm thick were cut from the sample/tubing/epoxy composite. These slices were then mechanically ground and polished by use of progressively finer abrasive media to a thickness of about 0.1 mm. These disk-shaped samples were suitable for examination by micro-beam synchrotron radiation.
The polished disk samples were dimpled on both sides by use of a Gatan Model 656 Dimple Grinder, with the final thickness of the disk at the bottom of the dimple in the range of 5–8 µm. This thickness was suitable for examination of the oxides using transmitted light optical microscopy. Further polishing performed by using an ion mill yielded samples that could be observed in a TEM.
Synchrotron Radiation Experiments
Experiments were performed at the Advanced Photon Source (APS) at Argonne National Laboratory. The beamline (2ID-D) is equipped with zone plate diffraction gratings that can produce a monochromatic 0.2 µm × 0.3 µm X-ray beam with a photon flux of 5 × 10⁹ photons/s and an X-ray energy band width (dE/E) of 0.01 % [9]. The beam that was used during the experiments was focused to a size of 0.25 µm in the vertical direction (normal to the oxide-metal interface) so that it had a 2 µm footprint in the horizontal direction (parallel to the oxide-metal interface). The beam energy was 9.5 keV, corresponding to a wavelength of 0.1305 nm. Diffraction and fluorescence data were simultaneously collected from the sample as it was translated across the beam in step sizes ranging from 0.15–0.50 µm. The diffraction data were
JOURNAL OF ASTM INTERNATIONAL 4
collected by a flat two-dimensional detector (CCD camera), while the fluorescence data were collected by an energy dispersive Ge (Li) detector with an energy resolution of 200 eV.
The positions of the oxide-metal and oxide-water interfaces were determined by monitoring Zr L line fluorescence counts as the sample was translated across the beam. The lower density of zirconium atoms in the oxide than in the metal results in a slight reduction in Zr L intensity as the micro-beam is moved from the metal to the oxide. This allowed the determination of the oxide location. The distance between the oxide-metal interface and the oxide-water interface measured by this method was in good agreement, to within 0.5 µm, with optical determination of the oxide thickness.
Processing and Integration of Diffraction Data
To obtain quantitative diffraction data, the digital data obtained from the two-dimensional detector were integrated over the elliptical sections for a fixed azimuthal angle, and the appropriate Lorentz and polarization correction factors were applied [4]. Following the integration and above corrections, a plot of diffracted intensity versus two-theta angle was obtained at each location analyzed [4].
Experimental Results
Autoclave Corrosion Results
The corrosion weight gain results for the three alloys studied in the two environments are shown in Fig. 1. A wide spread of corrosion rates is observed during testing in water, with Zr2.5Nb having the lowest corrosion rate, followed by ZIRLO and Zircaloy-4. In the lithiated water environment, the relative order is changed, with the Zr2.5Nb alloy exhibiting accelerated corrosion following the initial three-day exposure. Zircaloy-4 and ZIRLO show significantly lower corrosion than Zr2.5Nb. Acceleration in Zircaloy-4 corrosion began at about 150 days, while the corrosion of ZIRLO in lithiated water showed no acceleration.
The corrosion plots in pure water can be divided into a pre-transition regime where the weight gain follows parabolic or cubic kinetics followed by a post-transition regime in which the kinetics are typically characterized as linear, likely as a result of averaging over various areas. The oxide thickness at the end of pre-transition can be estimated from the weight gain prior to the change in kinetics using a relationship of 1 µm of oxide equal to 15 mg/dm2. The oxide thickness at transition and time to transition are tabulated in Table 3 along with the post-transition corrosion rate. The corrosion of ZIRLO in lithiated water also exhibits a pre-transition regime with the thickness and time to transition given in Table 3. No pre-transition regime in lithiated water could be identified for Zircaloy-4 or Zr2.5Nb based upon the weight gain measurements (possibly because of too few data points due to fast corrosion).
X-Ray Fluorescence of Oxides
Figure 2 shows the Zr L and Fe Kα fluorescence intensity when the micro-beam is scanned across the oxide cross-section for ZIRLO and Zr2.5Nb corrosion tested in pure water (Figs. 2a and 2b) and in lithiated water (Figs. 2c and 2d). The change in Zr L fluorescence counts was used to identify the location of the metal-oxide and oxide-water interface regions. The intensity of the Fe Kα line is higher near the oxide-water interface in all cases, likely due to contamination

MOTTA ET AL. ON SYNCHROTRON RADIATION 5
of the oxide from Fe ions dissolved in the autoclave solution. The increase in the concentration of Mn, not present in the alloy but present in the autoclave steel, in the outer part of the oxide (not shown in Fig. 2) is further indication that this Fe peak comes from the autoclave environment. Thus, the penetration of Fe into the oxide can serve as a marker for porosity or cracking in the oxide.
The Fe ingress into the oxides formed in pure water and in lithiated water is quite different. At about eight microns from the oxide-water interface, the Fe concentrations in Figs. 2a and 2b (pure water samples) decrease to levels that are close to those observed in the metal. In contrast, in Figs. 2c and 2d (oxides formed under lithiated water conditions), the concentration of Fe remains high to greater depths into the oxide. This indicates that the oxides formed in lithiated water allow greater ingress of Fe from the autoclave solution as the oxides are more porous or cracked than the oxides formed in pure water, in agreement with previous studies [10].
0
100
200
300
400
500
600
0 50 100 150 200 250 300 350 400Exposure Time (days)
Wei
ght G
ain
(mg/
dm2 )
0
5
10
15
20
25
30
35
40
Oxi
de T
hick
ness
( µm
)
Zr-2.5NbZIRLOZircaloy-4
0
50
100
150
200
250
300
350
400
450
500
0 100 200 300 400 500 600 700 800Exposure Time (days)
Wei
ght G
ain
(mg/
dm2 )
0
5
10
15
20
25
30
Oxi
de T
hick
ness
( µm
)
Zr-2.5NbZIRLOZircaloy 4
(a)
(b)
0
100
200
300
400
500
600
0 50 100 150 200 250 300 350 400Exposure Time (days)
Wei
ght G
ain
(mg/
dm2 )
0
5
10
15
20
25
30
35
40
Oxi
de T
hick
ness
( µm
)
Zr-2.5NbZIRLOZircaloy-4
0
50
100
150
200
250
300
350
400
450
500
0 100 200 300 400 500 600 700 800Exposure Time (days)
Wei
ght G
ain
(mg/
dm2 )
0
5
10
15
20
25
30
Oxi
de T
hick
ness
( µm
)
Zr-2.5NbZIRLOZircaloy 4
(a)
(b)
FIG. 1—Corrosion weight gain versus exposure time for the corrosion of Zircaloy-4, ZIRLO,
and Zr-2.5Nb in a (a) 360oC pure water, and (b) 360oC lithiated water (70 wt. ppm Li added) environment.

JOURNAL OF ASTM INTERNATIONAL 6
TABLE 2—Elemental concentrations in metal and oxide of samples formed in pure water and in lithiated water calculated using the MSIM5d simulation program [11,12].
Position of Spectrum Fe (wt. ppm) Mn (wt. ppm) Sn (wt. ppm) Metal - 5 µm from O/M 1000 50 15 100 15 µm from O/M (middle) 2100 70 10 700
wat
er
31 µm from O/M (outer) 5300 1300 10 300 19 µm from O/M (middle) 1600 80 10 500 Zi
rcal
oy-4
Li
38 µm from O/M (outer) 2000 80 10 200 Metal - 2 µm from O/M 1100 50 9600 10 µm from O/M (middle) 1200 50 7100
wat
er
18 µm from O/M (outer) 2700 300 7100 Metal - 3.5 µm from O/M 1100 50 9600 ZI
RLO
Li
8 µm from O/M (middle) 2700 200 7000 Metal - 3 µm from O/M 500 50 … 6 µm from O/M (middle) 600 50 …
wat
er
12 µm from O/M (outer) 3800 300 … Metal - 6 µm from O/M 450 40 … Zr
-2.5
Nb
Li
15 µm from O/M (middle) 1700 90 …
-10 0 10 20 30 40Oxide Thickness (µm)
Num
ber o
f Cou
nts
(Arb
itrar
y U
nits
)
-2 0 2 4 6 8 10 12 14 16 18Oxide Thickness (µm)
Nun
ber o
f Cou
nts
(Arb
itrar
y U
nits
)
-4 0 4 8 12 16 20 24Oxide Thickness (µm)
Num
ber o
f Cou
nts
(Arb
itrar
y U
nits
)
-4 0 4 8 12 16Oxide Thickness (µm)
Num
ber o
f Cou
nts
(Arb
itrar
y U
nits
)
(b)(a)
(c) (d)
O/M O/W
O/M O/W
O/WO/M
O/WO/M
FIG. 2—X-ray fluorescence scans of Zr (solid line), Fe (dotted), and Sn (dashed) in (a) ZIRLO tested in 360oC pure water for 784 days, (b) Zr-2.5Nb tested in 360oC pure water for 784 days, (c) ZIRLO tested in 360oC lithiated water for 369 days, and (d) Zr-2.5Nb oxide tested in 360oC lithiated water for 6 days.
MOTTA ET AL. ON SYNCHROTRON RADIATION 7
A further difference can be observed among the oxides formed in lithiated water. In Zr2.5Nb, the high Fe region extends to the oxide-metal interface, while in ZIRLO, the last 2–3 microns near the oxide-metal interface exhibit a lower Fe concentration. This suggests that, in the lithiated water environment, a non-porous or protective layer near the oxide-metal interface exists in ZIRLO that is not present in Zr2.5Nb, and this could likely contribute to ZIRLO’s lower corrosion rate. It is also observed that the Fe concentration in the ZIRLO oxide formed in lithiated water exhibits periodic undulations within the oxide thickness (Fig. 2c). These fluctuations have similar periods to the variations observed in the diffracted intensities (see below) and correspond closely to the layer thickness at transition given in Table 3. Zircaloy-4 behaves similarly to Zr2.5Nb.
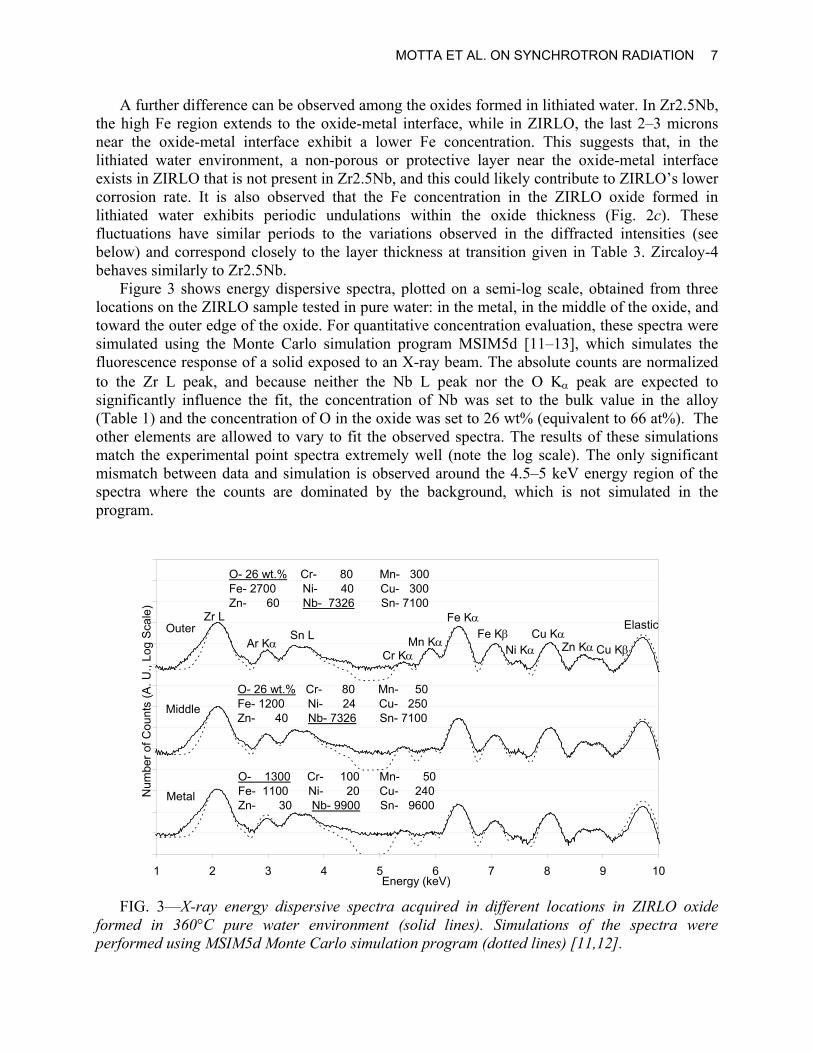
Figure 3 shows energy dispersive spectra, plotted on a semi-log scale, obtained from three locations on the ZIRLO sample tested in pure water: in the metal, in the middle of the oxide, and toward the outer edge of the oxide. For quantitative concentration evaluation, these spectra were simulated using the Monte Carlo simulation program MSIM5d [11–13], which simulates the fluorescence response of a solid exposed to an X-ray beam. The absolute counts are normalized to the Zr L peak, and because neither the Nb L peak nor the O Kα peak are expected to significantly influence the fit, the concentration of Nb was set to the bulk value in the alloy (Table 1) and the concentration of O in the oxide was set to 26 wt% (equivalent to 66 at%). The other elements are allowed to vary to fit the observed spectra. The results of these simulations match the experimental point spectra extremely well (note the log scale). The only significant mismatch between data and simulation is observed around the 4.5–5 keV energy region of the spectra where the counts are dominated by the background, which is not simulated in the program.
1 2 3 4 5 6 7 8 9 10Energy (keV)
Num
ber o
f Cou
nts
(A. U
., Lo
g S
cale
)
Outer
Middle
Metal
Zr L
Ar KαCr Kα
Mn Kα
Fe KαFe Kβ
Ni KαCu Kα
Zn KαCu Kβ
ElasticSn L
O- 1300 Cr- 100 Mn- 50Fe- 1100 Ni- 20 Cu- 240 Zn- 30 Nb- 9900 Sn- 9600
O- 26 wt.% Cr- 80 Mn- 50Fe- 1200 Ni- 24 Cu- 250Zn- 40 Nb- 7326 Sn- 7100
O- 26 wt.% Cr- 80 Mn- 300 Fe- 2700 Ni- 40 Cu- 300Zn- 60 Nb- 7326 Sn- 7100
FIG. 3—X-ray energy dispersive spectra acquired in different locations in ZIRLO oxide
formed in 360°C pure water environment (solid lines). Simulations of the spectra were performed using MSIM5d Monte Carlo simulation program (dotted lines) [11,12].

JOURNAL OF ASTM INTERNATIONAL 8
The numerical results of the simulation for all the alloys are summarized in Table 2. The error in the calculated results is estimated to be about 10 %. The concentrations of Sn in Zircaloy-4 and ZIRLO and Fe in ZIRLO and Zr2.5Nb correspond well to the bulk metal concentrations tabulated in Table 1. One exception is Fe in Zircaloy-4, where some spatial variation in Fe and Cr concentrations could be expected because of the larger precipitate sizes. The above fluorescence data show no segregation of alloying elements in the oxide, at least on the scale and geometry examined. Moreover, one should expect from the 26 wt% oxygen in the oxide that the concentration of other elements would be reduced by a factor of 0.74 as one goes from the metal to the oxide. This is verified for the Sn concentration in ZIRLO and Zircaloy-4, and also for the Zr concentration, indicating no alloying element enrichment in the oxide. The Fe concentrations in the middle of the oxides formed on the three alloys (Zircaloy-4, ZIRLO, and Zr2.5Nb) are higher than what would be expected if the overall Fe content were the same in the metal and in the oxide (corrected for the higher O content). The calculated Fe concentrations in the outer oxide layer vary between 2000 and 5000 wt. ppm, which are significantly higher than the iron concentration in the metal. These higher concentrations of Fe would likely be at the limit of detection of conventional techniques such as energy dispersive spectroscopy in the transmission electron microscope.
Optical Microscopy
Transmitted light optical microscopy was used to examine whether periodicity takes place during the oxide growth. Figure 4 shows transmitted light optical micrographs from oxides formed on Zircaloy-4, ZIRLO, and Zr2.5Nb in 360°C pure water, and Fig. 5 shows the corresponding micrographs for oxides formed in 360°C lithiated water. Periodicity in the oxide growth is clearly seen in the oxides formed in pure water with the layer thickness increasing with decreasing oxide thickness or corrosion rate [4]. In lithiated water, only ZIRLO oxides exhibit periodicity. No periodicity is present in Zircaloy-4 where extensive cracking parallel to the oxide-metal interface was observed. No evidence of periodicity could be seen in the oxide formed on Zr2.5Nb. The lack of a periodic oxide growth in both Zircaloy-4 and Zr2.5Nb correlates with the accelerated corrosion rates of these alloys in lithiated water. The layer thickness from these samples determined by optical microscopy is tabulated in Table 3 for comparison to layer thickness determinations by other techniques.
X-Ray Diffraction
The objective of the micro-diffraction studies was to characterize the metal and oxide structures at the oxide-metal interface and to study the evolution of the oxide structure as a function of distance from the oxide-metal interface. Using the micro-beam, it is possible to obtain information on the phase content, texture, and grain size of the oxides at different locations within the oxide.
The two-theta range captured by the CCD camera was 19–35°. The region ranging from 25–32° two-theta includes several peaks of interest: the three α-Zr diffraction peaks ( ) ( ) ( )ZrZrZr 1110and,0002,0110 , the monoclinic oxide peaks, (111)m, (200)m, (020)m, and (002)m, and the tetragonal oxide peaks (101)t, (110)t, and (002)t. Table 4 shows the lattice parameters of the observed phases. These lattice parameters were used for the fitting of the X-ray diffraction peaks.

MOTTA ET AL. ON SYNCHROTRON RADIATION 9
Figure 6 shows the diffracted intensity versus two-theta angle as the beam is scanned across the metal and oxide layer formed on ZIRLO in pure water. In the metal, the ( ) ( )1010 and 1011
Zr Zr peaks have high intensities that decrease to zero at the oxide-metal
interface where the oxide peaks increase. The (0002)Zr peak has very low intensity, but is visible in the metal region along with occasional hydride peaks. The specimens were prepared from a transverse cross-section of the tubing with the specimen normal being the axial direction of the tubing. The intensity from the basal plane (0002)Zr is low, since the basal poles are aligned in the radial-circumferential plane. The high intensity of the prism plane, ( )Zr0110 , is consistent with the alignment of the prism pole along the axial direction in non-recrystallized material.
Zr4
20 microns 20 microns
Zr4
ZIRLO ZIRLO
Zr-2.5Nb
(a) (b)
(c) (d)
(e) (f) Zr-2.5Nb
FIG. 4—Reflected and transmitted light micrographs from Zircaloy-4 (a,b), ZIRLO (c,d), and Zr-2.5Nb (e,f) alloy oxides formed in 360oC pure water environment for 784 days.

JOURNAL OF ASTM INTERNATIONAL 10
25 µm
Zr4 Zr4
ZIRLOZIRLO
Zr-2.5NbZr-2.5Nb
(a) (b)
(c) (d)
(e) (f)
FIG. 5—Reflected and transmitted light micrographs from Zircaloy-4 (a,b), ZIRLO (c,d), and
Zr2.5Nb (e,f) alloy oxides formed in 360oC water containing 70 wt. ppm Li. TABLE 3—Comparison of first transition thickness and layer period thicknesses measured by
different techniques in three different alloy oxides formed in pure water and in lithiated water. Thickness/Time to
Transition (from weight gain)
Post-Transition Corrosion Rate (mg/dm2/day)
Layer Period (XRD)
Layer Period (Transmitted Light
Optical Microscope)
Layer Period (TEM)
water 1.6±0.4 µm/28 days 0.58 1.85±0.45 µm 1.87±0.05 µm 1.85±0.23µm
Zirc
aloy
-4
Li (strip) Not discernible 2.02 None None Not examined
water 2.29±0.25 µm/84 days 0.33 2.28±0.53 µm 2.13±0.13 µm 2.3±0.1 µm
ZIR
LO
Li (strip) 2.7±0.7 µm/67 days 0.59 3.11±0.56 µm 2.82±0.26 µm 2.8±0.5 µm
water 2.52±0.26 µm/112 days 0.21 3.13 ±0.5 µm 2.86±0.32 µm 2±1 µm
Zr-2
.5N
b
Li Not discernible 84.6 None None Not periodic

MOTTA ET AL. ON SYNCHROTRON RADIATION 11
TABLE 4—Lattice parameters of crystalline phases observed in the samples in this study. System a (nm) b (nm) c (nm) α β γ JSPDF#
ZrO2 Monoclinic 0.531 0.521 0.515 90o 99.218o 90o 37-1484 ZrO2 Tetragonal 0.364 … 0.527 90o 90o 90o 42-1164 ZrO2 Cubic 0.513 … … 90o 90o 90o 49-1642 α-Zr Hexagonal 0.323 … 0.515 120o 90o 90o 5-0665 Zr3O Hex. (rhom.) 0.556 … 3.119 120o 90o 90o 22-1025 ZrH2 Tetragonal 0.352 … 0.445 90o 90o 90o 17-0314
O/M Interface
O/W Interface
(101
1)Zr
(002
) m(0
002) Zr
(020
) m(0
02) t
(101
) hyd.
(111
) m
(101
0) Zr
(101
) t
(111
) m
Oxid
e La
yer
Met
al
Oxid
e Th
ickne
ss (µ
m)
2-θ
O/M Interface
O/W Interface
(101
1)Zr
(002
) m(0
002) Zr
(020
) m(0
02) t
(101
) hyd.
(111
) m
(101
0) Zr
(101
) t
(111
) m
Oxid
e La
yer
Met
al
Oxid
e Th
ickne
ss (µ
m)
2-θ
FIG. 6—X-ray diffracted intensity versus two-theta angle scans from oxide-metal interface to oxide-water interface showing the phases that are present in ZIRLO oxide layer formed in 360oC pure water environment. The subscripts “m” and “t” stand for monoclinic and tetragonal oxide peaks, “hyd” for hydride peak, and “Zr” for zirconium metal peaks.
In the bulk of the oxide, far from the oxide-metal interface, the strongest peak is the (111)m
peak (instead of m)111( observed in frontal geometry) [14], and its intensity varies throughout the oxide. The (101)t peak is the only tetragonal phase peak visible in the oxide (except right at the oxide-metal interface, see below). The periodicity observed in the intensity of the (020)m peak is discussed in the Texture Development in Oxide section below. In the oxide, the (020)m and (002)m peaks are observed in preference to the (200)m peak throughout most of the oxide thickness, indicating an alignment of the (200)m plane nearly parallel to the oxide-metal interface.
In the region close to the oxide-metal interface, where new oxide is being formed, a peak that can be indexed as the (002)t peak exhibits significant diffracted intensity. Within about 0.3–0.5

JOURNAL OF ASTM INTERNATIONAL 12
µm of the oxide-metal interface, this peak disappears, and monoclinic peaks become visible. This peak is believed to be a tetragonal precursor of the monoclinic phase as discussed in more detail in the Discussion section. This peak is quite prominent in the oxide layers formed on the surface of the tube samples autoclaved in a pure water environment. In oxides formed on the sheet samples in water, the (002)t peak is visible, but its intensity is very small compared to tube samples. This peak is not observed in any of the oxides formed on the three alloys in lithiated water. This includes one tubing sample (the Zr-2.5Nb oxide). Thus, this peak appears more prominently in water samples than in oxides formed in the Li environment and is more prominent in tubing samples. The reasons for this are discussed in the Discussion section.
Additional peaks are observed at the oxide-metal interface that can be indexed as the Zr3O suboxide phase (see red arrows in Fig. 6). These peaks are discussed in greater detail in the Phase Content section below.
In summary, diffraction data show that the oxide region near the interface is significantly different from the bulk of the oxide. This region exhibits a higher tetragonal fraction (as calculated from the Garvie-Nicholson formula), and an additional diffraction peak (002)t is seen that is not present in the bulk of the oxide. In the region away from the interface, the growing oxide is highly oriented, contains larger grains, exhibits a lower tetragonal oxide fraction, and the oxide texture varies periodically.
Phase Content
In their bulk, the oxides were found to contain both monoclinic and tetragonal oxide. Although the majority oxide phase within the oxide layer is monoclinic ZrO2, some tetragonal phase was always observed, even if its overall content was small, ranging from 4–15 % (calculated using a texture corrected Garvie-Nicholson formula) [4,15]. The relative amounts of tetragonal and monoclinic phase varied among the three alloys. The oxides formed in the Zr2.5Nb alloy exhibited overall less tetragonal phase than oxides formed on Zircaloy-4 and ZIRLO, in agreement with other previous observations [14,16,17] on binary Zr-Nb(-O) alloys. The tetragonal phase was found to be higher in the 1–2 microns closest to the oxide-metal interface, in agreement with numerous other observations (see e.g., [14,18,19]) . The comparison of tetragonal phase content for oxides formed in pure water [4] and lithiated water is shown in Table 5 for the three alloys. For samples tested in pure water, the tetragonal zirconia content was highest in Zircaloy-4, intermediate in ZIRLO, and lowest in Zr2.5Nb, so that as the tetragonal phase decreased, so did the corrosion rate. The same variation from alloy to alloy is roughly seen in the lithiated water. However, in the lithiated water case, the corrosion rankings are reversed with respect to pure water. This suggests that the tetragonal content in the oxide layer is primarily a function of the alloy and may not be directly related to corrosion rate.
TABLE 5—Tetragonal oxide phase fraction in the oxide-metal interface region (average in
first 0.5 µm from oxide-metal interface) using a texture-corrected Garvie Nicholson formula [4].
360oC Pure Water Environment
360oC Lithiated Water Environment
Zircaloy-4 15 % 10 % ZIRLO 13 % 8–9 % Zr-2.5Nb 8 % 2–3 %
MOTTA ET AL. ON SYNCHROTRON RADIATION 13
The diffraction results obtained from oxides formed in pure water were discussed previously [4] and are reviewed here briefly, in the context of comparing them with those obtained from oxides formed in lithiated water. In the oxides formed in pure water, the amount of tetragonal phase in the oxide-metal interface region was highest in Zircaloy-4, followed by ZIRLO, and lowest in Zr2.5Nb. It was also observed that the monoclinic (020)m peak and tetragonal (101)t peak varied periodically and out of phase with each other throughout the oxide.
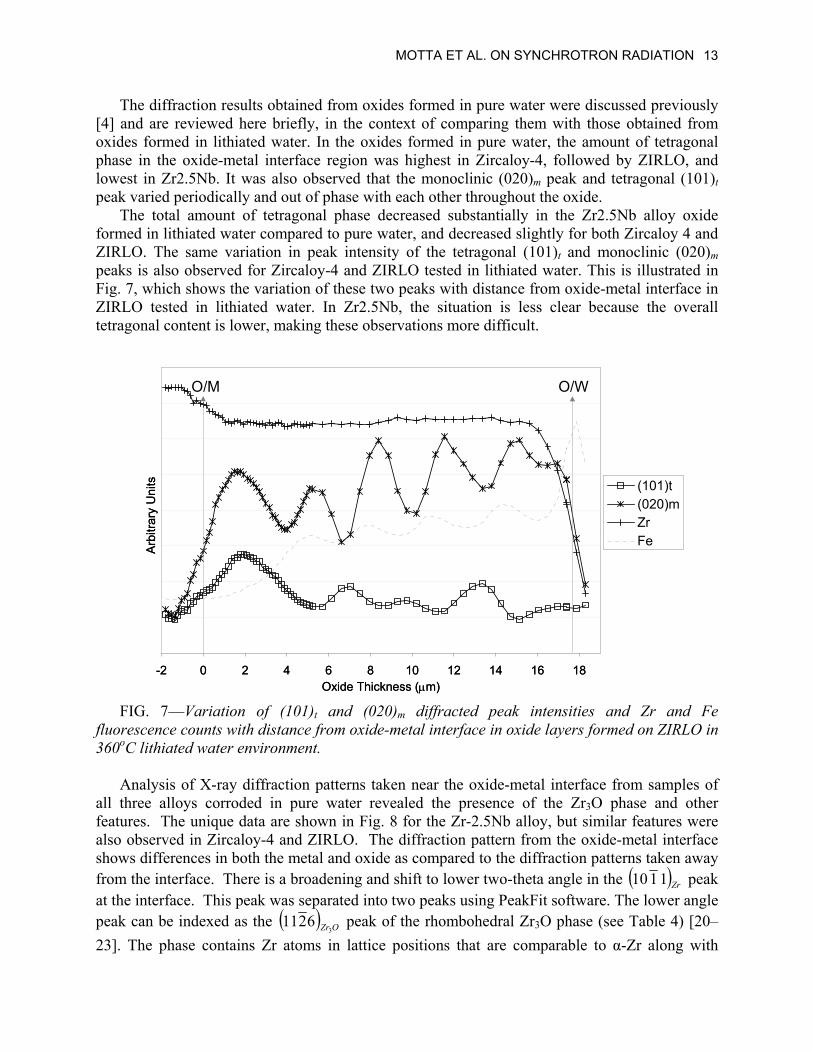
The total amount of tetragonal phase decreased substantially in the Zr2.5Nb alloy oxide formed in lithiated water compared to pure water, and decreased slightly for both Zircaloy 4 and ZIRLO. The same variation in peak intensity of the tetragonal (101)t and monoclinic (020)m peaks is also observed for Zircaloy-4 and ZIRLO tested in lithiated water. This is illustrated in Fig. 7, which shows the variation of these two peaks with distance from oxide-metal interface in ZIRLO tested in lithiated water. In Zr2.5Nb, the situation is less clear because the overall tetragonal content is lower, making these observations more difficult.
-2 0 2 4 6 8 10 12 14 16 18Oxide Thickness (µm)
Arb
itrar
y U
nits (101)t
(020)mZrFe
O/M O/W
-2 0 2 4 6 8 10 12 14 16 18Oxide Thickness (µm)
Arb
itrar
y U
nits (101)t
(020)mZrFe
O/M O/W
FIG. 7—Variation of (101)t and (020)m diffracted peak intensities and Zr and Fe
fluorescence counts with distance from oxide-metal interface in oxide layers formed on ZIRLO in 360oC lithiated water environment.
Analysis of X-ray diffraction patterns taken near the oxide-metal interface from samples of
all three alloys corroded in pure water revealed the presence of the Zr3O phase and other features. The unique data are shown in Fig. 8 for the Zr-2.5Nb alloy, but similar features were also observed in Zircaloy-4 and ZIRLO. The diffraction pattern from the oxide-metal interface shows differences in both the metal and oxide as compared to the diffraction patterns taken away from the interface. There is a broadening and shift to lower two-theta angle in the ( peak at the interface. This peak was separated into two peaks using PeakFit software. The lower angle peak can be indexed as the
)Zr1110
( ) OZr36211 peak of the rhombohedral Zr3O phase (see Table 4) [20–
23]. The phase contains Zr atoms in lattice positions that are comparable to α-Zr along with

JOURNAL OF ASTM INTERNATIONAL 14
ordered oxygen atoms that occupy octahedral interstitial sites. The higher angle peak is indexed as ( )Zr1110 . An additional Zr3O peak ( ) OZr3
0211 is seen near the ( )Zr0110 peak. However, this peak is not as clearly resolved due to the presence of nearby monoclinic ZrO2 peaks.
In the region near the oxide-metal interface, as mentioned above, a peak appears in the 0.3 µm near the interface that can be indexed as a (002)t peak (Fig. 8). This tetragonal orientation is parallel to the monoclinic (020)m orientation according to the orientation relationship given by [24]. Not visible in Fig. 8, but identified during deconvolution of the diffraction pattern, another peak is discerned at 29.3°, which can be indexed as corresponding to the (110)t plane, and which is parallel to the (002)m plane (see Discussion section). These peaks are believed to originate from a precursor columnar tetragonal phase that forms before the monoclinic phase and transforms when the grain size increases beyond a critical value. With the orientation these peaks exhibit, they clearly would not contribute to the overall tetragonal fraction calculated by the Garvie-Nicholson formula as discussed in the Discussion section.
26 27 28 29 30 312-θ
+1.5 µm
+1.0 µm
+0.5 µm
O/M
-0.5 µm
-1.0 µm
-1.5 µm
(002
) t(0
20) m
(002
) m
(111
) m(1
120)
Zr3O
(112
6)Zr
3O
(000
2)Zr
(101
0)Zr
(101
1)Zr
Met
alO
xide
26 27 28 29 30 312-θ
+1.5 µm
+1.0 µm
+0.5 µm
O/M
-0.5 µm
-1.0 µm
-1.5 µm
(002
) t(0
20) m
(002
) m
(111
) m(1
120)
Zr3O
(112
6)Zr
3O
(000
2)Zr
(101
0)Zr
(101
1)Zr
Met
alO
xide
26 27 28 29 30 312-θ
+1.5 µm
+1.0 µm
+0.5 µm
O/M
-0.5 µm
-1.0 µm
-1.5 µm
(002
) t(0
20) m
(002
) m
(111
) m(1
120)
Zr3O
(112
6)Zr
3O
(000
2)Zr
(101
0)Zr
(101
1)Zr
Met
alO
xide
FIG. 8—X-ray diffraction scans showing Zr3O suboxide phase and high (002)t peak of
Zr2.5Nb alloy oxide formed in 360°C pure water environment.
Texture Development in Oxide The development of texture and preferred orientation are important factors in determining the
stress accumulation associated with the growth of the oxide due to the Pilling-Bedworth ratio of 1.56. Previous studies have shown that the predominant texture in the oxide layer has the
m pole perpendicular to the oxide surface [14] (see Table 4 for monoclinic unit cell parameters). Such orientation of the
)014(m)014( pole should minimize the stresses from oxide
growth. [14,25–27] Oxide peaks of particular interest are the triplet of peaks, (200)m, (020)m, and (002)m. These
poles are oriented in three widely separated directions and therefore provide a reasonable means
MOTTA ET AL. ON SYNCHROTRON RADIATION 15
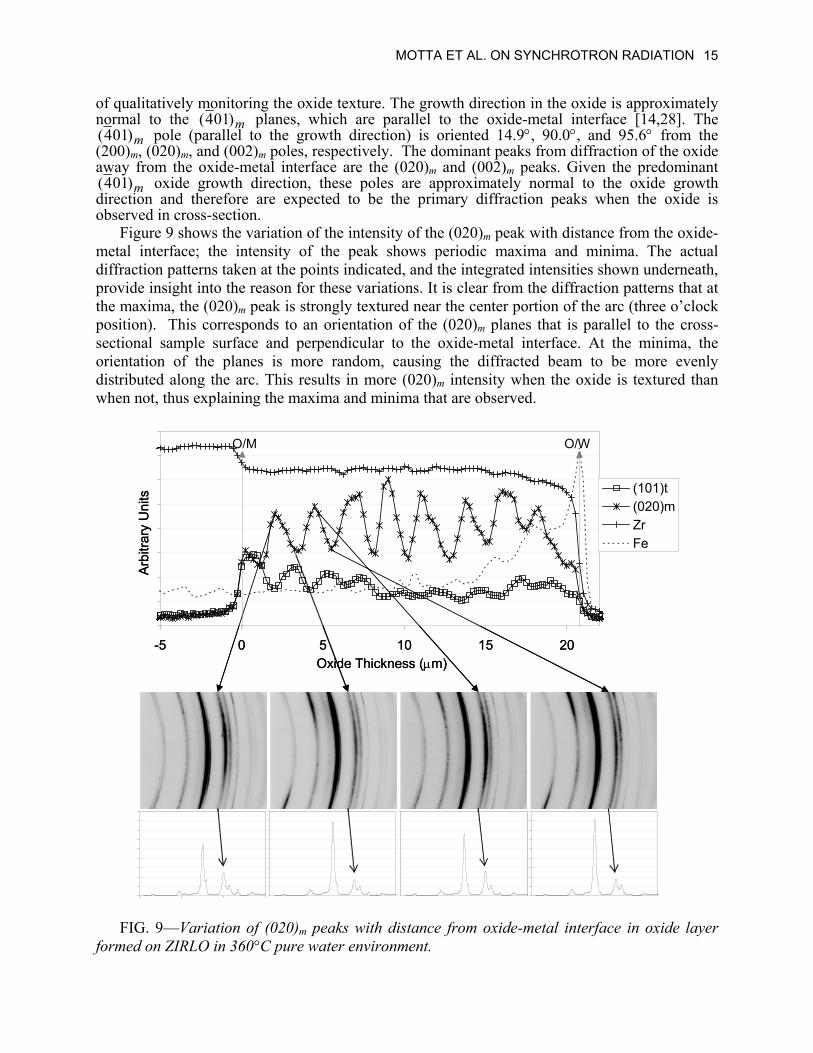
of qualitatively monitoring the oxide texture. The growth direction in the oxide is approximately normal to the m( planes, which are parallel to the oxide-metal interface [14,28]. The )014
m pole (parallel to the growth direction) is oriented 14.9°, 90.0°, and 95.6° from the (200)
)014(m, (020)m, and (002)m poles, respectively. The dominant peaks from diffraction of the oxide
away from the oxide-metal interface are the (020)m and (002)m peaks. Given the predominant m oxide growth direction, these poles are approximately normal to the oxide growth
direction and therefore are expected to be the primary diffraction peaks when the oxide is observed in cross-section.
)014(
Figure 9 shows the variation of the intensity of the (020)m peak with distance from the oxide-metal interface; the intensity of the peak shows periodic maxima and minima. The actual diffraction patterns taken at the points indicated, and the integrated intensities shown underneath, provide insight into the reason for these variations. It is clear from the diffraction patterns that at the maxima, the (020)m peak is strongly textured near the center portion of the arc (three o’clock position). This corresponds to an orientation of the (020)m planes that is parallel to the cross-sectional sample surface and perpendicular to the oxide-metal interface. At the minima, the orientation of the planes is more random, causing the diffracted beam to be more evenly distributed along the arc. This results in more (020)m intensity when the oxide is textured than when not, thus explaining the maxima and minima that are observed.
-5 0 5 10 15 20Oxide Thickness (µm)
Arbi
trary
Uni
ts (101)t(020)mZrFe
O/M O/W
-5 0 5 10 15 20Oxide Thickness (µm)
Arbi
trary
Uni
ts (101)t(020)mZrFe
O/M O/W
FIG. 9—Variation of (020)m peaks with distance from oxide-metal interface in oxide layer
formed on ZIRLO in 360°C pure water environment.

JOURNAL OF ASTM INTERNATIONAL 16
The comparison between the alloys is illustrated more clearly in Fig. 10, which shows an intensity contour diffraction map for the three alloys. The different periodicities seen in the three alloys are clearly observed in the heights of the (020)m peaks. It is also easy to notice the (002)t peak at the oxide metal interface, just adjacent to the (020)m peak, especially in ZIRLO and in Zr2.5Nb. The “downward drift” of the Zr peaks, (notice especially the ( 1110 ) peak in ZIRLO) corresponds to the Zr3O suboxide peaks observed near the interface. The (101)t peak is also seen throughout the oxide thicknesses just below the (111)m peak.
O/M O/W O/M O/W
O/M O/W
(111)m
(101)t
(111)m
(1010)Zr
(101)ZrH2
(002)t
(020)m
(0002)Zr
(002)m
(1011)Zr
(111)m
(101)t
(111)m
(101)ZrH2
(002)t
(020)m
(0002)Zr
(002)m
(1011)Zr
(1010)Zr
(111)m
(101)t
(111)m
(002)t
(020)m
(0002)Zr
(002)m
(1011)Zr
(1010)Zr
(a) (b)
(c)
O/M O/W O/M O/W
O/M O/W
(111)m
(101)t
(111)m
(1010)Zr
(101)ZrH2
(002)t
(020)m
(0002)Zr
(002)m
(1011)Zr
(111)m
(101)t
(111)m
(101)ZrH2
(002)t
(020)m
(0002)Zr
(002)m
(1011)Zr
(1010)Zr
(111)m
(101)t
(111)m
(002)t
(020)m
(0002)Zr
(002)m
(1011)Zr
(1010)Zr
(a) (b)
(c)
FIG. 10—Diffracted intensity contours across oxide thickness of (a) Zircaloy-4, (b) ZIRLO, and (c) Zr2.5Nb alloy oxides formed in 360°C pure water environment.
Oxide Grain Size from Line Broadening
For an unstressed solid, the particle size t can be calculated from the peak breadth by using the Scherrer formula [29]:
θλ
cos9.0
Bt = (1)
where λ is the wavelength, B is equal to 222 iBB −θ , B2θ is the broadening of the diffraction peak
due to particle size measured at half its maximum intensity (radians), Bi is the instrumental broadening, and t is the diameter of crystal particle. This formula is valid only when the particle size is less than 100–200 nm. The instrumental peak broadening is measured using a pattern

MOTTA ET AL. ON SYNCHROTRON RADIATION 17
measured from a LaB6 standard obtained from NIST (Standard Reference Material 660a Lanthanum Hexaboride Powder). The instrumental broadening was 0.051° in 2θ when λ is 0.1305 nm. During the peak fitting procedure, the peak widths (FWHM) of the (111)m and (101)t peaks were found in each of the diffraction patterns systematically collected from oxide layers of the Zr-based alloys examined.
Broadening at any given point is caused by particle size and strain due to stresses in the oxide. To minimize contributions of strain broadening, regions in the oxide far from the oxide-metal interface (where the stresses are more likely to be relaxed) were used in the analysis. If it is assumed that all broadening is caused by particle size, the Scherer formula, described in Eq 1, can be used to calculate the average particle size. It must be noted that the grain size as determined with the methodology described above is best suited to samples having random orientation and nearly equiaxed grains. The structures observed in these oxide films are strongly textured with columnar grains, which have an axis perpendicular to the oxide-metal interface [30]. In this experimental setup, the planes perpendicular to the oxide-metal interface diffract. Therefore, the measured grain size is associated with the width of the columnar grains, rather than the length.
The calculated grain sizes from the peak broadening for monoclinic and tetragonal phases are presented in Table 6. The tetragonal grains are significantly smaller than the monoclinic ones and remain nearly constant in size for the three alloys and autoclave environments. The monoclinic grains in Zr2.5Nb oxides are the largest of the three alloys in pure water but are slightly smaller in the lithiated water environment. The monoclinic grain sizes for Zircaloy-4 and ZIRLO are quite similar in the two environments. These measured values from peak broadening agree very well with results of the columnar widths measured by TEM, which will be published elsewhere. In a previous publication, oxide grain sizes in 360°C pure water that were calculated from peak broadening were mistakenly reported as twice their actual value [4]. These values are corrected and tabulated in Table 6.
TABLE 6—Oxide grain size calculations from broadening of the (111)m and (101)t oxide peaks.
360°C Pure Water
360°C Lithated Water
M(111)m 19.8 nm ±1 nm 21 nm±1 nm
Zirc
aloy
-4
T(101) t 7.6 nm ±0.6 nm 7.6 nm±1 nm
M(111)m 21 nm ±1 nm 20.9 nm±0.3 nm
ZIR
LO
T(101) t 7.8 nm ± 1.2 nm 8.6 nm± 0.5 nm
M(111)m 27.5 nm± 3 nm 19 nm± 1 nm
Zr-2
.5N
b
T(101) t 8 nm± 4 7.7 nm± 0.7 nm
JOURNAL OF ASTM INTERNATIONAL 18
Discussion
In this section the various experimental observations made in this study are put together to derive conclusions about the structure of various regions of the oxide (interface, bulk) and to propose a mechanism of oxide growth that is consistent with experiments. In studying the structure of oxides formed on Zr alloys and in attempting to relate this structure to the corrosion behavior of these alloys, it is often difficult to separate cause from effect. For example, is the higher fraction of tetragonal oxide found in the region near the oxide-metal interface a cause of the more protective nature of this layer, or is it an effect of this protective nature? It is also necessary to be conscious of possible artefacts induced by the sample preparation, sampling schedule, and trying to relate oxide properties measured ex-situ with alloy behavior in the autoclave.
For example, it has been previously proposed that periodicities observed in oxide structures were caused by the opening and closing operations of the autoclave to weigh samples rather than by the corrosion process itself. This is not the case in the current study, because the 360°C pure water samples were tested in the same autoclave with the same sample-weighing schedule and yet show vastly different periodicities, in agreement with prior results [31]. Because we examine bulk samples, with the oxide still attached to the metal, the artefacts related to relaxation of stress and consequent tetragonal destabilization due to dissolution of the underlying metal during sample preparation are minimized [1,2].
Oxide Periodicity
Several observations have revealed a periodic nature of the oxide layers formed in both water and lithiated water environments, as summarized in Table 3. These types of observations are different, and they all can shed light on the oxide growth process. In the first place, the periodicity can be seen as kinetic rate changes in the weight gains (Fig. 1), and when the weight gain at transition is converted into an oxide thickness, the values of the period are in very good agreement with those from other techniques. It is natural, then, to try to relate the periodicity to the oxide transition process.
The transmitted light optical microscopy observation of light and dark bands in the oxide (Figs. 4 and 5) extends in remarkably regular fashion throughout both the lateral and thickness directions of the oxide, indicating a repetitive process of oxide growth from beginning to end. The dark bands are interpreted as corresponding to a region with an increased density of smaller grains and possibly cracks that form just after oxide transition and that scatter light more efficiently, while the light bands correspond to well-aligned columnar grains. Similar bands, not as clear but with similar uniformity and lateral extension, were observed by Bryner [32] using optical microscopy and a cathodic vacuum etching procedure, during observation of oxides formed in Zircaloy-4 in water.
With just about the same periods, variations are observed in the diffracted intensity of the (020)m peak and of the (101)t peak, the former decreasing and the latter increasing just after transition. The decrease of the (020)m peak intensity at transition is attributed to a more random texture of the monoclinic phase just after transition (as illustrated in Figs. 7 and 9). The increase in (101)t tetragonal peak just after the transition is attributed to the nucleation of new grains. These zirconia grains, when they are small (<30 nm), exhibit a tetragonal crystal structure [33,34]. The tetragonal grains are associated with small grain size (Table 6). Because the tetragonal phase is stable up to approximately 30 nm, it is only when the grains become

MOTTA ET AL. ON SYNCHROTRON RADIATION 19
columnar in shape (i.e., no longer equiaxed) that the tetragonal to monoclinic transformation would be more likely to occur. Some of the tetragonal grains are properly oriented and grow into columnar tetragonal and then monoclinic grains. Others remain embedded in the oxide as small tetragonal grains, which cannot grow because they are not properly oriented for stress minimization.
A very similar and sharp periodic structure was observed by Kido and co-workers [35] in oxides formed on Zircaloy-4 in 360°C water containing Li levels up to 10 ppm and B levels up to 1600 ppm. Using SIMS (secondary ion mass spectrometry) they discerned sharp and periodic variations of B and Li concentrations in the oxide. Their periods were about 1.7 µm, which agrees well with our values for Zircaloy-4. In their case, the likely cause for the variations is similar to the reasons we proposed for the Fe variations shown in Fig. 2c, that is, at the transition the oxide becomes more cracked and porous and can absorb a larger quantity of B and Li from the solution. Thus, the peaks correspond to the oxide just after the transition.
Cracking is also observed at these locations in cross-sectional TEM samples. One possible explanation for these lateral cracks is that this higher density of small oxide grains could cause further cracking upon cooling from high temperature or during sample preparation, leading to the observation of periodic rows of cracks near the transition spacing. It is also possible that some of this cracking occurs at temperature, which would be the likely cause of the Fe oscillations observed in Figs. 2c and 7. The mechanism involved is that when the oxide breaks down at oxide transition, cracks are produced within that region that allow slightly greater ingress of Fe into the oxide, producing the observed peaks. As the oxide re-forms after transition, the protective nature of the layer increases, leading to less Fe ingress, and the process repeats.
The differences between the alloys and autoclave environments are also instructive. Different oxides have different transition periods and these are seen to correlate with corrosion resistance for a given environment. Also, X-ray fluorescence shows for the three alloys studied that the oxides formed in lithiated water exhibit a much higher porosity than those formed in pure water. Among the oxides formed in lithiated water, the oxide formed on ZIRLO showed a region near the oxide metal interface, which did not exhibit an increased concentration of iron and other elements from the autoclave, which correlates well with the better behavior of this alloy in lithiated water compared to Zr2.5Nb and Zircaloy-4.
The Bulk of the Oxide
In addition to exhibiting the periodic nature discussed in the paragraph above, the bulk of the oxides (regions far away from the interfaces) show other features of interest. In the bulk of the oxides, both monoclinic and tetragonal phases are seen. The overall texture of the monoclinic phase has the (200)m plane approximately parallel to the oxide-metal interface, so that the overall growth direction of the oxide is consistent with the m)140( orientation previously observed. The monoclinic grain sizes calculated from the (111)m peak line broadening are in good agreement with the columnar grain widths observed in TEM. From X-ray fluorescence, no significant elemental redistribution is observed in the oxides examined.
The Oxide-Metal Interface
For all the alloys studied, the region near the oxide-metal interface exhibited a different oxide structure than that in the bulk of the oxide. In the metal near the oxide, peaks consistent with the

JOURNAL OF ASTM INTERNATIONAL 20
Zr3O suboxide phase were observed in all samples, but with greater intensity in the water samples than in lithiated water samples. The formation of this suboxide phase is consistent with TEM observations showing that the region ahead of the oxide front exhibits a higher concentration of oxygen [36] and that there was an increase in yield stress in the region ahead of the oxide observed by nano-indentation techniques [37].
At the oxide-metal interface, a peak is observed that was identified as the (002)t peak. Another peak is discerned at 29.3° two-theta in the diffracted intensity as a result of peak deconvolution. This peak is indexed as the (110)t peak. The full width at half maximum of these peaks is similar to that of the (020)m and (002)m peaks, and no other tetragonal peaks (in particular no (101)t) are observed with similar intensity at that oxide location. This indicates a highly oriented tetragonal phase, observed only at the oxide-metal interface. The orientation relationship between tetragonal and monoclinic phase is (002)t//(020)m, and (110)t is approximately parallel to (002)m [24]. Thus, the monoclinic oxide orientations observed in the bulk of the oxide are also reflected in the orientation of the precursor tetragonal oxide.
The tetragonal fraction, calculated using a texture modified Garvie-Nicholson formula, is higher in the protective layer (first micron or so) near the oxide-metal interface than in the balance of the oxide. This is in agreement with many other studies of oxides of Zr alloys [1,2,14,19,28,38]. We note here that the determination of the tetragonal phase content by this procedure presupposes a random oxide texture. It is possible to correct the calculated content for texture, but a highly oriented tetragonal precursor of the monoclinic grain would not be taken into account here. These calculated tetragonal fraction values refer to the small grain tetragonal phase only, rather than to the aligned tetragonal columnar grains in the precursor. It is possible that some of the discrepancies in tetragonal phase fraction previously reported originate both in the variation of tetragonal fraction with depth (which cannot be resolved by bulk techniques) and in the highly oriented nature of the tetragonal phase seen near the oxide metal interface in this study.
Oxide Growth Mechanism
From the ensemble of the observations above, the following mechanism of oxide growth is proposed. Although these steps are consistent with the experimental data, the mechanism offered here still needs to be tested by further experiments.
1. At the beginning of the oxidation, small oxide grains nucleate with a comparatively high percentage of tetragonal grains because of the stabilization of the tetragonal phase relative to monoclinic afforded principally by the small grain size (possibly aided by high stress and oxide sub-stoichiometry), as shown in Fig. 11a. The outer part of the oxides contains mostly small grains as observed in this work using TEM, and also the full-width half maximum of the diffraction peaks increases near the oxide-water interface, indicating small grains.
2. Some of these tetragonal grains are properly oriented for growth (they have their ( or
t)110
t)011( planes parallel to the oxide-metal interface), so they are self-selected to grow, as shown in Fig. 11b. As these oxide grains grow, they become columnar, and when they pass a critical column length, they transform to monoclinic oxide maintaining the same orientation. This is the reason for the observed monoclinic intensity increase in the protective oxide (Figs. 7 and 10) with distance from the oxide metal interface. The
MOTTA ET AL. ON SYNCHROTRON RADIATION 21
tetragonal grains that are improperly oriented remain as small tetragonal grains embedded in the oxide, which agrees with the fact that, as seen in Figs. 6, 7, and 10, the tetragonal intensity does not go to zero in the layer.
3. Those monoclinic columnar grains oriented with (200)m near the oxide-growth direction grow into the metal. This is supported by the observation of preferential (200)m plane alignment with the oxide-metal interface observed by us and several others. When the columnar grains reach aspect ratios of 4–5 (observed columnar grains have aspect ratios of 4–5), small mismatches in crystalline orientation relative to the preferred orientation cause stress to accumulate. This causes the columnar grains to stop growing and requires re-nucleation to occur at the leading edge of the grain, as illustrated in Fig. 11c.
4. Whenever re-nucleation occurs at the end of the grain, the freshly created small equiaxed grains have a higher percentage of tetragonal phase (because they are equiaxed and small), and thus, in that location a high tetragonal fraction is observed in our work and others. Because larger columnar grains have to renucleate less frequently, the tetragonal fraction is lower in large grained oxides in pure water. This is supported by the observation of a small tetragonal fraction in Zr-Nb alloy oxides, which also have a larger grain size. The tetragonal oxide formed at this stage is thought to be the highly oriented tetragonal phase, responsible for the (002)t peak observed in Fig. 6. Many observations were performed of oxides at different stages of the corrosion process, and a similar structure exists at different corrosion stages at the interface, supporting this mechanism.
5. On the scale of the overall oxide thickness, stresses accumulate in the bulk of the oxide that eventually cause the oxide to crack and globally undergo transition (at least on a lateral scale of ~ cm2). This causes a global renucleation of the oxide grains, again with a greater percentage of tetragonal, but now over a much wider area, as illustrated by the large scale vertical and horizontal porosity sketched in Fig. 11d. This is what causes the tetragonal intensity to increase and the monoclinic intensity to decrease just after the transition in the oxide (Figs. 7 and 9).
6. The process restarts from the beginning (Fig. 11e) and is periodic. The numerous observations of periodicity in the oxide structure by transmitted light optical microscopy, synchrotron radiation, and also TEM mentioned in this work support this assertion. TEM observations of oxides in Zr alloys [39] have also revealed bands of equiaxed small grains parallel to the oxide-metal interface that were flanked on both sides by vertical columnar oxide grains. Figure 11f shows what the microstructure of the oxide would be after several transitions. In this view, the advancement of the oxide depends essentially on what has been occurring in the last layer.
If the above oxide-growth mechanism is tested and verified, and if it is shown to be prevalent
in the different oxides, it can serve as a template to compare and understand mechanistically the differences in corrosion behavior of different alloys. Different alloys could have different columnar grain sizes, for example, or different rates of oxide re-nucleation, etc., potentially resulting in different rates within the above mechanism.
It is not clear yet what role the suboxide region has on the oxide growth process. Also recent studies have indicated a role of oxide-metal epitaxy in the oxide structure [40], while others have shown little epitaxy [26]. The role of epitaxy needs to be investigated further.

JOURNAL OF ASTM INTERNATIONAL 22
(a)
(b)
(c)
(d)
(e)
O/W
O/M
(f)
FIG. 11—Schematic description of the proposed mechanism for advancement of the oxide
layer based on the experimental observations, as described in the text. Successive cartoons indicate successive snapshots of the advancement of the oxide layer and of the microstructure of the oxide as a function of overall oxide thickness and distance from the oxide-metal interface.

MOTTA ET AL. ON SYNCHROTRON RADIATION 23
Conclusions
Oxides formed on three different alloys (Zircaloy-4, ZIRLO, and Zr2.5Nb) in two different environments (water and lithiated water) were examined with the objective of discerning the structural differences in the oxide responsible for the change in corrosion behavior between oxides. The main conclusions are:
1. Regular periodicity in the corrosion process was observed using various techniques, all
showing remarkable agreement with and corresponding well to the oxide transition thickness. The observation of periodicity throughout the oxide thickness indicates a corrosion process that is repetitive with a constant period from beginning to end.
2. The structure of the oxide at the oxide-metal interface is different from that in the bulk of the oxide and does not change significantly as the oxide advances, indicating a restructuring of the oxide in the region behind the oxide front.
3. The oxide formed right after transition is different qualitatively from the oxide formed during the slow growth of the protective layer exhibiting smaller grains and higher tetragonal fraction.
4. The evidence from fluorescence measurements shows that oxides formed in lithiated water are considerably more porous than those formed in water. Among the oxides formed in lithiated water, ZIRLO exhibits a less porous oxide layer near the oxide-metal interface and a regular periodicity. This alloy performs significantly better in lithiated water than Zircaloy-4 and Zr2.5Nb.
5. The texture evolution in the oxide shows that away from the oxide-metal interface, the oxide is preferentially oriented with the (200)m pole parallel to the growth direction of the oxide. The better performing oxides are more highly oriented. Periodic variations are seen in the (020)m reflection that are believed to be associated with the oxide transition. Some evidence indicates that these columnar monoclinic grains form first as highly oriented tetragonal grains.
6. Oxides that behave well in corrosion tend to have large, well aligned columnar grains, with the (200)m plane aligned parallel to the oxide-metal interface. The tetragonal fraction does not appear to be directly related to corrosion rate, but rather to the alloy.
7. A periodic oxide growth mechanism with multiple transitions is proposed, which could be used as a basis for comparison of corrosion behavior of different alloys.
Acknowledgments
The authors would like to acknowledge J.-L. Béchade of CEA and P. Barberis of Cezus for helpful discussions, and Marcelo Silva at Penn State for help with peak fitting. A. Motta would like to thank the CEA-Saclay/SRMA for their hospitality and support during a sabbatical period spent there in 2003. This work was supported by a DOE-NERI grant number DE-FC03-99SF21918 and by a DOE I-NERI grant no. DE-FG07-03RL14530. Use of the Advanced Photon Source was supported by the U.S. Department of Energy, Basic Energy Sciences, Office of Science, under Contract No. W-31-109-Eng-38.
JOURNAL OF ASTM INTERNATIONAL 24
References
[1] Godlewski, J., "How the Tetragonal Zirconia is Stabilized in the Oxide Scale that is Formed on a Zirconium Alloy Corroded at 400 C in Steam," 10th Int. Symp. on Zr in the Nuclear Industry, ASTM STP 1245, ASTM International, West Conshohocken, PA, 1994, pp. 663–686.
[2] Godlewski, J., Gros, J. P., Lambertin, M., Wadier, J. F., and Weidinger, H., "Raman Spectroscopy Study of the Tetragonal-to-Monoclinic Transition in Zirconium Oxide Scales and Determination of Overall Oxygen Diffusion by Nuclear Microanalysis of 18O," 9th International Symposium on Zr in the Nuclear Industry, ASTM STP 1132, Kobe, Japan, ASTM International, West Conshohocken, PA, 1991, pp. 416–436.
[3] Tupin, M., Pijolat, M., Valdivieso, F., Soustelle, M., Frichet, A., and Barberis, P., "Differences in Reactivity of Oxide Growth during the Oxidation of Zircaloy-4 in Water Vapour before and after the Kinetic Transition," Journal of Nuclear Materials, Vol. 317, 2003, pp. 130–144.
[4] Yilmazbayhan, A., Motta, A. T., Comstock, R. J., Sabol, G. P., Lai, B., and Cai, Z., "Structure of Zirconium Alloy Oxides Formed in Pure Water Studied with Synchrotron Radiation and Optical Microscopy: Relation to Corrosion Rate," Journal of Nuclear Materials, Vol. 324, 2004, pp. 6–22.
[5] Pecheur, D., Lefebvre, F., Motta, A. T., Lemaignan, C., and Charquet, D., "Oxidation of Intermetallic Precipitates in Zircaloy-4: Impact of Irradiation," 10th International Symposium on Zirconium in the Nuclear Industry, ASTM STP 1245, Baltimore, MD, ASTM International, West Conshohocken, PA, 1994, pp. 687–705.
[6] Pecheur, D., Filippov, V. P., Bateev, A. B., and Ivanov, J. J., "Mossbauer Investigations of the Chemical States of Tin and Iron Atoms in Zirconium Alloy Oxide Film," 13th Symposium on Zr in the Nuclear Industry, ASTM STP 1423, Annecy, ASTM International, West Conshohocken, PA, 2002, pp. 135–153.
[7] Takeda, K. and Anada, H., "Mechanism of Corrosion Degradation in Sn," 12th International Symposium on Zr in the Nuclear Industry, ASTM STP 1354, Toronto, Canada, ASTM International, West Conshohocken, PA, 2000, pp. 592–608.
[8] Sabol, G. P., Kilp, G. R., Balfour M. G., and Roberts, E., "Development of a Cladding Alloy for High Burnup," 8th International Symposium on Zirconium in the Nuclear Industry, ASTM STP 1023, San Diego, ASTM International, West Conshohocken, PA, 1989, pp. 227–244.
[9] Cai, Z., Lai, B., Yun, W., Ilinski, P., Legnini, D., Maser, J., et al. "A Hard X-ray Scanning Microprobe for Fluorescence Imaging and Microdiffraction at the Advanced Photon Source," The Sixth International Conference for X-ray Microscopy, AIP Proceedings 507, 2000, p. 472.
[10] Pecheur, D., Godlewski, J., Billot, P., and Thomazet, J., "Microstructure of Oxide Films Formed during the Waterside Corrosion of the Zircaloy Cladding in Lithiated Environment," 11th International Symposium on Zr in the Nuclear Industry, ASTM STP 1295, Garmisch-Partenkirchen, ASTM International, West Conshohocken, PA, 1995, pp. 94–113.
[11] Vincze, L., Janssens, K., Adams, F., Rivers, M. L., and Jones, K. W., "A General Monte Carlo Simulation of ED-XRF Spectrometers - II: Polarized Monochromatic Radiation, Homogeneous Samples," Spectrochimica Acta, Vol. 50B, 1995, pp. 127–147.

MOTTA ET AL. ON SYNCHROTRON RADIATION 25
[12] Vincze, L., Janssens, K., Adams, F., and Jones, K. W., "A General Monte Carlo Simulation of Energy-Dispersive X-ray Fluorescence Spectrometers - Part 3. Polarized Polychromatic Radiation, Homogeneous Samples," Spectrochimica Acta Part B, Vol. 50, 1995, pp. 1481–1500.
[13] Yilmazbayhan, A., Delaire, O., Motta, A. T., Birtcher, R. C., Maser, J. M., and Lai, B., "Determination of the Alloying Content in the Matrix of Zr Alloys Using Synchrotron Radiation Microprobe X-ray Fluorescence," Journal of Nuclear Materials, Vol. 21, 2003, pp. 221–232.
[14] Petigny, N., Barberis, P., Lemaignan, C., Valot, C., and Lallemant, M., "In Situ XRD Analysis of the Oxide Layers Formed by Oxidation at 743 K on Zircaloy-4 and Zr-1NbO," Journal of Nuclear Materials, Vol. 280, 2000, pp. 318–330.
[15] Garvie, R. C. and Nicholson, P. S., Journal of the American Ceramic Society, Vol. 55, 1972, pp. 303.
[16] Bossis, P., Thomazet, J., and Lefebvre, F., "Study of Mechanisms Controlling the Oxide Growth Under Irradiation: Characterization of Irradiated Zircaloy-4 and Zr-1Nb-O Oxide Scales," 13th International Symposium on Zirconium in the Nuclear Industry, ASTM STP 1423, Annecy, France, ASTM International, West Conshohocken, PA, 2001, pp. 190–221.
[17] Bechade, J. L., Dralet, R., Goudeau, P., and Yvon, P., Materials Science Forum, Vols. 347–349, 2000, pp. 471–478.
[18] Valot, C., Ciosmak, D., Mesner, M. T., and Lallemant, M., "Phase Analysis by Variable Incidence X-ray Diffraction: Application to Zirconium Oxidation," Oxidation of Metals, Vol. 48, 1997, pp. 329–345.
[19] Béchade, J.-L., Brenner, R., Goudeau, P., and Gailhanou, M., Materials Science Forum, Vols. 404–407, 2002, pp. 803–808.
[20] Holmberg, B. and Magneli, A., "Preliminary Note on the Solubility of Oxygen in Alpha-Zirconium," Acta Chemica Scandinavica, Vol. 12, 1958, p. 1341.
[21] Holmberg, B. and Dagerhamn, T., "X-ray Studies on Solid Solutions of Oxygen in Alpha-Zirconium," Acta Chemica Scandinavica, Vol. 15, 1961, pp. 919–925.
[22] Treco, R. M., "Effect of Small Additions of Oxygen on Lattice Constants and Hardness of Zirconium," Transactions of the American Institute of Mining and Metallurgical Engineers, Vol. 197, 1953, pp. 344–348.
[23] Ericsson, T., Ostberg, G., and Lehtinen, B., "Some Observations on Zr-O Solid Solutions with a Microprobe and by Electron Microscopy," Journal of Nuclear Materials, Vol. 25, 1968, pp. 322–327.
[24] Subbarao, E. C., Maiti, H. S., and Srivastava, K. K., "Martensitic Transformation in Zirconia," Physica Status Solidii, Vol. 21, 1974, pp. 9.
[25] Li, H., Glavicic, H. M., and Spuznar, J. A., "A Model of Texture Formation in ZrO2 Films," Materials Science and Engineering, Vol. A366, 2004, pp. 164–174.
[26] Lin, Y. P. and Woo, O. T., "Oxidation of Beta-Zr and Related Phases in Zr-Nb Alloys: An Electron Microscopy Investigation," Journal of Nuclear Materials, Vol. 277, 2000, pp. 11–27.
[27] Roy, C. and David, G., "X-ray Diffraction Analysis of Zirconia Films on Zirconium and Zircaloy-2," Journal of Nuclear Materials, Vol. 37, 1970, pp. 71–81.
[28] Bechade, J. L., Dralet R., Goudeau, P., and Yvon, P., "Studies of Zirconium Alloy Oxide Layers Using Synchrotron Radiation," Materials Science Forum, Vols. 347–349, 2000, pp. 471–478.

JOURNAL OF ASTM INTERNATIONAL 26
[29] Cullity, B. D., Elements of X-ray Diffraction, Addison-Wesley, Reading, MA, 1978. [30] Wadman, B., Lai, Z., Andren, H. O., Nystrom, A. L., Rudling, P., and Pettersson, H.,
"Microstructure of Oxide Layers Formed during Autoclave Testing of Zr Alloys," 10th International Symposium on Zr in the Nuclear Industry, ASTM STP 1245, Baltimore, ASTM International, West Conshohocken, PA, 1994, pp. 579–598.
[31] Gohr, H., Schaller, J., Ruhmann, H., and Garzarolli, F., "Long-Term In Situ Corrosion Investigation of Zr Alloys in Simulated PWR Environment by Electrochemical Measurements," 11th International Symposium on Zirconium in the Nuclear Industry, ASTM STP 1295, ASTM International, West Conshohocken, PA, 1996, pp. 181–202.
[32] Bryner, J. S., "The Cyclic Nature of Corrosion of Zircaloy-4 in 633 K Water," Journal of Nuclear Materials, Vol. 82, 1979, pp. 84–101.
[33] Garvie, R. C., "Stabilization of the Tetragonal Structure in Zirconia Microcrystals," The Journal of Physical Chemistry, Vol. 82, 1978, pp. 218–224.
[34] Garvie, R. C., "The Occurence of Metastable Tetragonal Zirconia as a Crystalline Size Effect," The Journal of Physical Chemistry, Vol. 69, 1965, pp. 1238–1243.
[35] Kido, T., Wada, S., Takahashi, T., Uchida, H., Komine, I., and Inoue, Y., "Behavior of Lithium and Boron in Irradiated and Unirradiated Oxides Formed on Zircaloy-4 Claddings," 12th International Symposium on Zr in the Nuclear Industry, ASTM STP 1354, Toronto, ASTM International, West Conshohocken, PA, 2000, pp. 773–792.
[36] Yilmazbayhan, A., Breval, E., Motta, A., and Comstock, R., "Transmission Electron Microscopy Examination of Oxide Layers Formed in Zr Alloys," to be submitted to the Journal of Nuclear Materials, 2005.
[37] Bechade, J.-L., Personal Communication, 2003. [38] Vrtilkova, V., Jaros, J., Cmakal, J., and Belovsky, L., "Corrosion of Zirconium Alloys,"
Light Water Reactor Fuel Performance Meeting, ANS, Park City, UT, 2000. [39] Doriot, S., Unpublished Research, CEA/SRMA, 2003. [40] Kim, H. G., Kim, T. H., and Jeong, Y. H., "Oxidation Characteristics of Basal (0002)
Plane and Prism (1120) Plane in HCP Zr," Journal of Nuclear Materials, Vol. 306, 2002, pp. 44–53.