Microstructural Modeling of Glass Cullet Reaction in ...
39
Microstructural Modeling of Glass Cullet Reaction in 1 Cementitious Systems 2 Mohammadreza Mirzahosseini 1 3 Abstract 4 Finely ground glass has the potential for pozzolanic reactivity and can serve as a 5 supplementary cementitious material (SCM). Glass reaction kinetics depends on both temperature 6 and glass composition. Microstructural modeling is a helpful approach to get better understanding 7 of cement hydration and microstructure development. Mechanical and performance properties of 8 concrete are directly related to the development of concrete microstructure, which is the 9 consequence of progress in cement hydration. This study initially provides a comprehensive 10 background about cement hydration process and microstructural modeling of the hydration. It then 11 utilizes results of experimental studies, i.e. isothermal calorimetry and thermogravimetric analysis, 12 to find kinetics equation parameters called “Avrami Constants”. For the first time, these constants 13 were found for three main components of cement, i.e. C3S, C2S, and C3A, and also for glass 14 particles smaller than 25 µm. Although modeling of cement hydration and cementitious systems 15 containing single glass particles showed promising results, simulations of combined glass types 16 and sizes showed that more work on microstructural models is needed to properly model the 17 reactivity of mixed glass particle systems. 18 Keywords: Microstructural modeling, cement hydration, Avrami constants, hydration kinetics, glass cullet, 19 supplementary cementitious material (SCM) 20 1 Post-Doctoral Researcher at Purdue University, West Lafayette, IN Preprints (www.preprints.org) | NOT PEER-REVIEWED | Posted: 17 May 2018 doi:10.20944/preprints201805.0239.v1 © 2018 by the author(s). Distributed under a Creative Commons CC BY license.
Transcript of Microstructural Modeling of Glass Cullet Reaction in ...

Microstructural Modeling of Glass Cullet Reaction in 1
Cementitious Systems 2
Mohammadreza Mirzahosseini1 3
Abstract 4
Finely ground glass has the potential for pozzolanic reactivity and can serve as a 5
supplementary cementitious material (SCM). Glass reaction kinetics depends on both temperature 6
and glass composition. Microstructural modeling is a helpful approach to get better understanding 7
of cement hydration and microstructure development. Mechanical and performance properties of 8
concrete are directly related to the development of concrete microstructure, which is the 9
consequence of progress in cement hydration. This study initially provides a comprehensive 10
background about cement hydration process and microstructural modeling of the hydration. It then 11
utilizes results of experimental studies, i.e. isothermal calorimetry and thermogravimetric analysis, 12
to find kinetics equation parameters called “Avrami Constants”. For the first time, these constants 13
were found for three main components of cement, i.e. C3S, C2S, and C3A, and also for glass 14
particles smaller than 25 µm. Although modeling of cement hydration and cementitious systems 15
containing single glass particles showed promising results, simulations of combined glass types 16
and sizes showed that more work on microstructural models is needed to properly model the 17
reactivity of mixed glass particle systems. 18
Keywords: Microstructural modeling, cement hydration, Avrami constants, hydration kinetics, glass cullet, 19
supplementary cementitious material (SCM) 20
1 Post-Doctoral Researcher at Purdue University, West Lafayette, IN
Preprints (www.preprints.org) | NOT PEER-REVIEWED | Posted: 17 May 2018 doi:10.20944/preprints201805.0239.v1
© 2018 by the author(s). Distributed under a Creative Commons CC BY license.
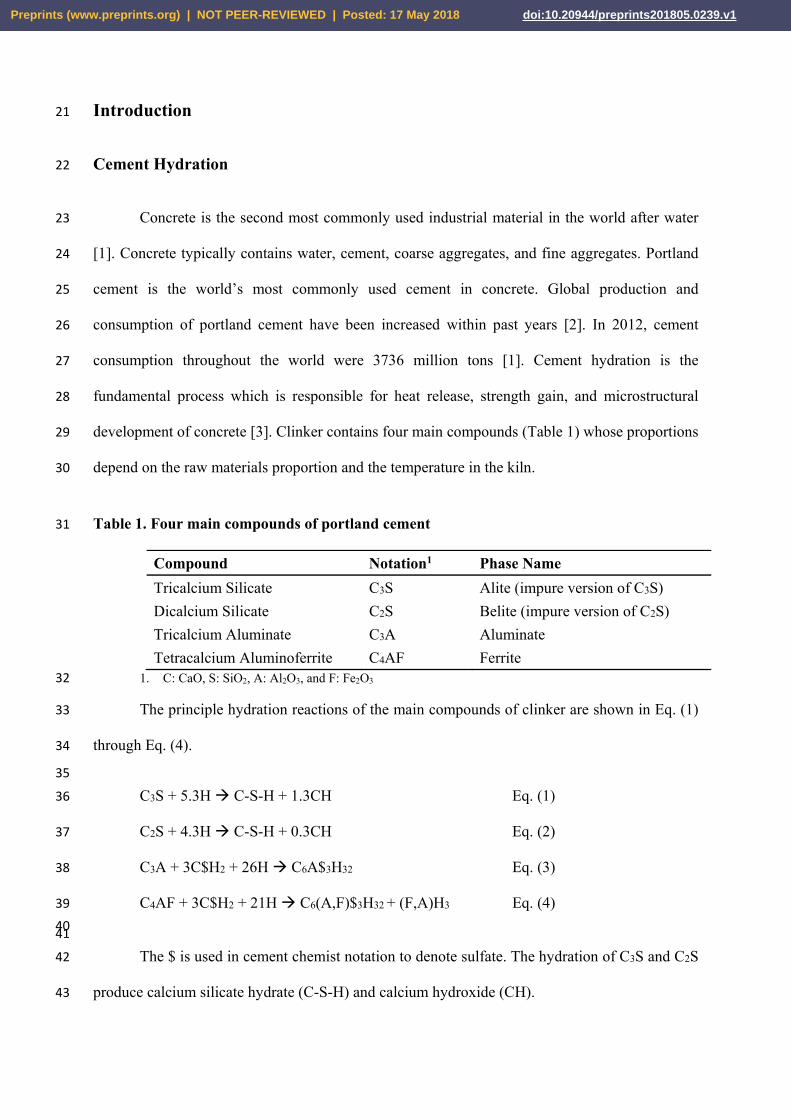
Introduction 21
Cement Hydration 22
Concrete is the second most commonly used industrial material in the world after water 23
[1]. Concrete typically contains water, cement, coarse aggregates, and fine aggregates. Portland 24
cement is the world’s most commonly used cement in concrete. Global production and 25
consumption of portland cement have been increased within past years [2]. In 2012, cement 26
consumption throughout the world were 3736 million tons [1]. Cement hydration is the 27
fundamental process which is responsible for heat release, strength gain, and microstructural 28
development of concrete [3]. Clinker contains four main compounds (Table 1) whose proportions 29
depend on the raw materials proportion and the temperature in the kiln. 30
Table 1. Four main compounds of portland cement 31
Compound Notation1 Phase Name Tricalcium Silicate C3S Alite (impure version of C3S) Dicalcium Silicate C2S Belite (impure version of C2S) Tricalcium Aluminate C3A Aluminate Tetracalcium Aluminoferrite C4AF Ferrite
1. C: CaO, S: SiO2, A: Al2O3, and F: Fe2O3 32
The principle hydration reactions of the main compounds of clinker are shown in Eq. (1) 33
through Eq. (4). 34
35 C3S + 5.3H C-S-H + 1.3CH Eq. (1) 36
C2S + 4.3H C-S-H + 0.3CH Eq. (2) 37
C3A + 3C$H2 + 26H C6A$3H32 Eq. (3) 38
C4AF + 3C$H2 + 21H C6(A,F)$3H32 + (F,A)H3 Eq. (4) 39 40 41 The $ is used in cement chemist notation to denote sulfate. The hydration of C3S and C2S 42
produce calcium silicate hydrate (C-S-H) and calcium hydroxide (CH). 43
Preprints (www.preprints.org) | NOT PEER-REVIEWED | Posted: 17 May 2018 doi:10.20944/preprints201805.0239.v1

During these reactions, each of these four phases releases some heat, making hydration an 44
exothermal chemical reaction [4]. Monitoring and measuring the amount of heat evolved during 45
cement hydration can provide valuable information to investigate mechanical and performance 46
properties of concrete. Figure 1 shows the isothermal heat of hydration (HOH) of a portland 47
cement. There are five distinct reaction stages shown in Figure 1: dissolution, induction, 48
acceleration, deceleration, and the transition/diffusion-controlled stage [4]. Comprehensive 49
explanations of these stages are available in the literatures [4,5,6-28]. 50
51
Figure 1. Hydration heat curve of portland cement paste 52
Factors Affecting Hydration Rate 53
Hydration rate varies for different cementitious materials, mixture properties, and 54
conditions. Chemical compositions of cementitious materials, w/cm, applied pressure, particle 55
Stage 2
Stage 1
Stage 5
Stage 4 Stage 3
Preprints (www.preprints.org) | NOT PEER-REVIEWED | Posted: 17 May 2018 doi:10.20944/preprints201805.0239.v1

sizes of cementitious materials, and curing temperature can all affect the rate of hydration of 56
cementitious materials [3]. In the case of portland cement, different amounts of C3S, C2S, C3A, 57
and C4AF result in different hydration heat (Table 2). C3S and C3A have the highest rate of reaction 58
and produce the greatest amount of heat per unit quantity in the cement [29]. 59
60 Table 2. Amount of heat produced per gram of each phase 61
Phases Hydration heat (J/g) C3S 500 C2S 260 C3A 866 C4AF 420
Another important factor is w/cm ratio which not only affects the hydration rate, but also 62
influences the degree of hydration (DOH) and strength gain of concrete. Higher w/cm ratios 63
enhance the cement rate of hydration during the acceleration period [30,31]. Particle size plays an 64
important role in hydration rate. As general rule, smaller particle sizes of cementitious systems 65
and finer cement can increase the rate of hydration [29,32-34]. Finer cementitious materials have 66
higher specific surface providing more available area to water and causing higher hydration rate. 67
Higher surface area of cementitious system has been found to produce thinner hydration product 68
resulting in higher final degree of hydration [3]. Influence of curing temperatures of the reaction 69
rate of cementitious materials can be surveyed from two aspects. First of all, elevated curing 70
temperatures can enhance the rate of hydration [35,36]. However, higher curing temperatures can 71
cause rapid formation of hydration products which means that the hydration gradually shifts to a 72
diffusion-controlled mechanism. This phenomenon makes it hard for water to access unreacted 73
cementitious materials and results in a lower rate of reaction at later ages and lower ultimate 74
hydration degree [3,37]. 75
Preprints (www.preprints.org) | NOT PEER-REVIEWED | Posted: 17 May 2018 doi:10.20944/preprints201805.0239.v1

Supplementary cementitious Materials (SCM) 76
Cement production is an energy-intensive process and responsible for 5-8% of global man-77
made CO2 emissions [38]. One of the most effective ways to reduce greenhouse gas emission and 78
consumed energy from the cement industry is to partially substitute cement by other siliceous and 79
aluminosiliceous material, known as Supplementary Cementitious Materials (SCM) [5,38]. SCMs 80
can improve the properties of hardened concrete containing SCMs through the pozzolanic reaction. 81
The pozzolanic reaction occurs when the CH reacts with amorphous silica of SCMs and water to 82
create more C-S-H gel. A typical form of the pozzolanic reaction can be expressed as Eq. (5): 83
Ca(OH)2 + SiO2 + H2O→ (CaO)(SiO2)(H2O) Eq. (5) 84
From a mechanical point of view, SCMs can increase the concrete ultimate compressive 85
strength. Lothenbach et al. [39] have shown that SCMs can improve concrete microstructure 86
through changes in C-S-H composition and changes in the porosity. The changes in the C-S-H 87
composition however depend on the SCM composition. One material which has been studied for 88
potential use as an SCM in concrete is waste glass cullet. 89
Glass Cullet in Concrete 90
Millions of tons of glass cullet are either landfilled or recycled throughout the world every 91
year [40]. However, landfilling has economic and environmental issues such as limited capacity 92
[41]. Additionally, recycling has also drawbacks such as not being able to recycle mixed color 93
glass [42]. As the economic and environmental consequences of landfilling and recycling rise, the 94
incentive to reuse glass cullet has grown. The concrete industry is one of the potential ways of 95
reusing millions of tons of glass cullet per year either as aggregate or SCM [43]. Several studies 96
have shown that glass behaves pozzolanically if ground finely enough, with a surface area of more 97
than 300 m2/kg [44-50]. Most studies on the effect of glass cullet on cementitious mixtures as an 98
Preprints (www.preprints.org) | NOT PEER-REVIEWED | Posted: 17 May 2018 doi:10.20944/preprints201805.0239.v1

SCM focused on mechanical and durability properties [51-54]. There are few studies which have 99
aimed to connect the microstructural properties of cementitious mixture containing glass powder 100
to performance characteristics of the glass mixtures. Federico [55] performed an extensive study 101
on the influence of glass powder on reaction kinetics and performance properties of cementitious 102
mixtures. 103
Introduction to Microstructural Modeling of Hydration Process 104
Microstructural modeling is a helpful tool to obtain better understanding of cement 105
hydration and microstructure development [6]. Mechanical and performance properties of concrete 106
are directly related to the development of concrete microstructure, which is the consequence of 107
progress in cement hydration [6,56]. Cement hydration is a complicated system making hydration 108
difficult to model [57]. This complexity is the main reason for which there has not been developed 109
a complete theory explaining cement hydration and chemical reaction, despite almost 200 years 110
having passed from invention of cement [58]. Nevertheless, many efforts have been made during 111
the past 40 years to microstructurally model hydration of cement and various cementitious 112
materials such as fly ash, slag, and SF [57-63]. For the first time, this study has used a recently-113
developed modeling platform called “µic the model” to model kinetics reactions of three main 114
phases of cement, i.e. C3S, C2S, and C3A, and to simulated pozzolanic reactivity of single type and 115
fraction size and combined types and particle sizes of finely ground glass cullet. 116
Background of Microstructural Modeling 117
Single Particle Model 118
The Single Particle Model was developed based on growing hydration products in layers 119
on single spherical particles by Kondo and Kodama in 1967 [64]. This model suggested that the 120
Preprints (www.preprints.org) | NOT PEER-REVIEWED | Posted: 17 May 2018 doi:10.20944/preprints201805.0239.v1

first layer of hydration products creates a protective layer, making dissolution harder and ending 121
the induction period. This layer is then consumed and acceleration period begins. Clifton et al. [65] 122
proposed a diffusion-based single particle model for C3S which has similar fundamentals to the 123
Kondo and Kodama’s model [64]; but has stronger mathematical bases. The strong point of this 124
model is its ability to account for the continuous integrity of products layers through the 125
boundaries. In addition to the mathematical models, some single-particle-based empirical models 126
have been developed. Parrot and Killoh [66] performed an X-ray diffraction (XRD) analysis to 127
extract a dissolution model considering cement types and sizes, w/cm, and relative humidity (RH). 128
Tomosawa [67] proposed an empirical model which is similar to Parro and Killoh’s [66], and takes 129
into account the effect of fineness of cement particles and w/cm on cement reaction kinetics. Both 130
of these empirical models are effective with spherical shapes and easy to be executed. However, 131
these empirical models are just valid for the property ranges used to develop the models and need 132
to be calibrated for other materials properties. The major drawbacks of the single particle model 133
are that the models are not able to consider interaction between particles and cannot evaluate total 134
cement reaction kinetic for different size ranges. 135
Nucleation and Growth Models 136
C-S-H nucleation and growth are consider and modeled as one process using Nucleation 137
and Growth models, despite they are two different mechanisms. The first type of Nucleation and 138
Growth model is Early Nucleation and Growth considering two main cases: site saturation and 139
continuous nucleation [64]. Site saturation happens when nucleation is very quick at the beginning 140
of hydration but suddenly stops. Continuous nucleation occurs when nucleation sites are not fully 141
consumed. The simplest and the most widely used nucleation and growth model is Johnson and 142
Mehl, Avrami, and Kolmogorov (JMAK) model typically used for C3S modeling. This model 143
utilizes mathematical rules to explain hydration products overlapping. The JMAK model however, 144
Preprints (www.preprints.org) | NOT PEER-REVIEWED | Posted: 17 May 2018 doi:10.20944/preprints201805.0239.v1

is not capable of providing physically meaningful parameters, is just valid in isothermal conditions, 145
and is not able to take into account the impact of cement surface area as an important criterion of 146
particle sizes on reaction rate. Regardless of these limitations, many researchers have implemented 147
the JMAK model to study different aspects of cement hydration. The first application of the JMAK 148
model is dated back to 40 years ago when Tenatousse and de Donder [68] used the model to find 149
out that the nucleation and growth process is not limited to the acceleration period and can be 150
considered as a contributing process during the deceleration period. Models proposed by Brown 151
et al. [69] and Gartner and Gaidis [70] are the other examples of using JMAK model. The model 152
by Brown et al.did not show conclusive results. The model by Gartner and Gaidistried to cast doubt 153
on spatial nucleation hypothesis in the JMAK model but it was not accepted. One of the other 154
approaches in nucleation and growth modeling is the Mathematical Boundary Nucleation and 155
Growth (BNG) model originally developed by Chan in 1956 [71]. This model assumes that C-S-156
H nucleation occurs merely on arbitrarily oriented and dispersed planar borders. A recent study 157
[72] showed that BNG models can deliver more significant and realistic results compared to the 158
JMAK models. On the other hand, the BNG model is just an estimation which means that the exact 159
boundary condition would not be evaluated and hydration of C3S is only accounted for. 160
Additionally, the BNG model is developed for a fixed surface area which is not true in real world. 161
Hydration Simulation Model 162
It should be noted that this type of models has a significant difference with those mentioned 163
above. The single particle and nucleation and growth models are mathematical models based on 164
scientific theory, whereas simulation models are the visualized applications of those principals. 165
Currently, advances in computer technologies have paved the way for researchers to study 166
complicated hydration of cementitious materials accurately and in more details [64]. The first 167
simulation model was developed by Frohnsdorff et al. [73]. Although this model did not broad 168
Preprints (www.preprints.org) | NOT PEER-REVIEWED | Posted: 17 May 2018 doi:10.20944/preprints201805.0239.v1

application until next 20 years, it could be fairly successful in simulating hydration kinetics and 169
formation of microstructure. The first published simulation model was in 1986 called the Jennings 170
and Johnson Microstructure Simulation model. They developed a 3D platform which utilized an 171
off-Lattice (Vector) approach to simulated cement hydration. Off-Lattice is a method of presenting 172
different shapes using their properties. Cement particles were simulated by spherical particles 173
randomly distributed in the paste cube. Hydration was also simulated through the decrease in 174
radius of reactant particles as hydration progresses, and an increase in thickness of hydration 175
products on the reactants’ surface. This proposed simulation model was capable of taking into 176
account many complicated mechanisms such as different particle sizes, overlapping phenomenon, 177
and position and quantity of CH crystals. However, the model had restricted computational 178
abilities making it not broadly advanced and implemented. Another simulation model developed 179
is the HymoStruc (HYdration, Morphology, and STRUCtural development) model developed by 180
Van Breugel [74]. This model utilizes a 3D platform for modeling, is traceable from computational 181
point of view, and uses the same principal as Jennings and Johnson’s for cement hydration. Though 182
the model had many shortcomings such as the model was able to simulated just one product, did 183
not explain the influence of pore solution, did not calculate overlapping phenomenon, and the 184
reaction rate was a function of particle size only. One of the fairly successful simulation models 185
was CEMHYD3D Digital Hydration model developed by Bentz and Garboczi [75]. This model 186
uses a 3D lattice-based platform on digital images. The discrete element approach was 187
implemented in this model. The model operates quickly, and is able to simulate non-spherical 188
cement particles. Additionally, the simulation model incorporates a broad range of phenomena 189
such as hydration heat, porosity, chemical shrinkage, setting time, and the effect of environmental 190
conditions on microstructural development. Not having a physical time scale and thermodynamic 191
information, as well as necessity of calibration of time scale and not being numerically convergent 192
are of the foremost drawbacks of the CEMHYD3D model. In order to solve some of drawbacks of 193
Preprints (www.preprints.org) | NOT PEER-REVIEWED | Posted: 17 May 2018 doi:10.20944/preprints201805.0239.v1

previous simulation models like restrictions of kinetics, limited implementation of different 194
materials, and deficiency of CEMHYD3D regarding convergence a series of probabilistic rules 195
were used by Bullard [76] to develop a stochastic simulation model known as HydratiCA 196
Simulation model. This model is capable of simulating dissolution, nucleation, growth, and 197
diffusion processes, as well as complicated reactions that happen in pore solutions. The two biggest 198
advantages of this model are: the ability of the model to deliver an accurate prediction of hydration 199
kinetics based on chemistry of solutions and temperatures, and user does not need to make any 200
modifications in parameters during simulation. The main drawback of this model is that the model 201
is cumbersome and computationally expensive, as several required inputs are needed to be 202
specified at the beginning of simulation. The last simulation model discussed in this study is the 203
multi-scale finite element-based model, called DuCom Hydration model which was developed by 204
University of Tokyo. This semi-empirical model was used to predict structures’ durability. This 205
model was a constructional model rather than a microstructural one. The main disadvantages of 206
this model were its dependency on merely empirical relations and using single particle approach 207
to simulate hydration [6]. Although many researches have carried out on microstructural modeling 208
of cement hydration, more work is still needed to obtain an accurate and comprehensive model 209
which is able to evaluate field performance of concrete, address material-related problems, and 210
simulate new cementitious materials. 211
µic the Model 212
The principles of the µic (reads mike) were obtained from the approach outlined by Navi 213
and Pignat [77]. µic has been designed in a way that it can be improved as our knowledge of 214
cement progresses. µic is a customizable modeling platform that enables users to model new 215
cementitious materials and reaction algorithm, to extensively develop in the future, to easily 216
interact with a friendly environment, to simulate a wide range of particles sizes as an influential 217
Preprints (www.preprints.org) | NOT PEER-REVIEWED | Posted: 17 May 2018 doi:10.20944/preprints201805.0239.v1

factor in cement hydration, and to use the model in regular computers. µic utilizes a fast and 218
resolution-free approach called “Vector Approach”. Vector approach, versus discrete approach, is 219
a widely accepted method using locations and sizes of objects to define objects’ geometry and to 220
simulate multi-scale materials like cement. However, since vector approach is expensive from 221
computational aspect some simplifying suppositions have been taken into account like spherical 222
approximation, statistical homogeneity, and reduced particle size distribution. Among these three 223
suppositions, spherical approximation has been executed for µic to make the model faster, as the 224
sphere is the most regular shape and has fastest computation time. Object-oriented programming 225
in Java also has been utilized in µic, as the most effective method for cement hydration to make 226
µic operate faster. This is achieved by storing information in diverse assemblies without noticeable 227
increases in required memory. µic simulates cement grains as spherical particles with determined 228
radius and initial coordination in a virtual computational cube. Cement hydration is then simulated 229
through decrease in radius of reacting particles, and simultaneous formation of hydration products 230
in different layers on available surface of unreacted phases or in porosities. In addition to 231
nucleation and growth of hydration products and by-products, overlapping of hydration products 232
is also included. 233
Experimental Program 234
Materials 235
Cement and Water 236
An ASTM C150 [78] Type I/II ordinary portland cement (OPC) was used in this study. 237
Table 3 shows the cement chemical composition as determined by X-ray fluorescence (XRF) 238
analysis. Potential primary cement components used in this study, calculated by Bogue equations 239
Preprints (www.preprints.org) | NOT PEER-REVIEWED | Posted: 17 May 2018 doi:10.20944/preprints201805.0239.v1

[78] and Rietveld analysis of XRD are summarized in Table 4. Distilled water was also used as 240
mixing water for this study. 241
Table 03. Chemical components of cementitious materials 242
243 244
Table 0. Potential composition of cement based on Bogue equations and Rietveld analysis 245
246
Glass Cullet 247
Clear and green glass was used in this study because previous research results showed that 248
clear glass is the most commonly available type of glass and green glass has the highest pozzolanic 249
reaction. Small impurities are added as coloring agent in glass production. These coloring agents 250
change the glass composition and structure. The source of clear glass was waste window glass 251
collected from recycling company at Kansas City, KS, and the source of green glass was bottle 252
glass from the same bottle manufacturer and bottle type collected from recycling center in 253
Manhattan, KS. The glass was washed and dried to remove any residues before crushing. After 254
crushing to smaller than 1.18 mm (No. 16), glass particles were milled in a laboratory ball mill. 255
After ball milling, the glass was wet-sieved using a sieve with 25 µm openings and isopropanol. 256
In addition to single glass types and particle sizes, one combination of the two glass types, green 257
and glass, and one narrow size ranges, 0-25 µm, were used in this study. The chemical 258
compositions of the glass powders used for this study are shown in Table 3, while Table 5 shows 259
Cementitious Materials
Chemical Components
SiO2 (%) Al2O3 (%) CaO (%) Na2O (%) K2O (%) Cr2O3 (%) Fe2O3 (%) CaCO3 (%)
OPC 19.66 4.71 62.74 0.12 0.56 - 3.26 2.2 Clear Glass 73.50 0.06 9.02 12.65 0.02 0.02 0.28 - Green Glass 73.10 1.65 10.55 12.34 0.58 0.24 0.44 -
Bogue equations Rietveld Analysis C3S (%)
C2S (%)
C3A (%)
C4AF (%)
Alite (%)
Belite (%)
Aluminate (%)
Ferrite (%)
Lime (%)
Calcite (%)
Gypsum (%)
58 11 7 10 64.1 14.6 4.36 10.01 0.40 2.54 4.03
Preprints (www.preprints.org) | NOT PEER-REVIEWED | Posted: 17 May 2018 doi:10.20944/preprints201805.0239.v1

glass powder density and Blaine fineness. Glass powder and cement particle size distribution is 260
shown in Figure 2, demonstrating that the gradation of glass powder is very similar to the cement 261
gradation. Particle shape and texture of cement grain and glass particles was investigated by 262
scanning electronic microscopy (SEM), as shown in Figure 3. 263
264
Table 5. Density and Blaine surface area of cementitious materials 265
Materials Density (Kg/m3) Blaine Surface Area (m2/Kg) OPC 3150 395 Clear Glass 0-25 µm 2477 433 Green Glass 0-25 µm 2501 476 Green 0-25 µm + Clear 0-25 µm (Mix 2) 2492 454.5
266
Figure 2. Gradation of cementitious materials 267
Preprints (www.preprints.org) | NOT PEER-REVIEWED | Posted: 17 May 2018 doi:10.20944/preprints201805.0239.v1

268
269
Figure 3. SEM Images; a. Cement grain, b. Clear glass 0-25 µm, c. Green glass 0-25 µm 270
Methodology 271
Cement Paste Preparation 272
Cement paste samples were made with a water-cementitious materials ratio (w/cm) of 0.35, 273
using a 25% replacement by mass of portland cement with individual clear or green glass powder 274
as well as combined types and sizes of glass cullet, as recommended by other studies [49]. Samples 275
were cured at 50°C in order to show hydration behavior at elevated temperature. Water and 276
cementitious materials were stirred at slow speed (500 rpm) for three minutes, followed by two 277
minutes rest, and then high speed (2000 rpm) for two minutes. Samples were pre-conditioned to 278
a b
c
Preprints (www.preprints.org) | NOT PEER-REVIEWED | Posted: 17 May 2018 doi:10.20944/preprints201805.0239.v1

the desired curing temperature before mixing. After mixing, paste samples for thermogravimetric 279
analysis (TGA) were casted in a polystyrene vials with diameter of 17 mm and height of 50 mm. 280
Paste samples with or without the glass powder were wet-cured beginning at six hours after casting 281
at three curing temperatures in a temperature-controlled chamber. 282
Isothermal Calorimetry 283
The hydration rate and total heat of hydration of cement were measured using an eight-284
channel isothermal calorimeter. Approximately 30 g of paste samples were placed in the sample 285
containers, weighed, and placed into the calorimeter. The time between initial contact of water and 286
cementitious materials and placing samples into the calorimeter was less than 15 min in all cases. 287
The influence of glass type and curing temperature on hydration kinetics could be observed as the 288
change in heat of hydration when the calorimetry results were normalized by the mass of dry 289
portland cement used in the paste. This change in heat of hydration is likely from the dilution effect 290
providing additional space for hydration product formation and glass powder providing nucleation 291
platform for calcium silicate hydrate (C-S-H) and glass hydration [79,80]. 292
Thermogravimetric Analysis (TGA) 293
To study the pozzolanic reactivity of glass powder, the calcium hydroxide (CH) content of 294
cement paste samples was measured by the thermogravimetric analysis (TGA) using the approach 295
outlined by Marsh [81]. Paste samples with or without the single particle and combined glass 296
powder were wet-cured starting at six hours after casting at three curing temperatures. At 1, 7, 28, 297
and 91 days after casting, hydration was stopped by solvent exchange with isopropanol. Paste 298
samples were cut from the 17-mm diameter samples into 2 mm thick discs and placed in 299
isopropanol for seven days. The samples were then dried in a vacuum for at least four days. To 300
minimize the risk of carbonation during casting, drying, and testing, high level of care was taken. 301
Preprints (www.preprints.org) | NOT PEER-REVIEWED | Posted: 17 May 2018 doi:10.20944/preprints201805.0239.v1

Finally, 30-50 mg of dried paste samples were ground and heated at a rate of 20°C/min to 1,000°C 302
in nitrogen atmosphere. 303
Hydration Modeling using µic 304
In this section, two single particles and two types, as well as one blended glass particles 305
and type of very finely ground glass are simulated by means of µic. 306
Modeling of Cement Hydration 307
In order to simulate glass cullet reactivity, the cement hydration needs to be modeled by 308
means of µic. Modeling cement hydration means to fit reaction kinetics equation parameters. For 309
this study, the reaction kinetics equation used for cement hydration as well as glass reactivity is 310
the Avrami equation. The Avrami equation is a nucleation and growth model which was initially 311
developed for metallic crystals. However, its S-shape is similar to the typical shape of cement 312
hydration. Its implicity also helps make it one of the most popular reaction kinetics equations used 313
for modeling cement hydration [6]. The Avrami equation can be expressed as Eq. (6) [82]: 314
– ln(1–α) = ktn Eq. (6) 315
where α is cement degree of hydration, t is elapsed time from initial contact of water and 316
cement, and k and n are Avrami parameters which depend on reaction rate and how crystals grow, 317
respectively. The Avrami constant n is a function of three additional parameters as shown in Eq. 318
(7): 319
n = (P/S) + Q Eq. (7) 320
where P is related to dimensions of products growths and can be 1, 2, or 3 for one-, two-, 321
or three-dimensional growth, respectively. Parameter S is 1 for interface controlled and 2 for 322
Preprints (www.preprints.org) | NOT PEER-REVIEWED | Posted: 17 May 2018 doi:10.20944/preprints201805.0239.v1

diffusion controlled mechanisms. Q is a function of rate of nucleation and can be 1 for continuous 323
nucleation and 0 for only initial nucleation [69]. Respectively selecting 3, 1, and 1 for P, S, and Q, 324
the value of n will be 4 for this study. Thus, the objective of modeling cement hydration is to find 325
the Avrami parameter k by fitting degree of hydration results obtained from µic to those obtained 326
from isothermal calorimetry. These values were used as fixed inputs for the next step of the 327
modeling process: modeling glass cullet. 328
The modeling in this study is done for three main compounds of cement, namely C3S, C2S, 329
and C3A, to attain more descriptive results. Having very complicated hydration products and 330
known to be rather slow reacting, C4AF has not been modeled in this study. Additionally, cement 331
hydration and glass reactivity are simulated only at 50°C because previous experimental results 332
showed that reaction rate of cement and pozzolanic reaction of glass cullet are more pronounced 333
at 50°C compared to 10°C and 23°C [83]. 334
Step 1 – Initial Settings 335
µic reads XML files that assign the hydration rate parameters and other inputs to the 336
modeling engine. These XML input files can be created by a graphical user interface program or 337
developed manually. From “File” tab in the command bar of the µic interface, “Load XML File” 338
or “Create New Reactor” is selected. In this window the name of reactor, size of virtual paste cube, 339
hydration time step, and some other initial settings such as pixel sizes and background color are 340
determined. For this study, the size of the virtual paste cube is set to be a 100 x 100 x 100 voxel 341
cube. Figure 4 shows a screen shot of the Reactor window. 342
Preprints (www.preprints.org) | NOT PEER-REVIEWED | Posted: 17 May 2018 doi:10.20944/preprints201805.0239.v1

343
Figure 4. Reactor window in µic 344
Step 2 – Materials Defining 345
Clicking on the “Materials” tab, a new window is opened in which all constituents used for 346
modeling are defined. The constituents and properties used for cement hydration modeling are 347
summarized in Table 6. Initial fractions of some constituents are volume percentages of those 348
constituents, and have been calculated through volumetric stoichiometry. Figure 5 also shows the 349
Materials window in µic. 350
Table 0. Properties of all materials used for cement hydration modeling in µic 351
Name Density Initial fraction Diffusivity Color Alite 3.21 0.2832 0.04 Belite 3.28 0.0646 0.04 Aluminate 3.03 0.0193 0.04 C-S-H 2.00 0.0 0.04 CH 2.20 0.0 0.04 Ettringite 2.00 0.0 0.04
352
Preprints (www.preprints.org) | NOT PEER-REVIEWED | Posted: 17 May 2018 doi:10.20944/preprints201805.0239.v1
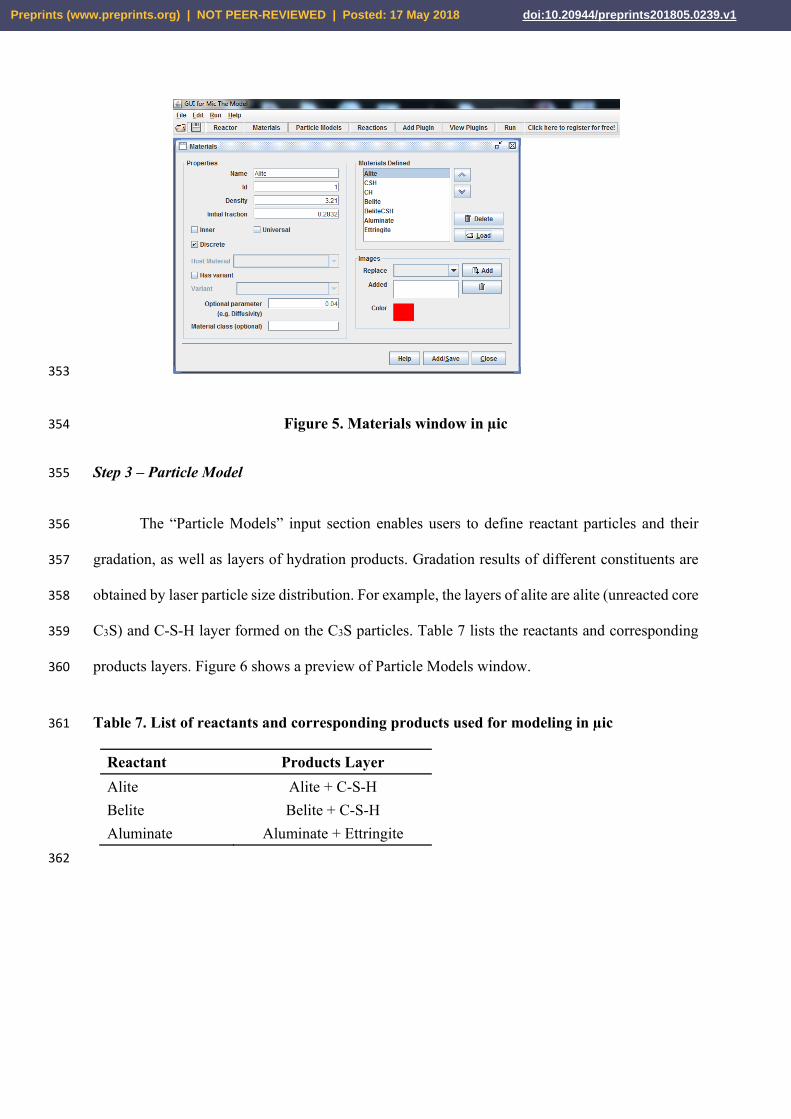
353
Figure 5. Materials window in µic 354
Step 3 – Particle Model 355
The “Particle Models” input section enables users to define reactant particles and their 356
gradation, as well as layers of hydration products. Gradation results of different constituents are 357
obtained by laser particle size distribution. For example, the layers of alite are alite (unreacted core 358
C3S) and C-S-H layer formed on the C3S particles. Table 7 lists the reactants and corresponding 359
products layers. Figure 6 shows a preview of Particle Models window. 360
Table 7. List of reactants and corresponding products used for modeling in µic 361
Reactant Products Layer Alite Alite + C-S-H Belite Belite + C-S-H Aluminate Aluminate + Ettringite
362
Preprints (www.preprints.org) | NOT PEER-REVIEWED | Posted: 17 May 2018 doi:10.20944/preprints201805.0239.v1

363
Figure 6. Particle Models window in µic 364
Step 4 – Reactions 365
A critical step in simulation in µic is to define reactions of different phases through 366
mathematical equations. Hydrations of different phases of cement are typically expressed as mass 367
equations, as previously shown in Eq. (1), Eq. (2), and Eq. (3).Since cement hydration is modeled 368
in a paste cube and all fractions and calculations are volumetric-based, reactions equations should 369
also be converted to volumetric equations. These conversions are done through stoichiometry and 370
by assigning densities. Material densities used in this study are shown in Table 8. Equations (8), 371
(9), and (10) show the volumetric equations for the reaction of different phases: 372
VC3S + 1.318VH 1.569VC-S-H + 0.593VCH Eq. (8) 373
VC2S + 1.476VH 2.166VC-S-H + 0.189VCH Eq. (9) 374
VC3A + 2.53VC$H2 + 5.27VH 7.84VC6A$3H32 Eq. (10) 375
“Reactions” window allows users to define and customize different hydration equations. 376
In this study, hydration equations (8), (9), and (10) are plugged into µic. As shown in Figure 7. 377
Preprints (www.preprints.org) | NOT PEER-REVIEWED | Posted: 17 May 2018 doi:10.20944/preprints201805.0239.v1

378
Figure 7. Particle Models window in µic 379
Step 5 – Plugins 380
“Plugins” is a list of several types of hydration model. Users are able to select desired 381
model depending on objective of the modeling, or add new customized plugins in Java to the list. 382
As mentioned earlier, this study uses Avrami model for cement hydration. Figure 8 shows how 383
Avrami model is selected. 384
385
Figure 8. Selection of Avrami kinetics model 386
Preprints (www.preprints.org) | NOT PEER-REVIEWED | Posted: 17 May 2018 doi:10.20944/preprints201805.0239.v1

Then Avrami constants, starting time (set to zero), initial degree of hydration (set to zero), 387
order of implementation of kinetics (set to one for all, as all reactions happen simultaneously), and 388
types of reactions and reactants are determined. Figure 9 shows a set Avrami model for alite 389
hydration. 390
391
Figure 9. Avrami model set for alite hydration 392
Step 6 – View Plugins 393
This window allows users to control all determined plugins. 394
Step 7 - Run 395
After saving the project, users can run the model. Once the model runs, a folder in the name 396
of project is automatically created which contains a cross section of simulated hydration at each 397
time steps (Figure 10), as well as an excel file that gives the degree of hydration and changes in 398
volume of all constituents at each time steps. The black pixels shown in Figure 10 are porosity. 399
Preprints (www.preprints.org) | NOT PEER-REVIEWED | Posted: 17 May 2018 doi:10.20944/preprints201805.0239.v1

Modeling of Glass Cullet Reactivity 400
Single type and particle size 401
Modeling of pozzolanic reaction of two glass types (i.e. clear and green) and one single 402
particle size (<25 µm) of finely ground glass followed the same basic modeling steps as those 403
explained for cement hydration modeling, with only a few alterations. Clear glass smaller than 25 404
µm, green glass smaller than 25 µm, and pozzolanic C-S-H were added to the previous 405
constituents, but simulated through separate models to determine the reaction rate parameters to 406
use for each material by itself. Table 8 shows the properties of the individual types of glass in µic. 407
Table 0. Properties of glass particles used for pozzolanic reaction modeling in µic 408
Name Density Initial fraction Diffusivity Color Clear <25 µm 2.48 0.1455 0.0 Green <25 µm 2.50 0.1455 0.0 Pozzolanic C-S-H 2.00 0.0 0.04
409
In the “Particle Models” window, gradations of glass particles obtained from laser particle 410
size distribution device were defined. Reactants and products layers on glass particles were also 411
determined. Table 9 lists the glass reactants and corresponding hydration products. 412
Preprints (www.preprints.org) | NOT PEER-REVIEWED | Posted: 17 May 2018 doi:10.20944/preprints201805.0239.v1

413
414
Figure 10. Cross sections of simulated cement hydration at 50°C: a. 1 day, b. 28 days, c. 91 days, 415
and d. 365 days 416
Table 0. List of glass reactants and corresponding products used for modeling in µic 417
Reactant Products Layer Clear <25 µm G025 + C-S-HG025 Green <25 µm GG025 + C-S-HGG025
418
The pozzolanic reaction equation for glass cullet used in concrete was determined by Saeed 419
et al. [43] and is shown determine in Eq. (11): 420
C1S6.11N1.1 + 6.15CH + 9.15H C7.15S6.11N1.1H15.3 Eq. (11) 421
c
a b
d
Preprints (www.preprints.org) | NOT PEER-REVIEWED | Posted: 17 May 2018 doi:10.20944/preprints201805.0239.v1

where N is shorthand for Na2O. Using the material densities shown in Table 8 and the 422
stoichiometric calculations from Eq. (11) give a volumetric-based equation shown in Eq. (12): 423
VC1S6.11N1.1 + 1.027VCH + 0.832VH 2.806VC7.15S6.11N1.1H15.3 Eq. (12) 424
The last step for modeling the pozzolanic reactivity of glass cullet was to obtain the Avrami 425
constants. These constants were attained through a trial-error process used in modeling to fit to the 426
CH content calculated curve determined by TGA measurements. 427
Combined glass types and particle sizes 428
The process of the modeling Mix 2 was the same as that previously outlined for cement 429
and single glass particles. To model combined glass types and sizes (Mix 2), the fit Avrami 430
constants for cement, Clear glass smaller than 25 µm, and Green glass smaller than 25 µm at 50°C 431
obtained by modeling them in separate steps were used. The only difference between modeling 432
Mix 2 and earlier materials is that the initial fractions of both Clear glass smaller than 25 µm and 433
Green glass smaller than 25 µm are 0.07275 instead of 0.1455 (see Table 8). 434
Results and Discussions 435
Avrami Constants for Cement 436
The Avrami constants found from fitting the model degree of hydration to the degree of 437
hydration found from isothermal calorimetry for three compounds of cement are shown in Table 438
10. Figure 11 shows the fit obtained from the modeling to the measured data. 439
440
441
Preprints (www.preprints.org) | NOT PEER-REVIEWED | Posted: 17 May 2018 doi:10.20944/preprints201805.0239.v1

Table 10. Avrami constants of three phases obtained by µic 442
Name Avrami Constants
k n Alite 5.8E–3 4.0 Belite 3.3E–3 4.0 Aluminate 7.0E–3 4.0
443 444
445
Figure 11. Fitting modeled to measured DOH results 446
Avrami Constants of Single Glass Cullet 447
Cross sections of simulated microstructures for cementitious systems containing green 448
glass smaller than 25 µm are shown in Figure 12. Following the same method discussed for 449
modeling clear glass, the Avrami parameters for the green glass smaller than 25 µm material were 450
fit using the TGA measurements as shown in Figure 13. The Avrami parameters for the pozzolanic 451
reactivity of Green glass smaller than 25 µm were found to be k = 1.0899E–5 and n = 1.5. 452
0
20
40
60
80
100
0 25 50 75
Deg
ree
of H
ydra
tion
(%
)
Time (Hr)
DOH Measured
DOH Modeled
R2 = 0.95
Preprints (www.preprints.org) | NOT PEER-REVIEWED | Posted: 17 May 2018 doi:10.20944/preprints201805.0239.v1

453
454
Figure 12. Cross sections of simulated pozzolanic reaction of Green glass <25 µm at 50°C: a. 1 day, 455
b. 28 days, c. 91 days, and d. 365 days 456
457
Figure 13. Fitting modeled to measured results of CH content for Green glass <25 µm at 50°C 458
0%
5%
10%
15%
20%
25%
0 100 200 300 400
% C
a(O
H)2
of
Dry
Cem
ent
Curing Age (Day)
Measured
Modeled
R2 = 0.95
c
a b
d
Preprints (www.preprints.org) | NOT PEER-REVIEWED | Posted: 17 May 2018 doi:10.20944/preprints201805.0239.v1

Avrami Constants of Combined Glass Cullet 459
Cross sections of simulated microstructures for cementitious systems Mix 2 are shown in 460
Figure 14. 461
462 463
464 Figure 14. Cross sections of simulated pozzolanic reaction of Mix 2 at 50°C: a. 1 day, b. 28 days, c. 465
91 days, and d. 365 days 466
The first interesting point is that the modeling of Mix 2 pozzolanic reactivity was in well 467
agreement with the calculated CH content obtained from the modeling of single particles 468
(R2=0.99) as shown in Figure 15. Results also showed that simulation for Mix 2 was not 469
satisfactory and the differences between measured and modeled values are significant. In other 470
words, the effect of particle sizes of on glass cullet pozzolanic reactivity could not be accounted 471
for through linear addition as expected to be obtained by microstructural modeling. This 472
c d
a b
Preprints (www.preprints.org) | NOT PEER-REVIEWED | Posted: 17 May 2018 doi:10.20944/preprints201805.0239.v1

discrepancy might be caused by some errors in Avrami constants attained in modeling of cement 473
and single glass particles. Another possible explanation for inaccurate modeling is the effect of 474
elevated curing temperatures on reactivity and mechanical properties of cementitious systems 475
containing Mix 2. As explained earlier, Mix 2 physical properties do not follow the linear-addition 476
behavior. In other word, elevated curing temperatures is an important parameter not only in 477
reactivity and mechanical properties of concrete containing mixed types and sizes of glass, but 478
also in microstructural modeling. 479
480
Figure 15. Fitting modeled to measured results of CH content for Mix 2 at 50°C 481
Conclusion 482
The objective of this study was to microstructurally model cement hydration and 483
cementitious systems containing single glass types and sizes and combined glass types and sizes. 484
In order to achieve these goals, a newly developed modeling platform called “µic” was used. 485
Modeling outputs were fitted to the results of experimental studies. Some minor errors were seen 486
in modeling cement and glass particles, especially at early ages. Despite acceptable fits of single 487
type and size of glass cullet, microstructural modeling could not verify that the effect of particle 488
size distribution on pozzolanicity (i.e. combined glass types and sizes) of glass powder is linear. 489
Preprints (www.preprints.org) | NOT PEER-REVIEWED | Posted: 17 May 2018 doi:10.20944/preprints201805.0239.v1

This inaccuracy can be attributed not only to some inherent limitations of microstructural modeling 490
such as limited knowledge about mechanisms of hydration kinetics, but also to accumulation of 491
minor errors in earlier steps of modeling, effects of some important factors such as curing 492
temperatures and gradation, and accuracy of reaction equations. It can be recommended that a 493
comprehensive stoichiometry study is performed on pozzolanic reaction of glass cullet to obtain a 494
precise equation which can be used in microstructural modeling platforms like µic. 495
Acknowledgment 496
This work has been funded by the National Science Foundation (CMMI-1032636). The 497
author would like to acknowledge Ash Grove Cement Company for performing XRF 498
measurements and measuring surface area and density of materials, and Kyle A. Riding for his 499
valuable advices. 500
501
Preprints (www.preprints.org) | NOT PEER-REVIEWED | Posted: 17 May 2018 doi:10.20944/preprints201805.0239.v1

References 502
[1] United Nation Environmental Program (UNEP) (2010). Greening Cement Production has 503
a Big Role to Play in Reducing Greenhouse Gas Emissions. 504
http://na.unep.net/geas/getUNEPPageWithArticleIDScript.php?article_id=57 (downloaded 505
on March 14, 2014) 506
[2] Van Oss, H. G. (2011). USGS Mineral Program Cement Report. United States Geological 507
Survey (USGS) Report, pp. 38-39. 508
[3] Lin, F., and Meyer C. (2009). Hydration kinetics modeling of Portland cement considering 509
the effects of curing temperature and applied pressure, Cement and Concrete Research, vol. 510
39, pp. 255–265. 511
[4] Kirby, D. M., and Biernacki, J. J. (2012). The effect of water-to-cement ratio on the 512
hydration kinetics of tricalcium silicate cements: Testing the two-step hydration 513
hypothesis, Cement and Concrete Research, vol. 42, pp. 1147–1156. 514
[5] Kosmatka, S. H., Kerkhoff, B., and Panarese, W. C. (2003). Design and Control of 515
Concrete Mixtures, Portland Cement Association, 14th Edition, USA, pp. 360. 516
[6] Bishnoi, S. (2008). Vector Modelling of Hydrating Cement Microstructure and Kinetics, 517
Doctoral Thesis, Swiss Federal Institute of Technology in Lausanne, Laboratory of 518
Materials of Construction, pp. 166. 519
[7] Bullard, J. W., Jennings, H. M. , Livingston, R. A., Nonat, A., Scherer, G. W., Schweitzer 520
J. S., Scrivener, K. L., and Thomas, J. J. (2011). Mechanisms of cement hydration, Cement 521
and Concrete Research, vol. 41, pp. 1208–1223. 522
[8] Stein, H. N., and Stevels J. M. (1964). Influence of silica on the hydration of 3CaO, SiO2, 523
J. Appl. Chem., vol. 14, vol. 338–346. 524
Preprints (www.preprints.org) | NOT PEER-REVIEWED | Posted: 17 May 2018 doi:10.20944/preprints201805.0239.v1

[9] Juilland, P., Gallucci, E., Flatt, R., and Scrivener, K. (2010). Dissolution theory applied to 525
the induction period in alite hydration, Cement and Concrete Research, vol. 40, pp. 831–526
844. 527
[10] Gartner, E. M., and Gaidis, J. M. (1989). Hydration mechanisms, I, in: J. Skalny (Ed.), 528
Materials Science of Concrete, Vol. 1, American Ceramic Society, Westerville, OH, pp. 529
95–125. 530
[11] Garrault, S., and Nonat, A. (2001). Hydrated layer formation on tricalcium and dicalcium 531
silicate surfaces: experimental study and numerical simulations, Langmuir, vol. 17, pp. 532
8131–8138. 533
[12] Garrault-Gauffinet, S., and Nonat, A. (1999). Experimental investigation of calcium 534
silicate hydrate (C–S–H) nucleation, J. Cryst. Growth, vol. 200, pp. 565–574. 535
[13] Damidot, D., Nonat, A., and Barret P. (1990). Kinetics of tricalcium silicate hydration in 536
diluted suspensions by microcalorimetric measurements, J. Am. Ceram. Soc., vol. 73(11), 537
pp. 3319–3322. 538
[14] Arvidson, R. S., Fischer, C., and Luttge, A. (2009). Resolution of crystal dissolution and 539
growth processes at multiple scales, Geochim. Cosmochim. Acta, vol. 72 (12), A34. 540
[15] Damidot, D., Bellmann, F., Möser, B., and Sovoidnich, T. (2007). Calculation of the 541
dissolution rate of tricalcium silicate in several electrolyte compositions, Cement 542
WapnoBeton, vol. 12/74 (2), pp. 57–67. 543
[16] Ménétrier, D., Jawed, I., Sun, T. S., and Skalny J. (1979). ESCA and SEM studies on 544
early C3S hydration, Cem. Concr. Res., vol. 9, pp. 473–482. 545
[17] Tadros, M. E., Skalny, J., Kalyoncu, R. S. (1976). Early hydration of tricalcium silicate, 546
Journal of the American Ceramic Society, vol. 59 (7–8), pp. 344–347. 547
Preprints (www.preprints.org) | NOT PEER-REVIEWED | Posted: 17 May 2018 doi:10.20944/preprints201805.0239.v1

[18] Young, J. F., Tong, H. S., and Berger, R. L. (1977). Compositions of solutions in contact 548
with hydrating tricalcium silicate pastes, Journal of the American Ceramic Society, vol. 60 549
(5–6), pp. 193–198. 550
[19] Damidot, D., and Nonat, A. (1994). C3S hydration in diluted and stirred suspensions: (I) 551
study of the two kinetic steps, Advances in Cement Research, vol. 6 (21), pp. 27–35. 552
[20] Barret, P., and Ménétrier, D. (1980). Filter dissolution of C3S as a function of lime 553
concentration in a limited amount of lime water, Cement and Concrete Research, vol. 10, 554
pp. 521–534. 555
[21] Kondo, R., and Ueda, S. (1968). Kinetics of hydration of cements, Proceedings of the 5th 556
international symposium on chemistry of cement, Tokyo, pp. 203-248. 557
[22] Pommersheim, J. M., and Clifton, J. R. (1979). Mathematical modeling of tricalcium 558
silicate hydration, Cement and Concrete Research, Vol. 9, pp. 765-770. 559
[23] Gartner, E. M., and Gaidis, J. M. (1989). Hydration mechanisms, I, in: J.P. Skalny (Ed.), 560
The Materials Science of Concrete, I, American Ceramic Society, pp. 95–125. 561
[24] Jennings, H. M., and Pratt, P. L. (1979). An experimental argument for the existence of 562
a protective membrane surrounding Portland cement during the induction period, Cement 563
and Concrete Research, vol. 9, pp. 501–506. 564
[25] Xie, T., and Biernacki, J. J. (2011). The origins and evolution of cement hydration 565
models, Comp. Concr., vol. 8(6), pp. 647–675. 566
[26] Garrault, S., Behr, T., and Nonat, A. (2006). Formation of the C-S-H layer during early 567
hydration of tricalcium silicate grains with different sizes, Journal of Physical Chemistry, 568
Vol. 110, pp. 270-275. 569
[27] Bishnoi, S., and Scrivener, K. L. (2009). μic: a new platform for modeling the hydration 570
of cements, Cem. Concr. Res., vol. 39(4), pp. 266–274. 571
Preprints (www.preprints.org) | NOT PEER-REVIEWED | Posted: 17 May 2018 doi:10.20944/preprints201805.0239.v1

[28] Bishnoi, S., and Scrivener, K. L. (2009). Studying nucleation and growth kinetics of alite 572
hydration using μic, Cem. Concr. Res., vol. 39(10), pp. 849–860. 573
[29] Van Breugel, K. (1991). Simulation of hydration and formation of structure in hardening 574
cement-based materials, PhD Thesis, Delft University of Technology, The Netherlands. 575
[30] Danielson, U. (1962). Heat of hydration of cement as affected bywater–cement ratio, 576
Paper IV-S7, Proceedings of the 4th International Symposium on the Chemistry of Cement, 577
Washington DC, USA, pp. 519–526. 578
[31] Taplin, J. H. (1969). A method for following hydration reaction in Portland cement paste, 579
Australian Journal of Applied Sciences, vol. 10, pp. 329–345. 580
[32] Knudsen, T. (1982). Modeling hydration of portland cement — the effect of particle size 581
distribution, in: Young, J. F. (Ed.). Characterization and performance prediction of cement 582
and concrete, United Engineering Trustees, Inc., New Hampshire, USA, pp. 125–150. 583
[33] Frigione, G., and Marra, S. (1976). Relationship between particle size distribution and 584
compressive strength in Portland cement, Cement and Concrete Research, vol. 6(1), pp. 585
113–127. 586
[34] Bezjak, A. (1986). An extension of the dispersion model for the hydration of Portland 587
cement, Cement and Concrete Research, vol. 16 (2), pp. 260–264. 588
[35] Lerch, W., and Ford, C. L. (1948). Long-term study of cement performance in concrete: 589
chapter 3, Chemical and physical tests of the cements, ACI Journal, vol. 19(8), pp. 745–590
795. 591
[36] Escalante-Garcia, J. I. (2003). Nonevaporable water from neat OPC and replacement 592
materials in composite cements hydrated at different temperatures, Cement and Concrete 593
Research, vol. 33(11), pp. 1883–1888. 594
Preprints (www.preprints.org) | NOT PEER-REVIEWED | Posted: 17 May 2018 doi:10.20944/preprints201805.0239.v1

[37] Bentur, A., Berger, R. L., Kung, J. H., Milestone, N. B., and Young J. F. (1979), 595
Structural properties of calcium silicate pastes: II, effect of the curing temperature, Journal 596
of the American Ceramic Society, vol. 62(7–8), pp. 362–366. 597
[38] Worrell, E., Price, L., Martin, N., Hendriks, C., and Meida, L. O. (2001). Carbon dioxide 598
emissions from the global cement industry, Annual Review of Energy and the 599
Environment, vol. 26, pp. 303-329. 600
[39] Lothenbach, B., Scrivener, K., Hooton, R. D. (2011). Supplementary cementitious 601
materials, Cement and Concrete Research, vol. 41, pp. 1244–1256. 602
[40] United States Environmental Protection Agency (EPA) (2010). Municipal solid waste in 603
the United States: 2009 Facts and Figures. Report No. EPA530-R-10-012. 604
[41] Shao, Y., Lefort, T., Moras, S., and Rodriguez, D. (2000). Studies on Concrete Containing 605
Ground Waste Glass. Cement and Concrete Research, vol. 30(1), pp. 91-100. 606
[42] Shi, C., and Zheng, K. (2007). A Review on the Use of Waste Glasses in the Production 607
of Cement and Concrete. Resources, Conservation and Recycling, vol. 52(2), pp. 234-247. 608
[43] Saeed, H. A., Ebead, U. A., Tagnit-Hamou, A., and Neale, K. W. (2011). Stoichiometric 609
study of activated glass powder hydration. Advances in Cement Research, vol. 24(2), pp. 610
91-101. 611
[44] Dyer, T. D., and Dhir, R. K. (2001). Chemical Reactions of Glass Cullet Used as Cement 612
Component. Journal of Material of Civil Engineering, vol. 13(6), pp. 412-417. 613
[45] Shayan, A., and Xu, A. (2004). Value-added Utilization of Waste Glass in Concrete. 614
Cement and Concrete Research, vol. 34(1), pp. 81-89. 615
[46] Shayan, A., and Xu, A. (2006). Performance of Glass Powder as a Pozzolanic Material in 616
Concrete: A Field Trial on Concrete Slabs. Cement and Concrete Research, vol. 36(3), pp. 617
457-468. 618
Preprints (www.preprints.org) | NOT PEER-REVIEWED | Posted: 17 May 2018 doi:10.20944/preprints201805.0239.v1

[47] Pereira-de-Oliveira, L. A., Castro-Gomes, J. P., and Santos, P. M. S. (2012). The Potential 619
Pozzolanic Activity of Glass and Red-clay Ceramic Waste as Cement Mortars 620
Components. Construction and Building Material, vol. 31, pp. 197-203 621
[48] Schwarz, N., and Neithalath, N. (2008). Influence of a fine glass powder on cement 622
hydration: Comparison to fly ash and modeling the degree of hydration. Cement and 623
Concrete Research, vol. 38, pp. 429-436 624
[49] Tagnit-Hamou, A., and Bengougam, A. (2012). The Use of Glass Powder as 625
Supplementary Cementitious Material. Concrete International, vol. 34(3), pp. 56. 626
[50] Shi, C., Wu, Y., Riefler, C., and Wang, H. (2005). Characteristics and Pozzolanic 627
Reactivity of Glass Powders. Cement and Concrete Research, vol. 35(5), pp. 987-993. 628
[51] Nassar, R., and Soroushian, P. (2011). Field Investigation of Concrete Incorporating 629
Milled waste Glass, Journal of Solid Waste Technology and Management, vol. 37(4), pp. 630
307-319. 631
[52] Bajad, M. N., Modhera, C. D., and Desai, A. K. (2011). Effect of Glass on Strength of 632
Concrete Subjected to Sulphate Attack, International Journal of Civil Engineering 633
Research and Development, vol. 1(2). pp. 1-13. 634
[53] Meena, A., and Singh, R. (2012). Comparative Study of Waste Glass Powder as 635
Pozzolanic Material in Concrete, Bachelor Thesis, Department of Civil engineering, 636
National Institute of Technology, Rourkela, India, pp. 46. 637
[54] Kou, S. C., and Xing, F. (2012). The Effect of Recycled Glass Powder and Reject Fly 638
ash on the Mechanical Properties of fiber-reinforced Ultralight Performance Concrete, 639
Advances in Material science and Engineering, pp. 8. 640
Preprints (www.preprints.org) | NOT PEER-REVIEWED | Posted: 17 May 2018 doi:10.20944/preprints201805.0239.v1

[55] Federico, L. (2013). Waste Glass – A Supplementary Cementitious Material, Ph.D. 641
Dissertation, Department of Civil engineering, McMaster University, Hamilton, Ontario, 642
Canada, pp. 99. 643
[56] Xu, W., and Chen, H. (2012). Microstructural modelling of cement-based materials via 644
random packing of three-dimensional ellipsoidal particles. Procedia Engineering, vol. 27, 645
pp. 332-340. 646
[57] Gallucci, E., Mathur, P., and Scrivener, K. (2010). Microstructural development of early 647
age hydration shells around cement grains, Cement and Concrete Research, vol. 40, pp. 4–648
13. 649
[58] Thomas, J. J., Biernacki, J. J., Bullard, J. W., Bishnoi, S., Dolado, J. S., Scherer, G. W., 650
and Luttge, A. (2011). Modeling and simulation of cement hydration kinetics and 651
microstructure development. Cement and Concrete Research, vol. 41, pp. 1257–1278. 652
[59] Diamond, S. (2004). The microstructure of cement paste and concrete––a visual primer, 653
Cement & Concrete Composites, vol. 26, pp. 919–933. 654
[60] Merzouki, T., Bouasker, M., Khalifa, N. E. H., and Mounanga, P. (2013). Contribution 655
to the modeling of hydration and chemical shrinkage of slag-blended cement at early age, 656
Construction and Building Materials, vol. 44, pp. 368–380. 657
[61] Bentz, D. P. (2008). Virtual Pervious Concrete: Microstructure, Percolation, and 658
Permeability, ACI Materials Journal, vol. 105(3), pp. 297-301. 659
[62] Bentz, D. P. (2000). Influence of silica fume on diffusivity in cement-based materials II. 660
Multi-scale modeling of concrete diffusivity, Cement and Concrete Research, vol. 30, pp. 661
1121–1129. 662
[63] Roy, D. M. (1993). Concrete microstructure, Strategic Highway Research Program 663
(SHRP), National Research Council, Washington, DC 1993. 664
Preprints (www.preprints.org) | NOT PEER-REVIEWED | Posted: 17 May 2018 doi:10.20944/preprints201805.0239.v1
[64] Thomas, J. J., Biernacki, J. J., Bullard, J. W., Bishnoi, S., Dolado, J. S., Scherer, G. W., 665
and Luttge, A. (2011). Modeling and simulation of cement hydration kinetics and 666
microstructure development. Cement and Concrete Research, vol. 41, pp. 1257–1278. 667
[65] Pommersheim, J. M., and Clifton, J. R. (1979). Mathematical modeling of tricalcium 668
silicate hydration, Cem. Concr. Res, vol. 9, pp. 765–770. 669
[66] Parrot in 2796: Parrot, L. J., and Killoh, D. C. (1984). Prediction of cement hydration, 670
Br. Ceram. Proc., vol. 35, pp. 41–53. 671
[67] Tomosawa, F. (1997). Development of a Kinetic Model for Hydration of Cement, in: H. 672
Justnes (Ed.), Proceedings of the Tenth International Congress on the Chemistry of 673
Cement, Göteburg, Sweden. 674
[68] Tenoutasse, N., and De Donder, A. (1970). The kinetics and mechanism of hydration of 675
tricalcium silicate, Silicates Ind., vol. 35, pp. 301–307. 676
[69] Brown, P. W., Pommersheim, J. M., and Frohnsdorff, G. (1985). A kinetic model for the 677
hydration of tricalcium silicate, Cem. Concr. Res., vol. 15, pp. 35–41. 678
[70] Gartner in 2796: Gartner, E. M., and Gaidis, J. M. (1989). Hydration Mechanisms, I, in: 679
J.P. Skalny (Ed.), Materials Science of Concrete, American Ceramic Society, Westerville, 680
OH, pp. 95–125. 681
[71] Cahn, J. W. (1956). The kinetics of grain boundary nucleated reactions, Acta Metall. vol. 682
4, pp. 449–459. 683
[72] Thomas, J. J. (2007). A new approach to modeling the nucleation and growth kinetics of 684
tricalcium silicate hydration, J. Am. Ceram. Soc., vol. 90, pp. 3282–3288. 685
[73] Frohnsdorff, G. J. C., Freyer, W. G., and Johnson P. D. (1968). The Mathematical 686
Simulation of Chemical, Physical and Mechanical Changes Accompanying the Hydration 687
of Cement, 5th Int. Congr. Chem. Cem., Tokyo, vol. 2, p. 321. 688
Preprints (www.preprints.org) | NOT PEER-REVIEWED | Posted: 17 May 2018 doi:10.20944/preprints201805.0239.v1

[74] Van Breugel, K. (1995). Numerical simulation of hydration and microstructural 689
development in hardening cement paste (II): applications, Cem. Concr. Res., vol. 25, pp. 690
522–530. 691
[75] Bentz, D. P., and Garboczi E. J. (1991). A digitized simulation model for microstructural 692
development, Ceram. Trans., vol. 16, pp. 211–226. 693
[76] Bullard, J. W. (2007). A three-dimensional microstructural model of reactions and 694
transport in aqueous mineral systems, Modell. Simul. Mater. Sci. Eng., vol. 15, pp. 711–695
738. 696
[77] Navi, P., and Pignat, C. (1996).Simulation of cement hydration and the connectivity ofthe 697
capillary pore space, Advanced Cement Based Materials, vol. 4, pp.58-67. 698
[78] ASTM (2012). Standard Specification for Portland Cement. ASTM C150/150M, pp. 9. 699
[79] Mehta, P. K. (2009). Global Concrete Industry Sustainability. Concrete International, 700
vol. 31(2), pp. 45-48. 701
[80] Russ, J. C. (1986). Practical Stereology, Springer, pp. 196. 702
[81] Marsh B. K. (1984). Relationships between engineering properties and microstructure 703
characteristics of hardened cement paste containing pulverized fuel ash as a partial cement 704
replacement, PhD thesis, The Hatfield Polytechnic, UK. 705
[82] Farjas, J., and Roura, P. (2006). Modification of the Kolmogorov-Johnson-Mehl-Avrami 706
rate equation for non-isothermal experiments and its analytical solution, Acta Materialia, 707
vol. 54(20), pp. 5573–5579. 708
[83] Mirzahosseini, M.R., and Riding, K. A. (2014). Effect of Curing Temperature and Glass 709
Type on the Pozzolanic Reactivity of Glass Powder, Cement and Concrete Research, vol. 710
58, pp. 103-111. 711
Preprints (www.preprints.org) | NOT PEER-REVIEWED | Posted: 17 May 2018 doi:10.20944/preprints201805.0239.v1