Microstructural Evolution of EGR Cooler Deposits · Microstructural Evolution of EGR Cooler...
23
Microstructural Evolution of EGR Cooler Deposits Michael J. Lance, C. Scott Sluder, and John M.E. Storey Oak Ridge National Laboratory
Transcript of Microstructural Evolution of EGR Cooler Deposits · Microstructural Evolution of EGR Cooler...

Microstructural Evolution of EGR Cooler Deposits
Michael J. Lance, C. Scott Sluder, and John M.E. Storey
Oak Ridge National Laboratory
2 Managed by UT-Battellefor the U.S. Department of Energy
Outline
•
Exhaust Gas Recirculation as a Method for Reducing NOx Emissions
•
Review new DOE-funded project: Materials Issues Associated with EGR Systems
•
Experimental Methodology for Depositing Particulate Matter (PM) on Model Cooler Tubes
•
Microstructural Evolution of EGR Deposits–
Deposits from Steady-State Laboratory Cooler Tubes
–
Deposits from Half-Useful-Life Industry-Provided Coolers

3 Managed by UT-Battellefor the U.S. Department of Energy
Background: High-Pressure Exhaust Gas Recirculation (HP-EGR)
•
High-pressure EGR is the dominant NOX
-reduction technology.
•
Exhaust gas laden with PM flows through the EGR cooler which causes deposits to form through thermophoresis and condensation.
•
The deposit thermal conductivity is very low, which reduces the effectiveness of the EGR system.
•
Increasing demands placed on the technology by more stringent NOX
emissions, advanced combustion, increasing use of non-petroleum-based fuels, and engine/aftertreatment system optimization requirements are leading to expansions of the technology into operational conditions that are relatively unknown or known to be problematic.

4 Managed by UT-Battellefor the U.S. Department of Energy
Background: Fouling of (HP) EGR Coolers
•
Information about deposit formation and removal is needed:–
Thermo-physical and chemical properties of the deposit are needed for modeling.
–
Effectiveness of EGR systems often decline but then reach a plateau. Why?
–
The deposit changes with time due to temperature and HC/water condensation.
–
What is the adhesion mechanism and how can we stop it? –
How does the deposit affect the EGR valve.
•
Bio-based fuels produce different exhaust gas chemistry and PM.
5 Managed by UT-Battellefor the U.S. Department of Energy
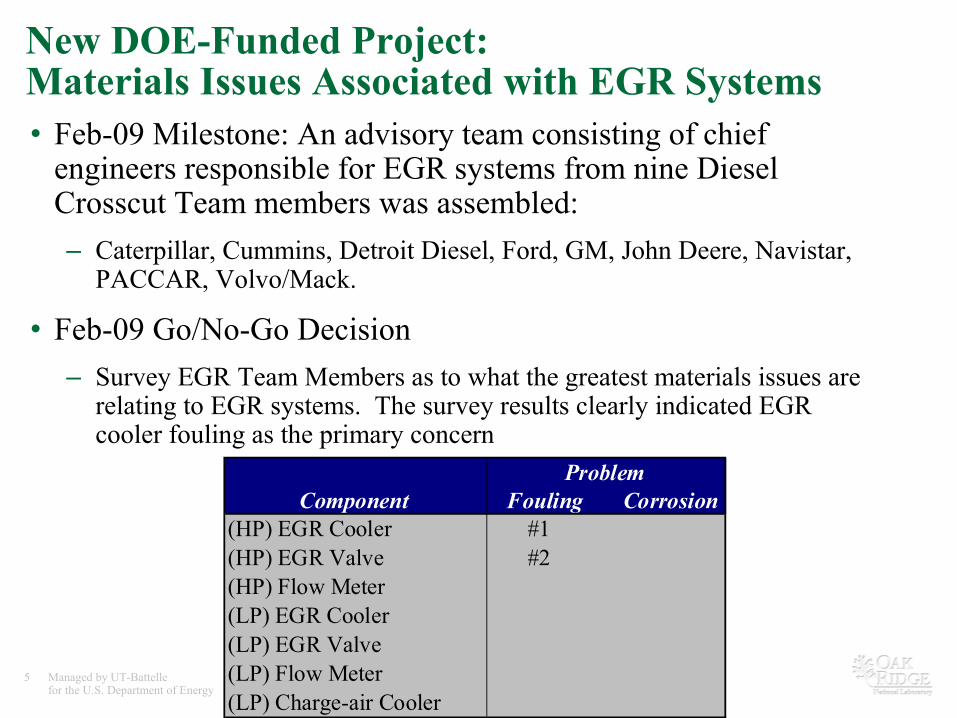
New DOE-Funded Project: Materials Issues Associated with EGR Systems•
Feb-09 Milestone: An advisory team consisting of chief engineers responsible for EGR systems from nine Diesel Crosscut Team members was assembled:–
Caterpillar, Cummins, Detroit Diesel, Ford, GM, John Deere, Navistar, PACCAR, Volvo/Mack.
•
Feb-09 Go/No-Go Decision–
Survey EGR Team Members as to what the greatest materials issues
are relating to EGR systems. The survey results clearly indicated EGR cooler fouling as the primary concern
Fouling Corrosion(HP) EGR Cooler #1(HP) EGR Valve #2(HP) Flow Meter(LP) EGR Cooler(LP) EGR Valve(LP) Flow Meter(LP) Charge-air Cooler
ProblemComponent
6 Managed by UT-Battellefor the U.S. Department of Energy
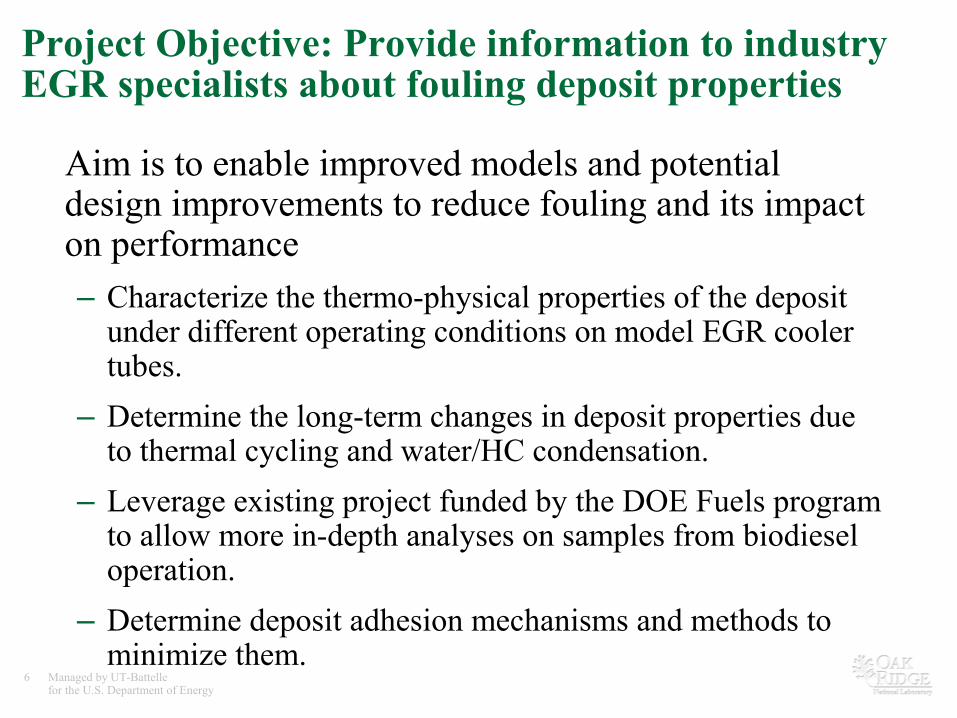
Project Objective: Provide information to industry EGR specialists about fouling deposit properties
Aim is to enable improved models and potential design improvements to reduce fouling and its impact on performance–
Characterize the thermo-physical properties of the deposit under different operating conditions on model EGR cooler tubes.
–
Determine the long-term changes in deposit properties due to thermal cycling and water/HC condensation.
–
Leverage existing project funded by the DOE Fuels program to allow more in-depth analyses on samples from biodiesel operation.
–
Determine deposit adhesion mechanisms and methods to minimize them.
7 Managed by UT-Battellefor the U.S. Department of Energy
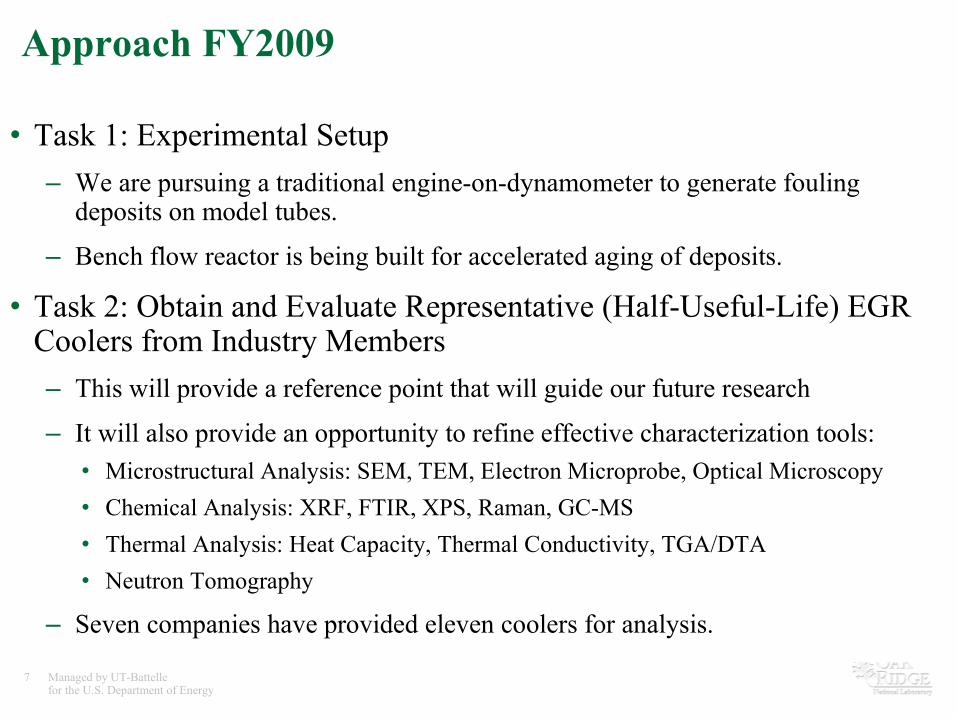
Approach FY2009
•
Task 1: Experimental Setup –
We are pursuing a traditional engine-on-dynamometer to generate fouling deposits on model tubes.
–
Bench flow reactor is being built for accelerated aging of deposits.
•
Task 2: Obtain and Evaluate Representative (Half-Useful-Life) EGR Coolers from Industry Members–
This will provide a reference point that will guide our future research
–
It will also provide an opportunity to refine effective characterization tools:•
Microstructural Analysis: SEM, TEM, Electron Microprobe, Optical
Microscopy•
Chemical Analysis: XRF, FTIR, XPS, Raman, GC-MS•
Thermal Analysis: Heat Capacity, Thermal Conductivity, TGA/DTA•
Neutron Tomography
–
Seven companies have provided eleven coolers for analysis.
8 Managed by UT-Battellefor the U.S. Department of Energy
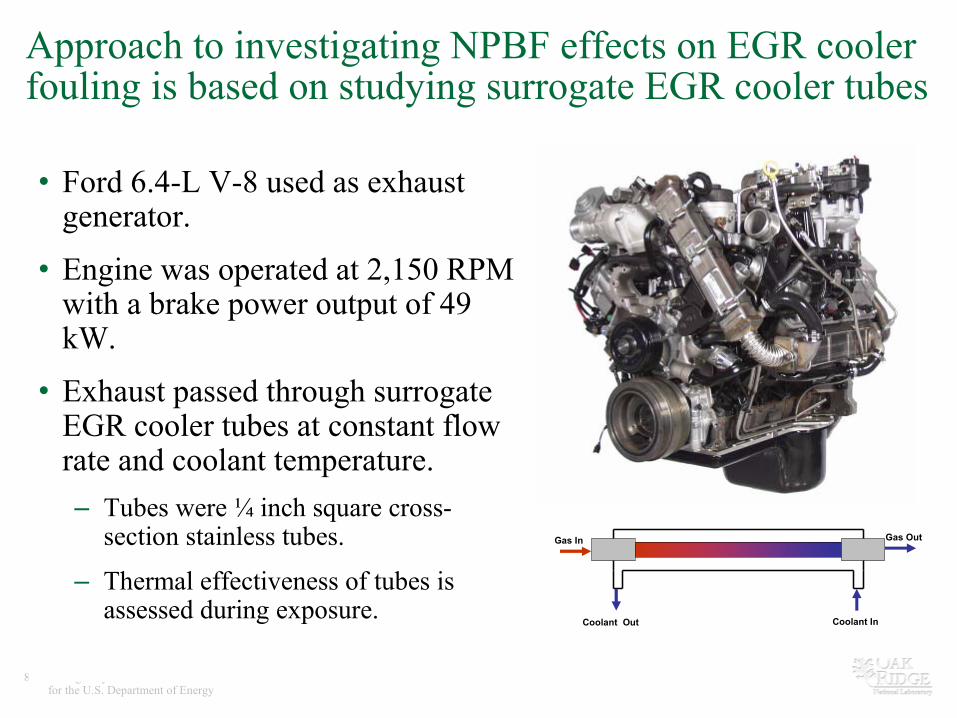
Approach to investigating NPBF effects on EGR cooler fouling is based on studying surrogate EGR cooler tubes
•
Ford 6.4-L V-8 used as exhaust generator.
•
Engine was operated at 2,150 RPM with a brake power output of 49 kW.
•
Exhaust passed through surrogate EGR cooler tubes at constant flow rate and coolant temperature.–
Tubes were ¼
inch square cross-
section stainless tubes.
–
Thermal effectiveness of tubes is assessed during exposure.
Gas In Gas Out
Coolant Out Coolant In
9 Managed by UT-Battellefor the U.S. Department of Energy
Experimental Conditions
•
Fuel: –
Ultra-low sulfur certification diesel (ULSD) sourced from Chevron-Phillips Specialty Chemical Company
–
5 and 20% volume blend of soy biodiesel in ULSD (B5 & B20)
•
Feed gas conditions:–
1.5 Smoke Number
–
50 PPM HC (as C1
)
•
Tube Conditions–
40, 70 and 90 °C coolant
–
375 °C inlet gas temperature–
30 SLPM per-tube gas flow

10 Managed by UT-Battellefor the U.S. Department of Energy
Significant thermal effectiveness loss due to deposit formation occurs within a few hours
•
Steady-flow, time-of-exposure experiments showed very good repeatability.
•
Mass accumulation in the tubes showed similar profiles for ULSD, B5, and B20 fuels.
C. Scott Sluder and John M. E. Storey, “EGR Cooler Performance and Degradation: Effects of Biodiesel Blends,”
SAE Paper 2008-01-2473.
0
10
20
30
40
50
60
70
0 2 4 6 8 10 12 14Exposure Time (Hours)
Ave
rage
Effe
ctiv
enes
s (%
)
1/2-Hour Experiment2-Hour Expeiment4-Hour Experiment8-Hour Expeirment12-Hour Experiment
Curves for 5% Soy
0.00
0.01
0.02
0.03
0.04
0.05
0.06
0.07
0.08
0.09
0 2 4 6 8 10 12 14
Exposure Time (Hours)
Ave
rage
Tot
al M
ass
Gai
n (g
)
B5ULSDB20

11 Managed by UT-Battellefor the U.S. Department of Energy
Thermal Conductivity at 25°C
•
The average thermal conductivity of the deposit was 0.041 W/mK. •
Since the thermal conductivity of air is 0.025 W/mK, the deposit
is
only slightly above air and is much lower than stainless steel which is ~15 W/mK.
•
The porosity of the deposit was ~98% which is the main determinant of the thermal conductivity.
Property SS 304 ULSD B5 B20Thickness (mm) 0.5150 0.4140 0.3725 0.3600Density (g/cm3) 7.9300 0.0316 0.0363 0.0379
Cp (J/gK) 0.4700 0.8668 0.8170 0.8706Apparent Diffusivity 1,2 (cm2/s) 0.0280 0.0190 0.0172
Diffusivity (cm2/s) 0.0395 0.0209 0.0115 0.0097Thermal Conductivity (W/mK) 14.7220 0.057 0.034 0.032
12 Managed by UT-Battellefor the U.S. Department of Energy
•
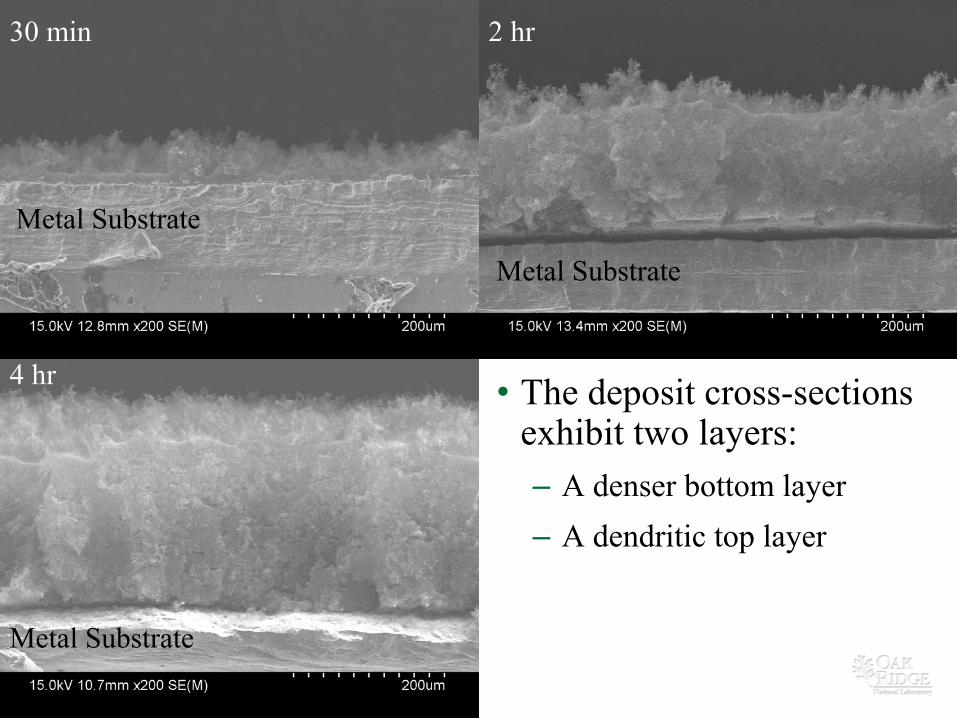
The deposit cross-sections exhibit two layers:–
A denser bottom layer
–
A dendritic top layer
30 min 2 hr
4 hr
Metal Substrate
Metal Substrate
Metal Substrate

13 Managed by UT-Battellefor the U.S. Department of Energy
Dendritic LayerTotal Deposit
Individual Dendrites PM Aggregates
300 X 2,000 X
100,000 X10,000 X
14 Managed by UT-Battellefor the U.S. Department of Energy
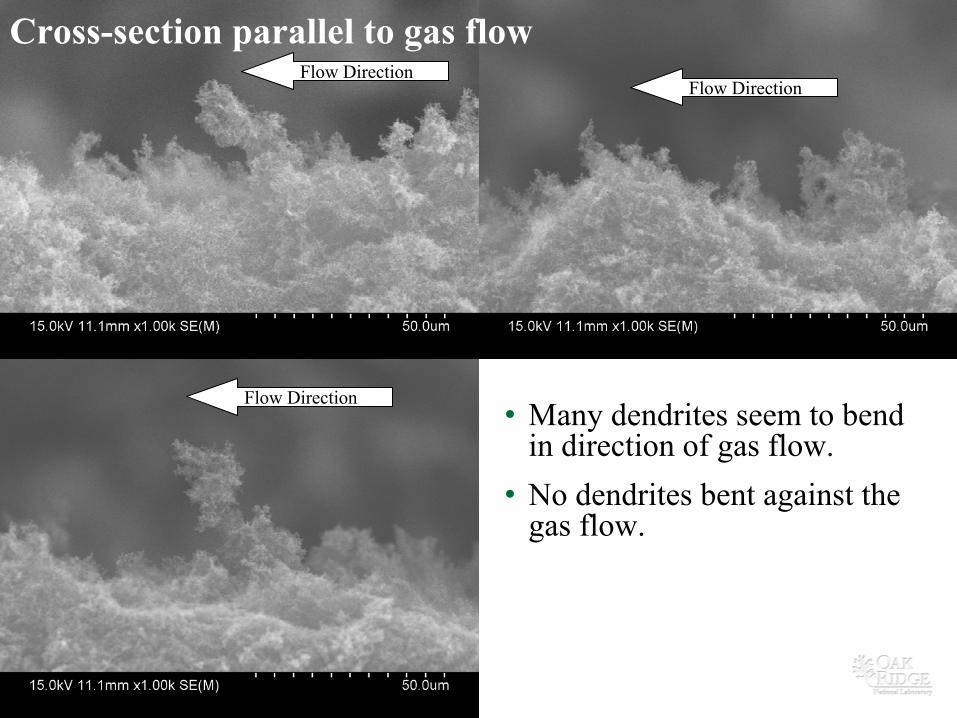
Cross-section parallel to gas flow
•
Many dendrites seem to bend in direction of gas flow.
•
No dendrites bent against the gas flow.
Flow Direction
Flow Direction
Flow Direction
15 Managed by UT-Battellefor the U.S. Department of Energy
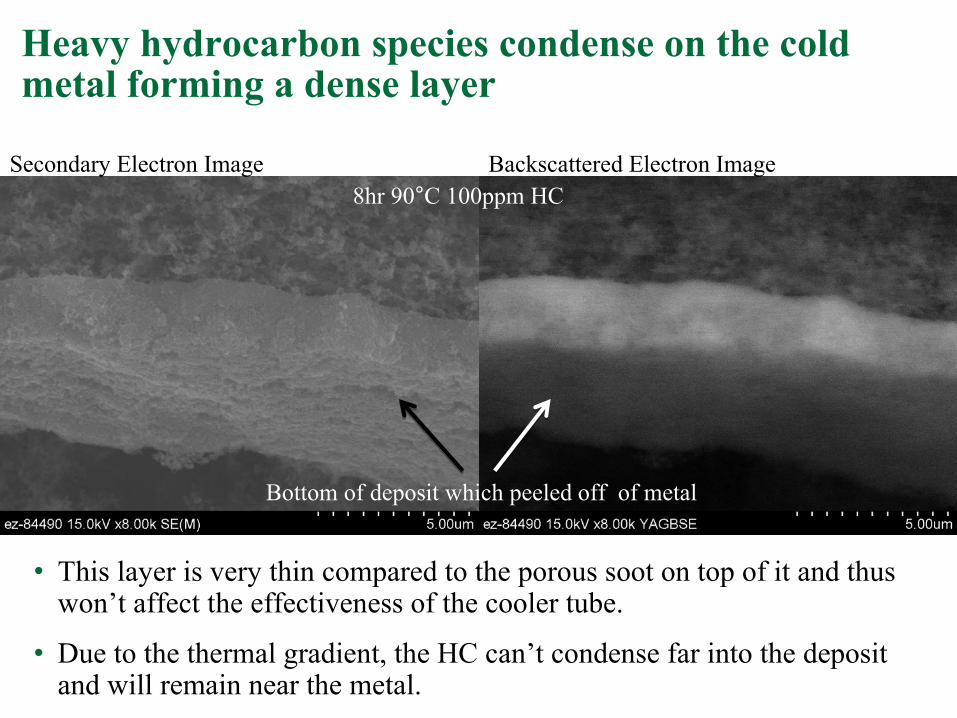
Heavy hydrocarbon species condense on the cold metal forming a dense layer
•
This layer is very thin compared to the porous soot on top of it
and thus won’t affect the effectiveness of the cooler tube.
•
Due to the thermal gradient, the HC can’t condense far into the deposit and will remain near the metal.
8hr 90°C 100ppm HCSecondary Electron Image Backscattered Electron Image
Bottom of deposit which peeled off of metal
16 Managed by UT-Battellefor the U.S. Department of Energy
Hypothesis for Deposit Formation under Steady-State Conditions•
PM aggregates initially deposit randomly on the surface. Hydrocarbon condenses.
•
Subsequent aggregates are caught by the initial aggregates forming dendrites that grow perpendicular to the surface.
•
Once a critical mass/height is reached, the gas flow will topple the dendrite, fracturing it at its base.
•
The toppled dendrites will lay flat on one another forming the denser bottom layer.
•
New PM aggregates from the gas will then randomly deposit in the new ‘open’
area formed following
dendrite toppling. •
This process will repeat itself as the deposit thickens.
17 Managed by UT-Battellefor the U.S. Department of Energy
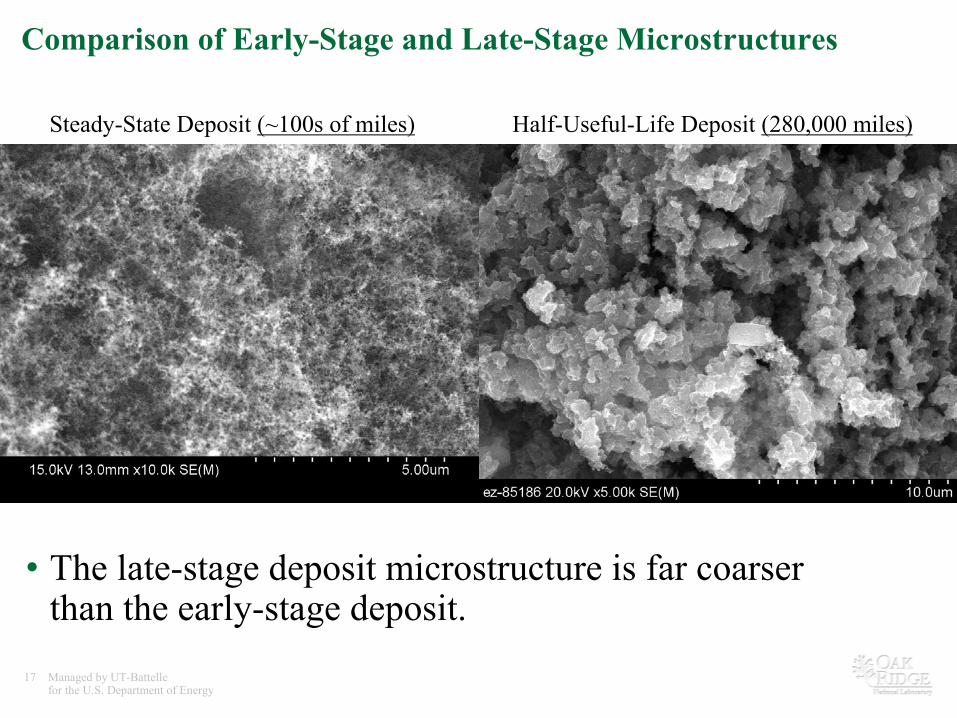
Comparison of Early-Stage and Late-Stage Microstructures
•
The late-stage deposit microstructure is far coarser than the early-stage deposit.
Steady-State Deposit (~100s of miles) Half-Useful-Life Deposit (280,000 miles)

18 Managed by UT-Battellefor the U.S. Department of Energy
Thermo-gravimetric Analysis in Argon (Devolatilization)
•
The late-stage deposit had 10 times more hydrocarbon and 20 times the density than the early-stage deposit.
•
The thermal conductivity of the late-stage deposit is likely to be far higher than the early-stage deposit as well.
0
20
40
60
80
100
0 200 400 600Temperature (C)
Wei
ght (
%)
Early-Stage Deposit : ~5% weight lossDensity = 0.032 g/cm3
Late-Stage Deposit : ~50% weight lossDensity = 0.79 g/cm3
19 Managed by UT-Battellefor the U.S. Department of Energy
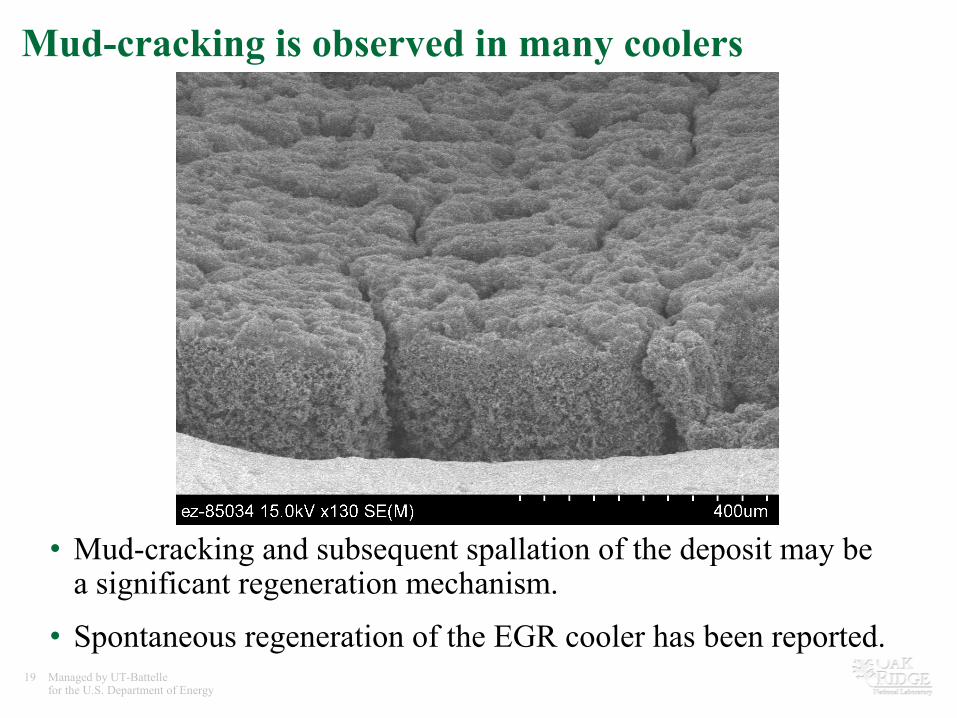
Mud-cracking is observed in many coolers
•
Mud-cracking and subsequent spallation of the deposit may be a significant regeneration mechanism.
•
Spontaneous regeneration of the EGR cooler has been reported.
20 Managed by UT-Battellefor the U.S. Department of Energy
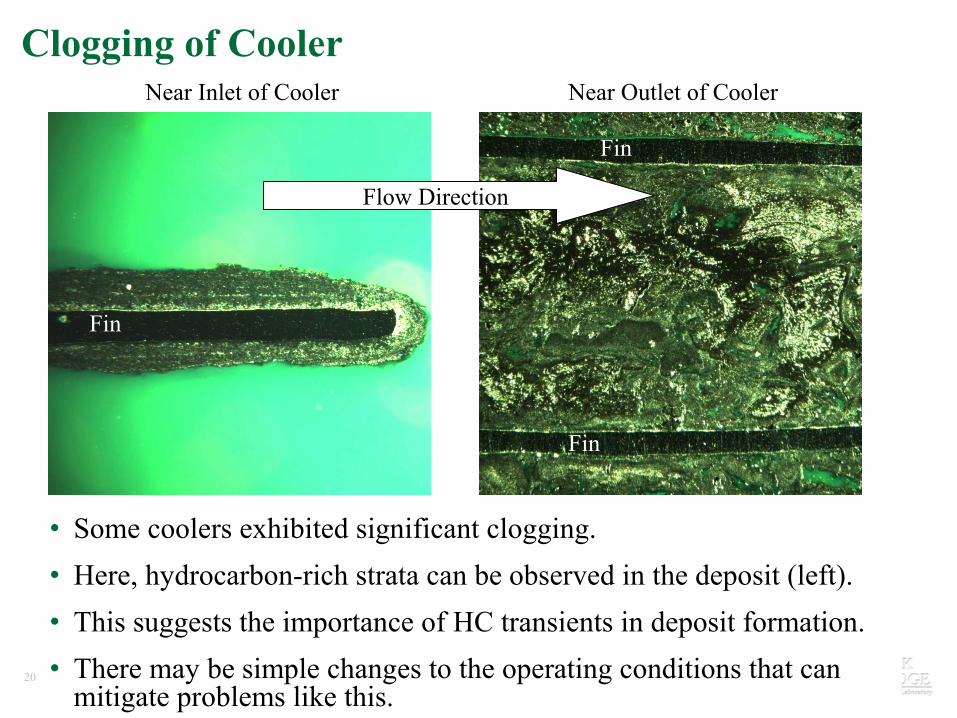
Clogging of Cooler
•
Some coolers exhibited significant clogging.•
Here, hydrocarbon-rich strata can be observed in the deposit (left).
•
This suggests the importance of HC transients in deposit formation.•
There may be simple changes to the operating conditions that can
mitigate problems like this.
Near Inlet of Cooler Near Outlet of Cooler
Flow Direction
Fin
Fin
Fin
21 Managed by UT-Battellefor the U.S. Department of Energy
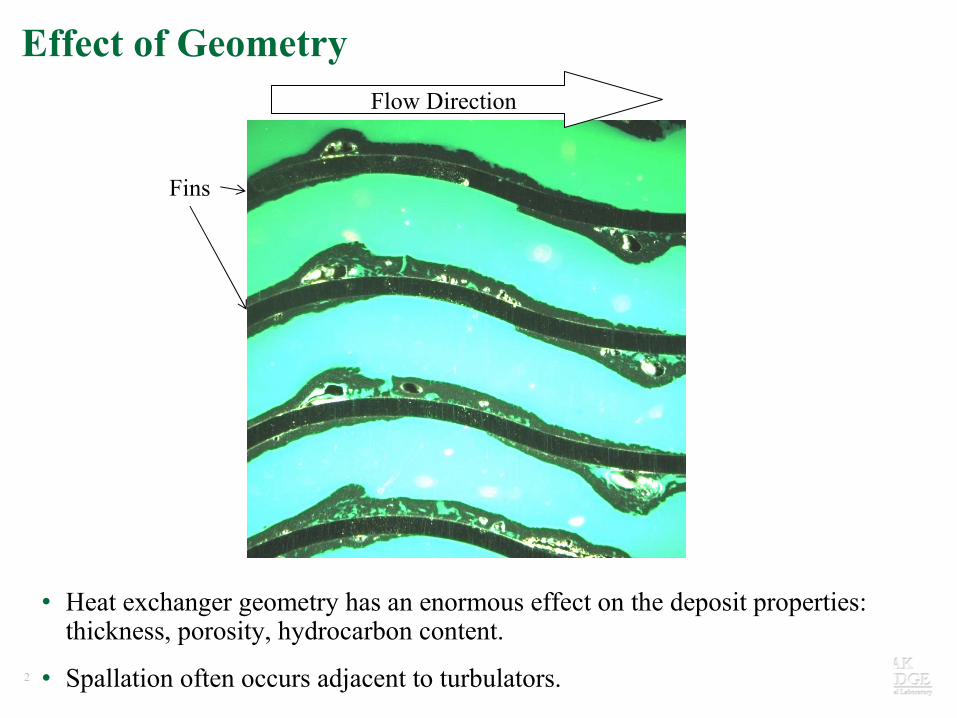
Effect of Geometry
•
Heat exchanger geometry has an enormous effect on the deposit properties: thickness, porosity, hydrocarbon content.
•
Spallation often occurs adjacent to turbulators.
Flow Direction
Fins
22 Managed by UT-Battellefor the U.S. Department of Energy
Summary
•
A team of industry advisors has been assembled that will help guide future research directions of this pre-
competitive research. •
An engine and a sampler tube system for laying down controlled PM deposits is being designed and purchased. A portable gas manifold for controlled post-deposition aging is being built.
•
A conceptual model of deposit formation under steady-state conditions has been proposed based on microstructural
imaging.
•
Comparison between the early-stage and late-stage cooler deposits suggest the importance of aging and transient operation.
23 Managed by UT-Battellefor the U.S. Department of Energy
Acknowledgements•
The authors gratefully acknowledge the funding support of Jerry Gibbs, Kevin Stork, Dennis Smith, and Steve Goguen
of
the United States Department of Energy, Office of Vehicle Technologies.
•
We would also like to thank Dan Styles of Ford Motor Company for providing the engine and funding the development of the sampling system and methodology that was used in this study.
Questions?