MICROSTRUCTURAL EVOLUTION IN MATERIALS - …web.mit.edu/3.022/www/Exams/Final2009.pdf · ·...
16
3.022 Microstructural Evolution in Materials M.J. Cima, Spring ‘09 MICROSTRUCTURAL EVOLUTION IN MATERIALS DEPARTMENT OF MATERIALS SCIENCE AND ENGINEERING MASSACHUSETTS INSTITUTE OF TECHNOLOGY Spring Semester, 2009 Final Exam Please read the exam through before starting. Clearly show all work in the space provided below each question. Feel free to use the additional pages at the end of this packet if necessary. Calculators and one double-sided 8 ½ x 11 page of notes are permitted. It is suggested that you outline the solution to your problem wherever possible. Partial credit will be given for answers that follow a logical thought process. Good luck! RETURN THIS EXAM WITH YOUR EQUATION SHEET AT THE END OF THE EXAM Name Question 1 (out of 10) Question 2 (out of 20) Question 3 (out of 20) Question 4 (out of 20) Question 5 (out of 30) Total (out of 100) 1
Transcript of MICROSTRUCTURAL EVOLUTION IN MATERIALS - …web.mit.edu/3.022/www/Exams/Final2009.pdf · ·...

3.022 Microstructural Evolution in Materials M.J. Cima, Spring ‘09
MICROSTRUCTURAL EVOLUTION IN MATERIALS
DEPARTMENT OF MATERIALS SCIENCE AND ENGINEERING MASSACHUSETTS INSTITUTE OF TECHNOLOGY
Spring Semester, 2009
Final Exam
Please read the exam through before starting. Clearly show all work in the space provided below each question. Feel free to use the additional pages at the end of this packet if necessary. Calculators and one double-sided 8 ½ x 11 page of notes are permitted. It is suggested that you outline the solution to your problem wherever possible. Partial credit will be given for answers that follow a logical thought process. Good luck!
RETURN THIS EXAM WITH YOUR EQUATION SHEET
AT THE END OF THE EXAM
Name
Question 1 (out of 10)
Question 2 (out of 20)
Question 3 (out of 20)
Question 4 (out of 20)
Question 5 (out of 30)
Total (out of 100)
1

3.022 Microstructural Evolution in Materials M.J. Cima, Spring ‘09
Problem 1 (10 points) Germanium is sometimes observed to facet as it is solidified. Shown below is a schematic of a crystal cross-section as it is being solidified. There are regions of the solid-liquid interface that have a clear curvature at this scale while some regions have a flat or faceted structure. The temperature of each interface changes with growth rate as shown in the figure on the right. The more rounded interface has hardly any undercooling but the undercooling at the facet is substantial.
Explain why the facet has such a large undercooling while the rounded interface has hardly any.
2

3.022 Microstructural Evolution in Materials M.J. Cima, Spring ‘09
Problem 2 (20 points) Atomic force microscopy (AFM) is a very useful tool for characterizing the phase separation behavior in binary glass systems. An etching process is done on glass samples that have been quenched after heat-treating at a particular temperature for some time. This process results in topographic variation between phases as they etch at different rates. The AFM micrographs have lighter and darker regions corresponding to topography variation. The binary phase diagram for a sodium silicate (made from a starting mixture of sodium carbonate and silica) glass is given below, along with two AFM micrographs. The lighter regions are silica rich, while the darker regions are soda rich.
A. B.
a) Label the regions in the phase diagram which correspond to each micrograph.
3

3.022 Microstructural Evolution in Materials M.J. Cima, Spring ‘09
The following micrograph shows a specimen heat treated at 778°C for 15 minutes and then cooled down to below the spinodal temperature. The micrograph shows two populations of second phase regions that differ in size. .
b) Explain why there are two second phase populations. The time progression of the microstructure of a sample with composition 12.5% Na2O and 87.5% SiO2 is given on the next page.
4

3.022 Microstructural Evolution in Materials M.J. Cima, Spring ‘09
The volume of second phase appears to be constant after a short amount of time, but the microstructure continues to change. The interface area between the phases is plotted against the cube root of heat treatment time in the graph below. (Note that the y-axis is arbitrary units.)
c) Why is there a linear trend in this graph? What is happening over time?
5

3.022 Microstructural Evolution in Materials M.J. Cima, Spring ‘09
Problem 2 cont.
6

3.022 Microstructural Evolution in Materials M.J. Cima, Spring ‘09
Problem 3 (20 points) Microfluidic tools are useful in observing crystallization phenomena. A microfluidic device has been developed in which droplets of a uniform size are formed and their temperatures precisely controlled using an attached Peltier heater.
The figure above shows the formation of these droplets in a silicon oil matrix: aqueous solution is injected through inlet 2 on top, forming droplets at intersection 1. Fluorinated oil is injected through inlet 3 on the side to prevent the droplets from coalescing with each other. Up to 300 droplets can be contained within the microfluidic device at a time. A stereomicroscope with crossed polarizers was used to determine whether a droplet contained a crystal. That is, crystals appear as bright spots on the micrograph. The figure below shows the time evolution of the probability P that a droplet does not contain a crystal for different cooling temperatures. Seven temperature cycles were applied to the droplets as shown below. The corresponding microstructures are shown along with the temperature profile.
7

3.022 Microstructural Evolution in Materials M.J. Cima, Spring ‘09
a. What do you notice about the locations of these crystal-containing droplets for each temperature cycle?
b. What does the answer to part (a) suggest about the nucleation of crystals in the
droplets? From this, can you explain why there appears to be two segments to all the log P vs. t curves (a rapid decrease followed by a slower decrease with time)?
8

3.022 Microstructural Evolution in Materials M.J. Cima, Spring ‘09
Problem 3 cont.
9

3.022 Microstructural Evolution in Materials M.J. Cima, Spring ‘09
Problem 4 (20 points) Isothermal crystallization kinetics and properties related to the crystalline structure of four series of random propylene with various amounts of co-monomers (also called defects) were performed. These co-monomers were comparatively studied in this work. The co-monomers include ethylene, 1-butene, 1-hexene and 1-octene in a concentration range up to 21 mol%. The resulting copolymers were designated PE, PB, PH, and PO, respectively. The “defective” polypropylene polymers can be crystallized but vary in their physical properties and kinetics. The melting point and heat of fusion, for example, vary among them as shown below.
Shown below is the crystallization rate for copolymers with PE and PB defects. The rate is represented by the logarithm of one over the time required to crystallize half the material. The numbers after the PE and PB designation refer to the defect content of the material.
10

3.022 Microstructural Evolution in Materials M.J. Cima, Spring ‘09
a) Why does the rate data for some of the PE samples exhibit a maximum in rate versus crystallization temperature?
b) Why do the rates vary as PE16.9 > PE20.8 > PE22.5 at any given temperature?
c) Why is the crystallization rate for PB16.6 greater than PE16.9 at any given temperature?
11

3.022 Microstructural Evolution in Materials M.J. Cima, Spring ‘09
Problem 4 cont.
12

3.022 Microstructural Evolution in Materials M.J. Cima, Spring ‘09
Problem 5 (30 points)
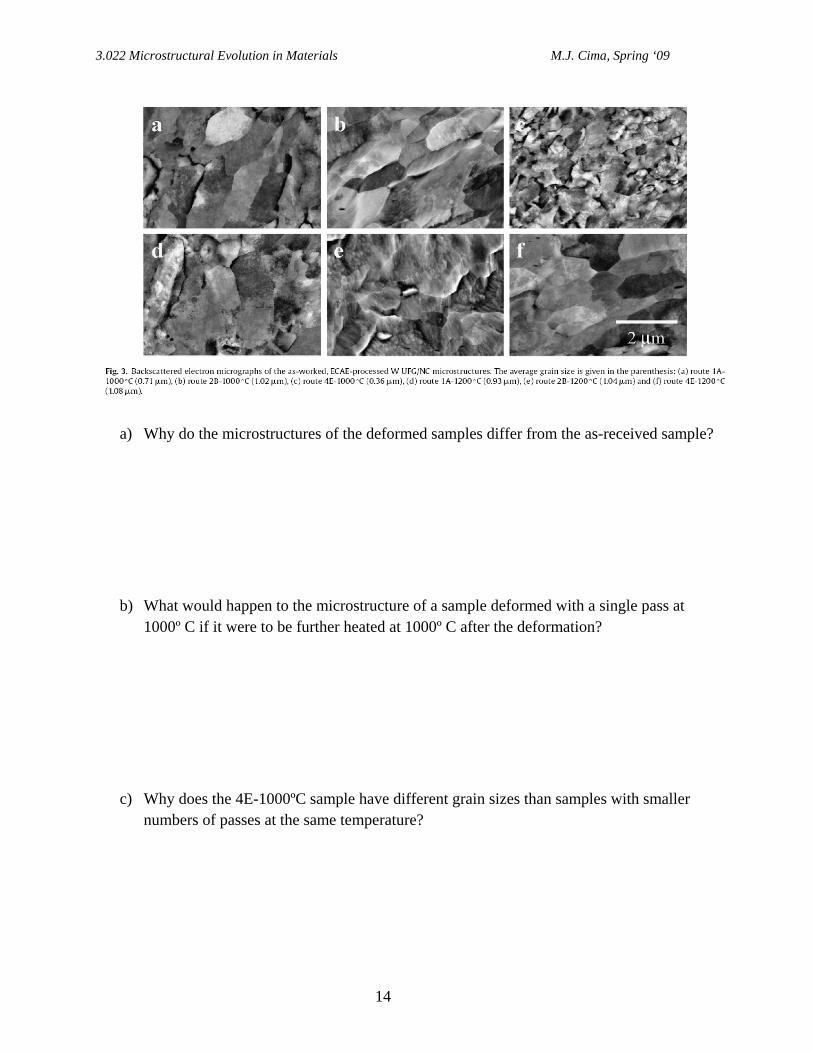
Equal Channel Angular Extrusion (ECAE) is an extrusion process that can cold-work a material without reduction in the cross sectional area of the deformed workpiece. Conventional deformation processes like rolling, forging extrusion, and drawing cause a reduction in the cross sectional area. ECAE is accomplished by extruding the work piece around a corner. A square cross section bar, for example, can be forced through a channel around a 90º angle. The cross section of the material is unchanged through such a deformation although the forces are very high. Multiple passes can be performed with each pass producing the same strain each time.
As-received coarse-grained (CG) tungsten (W) is subjected to ECAE at two temperatures (1000º C and 1200º C) for multiple passes. The CG material microstructure is shown below.
Multiple pass extrusions were performed and designated route 2B (90º rotations about the billet axis) and route 4E (180º C rotations between passes 1 and 2, 3 and 4, with a 90º rotation between passes 2 and 3).
13
3.022 Microstructural Evolution in Materials M.J. Cima, Spring ‘09
a) Why do the microstructures of the deformed samples differ from the as-received sample?
b) What would happen to the microstructure of a sample deformed with a single pass at 1000º C if it were to be further heated at 1000º C after the deformation?
c) Why does the 4E-1000ºC sample have different grain sizes than samples with smaller numbers of passes at the same temperature?
14

3.022 Microstructural Evolution in Materials M.J. Cima, Spring ‘09
d) Explain why there is a number of passes beyond which the grain size no longer changes.
e) Why is such processing important for metals such as tungsten?
15

3.022 Microstructural Evolution in Materials M.J. Cima, Spring ‘09
16
Problem 5 cont.