Mijnbouw en arbeidsmarkt in Nederlands-Limburg · Mijnbouw en arbeidsmarl

Netherlands Journal of Geosciences — Geologie en Mijnbouw |95 – 3 | 293–313 | 2016 doi:10.1017/njg.2016.16
Microstructural characterisation of the Ypresian clays (Kallo-1)at nanometre resolution, using broad-ion beam milling andscanning electron microscopy
S. Hemes1,∗, G. Desbois1, J. Klaver1,2 & J.L. Urai1
1 Structural Geology, Tectonics and Geomechanics, Energy and Mineral Resources Group, RWTH Aachen University, Lochnerstrasse 4–20,
52062 Aachen, Germany2 Microstructure and Porosity at Structural Geology, Tectonics and Geomechanics, Energy and Mineral Resources Group, RWTH Aachen
University, Lochnerstrasse 4–20, 52062 Aachen, Germany∗ Corresponding author. Email: [email protected]
Manuscript received: 13 January 2016, accepted: 18 April 2016
Abstract
Besides the Oligocene Boom Clay, the Ypresian clays – part of the Eocene Ieper Group (Kortrijk Formation and Kortemark Member) – are currently
being investigated as an alternative host rock for the deep geological disposal of radioactive waste in Belgium and the Netherlands. In this study,
broad-ion-beam milling and high resolution scanning electron microscopy (BIB-SEM) analyses were carried out to analyse the mineral fabrics and
microstructures of representative Ypresian clay samples from different depths of the ON-Kallo-1 borehole (Kallo, Belgium). Qualitative microstructural
observations indicate that mineral fabrics and pore morphologies in fine-grained samples are comparable to those found for fine-grained Boom
Clay, but most of the Ypresian clay samples analysed also contained a significant silt fraction, which is associated with larger inter-aggregate
pores, coated by a thin, very low porous clay layer. Quantitative pore-shape analysis shows lower axial ratios and elongations, as well as higher
roundness and circularities for pores in the clay matrix of the more coarse-grained samples, compared to the fine-grained samples. The contribution
of large pores (>1 × 10⁷ nm² pore area) to the total BIB-SEM observed porosity was found to correlate with the non-clay mineral (NCM) content
of a sample. Frequencies of pore sizes within the clay matrix follow a power-law distribution, hinting towards the possibility of up-scaling of the
nanometre-scale observations to larger scale (micro-) structural features of the material. Power-law exponents are comparable to values found for
power-law pore-size distributions within the clay matrix of the Boom Clay, which indicates similarity of the pore-space morphologies within the
clay matrix of the Boom Clay and the Ypresian clays. Wood’s metal injection, followed by (cooled BIB)-SEM analysis shows that all visible pores are
connected via pore throats of diameter down to �10 nm.
Key words: BIB-SEM, microstructural analysis, nanometre-scale porosity, Wood’s metal injection, Ypresian clays
Introduction
In Belgium, research on a potential host rock formation for thesafe long-term disposal of high- and medium-level long-livedradioactive waste has so far been focused on the Oligocene BoomClay. The reference location for research on the Boom Clay is theMol-Dessel nuclear zone in the province of Antwerp (Belgium),involving the high activity disposal experimental site under-ground research facility (HADES-URF; Huysmans & Dassargues,2006; ONDRAF/NIRAS, 2001). Since the late 1990s, the Ypresianclays – part of the Eocene Ieper Group, Kortemark Member and
Kortrijk Formation – have been considered and investigated asanother potential host rock material for the deep geologicaldisposal of radioactive waste. A research site, located in Doel,close to Antwerp (Belgium), is the reference site for method-ological studies on the Ypresian clays (ONDRAF/NIRAS, 2001,2013a). So far, mainly mineralogical and geochemical aspectsof the material have been investigated, and little is knownabout the microstructure and mineral fabrics, in contrast to thewell-documented Boom Clay (Desbois et al., 2009, 2014; Hemeset al., 2013, 2015). Information on pore-size distributions, pore-space morphologies and pore-space connectivity are of special
C© Netherlands Journal of Geosciences Foundation 2016. This is an Open Access article, distributed under the terms of the Creative CommonsAttribution-NonCommercial-NoDerivatives licence (http://creativecommons.org/licenses/by-nc-nd/4.0/), which permits non-commercial re-use,distribution, and reproduction in any medium, provided the original work is unaltered and is properly cited. The written permission of CambridgeUniversity Press must be obtained for commercial re-use or in order to create a derivative work. 293
https://www.cambridge.org/core/terms. https://doi.org/10.1017/njg.2016.16Downloaded from https://www.cambridge.org/core. Lehrst F Alte Geschichte Hist Inst, on 14 Jun 2018 at 08:56:48, subject to the Cambridge Core terms of use, available at

Netherlands Journal of Geosciences — Geologie en Mijnbouw
Table 1. XRD bulk mineralogical analysis results (Qmineral Analysis and Consulting, 2014). Rietveld refinement was used for the
quantification of different mineral phases and the results are given in dry wt%.
Mineralogy (XRD analysis)
ON-Kallo-1-
008-a1
ON-Kallo-1-
020-a1
ON-Kallo-1-
045-a1
ON-Kallo-1-
060-a1
ON-Kallo-1-
086-c1
ON-Kallo-1-
108-a1
2:1 clays 28.9 65.9 69.2 48.9 54.9 56.0
Chlorite 0.6 1.4 1.0 1.1 1.4 1.3
Kaolinite 0.1 2.0 0.7 1.1 0.3 5.7
Sum clay minerals 29.6 69.3 70.9 51.1 56.6 63.0
Non-clay silicates
Quartz 54.6 23.9 23.5 38.8 36.5 31.0
Plagioclase 5.1 3.7 2.7 4.4 3.9 2.0
Alkalifeldspar 4.3 1.8 0.5 0.7 0.4 2.2
Opal 4.1 1.5 0.4
Clinoptilolite/heulandite 1.3
Carbonates
Calcite 0.3 0.9 1.7
Magnesite 0.4
Ankerite (0.2Fe) 0.7 0.5 0.6
Ankerite (0.54Fe) 0.3 0.3
Oxides
Rutile 0.3 0.4 0.4 0.4 0.4 0.5
Anatase 0.2 0.4 0.2 0.3 0.3
Sulphides
Pyrite 0.3 0.5 0.5 0.5 0.4 1.0
Sum non-clay minerals 70.5 30.7 29.2 49.0 43.6 37.0
Bold figures are sums of the entries above.
interest with respect to the migration of radionuclides (Aertsenset al., 2008a–c; Ortiz et al., 2002). The modelling of materialphysical properties, such as permeability and diffusivity, as wellas single and multi-phase fluid flow or radionuclide transportvia diffusion and migration requires these data as input (Bluntet al., 2013; Dvorkin et al., 2011; Hemes et al., 2015).
The main objective of this study was to provide the firstdirect detailed characterisation (qualitative and quantitative)of the 2D pore space in the Ypresian clays. This paper deliversstatistical analyses of the pore-space morphologies, includingsize, shape and orientation of the pores, down to hundreds ofnanometers in pore-size diameter.
In the present study, six samples from the ON-Kallo-1 drilling(2008) were analysed, with respect to their mineral fabrics andporosity, using a combination of broad-ion-beam (BIB) millingand high resolution scanning electron microscopy (SEM), downto nanometre-scale resolution, within representative samplesand areas.
Moreover, a high-pressure Wood’s metal injection (WMI) ex-periment, followed by (cooled BIB)-SEM, was carried out to gaininformation on the connectivity of the pore space in 2D images(Klaver et al., 2015a).
Results were evaluated and compared to results of previousBIB-SEM studies on the Boom Clay (Hemes et al., 2013, 2015).
Methods and materials
Methodology
Mineralogical analysis. For mineralogical characterisation, fullquantitative analyses of bulk mineralogy and <2 µm clay frac-tions were done using �20 g per sample for X-ray diffraction(XRD) analysis (Qmineral Analysis and Consulting, 2014; Heverlee,Belgium; Tables 1 and 2). The preparation of specimens for XRDanalysis is described below.
Samples were first dried at 60°C for at least 24 hours. Afterdrying, the samples were ground in an agate/porcelain mor-tar and part of the homogenised sample (�2.7 g) was mixedand milled together with an internal standard (Zincite; ZnO)in ethanol, in a micronising mill. Afterwards, the samples wereloaded into a sample holder for XRD, using CuKα radiation. Thequantification of the NCMs was performed using the Rietveldmethod, whereas the quantification of the clay minerals wasperformed using the PONCKS method (Scarlett & Madsen, 2006).During Rietveld refinement, an XRD pattern is calculated basedon the structural models of the minerals present. The calcu-lated pattern is then fitted to the measured pattern by refin-ing the structural parameters. Quantitative phase contents canbe derived from the so-called scale factors, which are refined
294
https://www.cambridge.org/core/terms. https://doi.org/10.1017/njg.2016.16Downloaded from https://www.cambridge.org/core. Lehrst F Alte Geschichte Hist Inst, on 14 Jun 2018 at 08:56:48, subject to the Cambridge Core terms of use, available at
Netherlands Journal of Geosciences — Geologie en Mijnbouw
Table 2. Mineralogical compositions of the <2 µm clay fractions from XRD (Qmineral Analysis and Consulting, 2014), calculated
using the PONKCS-method. Contributions are given in dry wt%.
<2 µm clay fraction
ON-Kallo-1-
008-a1
ON-Kallo-1-
020-a1
ON-Kallo-1-
045-a1
ON-Kallo-1-
060-a1
ON-Kallo-1-
086-c1
ON-Kallo-1-
108-a1
Illite 9.0 12.0 9.0 8.0 8.0 26.0
Smectite 62.0 69.0 62.0 66.0 66.0 32.0
Illite/smecite 27.0 18.0 27.0 25.0 24.0 27.0
Kaolinite 0.8 0.7 0.8 0.5 0.5 14.0
Chlorite 0.8 0.9 0.8 1.2 1.2 1.5
during the procedure (Table 1). In a second analysis, the frac-tion <2 μm, enriched in clay minerals, was separated fromeach of the samples, starting with a modified Jackson treatment(Jackson, 1985), in order to liberate the clay particles. Succes-sively, carbonates, organic matter and Fe oxides/hydroxideswere removed from the samples. Afterwards, the fraction<2 μm was separated by centrifugation and the interlayercations of the separated clay minerals were exchanged to theirCa form. Oriented clay specimens were prepared from the clay-enriched <2 μm fractions and measured by XRD in an air-dry,ethylene glycol solvated state.
The obtained diffraction patterns were modeled with theNewmod 2-software (Reynolds & Reynolds, 2012; Table 2).
Sample drying, water content porosimetry and BIB cross-sectioning.To minimise the development of desiccation cracks during high-vacuum BIB milling and SEM imaging, cubic centimetre samplesfrom wet preserved cores (originally of �20 cm length and 10cm diameter) were slowly dried prior to the analyses. Sampleswere cut along their bedding using a razorblade. Sub-samples,suitable for BIB milling, had dimensions of �1 × 0.5 × 0.4 cm.Drying was performed at room temperature, in closed contain-ers, over a period of 75–178 days at controlled relative humid-ity, using different saturated salt solutions (Winston & Don-ald, 1960). Five different salt solutions were prepared, rangingfrom 85% (potassium chloride, KCl), 76–75.5% (sodium chlo-ride, NaCl), 70–71% (1:1 mixture of NaCl and KCl), 55–53%(magnesium nitrate hexahydrate, Mg(NO3)2·6H2O) to 33–32.5%(magnesium chloride hexahydrate, MgCl2·6H2O).
To calculate water content porosities from weight losses,an average grain density of the Ypresian clays of 2.699 g/cm³(Van Marcke et al., 2005) and a pore-water density of 1.012g/cm³, from pore-water compositions measured at ON-Kallo-1(S. Brassinnes, ONDRAF/NIRAS, personal communication, 2014)were used. The resulting water content porosities were 41%,41%, 43%, 39%, 35% and 31%, respectively, for the samples 8a,20a, 45a, 60a, 86c and 108a, analysed.
After drying, samples were pre-polished using carbide grind-ing papers of grit sizes P500-2400 (ISO/FEPA Grit), followedby BIB milling, using a JeoL SM90001 at 6 kV for 8 hours,
with the BIB cross-section oriented perpendicular to the bed-ding. BIB milling removes about 100 µm of damaged materialand produces smooth, damage-free surfaces, suitable for high-resolution SEM image analysis.
Microstructural imaging using SEM (SE2, BSE, EDX). BIB-polishedsamples were analysed using a Zeiss SUPRA55 scanning electronmicroscope, equipped with a back-scattered electron (BSE) de-tector for qualitative mineralogical analysis and a SE2 detectorfor the analysis of the sample surface topography (mostly theporosity) at high resolution. Energy dispersive XRD (EDX; OxfordInstruments, SDD Xmax150) was available for semi-quantitativeanalysis of the composition.
For qualitative mineralogical, microstructural and pore-spaceanalyses, low-resolution (5000–6000x magnification) BSE andSE2 images were used, allowing for the identification of differ-ent mineral phases (BSE images) and characteristic pore-spacemorphologies (SE2 images; Figs 2–7). For quantitative porosityanalysis, SE2-image mosaics, taken at high SEM magnifications(15,000–30,000x), were used. Image analysis was carried outon areas where macroscopic desiccation cracks were lacking.At the microscopic scale, if desiccation cracks were identifiedthey were manually deleted from the segmentation data and ex-cluded from further statistical analyses. For more details aboutthe method we refer to Hemes et al. (2013).
Porosity evaluation (segmentation and analysis). In SE2 imagestaken at high magnifications (15,000–30,000x), pores are seg-mented semi-automatically, using a combination of thresh-olding and sobel-edge detection algorithms in Matlab (TheMathWorks R©; after Houben et al., 2013, 2014a; Klaver et al.,2012; Hemes et al., 2013), followed by manual cleaning. Theautomatic porosity segmentation procedure recognises �90%of the resolved pores correctly. Many larger pores contain seg-mentation artifacts and underestimate the boundary areas ofthe pores; these data are manually edited in ArcGIS (ESRIInc., 2011). Prior to further statistical analysis, pores belowthe practical pore-detection resolution (PPR), as well as dry-ing artifacts, are removed from the data. The PPR defines theminimum amount of pixels per pore that is necessary to con-fidently recognise the pore. In the present study, the PPR was
295
https://www.cambridge.org/core/terms. https://doi.org/10.1017/njg.2016.16Downloaded from https://www.cambridge.org/core. Lehrst F Alte Geschichte Hist Inst, on 14 Jun 2018 at 08:56:48, subject to the Cambridge Core terms of use, available at

Netherlands Journal of Geosciences — Geologie en Mijnbouw
determined as 15 pixels per pore, resulting in pore areas of1441 nm² at 30,000x (sample 108a) magnification, 3241 nm² at20,000x (samples 20a, 45a and 86c), 5704 nm² at 15,000x (sam-ple 8a) and 51,509 nm² at 5000x (sample 60a; Hemes et al.,2013; Klaver et al., 2012).
Pore morphologies are quantified using the Matlab toolboxPolyLX (Lexa, 2010). The most relevant output parameters arethe axial ratio (AR), the elongation (E), the roundness (R), thecircularity (C), the compactness (Cp), the grain-shape factor(GSF) and the orientation angle of the longest pore axis. Forpore-morphological analysis we discriminated between intra-clay matrix porosity and inter-aggregate pores.
For the analysis of pore-area size distributions, a non-linearbinning, as described by Hemes et al. (2013, 2015), Houbenet al. (2013, 2014a) and Klaver et al. (2012), of always dou-bling the subsequent bin size and starting with a bin size of 1nm², was used. The resulting pore-area size distributions andcontributions of pore-area sizes to total segmented porositieswere plotted against the bin centres (bi). Following the findingsof Houben et al. (2013), Klaver et al. (2012) and Hemes et al.(2013, 2015), pore-area size distributions in clayey materialscan be described by a power law, therefore the frequencies ofthe pore areas (Ni), that is, the number of pores falling withineach bin, were normalised by the respective bin size (Si) and,for the comparison of pore-area size distributions measured indifferent samples, the size of the total mosaic area analysed(Smosaic). The resulting normalised numbers of pores per bin (Ni
/SiSmosaic) were plotted against the bin centers (bi) on a doublelogarithmic scale (Equations 1 and 2).
[Ni/ (Si Smosaic)] = C(bi
−D)
(1)
log [Ni/ (Si Smosaic)] = −D log bi + log C (2)
where C is a constant of proportionality.To calculate the power-law exponents (D) and log (C) of the
distributions, least-square linear regression analyses (including95% confidence bounds) were applied to the linear parts of thepore-area size distributions on a double logarithmic scale andabove the PPRs.
Evaluation of the investigated areas’ representativeness. Relativeerrors – with respect to an infinite volume (= 100% mathe-matically representative) – of 2D apparent porosities were cal-culated after Hemes et al. (2015), Keller (2015), Keller et al.(2013) and Kanit et al. (2003) based on the size of the anal-ysed sample areas and the number of realisations (N) of thosearea elements (see the references above for details). By in-creasing the number of realisations (N), the area of investi-gation is virtually increased, thereby decreasing the relativeerror.
Wood’s metal injection experiment. To analyse and directly vi-sualise the connectivity of the pore space, Wood’s metal (WM)injection, as an alternative to mercury intrusion porosimetry
(MIP), was used. The advantage of WM over mercury is that it issolid at ambient conditions, but melts above �70°C, thereforeby heating the whole injection set-up, including the samples,the metal can be injected into the sample’s pore space in itsliquid state. By cooling down the whole set-up to room temper-ature afterwards, the injected metal solidifies within the porespace and can be visualised using (cooled BIB)-SEM. The chem-ical composition of the WM alloy is �50% Bi, 25% Pb, 12.5% Snand 12.5% Cd.
The WMI apparatus used in the present study (after Klaveret al., 2015a) was developed in-house at RWTH Aachen Univer-sity (Hildenbrand, 2003; Hildebrand & Urai, 2003). It consistsof a pressure cell and two pistons, with external heating and athermocouple for temperature control during the experiment.A nut and the lower steel piston, with a thread, are used torelease the WM cylinder with the injected samples after coolingat the end of the experiment. For WMI, a solid WM piece isinserted into the pressure cell with the lower piston in place.To melt the WM, the cell is heated to �75°C, which is checkedusing a thermocouple and by visual inspection. Afterwards, theoven-dried samples, with dimensions of �0.5 × 0.5 × 0.5 cm,are inserted into the cylinder and immersed into the moltenalloy. The upper piston is put in place and the pressure cellis loaded using a manually-controlled hydraulic press equippedwith a pressure gauge. The pressure in the molten WM is in-creased to a maximum of �156 MPa, so the smallest accessedpore throats should be about �10 nm in diameter. This is cal-culated using Laplace’s equation (Washburn, 1921; Equation 3).After the maximum pressure has been reached, the heating isturned off and the system is cooled down to room temperatureovernight and at high pressure. The solidified WM cylinder con-taining the samples is then gently pushed out of the stainlesssteel cylinder (Klaver et al., 2015a).
P = −4γ cos θ/d (3)
For the pore-throat diameter calculation, an interfacial ten-sion (γ ) of WM of 0.420 N/m and a wetting angle (θ) of 140°(after Abell et al., 1999; Darot & Reuschle, 1999; Hildebrand &Urai, 2003; Klaver et al., 2015a) were used.
Samples are cut from the WM cylinder at room temperature,followed by pre-polishing, using silicon carbide papers downto grit-size P2400 (ISO/FEPA Grit), to optimise the subsequentBIB-polishing.
To avoid re-melting the WM inside the samples, a TechnoorgLinda Co. Ltd. SC-1000 argon-ion beam polisher, equipped witha Peltier module – to keep the temperature below the meltingpoint of WM during the ion-beam milling, that is, the samplestage was maintained at �40°C during the whole experiment –was used to produce large, planar cross-sections with low sur-face roughness. The samples were polished in two subsequentsteps and rotated during the ion-milling, as described in Klaveret al. (2015a).
296
https://www.cambridge.org/core/terms. https://doi.org/10.1017/njg.2016.16Downloaded from https://www.cambridge.org/core. Lehrst F Alte Geschichte Hist Inst, on 14 Jun 2018 at 08:56:48, subject to the Cambridge Core terms of use, available at

Netherlands Journal of Geosciences — Geologie en Mijnbouw
Fig. 1. Stratigraphy, lithology and depths of origin (m BDT) of the Ypresian clay samples investigated in the present study. Figure modified from Mohammad
(2009), after Hemes (2015).
Samples
The Ypresian clays. The Ypresian clays – part of the Eocene IeperGroup – were deposited predominantly in a marine environment
during the oldest age of the Eocene (i.e. the Ypresian Age)�55–49 Ma ago (ONDRAF/NIRAS, 2001; Steurbaut, 1998). Theycomprise the clayey deposits of the Kortrijk Formation and theclay-rich silts of the lower part of the Tielt Formation, referred
297
https://www.cambridge.org/core/terms. https://doi.org/10.1017/njg.2016.16Downloaded from https://www.cambridge.org/core. Lehrst F Alte Geschichte Hist Inst, on 14 Jun 2018 at 08:56:48, subject to the Cambridge Core terms of use, available at
Netherlands Journal of Geosciences — Geologie en Mijnbouw
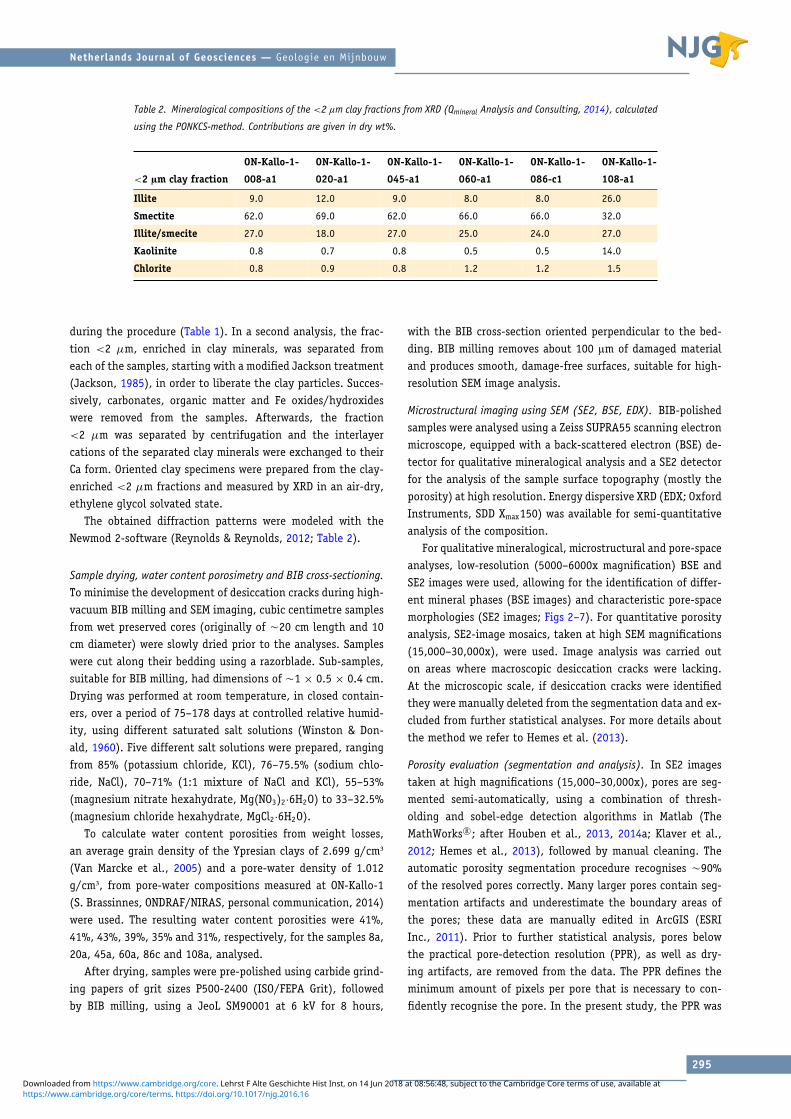
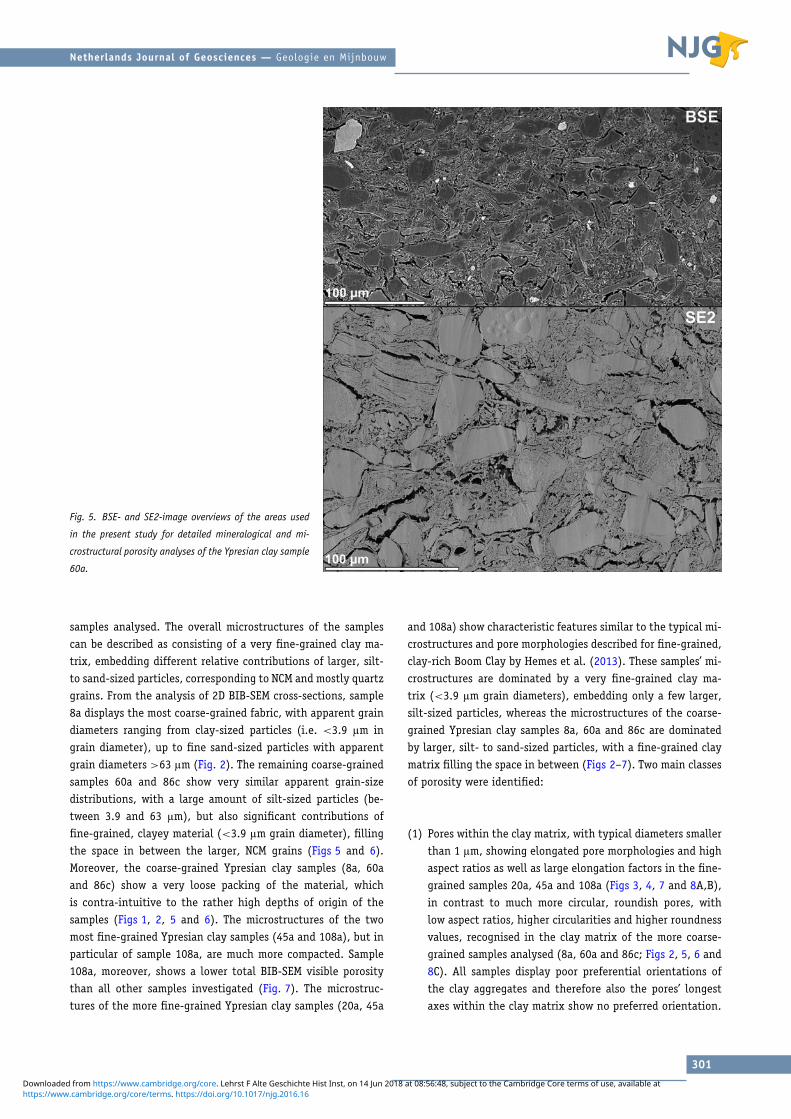
Fig. 2. BSE- and SE2-image overviews of the areas used
in the present study for detailed mineralogical and mi-
crostructural porosity analyses of the Ypresian clay sample
8a.
to as the Kortemark Member, which were both deposited duringthe early to middle Ypresian (Van Marcke et al., 2005). Thedeposits are present underneath nearly the whole of Belgium,parts of France and small areas of the Netherlands at depthsranging from the surface to �650 m below tweede algemeenewaterpassing (TAW), that is, the second general levelling inBelgium (Jones, 1949; Labat, 2011). They dip gently to thenorth–northeast (Van Marcke et al., 2005). The thickness ofthe deposits varies between �50 m in the south and �150 min the north. Similar to the Boom Clay Formation, the Ypresianclays consist of an alternation of clay- and silt-rich layers,with the corresponding variation in grain size distribution (VanMarcke et al., 2005). First results of quantitative mineralogicalanalyses on the Ypresian clays, from the Doel-1 well (1998), aresummarised in Van Marcke et al. (2005).
Samples analysed in the present study. All samples analysed inthe present contribution originate from the ON-Kallo-1 (2008)well at depths between –288 and –387 m TAW, within theKortemark Member and Kortrijk Formation (Fig. 1). Sampleswere chosen from the Kortemark Member, Aalbeke Member,Roubaix Member and Orchies/Mont-Heribu Member (Cammaeret al., 2009; Mohammad, 2009; ONDRAF/NIRAS, 2013b), com-prising different mineralogical compositions and grain-size dis-
tributions, and being representative of more clay-rich, fine-grained vs more NCM and silt-rich, low vs high-porosity mate-rial. Six samples were analysed in total. Two samples were veryfine grained and show high clay mineral contents (Table 1;samples ON-Kallo-1-108-a1 and ON-Kallo-1-045-a1), originat-ing from depths of �395 mBDT/–387 mTAW (sample 108a)and 333 mBDT/–325 mTAW (sample 45a), respectively. Sam-ple ON-Kallo-1-020-a1 was of intermediate grain-size and wascollected at a depth of �308 mBDT/–300 mTAW. Three sam-ples were more coarse grained (samples ON-Kallo-1-008-a1, ON-Kallo-1-060-a1 and ON-Kallo-1-086-c1), originating from depthsof about 296 mBDT/–288 mTAW (sample 8a), 348 mBDT/–340mTAW and �373 mBDT/–365 mTAW (sample 86c), respectively.Fig. 1 shows the depths of origin of the Ypresian clay samplesanalysed (in mBDT), together with the lithology of the Ypresianclays at ON-Kallo-1 (after Mohammad, 2009; Hemes, 2015).
Results
Full quantitative analysis of the chemicalcompositions
Quantitative XRD results indicate comparable overall mineralog-ical compositions of the samples, but with varying proportions
298
https://www.cambridge.org/core/terms. https://doi.org/10.1017/njg.2016.16Downloaded from https://www.cambridge.org/core. Lehrst F Alte Geschichte Hist Inst, on 14 Jun 2018 at 08:56:48, subject to the Cambridge Core terms of use, available at
Netherlands Journal of Geosciences — Geologie en Mijnbouw
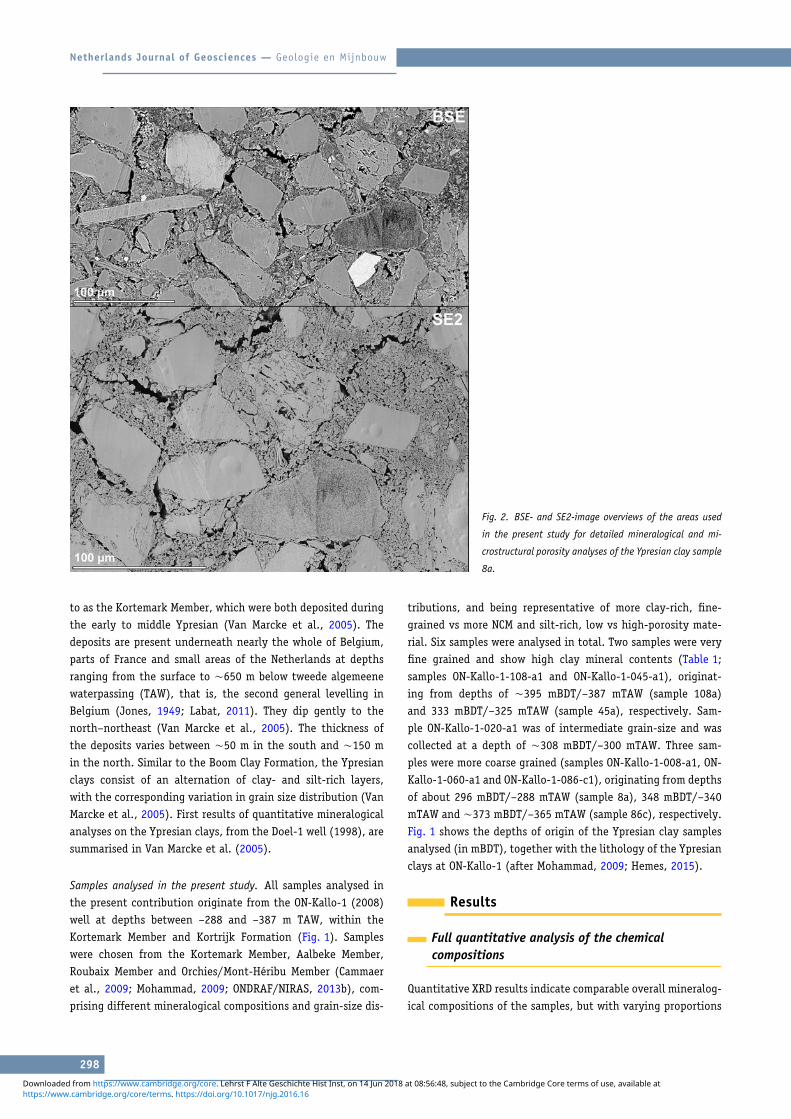
Fig. 3. BSE- and SE2-image overviews of the areas used
in the present study for detailed mineralogical and mi-
crostructural porosity analyses of the Ypresian clay sample
20a.
of the different mineral phases (Tables 1 and 2). Clay mineralcontents range between 29.6 dry wt% in sample 8a (clay-poor)and �71 dry wt% in sample 45a (most clay-rich). Sample 20ashows a clay mineral content of �69 dry wt% and is thereforealso considered to be clay-rich, whereas samples 60a, 86c and108a show intermediate clay mineral contents between 51 and63 dry wt% (Table 1).
Mineralogical analyses using XRD and subsequent quantifi-cation of the NCMs by the Rietveld method as well as quan-tification of the clay minerals by the PONCKS-method result inthree different groups of clay minerals, present in significantamounts. These comprise 2:1 clays or TOT phyllosilicates, whichare smectite, illite or illite–smectite mixed layer clays. The sec-ond group consists of kaolinites, referred to as TO or 1:1 clays,and the third of chlorites. Kaolinites and chlorites are presentin much lower quantities of between 0.1 to 2 dry wt%, comparedto the 2:1 clays, accounting for between 28.9 and 69.2 dry wt%(Tables 1 and 2). Only sample 108a shows a higher kaolinitecontent of �5.7 dry wt% (bulk sample) and �14 dry wt% in its
<2 μm clay fraction, whereas the other samples investigatedcontain <1 dry wt% kaolinite in their <2 μm clay fractions(Tables 1 and 2). Chlorite is limited to the <2 μm clay fractionin all samples, with concentrations between 0.8 and 1.5 drywt% (Tables 1 and 2). The 2:1 clays in the <2 μm fractions con-sist mainly of smectites (�32–69 dry wt%) and illite–smectitemixed layer clays (between 18 and 27 dry wt%). Illite is alsopresent in the <2 μm clay fraction of the samples, but in muchlower quantities of between 8 and 12 dry wt%. Again, sample108a is the exception, with a much higher illite content of �26dry wt% and remarkably less smectite, contributing to only �32dry wt% of the <2 μm clay fraction of the sample (Table 2).
Although only the clay minerals were quantified in the ori-ented clay specimens, reflections of other minerals could also beidentified. Among these are zeolites (clinoptilolite or heulan-dite) in sample 8a, concentrated in its <2 μm clay fraction.Opal was identified in the bulk diffraction patterns of the<2 μm clay fractions of samples 8a, 60a and 86c, with con-centrations inversely correlated to the clay mineral contents.
299
https://www.cambridge.org/core/terms. https://doi.org/10.1017/njg.2016.16Downloaded from https://www.cambridge.org/core. Lehrst F Alte Geschichte Hist Inst, on 14 Jun 2018 at 08:56:48, subject to the Cambridge Core terms of use, available at
Netherlands Journal of Geosciences — Geologie en Mijnbouw
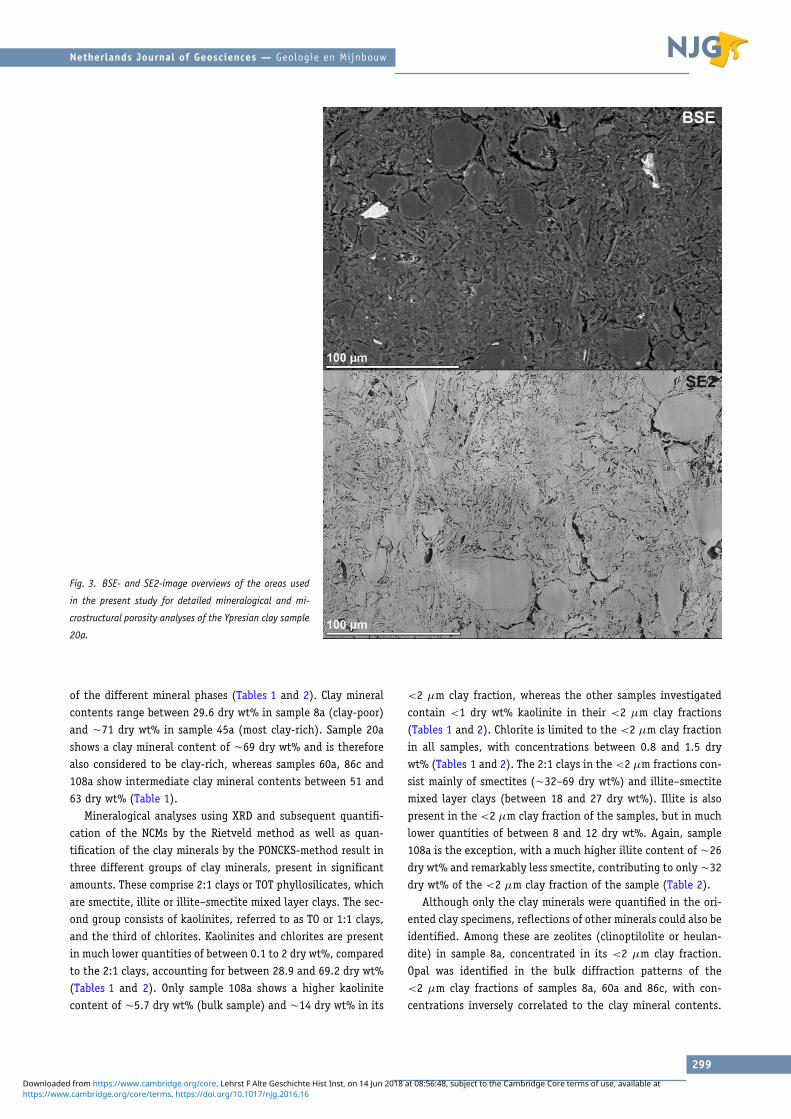
Fig. 4. BSE- and SE2-image overviews of the areas used
in the present study for detailed mineralogical and mi-
crostructural porosity analyses of the Ypresian clay sample
45a.
In the clay-rich samples 20a, 45a and 108a, no opal was found atall. Quartz was detected in all samples analysed, showing con-centrations between 23.5 dry wt% (sample 45a) and 54.6 drywt% (sample 8a). An inverse correlation between the amountof plagioclase and the samples’ clay mineral contents (Table 1)was observed, showing the highest plagioclase concentrationsof 3.9–5.1 dry wt% in the most clay-poor samples (8a, 60aand 86c). Only sample 108a shows a lower plagioclase contentthan samples 20a and 45a, although its clay mineral content islower too. Alkali-feldspars were found in rather high concen-trations in samples 8a (�4.3 dry wt%), 108a (�2.2 dry wt%)and 20a (�1.8 dry wt%), but in much lower concentrations ofonly �0.4–0.7 dry wt% in the remaining samples. The carbon-ates calcite and ankerite were identified in low concentrations(<2 dry wt%) in samples 8a, 45a, 60a and 86c. Magnesite wasfound in sample 86c (�0.4 dry wt%), only. Rutile, anatase andpyrite were present in concentrations �1 dry wt% in most ofthe samples analysed (Table 1).
From bulk sample mineralogical compositions and resultsof XRD analyses of the <2 µm clay fractions, total expand-ing clay mineral contributions (i.e. smectites + illite–smectitemixed layer clays) were calculated. The expanding clay mineral
content of a sample is of importance with respect to the vol-ume change potential of clay minerals during drying/wetting,respectively, and therefore there is the potential for the de-velopment of desiccation cracks. Results give bulk expandingclay mineral contents of 26 dry wt% in sample 8a, 60 dry wt%in sample 20a, 63 dry wt% in sample 45a, 47 dry wt% in sam-ple 60a, 51 dry wt% in sample 86c and 37 dry wt% in sample108a. For the calculation, only the contributions of mica fromthe 2:1 fractions of the bulk were taken into account (but notto the <2 µm clay fractions). Recent analysis of the swellingproperties of the Ypresian clays, performed on the same cores,confirms our results based on XRD measurements.
Qualitative description of the morphology ofporosity
Analysis of BSE- and SE2-image mosaics. BSE- and SE2-image mo-saics, taken at SEM magnification between 5000 and 30,000x,cover areas between 150 × 250 and 200 × 300 µm² (Figs 2–7). Only the SE2-image area analysed for sample 108a isslightly smaller (�150 × 200 µm²; Fig. 7). The images showthe characteristic mineral and pore fabrics of the Ypresian clay
300
https://www.cambridge.org/core/terms. https://doi.org/10.1017/njg.2016.16Downloaded from https://www.cambridge.org/core. Lehrst F Alte Geschichte Hist Inst, on 14 Jun 2018 at 08:56:48, subject to the Cambridge Core terms of use, available at
Netherlands Journal of Geosciences — Geologie en Mijnbouw
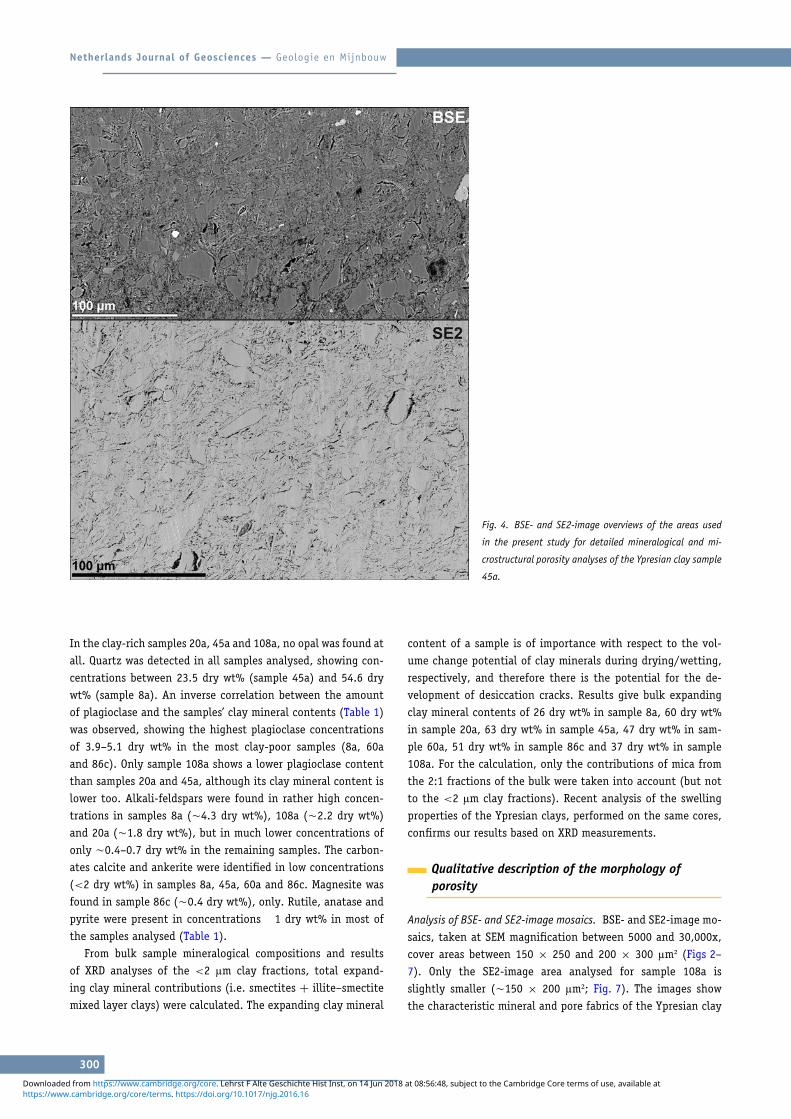
Fig. 5. BSE- and SE2-image overviews of the areas used
in the present study for detailed mineralogical and mi-
crostructural porosity analyses of the Ypresian clay sample
60a.
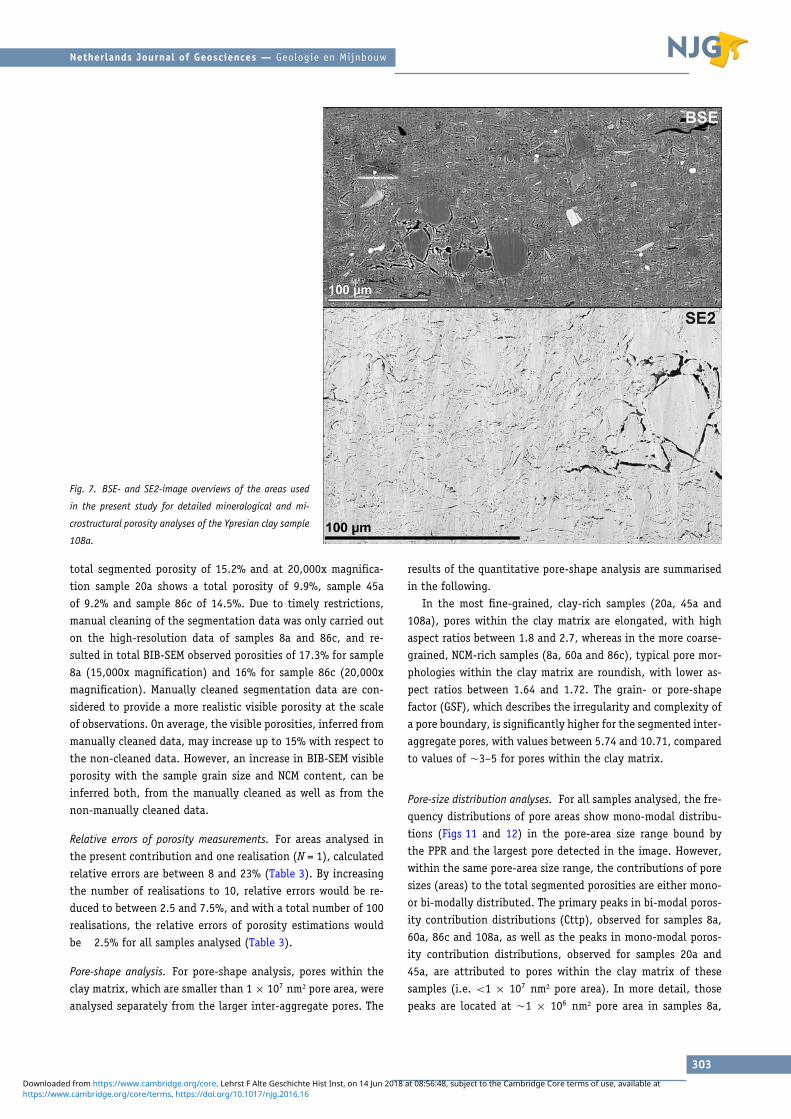
samples analysed. The overall microstructures of the samplescan be described as consisting of a very fine-grained clay ma-trix, embedding different relative contributions of larger, silt-to sand-sized particles, corresponding to NCM and mostly quartzgrains. From the analysis of 2D BIB-SEM cross-sections, sample8a displays the most coarse-grained fabric, with apparent graindiameters ranging from clay-sized particles (i.e. <3.9 µm ingrain diameter), up to fine sand-sized particles with apparentgrain diameters >63 µm (Fig. 2). The remaining coarse-grainedsamples 60a and 86c show very similar apparent grain-sizedistributions, with a large amount of silt-sized particles (be-tween 3.9 and 63 µm), but also significant contributions offine-grained, clayey material (<3.9 µm grain diameter), fillingthe space in between the larger, NCM grains (Figs 5 and 6).Moreover, the coarse-grained Ypresian clay samples (8a, 60aand 86c) show a very loose packing of the material, whichis contra-intuitive to the rather high depths of origin of thesamples (Figs 1, 2, 5 and 6). The microstructures of the twomost fine-grained Ypresian clay samples (45a and 108a), but inparticular of sample 108a, are much more compacted. Sample108a, moreover, shows a lower total BIB-SEM visible porositythan all other samples investigated (Fig. 7). The microstruc-tures of the more fine-grained Ypresian clay samples (20a, 45a
and 108a) show characteristic features similar to the typical mi-crostructures and pore morphologies described for fine-grained,clay-rich Boom Clay by Hemes et al. (2013). These samples’ mi-crostructures are dominated by a very fine-grained clay ma-trix (<3.9 µm grain diameters), embedding only a few larger,silt-sized particles, whereas the microstructures of the coarse-grained Ypresian clay samples 8a, 60a and 86c are dominatedby larger, silt- to sand-sized particles, with a fine-grained claymatrix filling the space in between (Figs 2–7). Two main classesof porosity were identified:
(1) Pores within the clay matrix, with typical diameters smallerthan 1 µm, showing elongated pore morphologies and highaspect ratios as well as large elongation factors in the fine-grained samples 20a, 45a and 108a (Figs 3, 4, 7 and 8A,B),in contrast to much more circular, roundish pores, withlow aspect ratios, higher circularities and higher roundnessvalues, recognised in the clay matrix of the more coarse-grained samples analysed (8a, 60a and 86c; Figs 2, 5, 6 and8C). All samples display poor preferential orientations ofthe clay aggregates and therefore also the pores’ longestaxes within the clay matrix show no preferred orientation.
301
https://www.cambridge.org/core/terms. https://doi.org/10.1017/njg.2016.16Downloaded from https://www.cambridge.org/core. Lehrst F Alte Geschichte Hist Inst, on 14 Jun 2018 at 08:56:48, subject to the Cambridge Core terms of use, available at

Netherlands Journal of Geosciences — Geologie en Mijnbouw
Fig. 6. BSE- and SE2-image overviews of the areas used
in the present study for detailed mineralogical and mi-
crostructural porosity analyses of the Ypresian clay sample
86c.
(2) Larger inter-aggregate pores are found at the interfacesbetween clay matrix and NCM grains, with typical diametersabove 1 up to 10 µm (Figs 2–7 and 9).
A more detailed inspection of these inter-aggregate poresshows that they can be further sub-divided into two classes:
(i) Symmetric pores, showing rather high aspect ratios andserrated pore boundaries and resembling desiccation cracks,as described by Renard (2012), Houben et al. (2014b) andDesbois et al. (2014).
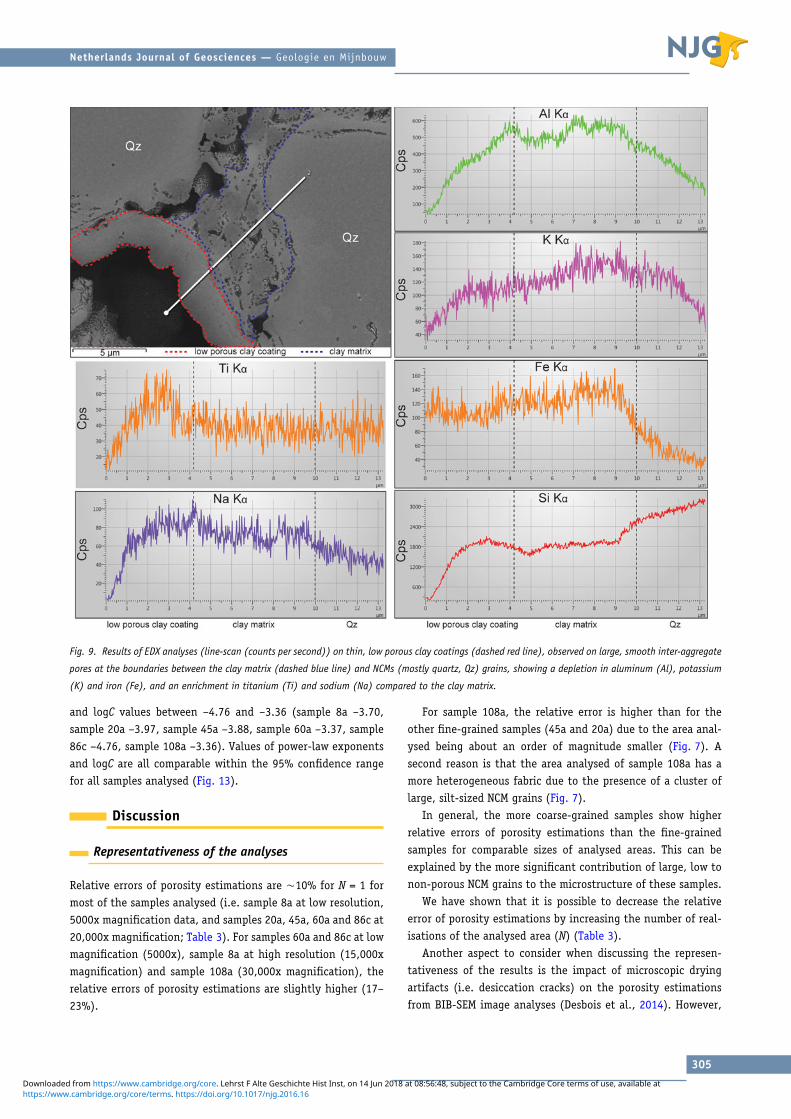
(ii) Pores with smooth, rounded pore boundaries, coated by avery low porous, thin (�1–3 µm) clay layer (Fig. 9). Com-pared to the clay matrix, EDX analysis indicates enrichmentin titanium (Ti) and sodium (Na) in these coatings, but aslight depletion in aluminum (Al), potassium (K) and iron(Fe) (Fig. 9).
The loose packing of the coarse-grained samples (8a, 60a and86c), their high clay matrix internal porosities, together withthe smooth, rounded pore morphologies were described andcharacterised as a ‘flower like microstructure’ (Hemes, 2015;Figs 2, 5 and 6).
Wood’s metal injection
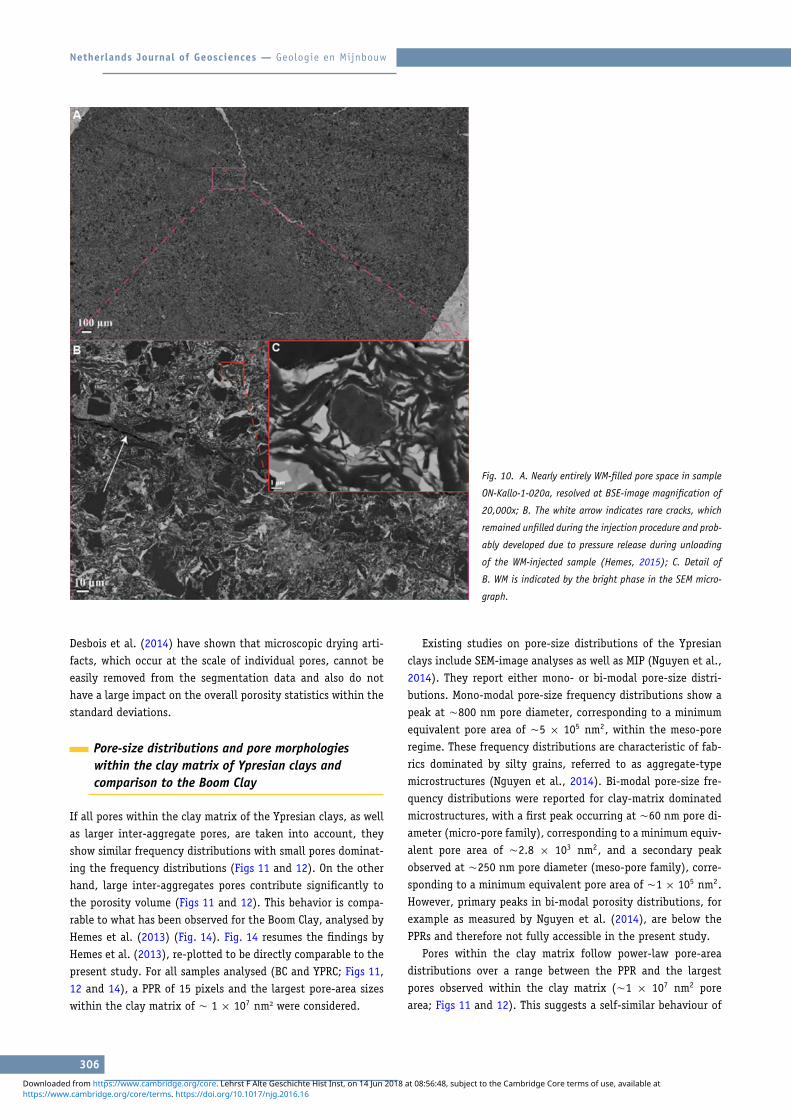
WMI was carried out on one Ypresian clay sample (ON-Kallo-1-020a). Because of the high density of the WM, it appearsbright in BSE images (Fig. 10) and the results show that nearlythe entire resolved pore space was filled by the WM alloy, withonly a few cracks remaining unfilled (Fig. 10, white arrow). Theinset in Fig. 10 shows high-resolution examples of the small-est visible filled pores. WMI reveals that all pores – includingpores within the clay matrix as well as inter-aggregates pores– are mutually connected at a maximum WM entry pressure of156 MPa, corresponding to accessible pore-throat diameters of10 nm.
Quantitative description of porosity
Visible porosity in BIB-SEM images. Total BIB-SEM observedporosities, resulting from automatic porosity segmentations onSE2-image mosaics at resolutions between 51,509 nm² at 5000xmagnification and 1441 nm² at 30,000x magnification, are be-tween 6.3% of the analysed area for sample 108a (30,000x)and 17.8% for sample 60a (20,000x). At 5000x magnificationsample 60a shows a total porosity of 14.8% and sample 8aof 13.9%. At 15,000x SEM magnification sample 8a shows a
302
https://www.cambridge.org/core/terms. https://doi.org/10.1017/njg.2016.16Downloaded from https://www.cambridge.org/core. Lehrst F Alte Geschichte Hist Inst, on 14 Jun 2018 at 08:56:48, subject to the Cambridge Core terms of use, available at
Netherlands Journal of Geosciences — Geologie en Mijnbouw
Fig. 7. BSE- and SE2-image overviews of the areas used
in the present study for detailed mineralogical and mi-
crostructural porosity analyses of the Ypresian clay sample
108a.
total segmented porosity of 15.2% and at 20,000x magnifica-tion sample 20a shows a total porosity of 9.9%, sample 45aof 9.2% and sample 86c of 14.5%. Due to timely restrictions,manual cleaning of the segmentation data was only carried outon the high-resolution data of samples 8a and 86c, and re-sulted in total BIB-SEM observed porosities of 17.3% for sample8a (15,000x magnification) and 16% for sample 86c (20,000xmagnification). Manually cleaned segmentation data are con-sidered to provide a more realistic visible porosity at the scaleof observations. On average, the visible porosities, inferred frommanually cleaned data, may increase up to 15% with respect tothe non-cleaned data. However, an increase in BIB-SEM visibleporosity with the sample grain size and NCM content, can beinferred both, from the manually cleaned as well as from thenon-manually cleaned data.
Relative errors of porosity measurements. For areas analysed inthe present contribution and one realisation (N = 1), calculatedrelative errors are between 8 and 23% (Table 3). By increasingthe number of realisations to 10, relative errors would be re-duced to between 2.5 and 7.5%, and with a total number of 100realisations, the relative errors of porosity estimations wouldbe �2.5% for all samples analysed (Table 3).
Pore-shape analysis. For pore-shape analysis, pores within theclay matrix, which are smaller than 1 × 10⁷ nm² pore area, wereanalysed separately from the larger inter-aggregate pores. The
results of the quantitative pore-shape analysis are summarisedin the following.
In the most fine-grained, clay-rich samples (20a, 45a and108a), pores within the clay matrix are elongated, with highaspect ratios between 1.8 and 2.7, whereas in the more coarse-grained, NCM-rich samples (8a, 60a and 86c), typical pore mor-phologies within the clay matrix are roundish, with lower as-pect ratios between 1.64 and 1.72. The grain- or pore-shapefactor (GSF), which describes the irregularity and complexity ofa pore boundary, is significantly higher for the segmented inter-aggregate pores, with values between 5.74 and 10.71, comparedto values of �3–5 for pores within the clay matrix.
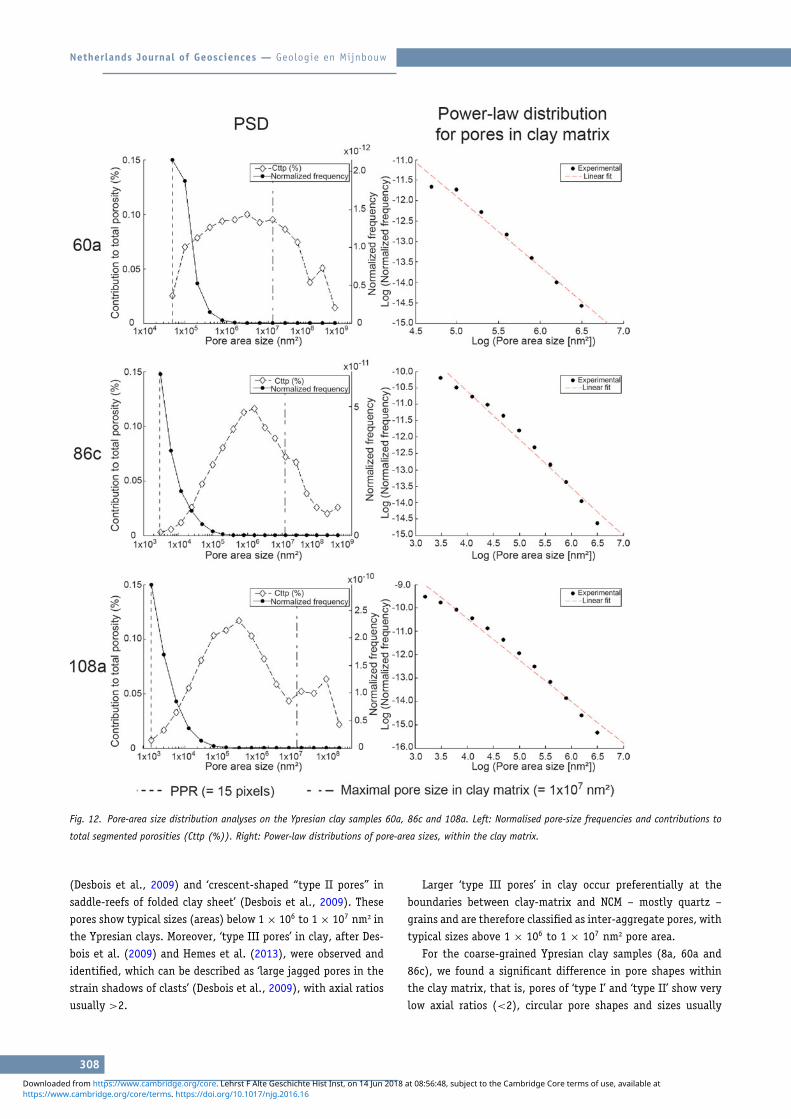
Pore-size distribution analyses. For all samples analysed, the fre-quency distributions of pore areas show mono-modal distribu-tions (Figs 11 and 12) in the pore-area size range bound bythe PPR and the largest pore detected in the image. However,within the same pore-area size range, the contributions of poresizes (areas) to the total segmented porosities are either mono-or bi-modally distributed. The primary peaks in bi-modal poros-ity contribution distributions (Cttp), observed for samples 8a,60a, 86c and 108a, as well as the peaks in mono-modal poros-ity contribution distributions, observed for samples 20a and45a, are attributed to pores within the clay matrix of thesesamples (i.e. <1 × 10⁷ nm² pore area). In more detail, thosepeaks are located at �1 × 10⁶ nm² pore area in samples 8a,
303
https://www.cambridge.org/core/terms. https://doi.org/10.1017/njg.2016.16Downloaded from https://www.cambridge.org/core. Lehrst F Alte Geschichte Hist Inst, on 14 Jun 2018 at 08:56:48, subject to the Cambridge Core terms of use, available at
Netherlands Journal of Geosciences — Geologie en Mijnbouw
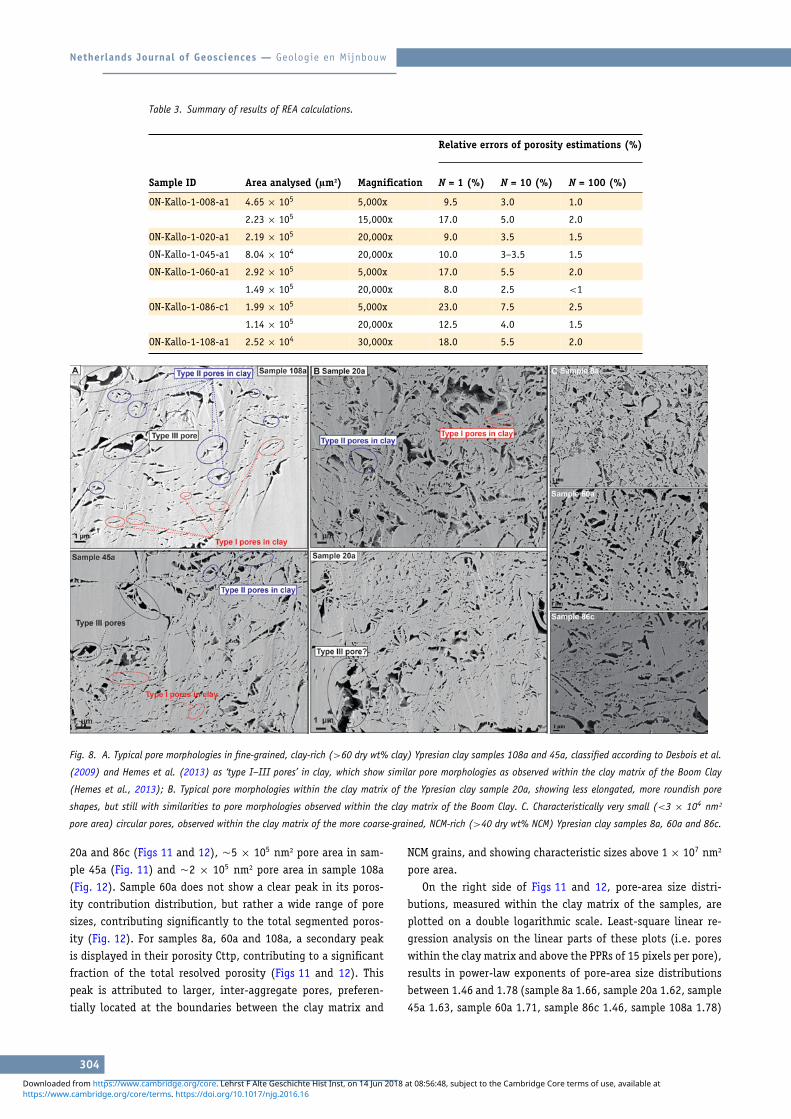
Table 3. Summary of results of REA calculations.
Relative errors of porosity estimations (%)
Sample ID Area analysed (µm²) Magnification N = 1 (%) N = 10 (%) N = 100 (%)
ON-Kallo-1-008-a1 4.65 × 10⁵ 5,000x 9.5 3.0 1.0
2.23 × 10⁵ 15,000x 17.0 5.0 2.0
ON-Kallo-1-020-a1 2.19 × 10⁵ 20,000x 9.0 3.5 1.5
ON-Kallo-1-045-a1 8.04 × 10⁴ 20,000x 10.0 3–3.5 1.5
ON-Kallo-1-060-a1 2.92 × 10⁵ 5,000x 17.0 5.5 2.0
1.49 × 10⁵ 20,000x 8.0 2.5 <1
ON-Kallo-1-086-c1 1.99 × 10⁵ 5,000x 23.0 7.5 2.5
1.14 × 10⁵ 20,000x 12.5 4.0 1.5
ON-Kallo-1-108-a1 2.52 × 10⁴ 30,000x 18.0 5.5 2.0
Fig. 8. A. Typical pore morphologies in fine-grained, clay-rich (>60 dry wt% clay) Ypresian clay samples 108a and 45a, classified according to Desbois et al.
(2009) and Hemes et al. (2013) as ‘type I–III pores’ in clay, which show similar pore morphologies as observed within the clay matrix of the Boom Clay
(Hemes et al., 2013); B. Typical pore morphologies within the clay matrix of the Ypresian clay sample 20a, showing less elongated, more roundish pore
shapes, but still with similarities to pore morphologies observed within the clay matrix of the Boom Clay. C. Characteristically very small (<3 × 10⁴ nm²
pore area) circular pores, observed within the clay matrix of the more coarse-grained, NCM-rich (>40 dry wt% NCM) Ypresian clay samples 8a, 60a and 86c.
20a and 86c (Figs 11 and 12), �5 × 10⁵ nm² pore area in sam-ple 45a (Fig. 11) and �2 × 10⁵ nm² pore area in sample 108a(Fig. 12). Sample 60a does not show a clear peak in its poros-ity contribution distribution, but rather a wide range of poresizes, contributing significantly to the total segmented poros-ity (Fig. 12). For samples 8a, 60a and 108a, a secondary peakis displayed in their porosity Cttp, contributing to a significantfraction of the total resolved porosity (Figs 11 and 12). Thispeak is attributed to larger, inter-aggregate pores, preferen-tially located at the boundaries between the clay matrix and
NCM grains, and showing characteristic sizes above 1 × 10⁷ nm²pore area.
On the right side of Figs 11 and 12, pore-area size distri-butions, measured within the clay matrix of the samples, areplotted on a double logarithmic scale. Least-square linear re-gression analysis on the linear parts of these plots (i.e. poreswithin the clay matrix and above the PPRs of 15 pixels per pore),results in power-law exponents of pore-area size distributionsbetween 1.46 and 1.78 (sample 8a 1.66, sample 20a 1.62, sample45a 1.63, sample 60a 1.71, sample 86c 1.46, sample 108a 1.78)
304
https://www.cambridge.org/core/terms. https://doi.org/10.1017/njg.2016.16Downloaded from https://www.cambridge.org/core. Lehrst F Alte Geschichte Hist Inst, on 14 Jun 2018 at 08:56:48, subject to the Cambridge Core terms of use, available at
Netherlands Journal of Geosciences — Geologie en Mijnbouw
Fig. 9. Results of EDX analyses (line-scan (counts per second)) on thin, low porous clay coatings (dashed red line), observed on large, smooth inter-aggregate
pores at the boundaries between the clay matrix (dashed blue line) and NCMs (mostly quartz, Qz) grains, showing a depletion in aluminum (Al), potassium
(K) and iron (Fe), and an enrichment in titanium (Ti) and sodium (Na) compared to the clay matrix.
and logC values between –4.76 and –3.36 (sample 8a –3.70,sample 20a –3.97, sample 45a –3.88, sample 60a –3.37, sample86c –4.76, sample 108a –3.36). Values of power-law exponentsand logC are all comparable within the 95% confidence rangefor all samples analysed (Fig. 13).
Discussion
Representativeness of the analyses
Relative errors of porosity estimations are �10% for N = 1 formost of the samples analysed (i.e. sample 8a at low resolution,5000x magnification data, and samples 20a, 45a, 60a and 86c at20,000x magnification; Table 3). For samples 60a and 86c at lowmagnification (5000x), sample 8a at high resolution (15,000xmagnification) and sample 108a (30,000x magnification), therelative errors of porosity estimations are slightly higher (17–23%).
For sample 108a, the relative error is higher than for theother fine-grained samples (45a and 20a) due to the area anal-ysed being about an order of magnitude smaller (Fig. 7). Asecond reason is that the area analysed of sample 108a has amore heterogeneous fabric due to the presence of a cluster oflarge, silt-sized NCM grains (Fig. 7).
In general, the more coarse-grained samples show higherrelative errors of porosity estimations than the fine-grainedsamples for comparable sizes of analysed areas. This can beexplained by the more significant contribution of large, low tonon-porous NCM grains to the microstructure of these samples.
We have shown that it is possible to decrease the relativeerror of porosity estimations by increasing the number of real-isations of the analysed area (N) (Table 3).
Another aspect to consider when discussing the represen-tativeness of the results is the impact of microscopic dryingartifacts (i.e. desiccation cracks) on the porosity estimationsfrom BIB-SEM image analyses (Desbois et al., 2014). However,
305
https://www.cambridge.org/core/terms. https://doi.org/10.1017/njg.2016.16Downloaded from https://www.cambridge.org/core. Lehrst F Alte Geschichte Hist Inst, on 14 Jun 2018 at 08:56:48, subject to the Cambridge Core terms of use, available at
Netherlands Journal of Geosciences — Geologie en Mijnbouw
Fig. 10. A. Nearly entirely WM-filled pore space in sample
ON-Kallo-1-020a, resolved at BSE-image magnification of
20,000x; B. The white arrow indicates rare cracks, which
remained unfilled during the injection procedure and prob-
ably developed due to pressure release during unloading
of the WM-injected sample (Hemes, 2015); C. Detail of
B. WM is indicated by the bright phase in the SEM micro-
graph.
Desbois et al. (2014) have shown that microscopic drying arti-facts, which occur at the scale of individual pores, cannot beeasily removed from the segmentation data and also do nothave a large impact on the overall porosity statistics within thestandard deviations.
Pore-size distributions and pore morphologieswithin the clay matrix of Ypresian clays andcomparison to the Boom Clay
If all pores within the clay matrix of the Ypresian clays, as wellas larger inter-aggregate pores, are taken into account, theyshow similar frequency distributions with small pores dominat-ing the frequency distributions (Figs 11 and 12). On the otherhand, large inter-aggregates pores contribute significantly tothe porosity volume (Figs 11 and 12). This behavior is compa-rable to what has been observed for the Boom Clay, analysed byHemes et al. (2013) (Fig. 14). Fig. 14 resumes the findings byHemes et al. (2013), re-plotted to be directly comparable to thepresent study. For all samples analysed (BC and YPRC; Figs 11,12 and 14), a PPR of 15 pixels and the largest pore-area sizeswithin the clay matrix of � 1 × 10⁷ nm² were considered.
Existing studies on pore-size distributions of the Ypresianclays include SEM-image analyses as well as MIP (Nguyen et al.,2014). They report either mono- or bi-modal pore-size distri-butions. Mono-modal pore-size frequency distributions show apeak at �800 nm pore diameter, corresponding to a minimumequivalent pore area of �5 × 10⁵ nm2, within the meso-poreregime. These frequency distributions are characteristic of fab-rics dominated by silty grains, referred to as aggregate-typemicrostructures (Nguyen et al., 2014). Bi-modal pore-size fre-quency distributions were reported for clay-matrix dominatedmicrostructures, with a first peak occurring at �60 nm pore di-ameter (micro-pore family), corresponding to a minimum equiv-alent pore area of �2.8 × 10³ nm2, and a secondary peakobserved at �250 nm pore diameter (meso-pore family), corre-sponding to a minimum equivalent pore area of �1 × 10⁵ nm2.However, primary peaks in bi-modal porosity distributions, forexample as measured by Nguyen et al. (2014), are below thePPRs and therefore not fully accessible in the present study.
Pores within the clay matrix follow power-law pore-areadistributions over a range between the PPR and the largestpores observed within the clay matrix (�1 × 10⁷ nm2 porearea; Figs 11 and 12). This suggests a self-similar behaviour of
306
https://www.cambridge.org/core/terms. https://doi.org/10.1017/njg.2016.16Downloaded from https://www.cambridge.org/core. Lehrst F Alte Geschichte Hist Inst, on 14 Jun 2018 at 08:56:48, subject to the Cambridge Core terms of use, available at

Netherlands Journal of Geosciences — Geologie en Mijnbouw
Fig. 11. Pore-area size distribution analyses on the Ypresian clay samples 8a, 20a and 45a. Left: Normalised pore-size frequencies and contributions to total
segmented porosities (Cttp (%)). Right: Power-law distributions of pore-area sizes, within the clay matrix.
porosity within the clay matrix of the Ypresian clays. Power-law pore-size distributions and self-similarity of observed mi-crostructures hint towards the possibility of up-scaling of theresults to larger scale (micro-) structural features of the Ypre-sian clays. Power-law distributions of pore-area sizes have alsobeen reported for the Boom Clay (Hemes et al., 2013; Fig. 14)and the Opalinus Clay (Houben et al., 2013, 2014a), as well asfor several fine-grained oil and gas shale samples (Klaver et al.,2012, 2015b).
Power-law exponents found for the Boom Clay and Ypre-sian clays are comparable within the 95% confidence bounds(Fig. 13), suggesting similar microstructures and physical prop-erties. Morphologically, pore types found within the claymatrix of the Ypresian clays are similar to those found inthe Boom Clay, for example by Desbois et al. (2009) andHemes et al. (2013), where pore types are controlled by theimpingement of adjacent clay aggregates: ‘elongated “type Ipores” are found in between similarly oriented sheets of clay’
307
https://www.cambridge.org/core/terms. https://doi.org/10.1017/njg.2016.16Downloaded from https://www.cambridge.org/core. Lehrst F Alte Geschichte Hist Inst, on 14 Jun 2018 at 08:56:48, subject to the Cambridge Core terms of use, available at
Netherlands Journal of Geosciences — Geologie en Mijnbouw
Fig. 12. Pore-area size distribution analyses on the Ypresian clay samples 60a, 86c and 108a. Left: Normalised pore-size frequencies and contributions to
total segmented porosities (Cttp (%)). Right: Power-law distributions of pore-area sizes, within the clay matrix.
(Desbois et al., 2009) and ‘crescent-shaped “type II pores” insaddle-reefs of folded clay sheet’ (Desbois et al., 2009). Thesepores show typical sizes (areas) below 1 × 10⁶ to 1 × 10⁷ nm² inthe Ypresian clays. Moreover, ‘type III pores’ in clay, after Des-bois et al. (2009) and Hemes et al. (2013), were observed andidentified, which can be described as ‘large jagged pores in thestrain shadows of clasts’ (Desbois et al., 2009), with axial ratiosusually >2.
Larger ‘type III pores’ in clay occur preferentially at theboundaries between clay-matrix and NCM – mostly quartz –grains and are therefore classified as inter-aggregate pores, withtypical sizes above 1 × 10⁶ to 1 × 10⁷ nm² pore area.
For the coarse-grained Ypresian clay samples (8a, 60a and86c), we found a significant difference in pore shapes withinthe clay matrix, that is, pores of ‘type I’ and ‘type II’ show verylow axial ratios (<2), circular pore shapes and sizes usually
308
https://www.cambridge.org/core/terms. https://doi.org/10.1017/njg.2016.16Downloaded from https://www.cambridge.org/core. Lehrst F Alte Geschichte Hist Inst, on 14 Jun 2018 at 08:56:48, subject to the Cambridge Core terms of use, available at

Netherlands Journal of Geosciences — Geologie en Mijnbouw
Fig. 13. Comparison of power-law scaling parameters
(D) from least-square linear regression analysis on
pore-area size distributions within the clay matrix, as
well as –logC values for the Ypresian clays (present
study), compared to the Boom Clay (data reworked
from Hemes et al., 2013).
<3 × 10⁴ nm² pore area (Fig. 8C). ‘Type III’ (inter-aggregate)pores in clay show very smooth, rounded pore boundaries(Figs 2, 5, 6 and 9) and can be very large, up to �5 × 10⁹
nm² pore area.Based on these results, we infer that a higher content of
NCMs causes a switch from a clay-matrix supported to a NCMgrain-supported fabric. This leads to less compaction of theclay matrix and is also in agreement with the bedding parallelpreferred orientation of the pores’ longest axes in fine-grained,clay-rich Boom Clay (Hemes et al., 2013), which is absent in theYpresian clay samples. The effect of NCMs controlling the porespace within and the microstructures of the clay matrix hasalso been reported in recent studies by Bobko and Ulm (2008),Hemes et al. (2013), Houben et al. (2014a), Keller et al. (2015)and Philipp et al. (submitted).
Pore-space connectivity and relevance of theinter-aggregate pores in the Ypresian clays
Although WMI reveals that all pores, including the pores withinthe clay matrix as well as larger inter-aggregates pores, aremutually connected at a maximum WM entry pressure of 156MPa, corresponding to accessible pore-throat diameters of �10nm, X-ray µ-CT and focused ion beam milling (FIB)-SEM to-mography are suggested to solve the question of whether largeinter-aggregate pores are directly connected to each other orvia much smaller pore throats within the clay matrix, as has
been reported for a fine-grained, clay-rich Boom Clay sample,analysed by Hemes et al. (2015).
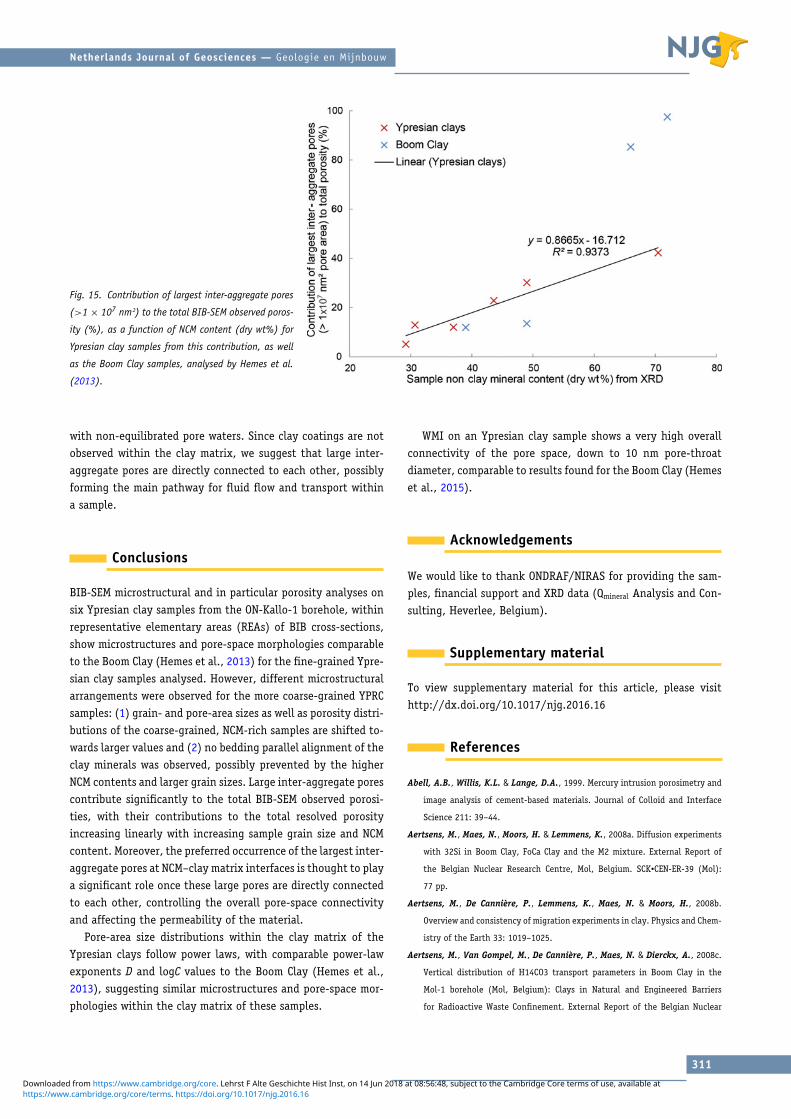
The origin of the large inter-aggregate pores still remainsunclear, although they contribute significantly to the totalobserved porosity and may provide preferential pathways forfluid flow. We therefore suggest that the frequent occurrence oflarger NCM grains within a sample’s fabric favors an increase inpermeability. We recommend checking this hypothesis by mea-suring permeability together with the grain-size distributionand mineralogy of a sample. The large inter-aggregate poresare systematically located at the interfaces between NCM grainsand the clay matrix. Moreover, the size and occurrence of thelarge inter-aggregate pores correlates with the size and occur-rence of the NCM grains within the same sample. We observeda correlation between the contribution of large inter-aggregatepores to the total BIB-SEM observed porosity (Cttp) and the NCMcontent of a sample, as measured by XRD (Table 1 and Fig. 15).Such a correlation has already been described and hypothesisedfor the Boom Clay (Hemes et al., 2013) and for the Opalinus Clay(Keller, 2015; Philipp et al., submitted). Another characteristicof the large inter-aggregate pores is their coating by a verylow porous, thin clay layer (Fig. 9). The presence of these claycoatings at larger inter-aggregates pores suggests that they arenot originating from drying or de-compaction damages, but arepart of the preserved natural clay fabric. The origin of the claycoatings remains unknown to date. The clay coatings may cor-respond to secondary clay minerals, precipitated from the inter-action of original clay minerals, quartz and/or feldspar grains
309
https://www.cambridge.org/core/terms. https://doi.org/10.1017/njg.2016.16Downloaded from https://www.cambridge.org/core. Lehrst F Alte Geschichte Hist Inst, on 14 Jun 2018 at 08:56:48, subject to the Cambridge Core terms of use, available at

Netherlands Journal of Geosciences — Geologie en Mijnbouw
Fig. 14. Pore-area size distribution analyses on the Boom Clay samples from the Mol-1 borehole; data reworked from Hemes et al. (2013). Left: Normalised
pore-size frequencies and contributions to total segmented porosities (Cttp (%)). Right: Power-law distributions of pore-area sizes, within the clay matrix
only.
310
https://www.cambridge.org/core/terms. https://doi.org/10.1017/njg.2016.16Downloaded from https://www.cambridge.org/core. Lehrst F Alte Geschichte Hist Inst, on 14 Jun 2018 at 08:56:48, subject to the Cambridge Core terms of use, available at
Netherlands Journal of Geosciences — Geologie en Mijnbouw
Fig. 15. Contribution of largest inter-aggregate pores
(>1 × 10⁷ nm²) to the total BIB-SEM observed poros-
ity (%), as a function of NCM content (dry wt%) for
Ypresian clay samples from this contribution, as well
as the Boom Clay samples, analysed by Hemes et al.
(2013).
with non-equilibrated pore waters. Since clay coatings are notobserved within the clay matrix, we suggest that large inter-aggregate pores are directly connected to each other, possiblyforming the main pathway for fluid flow and transport withina sample.
Conclusions
BIB-SEM microstructural and in particular porosity analyses onsix Ypresian clay samples from the ON-Kallo-1 borehole, withinrepresentative elementary areas (REAs) of BIB cross-sections,show microstructures and pore-space morphologies comparableto the Boom Clay (Hemes et al., 2013) for the fine-grained Ypre-sian clay samples analysed. However, different microstructuralarrangements were observed for the more coarse-grained YPRCsamples: (1) grain- and pore-area sizes as well as porosity distri-butions of the coarse-grained, NCM-rich samples are shifted to-wards larger values and (2) no bedding parallel alignment of theclay minerals was observed, possibly prevented by the higherNCM contents and larger grain sizes. Large inter-aggregate porescontribute significantly to the total BIB-SEM observed porosi-ties, with their contributions to the total resolved porosityincreasing linearly with increasing sample grain size and NCMcontent. Moreover, the preferred occurrence of the largest inter-aggregate pores at NCM–clay matrix interfaces is thought to playa significant role once these large pores are directly connectedto each other, controlling the overall pore-space connectivityand affecting the permeability of the material.
Pore-area size distributions within the clay matrix of theYpresian clays follow power laws, with comparable power-lawexponents D and logC values to the Boom Clay (Hemes et al.,2013), suggesting similar microstructures and pore-space mor-phologies within the clay matrix of these samples.
WMI on an Ypresian clay sample shows a very high overallconnectivity of the pore space, down to 10 nm pore-throatdiameter, comparable to results found for the Boom Clay (Hemeset al., 2015).
Acknowledgements
We would like to thank ONDRAF/NIRAS for providing the sam-ples, financial support and XRD data (Qmineral Analysis and Con-sulting, Heverlee, Belgium).
Supplementary material
To view supplementary material for this article, please visithttp://dx.doi.org/10.1017/njg.2016.16
References
Abell, A.B., Willis, K.L. & Lange, D.A., 1999. Mercury intrusion porosimetry and
image analysis of cement-based materials. Journal of Colloid and Interface
Science 211: 39–44.
Aertsens, M., Maes, N., Moors, H. & Lemmens, K., 2008a. Diffusion experiments
with 32Si in Boom Clay, FoCa Clay and the M2 mixture. External Report of
the Belgian Nuclear Research Centre, Mol, Belgium. SCK•CEN-ER-39 (Mol):
77 pp.
Aertsens, M., De Canniere, P., Lemmens, K., Maes, N. & Moors, H., 2008b.
Overview and consistency of migration experiments in clay. Physics and Chem-
istry of the Earth 33: 1019–1025.
Aertsens, M., Van Gompel, M., De Canniere, P., Maes, N. & Dierckx, A., 2008c.
Vertical distribution of H14CO3 transport parameters in Boom Clay in the
Mol-1 borehole (Mol, Belgium): Clays in Natural and Engineered Barriers
for Radioactive Waste Confinement. External Report of the Belgian Nuclear
311
https://www.cambridge.org/core/terms. https://doi.org/10.1017/njg.2016.16Downloaded from https://www.cambridge.org/core. Lehrst F Alte Geschichte Hist Inst, on 14 Jun 2018 at 08:56:48, subject to the Cambridge Core terms of use, available at
Netherlands Journal of Geosciences — Geologie en Mijnbouw
Research Centre (Mol). SCK. Physics and Chemistry of the Earth, Parts A/B/C,
33, Supplement 1 33: 61–66.
Blunt, M.J., Bijeljic, B., Dong, H., Gharbi, O., Iglauer, S., Mostaghimi, P.,
Paluszny, A. & Pentland, C., 2013. Pore-scale imaging and modelling. Ad-
vances in Water Resources 51: 197–216.
Bobko, C. & Ulm, F.-J., 2008. The nano-mechanical morphology of shale. Me-
chanics of Materials 40: 318–337.
Cammaer, C., Cockaerts, G. & Schiltz, M., 2009. Drilling and geological report on-
kallo-1, on-kallo-2, on-kallo-3. ONDRAF/NIRAS – Technical report Samsuffit
R2009–01.
Darot, M. & Reuschle, T., 1999. Direct assessment of Wood’s metal wettability on
quartz. Pure and Applied Geophysics 155: 119–129.
Desbois, G., Urai, J.L. & Kukla, P.A., 2009. Morphology of the pore space in
claystones – evidence from BIB/FIB ion beam sectioning and cryo-SEM obser-
vations. eEarth 4: 15–22.
Desbois, G., Urai, J.L., Hemes, S., Brassinnes, S., De Craen, M. & Sillen, X.,
2014. Nanometer-scale pore fluid distribution and drying damage in preserved
clay cores from Belgian clay formations inferred by BIB-cryo-SEM. Engineering
Geology 179: 117–131.
Dvorkin, J., Derzhi, N., Diaz, E. & Fang, Q., 2011. Relevance of computational
rock physics. Geophysics 76: E141–E153.
ESRI Inc., 2011. ArcGIS 10.2.1 for Desktop.
Hemes, S., 2015. Nm-scale pore space characteristics of the Boom Clay (Mol-1
borehole) and the Ypresian clays (Kallo-1 borehole). Dissertation Rheinisch-
Westfalischen Technischen Hochschule (RWTH). Department of Structural
Geology Tectonica and Geomechanics, Energy and Mineral Resources Group
(Aachen): 222 pp.
Hemes, S., Desbois, G., Urai, J.L., De Craen, M., Honty, M., Craen, M. De &
Craen, D., 2013. Variations in the morphology of porosity in the Boom
Clay Formation: insights from 2D high resolution BIB-SEM imaging and
mercury injection porosimetry. Netherlands Journal of Geosciences 92:
275–300.
Hemes, S., Desbois, G., Urai, J.L., Schroppel, B. & Schwarz, J.O., 2015. Multi-
scale characterization of porosity in Boom Clay (HADES-level, Mol, Belgium)
using a combination of X-ray μ-CT, 2D BIB-SEM and FIB-SEM tomography.
Microporous and Mesoporous Materials 208: 1–20.
Hildenbrand, A., 2003. Fluid Transport Processes in Mudstones. Dissertation
RWTH. Aachen University (Aachen): 137 pp.
Hildebrand, A. & Urai, J.L., 2003. Investigation of the morphology of pore
space in mudstones – first results. Marine and Petroleum Geology 20:
1185–1200.
Houben, M.E., Desbois, G. & Urai, J.L., 2013. Pore morphology and distribution
in the Shaly facies of Opalinus Clay (Mont Terri, Switzerland): Insights from
representative 2D BIB–SEM investigations on mm to nm scale. Applied Clay
Science 71: 82–97.
Houben, M.E., Desbois, G. & Urai, J.L., 2014a. A comparative study of rep-
resentative 2D microstructures in Shaly and Sandy facies of Opalinus Clay
(Mont Terri, Switzerland) inferred form BIB-SEM and MIP methods. Marine
and Petroleum Geology 49: 143–161.
Houben, M., Desbois, G., Urai, J.L., Winter, D.A.M., Drury, M.R. & Schwarz,
J.O., 2014b. Microstructure of the Shaly facies of Opalinus Clay on the mm-nm
scale. In Fourth EAGE Shale Workshop Shales: What Do They Have in Common?
Porto, Portugal: EAGE Workshop abstracts, p. 5.
Huysmans, M. & Dassargues, A., 2006. Hydrogeological modeling of radionuclide
transport in low permeability media: a comparison between Boom Clay and
Ypresian Clay. Environmental Geology 50: 122–131.
Jackson, M.L., 1985. Soil chemical analysis – advanced course. Parallel Press,
University of Wisconsin – Madison Libraries (Madison, WI).
Jones, L., 1949. Deuxieme Nivellement General. Repertoire des definitions et des
altitudes des reperes. reseau de premier ordre (mesures faites en 1947 et
1948). Institut Geographique Militaire. Service de Nivellement, 2, Allee du
Cloitre (Brussels).
Kanit, T., Forest, S., Galliet, I., Mounoury, V., Jeulin, D., Kang, M.-S.,
Watabe, Y. & Tsuchida, T., 2003. Determination of the size of the
representative volume element for random composites: statistical and
numerical approach. International Journal of Solids and Structures 40:
3647–3679.
Keller, L.M., 2015. On the representative elementary volumes of clay rocks at the
mesoscale. Academic Journals, Open Access – Journal of Geology and Mining
Research 7(6): 58–64.
Keller, L.M., Holzer, L., Schuetz, P. & Gasser, P.H., 2013. Pore space relevant for
gas permeability in Opalinus clay: Statistical analysis of homogeneity, perco-
lation, and representative volume element. Journal of Geophysical Research:
Solid Earth 118: 2799–2812.
Klaver, J., Desbois, G., Urai, J.L. & Littke, R., 2012. BIB-SEM study
of the pore space morphology in early mature Posidonia Shale from
the Hils area, Germany. International Journal of Coal Geology 103:
12–25.
Klaver, J., Hemes, S., Houben, M.E., Desbois, G., Radi, Z. & Urai, J.L., 2015a.
The connectivity of pore space in mudstones: insights from high-pressure
Wood’s metal injection, BIB-SEM imaging, and mercury intrusion porosimetry.
Geofluids 15(4): 577–591.
Klaver, J., Desbois, G., Littke, R. & Urai, J.L., 2015b. BIB-SEM characterization of
pore space morphology and distribution in postmature to overmature samples
from the Haynesville and Bossier Shales. Marine and Petroleum Geology 59:
451–466.
Labat, S., 2011. Overview and Analysis of 30 Years Piezometric Observations in
North-East Belgium (Mol): 69 pp.
Lexa, O. (2010). PolyLX – the MATLABTM toolbox for quantitative analysis of
microstructures (Version 2.1). Institute of Petrology and Structural Geology,
Charles University (Prague): 66 pp.
Mohammad, W., 2009. The NIRAS-ONDRAF Kallo 1 & 2 boreholes. The Ypresian
cored section: 254–410 m depth. Laboratory of Applied Geology & Mineralogy
of KULeuven (Leuven): 120pp.
Nguyen, X.P., Cui, Y.J., Tang, A.M., Li, X.L. & Wouters, L., 2014. Physical and
microstructural impacts on the hydro-mechanical behaviour of Ypresian clays.
Applied Clay Science 102: 172–185.
ONDRAF/NIRAS, 2001. SAFIR2 - Safety Assessment and Feasibility Interim Report
2 (NIROND 2001–06 E). ONDRAF/NIRAS (Brussels): 280 pp.
ONDRAF/NIRAS, 2011. Waste plan – for the long-term management of condi-
tioned high-level and/or long-lived radioactive waste and overview of related
issues (NIROND 2011-02E). ONDRAF/NIRAS (Brussels): 255 pp.
ONDRAF/NIRAS, 2013a. ONDRAF/NIRAS Research, Development and Demonstra-
tion (RD&D) Plan for the geological disposal of high-level and/or long-lived
radioactive waste including irradiated fuel if considered as waste. State-of-
the-art report as of December 2012. ONDRAF/NIRAS (Brussels): 413 pp.
312
https://www.cambridge.org/core/terms. https://doi.org/10.1017/njg.2016.16Downloaded from https://www.cambridge.org/core. Lehrst F Alte Geschichte Hist Inst, on 14 Jun 2018 at 08:56:48, subject to the Cambridge Core terms of use, available at

Netherlands Journal of Geosciences — Geologie en Mijnbouw
ONDRAF/NIRAS, 2013b. Proposal for sampling of Ypresian clays from the ON-Kallo
1 borehole in the framework of the characterisation of the pore network by
RWTH Aachen. ONDRAF/NIRAS (Brussels): 13 pp.
Ortiz, L., Volckaert, G. & Mallants, D., 2002. Gas generation and migration
in Boom Clay, a potential host rock formation for nuclear waste storage.
Engineering Geology 64: 287–296.
Philipp, T., Amann-Hildenbrand, A., Laurich, B., Desbois, G., Littke, R. & Urai,
J.L. (submitted). The effect of microstructural heterogeneity on pore size
distribution and permeability in Opalinus Clay (Mont Terri, CH): insights from
an integrated study of laboratory fluid flow and pore morphology from BIB-
SEM images. Geological Society Special Publication.
Qmineral Analysis and Consulting, 2014. Analysis Report. Aachen samples. Qmin-
eral Analysis and Consulting (Belgium): 9 pp.
Renard, F., 2012. Microfracturation in rocks: from microtomography im-
ages to processes. The European Physical Journal Applied Physics 60(2):
24203.
Reynolds, R.C. & Reynolds, R.C., 2012. Newmod II Software for mod-
elling – X-Ray Diffraction of Mixed layer Clay Minerals Software For Re-
search/Education: Quantitative Analysis/Mixed-Layer Clay Interpretation.
http://www.newmod-for-clays.com/newmod-ii.html.
Scarlett, N.V.Y.N. & Madsen, I.C.I., 2006. Quantification of phases with partial
or no known crystal structures. Powder Diffraction 21: 278–284.
Steurbaut, E., 1998. High-resolution holostratigraphy of Middle Paleocene to
Early Eocene strata in Belgium and adjacent areas. Palaeontographica Abt. A
247: 91–156.
Van Marcke, P., Laenen, B. & Wouters, L., 2005. The Ypresian Clay as possible
host rock for radioactive waste disposal: an evaluation (NIROND TR-2005-01
E). ONDRAF/NIRAS (Mol, Lille): 159 pp.
Washburn, E.W., 1921. The dynamics of capillary flow. Physical Review 17: 273–
283.
Winston, P.W. & Donald, H., 1960. Saturated solutions for the control of humidity
in biological research. Ecology 41: 232–237.
313
https://www.cambridge.org/core/terms. https://doi.org/10.1017/njg.2016.16Downloaded from https://www.cambridge.org/core. Lehrst F Alte Geschichte Hist Inst, on 14 Jun 2018 at 08:56:48, subject to the Cambridge Core terms of use, available at