Microstructural And Rheological Properties Of Concentrated...
89
Mircostructure and rheological properties of concentrated tomato suspensions during processing Bayod, Elena 2008 Link to publication Citation for published version (APA): Bayod, E. (2008). Mircostructure and rheological properties of concentrated tomato suspensions during processing. General rights Copyright and moral rights for the publications made accessible in the public portal are retained by the authors and/or other copyright owners and it is a condition of accessing publications that users recognise and abide by the legal requirements associated with these rights. • Users may download and print one copy of any publication from the public portal for the purpose of private study or research. • You may not further distribute the material or use it for any profit-making activity or commercial gain • You may freely distribute the URL identifying the publication in the public portal Take down policy If you believe that this document breaches copyright please contact us providing details, and we will remove access to the work immediately and investigate your claim.
Transcript of Microstructural And Rheological Properties Of Concentrated...
LUND UNIVERSITY
PO Box 117221 00 Lund+46 46-222 00 00
Mircostructure and rheological properties of concentrated tomato suspensions duringprocessing
Bayod, Elena
2008
Link to publication
Citation for published version (APA):Bayod, E. (2008). Mircostructure and rheological properties of concentrated tomato suspensions duringprocessing.
General rightsCopyright and moral rights for the publications made accessible in the public portal are retained by the authorsand/or other copyright owners and it is a condition of accessing publications that users recognise and abide by thelegal requirements associated with these rights.
• Users may download and print one copy of any publication from the public portal for the purpose of private studyor research. • You may not further distribute the material or use it for any profit-making activity or commercial gain • You may freely distribute the URL identifying the publication in the public portalTake down policyIf you believe that this document breaches copyright please contact us providing details, and we will removeaccess to the work immediately and investigate your claim.
Microstructural and Rheological Properties of
Concentrated Tomato Suspensions during Processing
Elena Bayod
2008
Doctoral thesis
Division of Food Engineering
Department of Food Technology, Engineering and Nutrition
Lund University
Akademisk avhandling för avläggande av teknologie doktorsexamen vid tekniska fakulteten,
Lunds universitet. Försvaras på engelska fredagen den 7 mars 2008, kl. 09:15 i hörsal B,
Kemicentrum, Getingevägen, 60, Lund. Fakultetsopponent: Dr. Peter Fischer, Institute of Food
Science and Nutrition, ETH, Zürich, Switzerland.
Academic thesis which, by due permission of the Faculty of Engineering at Lund University, will
be publicly defended on Friday, 7th March 2008, at 09:15 in lecture hall B, Centre for Chemistry
and Chemical Engineering, Getingevägen, 60, Lund, for the degree of Doctor of Philosophy in
Engineering. Faculty opponent: Dr. Peter Fischer, Institute of Food Science and Nutrition, ETH,
Zurich, Switzerland.
Microstructural and Rheological Properties of Concentrated Tomato Suspensions during Processing
A doctoral thesis at a university in Sweden is produced either as a monograph or as a collection of papers. In the latter case, the introductory part constitutes the formal thesis, which summarizes the accompanying papers. These have either already been published or are manuscripts at various stages (in press, submitted or in ms).
© 2008, Elena Bayod
Doctoral thesis
Division of Food Engineering
Department of Food Technology, Engineering and Nutrition
Lund University
P.O. Box 124
SE-221 00 Lund
Sweden
Cover: micrographs of tomato suspensions at different stages of processing
ISBN 978-91-976695-4-2
Printed in Sweden by Media-Tryck, Lund University
Lund, 2008
ii

Microstructural and Rheological Properties of Concentrated Tomato Suspensions during Processing
Abstract
Food processing comprises operations such as dilution (changing the concentration),
homogenisation (changing the particle size), and subsequent pumping (shearing), among
others. It is thus of great interest to gain a better understanding of the mechanisms
governing the creation and disruption of structures during these engineering operations,
and the way in which they are related to the textural and rheological properties of the
material.
The influence of processing on the microstructure and the rheological properties of
tomato paste suspensions has been studied. The microstructure was characterised using
light microscopy and particle size distribution analysis. The way in which particles of
varying size are packed in a specified volume at different concentrations was estimated in
terms of the compressive volume fraction. The rheological properties were studied using
small-amplitude oscillatory tests, giving the elastic (G ) and viscous (G ) moduli, as well
as steady shear measurements, giving the viscosity ( ). In the latter case both a rotational
and a tube viscometer were used.
The results indicate that tomato suspensions consist of a collection of whole cells and
cell wall material forming a network (G >G ). During the process of homogenisation,
the particles are broken down, resulting in a smoother and more evenly distributed
network of finer particles. The effectiveness of homogenisation in decreasing particle size
seemed to be governed by the inherent susceptibility of the particles to breakage (i.e. the
type of paste), the viscosity of the suspending medium, and the concentration of
particles. Higher viscosities and concentrations were found to prevent breakage to some
extent.
The presence of larger amounts of fine particles in the homogenised suspensions had a
considerable effect on the rheological properties. The yield stress was found to increase,
and time-dependent effects became more apparent. At low deformations ( 20), the
system consisting of finer particles exhibited rheopectic behaviour (increasing viscosity
with time), which was suggested to be caused partly by the rotation of the particles
iii
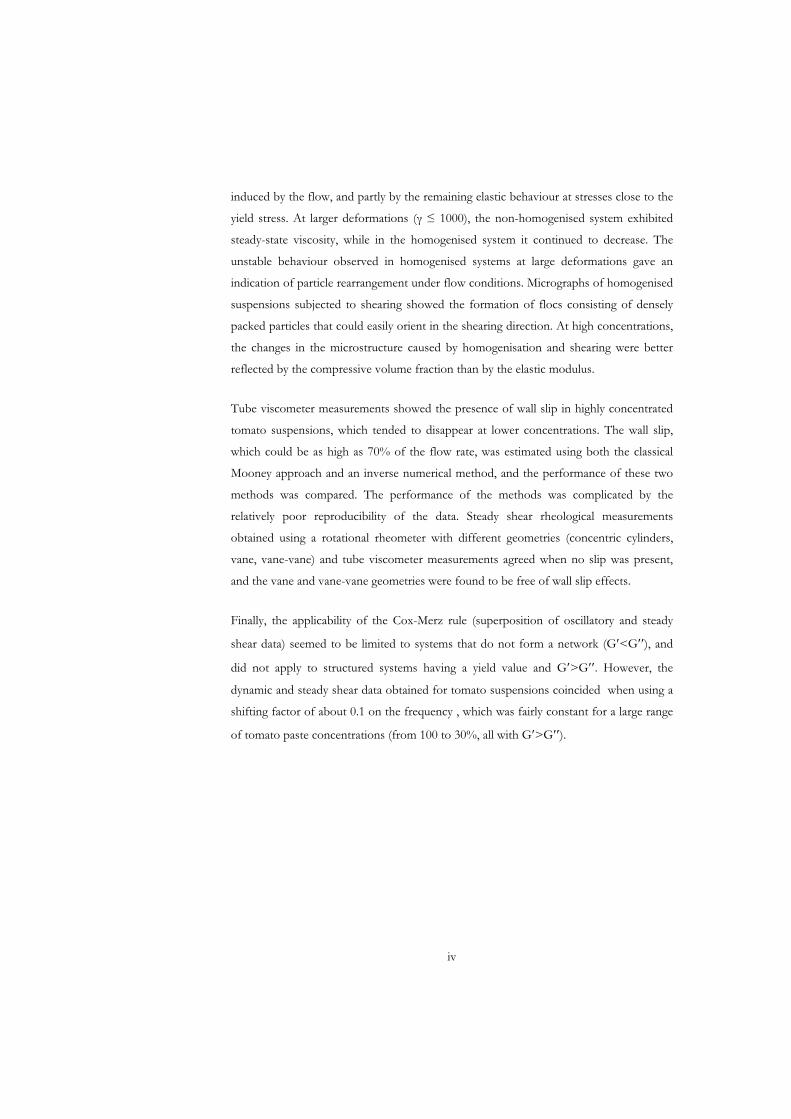
induced by the flow, and partly by the remaining elastic behaviour at stresses close to the
yield stress. At larger deformations ( 1000), the non-homogenised system exhibited
steady-state viscosity, while in the homogenised system it continued to decrease. The
unstable behaviour observed in homogenised systems at large deformations gave an
indication of particle rearrangement under flow conditions. Micrographs of homogenised
suspensions subjected to shearing showed the formation of flocs consisting of densely
packed particles that could easily orient in the shearing direction. At high concentrations,
the changes in the microstructure caused by homogenisation and shearing were better
reflected by the compressive volume fraction than by the elastic modulus.
Tube viscometer measurements showed the presence of wall slip in highly concentrated
tomato suspensions, which tended to disappear at lower concentrations. The wall slip,
which could be as high as 70% of the flow rate, was estimated using both the classical
Mooney approach and an inverse numerical method, and the performance of these two
methods was compared. The performance of the methods was complicated by the
relatively poor reproducibility of the data. Steady shear rheological measurements
obtained using a rotational rheometer with different geometries (concentric cylinders,
vane, vane-vane) and tube viscometer measurements agreed when no slip was present,
and the vane and vane-vane geometries were found to be free of wall slip effects.
Finally, the applicability of the Cox-Merz rule (superposition of oscillatory and steady
shear data) seemed to be limited to systems that do not form a network (G <G ), and
did not apply to structured systems having a yield value and G >G . However, the
dynamic and steady shear data obtained for tomato suspensions coincided when using a
shifting factor of about 0.1 on the frequency , which was fairly constant for a large range
of tomato paste concentrations (from 100 to 30%, all with G >G ).
iv
Microstructural and Rheological Properties of Concentrated Tomato Suspensions during Processing
Populärvetenskaplig sammanfattning
Världens produktion av tomat har ökat kraftigt under de senaste årtiondena och 2004
översteg den 100 miljoner ton. Tomat brukar konsumeras huvudsakligen som färsk
grönsak och/eller som processad tomatprodukt. Tomatpasta är den huvudprodukt, som
används vid tillverkning av tomatketchup och tomatsås. I Sverige, är
ketchupkonsumtionen omkring 2 kg per person och år, och försäljningen uppgår till mer
än 330 MSEK. Tomatketchup består av tomatpasta, vatten, socker, vinäger, salt, kryddor,
och ibland också lök och vitlök som smaktillsats. Även andra tillsatser, såsom
förtjocknings- och stabiliseringsmedel, kan användas för att påverka konsistensen. Smak
och textur/konsistens är för konsumenter de viktigaste parametrarna för att bedöma
kvaliteten hos ketchup. Man vill ha en produkt som smakar gott, men konsistensen måste
vara sådan så att man får rätt munkänsla. Det är också viktigt att undvika
ketchupeffekten, dvs. först kommer inget och sen kommer allt på en gång. Andra
kvalitetsaspekter avseende konsistensen är att tomatketchupen skall ligga kvar på korven
när man äter den. En kvalitetsdefekt hos ketchup, som kan uppfattas negativt av
konsumenten, är serumseparation, som uppkommer som ett tunt vätskeskikt ovanför
ketchupen vid flaskhalsen. Det är därför viktigt att förstå hur tillverkningsprocessen
påverkar konsistensen hos ketchup för att förbättra kvaliteten och minska olika
kvalitetsdefekter. Syftet med denna studie var att lära sig mer om hur tomatfibrerna
uppträder under olika processer, som används för att tillverka såser eller ketchup, och att
studera de mikrostrukturer som kan uppkomma under denna processning. Exempel på
sådana processer är homogenisering och pumpning.
Tomatprodukter kan beskrivas som ett disperst system, där den fasta fasen utgöres av
tomatceller och delar av tomatcellen i form av fibrer och dessa är uppslammade i vatten
med socker och andra lösliga ämnen. Vid processning av detta system förändras
produktens struktur och mekaniska egenskaper, vilket ger upphov till olika textur och
konsistens. Ett sätt att förutsäga dessa olika konsistenser är att mäta produkternas
mikrostruktur och reologiska egenskaper. Reologin är den vetenskap som behandlar flyt-
och deformationsegenskaper. I föreliggande arbete har effekten av processning
v
(homogenisering och pumpning) undersökts med avseende på olika utspädda
tomatpastors mikrostruktur och reologi. Homogenisering ger mindre partikelstorlek och
förbättrar viskositeten (konsistensen), medan produkterna är efter denna behandling mer
känsliga för fiberaggregering vid efterföljande pumpning. Denna mikrostrukturella
förändring kan ge oönskad lägre viskositet och serumseparation.
Pumpning är en viktig och oundviklig del vid tillverkning av exempelvis tomatketchup,
och för att beräkna pumpens prestationsförmåga krävs bland annat att man känner till
tomatketchupens viskositet. Att överdimensionera pumpen i processen är både
ekonomiskt och energetiskt dyrt, men att underdimensionera pumpen kan orsaka
allvarliga problem för livsmedelsindustrin om livsmedlet ifråga inte kan pumpas vidare.
Därför är det intressant att mäta viskositeten noggrant. Olika problem kan förekomma
vid mätning av viskositet hos produkter med högt fiberinnehåll, som tomatpasta.
Exempelvis, uppträder vid väggen av mätinstrumentet ett väldigt tunt skikt av vätska på
grund av partikelrörelse bort från väggen. Detta fenomen kallas slip. Det gör att man
mäter en lägre viskositet än det i verkligheten är och dimensionerar därför pumpen fel
utifrån den för låga viskositeten. Att kontrollera och korrigera för denna slip så att
viskositetsmätningarna blir korrekta har också varit en del av detta arbete.
Denna studie är ett samarbete med Orkla Foods AS, Tetra Pak AB, Lyckeby-Culinar AB,
Reologica AB, Salico, AB, Mariannes Farm AB, Kiviks Musteri AB.
vi
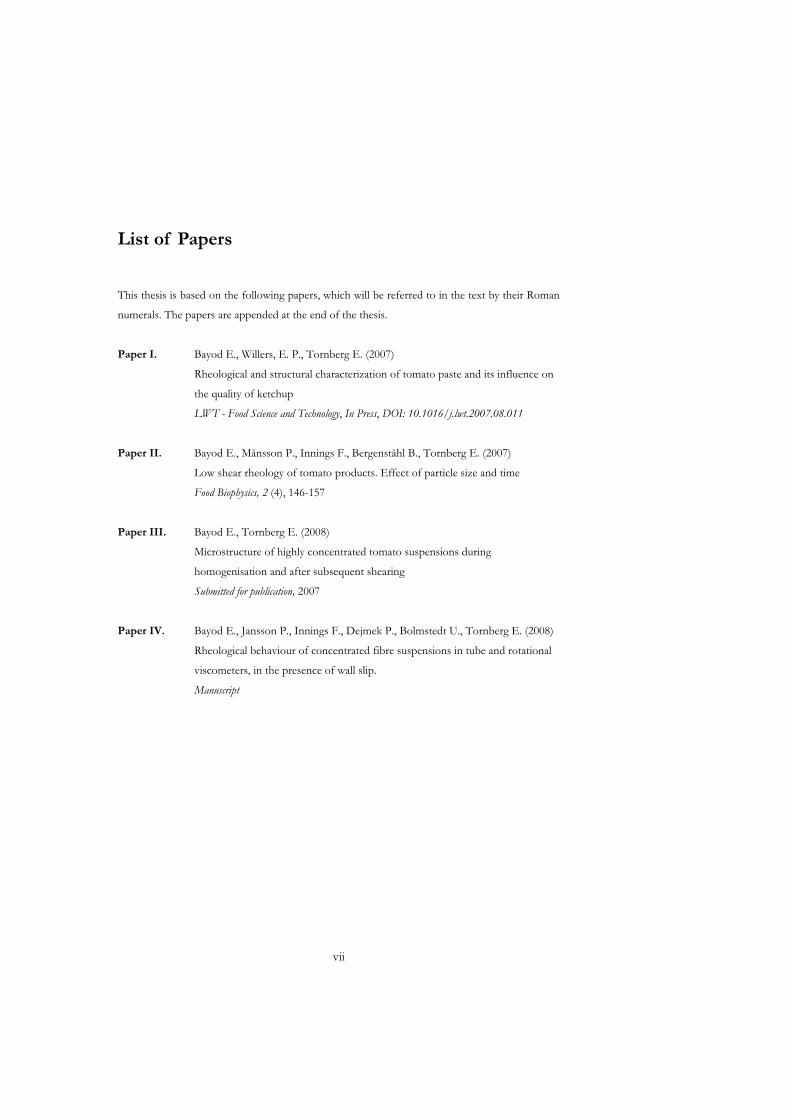
List of Papers
This thesis is based on the following papers, which will be referred to in the text by their Roman
numerals. The papers are appended at the end of the thesis.
Paper I. Bayod E., Willers, E. P., Tornberg E. (2007)
Rheological and structural characterization of tomato paste and its influence on
the quality of ketchup
LWT - Food Science and Technology, In Press, DOI: 10.1016/j.lwt.2007.08.011
Paper II. Bayod E., Månsson P., Innings F., Bergenståhl B., Tornberg E. (2007)
Low shear rheology of tomato products. Effect of particle size and time
Food Biophysics, 2 (4), 146-157
Paper III. Bayod E., Tornberg E. (2008)
Microstructure of highly concentrated tomato suspensions during
homogenisation and after subsequent shearing
Submitted for publication, 2007
Paper IV. Bayod E., Jansson P., Innings F., Dejmek P., Bolmstedt U., Tornberg E. (2008)
Rheological behaviour of concentrated fibre suspensions in tube and rotational
viscometers, in the presence of wall slip.
Manuscript
vii
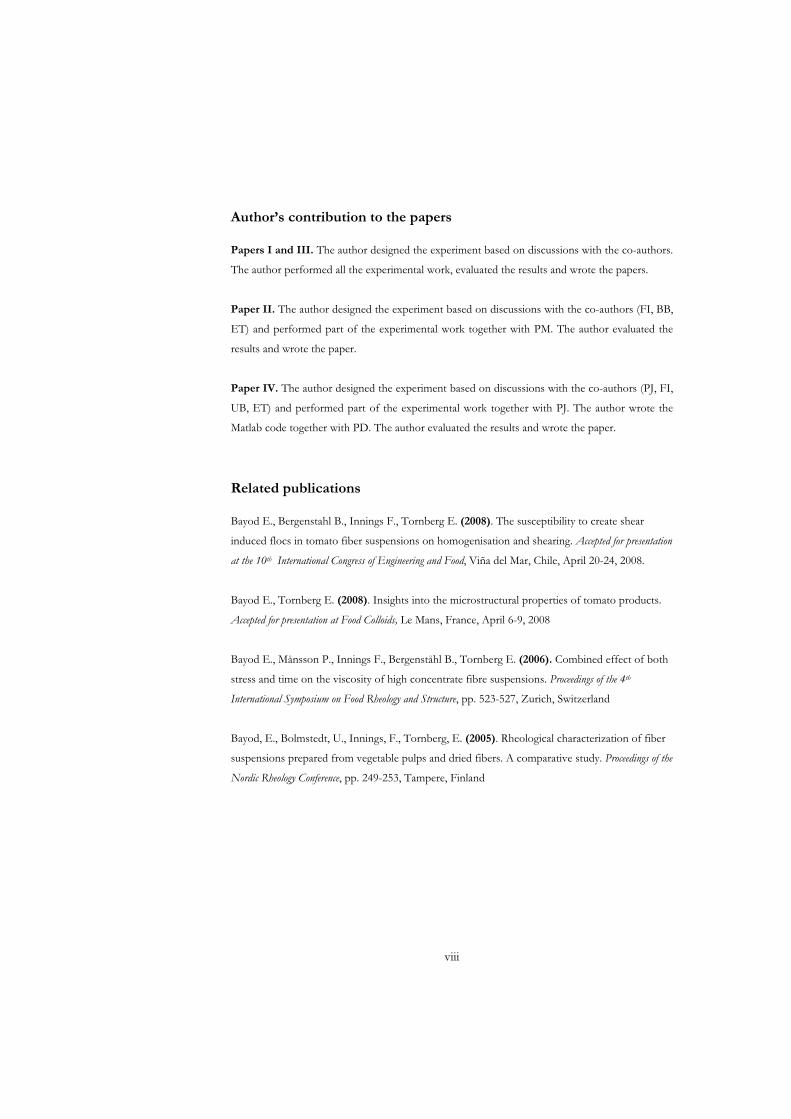
Author’s contribution to the papers
Papers I and III. The author designed the experiment based on discussions with the co-authors.
The author performed all the experimental work, evaluated the results and wrote the papers.
Paper II. The author designed the experiment based on discussions with the co-authors (FI, BB,
ET) and performed part of the experimental work together with PM. The author evaluated the
results and wrote the paper.
Paper IV. The author designed the experiment based on discussions with the co-authors (PJ, FI,
UB, ET) and performed part of the experimental work together with PJ. The author wrote the
Matlab code together with PD. The author evaluated the results and wrote the paper.
Related publications
Bayod E., Bergenstahl B., Innings F., Tornberg E. (2008). The susceptibility to create shear
induced flocs in tomato fiber suspensions on homogenisation and shearing. Accepted for presentation
at the 10th International Congress of Engineering and Food, Viña del Mar, Chile, April 20-24, 2008.
Bayod E., Tornberg E. (2008). Insights into the microstructural properties of tomato products.
Accepted for presentation at Food Colloids, Le Mans, France, April 6-9, 2008
Bayod E., Månsson P., Innings F., Bergenståhl B., Tornberg E. (2006). Combined effect of both
stress and time on the viscosity of high concentrate fibre suspensions. Proceedings of the 4th
International Symposium on Food Rheology and Structure, pp. 523-527, Zurich, Switzerland
Bayod, E., Bolmstedt, U., Innings, F., Tornberg, E. (2005). Rheological characterization of fiber
suspensions prepared from vegetable pulps and dried fibers. A comparative study. Proceedings of the
Nordic Rheology Conference, pp. 249-253, Tampere, Finland
viii
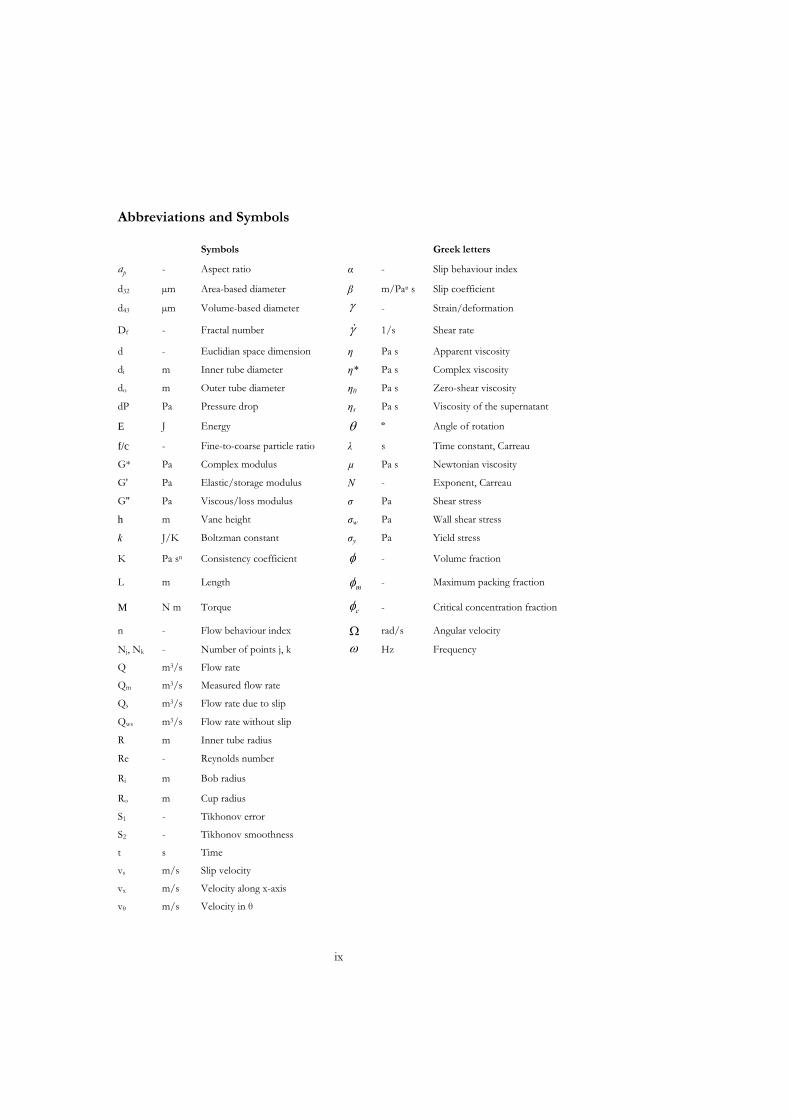
Abbreviations and Symbols
Symbols Greek letters
ap - Aspect ratio - Slip behaviour index
d32 μm Area-based diameter m/Pa s Slip coefficient
d43 μm Volume-based diameter - Strain/deformation
Df - Fractal number 1/s Shear rate
d - Euclidian space dimension Pa s Apparent viscosity
di m Inner tube diameter * Pa s Complex viscosity
do m Outer tube diameter 0 Pa s Zero-shear viscosity
dP Pa Pressure drop s Pa s Viscosity of the supernatant
E J Energy º Angle of rotation
f/c - Fine-to-coarse particle ratio s Time constant, Carreau
G* Pa Complex modulus μ Pa s Newtonian viscosity
G' Pa Elastic/storage modulus N - Exponent, Carreau
G'' Pa Viscous/loss modulus Pa Shear stress
h m Vane height w Pa Wall shear stress
k J/K Boltzman constant y Pa Yield stress
K Pa sn Consistency coefficient - Volume fraction
L m Length m - Maximum packing fraction
M N m Torque c - Critical concentration fraction
n - Flow behaviour index rad/s Angular velocity
Nj, Nk - Number of points j, k Hz Frequency
Q m3/s Flow rate
Qm m3/s Measured flow rate
Qs m3/s Flow rate due to slip
Qws m3/s Flow rate without slip
R m Inner tube radius
Re - Reynolds number
Ri m Bob radius
Ro m Cup radius
S1 - Tikhonov error
S2 - Tikhonov smoothness
t s Time
vs m/s Slip velocity
vx m/s Velocity along x-axis
v m/s Velocity in
ix
Abbreviations
ah After homogenisation
bh Before homogenisation
CB Cold break
CC Concentric cylinder
EDM Euclidean distance map
H Homogenisation
HB Hot break
LVE Linear viscoelastic region
PSD Particle size distribution
SH Shearing
TS % Total solids
V Vane geometry
VV Vane geometry in vane cup
WIS % Water-insoluble solids
x
Contents
1. INTRODUCTION.........................................................................................................................1
2. SCOPE ...........................................................................................................................................3
3. THE MICROSTRUCTURE OF FOOD SUSPENSIONS .........................................................5
3.1 Observation of the microstructure....................................................................................63.1.1 Morphology and shape of particles ............................................................................................ 7
3.2 Quantifying the microstructure.........................................................................................83.2.1 Image analysis of light micrographs........................................................................................... 9
3.2.2 Particle size distribution ........................................................................................................... 10
3.2.3 Concentration and volume fraction determination ................................................................... 14
3.3 Effect of concentration, particle size and shearing.........................................................16
4. MECHANICAL SPECTRA OF CONCENTRATED SUSPENSIONS .................................23
4.1 Dynamic oscillatory rheology.........................................................................................234.1.1 Strain/stress sweep tests ........................................................................................................... 24
4.1.2 Mechanical spectra in the linear viscoelastic region................................................................. 25
4.2 Effect of concentration, particle size and shearing.........................................................27
5. FLOW BEHAVIOUR OF CONCENTRATED SUSPENSIONS ...........................................33
5.1 Suspension rheology .......................................................................................................335.1.1 Rheological behaviour of tomato products............................................................................... 35
5.1.2 Yield stress ............................................................................................................................... 37
5.1.3 Time dependency ..................................................................................................................... 40
5.2 Measurement systems .....................................................................................................455.2.1 Rotational rheometers............................................................................................................... 45
5.2.2 Tube viscometers...................................................................................................................... 48
5.3 Quantification of apparent wall slip and determination of flow behaviour in the tube
viscometer .....................................................................................................................................515.3.1 The classical Mooney method .................................................................................................. 52
5.3.2 A numerical method of quantifying slip and flow behaviour ................................................... 54
5.4 Comparison of dynamic rheology and flow behaviour –The Cox-Merz rule.................59
6. CONCLUSIONS .........................................................................................................................65
7. FUTURE OUTLOOK.................................................................................................................67
ACKNOWLEDGEMENTS .................................................................................................................69
REFERENCES .....................................................................................................................................71
PAPERS I-IV ........................................................................................................................................77
xi

1. Introduction
Tomatoes are an important commercial product, with a total world production in 2004
exceeding 100 million tones (UN Food and Agricultural Organization). Tomatoes can be
consumed fresh, although most of the global production is processed to form tomato
paste. This tomato paste is then used as a main ingredient in other products such as
ketchup, sauces, and juices. The principal quality parameters for consumer acceptance of
tomato products are the appearance, colour and flavour, as well as the consistency and
texture, which in turn depend on the agronomical conditions during the growth of the
tomatoes and the processing conditions during the production of different tomato
products.
Processing fresh tomatoes to provide tomato paste involves a number of stages. First,
the fresh tomatoes are washed, sorted and crushed, usually accompanied by thermal
treatment (called break treatment), followed by peeling, screening and refining. The fluid
is then concentrated by evaporation, finally undergoes thermal treatment
(pasteurisation/sterilization) and packaging, often aseptic vacuum-packing. The viscosity
increases throughout the concentration processes, from about 10 mPa s in the initial
tomato juice up to viscosities several orders of magnitude higher in the final tomato
paste. The final product should be as concentrated as possible (usually between 24 and
38% soluble solids), but it should still be pumpable to allow processing. This means that
the accurate determination of the pumping requirements is of great interest. Predictions
of the pressure drop in tomato paste in tube flow based on viscosity values obtained
from rotational rheometers, are frequently found to be incorrect, according to
manufacturers’ experience, but no investigation has so far addressed this problem. It has
been observed in concentrated tomato products that substantial wall slip occurs on tube
flow (Lee et al., 2002) and this may be a reason for the disagreement between tube and
rheometer viscosity data.
The method of producing tomato paste influences the quality of the products to which it
is added as an ingredient, for example, ketchup. The process parameters believed to have
the greatest effects on the rheology of tomato derivatives are the break temperature, and
the screen size (Valencia et al., 2004). Break treatment can be carried out at high
temperatures (> 85°C), i.e. hot break (HB), or at low temperatures (< 70°C), i.e. cold
break (CB). The latter process allows a certain degree of pectin degradation because of
the slow and incomplete inactivation of the enzymes involved, i.e. pectin methyl esterase
and polygalacturonase. This results in products with a lower viscosity, but better
preserves the tomato flavour and colour. The influence of the break temperature on the
rheological properties of tomato products has been studied previously (Fito et al., 1983;
Xu et al., 1986). Moreover, changes in the pectin content and composition during the
processing of HB tomato paste have been described (Hurtado et al, 2002). The difference
in the physical properties of soluble pectin in HB and CB tomato paste has been
attributed to lower average molecular mass and a different chemical structure in the latter
case (Lin et al., 2005). It is believed that a higher pectin content gives rise to higher
viscosity and better textural properties, but Den Ouden (1995) showed that the
contribution of the pectins to the total viscosity was very small, compared with the
contribution of the fibre matrix. The effect of the particle size has also been studied to
some extent (Valencia et al. 2004, Den Ouden, 1995), but the published data are
ambiguous.
Tomato products can be manufactured by diluting tomato paste to the desired content,
mixing with other ingredients (i.e. spices, salt, sugar, vinegar, hydrocolloids), in some
cases homogenisation, and then pasteurization, aseptic cooling and packing.
Homogenisation is performed to obtain a smoother texture, enhance the structure of the
product, to increase its viscosity and to lower the degree of syneresis (Thakur et al., 1995;
Den Ouden, 1995). Generally, tomato products are non-Newtonian, shear thinning fluids
that exhibit yield stress and are strongly dependent on the shear history of the fluid. For
example, tomato juice has been shown to exhibit rheopectic behaviour at low
deformations (De Kee, 1983), i.e. the viscosity increases as a function of time, and
thixotropic behaviour at large deformations, i.e. the viscosity decreases as a function of
time (Tiziani & Vodovotz, 2005). The latter has been suggested to be caused by
structural breakdown of the suspension. This behaviour reflects the complex rheological
nature of tomato products. Tomato products are considered to be concentrated food
suspensions, consisting of whole cells or cell wall material suspended in an aqueous
solution containing sugars, soluble pectins and proteins.
2
2. Scope
Tomato processing constitutes an important industry as large volumes of fresh tomatoes
are processed into tomato ketchup and other products all over the world. As tomato
products are consumed worldwide, understanding the influence of processing on their
quality is of great interest, for both industry and consumers. Because of their economic
impact, tomato products have been subjected to numerous investigations, usually
involving their rheological characterisation. The complex nature of tomato suspensions
can complicate rheological measurements in several ways and thus, the results obtained
depend on the experimental conditions. A better understanding of the difficulties
encountered in rheological measurements might allow us to correct for them and/or to
prevent them, as well as providing more knowledge on tomato suspensions. Moreover,
the influence of the tomato fibres and the microstructure of the suspensions on their
textural and rheological attributes have been little explored so far.
The objectives of this investigation were therefore:
To study the different problems encountered in the determination of the
rheological properties of highly concentrated suspensions, such as tomato
products. The determination of the yield stress, and the effect of time
dependency and shear history are reported in Paper II, and the determination of
the wall slip in both tube viscometers and rotational rheometers is described in
Paper IV.
To study the effect of processing on the properties of tomato products. The
influence of homogenisation on the particle size distribution (PSD) and particle
shape, and the effect of the PSD on the rheological properties of the
suspensions, regarding the flow behaviour (Paper I), and the time dependency
and yield stress (Paper II) have been investigated. Changes in the microstructure
of the suspensions resulting from processing, i.e. homogenisation and shearing,
have also been investigated (Paper III).
3

3. The Microstructure of Food Suspensions
The processing of foods brings about several changes in their microstructure. The
macroscopic properties of foods, such as rheology and mechanical strength, sensory
attributes, as well as engineering properties, are strongly determined by the
microstructure of the food material (Fig. 1). During the early development of the food
industry, food engineers were mainly concerned with the macroscopic scale, which meant
designing equipment and improving unit operations. Food manufactures were essentially
concerned with producing large quantities of food of more or less acceptable quality.
Nowadays, higher food quality is an increasing consumer demand, together with the
development of new products. Because several sensory attributes, e.g. mouth feel, texture
and even flavour release, are directly related to the microstructure and mechanics of food
materials, understanding the effect of microstructure on the macroscopic properties of
foods is a new challenge facing food researchers.
Transport propertiesRheology
Mechanical strengthSensory attributes
Nanostructure
Microstructure
Macroscopicstructure
Transport propertiesRheology
Mechanical strengthSensory attributes
Nanostructure
Microstructure
Macroscopicstructure
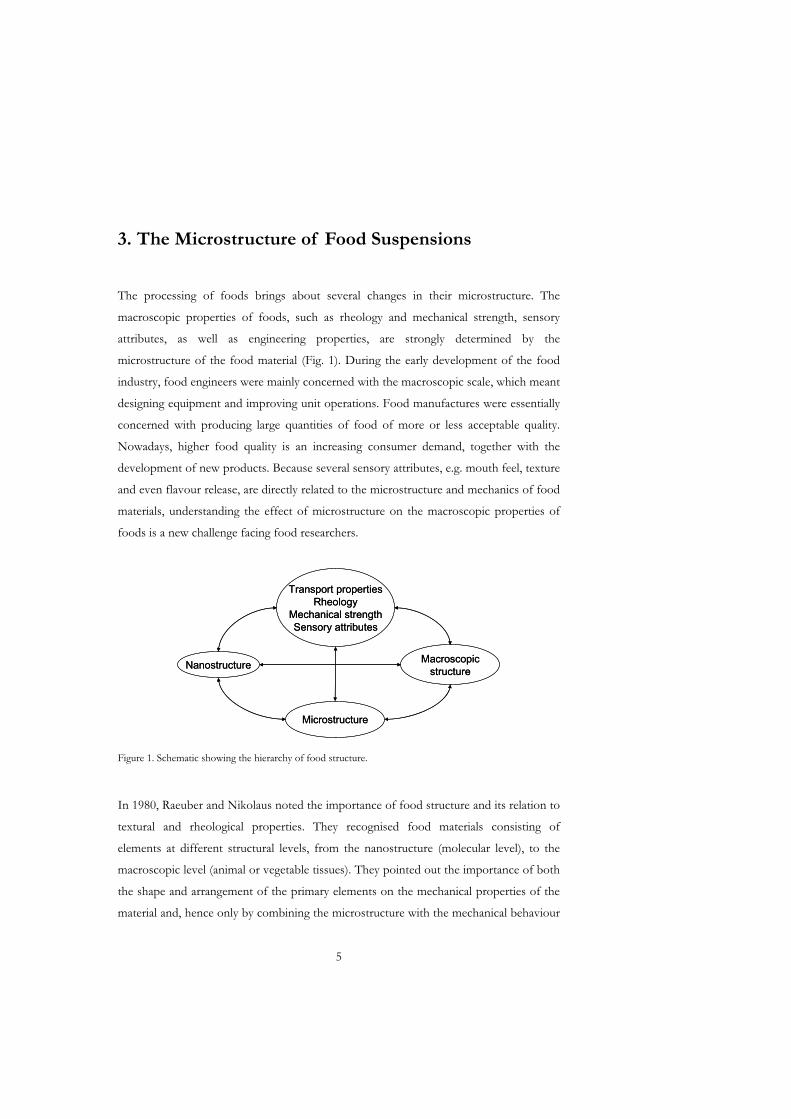
Figure 1. Schematic showing the hierarchy of food structure.
In 1980, Raeuber and Nikolaus noted the importance of food structure and its relation to
textural and rheological properties. They recognised food materials consisting of
elements at different structural levels, from the nanostructure (molecular level), to the
macroscopic level (animal or vegetable tissues). They pointed out the importance of both
the shape and arrangement of the primary elements on the mechanical properties of the
material and, hence only by combining the microstructure with the mechanical behaviour
5
is it possible to obtain a complete picture of a material’s properties. However, the
research in this area has been relatively scarce and, as late as 2005, Aguilera (2005) wrote
a paper entitled “Why Food Microstructure?” in which he highlights the importance of
understanding food microstructure in both food process engineering and food design.
3.1 Observation of the microstructure
Processing can drastically change the mechanical properties, as well as the
microstructure, of food products. An important example is that of whole fruits that are
crushed to produce purees or juices; where both the whole fruit and the juice have
approximately the same chemical composition, but their textural attributes are completely
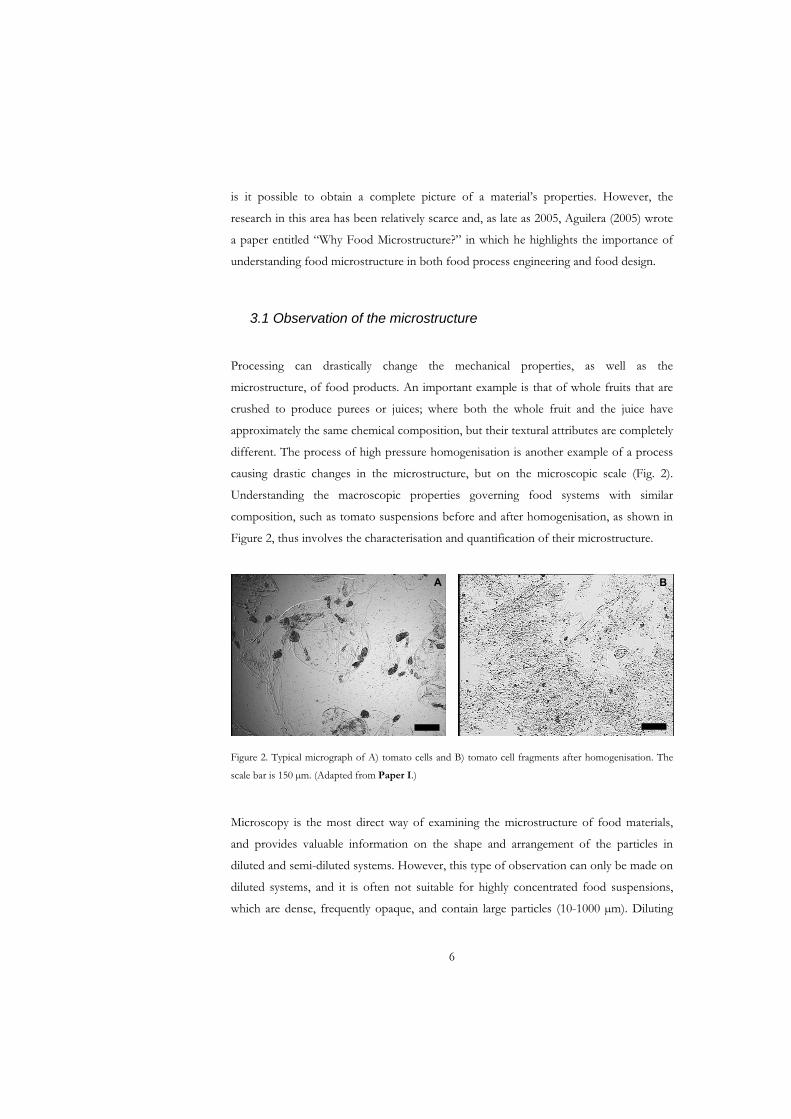
different. The process of high pressure homogenisation is another example of a process
causing drastic changes in the microstructure, but on the microscopic scale (Fig. 2).
Understanding the macroscopic properties governing food systems with similar
composition, such as tomato suspensions before and after homogenisation, as shown in
Figure 2, thus involves the characterisation and quantification of their microstructure.
A B
Figure 2. Typical micrograph of A) tomato cells and B) tomato cell fragments after homogenisation. The
scale bar is 150 μm. (Adapted from Paper I.)
Microscopy is the most direct way of examining the microstructure of food materials,
and provides valuable information on the shape and arrangement of the particles in
diluted and semi-diluted systems. However, this type of observation can only be made on
diluted systems, and it is often not suitable for highly concentrated food suspensions,
which are dense, frequently opaque, and contain large particles (10-1000 μm). Diluting
6
highly concentrated suspensions to a concentration suitable for observation in a light
microscope will, however, have a considerable effect on the structure of the suspension
and the arrangement of the particles, so the structure observed will not resemble the
original microstructure. Static light scattering is another technique that fails in systems
subject to strong multiple scattering, such as concentrated food suspensions. Confocal
microscopy is the preferred technique in such cases, but it requires some kind of
fluorescent labelling of the structure under study and, in vegetable material, problems
such as auto-fluorescence are likely to occur. Other techniques used in characterising
food microstructure are summarised and their applicability and limitations discussed
elsewhere (Wyss et al., 2005).
3.1.1 Morphology and shape of particles
The morphology of vegetable cells differs depending on the kind of tissue and its
function in the living vegetable. Different types of cells also show different mechanical
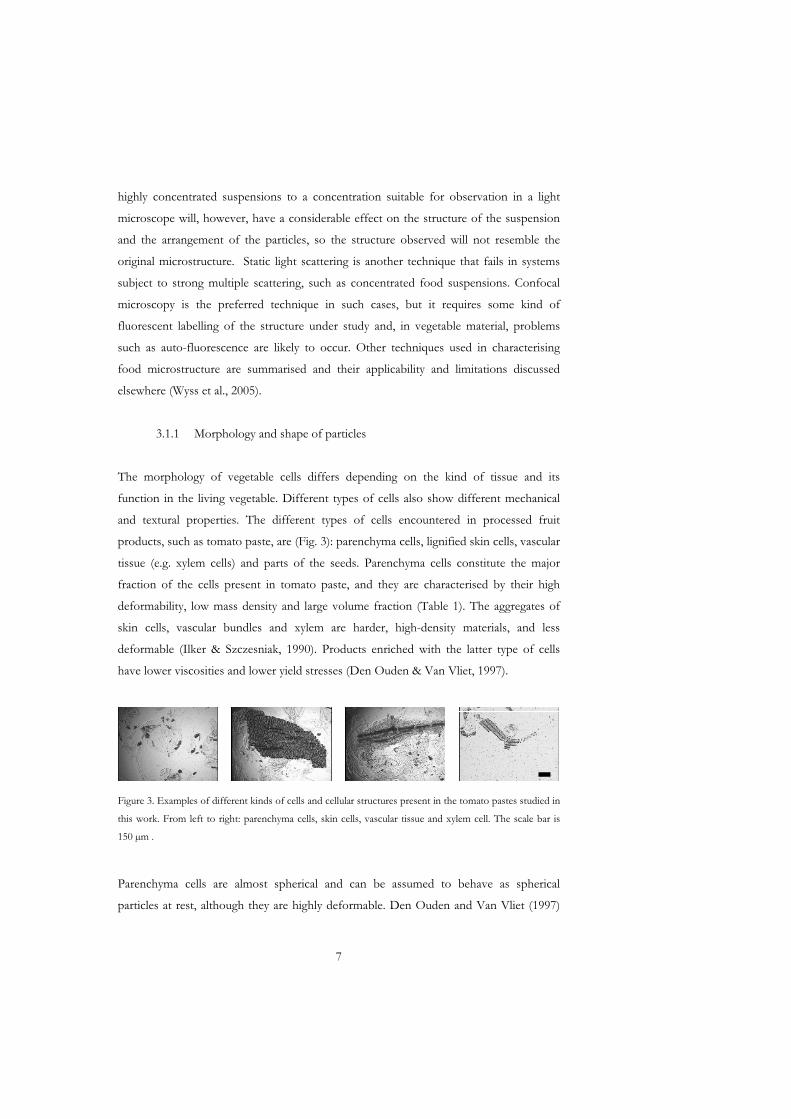
and textural properties. The different types of cells encountered in processed fruit
products, such as tomato paste, are (Fig. 3): parenchyma cells, lignified skin cells, vascular
tissue (e.g. xylem cells) and parts of the seeds. Parenchyma cells constitute the major
fraction of the cells present in tomato paste, and they are characterised by their high
deformability, low mass density and large volume fraction (Table 1). The aggregates of
skin cells, vascular bundles and xylem are harder, high-density materials, and less
deformable (Ilker & Szczesniak, 1990). Products enriched with the latter type of cells
have lower viscosities and lower yield stresses (Den Ouden & Van Vliet, 1997).
Figure 3. Examples of different kinds of cells and cellular structures present in the tomato pastes studied in
this work. From left to right: parenchyma cells, skin cells, vascular tissue and xylem cell. The scale bar is
150 μm .
Parenchyma cells are almost spherical and can be assumed to behave as spherical
particles at rest, although they are highly deformable. Den Ouden and Van Vliet (1997)
7
found that tomato cells can pass through the pores of a sieve significantly smaller than
the size of the cell itself. The aspect ratio, ap, of the parenchyma cells, i.e. the relation
between the length and width of the particles, is normally close to 1. The other types of
cells are found in very small proportions in tomato paste, and have irregular shapes and
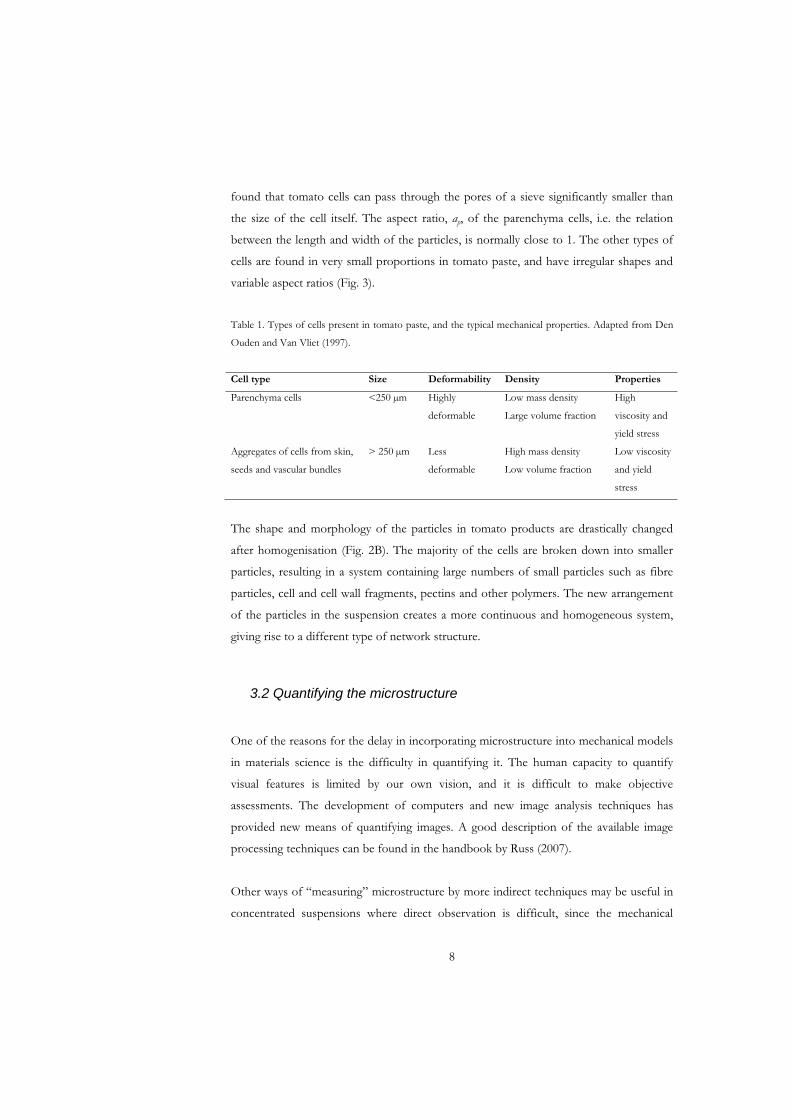
variable aspect ratios (Fig. 3).
Table 1. Types of cells present in tomato paste, and the typical mechanical properties. Adapted from Den
Ouden and Van Vliet (1997).
Cell type Size Deformability Density Properties
Parenchyma cells <250 μm Highly
deformable
Low mass density
Large volume fraction
High
viscosity and
yield stress
Aggregates of cells from skin,
seeds and vascular bundles
> 250 μm Less
deformable
High mass density
Low volume fraction
Low viscosity
and yield
stress
The shape and morphology of the particles in tomato products are drastically changed
after homogenisation (Fig. 2B). The majority of the cells are broken down into smaller
particles, resulting in a system containing large numbers of small particles such as fibre
particles, cell and cell wall fragments, pectins and other polymers. The new arrangement
of the particles in the suspension creates a more continuous and homogeneous system,
giving rise to a different type of network structure.
3.2 Quantifying the microstructure
One of the reasons for the delay in incorporating microstructure into mechanical models
in materials science is the difficulty in quantifying it. The human capacity to quantify
visual features is limited by our own vision, and it is difficult to make objective
assessments. The development of computers and new image analysis techniques has
provided new means of quantifying images. A good description of the available image
processing techniques can be found in the handbook by Russ (2007).
Other ways of “measuring” microstructure by more indirect techniques may be useful in
concentrated suspensions where direct observation is difficult, since the mechanical
8
behaviour of a suspension or gel depends to a great extent on the volume fraction, the
size and shape of the particles, the interparticle forces and the spatial arrangement
between particles (Wyss et al., 2005), all contributing to what is termed the
microstructure.
3.2.1 Image analysis of light micrographs
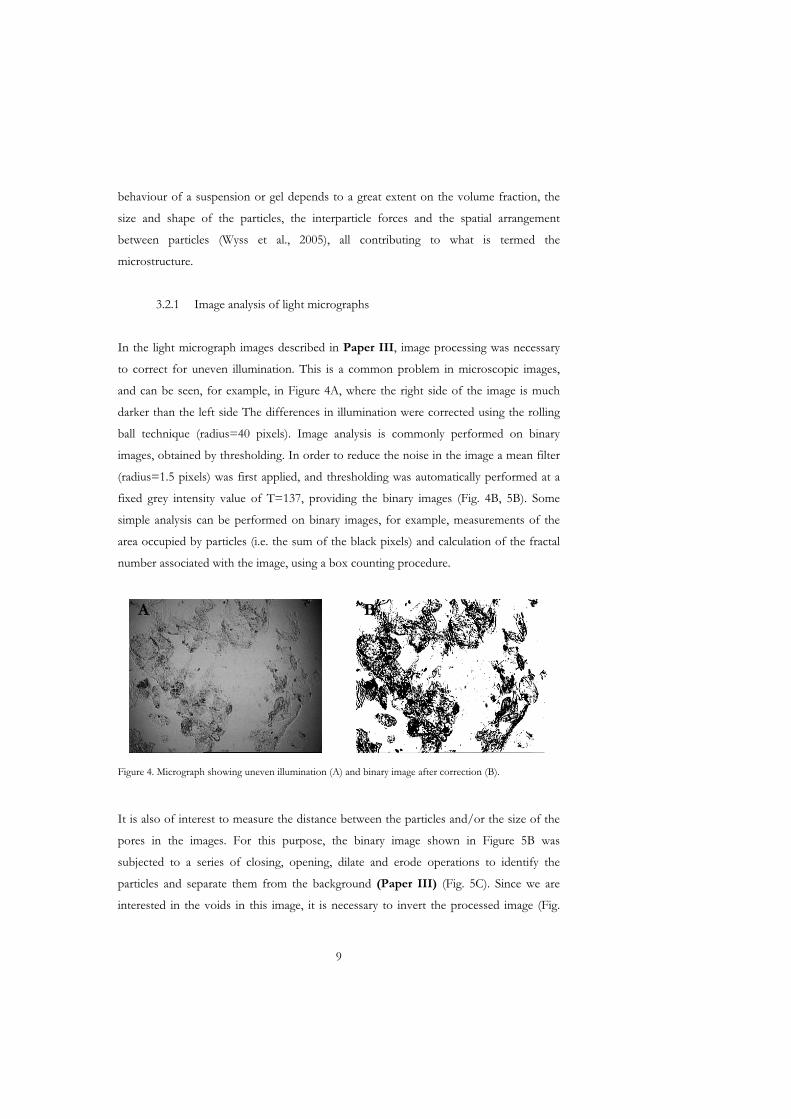
In the light micrograph images described in Paper III, image processing was necessary
to correct for uneven illumination. This is a common problem in microscopic images,
and can be seen, for example, in Figure 4A, where the right side of the image is much
darker than the left side The differences in illumination were corrected using the rolling
ball technique (radius=40 pixels). Image analysis is commonly performed on binary
images, obtained by thresholding. In order to reduce the noise in the image a mean filter
(radius=1.5 pixels) was first applied, and thresholding was automatically performed at a
fixed grey intensity value of T=137, providing the binary images (Fig. 4B, 5B). Some
simple analysis can be performed on binary images, for example, measurements of the
area occupied by particles (i.e. the sum of the black pixels) and calculation of the fractal
number associated with the image, using a box counting procedure.
A B
Figure 4. Micrograph showing uneven illumination (A) and binary image after correction (B).
It is also of interest to measure the distance between the particles and/or the size of the
pores in the images. For this purpose, the binary image shown in Figure 5B was
subjected to a series of closing, opening, dilate and erode operations to identify the
particles and separate them from the background (Paper III) (Fig. 5C). Since we are
interested in the voids in this image, it is necessary to invert the processed image (Fig.
9
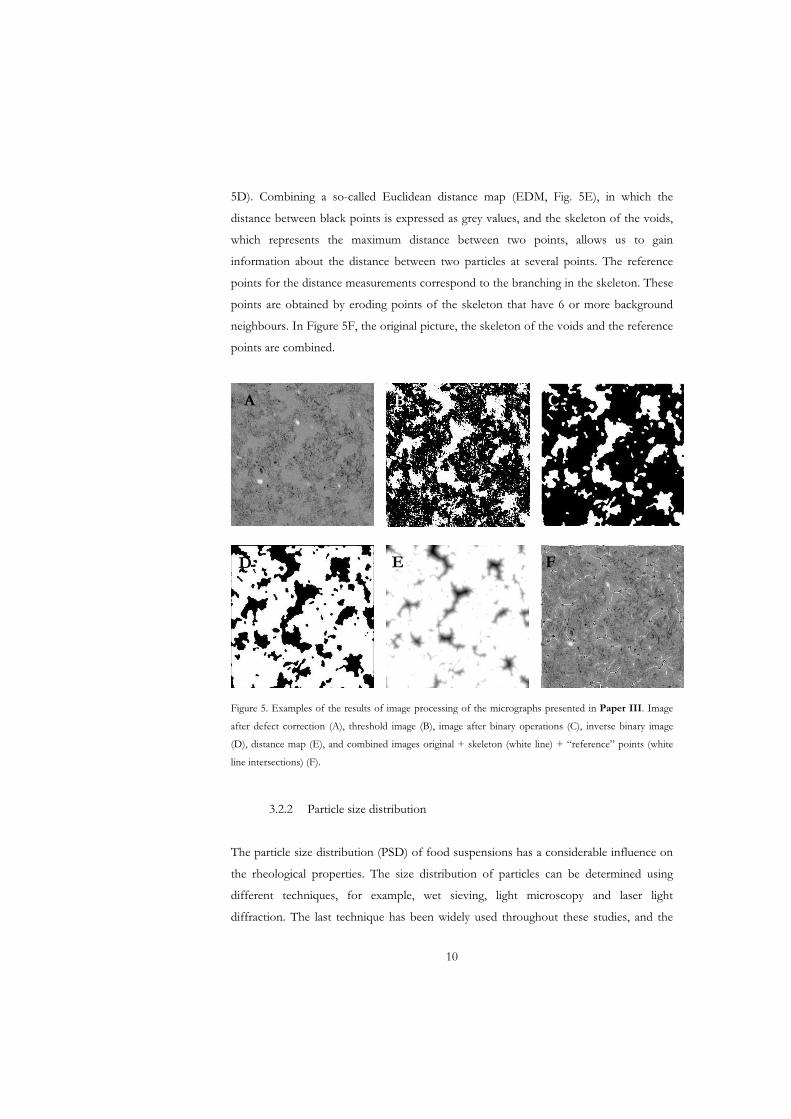
5D). Combining a so-called Euclidean distance map (EDM, Fig. 5E), in which the
distance between black points is expressed as grey values, and the skeleton of the voids,
which represents the maximum distance between two points, allows us to gain
information about the distance between two particles at several points. The reference
points for the distance measurements correspond to the branching in the skeleton. These
points are obtained by eroding points of the skeleton that have 6 or more background
neighbours. In Figure 5F, the original picture, the skeleton of the voids and the reference
points are combined.
A B C
E FD
Figure 5. Examples of the results of image processing of the micrographs presented in Paper III. Image
after defect correction (A), threshold image (B), image after binary operations (C), inverse binary image
(D), distance map (E), and combined images original + skeleton (white line) + “reference” points (white
line intersections) (F).
3.2.2 Particle size distribution
The particle size distribution (PSD) of food suspensions has a considerable influence on
the rheological properties. The size distribution of particles can be determined using
different techniques, for example, wet sieving, light microscopy and laser light
diffraction. The last technique has been widely used throughout these studies, and the
10
diffraction data were analysed using the Fraunhofer diffraction method. The Fraunhofer
method can be applied to particle sizes between 1 and 200 μm (Annapragada & Adjei,
1996), and can handle polydisperse systems. It assumes that the particles are spherical,
but it adequately describes the particle size of fibres (i.e. cylinders) with diameters larger
than 8 μm (Powers & Somerford, 1978). The use of the Fraunhofer theory in
determining the PSD of tomato products is rather common (Den Ouden & Van Vliet,
1997; Getchell & Schlimme, 1985).
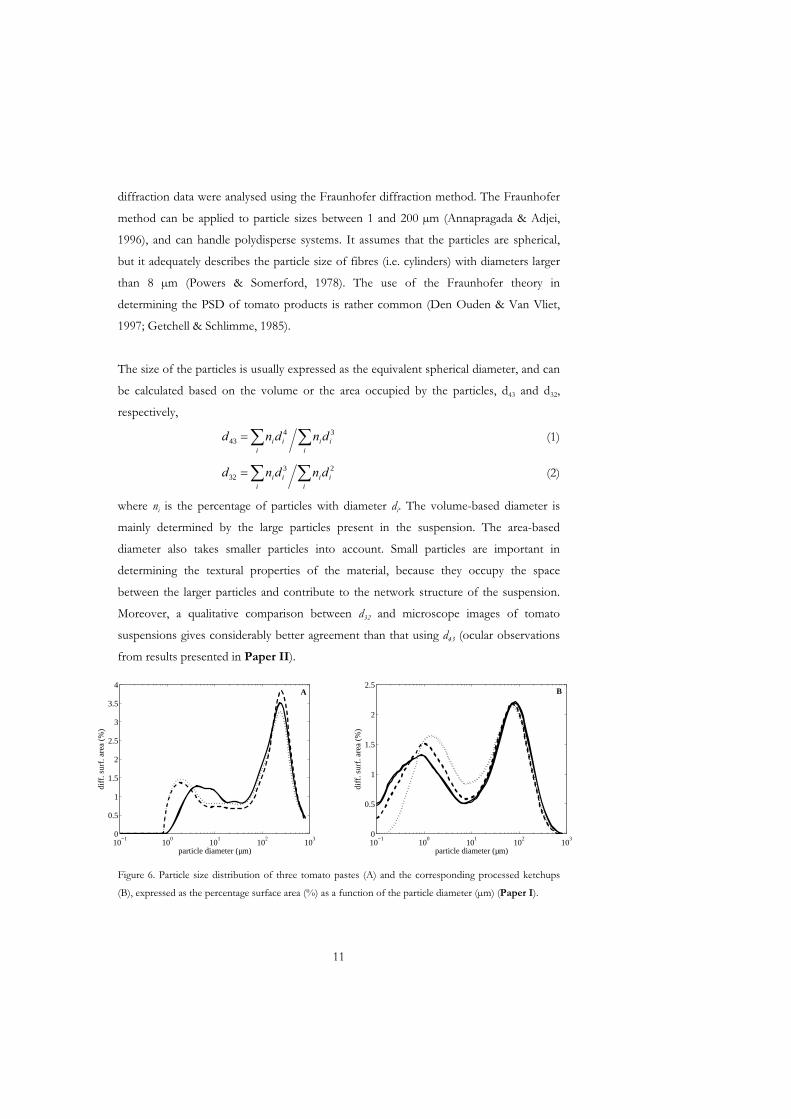
The size of the particles is usually expressed as the equivalent spherical diameter, and can
be calculated based on the volume or the area occupied by the particles, d43 and d32,
respectively,
iii
iii dndnd 34
43 (1)
iii
iii dndnd 23
32 (2)
where ni is the percentage of particles with diameter di. The volume-based diameter is
mainly determined by the large particles present in the suspension. The area-based
diameter also takes smaller particles into account. Small particles are important in
determining the textural properties of the material, because they occupy the space
between the larger particles and contribute to the network structure of the suspension.
Moreover, a qualitative comparison between d32 and microscope images of tomato
suspensions gives considerably better agreement than that using d43 (ocular observations
from results presented in Paper II).
10−1
100
101
102
103
0
0.5
1
1.5
2
2.5
3
3.5
4
particle diameter (µm)
diff
. sur
f. a
rea
(%)
A
10−1
100
101
102
103
0
0.5
1
1.5
2
2.5
particle diameter (µm)
diff
. sur
f. a
rea
(%)
B
Figure 6. Particle size distribution of three tomato pastes (A) and the corresponding processed ketchups
(B), expressed as the percentage surface area (%) as a function of the particle diameter (μm) (Paper I).
11
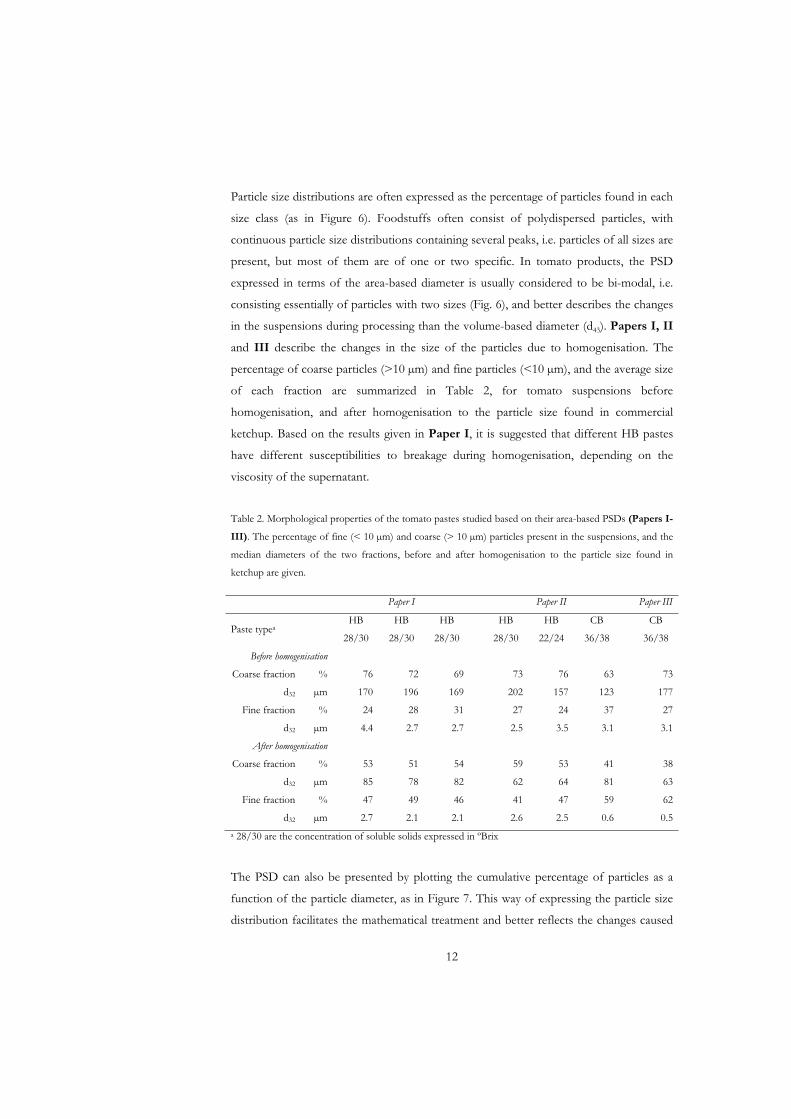
Particle size distributions are often expressed as the percentage of particles found in each
size class (as in Figure 6). Foodstuffs often consist of polydispersed particles, with
continuous particle size distributions containing several peaks, i.e. particles of all sizes are
present, but most of them are of one or two specific. In tomato products, the PSD
expressed in terms of the area-based diameter is usually considered to be bi-modal, i.e.
consisting essentially of particles with two sizes (Fig. 6), and better describes the changes
in the suspensions during processing than the volume-based diameter (d43). Papers I, II
and III describe the changes in the size of the particles due to homogenisation. The
percentage of coarse particles (>10 μm) and fine particles (<10 μm), and the average size
of each fraction are summarized in Table 2, for tomato suspensions before
homogenisation, and after homogenisation to the particle size found in commercial
ketchup. Based on the results given in Paper I, it is suggested that different HB pastes
have different susceptibilities to breakage during homogenisation, depending on the
viscosity of the supernatant.
Table 2. Morphological properties of the tomato pastes studied based on their area-based PSDs (Papers I-
III). The percentage of fine (< 10 μm) and coarse (> 10 μm) particles present in the suspensions, and the
median diameters of the two fractions, before and after homogenisation to the particle size found in
ketchup are given.
Paper I Paper II Paper III
Paste typeaHB
28/30
HB
28/30
HB
28/30
HB
28/30
HB
22/24
CB
36/38
CB
36/38
Before homogenisation
Coarse fraction % 76 72 69 73 76 63 73
d32 μm 170 196 169 202 157 123 177
Fine fraction % 24 28 31 27 24 37 27
d32 μm 4.4 2.7 2.7 2.5 3.5 3.1 3.1
After homogenisation
Coarse fraction % 53 51 54 59 53 41 38
d32 μm 85 78 82 62 64 81 63
Fine fraction % 47 49 46 41 47 59 62
d32 μm 2.7 2.1 2.1 2.6 2.5 0.6 0.5a 28/30 are the concentration of soluble solids expressed in ºBrix
The PSD can also be presented by plotting the cumulative percentage of particles as a
function of the particle diameter, as in Figure 7. This way of expressing the particle size
distribution facilitates the mathematical treatment and better reflects the changes caused
12
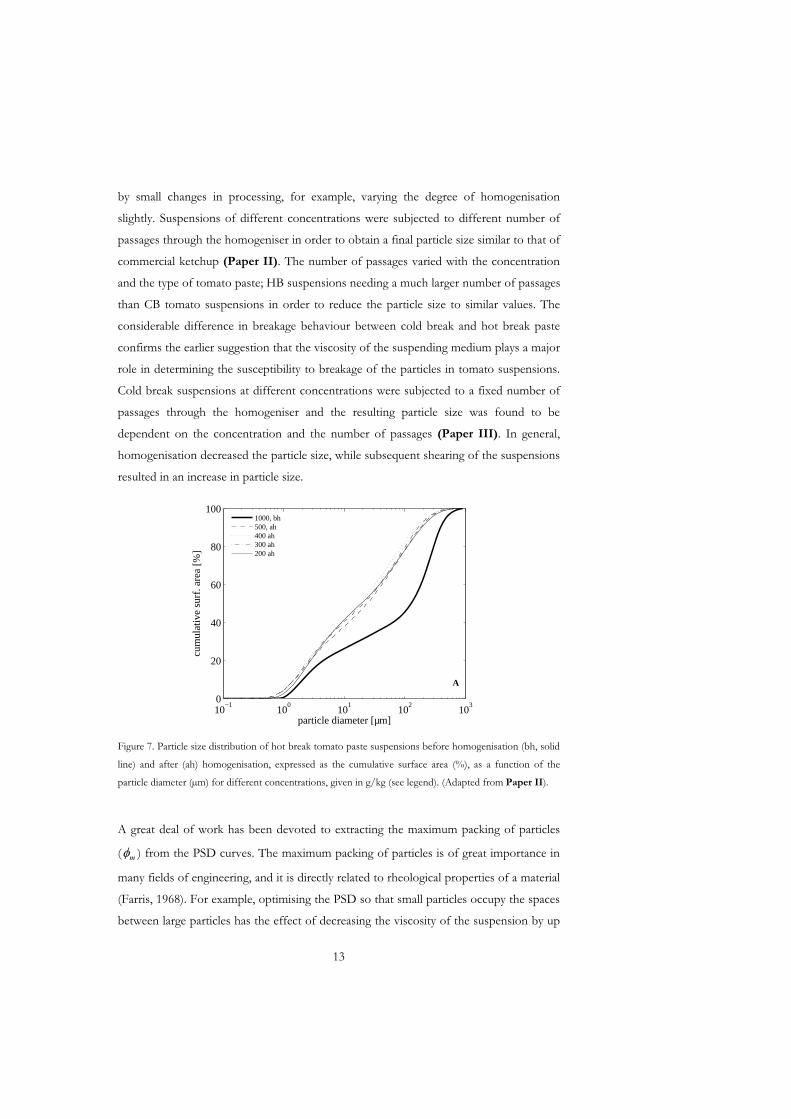
by small changes in processing, for example, varying the degree of homogenisation
slightly. Suspensions of different concentrations were subjected to different number of
passages through the homogeniser in order to obtain a final particle size similar to that of
commercial ketchup (Paper II). The number of passages varied with the concentration
and the type of tomato paste; HB suspensions needing a much larger number of passages
than CB tomato suspensions in order to reduce the particle size to similar values. The
considerable difference in breakage behaviour between cold break and hot break paste
confirms the earlier suggestion that the viscosity of the suspending medium plays a major
role in determining the susceptibility to breakage of the particles in tomato suspensions.
Cold break suspensions at different concentrations were subjected to a fixed number of
passages through the homogeniser and the resulting particle size was found to be
dependent on the concentration and the number of passages (Paper III). In general,
homogenisation decreased the particle size, while subsequent shearing of the suspensions
resulted in an increase in particle size.
10−1
100
101
102
103
0
20
40
60
80
100
particle diameter [µm]
cum
ulat
ive
surf
. are
a [%
]
1000, bh500, ah400 ah300 ah200 ah
A
Figure 7. Particle size distribution of hot break tomato paste suspensions before homogenisation (bh, solid
line) and after (ah) homogenisation, expressed as the cumulative surface area (%), as a function of the
particle diameter (μm) for different concentrations, given in g/kg (see legend). (Adapted from Paper II).
A great deal of work has been devoted to extracting the maximum packing of particles
( m ) from the PSD curves. The maximum packing of particles is of great importance in
many fields of engineering, and it is directly related to rheological properties of a material
(Farris, 1968). For example, optimising the PSD so that small particles occupy the spaces
between large particles has the effect of decreasing the viscosity of the suspension by up
13
to a factor of 50, which can significantly reduced the pumping cost (Servais et al., 2002).
It is also a key parameter in powder handling and processing as it determines the total
volume occupied by the powder.
The maximum packing fraction is easily obtained in monodisperse suspensions, binary
suspensions, i.e. particle populations with two discrete sizes, and ternary suspensions
(three discrete particle sizes) (Lee, 1970). In continuous PSDs, the extraction of m
represents a complex mathematical problem, and the computational requirements make
the solution difficult (Bierwagen & Saunders, 1974). Recently, m was solved for a
continuous PSD showing power law behaviour (Brouwers, 2006). For more complex
PSDs, such as those found in food suspensions like tomato paste, no mathematical tools
for the determination of the maximum packing of the particles are available today.
3.2.3 Concentration and volume fraction determination
The particle concentration is an important parameter determining the type of suspension,
as well as the microstructure. There are different ways of expressing concentration, for
example, based on the total solids, the water-insoluble solids or the volume fraction, but
only the last one takes into account the microstructure of the suspension. The total solids
and water-insoluble solids are, for example, not affected by processes that clearly change
the microstructure of the suspensions, such as homogenisation. Volume fraction, on the
other hand, is very sensitive to these changes. In this work, the volume fraction was
determined by ultracentrifugation at 110,000 g. This value was used as Den Ouden
(1995) and Rao (1999), claimed that very high centrifugation forces were needed to
separate the solid and liquid phases in tomato paste. The drawback of using the
centrifugation technique to determine the volume fraction is that the resulting value may
be affected by deformation of the particles. Therefore, the volume fraction ( )
determined in the present work is indeed a compressive volume fraction and depends on
morphological factors such as the PSD and the particle shape, as well as on the packing
capacity and deformability. In this text, it will simply be referred to as volume fraction.
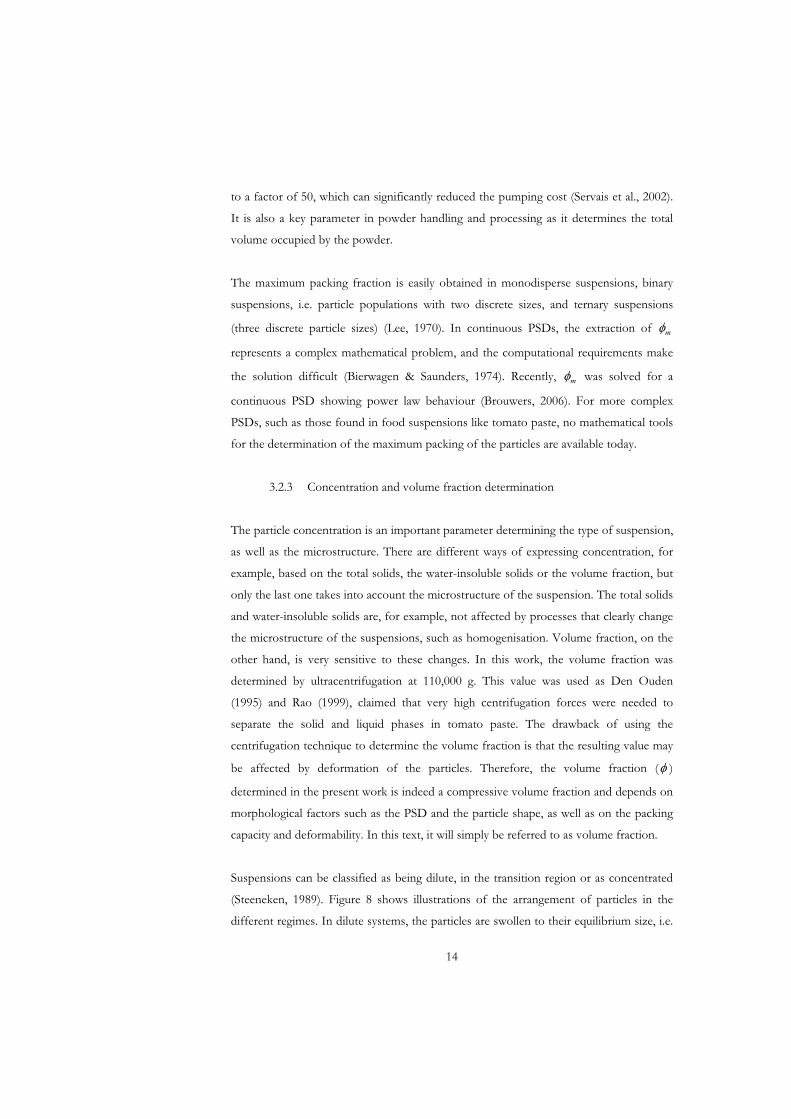
Suspensions can be classified as being dilute, in the transition region or as concentrated
(Steeneken, 1989). Figure 8 shows illustrations of the arrangement of particles in the
different regimes. In dilute systems, the particles are swollen to their equilibrium size, i.e.
14
they have maximum volume and are free to move in the suspension under Brownian
forces. In the transition region, the particles are in contact with each other, but still have
their maximum volume. In highly concentrated suspensions, the particles are deformed
and fill the space available, and the suspension is thus fully packed. Another definition
was given by Coussot and Ancey (1999), who described concentrated suspensions and
granular pastes from a physical point of view, as “complex systems within which particles
interact strongly, giving rise to viscosities much higher than the viscosity of the
suspending media”. In concentrated systems, the interactions and contact between
particles clearly dominate over the Brownian forces.
Figure 8. Concentration regime in suspensions. From left to right: dilute, transition and concentrated.
(Adapted from Steeneken, 1989.)
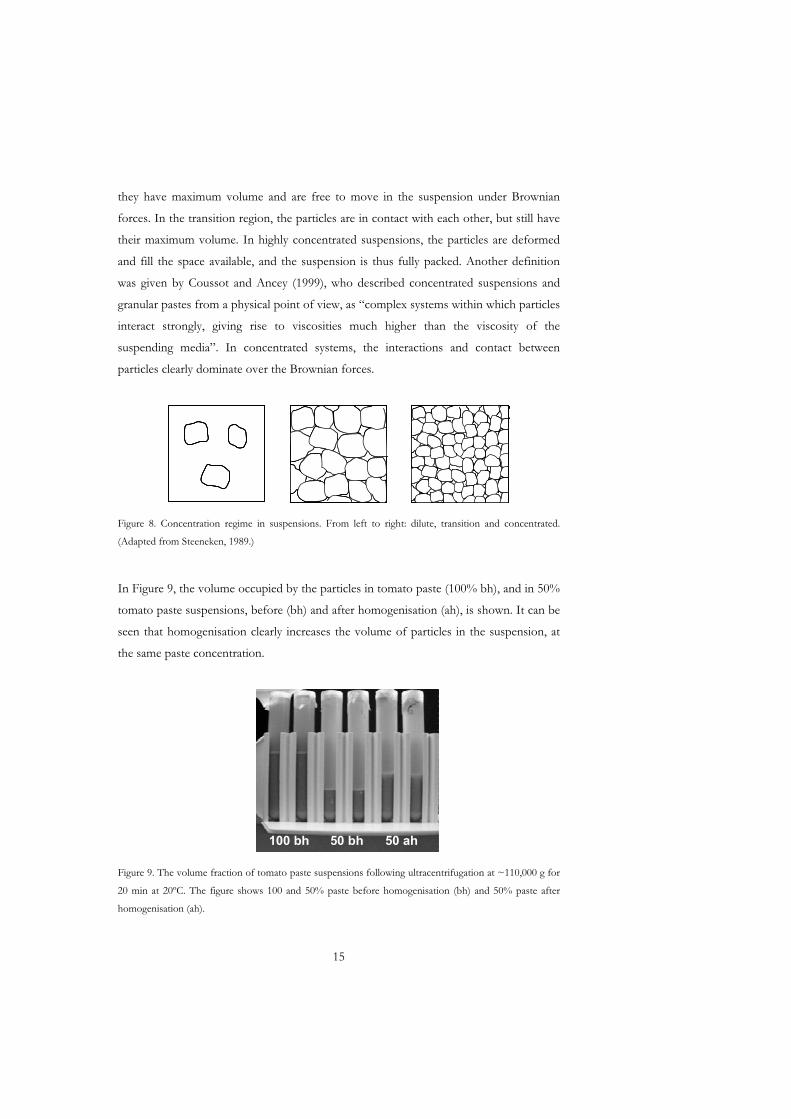
In Figure 9, the volume occupied by the particles in tomato paste (100% bh), and in 50%
tomato paste suspensions, before (bh) and after homogenisation (ah), is shown. It can be
seen that homogenisation clearly increases the volume of particles in the suspension, at
the same paste concentration.
100 bh 50 bh 50 ah100 bh 50 bh 50 ah
Figure 9. The volume fraction of tomato paste suspensions following ultracentrifugation at ~110,000 g for
20 min at 20ºC. The figure shows 100 and 50% paste before homogenisation (bh) and 50% paste after
homogenisation (ah).
15
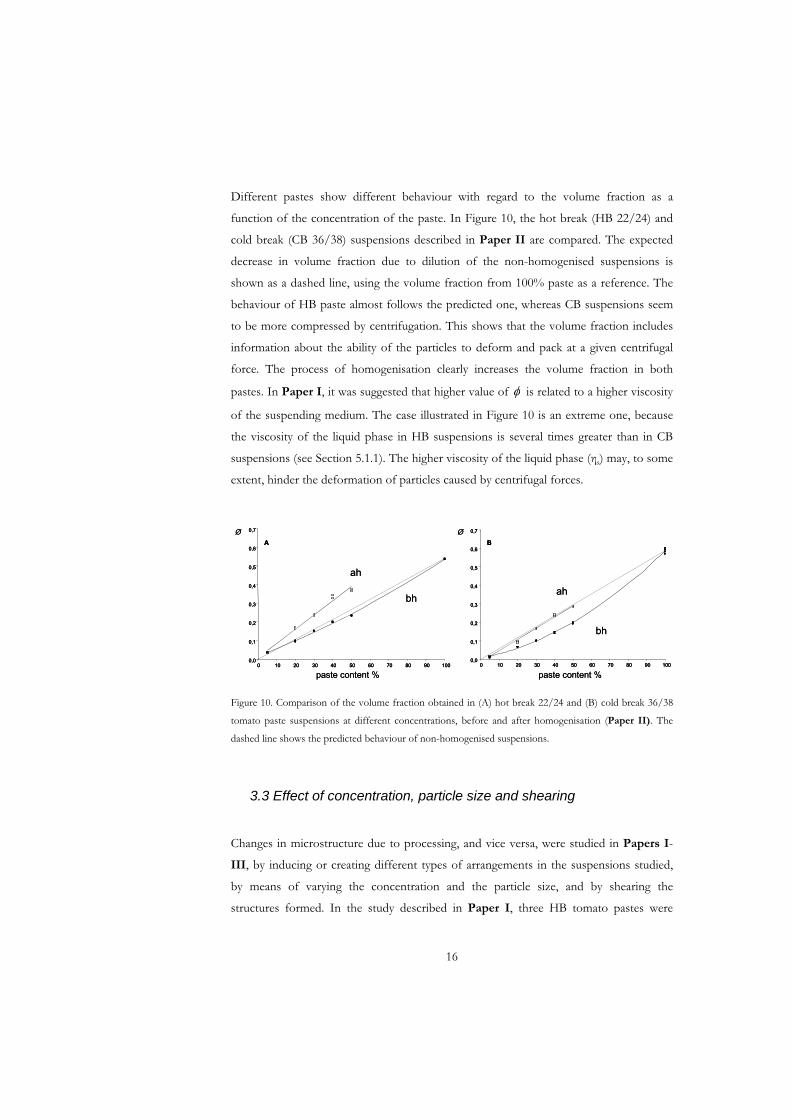
Different pastes show different behaviour with regard to the volume fraction as a
function of the concentration of the paste. In Figure 10, the hot break (HB 22/24) and
cold break (CB 36/38) suspensions described in Paper II are compared. The expected
decrease in volume fraction due to dilution of the non-homogenised suspensions is
shown as a dashed line, using the volume fraction from 100% paste as a reference. The
behaviour of HB paste almost follows the predicted one, whereas CB suspensions seem
to be more compressed by centrifugation. This shows that the volume fraction includes
information about the ability of the particles to deform and pack at a given centrifugal
force. The process of homogenisation clearly increases the volume fraction in both
pastes. In Paper I, it was suggested that higher value of is related to a higher viscosity
of the suspending medium. The case illustrated in Figure 10 is an extreme one, because
the viscosity of the liquid phase in HB suspensions is several times greater than in CB
suspensions (see Section 5.1.1). The higher viscosity of the liquid phase ( s) may, to some
extent, hinder the deformation of particles caused by centrifugal forces.
0,0
0,1
0,2
0,3
0,4
0,5
0,6
0,7
0 10 20 30 40 50 60 70 80 90 100
A
paste content %
Ø
0,0
0,1
0,2
0,3
0,4
0,5
0,6
0,7
0 10 20 30 40 50 60 70 80 90 10
B
paste content %
Ø
ah
bhah
bh
00,0
0,1
0,2
0,3
0,4
0,5
0,6
0,7
0 10 20 30 40 50 60 70 80 90 100
A
0,0
0,1
0,2
0,3
0,4
0,5
0,6
0,7
0 10 20 30 40 50 60 70 80 90 100
A
paste content %
Ø
0,0
0,1
0,2
0,3
0,4
0,5
0,6
0,7
0 10 20 30 40 50 60 70 80 90 10
B
00,0
0,1
0,2
0,3
0,4
0,5
0,6
0,7
0 10 20 30 40 50 60 70 80 90 10
B
paste content %
Ø
ah
bhah
bh
0
Figure 10. Comparison of the volume fraction obtained in (A) hot break 22/24 and (B) cold break 36/38
tomato paste suspensions at different concentrations, before and after homogenisation (Paper II). The
dashed line shows the predicted behaviour of non-homogenised suspensions.
3.3 Effect of concentration, particle size and shearing
Changes in microstructure due to processing, and vice versa, were studied in Papers I-
III, by inducing or creating different types of arrangements in the suspensions studied,
by means of varying the concentration and the particle size, and by shearing the
structures formed. In the study described in Paper I, three HB tomato pastes were
16
studied as raw material in the production of a commercial ketchup. Slight variations in
the composition, particle size distribution and particle susceptibility to breakage are
reflected in the rheological properties of the final ketchups. In the study presented in
Paper II, a more systematic approach was taken. Three different pastes were
homogenised to sizes similar to those found in commercial ketchup, and the effects of
both concentration and particle size on the time-dependent properties of the tomato
suspensions were investigated. Finally, changes in the microstructure due to processing
(homogenisation and shearing) were systematically studied on CB tomato paste
suspensions at different concentrations (Paper III). Table 3 presents an overview of the
studies described in each of the papers. Paper IV is included for completeness.
Table 3. Overview of the experimental studies described in Papers I-IV, including the type of paste used,
range of concentrations studied and the degree of homogenisation applied. The type of rheological
measurements performed in each study is also given.
Factor Paper I Paper II Paper III Paper IV
Paste type 3 HB 2 HB and 1 CB 1 CB 1 HB and 1 CB
Concentration
g/kg
1000, 400, 300 1000, 500, 400,
300, 200
400, 300, 100 1000, 500, 400,
300
Homogenisation 300 g/kg
to ketchup size
500-200 g/kg
to ketchup size
400-100 g/kg
3 degrees
-
Shearing - During
measurements
1 h, magnetic
stirrer
-
Measurements
Flow curve + + - +
Creep - + - -
Dynamic + - + +
Yield stress + + - +
Effect of concentration on the particle size
In this study, the concentration of tomato suspensions was expressed in terms of the
volume fraction, , instead of the more common forms, Brix degree, water-insoluble
solids or total solids, because these are not related to the microstructure. The effect of
concentration on the microstructure of tomato suspensions can not be studied using
microscopy, because dilution of the samples is required, and their arrangement in the
suspension would thus be disrupted. Therefore, the effects of concentration were
investigated in terms of other parameters, such as the rheological properties (Sections 4.2
17
and 5.1). Moreover, the influence of the concentration on the performance of the
homogeniser, in decreasing the particle size to a set value, was studied. The last point will
be discussed in this section.
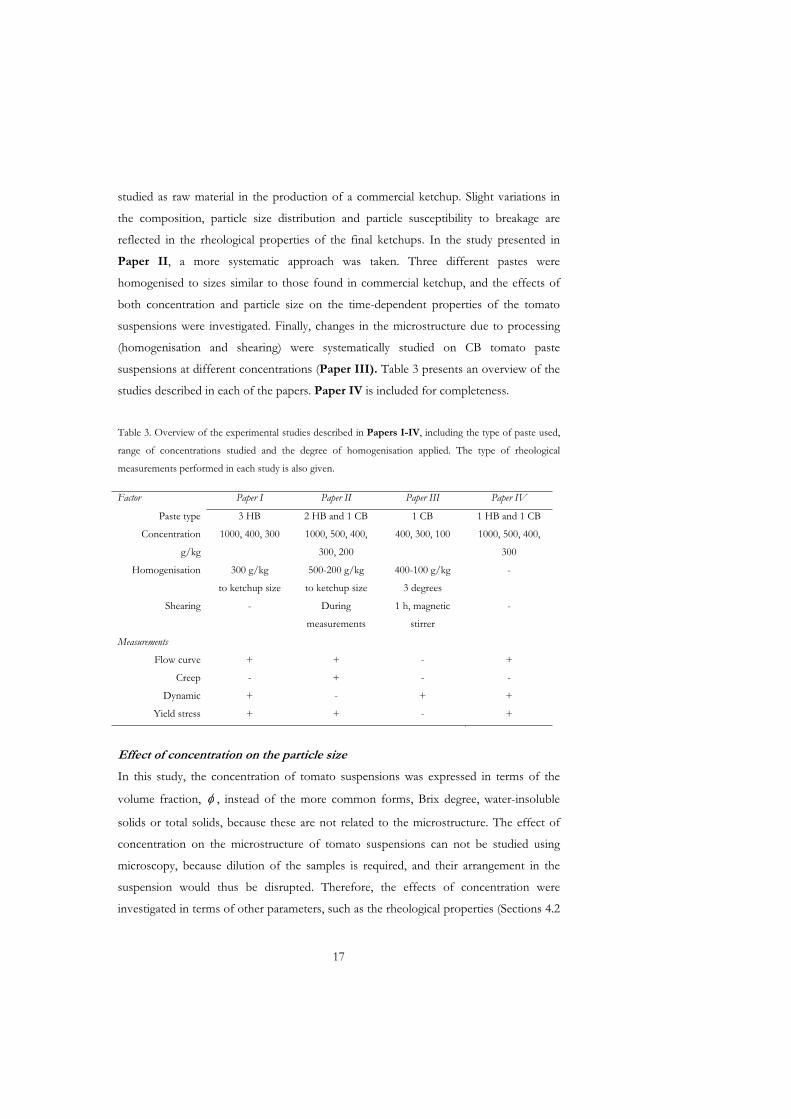
In Paper II, the number of passages through the homogeniser required to decrease the
particle size of different tomato pastes to a set value, was determined, taking into account
the concentration of the suspensions and the type of paste (Fig. 11A). In general, fewer
passages were required with decreasing concentration. The effect of a fixed number of
passages on the particle size of the suspension is shown in Figure 11B, for different
concentrations. The decrease in particle size in the more concentrated sample (400 g/kg)
is less pronounced than in the others at a given number of passages. The changes
following homogenisation differ considerably between HB and CB suspensions, the
latter requiring much fewer passages to break down the particles. This may also be
related to the lower viscosity of the suspending medium ( s), in CB suspensions.
0
50
100
150
200
250
500 400 300 200
A
d 43
% paste
1515
11710
10
76
1
12
3
0
50
100
150
200
250
300
350
400 300 100
B
% paste
d 43 3
3 3
22 2
1 1 1
0
50
100
150
200
250
500 400 300 200
A
d 43
% paste
1515
11710
10
76
1
12
3
0
50
100
150
200
250
500 400 300 200
A
d 43
% paste
1515
11710
10
76
1
12
3
0
50
100
150
200
250
300
350
400 300 100
B
% paste
d 43 3
3 3
22 2
1 1 1
0
50
100
150
200
250
300
350
400 300 100
B
% paste
d 43 3
3 3
22 2
1 1 1
g/kg g/kg
0
50
100
150
200
250
500 400 300 200
A
d 43
% paste
1515
11710
10
76
1
12
3
0
50
100
150
200
250
300
350
400 300 100
B
% paste
d 43 3
3 3
22 2
1 1 1
0
50
100
150
200
250
500 400 300 200
A
d 43
% paste
1515
11710
10
76
1
12
3
0
50
100
150
200
250
500 400 300 200
A
d 43
% paste
1515
11710
10
76
1
12
3
0
50
100
150
200
250
300
350
400 300 100
B
% paste
d 43 3
3 3
22 2
1 1 1
0
50
100
150
200
250
300
350
400 300 100
B
% paste
d 43 3
3 3
22 2
1 1 1
g/kg g/kg
Figure 11. Volume-based diameter (d43, μm) as a function of the concentration of the paste (g/kg), for
different numbers of passages through the homogeniser (given above each column). A) Adapted from
Paper II: HB 28/30 , HB 22/24 , and CB 36/38 . B) Adapted from Paper III, CB 36/38.
Finally, it is interesting to note that the behaviour of suspensions during the process of
homogenisation is markedly different from that of emulsions. In emulsions the relevant
parameter in decreasing the size of the particles is the homogenisation pressure
(Tornberg, 1978), while the size of the particles remains approximately constant after
repeated passage at the same pressure. This is not the case in suspensions and Figure 11B
clearly shows the importance of the number of passages in determining the final size of
the particles.
18
Non sheared Sheared
H0
H1
H2
H3
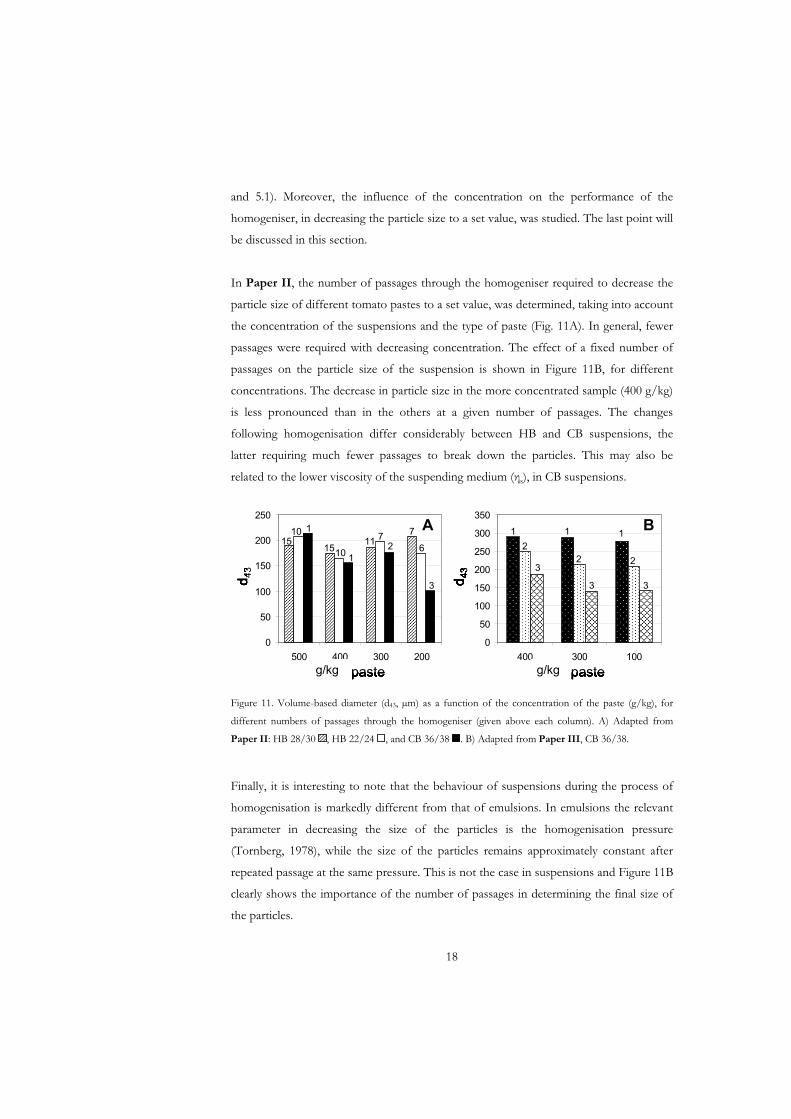
Figure 12. Effect of homogenisation and subsequent shearing on the microstructure of 10% cold break
tomato paste suspensions before homogenisation (H0) and after 1, 2 and 3 passages (H1-H3) through the
homogeniser (pressure ~90 bar). (Adapted from Paper III.) The scale bar is 250 μm.
19
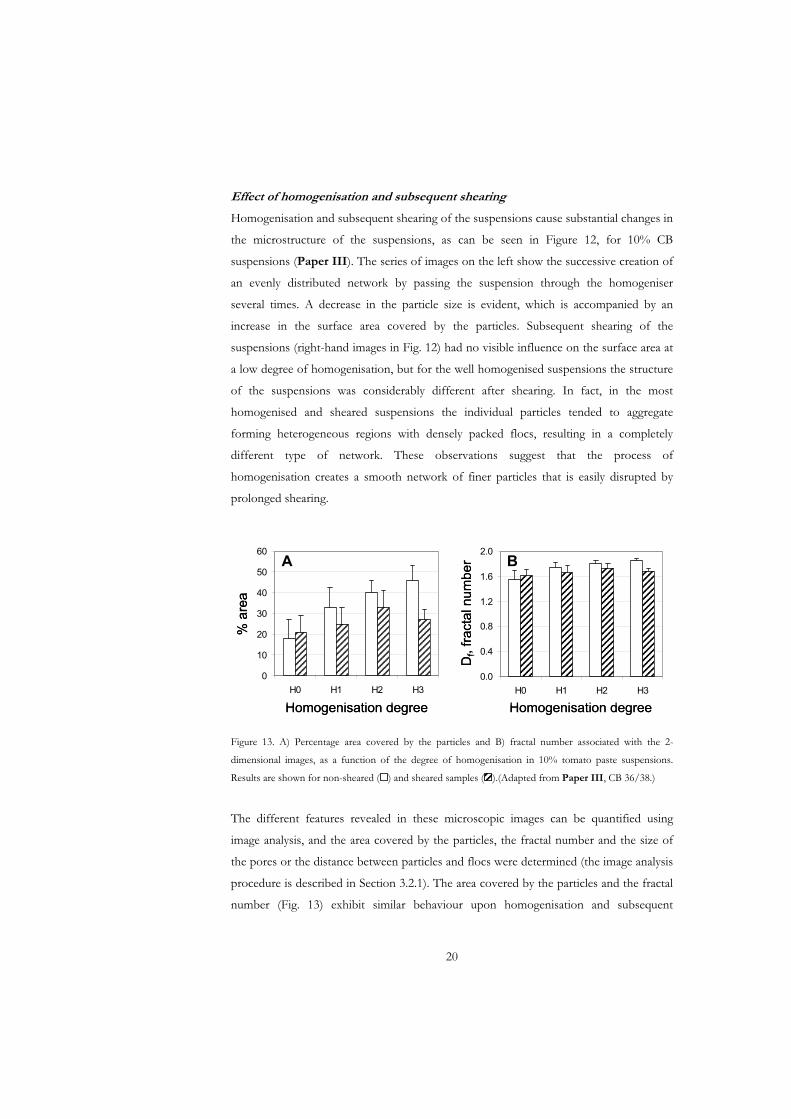
Effect of homogenisation and subsequent shearing
Homogenisation and subsequent shearing of the suspensions cause substantial changes in
the microstructure of the suspensions, as can be seen in Figure 12, for 10% CB
suspensions (Paper III). The series of images on the left show the successive creation of
an evenly distributed network by passing the suspension through the homogeniser
several times. A decrease in the particle size is evident, which is accompanied by an
increase in the surface area covered by the particles. Subsequent shearing of the
suspensions (right-hand images in Fig. 12) had no visible influence on the surface area at
a low degree of homogenisation, but for the well homogenised suspensions the structure
of the suspensions was considerably different after shearing. In fact, in the most
homogenised and sheared suspensions the individual particles tended to aggregate
forming heterogeneous regions with densely packed flocs, resulting in a completely
different type of network. These observations suggest that the process of
homogenisation creates a smooth network of finer particles that is easily disrupted by
prolonged shearing.
0
10
20
30
40
50
60
H0 H1 H2 H30.0
0.4
0.8
1.2
1.6
2.0
H0 H1 H2 H3
Homogenisation degreeHomogenisation degree
% a
rea
Df,
fract
al n
umbe
rA B
0
10
20
30
40
50
60
H0 H1 H2 H30.0
0.4
0.8
1.2
1.6
2.0
H0 H1 H2 H3
Homogenisation degreeHomogenisation degree
% a
rea
Df,
fract
al n
umbe
rA B
Figure 13. A) Percentage area covered by the particles and B) fractal number associated with the 2-
dimensional images, as a function of the degree of homogenisation in 10% tomato paste suspensions.
Results are shown for non-sheared ( ) and sheared samples ( ).(Adapted from Paper III, CB 36/38.)
The different features revealed in these microscopic images can be quantified using
image analysis, and the area covered by the particles, the fractal number and the size of
the pores or the distance between particles and flocs were determined (the image analysis
procedure is described in Section 3.2.1). The area covered by the particles and the fractal
number (Fig. 13) exhibit similar behaviour upon homogenisation and subsequent
20
shearing. Both variables are found to increase with the degree of homogenisation,
whereas shearing has a negative effect on their values. The structure of the unsheared
well-homogenised suspensions shows a high degree of fractality, and probably consists of
dense areas connected by thin linkages (H3). On shearing, the network is probably
disrupted first at these linkages, followed by the densification of the floc structure and
the growth of the floc size (H3-SH).
The fractality of the network structure is one of the few existing ways to relate
microstructure and rheology, and a number of scaling laws relating them have been
developed for colloidal suspensions and gels (Buscall et al., 1987, Buscall et al., 1988) and
more recently for fat crystals (Narine & Marangoni, 1999). The applicability of such laws
relating microstructure and rheology in tomato suspensions will be discussed in Chapter
4.
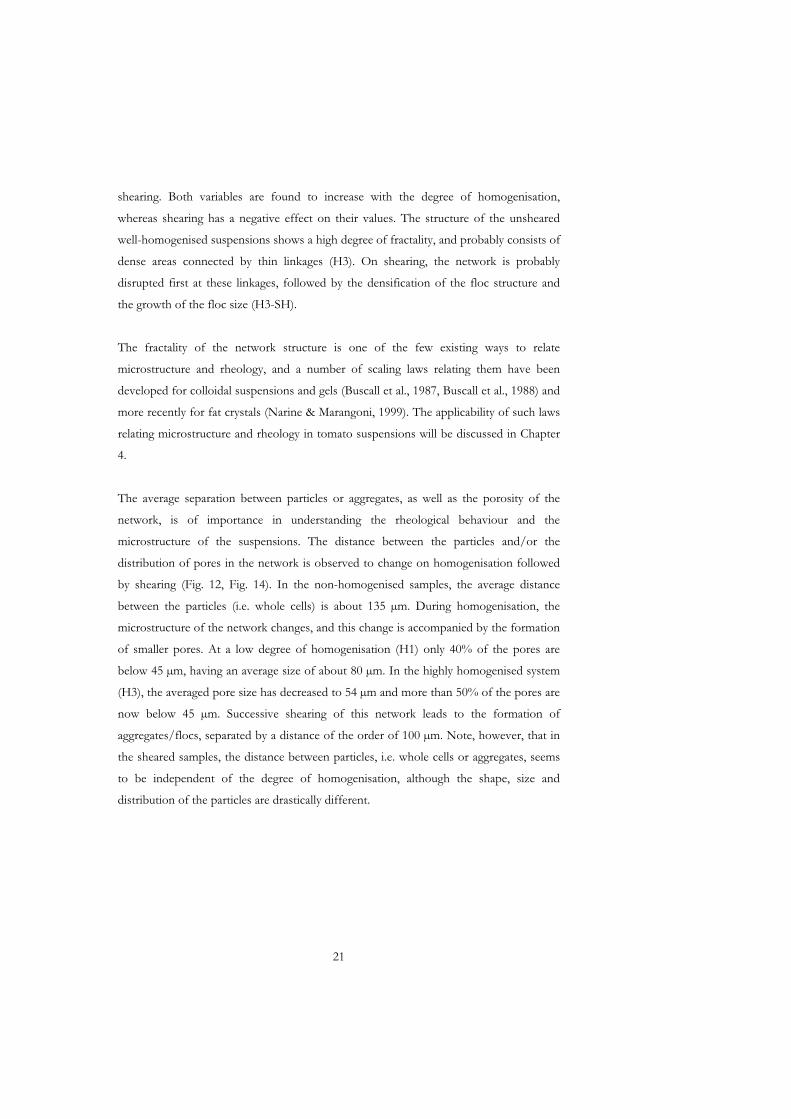
The average separation between particles or aggregates, as well as the porosity of the
network, is of importance in understanding the rheological behaviour and the
microstructure of the suspensions. The distance between the particles and/or the
distribution of pores in the network is observed to change on homogenisation followed
by shearing (Fig. 12, Fig. 14). In the non-homogenised samples, the average distance
between the particles (i.e. whole cells) is about 135 μm. During homogenisation, the
microstructure of the network changes, and this change is accompanied by the formation
of smaller pores. At a low degree of homogenisation (H1) only 40% of the pores are
below 45 μm, having an average size of about 80 μm. In the highly homogenised system
(H3), the averaged pore size has decreased to 54 μm and more than 50% of the pores are
now below 45 μm. Successive shearing of this network leads to the formation of
aggregates/flocs, separated by a distance of the order of 100 μm. Note, however, that in
the sheared samples, the distance between particles, i.e. whole cells or aggregates, seems
to be independent of the degree of homogenisation, although the shape, size and
distribution of the particles are drastically different.
21
0
50
100
150
200
250
H0 H1 H2 H30
10
20
30
40
50
60
H0 H1 H2 H3
A B
% p
ores
< 4
5 μm
Homogenisation degreeHomogenisation degree
Por
e si
ze μ
m
0
50
100
150
200
250
H0 H1 H2 H30
10
20
30
40
50
60
H0 H1 H2 H3
A B
% p
ores
< 4
5 μm
Homogenisation degreeHomogenisation degree
Por
e si
ze μ
m
Figure 14. A) Pore size (or distance between particles and/or flocs), and B) percentage of pores with a size
below 45 μm, as a function of the degree of homogenisation in 10% tomato paste suspensions. Results are
shown for non-sheared ( ) and sheared samples ( ).(Adapted from Paper III, CB 36/38.)
Following prolonged shearing, the network of tomato homogenates rearranges, forming
discrete, closely packed flocs, consisting of aggregates of small individual particles. These
flocs are easily oriented in the direction of the flow (in Fig. 12, at about 45º) and have an
aspect ratio of the order of ~10, whereas that of the individual particles is about ~1.5.
Mills et al. (1991) studied the effect of prolonged shearing in model colloid suspensions
and found that the particles tended to form flocs or aggregates, which led to a significant
decrease in yield stress, apparent viscosity and shear modulus. They reported that the size
of the aggregates was independent of the initial volume fraction, and probably
determined by the size of the individual particles.
22
4. Mechanical Spectra of Concentrated Suspensions
The word “rheology” was coined by Bingham in the 1920s and comes from the Greek,
where rheos- means “current or flow” and logos- means “word or science”. Rheology is
thus the study of the deformation and flow of matter in response to a mechanical force.
In this chapter , measurements based on deformation caused by oscillatory shear are
discussed. In the next chapter (Chapter 5) flow behaviour upon the application of steady
shear is discussed.
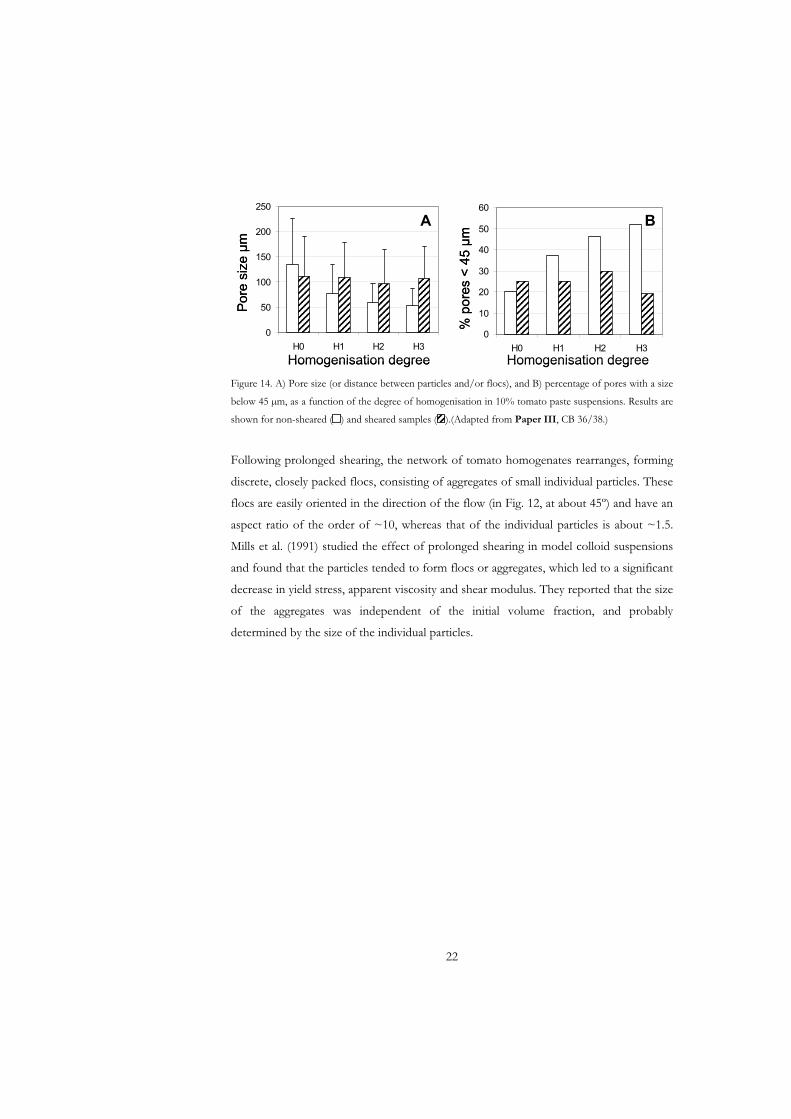
An overview of the rheological measurements performed and the type of measurement
system used in each of the studies is given in Table 4.
Table 4. Overview of the rheological measurements reported in Papers I-IV. The type of geometries used
in each study is also given.
Paper I Paper II Paper III Paper IV
Geometries used
Concentric cylinder - - - +
Vane + + + +
Outer vane - - - +
Tube viscometer - - - +
Measurements
Flow curve + + - +
Creep - + - -
Dynamic + - + +
Yield stress + + - +
4.1 Dynamic oscillatory rheology
A common way of investigating the microstructure of complex fluids is the application
of small-amplitude oscillatory shearing, which does not significantly deform the
microstructure of the fluid being tested. Most food materials are considered to be
23
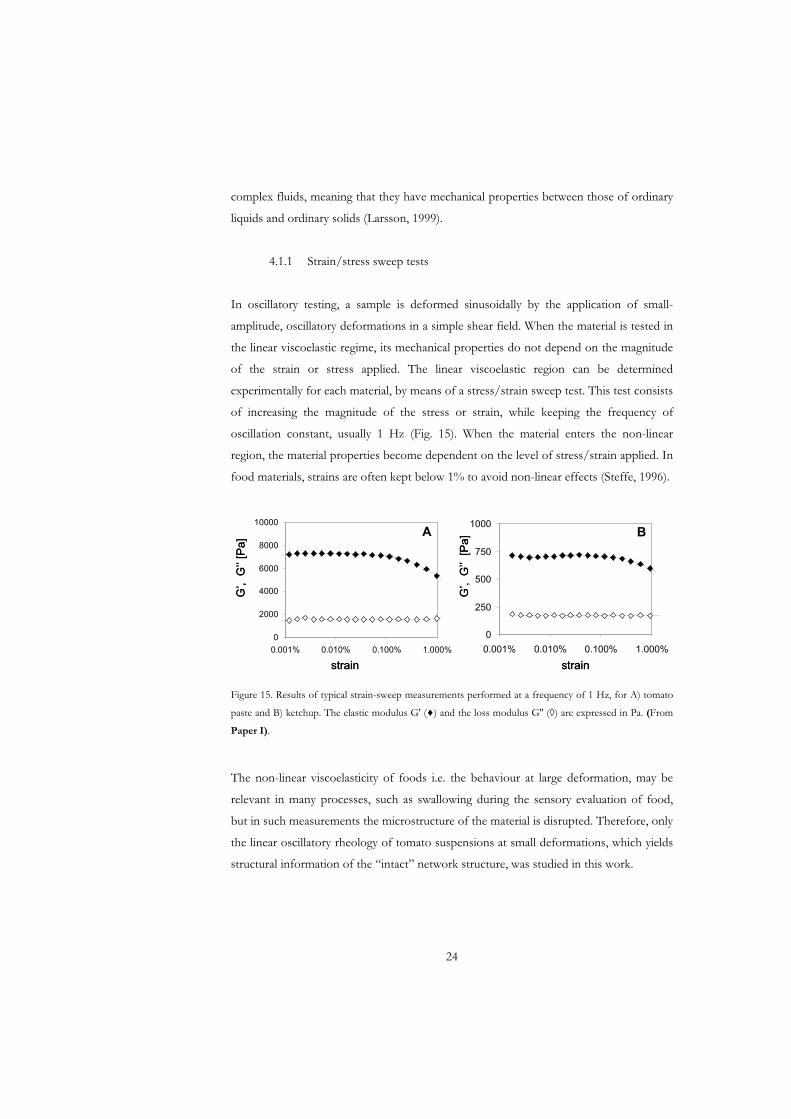
complex fluids, meaning that they have mechanical properties between those of ordinary
liquids and ordinary solids (Larsson, 1999).
4.1.1 Strain/stress sweep tests
In oscillatory testing, a sample is deformed sinusoidally by the application of small-
amplitude, oscillatory deformations in a simple shear field. When the material is tested in
the linear viscoelastic regime, its mechanical properties do not depend on the magnitude
of the strain or stress applied. The linear viscoelastic region can be determined
experimentally for each material, by means of a stress/strain sweep test. This test consists
of increasing the magnitude of the stress or strain, while keeping the frequency of
oscillation constant, usually 1 Hz (Fig. 15). When the material enters the non-linear
region, the material properties become dependent on the level of stress/strain applied. In
food materials, strains are often kept below 1% to avoid non-linear effects (Steffe, 1996).
0
2000
4000
6000
8000
10000
0.001% 0.010% 0.100% 1.000%
0
250
500
750
1000
0.001% 0.010% 0.100% 1.000%
strain strain
G’,
G’’
[Pa]
G’,
G’’
[Pa]
A B
0
2000
4000
6000
8000
10000
0.001% 0.010% 0.100% 1.000%
0
250
500
750
1000
0.001% 0.010% 0.100% 1.000%
strain strain
G’,
G’’
[Pa]
G’,
G’’
[Pa]
A B
Figure 15. Results of typical strain-sweep measurements performed at a frequency of 1 Hz, for A) tomato
paste and B) ketchup. The elastic modulus G' ( ) and the loss modulus G'' ( ) are expressed in Pa. (From
Paper I).
The non-linear viscoelasticity of foods i.e. the behaviour at large deformation, may be
relevant in many processes, such as swallowing during the sensory evaluation of food,
but in such measurements the microstructure of the material is disrupted. Therefore, only
the linear oscillatory rheology of tomato suspensions at small deformations, which yields
structural information of the “intact” network structure, was studied in this work.
24
In the linear region, the sinusoidally varying stress ( ) can be written:
tGtGt sin''sin'0 (3)
where is the frequency of oscillation, and 'G is the storage or elastic modulus, and
is the loss modulus. For solid-like materials ' , whereas for liquid-like
materials G <<G . The complex modulus, , is defined by '
''G '' GG
*G ''* iGGG , and the
complex viscosity is thus defined by ** G .
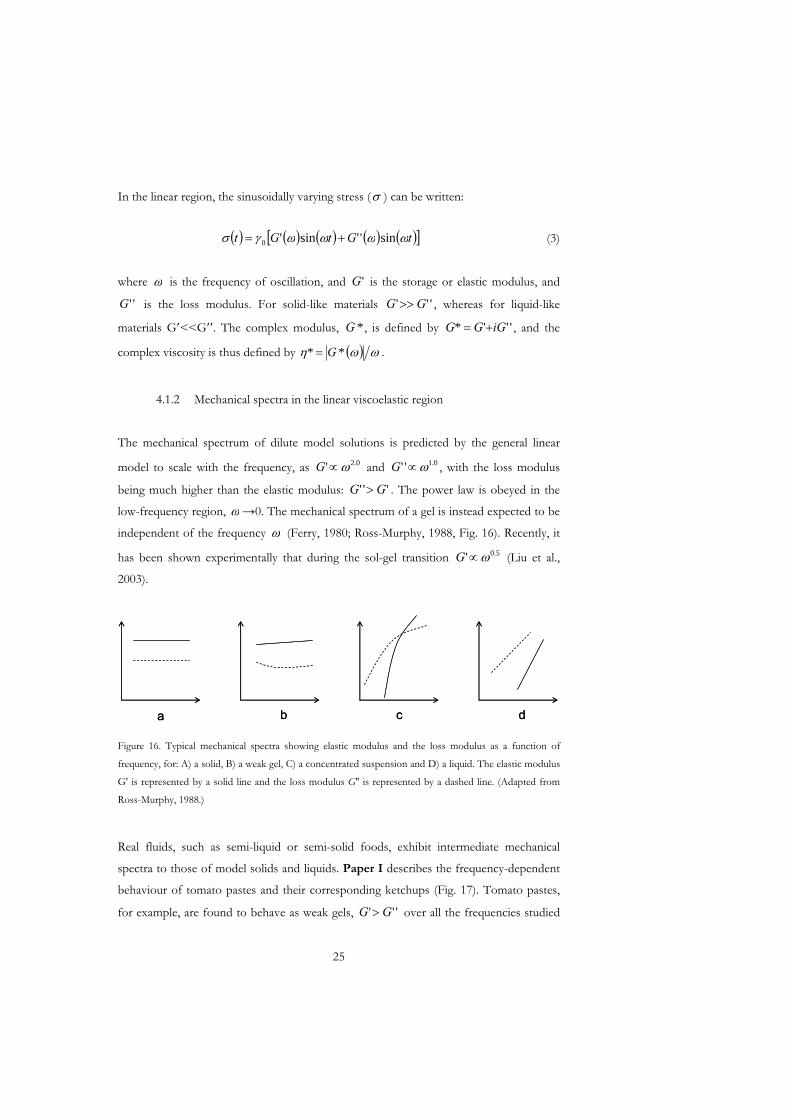
4.1.2 Mechanical spectra in the linear viscoelastic region
The mechanical spectrum of dilute model solutions is predicted by the general linear
model to scale with the frequency, as and , with the loss modulus
being much higher than the elastic modulus: . The power law is obeyed in the
low-frequency region,
0.2'G 0.1''G
''' GG
0. The mechanical spectrum of a gel is instead expected to be
independent of the frequency (Ferry, 1980; Ross-Murphy, 1988, Fig. 16). Recently, it
has been shown experimentally that during the sol-gel transition (Liu et al.,
2003).
5.0'G
a b c da b c d
Figure 16. Typical mechanical spectra showing elastic modulus and the loss modulus as a function of
frequency, for: A) a solid, B) a weak gel, C) a concentrated suspension and D) a liquid. The elastic modulus
G' is represented by a solid line and the loss modulus G'' is represented by a dashed line. (Adapted from
Ross-Murphy, 1988.)
Real fluids, such as semi-liquid or semi-solid foods, exhibit intermediate mechanical
spectra to those of model solids and liquids. Paper I describes the frequency-dependent
behaviour of tomato pastes and their corresponding ketchups (Fig. 17). Tomato pastes,
for example, are found to behave as weak gels, over all the frequencies studied ''' GG
25
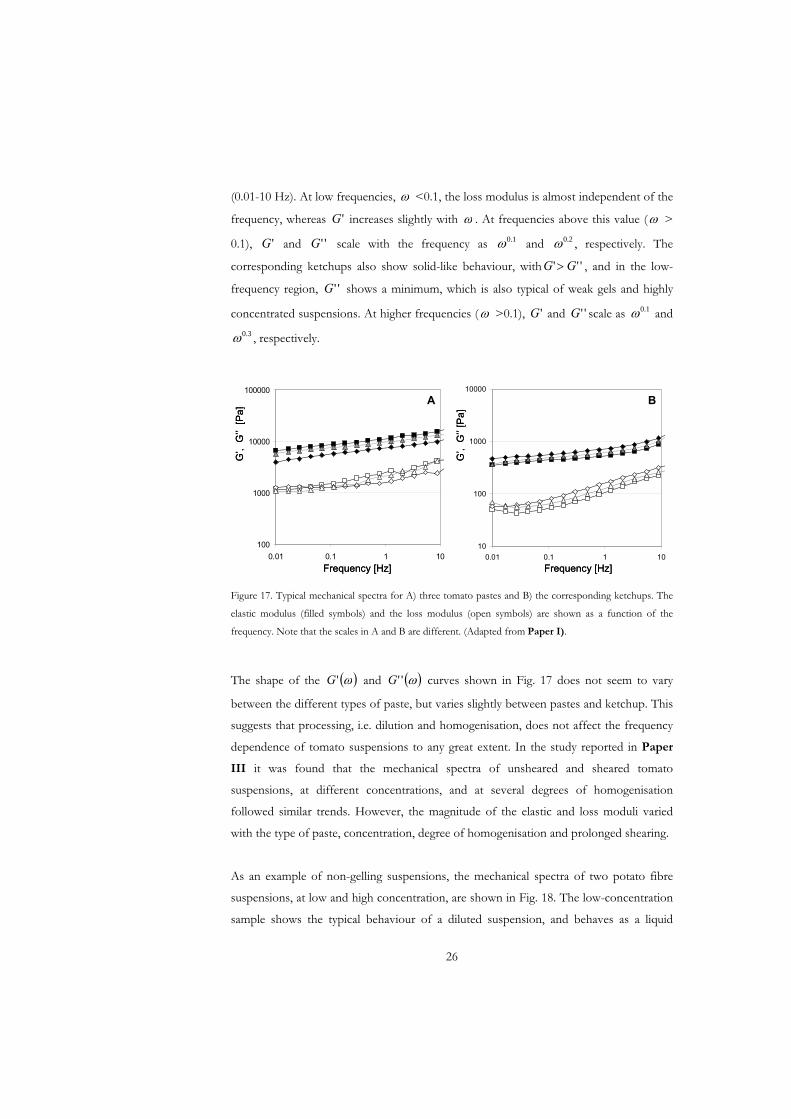
(0.01-10 Hz). At low frequencies, <0.1, the loss modulus is almost independent of the
frequency, whereas 'G increases slightly with . At frequencies above this value ( >
0.1), ' and scale with the frequency as and , respectively. The
corresponding ketchups also show solid-like behaviour, with , and in the low-
frequency region, shows a minimum, which is also typical of weak gels and highly
concentrated suspensions. At higher frequencies (
G ''G 1.0 2.0
''' GG
''G
>0.1), and scale as and
, respectively.
'G ''G 1.0
3.0
10
100
1000
10000
0.01 0.1 1 10100
1000
10000
100000
0.01 1 10
G’,
G’’
[Pa]
G’,
G’’
[Pa]
A B
quency [Hz] Frequency [Hz]0.1Fre
10
100
1000
10000
0.01 0.1 1 10100
1000
10000
100000
0.01 1 10
G’,
G’’
[Pa]
G’,
G’’
[Pa]
A B
quency [Hz] Frequency [Hz]0.1Fre
Figure 17. Typical mechanical spectra for A) three tomato pastes and B) the corresponding ketchups. The
elastic modulus (filled symbols) and the loss modulus (open symbols) are shown as a function of the
frequency. Note that the scales in A and B are different. (Adapted from Paper I).
The shape of the 'G and ''G curves shown in Fig. 17 does not seem to vary
between the different types of paste, but varies slightly between pastes and ketchup. This
suggests that processing, i.e. dilution and homogenisation, does not affect the frequency
dependence of tomato suspensions to any great extent. In the study reported in Paper
III it was found that the mechanical spectra of unsheared and sheared tomato
suspensions, at different concentrations, and at several degrees of homogenisation
followed similar trends. However, the magnitude of the elastic and loss moduli varied
with the type of paste, concentration, degree of homogenisation and prolonged shearing.
As an example of non-gelling suspensions, the mechanical spectra of two potato fibre
suspensions, at low and high concentration, are shown in Fig. 18. The low-concentration
sample shows the typical behaviour of a diluted suspension, and behaves as a liquid
26
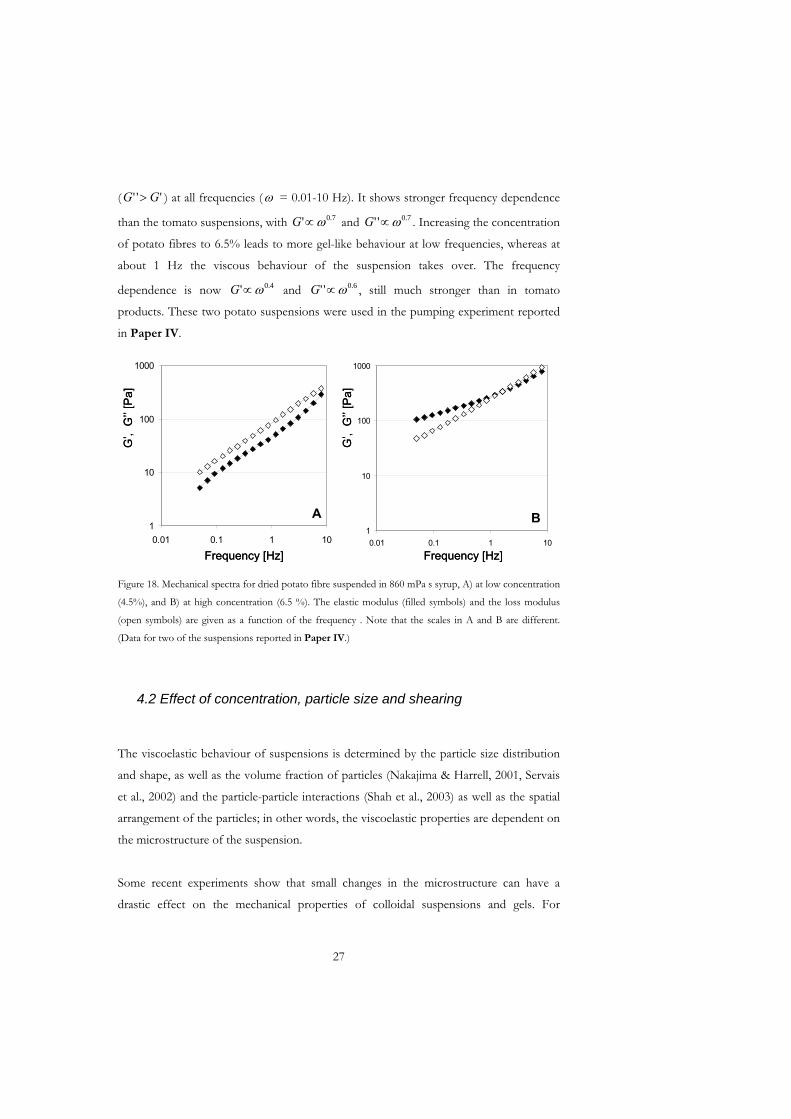
( ) at all frequencies (''' GG = 0.01-10 Hz). It shows stronger frequency dependence
than the tomato suspensions, with and . Increasing the concentration
of potato fibres to 6.5% leads to more gel-like behaviour at low frequencies, whereas at
about 1 Hz the viscous behaviour of the suspension takes over. The frequency
dependence is now and , still much stronger than in tomato
products. These two potato suspensions were used in the pumping experiment reported
in Paper IV.
7.0'G 7.0''G
4.0'G 6.0''G
1
10
100
1000
0.01 0.1 1 10
1
10
100
1000
0.01 0.1 1 10
G’,
G’’
[Pa]
G’,
G’’
[Pa]
A B
Frequency [Hz] Frequency [Hz]
1
10
100
1000
0.01 0.1 1 10
1
10
100
1000
0.01 0.1 1 10
G’,
G’’
[Pa]
G’,
G’’
[Pa]
A B
Frequency [Hz] Frequency [Hz]
Figure 18. Mechanical spectra for dried potato fibre suspended in 860 mPa s syrup, A) at low concentration
(4.5%), and B) at high concentration (6.5 %). The elastic modulus (filled symbols) and the loss modulus
(open symbols) are given as a function of the frequency . Note that the scales in A and B are different.
(Data for two of the suspensions reported in Paper IV.)
4.2 Effect of concentration, particle size and shearing
The viscoelastic behaviour of suspensions is determined by the particle size distribution
and shape, as well as the volume fraction of particles (Nakajima & Harrell, 2001, Servais
et al., 2002) and the particle-particle interactions (Shah et al., 2003) as well as the spatial
arrangement of the particles; in other words, the viscoelastic properties are dependent on
the microstructure of the suspension.
Some recent experiments show that small changes in the microstructure can have a
drastic effect on the mechanical properties of colloidal suspensions and gels. For
27
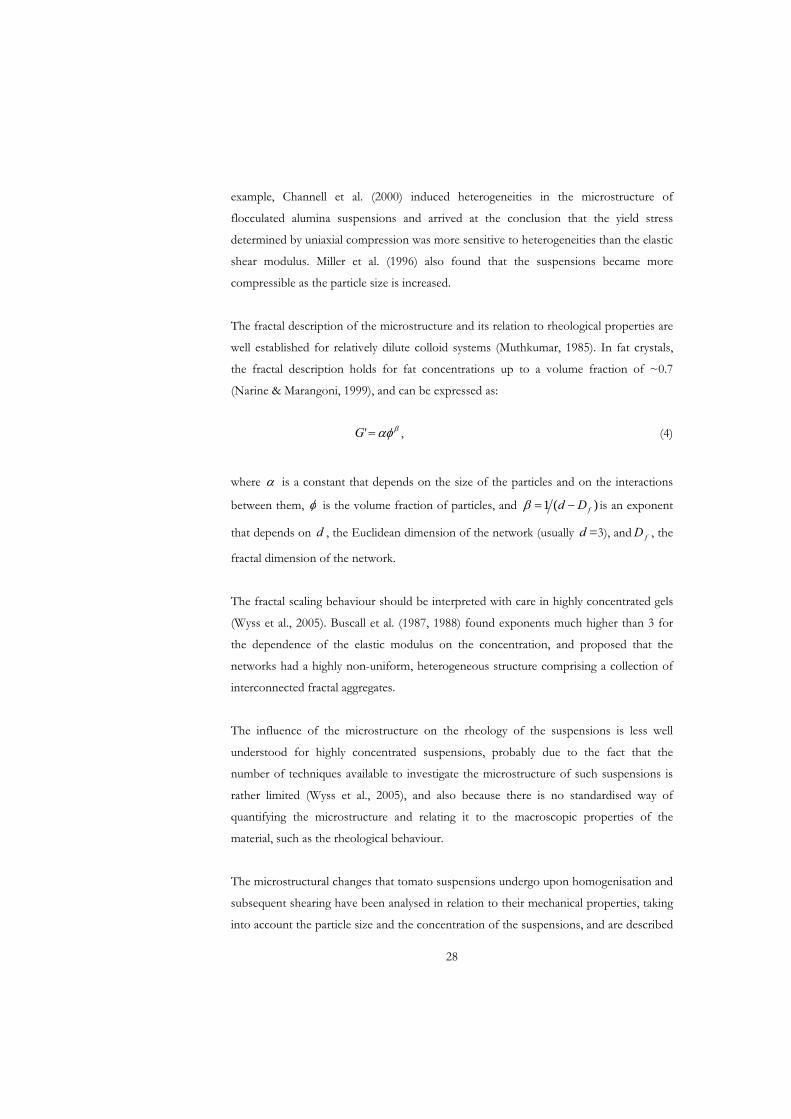
example, Channell et al. (2000) induced heterogeneities in the microstructure of
flocculated alumina suspensions and arrived at the conclusion that the yield stress
determined by uniaxial compression was more sensitive to heterogeneities than the elastic
shear modulus. Miller et al. (1996) also found that the suspensions became more
compressible as the particle size is increased.
The fractal description of the microstructure and its relation to rheological properties are
well established for relatively dilute colloid systems (Muthkumar, 1985). In fat crystals,
the fractal description holds for fat concentrations up to a volume fraction of ~0.7
(Narine & Marangoni, 1999), and can be expressed as:
'G , (4)
where is a constant that depends on the size of the particles and on the interactions
between them, is the volume fraction of particles, and )(1 fDd is an exponent
that depends on , the Euclidean dimension of the network (usually =3), and , the
fractal dimension of the network.
d d fD
The fractal scaling behaviour should be interpreted with care in highly concentrated gels
(Wyss et al., 2005). Buscall et al. (1987, 1988) found exponents much higher than 3 for
the dependence of the elastic modulus on the concentration, and proposed that the
networks had a highly non-uniform, heterogeneous structure comprising a collection of
interconnected fractal aggregates.
The influence of the microstructure on the rheology of the suspensions is less well
understood for highly concentrated suspensions, probably due to the fact that the
number of techniques available to investigate the microstructure of such suspensions is
rather limited (Wyss et al., 2005), and also because there is no standardised way of
quantifying the microstructure and relating it to the macroscopic properties of the
material, such as the rheological behaviour.
The microstructural changes that tomato suspensions undergo upon homogenisation and
subsequent shearing have been analysed in relation to their mechanical properties, taking
into account the particle size and the concentration of the suspensions, and are described
28
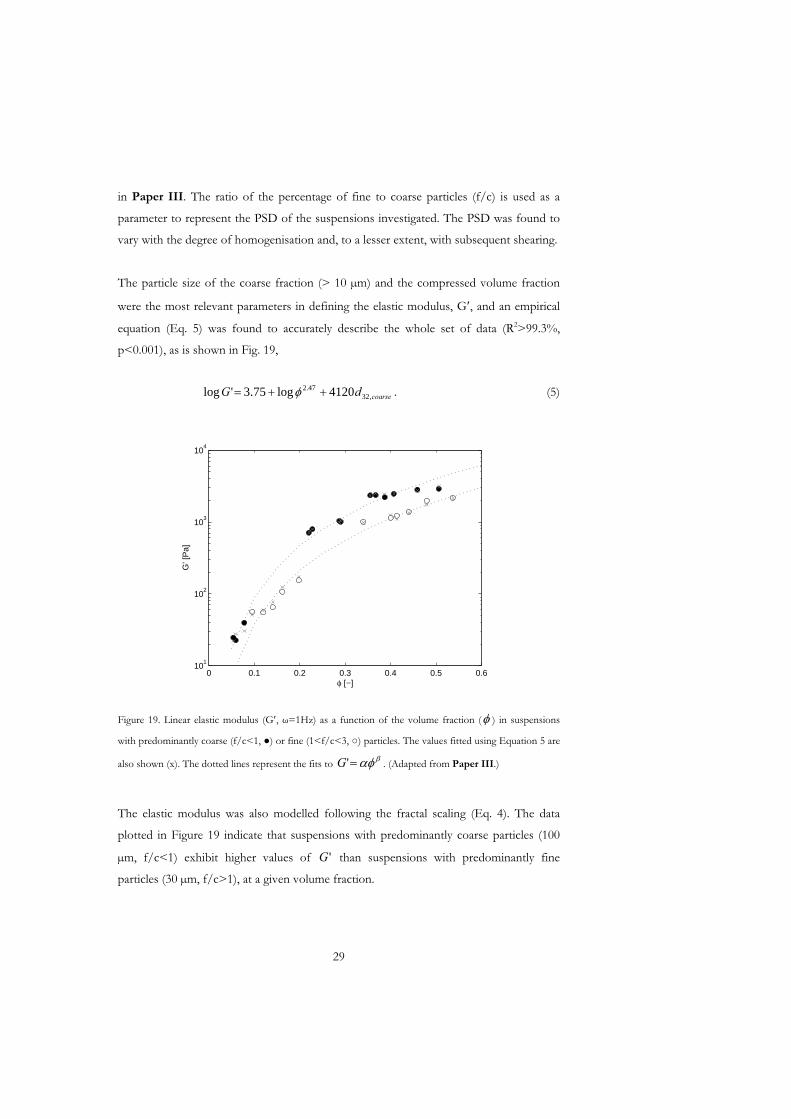
in Paper III. The ratio of the percentage of fine to coarse particles (f/c) is used as a
parameter to represent the PSD of the suspensions investigated. The PSD was found to
vary with the degree of homogenisation and, to a lesser extent, with subsequent shearing.
The particle size of the coarse fraction (> 10 μm) and the compressed volume fraction
were the most relevant parameters in defining the elastic modulus, G , and an empirical
equation (Eq. 5) was found to accurately describe the whole set of data (R2>99.3%,
p<0.001), as is shown in Fig. 19,
coarsedG ,3247.2 4120log75.3'log . (5)
0 0.1 0.2 0.3 0.4 0.5 0.610
1
102
103
104
φ [−]
G’ [
Pa]
Figure 19. Linear elastic modulus (G , =1Hz) as a function of the volume fraction ( ) in suspensions
with predominantly coarse (f/c<1, ) or fine (1<f/c<3, ) particles. The values fitted using Equation 5 are
also shown (x). The dotted lines represent the fits to . (Adapted from Paper III.)'G
The elastic modulus was also modelled following the fractal scaling (Eq. 4). The data
plotted in Figure 19 indicate that suspensions with predominantly coarse particles (100
μm, f/c<1) exhibit higher values of 'G than suspensions with predominantly fine
particles (30 μm, f/c>1), at a given volume fraction.
29
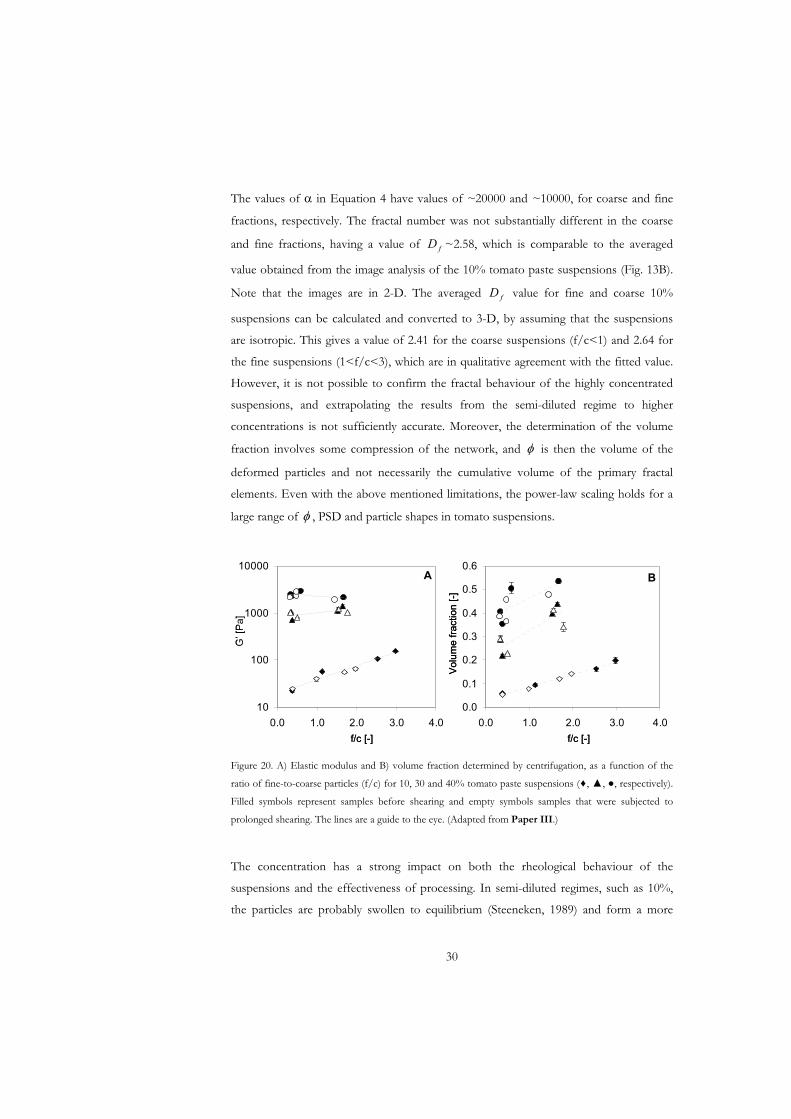
The values of in Equation 4 have values of ~20000 and ~10000, for coarse and fine
fractions, respectively. The fractal number was not substantially different in the coarse
and fine fractions, having a value of ~2.58, which is comparable to the averaged
value obtained from the image analysis of the 10% tomato paste suspensions (Fig. 13B).
Note that the images are in 2-D. The averaged value for fine and coarse 10%
suspensions can be calculated and converted to 3-D, by assuming that the suspensions
are isotropic. This gives a value of 2.41 for the coarse suspensions (f/c<1) and 2.64 for
the fine suspensions (1<f/c<3), which are in qualitative agreement with the fitted value.
However, it is not possible to confirm the fractal behaviour of the highly concentrated
suspensions, and extrapolating the results from the semi-diluted regime to higher
concentrations is not sufficiently accurate. Moreover, the determination of the volume
fraction involves some compression of the network, and
fD
fD
is then the volume of the
deformed particles and not necessarily the cumulative volume of the primary fractal
elements. Even with the above mentioned limitations, the power-law scaling holds for a
large range of , PSD and particle shapes in tomato suspensions.
10
100
1000
10000
0.0 1.0 2.0 3.0 4.00.0
0.1
0.2
0.3
0.4
0.5
0.6
0.0 1.0 2.0 3.0 4.
G’[
Pa]
f/c [-] f/c [-]
A B
Vol
ume
fract
ion
[-]
010
100
1000
10000
0.0 1.0 2.0 3.0 4.00.0
0.1
0.2
0.3
0.4
0.5
0.6
0.0 1.0 2.0 3.0 4.
G’[
Pa]
f/c [-] f/c [-]
A B
Vol
ume
fract
ion
[-]
0
Figure 20. A) Elastic modulus and B) volume fraction determined by centrifugation, as a function of the
ratio of fine-to-coarse particles (f/c) for 10, 30 and 40% tomato paste suspensions ( , , , respectively).
Filled symbols represent samples before shearing and empty symbols samples that were subjected to
prolonged shearing. The lines are a guide to the eye. (Adapted from Paper III.)
The concentration has a strong impact on both the rheological behaviour of the
suspensions and the effectiveness of processing. In semi-diluted regimes, such as 10%,
the particles are probably swollen to equilibrium (Steeneken, 1989) and form a more
30
heterogeneous network consisting of a collection of particles or aggregates/flocs, with
large pores in between (Fig. 13A). The rheological properties (G ) of this type of
suspension depend linearly on f/c, whereas this does not seem to be the case for more
concentrated suspensions, being more independent of f/c (Fig. 20A). The results of the
present work suggest that the 30 and 40% tomato paste suspensions instead form a
continuous particulate network, where the particles fill the available space and are
probably not swollen to equilibrium, but exist as more deformed particles
The volume fraction was found to be more sensitive to changes in the microstructure of
highly concentrated suspensions than the elastic modulus (Fig. 20B). The reason for this
could be that the deformability of the particles comes more into play in more
concentrated suspensions, as pointed out by Steeneken (1989). The deformability of the
particles is a key parameter in explaining why the presence of heterogeneities in the
microstructure could be measured using compressive yield stress (by centrifugation),
while the shear modulus could not differentiate between different types of
microstructures according to Channell et al. (2000). In the present study, large particles,
aggregates or flocs, and large pores or voids in the network caused heterogeneities in the
microstructure of the suspensions. Since the volume fraction was determined by
ultracentrifugation, i.e. uniaxial compression at a given speed (~110,000 g), it could be
affected by the compressive strength of the different networks, i.e. by the heterogeneities
induced by homogenisation and subsequent shearing. However, those changes
introduced by processing may not alter the number of junction points in the network,
especially in the more concentrated suspensions where particles are physically touching
each other and filling the spaces, thus giving similar 'G values in the dynamic shear
measurements.
31

5. Flow Behaviour of Concentrated Suspensions
The flow behaviour of the materials can be described by rheological models. Rheological
models describe the relationship between the shear stress ( ) and the shear rate ( ).
Newtonian fluids show a linear relationship between these variables, while non-
Newtonian fluids exhibit a non-linear dependence.
)( (6)
Tomato products exhibit pronounced non-Newtonian effects, e.g. yield stress, shear-
thinning behaviour and shear history dependence (Rao, 1999). The rheological properties
of tomato products have been described using the popular power-law equation or, when
the yield stress is taken into account, the Bingham, Herschel-Bulkley and/or Casson
models (Table 5). The applicability of each of these models depends on the range of
shear rates considered.
Table 5. Some typical rheological models used to describe the viscosity of tomato products
Power law nK Bingham y
Herschel Bulkley ny K Casson 5.05.05.05.0 Ky
5.1 Suspension rheology
The rheological behaviour of dilute suspensions and colloid dispersions, and some model
concentrated suspensions, is relatively well understood (Coussot & Ancey, 1999). Already
in the early 1900s, Einstein proposed that the viscosity of a dilute suspension of hard
spheres ( 0.03), assuming no interactions, was governed by
5.21s (7)
33
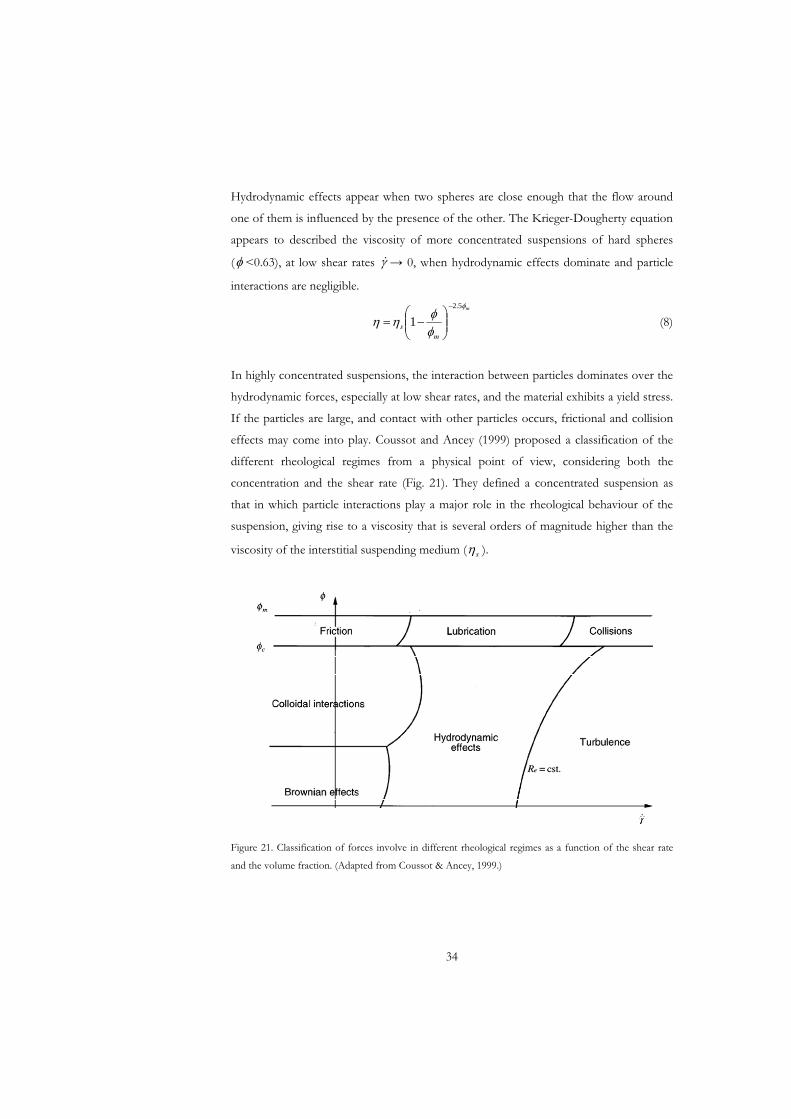
Hydrodynamic effects appear when two spheres are close enough that the flow around
one of them is influenced by the presence of the other. The Krieger-Dougherty equation
appears to described the viscosity of more concentrated suspensions of hard spheres
( <0.63), at low shear rates 0, when hydrodynamic effects dominate and particle
interactions are negligible. m
ms
5.2
1 (8)
In highly concentrated suspensions, the interaction between particles dominates over the
hydrodynamic forces, especially at low shear rates, and the material exhibits a yield stress.
If the particles are large, and contact with other particles occurs, frictional and collision
effects may come into play. Coussot and Ancey (1999) proposed a classification of the
different rheological regimes from a physical point of view, considering both the
concentration and the shear rate (Fig. 21). They defined a concentrated suspension as
that in which particle interactions play a major role in the rheological behaviour of the
suspension, giving rise to a viscosity that is several orders of magnitude higher than the
viscosity of the interstitial suspending medium ( s ).
Figure 21. Classification of forces involve in different rheological regimes as a function of the shear rate
and the volume fraction. (Adapted from Coussot & Ancey, 1999.)
34
It is also important to note that several practical difficulties are encountered in
rheological measurements of highly concentrated suspensions and gels, for example poor
reproducibility, sensitivity to shear history and to the preparation of samples, and slip
(Larsson, 1999; Kalyon, 2005). Up to 50% variability has been reported in the rheological
properties of wheat starch at high concentrations (Steeneken, 1989), and between 15 and
30% in the determination of yield stress in model colloidal suspensions (Buscall et al.,
1987). Measurements performed under similar experimental conditions, but in different
geometries, do not always agree (Plucinski et al., 1998), and hence the comparison
and/or prediction of rheological properties from one instrument to another is difficult.
In section 5.2, some considerations regarding measurement systems will be discussed.
5.1.1 Rheological behaviour of tomato products
Den Ouden (1995) reported viscosities of the supernatant of the order of ~20 mPa s for
HB tomato paste and ~4 mPa s for CB tomato paste, and claimed that the contribution
of the suspending medium to the apparent viscosity of tomato paste was very little, and
that the tomato particles and the fibre network accounted for the extremely high
apparent viscosities, especially at low shear rates. In the present work, the viscosity of the
suspending medium was below 7 mPa s for the CB suspensions and below 20 mPa s for
the diluted HB suspensions (Fig. 22).
The behaviour of the viscosity of the supernatant upon dilution is, however, markedly
different in hot and cold break suspensions, and while s resembles that of a sucrose
solution in CB samples, it increases much more steeply in HB samples. Note that the
viscosity of the supernatant in 100% HB paste is not included in Figure 22 because it
exhibits non-Newtonian behaviour, but for comparison, at =10 s-1, s ~300 mPa s, for
Brix degrees between 20 and 30. The main difference between hot and cold break
processing is that the former is carried out at high temperatures (> 85°C), while the latter
is only subjected to low temperatures (< 70°C). Low temperatures allow a certain degree
of pectin degradation because of the slow and incomplete inactivation of the enzymes
involved, i.e. pectin methyl esterase and polygalacturonase. Fito et al. (1983) reported that
the content of soluble pectins present in CB pastes was significantly lower than in HB
pastes, and several authors have suggested that the presence of soluble pectins is a key
35
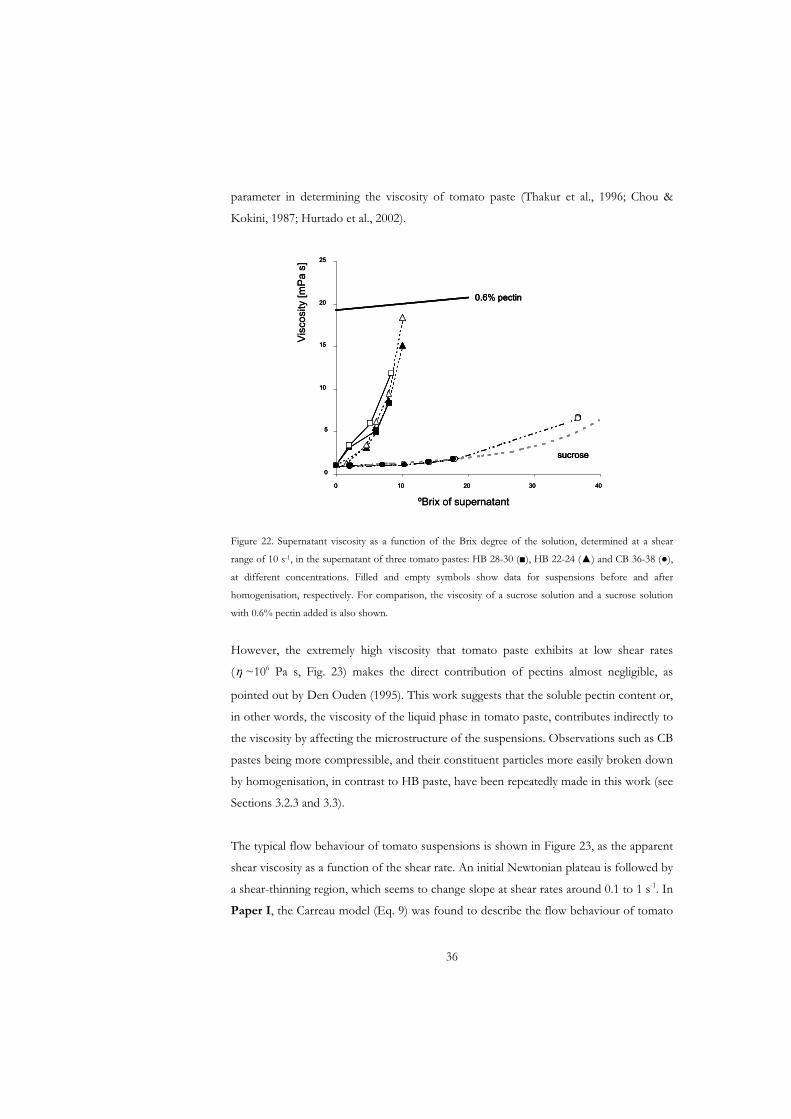
parameter in determining the viscosity of tomato paste (Thakur et al., 1996; Chou &
Kokini, 1987; Hurtado et al., 2002).
0.6% pectin
sucrose
0
5
10
15
20
25
0 10 20 30
Visc
osity
[mPa
s]
ºBrix of supernatant40
0.6% pectin
sucrose
0
5
10
15
20
25
0 10 20 30 40
0.6% pectin
sucrose
0
5
10
15
20
25
0 10 20 30
Visc
osity
[mPa
s]
ºBrix of supernatant40
Figure 22. Supernatant viscosity as a function of the Brix degree of the solution, determined at a shear
range of 10 s-1, in the supernatant of three tomato pastes: HB 28-30 ( ), HB 22-24 ( ) and CB 36-38 ( ),
at different concentrations. Filled and empty symbols show data for suspensions before and after
homogenisation, respectively. For comparison, the viscosity of a sucrose solution and a sucrose solution
with 0.6% pectin added is also shown.
However, the extremely high viscosity that tomato paste exhibits at low shear rates
( ~106 Pa s, Fig. 23) makes the direct contribution of pectins almost negligible, as
pointed out by Den Ouden (1995). This work suggests that the soluble pectin content or,
in other words, the viscosity of the liquid phase in tomato paste, contributes indirectly to
the viscosity by affecting the microstructure of the suspensions. Observations such as CB
pastes being more compressible, and their constituent particles more easily broken down
by homogenisation, in contrast to HB paste, have been repeatedly made in this work (see
Sections 3.2.3 and 3.3).
The typical flow behaviour of tomato suspensions is shown in Figure 23, as the apparent
shear viscosity as a function of the shear rate. An initial Newtonian plateau is followed by
a shear-thinning region, which seems to change slope at shear rates around 0.1 to 1 s-1. In
Paper I, the Carreau model (Eq. 9) was found to describe the flow behaviour of tomato
36
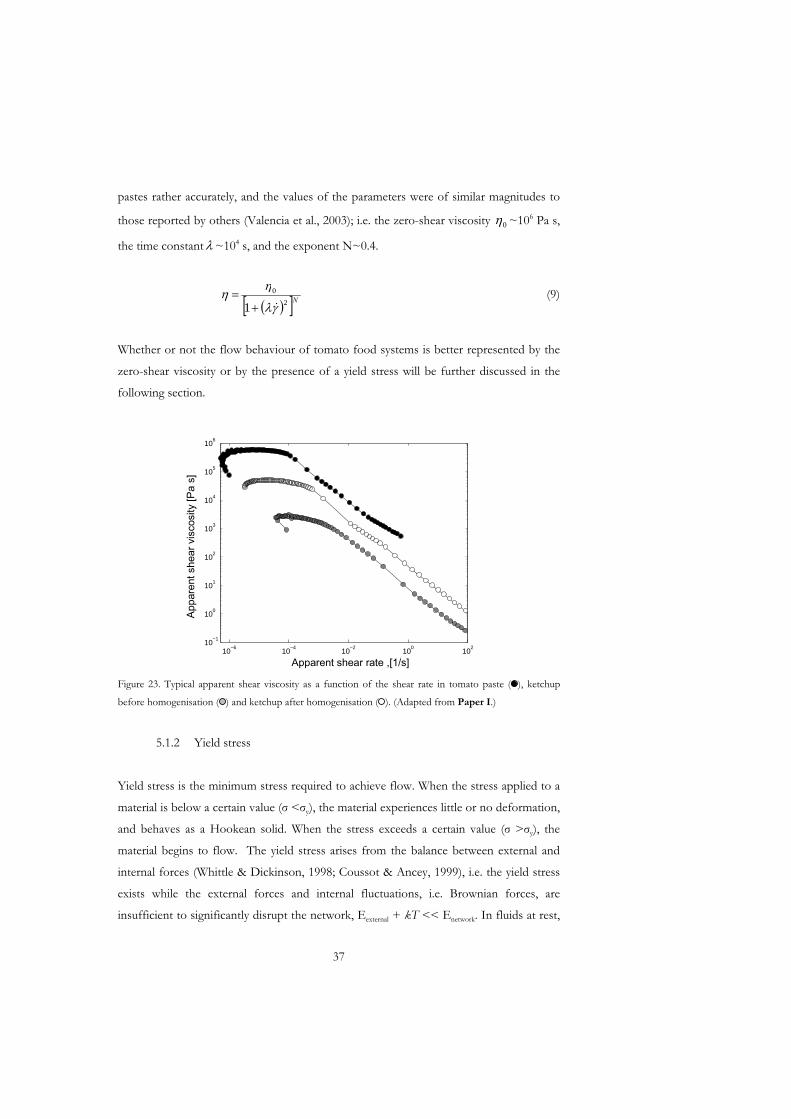
pastes rather accurately, and the values of the parameters were of similar magnitudes to
those reported by others (Valencia et al., 2003); i.e. the zero-shear viscosity 0 ~106 Pa s,
the time constant ~104 s, and the exponent N~0.4.
N2
0
1 (9)
Whether or not the flow behaviour of tomato food systems is better represented by the
zero-shear viscosity or by the presence of a yield stress will be further discussed in the
following section.
10−6
10−4
10−2
100
102
10−1
100
101
102
103
104
105
106
Apparent shear rate ,[1/s]
App
aren
t she
ar v
isco
sity
[Pa
s]
10−6
10−4
10−2
100
102
10−1
100
101
102
103
104
105
106
Apparent shear rate ,[1/s]
App
aren
t she
ar v
isco
sity
[Pa
s]
Figure 23. Typical apparent shear viscosity as a function of the shear rate in tomato paste ( ), ketchup
before homogenisation ( ) and ketchup after homogenisation ( ). (Adapted from Paper I.)
5.1.2 Yield stress
Yield stress is the minimum stress required to achieve flow. When the stress applied to a
material is below a certain value ( < y), the material experiences little or no deformation,
and behaves as a Hookean solid. When the stress exceeds a certain value ( > y), the
material begins to flow. The yield stress arises from the balance between external and
internal forces (Whittle & Dickinson, 1998; Coussot & Ancey, 1999), i.e. the yield stress
exists while the external forces and internal fluctuations, i.e. Brownian forces, are
insufficient to significantly disrupt the network, Eexternal + kT << Enetwork. In fluids at rest,
37
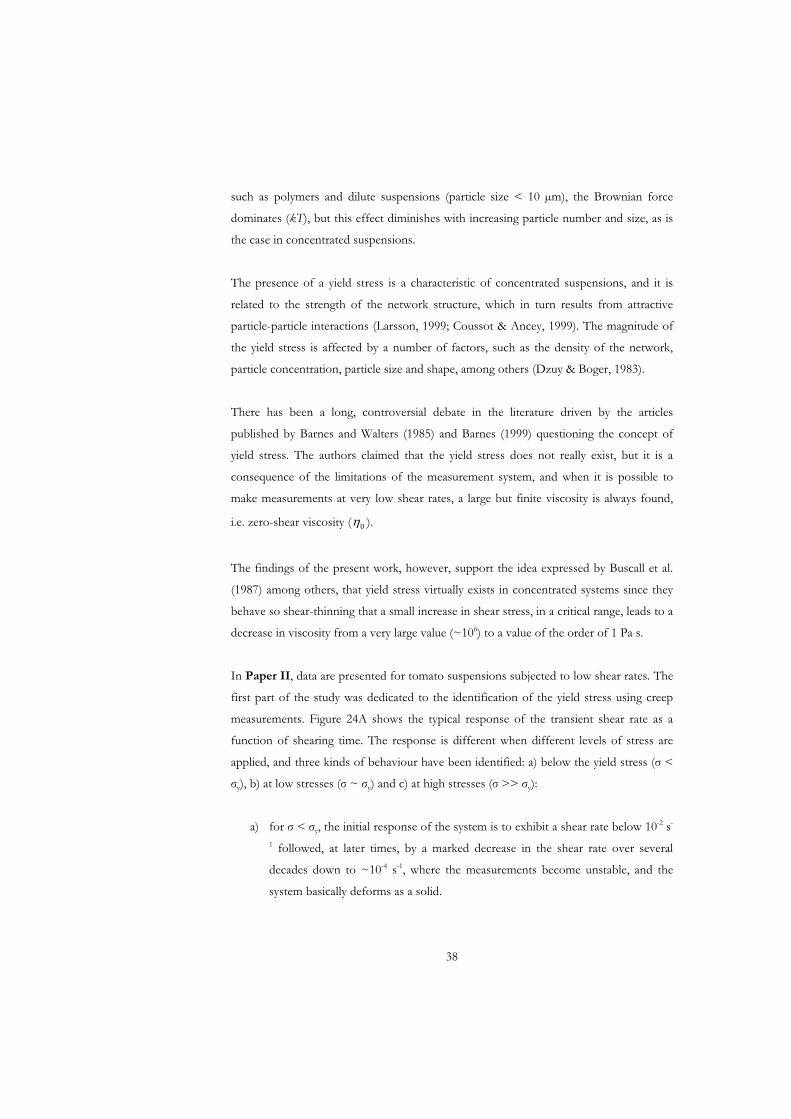
such as polymers and dilute suspensions (particle size < 10 μm), the Brownian force
dominates (kT), but this effect diminishes with increasing particle number and size, as is
the case in concentrated suspensions.
The presence of a yield stress is a characteristic of concentrated suspensions, and it is
related to the strength of the network structure, which in turn results from attractive
particle-particle interactions (Larsson, 1999; Coussot & Ancey, 1999). The magnitude of
the yield stress is affected by a number of factors, such as the density of the network,
particle concentration, particle size and shape, among others (Dzuy & Boger, 1983).
There has been a long, controversial debate in the literature driven by the articles
published by Barnes and Walters (1985) and Barnes (1999) questioning the concept of
yield stress. The authors claimed that the yield stress does not really exist, but it is a
consequence of the limitations of the measurement system, and when it is possible to
make measurements at very low shear rates, a large but finite viscosity is always found,
i.e. zero-shear viscosity ( 0 ).
The findings of the present work, however, support the idea expressed by Buscall et al.
(1987) among others, that yield stress virtually exists in concentrated systems since they
behave so shear-thinning that a small increase in shear stress, in a critical range, leads to a
decrease in viscosity from a very large value (~106) to a value of the order of 1 Pa s.
In Paper II, data are presented for tomato suspensions subjected to low shear rates. The
first part of the study was dedicated to the identification of the yield stress using creep
measurements. Figure 24A shows the typical response of the transient shear rate as a
function of shearing time. The response is different when different levels of stress are
applied, and three kinds of behaviour have been identified: a) below the yield stress ( <
y), b) at low stresses ( ~ y) and c) at high stresses ( >> y):
a) for < y, the initial response of the system is to exhibit a shear rate below 10-2 s-
1 followed, at later times, by a marked decrease in the shear rate over several
decades down to ~10-4 s-1, where the measurements become unstable, and the
system basically deforms as a solid.
38
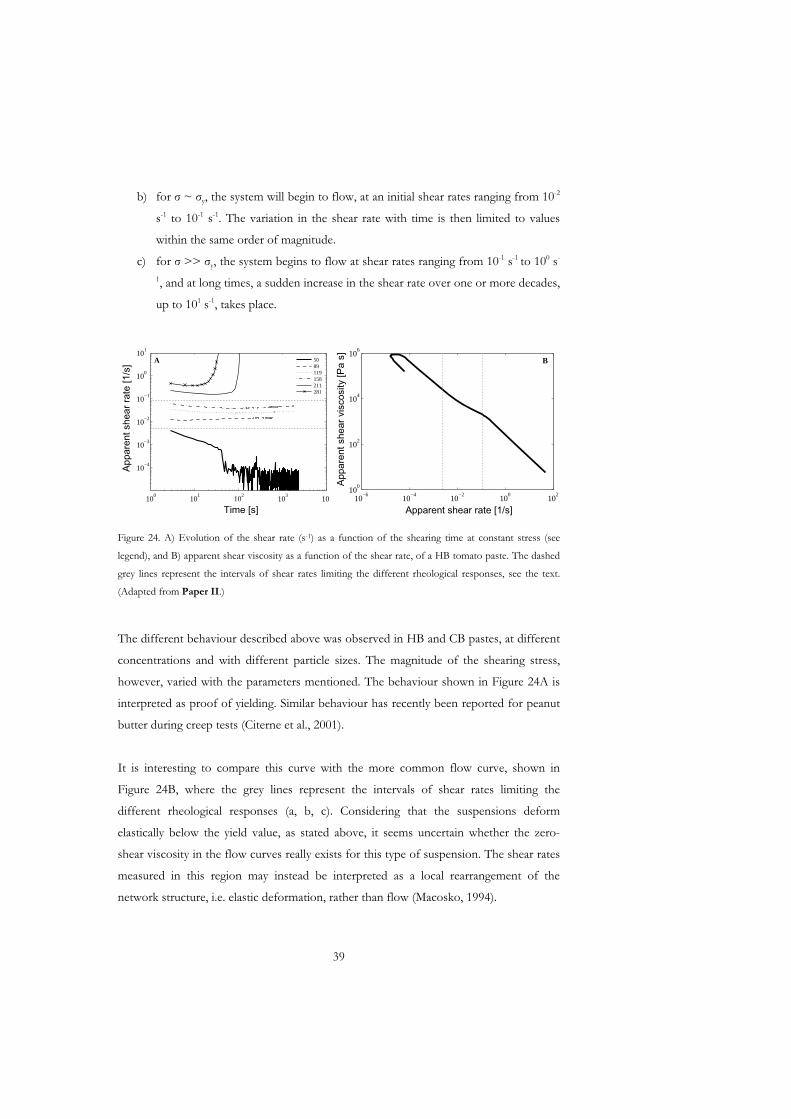
b) for ~ y, the system will begin to flow, at an initial shear rates ranging from 10-2
s-1 to 10-1 s-1. The variation in the shear rate with time is then limited to values
within the same order of magnitude.
c) for >> y, the system begins to flow at shear rates ranging from 10-1 s-1 to 100 s-
1, and at long times, a sudden increase in the shear rate over one or more decades,
up to 101 s-1, takes place.
100
101
102
103
104
10−4
10−3
10−2
10−1
100
101
t [s]
dγ
/d t
[1/s
]
5089119158211281
A
10−6
10−4
10−2
100
102
100
102
104
106
η [
Pa s
]
dγ/dt [1/s]
B
Time [s] Apparent shear rate [1/s]
Appa
rent
she
ar ra
te [1
/s]
App
aren
t she
ar v
isco
sity
[Pa
s]
100
101
102
103
104
10−4
10−3
10−2
10−1
100
101
t [s]
dγ
/d t
[1/s
]
5089119158211281
A
10−6
10−4
10−2
100
102
100
102
104
106
η [
Pa s
]
dγ/dt [1/s]
B
100
101
102
103
104
10−4
10−3
10−2
10−1
100
101
t [s]
dγ
/d t
[1/s
]
5089119158211281
A
10−6
10−4
10−2
100
102
100
102
104
106
η [
Pa s
]
dγ/dt [1/s]
B
Time [s] Apparent shear rate [1/s]
Appa
rent
she
ar ra
te [1
/s]
App
aren
t she
ar v
isco
sity
[Pa
s]
Figure 24. A) Evolution of the shear rate (s-1) as a function of the shearing time at constant stress (see
legend), and B) apparent shear viscosity as a function of the shear rate, of a HB tomato paste. The dashed
grey lines represent the intervals of shear rates limiting the different rheological responses, see the text.
(Adapted from Paper II.)
The different behaviour described above was observed in HB and CB pastes, at different
concentrations and with different particle sizes. The magnitude of the shearing stress,
however, varied with the parameters mentioned. The behaviour shown in Figure 24A is
interpreted as proof of yielding. Similar behaviour has recently been reported for peanut
butter during creep tests (Citerne et al., 2001).
It is interesting to compare this curve with the more common flow curve, shown in
Figure 24B, where the grey lines represent the intervals of shear rates limiting the
different rheological responses (a, b, c). Considering that the suspensions deform
elastically below the yield value, as stated above, it seems uncertain whether the zero-
shear viscosity in the flow curves really exists for this type of suspension. The shear rates
measured in this region may instead be interpreted as a local rearrangement of the
network structure, i.e. elastic deformation, rather than flow (Macosko, 1994).
39
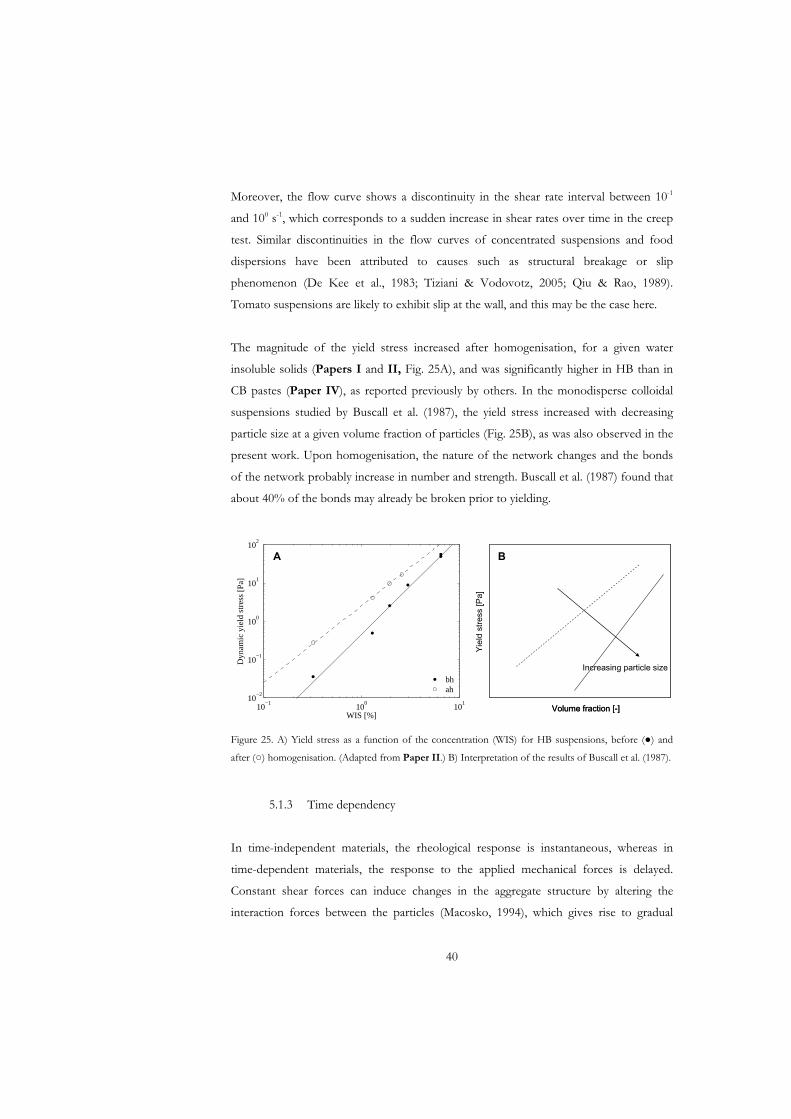
Moreover, the flow curve shows a discontinuity in the shear rate interval between 10-1
and 100 s-1, which corresponds to a sudden increase in shear rates over time in the creep
test. Similar discontinuities in the flow curves of concentrated suspensions and food
dispersions have been attributed to causes such as structural breakage or slip
phenomenon (De Kee et al., 1983; Tiziani & Vodovotz, 2005; Qiu & Rao, 1989).
Tomato suspensions are likely to exhibit slip at the wall, and this may be the case here.
The magnitude of the yield stress increased after homogenisation, for a given water
insoluble solids (Papers I and II, Fig. 25A), and was significantly higher in HB than in
CB pastes (Paper IV), as reported previously by others. In the monodisperse colloidal
suspensions studied by Buscall et al. (1987), the yield stress increased with decreasing
particle size at a given volume fraction of particles (Fig. 25B), as was also observed in the
present work. Upon homogenisation, the nature of the network changes and the bonds
of the network probably increase in number and strength. Buscall et al. (1987) found that
about 40% of the bonds may already be broken prior to yielding.
10−1
100
101
10−2
10−1
100
101
102
WIS [%]
Dyn
amic
yie
ld s
tres
s [P
a]
bhah
Yiel
d st
ress
[Pa]
Increasing particle size
A B
Volume fraction [-]10−1
100
101
10−2
10−1
100
101
102
WIS [%]
Dyn
amic
yie
ld s
tres
s [P
a]
bhah
Yiel
d st
ress
[Pa]
Increasing particle size
A B
Volume fraction [-]
Figure 25. A) Yield stress as a function of the concentration (WIS) for HB suspensions, before ( ) and
after ( ) homogenisation. (Adapted from Paper II.) B) Interpretation of the results of Buscall et al. (1987).
5.1.3 Time dependency
In time-independent materials, the rheological response is instantaneous, whereas in
time-dependent materials, the response to the applied mechanical forces is delayed.
Constant shear forces can induce changes in the aggregate structure by altering the
interaction forces between the particles (Macosko, 1994), which gives rise to gradual
40
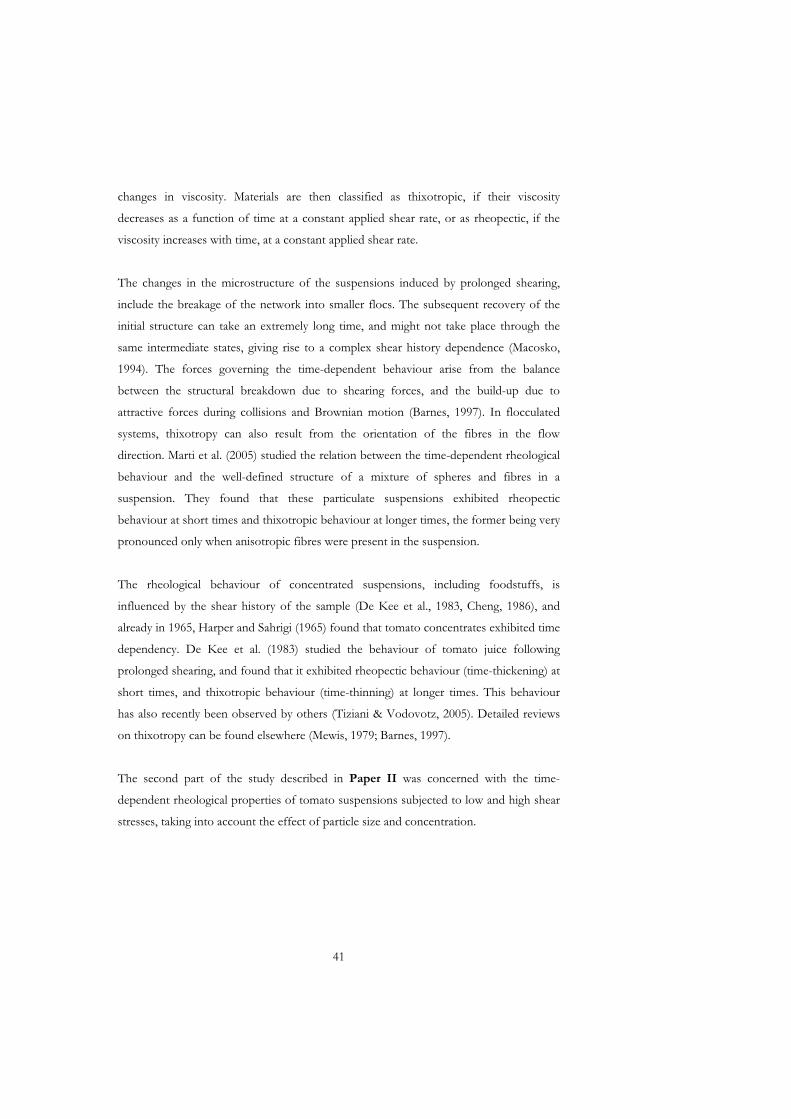
changes in viscosity. Materials are then classified as thixotropic, if their viscosity
decreases as a function of time at a constant applied shear rate, or as rheopectic, if the
viscosity increases with time, at a constant applied shear rate.
The changes in the microstructure of the suspensions induced by prolonged shearing,
include the breakage of the network into smaller flocs. The subsequent recovery of the
initial structure can take an extremely long time, and might not take place through the
same intermediate states, giving rise to a complex shear history dependence (Macosko,
1994). The forces governing the time-dependent behaviour arise from the balance
between the structural breakdown due to shearing forces, and the build-up due to
attractive forces during collisions and Brownian motion (Barnes, 1997). In flocculated
systems, thixotropy can also result from the orientation of the fibres in the flow
direction. Marti et al. (2005) studied the relation between the time-dependent rheological
behaviour and the well-defined structure of a mixture of spheres and fibres in a
suspension. They found that these particulate suspensions exhibited rheopectic
behaviour at short times and thixotropic behaviour at longer times, the former being very
pronounced only when anisotropic fibres were present in the suspension.
The rheological behaviour of concentrated suspensions, including foodstuffs, is
influenced by the shear history of the sample (De Kee et al., 1983, Cheng, 1986), and
already in 1965, Harper and Sahrigi (1965) found that tomato concentrates exhibited time
dependency. De Kee et al. (1983) studied the behaviour of tomato juice following
prolonged shearing, and found that it exhibited rheopectic behaviour (time-thickening) at
short times, and thixotropic behaviour (time-thinning) at longer times. This behaviour
has also recently been observed by others (Tiziani & Vodovotz, 2005). Detailed reviews
on thixotropy can be found elsewhere (Mewis, 1979; Barnes, 1997).
The second part of the study described in Paper II was concerned with the time-
dependent rheological properties of tomato suspensions subjected to low and high shear
stresses, taking into account the effect of particle size and concentration.
41
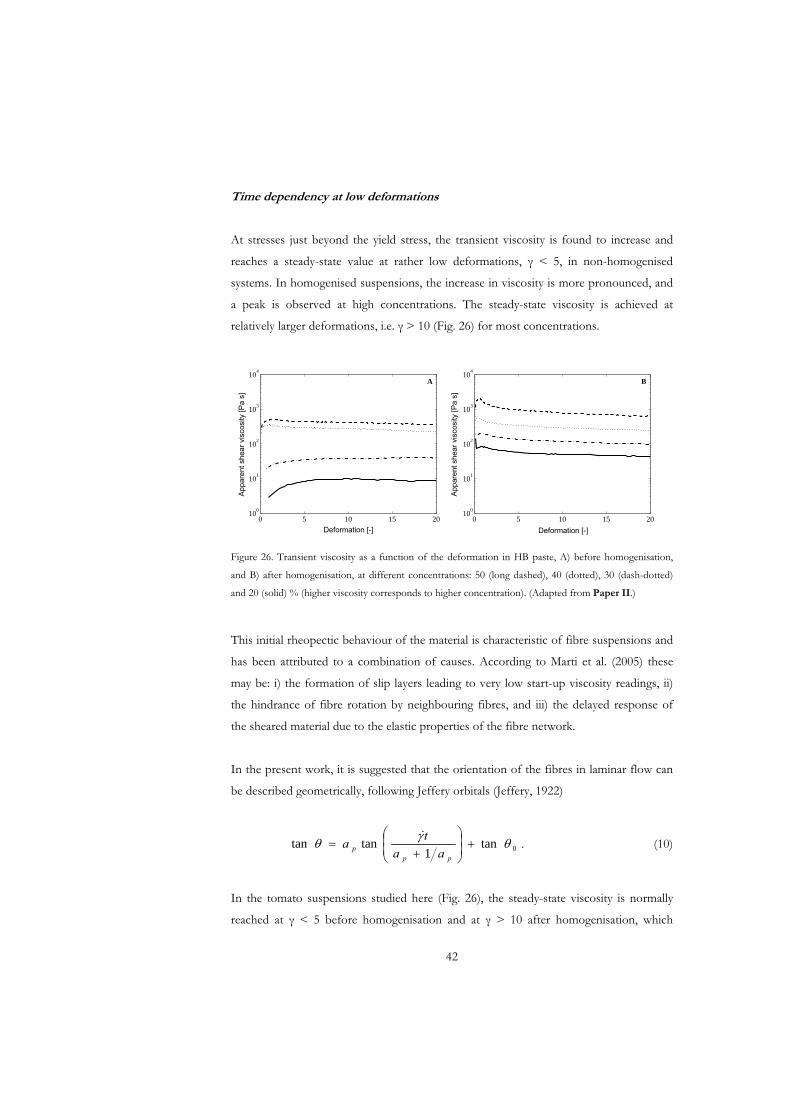
Time dependency at low deformations
At stresses just beyond the yield stress, the transient viscosity is found to increase and
reaches a steady-state value at rather low deformations, < 5, in non-homogenised
systems. In homogenised suspensions, the increase in viscosity is more pronounced, and
a peak is observed at high concentrations. The steady-state viscosity is achieved at
relatively larger deformations, i.e. > 10 (Fig. 26) for most concentrations.
0 5 10 15 2010
0
101
102
103
104
γ [−]
η [P
a.s]
A
0 5 10 15 2010
0
101
102
103
104
γ [−]
η [P
a.s]
B
Deformation [-] Deformation [-]
App
aren
t she
ar v
isco
sity
[Pa
s]
App
aren
t she
ar v
isco
sity
[Pa
s]
0 5 10 15 2010
0
101
102
103
104
γ [−]
η [P
a.s]
A
0 5 10 15 2010
0
101
102
103
104
γ [−]
η [P
a.s]
B
0 5 10 15 2010
0
101
102
103
104
γ [−]
η [P
a.s]
A
0 5 10 15 2010
0
101
102
103
104
γ [−]
η [P
a.s]
B
Deformation [-] Deformation [-]
App
aren
t she
ar v
isco
sity
[Pa
s]
App
aren
t she
ar v
isco
sity
[Pa
s]
Figure 26. Transient viscosity as a function of the deformation in HB paste, A) before homogenisation,
and B) after homogenisation, at different concentrations: 50 (long dashed), 40 (dotted), 30 (dash-dotted)
and 20 (solid) % (higher viscosity corresponds to higher concentration). (Adapted from Paper II.)
This initial rheopectic behaviour of the material is characteristic of fibre suspensions and
has been attributed to a combination of causes. According to Marti et al. (2005) these
may be: i) the formation of slip layers leading to very low start-up viscosity readings, ii)
the hindrance of fibre rotation by neighbouring fibres, and iii) the delayed response of
the sheared material due to the elastic properties of the fibre network.
In the present work, it is suggested that the orientation of the fibres in laminar flow can
be described geometrically, following Jeffery orbitals (Jeffery, 1922)
0tan1
tantanpp
p aata . (10)
In the tomato suspensions studied here (Fig. 26), the steady-state viscosity is normally
reached at < 5 before homogenisation and at > 10 after homogenisation, which
42
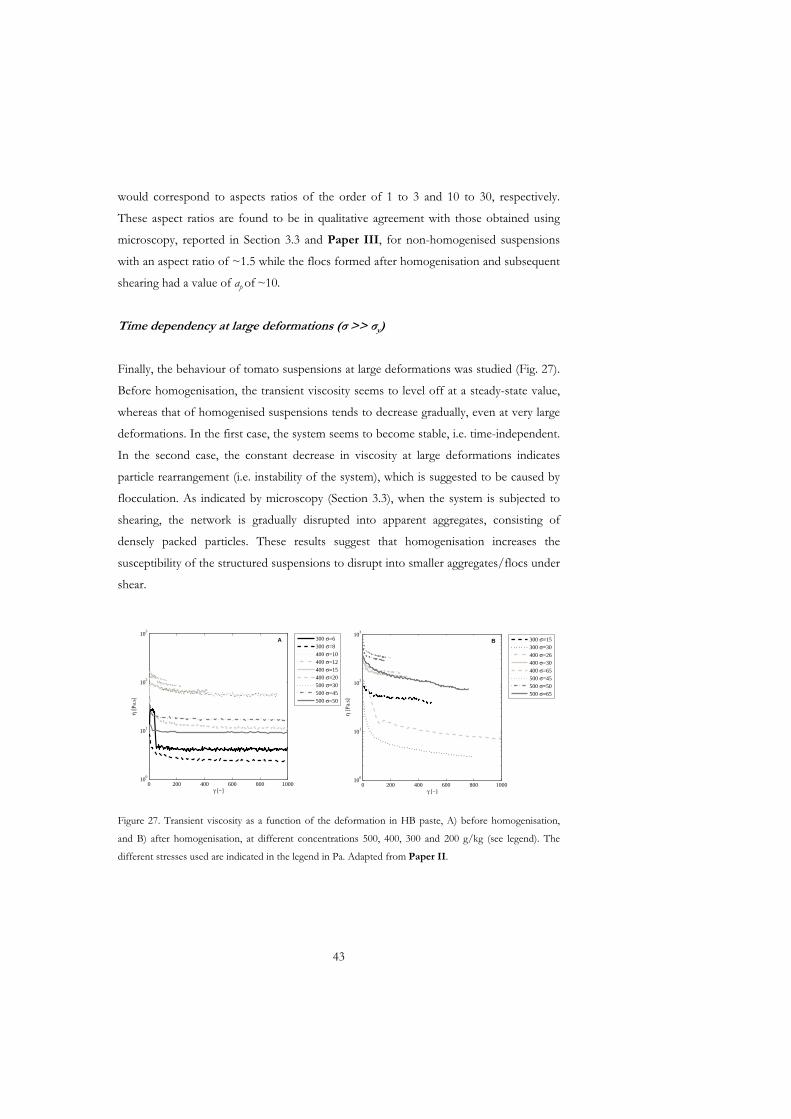
would correspond to aspects ratios of the order of 1 to 3 and 10 to 30, respectively.
These aspect ratios are found to be in qualitative agreement with those obtained using
microscopy, reported in Section 3.3 and Paper III, for non-homogenised suspensions
with an aspect ratio of ~1.5 while the flocs formed after homogenisation and subsequent
shearing had a value of ap of ~10.
Time dependency at large deformations ( >> y)
Finally, the behaviour of tomato suspensions at large deformations was studied (Fig. 27).
Before homogenisation, the transient viscosity seems to level off at a steady-state value,
whereas that of homogenised suspensions tends to decrease gradually, even at very large
deformations. In the first case, the system seems to become stable, i.e. time-independent.
In the second case, the constant decrease in viscosity at large deformations indicates
particle rearrangement (i.e. instability of the system), which is suggested to be caused by
flocculation. As indicated by microscopy (Section 3.3), when the system is subjected to
shearing, the network is gradually disrupted into apparent aggregates, consisting of
densely packed particles. These results suggest that homogenisation increases the
susceptibility of the structured suspensions to disrupt into smaller aggregates/flocs under
shear.
0 200 400 600 800 100010
0
101
102
103
γ [−]
η [P
a.s]
300 σ=15300 σ=30400 σ=26400 σ=30400 σ=65500 σ=45500 σ=50500 σ=65
B
0 200 400 600 800 100010
0
101
102
103
γ [−]
η [P
a.s]
300 σ=6300 σ=8400 σ=10400 σ=12400 σ=15400 σ=20500 σ=30500 σ=45500 σ=50
A
0 200 400 600 800 100010
0
101
102
103
γ [−]
η [P
a.s]
300 σ=15300 σ=30400 σ=26400 σ=30400 σ=65500 σ=45500 σ=50500 σ=65
B
0 200 400 600 800 100010
0
101
102
103
γ [−]
η [P
a.s]
300 σ=6300 σ=8400 σ=10400 σ=12400 σ=15400 σ=20500 σ=30500 σ=45500 σ=50
A
Figure 27. Transient viscosity as a function of the deformation in HB paste, A) before homogenisation,
and B) after homogenisation, at different concentrations 500, 400, 300 and 200 g/kg (see legend). The
different stresses used are indicated in the legend in Pa. Adapted from Paper II.
43
Combining the information discussed here, with the microscopic images, suggests that
the presence of fine particles, caused by homogenisation of the tomato suspensions,
plays a major role in determining the time-dependent behaviour of these suspensions
(Fig. 28). Yielding of homogenised suspensions requires higher stresses magnitudes or, in
other words, the strength of the network is enhanced by homogenisation, and more
bonds must be broken before the system overcomes the yield stress and begins to flow.
It is interesting to note that about 40% of the bonds in the structure may be broken just
prior to yield (Buscall et al., 1987). When applying relatively low shear stress ( ~ y), a
rheopectic response is seen, which might be related in part to rearrangement of the
particles, and in part to a delay in the response due to the remaining elastic properties of
the network. At these low stresses the system seems to reach an apparent steady-state
viscosity after times of about 30 min. It is however not possible to exclude further
rearrangements of the particles if a longer time frame is considered. Finally, prolonged
and intense shearing gives rise to the formation of flocs of densely packed particles. The
illustrations on the left side of the figure (Fig. 28), before shearing, would correspond to
the images in Figure 12 (non-sheared, H0, H3), whereas the right side of the drawing
instead corresponds to the images in Figure 12 (sheared, H0, H3).
Random distribution
Initial rheopecticbehavior viscosity
Random distribution
Initial rheopecticbehaviour
App. steady-statedensificationFloc
Deformation and/or Stress
Par
ticle
siz
e
Random distribution
Initial rheopecticbehavior viscosity
Random distribution
Initial rheopecticbehaviour
App. steady-statedensificationFloc
Deformation and/or Stress
Par
ticle
siz
e
Random distribution
Initial rheopecticbehavior viscosity
Random distribution
Initial rheopecticbehaviour
App. steady-statedensificationFloc
Deformation and/or Stress
Par
ticle
siz
e
Figure 28. Illustration of the behaviour of concentrated suspensions with predominantly coarse or
predominantly fine particle, upon the application of prolonged shear at small and large deformations.
44
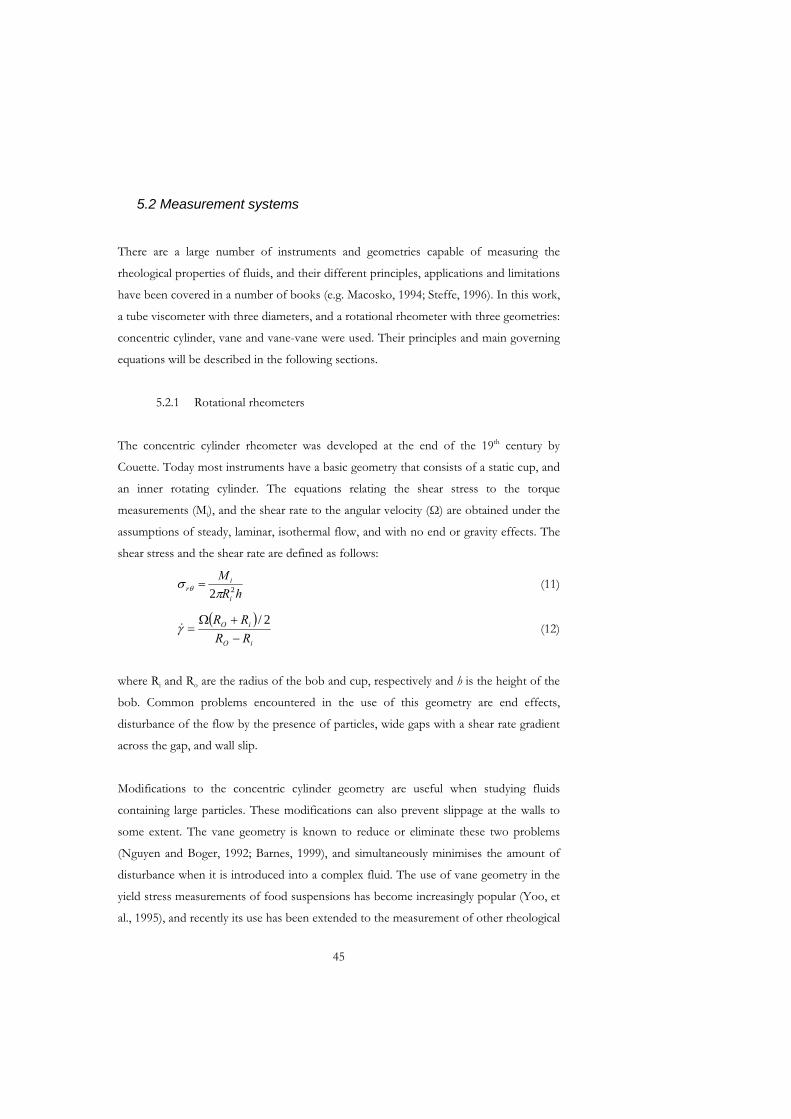
5.2 Measurement systems
There are a large number of instruments and geometries capable of measuring the
rheological properties of fluids, and their different principles, applications and limitations
have been covered in a number of books (e.g. Macosko, 1994; Steffe, 1996). In this work,
a tube viscometer with three diameters, and a rotational rheometer with three geometries:
concentric cylinder, vane and vane-vane were used. Their principles and main governing
equations will be described in the following sections.
5.2.1 Rotational rheometers
The concentric cylinder rheometer was developed at the end of the 19th century by
Couette. Today most instruments have a basic geometry that consists of a static cup, and
an inner rotating cylinder. The equations relating the shear stress to the torque
measurements (Mi), and the shear rate to the angular velocity ( ) are obtained under the
assumptions of steady, laminar, isothermal flow, and with no end or gravity effects. The
shear stress and the shear rate are defined as follows:
hRM
i
ir 22
(11)
iO
iO
RRRR 2/
(12)
where Ri and Ro are the radius of the bob and cup, respectively and h is the height of the
bob. Common problems encountered in the use of this geometry are end effects,
disturbance of the flow by the presence of particles, wide gaps with a shear rate gradient
across the gap, and wall slip.
Modifications to the concentric cylinder geometry are useful when studying fluids
containing large particles. These modifications can also prevent slippage at the walls to
some extent. The vane geometry is known to reduce or eliminate these two problems
(Nguyen and Boger, 1992; Barnes, 1999), and simultaneously minimises the amount of
disturbance when it is introduced into a complex fluid. The use of vane geometry in the
yield stress measurements of food suspensions has become increasingly popular (Yoo, et
al., 1995), and recently its use has been extended to the measurement of other rheological
45
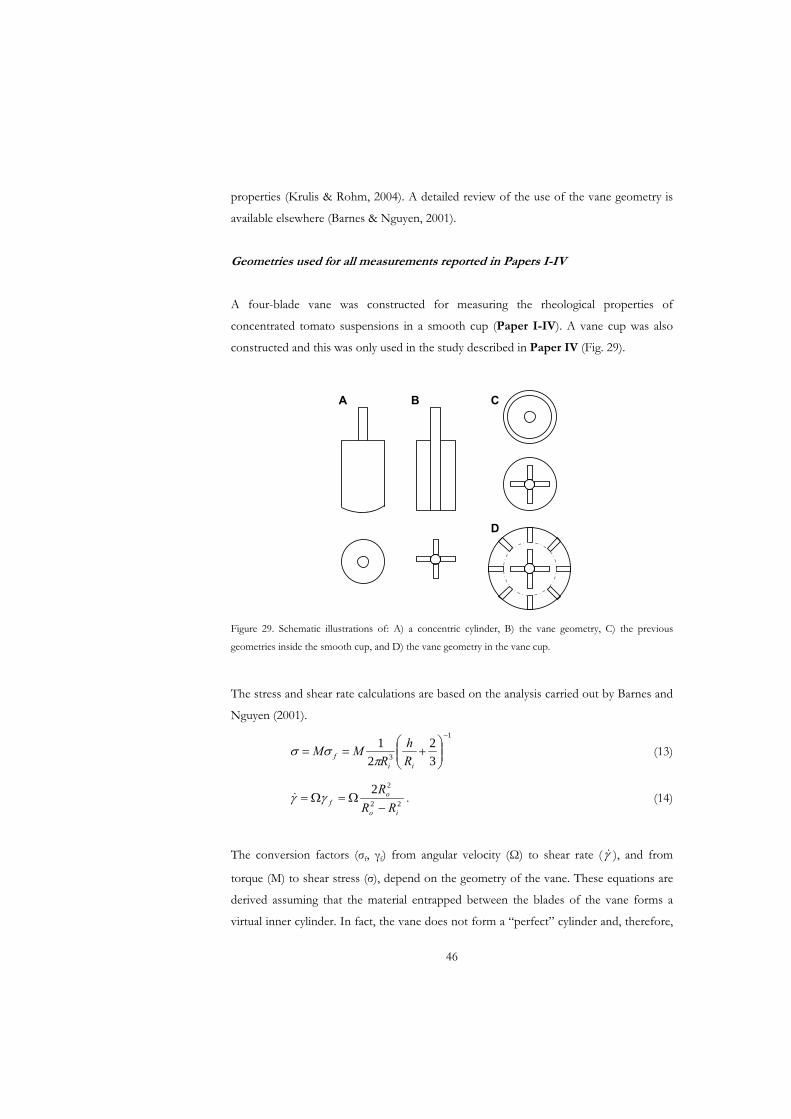
properties (Krulis & Rohm, 2004). A detailed review of the use of the vane geometry is
available elsewhere (Barnes & Nguyen, 2001).
Geometries used for all measurements reported in Papers I-IV
A four-blade vane was constructed for measuring the rheological properties of
concentrated tomato suspensions in a smooth cup (Paper I-IV). A vane cup was also
constructed and this was only used in the study described in Paper IV (Fig. 29).
A B C
D
Figure 29. Schematic illustrations of: A) a concentric cylinder, B) the vane geometry, C) the previous
geometries inside the smooth cup, and D) the vane geometry in the vane cup.
The stress and shear rate calculations are based on the analysis carried out by Barnes and
Nguyen (2001). 1
3 3
2
2
1
iif R
hR
MM (13)
22
22
io
of RR
R. (14)
The conversion factors ( f, f) from angular velocity ( ) to shear rate ( ), and from
torque (M) to shear stress ( ), depend on the geometry of the vane. These equations are
derived assuming that the material entrapped between the blades of the vane forms a
virtual inner cylinder. In fact, the vane does not form a “perfect” cylinder and, therefore,
46
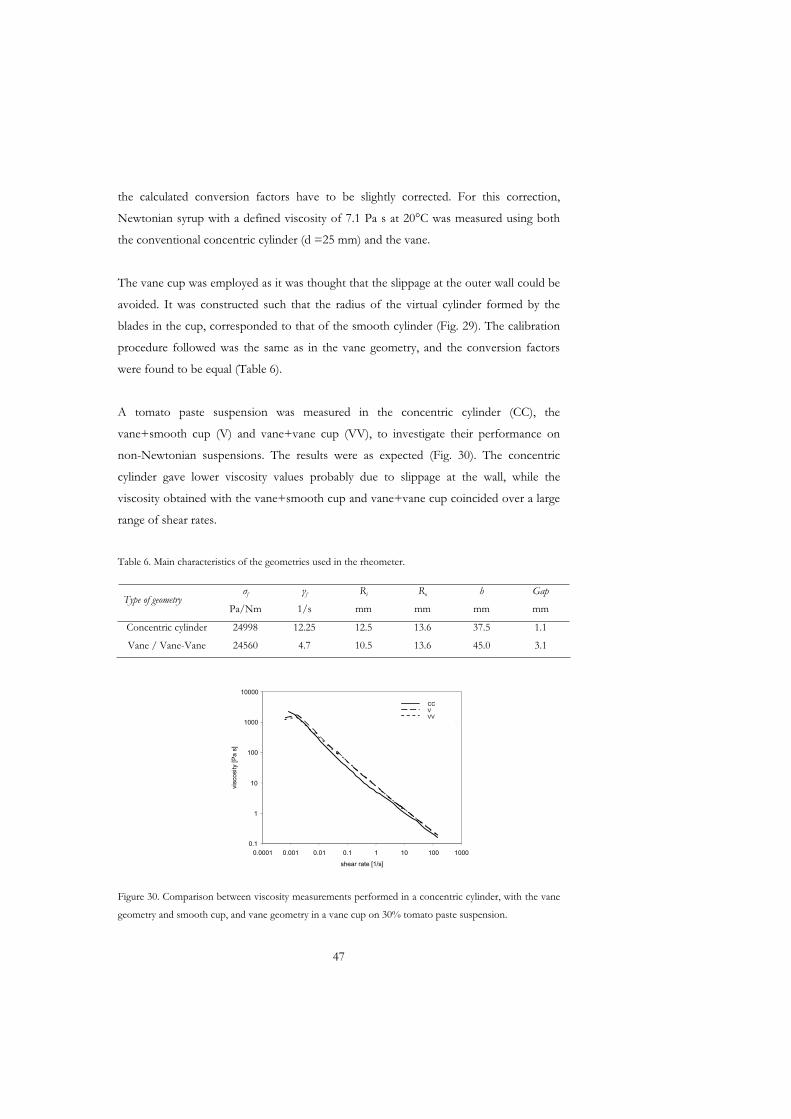
the calculated conversion factors have to be slightly corrected. For this correction,
Newtonian syrup with a defined viscosity of 7.1 Pa s at 20°C was measured using both
the conventional concentric cylinder (d =25 mm) and the vane.
The vane cup was employed as it was thought that the slippage at the outer wall could be
avoided. It was constructed such that the radius of the virtual cylinder formed by the
blades in the cup, corresponded to that of the smooth cylinder (Fig. 29). The calibration
procedure followed was the same as in the vane geometry, and the conversion factors
were found to be equal (Table 6).
A tomato paste suspension was measured in the concentric cylinder (CC), the
vane+smooth cup (V) and vane+vane cup (VV), to investigate their performance on
non-Newtonian suspensions. The results were as expected (Fig. 30). The concentric
cylinder gave lower viscosity values probably due to slippage at the wall, while the
viscosity obtained with the vane+smooth cup and vane+vane cup coincided over a large
range of shear rates.
Table 6. Main characteristics of the geometries used in the rheometer.
f f Ri Ro h GapType of geometry
Pa/Nm 1/s mm mm mm mm
Concentric cylinder 24998 12.25 12.5 13.6 37.5 1.1
Vane / Vane-Vane 24560 4.7 10.5 13.6 45.0 3.1
0.1
1
10
100
1000
10000
0.0001 0.001 0.01 0.1 1 10 100 1000
shear rate [1/s]
visc
osity
[Pa
s]
cc25
vane
outer
CCVVV
0.1
1
10
100
1000
10000
0.0001 0.001 0.01 0.1 1 10 100 1000
shear rate [1/s]
visc
osity
[Pa
s]
cc25
vane
outer
0.1
1
10
100
1000
10000
0.0001 0.001 0.01 0.1 1 10 100 1000
shear rate [1/s]
visc
osity
[Pa
s]
cc25
vane
outer
CCVVV
Figure 30. Comparison between viscosity measurements performed in a concentric cylinder, with the vane
geometry and smooth cup, and vane geometry in a vane cup on 30% tomato paste suspension.
47
In fact, earlier studies have already suggested that the behaviour of tomato concentrates
at low shear rates may be strongly influenced by secondary effects such as yield
phenomena, time dependency and wall effects, i.e. slippage (Harper and El Sahrigi, 1965).
These effects are related to each other (Windhab, 1988), and they all complicate the
measurement of the rheological properties in common rotational rheometers. The
remaining part of this thesis is devoted to discussing common problems that occur
during the determination of the flow behaviour of concentrated suspensions.
5.2.2 Tube viscometers
Tube or capillary viscometers were developed in mid 19th century to measure the
viscosity of fluids under laminar conditions. Advances in the field of small-bore tubing,
which allowed precise determination of the tube diameter, were key to the development
of this technique (Macosko, 1994). This was important because the viscosity depends on
the tube radius to the power four.
Compared with rotational rheometers, tube viscometers have the advantage of being able
to measure particulate suspensions, i.e. with large particles, in an interval of shear rates
that is relevant for food processing, i.e. 100 < < 1000 s-1. This is sometimes difficult to
achieved in rotational rheometers, as discussed above. Some drawbacks of using tube
viscometers are, however, the fact that they require large floor space and large amounts
of sample.
Tube viscometers employ a pressure-driven flow, which creates a velocity gradient
through the tube, with the maximum velocity at the centre of the pipe. The pressure
drop and volumetric flow rate are measured and converted to shear stress and shear rate,
respectively. The main assumptions in the derivation of rheological data for
incompressible fluids are:
- fully developed, steady-state, laminar flow in the pipe,
- velocity only in the length direction (x), and
- no wall slip, the velocity at the wall is zero, vx(R)=0.
48
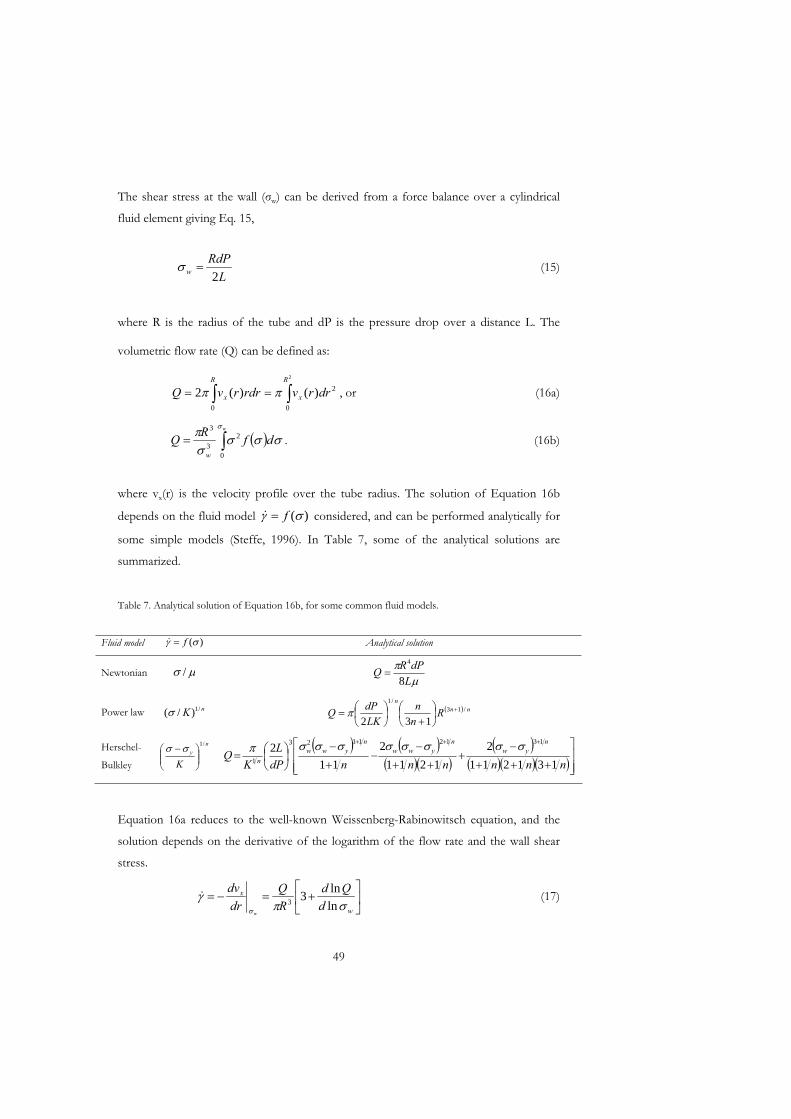
The shear stress at the wall ( w) can be derived from a force balance over a cylindrical
fluid element giving Eq. 15,
LRdP
w 2 (15)
where R is the radius of the tube and dP is the pressure drop over a distance L. The
volumetric flow rate (Q) can be defined as:
2
0
2
0
)()(2R
x
R
x drrvrdrrvQ , or (16a)
w
dfRQw 0
23
3
. (16b)
where vx(r) is the velocity profile over the tube radius. The solution of Equation 16b
depends on the fluid model )(f considered, and can be performed analytically for
some simple models (Steffe, 1996). In Table 7, some of the analytical solutions are
summarized.
Table 7. Analytical solution of Equation 16b, for some common fluid models.
Fluid model )(f Analytical solution
Newtonian /L
dPRQ8
4
Power law nK /1)/( nnn
Rnn
LKdPQ /13
/1
132
Herschel-
Bulkley
ny
K
/1
nnnnnndPL
KQ
nyw
nyww
nyww
n 131211
2
1211
2
11
213121123
1
Equation 16a reduces to the well-known Weissenberg-Rabinowitsch equation, and the
solution depends on the derivative of the logarithm of the flow rate and the wall shear
stress.
w
x
dQd
RQ
drdv
wln
ln3
3 (17)
49
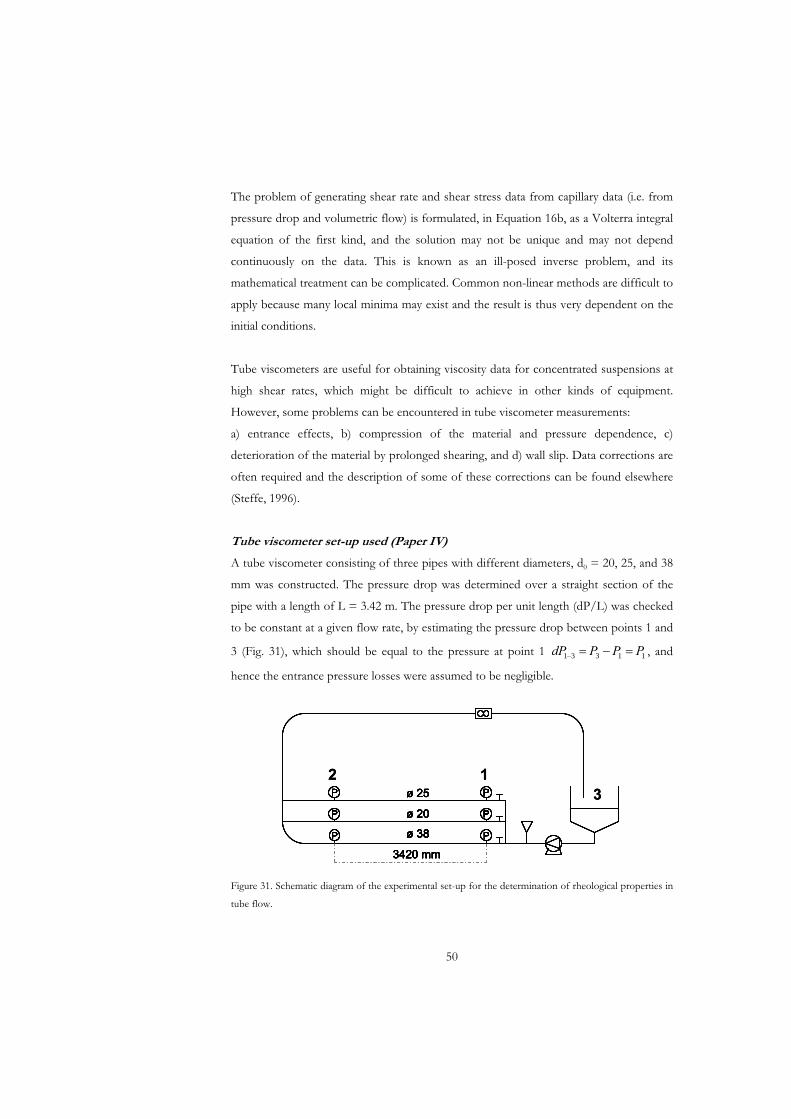
The problem of generating shear rate and shear stress data from capillary data (i.e. from
pressure drop and volumetric flow) is formulated, in Equation 16b, as a Volterra integral
equation of the first kind, and the solution may not be unique and may not depend
continuously on the data. This is known as an ill-posed inverse problem, and its
mathematical treatment can be complicated. Common non-linear methods are difficult to
apply because many local minima may exist and the result is thus very dependent on the
initial conditions.
Tube viscometers are useful for obtaining viscosity data for concentrated suspensions at
high shear rates, which might be difficult to achieve in other kinds of equipment.
However, some problems can be encountered in tube viscometer measurements:
a) entrance effects, b) compression of the material and pressure dependence, c)
deterioration of the material by prolonged shearing, and d) wall slip. Data corrections are
often required and the description of some of these corrections can be found elsewhere
(Steffe, 1996).
Tube viscometer set-up used (Paper IV)
A tube viscometer consisting of three pipes with different diameters, d0 = 20, 25, and 38
mm was constructed. The pressure drop was determined over a straight section of the
pipe with a length of L = 3.42 m. The pressure drop per unit length (dP/L) was checked
to be constant at a given flow rate, by estimating the pressure drop between points 1 and
3 (Fig. 31), which should be equal to the pressure at point 1 11331 PPPdP , and
hence the entrance pressure losses were assumed to be negligible.
P
P
P
P
P
P
3420 mm
ø 25
ø 20
ø 38
P
P
P
P
P
P
3420 mm
ø 25
ø 20
ø 38
PP
PP
PP
PP
PP
PP
3420 mm
ø 25
ø 20
ø 38
123P
P
P
P
P
P
3420 mm
ø 25
ø 20
ø 38
P
P
P
P
P
P
3420 mm
ø 25
ø 20
ø 38
PP
PP
PP
PP
PP
PP
3420 mm
ø 25
ø 20
ø 38
123
Figure 31. Schematic diagram of the experimental set-up for the determination of rheological properties in
tube flow.
50
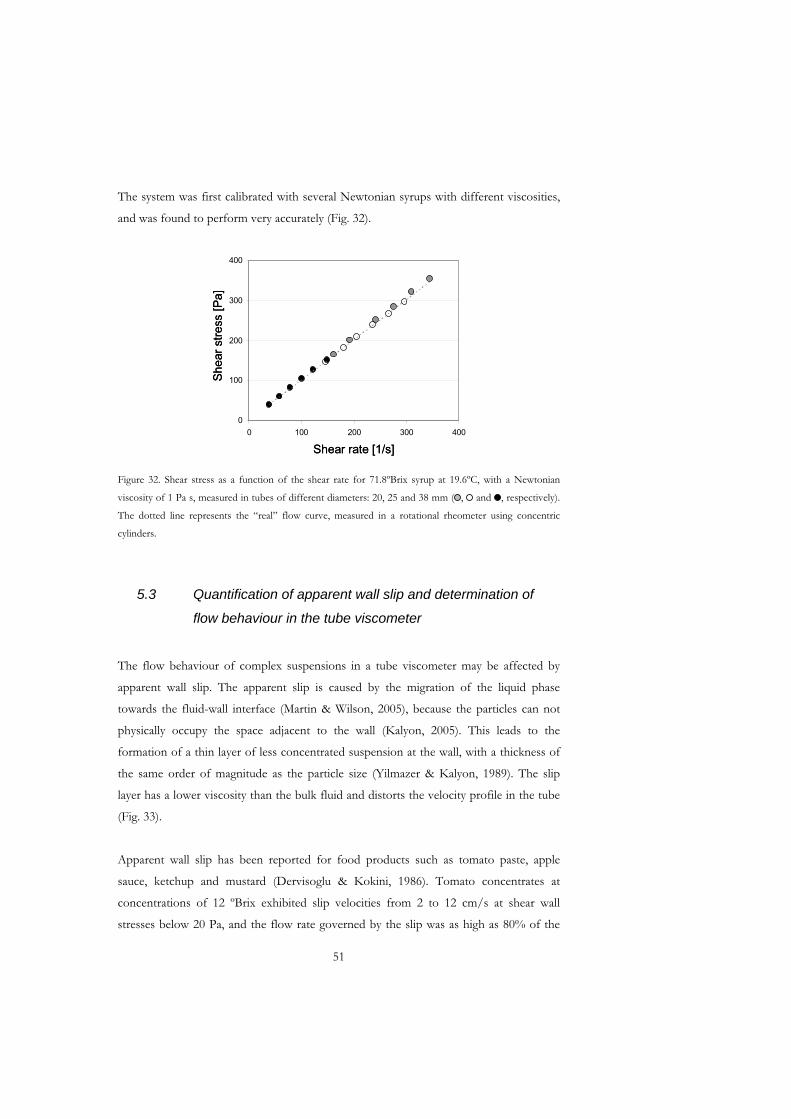
The system was first calibrated with several Newtonian syrups with different viscosities,
and was found to perform very accurately (Fig. 32).
0
100
200
300
400
0 100 200 300 400
Shear rate [1/s]
Shea
r stre
ss [P
a]
0
100
200
300
400
0 100 200 300 400
Shear rate [1/s]
Shea
r stre
ss [P
a]
Figure 32. Shear stress as a function of the shear rate for 71.8ºBrix syrup at 19.6ºC, with a Newtonian
viscosity of 1 Pa s, measured in tubes of different diameters: 20, 25 and 38 mm ( , and , respectively).
The dotted line represents the “real” flow curve, measured in a rotational rheometer using concentric
cylinders.
5.3 Quantification of apparent wall slip and determination of flow behaviour in the tube viscometer
The flow behaviour of complex suspensions in a tube viscometer may be affected by
apparent wall slip. The apparent slip is caused by the migration of the liquid phase
towards the fluid-wall interface (Martin & Wilson, 2005), because the particles can not
physically occupy the space adjacent to the wall (Kalyon, 2005). This leads to the
formation of a thin layer of less concentrated suspension at the wall, with a thickness of
the same order of magnitude as the particle size (Yilmazer & Kalyon, 1989). The slip
layer has a lower viscosity than the bulk fluid and distorts the velocity profile in the tube
(Fig. 33).
Apparent wall slip has been reported for food products such as tomato paste, apple
sauce, ketchup and mustard (Dervisoglu & Kokini, 1986). Tomato concentrates at
concentrations of 12 ºBrix exhibited slip velocities from 2 to 12 cm/s at shear wall
stresses below 20 Pa, and the flow rate governed by the slip was as high as 80% of the
51
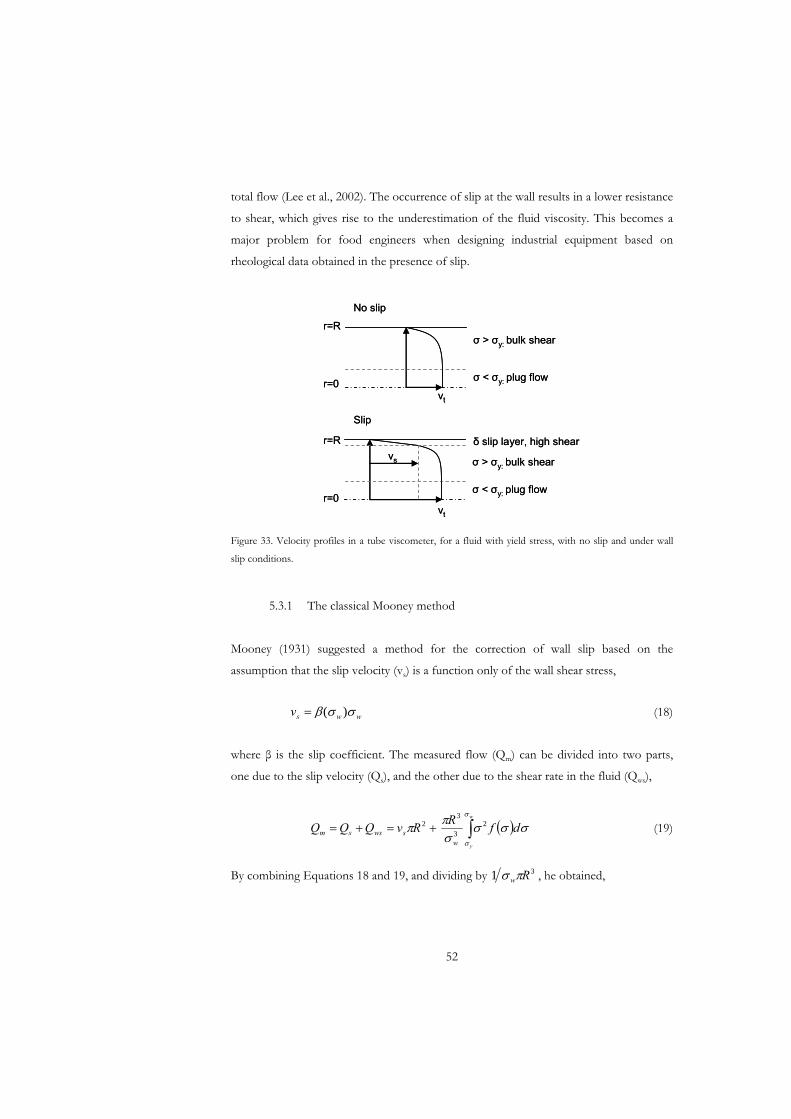
total flow (Lee et al., 2002). The occurrence of slip at the wall results in a lower resistance
to shear, which gives rise to the underestimation of the fluid viscosity. This becomes a
major problem for food engineers when designing industrial equipment based on
rheological data obtained in the presence of slip.
> y: bulk shear
< y: plug flow
> y: bulk shear
< y: plug flow
No slip
Slip
slip layer, high shearvs
vt
vt
r=0
r=R
r=0
r=R> y: bulk shear
< y: plug flow
> y: bulk shear
< y: plug flow
No slip
Slip
slip layer, high shearvs
vt
vt
r=0
r=R
r=0
r=R
Figure 33. Velocity profiles in a tube viscometer, for a fluid with yield stress, with no slip and under wall
slip conditions.
5.3.1 The classical Mooney method
Mooney (1931) suggested a method for the correction of wall slip based on the
assumption that the slip velocity (vs) is a function only of the wall shear stress,
wwsv )( (18)
where is the slip coefficient. The measured flow (Qm) can be divided into two parts,
one due to the slip velocity (Qs), and the other due to the shear rate in the fluid (Qws),
2RvQQQ swssm
w
y
dfR
w
23
3
(19)
By combining Equations 18 and 19, and dividing by 31 Rw , he obtained,
52
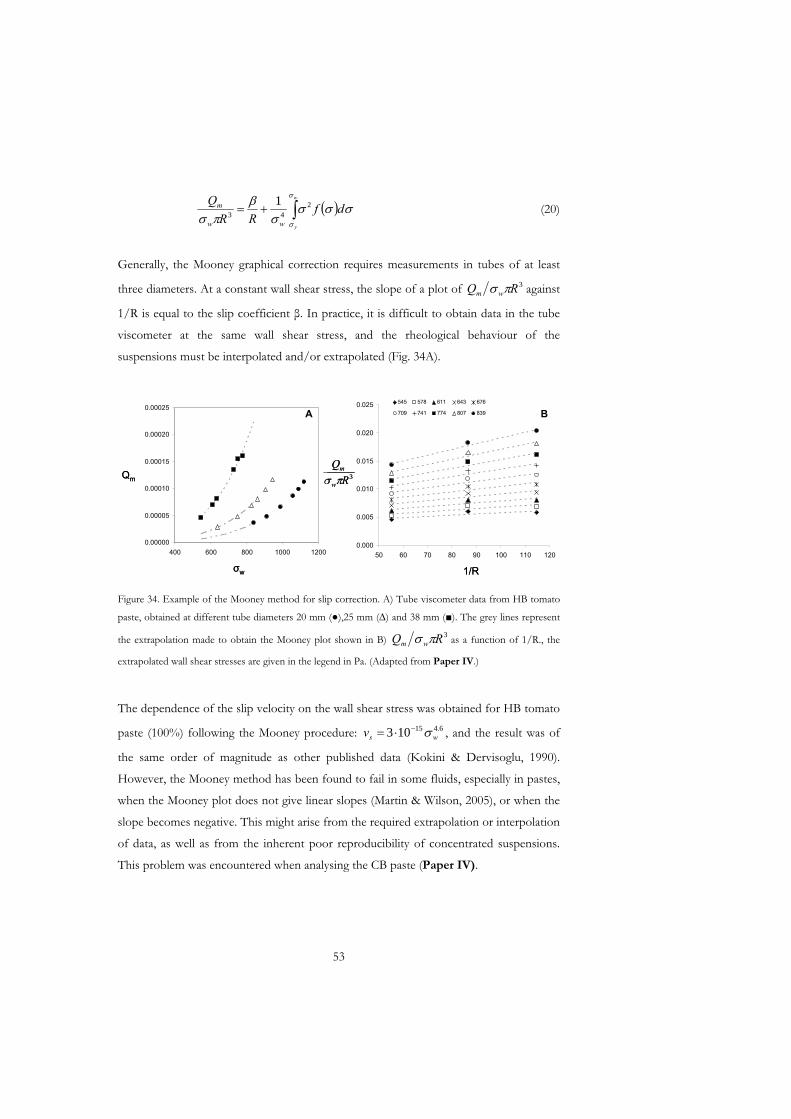
w
y
dfRR
Q
ww
m 243
1 (20)
Generally, the Mooney graphical correction requires measurements in tubes of at least
three diameters. At a constant wall shear stress, the slope of a plot of 3RQ wm against
1/R is equal to the slip coefficient . In practice, it is difficult to obtain data in the tube
viscometer at the same wall shear stress, and the rheological behaviour of the
suspensions must be interpolated and/or extrapolated (Fig. 34A).
0.00000
0.00005
0.00010
0.00015
0.00020
0.00025
400 600 800 1000 1200
w
Qm
0.000
0.005
0.010
0.015
0.020
0.025
50 60 70 80 90 100 110 120
545 578 611 643 676
709 741 774 807 839
3RQ
w
m
1/R
A B
0.00000
0.00005
0.00010
0.00015
0.00020
0.00025
400 600 800 1000 1200
w
Qm
0.000
0.005
0.010
0.015
0.020
0.025
50 60 70 80 90 100 110 120
545 578 611 643 676
709 741 774 807 839
3RQ
w
m
1/R
A B
Figure 34. Example of the Mooney method for slip correction. A) Tube viscometer data from HB tomato
paste, obtained at different tube diameters 20 mm ( ),25 mm ( ) and 38 mm ( ). The grey lines represent
the extrapolation made to obtain the Mooney plot shown in B) 3RQ wm as a function of 1/R., the
extrapolated wall shear stresses are given in the legend in Pa. (Adapted from Paper IV.)
The dependence of the slip velocity on the wall shear stress was obtained for HB tomato
paste (100%) following the Mooney procedure: , and the result was of
the same order of magnitude as other published data (Kokini & Dervisoglu, 1990).
However, the Mooney method has been found to fail in some fluids, especially in pastes,
when the Mooney plot does not give linear slopes (Martin & Wilson, 2005), or when the
slope becomes negative. This might arise from the required extrapolation or interpolation
of data, as well as from the inherent poor reproducibility of concentrated suspensions.
This problem was encountered when analysing the CB paste (Paper IV).
6.415103 wsv
53
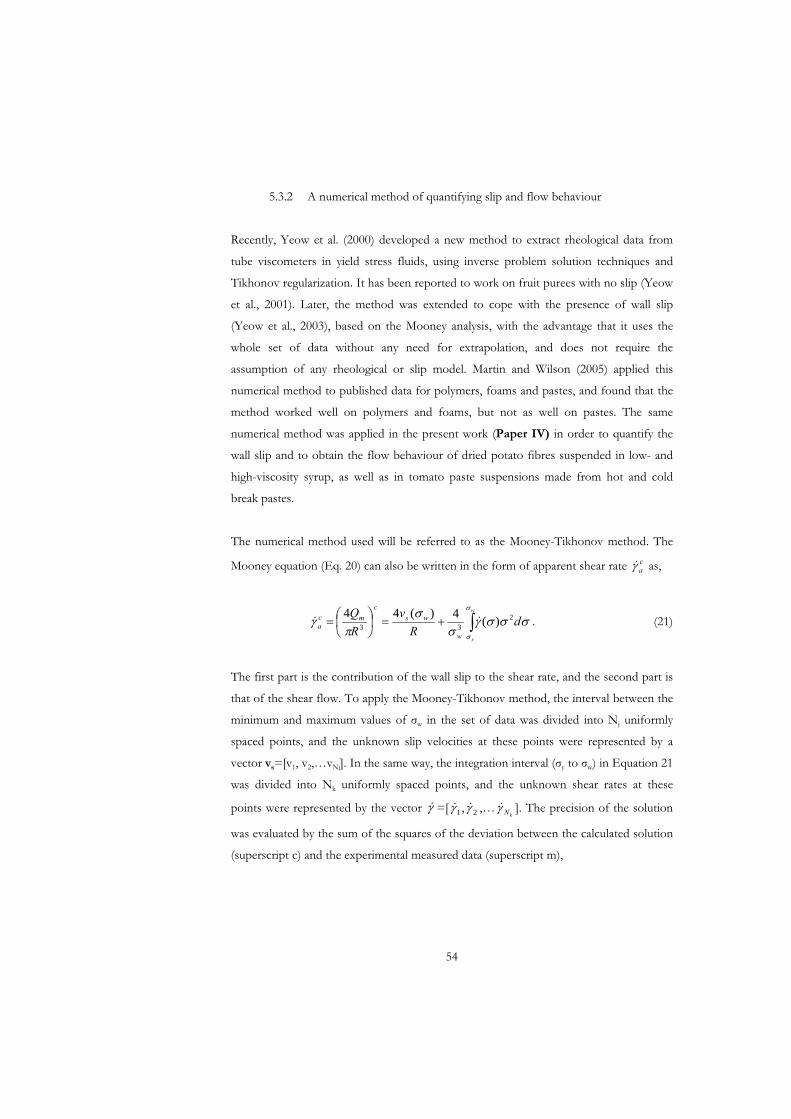
5.3.2 A numerical method of quantifying slip and flow behaviour
Recently, Yeow et al. (2000) developed a new method to extract rheological data from
tube viscometers in yield stress fluids, using inverse problem solution techniques and
Tikhonov regularization. It has been reported to work on fruit purees with no slip (Yeow
et al., 2001). Later, the method was extended to cope with the presence of wall slip
(Yeow et al., 2003), based on the Mooney analysis, with the advantage that it uses the
whole set of data without any need for extrapolation, and does not require the
assumption of any rheological or slip model. Martin and Wilson (2005) applied this
numerical method to published data for polymers, foams and pastes, and found that the
method worked well on polymers and foams, but not as well on pastes. The same
numerical method was applied in the present work (Paper IV) in order to quantify the
wall slip and to obtain the flow behaviour of dried potato fibres suspended in low- and
high-viscosity syrup, as well as in tomato paste suspensions made from hot and cold
break pastes.
The numerical method used will be referred to as the Mooney-Tikhonov method. The
Mooney equation (Eq. 20) can also be written in the form of apparent shear rate as, ca
w
y
dR
vRQ
w
wsc
mca
233
)(4)(44 . (21)
The first part is the contribution of the wall slip to the shear rate, and the second part is
that of the shear flow. To apply the Mooney-Tikhonov method, the interval between the
minimum and maximum values of w in the set of data was divided into Nj uniformly
spaced points, and the unknown slip velocities at these points were represented by a
vector vs=[v1, v2,…vNj]. In the same way, the integration interval ( y to w) in Equation 21
was divided into Nk uniformly spaced points, and the unknown shear rates at these
points were represented by the vector =[ 1 , 2 ,…kN ]. The precision of the solution
was evaluated by the sum of the squares of the deviation between the calculated solution
(superscript c) and the experimental measured data (superscript m),
54
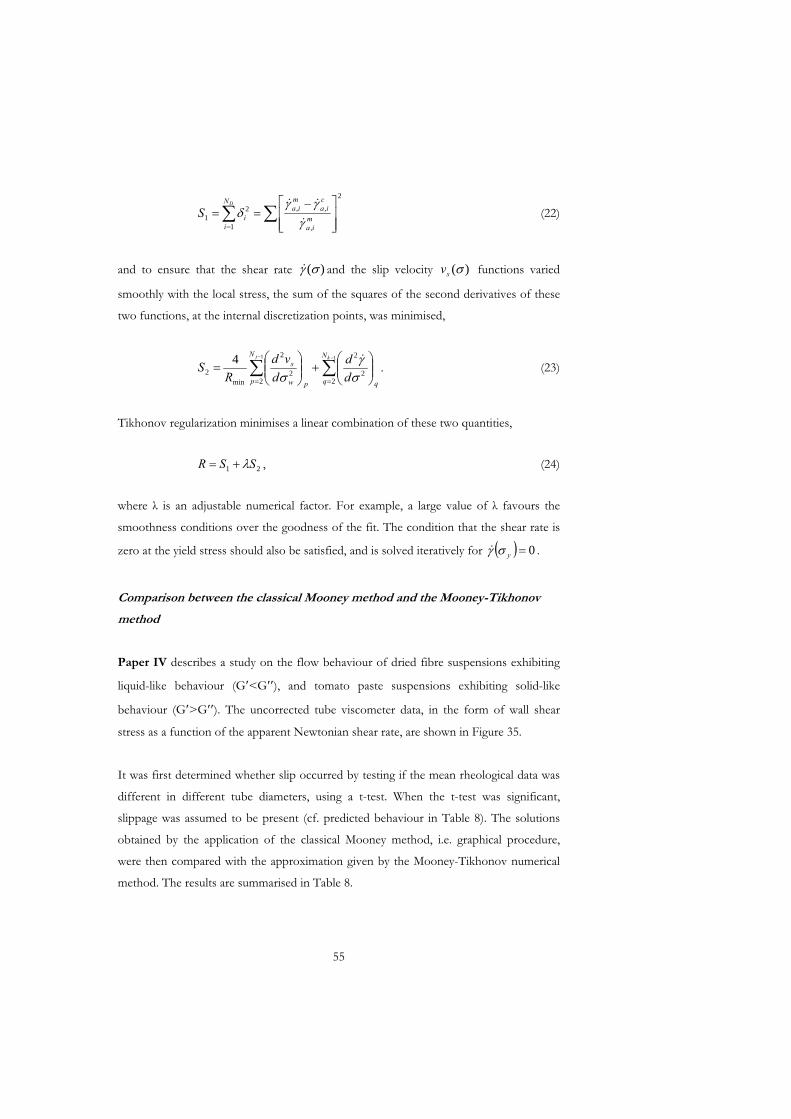
2
,
,,
1
21 m
ia
cia
mia
N
ii
D
S (22)
and to ensure that the shear rate )( and the slip velocity )(sv functions varied
smoothly with the local stress, the sum of the squares of the second derivatives of these
two functions, at the internal discretization points, was minimised,
q
N
qp
N
p w
skj
dd
dvd
RS
11
22
2
22
2
min2
4 . (23)
Tikhonov regularization minimises a linear combination of these two quantities,
21 SSR , (24)
where is an adjustable numerical factor. For example, a large value of favours the
smoothness conditions over the goodness of the fit. The condition that the shear rate is
zero at the yield stress should also be satisfied, and is solved iteratively for 0y .
Comparison between the classical Mooney method and the Mooney-Tikhonov
method
Paper IV describes a study on the flow behaviour of dried fibre suspensions exhibiting
liquid-like behaviour (G <G ), and tomato paste suspensions exhibiting solid-like
behaviour (G >G ). The uncorrected tube viscometer data, in the form of wall shear
stress as a function of the apparent Newtonian shear rate, are shown in Figure 35.
It was first determined whether slip occurred by testing if the mean rheological data was
different in different tube diameters, using a t-test. When the t-test was significant,
slippage was assumed to be present (cf. predicted behaviour in Table 8). The solutions
obtained by the application of the classical Mooney method, i.e. graphical procedure,
were then compared with the approximation given by the Mooney-Tikhonov numerical
method. The results are summarised in Table 8.
55
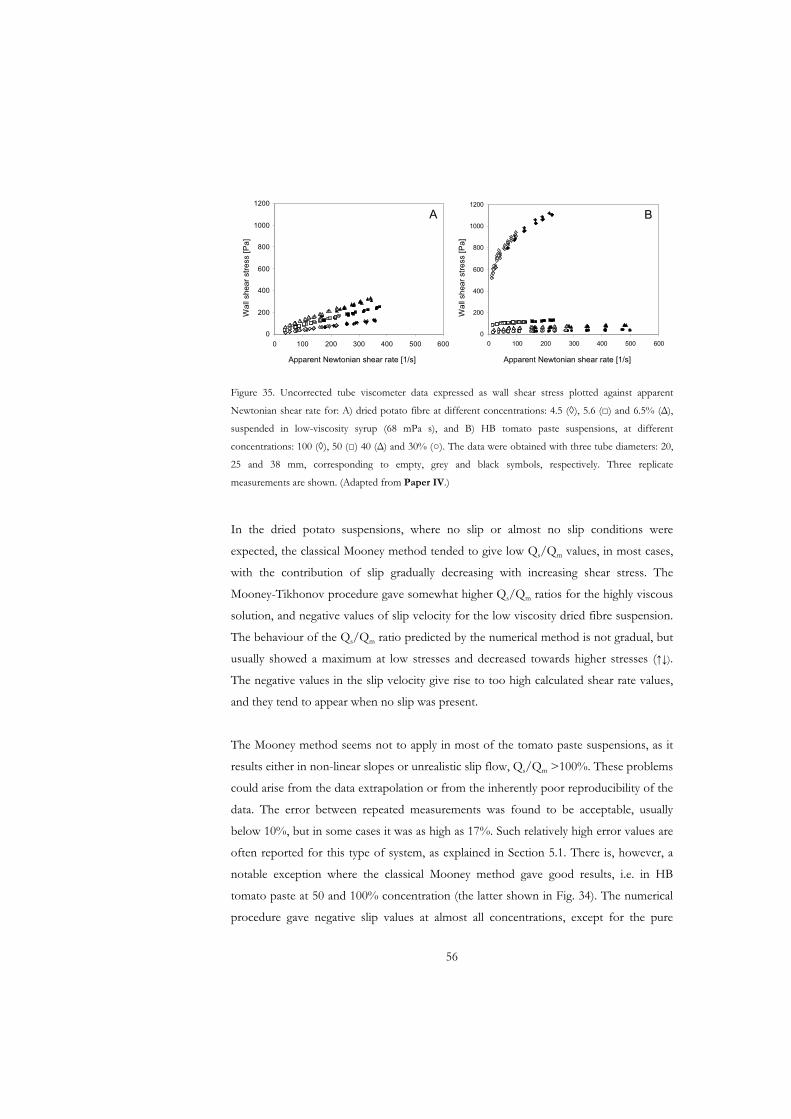
0
200
400
600
800
1000
1200
0 100 200 300 400 500 600
apparent shear rate
wal
l she
ar s
tress
0
200
400
600
800
1000
1200
0 100 200 300 400 500 600
apparent shear rate
wal
l she
ar s
tress
A B
Apparent Newtonian shear rate [1/s] Apparent Newtonian shear rate [1/s]
Wal
l she
ar s
tress
[Pa]
Wal
l she
ar s
tress
[Pa]
0
200
400
600
800
1000
1200
0 100 200 300 400 500 600
apparent shear rate
wal
l she
ar s
tress
0
200
400
600
800
1000
1200
0 100 200 300 400 500 600
apparent shear rate
wal
l she
ar s
tress
A B
Apparent Newtonian shear rate [1/s] Apparent Newtonian shear rate [1/s]
Wal
l she
ar s
tress
[Pa]
Wal
l she
ar s
tress
[Pa]
Figure 35. Uncorrected tube viscometer data expressed as wall shear stress plotted against apparent
Newtonian shear rate for: A) dried potato fibre at different concentrations: 4.5 ( ), 5.6 ( ) and 6.5% ( ),
suspended in low-viscosity syrup (68 mPa s), and B) HB tomato paste suspensions, at different
concentrations: 100 ( ), 50 ( ) 40 ( ) and 30% ( ). The data were obtained with three tube diameters: 20,
25 and 38 mm, corresponding to empty, grey and black symbols, respectively. Three replicate
measurements are shown. (Adapted from Paper IV.)
In the dried potato suspensions, where no slip or almost no slip conditions were
expected, the classical Mooney method tended to give low Qs/Qm values, in most cases,
with the contribution of slip gradually decreasing with increasing shear stress. The
Mooney-Tikhonov procedure gave somewhat higher Qs/Qm ratios for the highly viscous
solution, and negative values of slip velocity for the low viscosity dried fibre suspension.
The behaviour of the Qs/Qm ratio predicted by the numerical method is not gradual, but
usually showed a maximum at low stresses and decreased towards higher stresses ( ).
The negative values in the slip velocity give rise to too high calculated shear rate values,
and they tend to appear when no slip was present.
The Mooney method seems not to apply in most of the tomato paste suspensions, as it
results either in non-linear slopes or unrealistic slip flow, Qs/Qm >100%. These problems
could arise from the data extrapolation or from the inherently poor reproducibility of the
data. The error between repeated measurements was found to be acceptable, usually
below 10%, but in some cases it was as high as 17%. Such relatively high error values are
often reported for this type of system, as explained in Section 5.1. There is, however, a
notable exception where the classical Mooney method gave good results, i.e. in HB
tomato paste at 50 and 100% concentration (the latter shown in Fig. 34). The numerical
procedure gave negative slip values at almost all concentrations, except for the pure
56
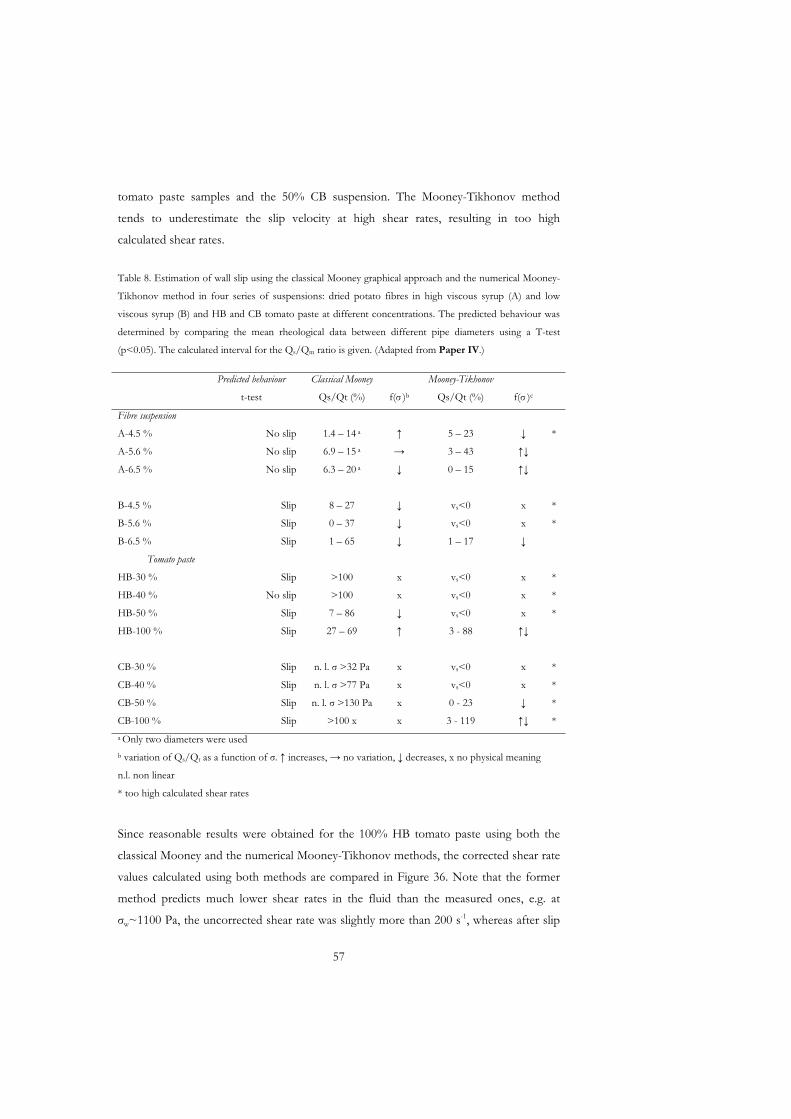
tomato paste samples and the 50% CB suspension. The Mooney-Tikhonov method
tends to underestimate the slip velocity at high shear rates, resulting in too high
calculated shear rates.
Table 8. Estimation of wall slip using the classical Mooney graphical approach and the numerical Mooney-
Tikhonov method in four series of suspensions: dried potato fibres in high viscous syrup (A) and low
viscous syrup (B) and HB and CB tomato paste at different concentrations. The predicted behaviour was
determined by comparing the mean rheological data between different pipe diameters using a T-test
(p<0.05). The calculated interval for the Qs/Qm ratio is given. (Adapted from Paper IV.)
Predicted behaviour Classical Mooney Mooney-Tikhonov
t-test Qs/Qt (%) f( )b Qs/Qt (%) f( )c
Fibre suspension
A-4.5 % No slip 1.4 – 14 a 5 – 23 *
A-5.6 % No slip 6.9 – 15 a 3 – 43
A-6.5 % No slip 6.3 – 20 a 0 – 15
B-4.5 % Slip 8 – 27 vs<0 x *
B-5.6 % Slip 0 – 37 vs<0 x *
B-6.5 % Slip 1 – 65 1 – 17
Tomato paste
HB-30 % Slip >100 x vs<0 x *
HB-40 % No slip >100 x vs<0 x *
HB-50 % Slip 7 – 86 vs<0 x *
HB-100 % Slip 27 – 69 3 - 88
CB-30 % Slip n. l. >32 Pa x vs<0 x *
CB-40 % Slip n. l. >77 Pa x vs<0 x *
CB-50 % Slip n. l. >130 Pa x 0 - 23 *
CB-100 % Slip >100 x x 3 - 119 *a Only two diameters were used b variation of Qs/Qt as a function of . increases, no variation, decreases, x no physical meaning
n.l. non linear
* too high calculated shear rates
Since reasonable results were obtained for the 100% HB tomato paste using both the
classical Mooney and the numerical Mooney-Tikhonov methods, the corrected shear rate
values calculated using both methods are compared in Figure 36. Note that the former
method predicts much lower shear rates in the fluid than the measured ones, e.g. at
w~1100 Pa, the uncorrected shear rate was slightly more than 200 s-1, whereas after slip
57
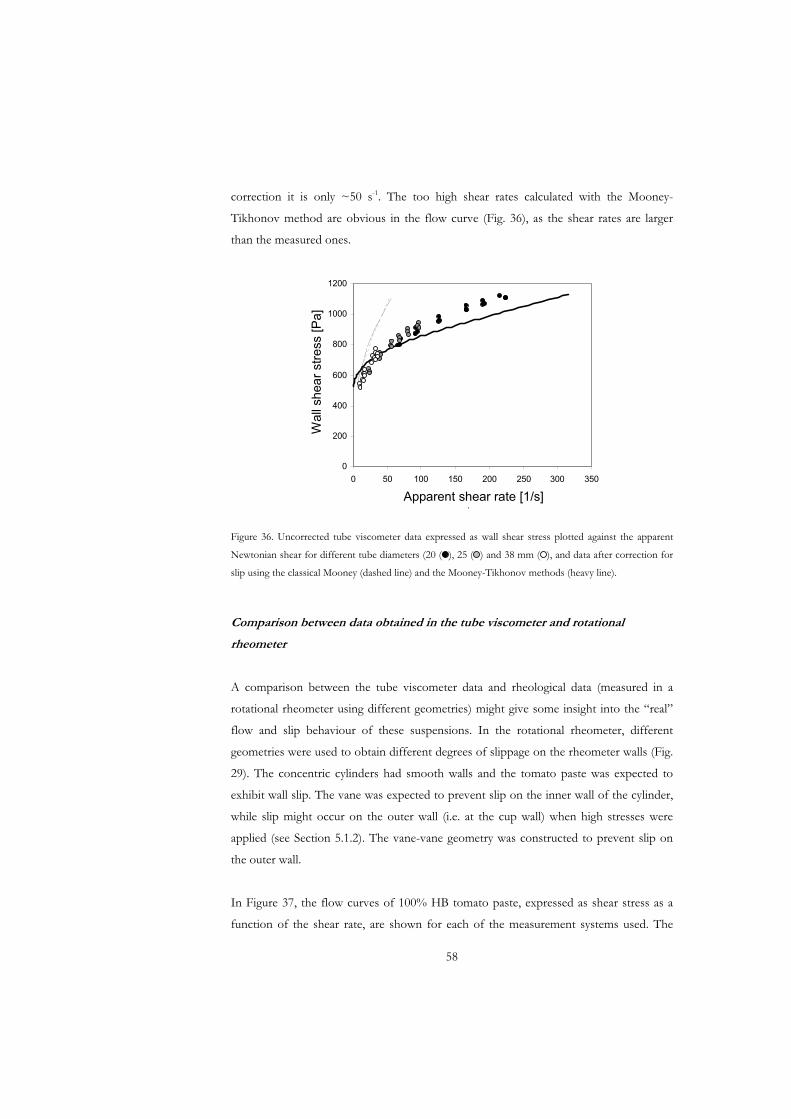
correction it is only ~50 s-1. The too high shear rates calculated with the Mooney-
Tikhonov method are obvious in the flow curve (Fig. 36), as the shear rates are larger
than the measured ones.
0
200
400
600
800
1000
1200
0 50 100 150 200 250 300 350
d /dt
w
Apparent shear rate [1/s]
Wal
l she
ar s
tress
[Pa]
0
200
400
600
800
1000
1200
0 50 100 150 200 250 300 350
d /dt
w
Apparent shear rate [1/s]
Wal
l she
ar s
tress
[Pa]
Figure 36. Uncorrected tube viscometer data expressed as wall shear stress plotted against the apparent
Newtonian shear for different tube diameters (20 ( ), 25 ( ) and 38 mm ( ), and data after correction for
slip using the classical Mooney (dashed line) and the Mooney-Tikhonov methods (heavy line).
Comparison between data obtained in the tube viscometer and rotational
rheometer
A comparison between the tube viscometer data and rheological data (measured in a
rotational rheometer using different geometries) might give some insight into the “real”
flow and slip behaviour of these suspensions. In the rotational rheometer, different
geometries were used to obtain different degrees of slippage on the rheometer walls (Fig.
29). The concentric cylinders had smooth walls and the tomato paste was expected to
exhibit wall slip. The vane was expected to prevent slip on the inner wall of the cylinder,
while slip might occur on the outer wall (i.e. at the cup wall) when high stresses were
applied (see Section 5.1.2). The vane-vane geometry was constructed to prevent slip on
the outer wall.
In Figure 37, the flow curves of 100% HB tomato paste, expressed as shear stress as a
function of the shear rate, are shown for each of the measurement systems used. The
58
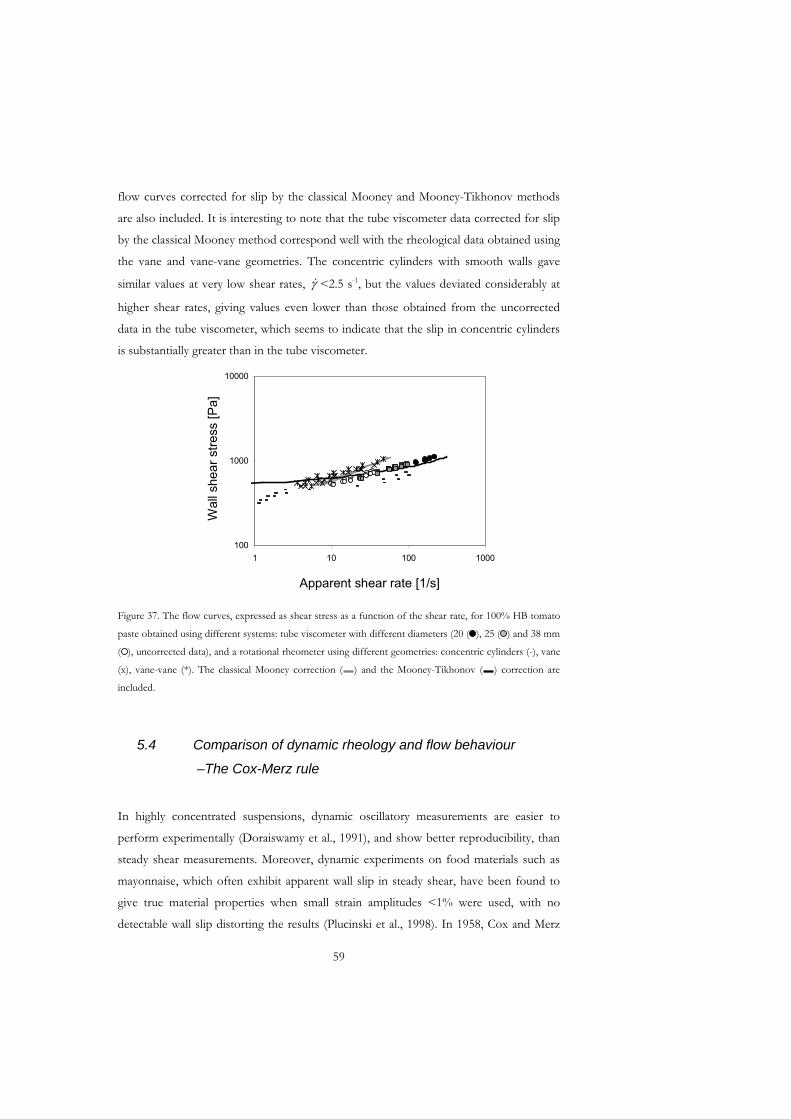
flow curves corrected for slip by the classical Mooney and Mooney-Tikhonov methods
are also included. It is interesting to note that the tube viscometer data corrected for slip
by the classical Mooney method correspond well with the rheological data obtained using
the vane and vane-vane geometries. The concentric cylinders with smooth walls gave
similar values at very low shear rates, <2.5 s-1, but the values deviated considerably at
higher shear rates, giving values even lower than those obtained from the uncorrected
data in the tube viscometer, which seems to indicate that the slip in concentric cylinders
is substantially greater than in the tube viscometer.
100
1000
10000
1 10 100 1000
d /dtApparent shear rate [1/s]
Wal
l she
ar s
tress
[Pa]
100
1000
10000
1 10 100 1000
d /dtApparent shear rate [1/s]
Wal
l she
ar s
tress
[Pa]
Figure 37. The flow curves, expressed as shear stress as a function of the shear rate, for 100% HB tomato
paste obtained using different systems: tube viscometer with different diameters (20 ( ), 25 ( ) and 38 mm
( ), uncorrected data), and a rotational rheometer using different geometries: concentric cylinders (-), vane
(x), vane-vane (*). The classical Mooney correction ( ) and the Mooney-Tikhonov ( ) correction are
included.
5.4 Comparison of dynamic rheology and flow behaviour –The Cox-Merz rule
In highly concentrated suspensions, dynamic oscillatory measurements are easier to
perform experimentally (Doraiswamy et al., 1991), and show better reproducibility, than
steady shear measurements. Moreover, dynamic experiments on food materials such as
mayonnaise, which often exhibit apparent wall slip in steady shear, have been found to
give true material properties when small strain amplitudes <1% were used, with no
detectable wall slip distorting the results (Plucinski et al., 1998). In 1958, Cox and Merz
59
discovered an astonishingly simple and empirical relationship between the steady shear
viscosity )( and the complex viscosity )(* ,
)()(* . (25)
The Cox-Merz rule holds for simple polymeric fluids, but is not reliable for more
complex and structured fluids such as crystalline polymers, concentrated suspensions or
gels (Larsson, 1999). Bistany and Kokini (1983) reported a lack of validity of this rule for
various types of food materials, such as butter, ketchup, margarine and cream cheese,
where they found that dynamic and steady shear data could only be superposed by using
a shift factor. The same type of shifting was used in data from tomato pastes (Rao &
Cooley, 1992), but no theoretical explanation was given. Recently, Muliawan &
Hatzikiriakos (2007) investigated cheese at different temperatures, and at low
temperatures they observed a shift between dynamic and steady shear data, that tended
to disappear when the cheese melted and lost its structure.
Small-amplitude oscillatory measurements tend to preserve the microstructure of the
material being tested (see Chapter 4), whereas steady shear measurements can induce
changes in the microstructure of the suspensions (see Section 5.1.3), disrupting the
network to some extent. This difference in the conservation of the microstructure might
explain the lack of agreement between the two types of data in complex structured food
materials.
For example, in Figure 35A complex and steady shear viscosities are plotted for a
suspension of dried potato fibres in highly viscous syrup. The Cox-Merz rule seems to
hold for this set of data. In the case of the 30% tomato suspension (Fig. 35B), however,
the complex viscosity is shifted to higher values than those of the steady shear viscosity.
The potato suspension exhibits liquid-like behaviour at all frequencies (G <G ) and
exhibits no yield stress. The tomato suspensions, on the other hand, exhibit solid-like
behaviour over the range of frequencies studied (G >G ), and had a yield stress. Hence,
the lack of a network structure in the dried fibre suspensions seems to be a key factor in
the validity of the Cox-Merz rule.
60
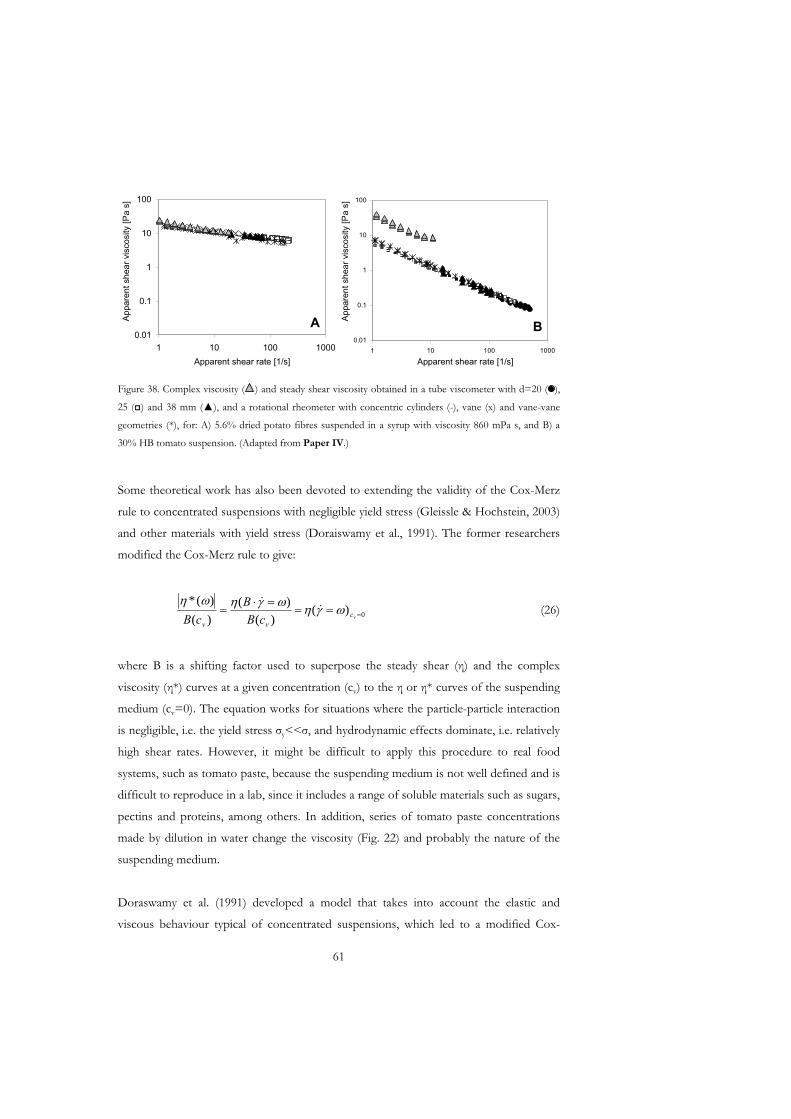
0.01
0.1
1
10
100
1 10 100 10000.01
0.1
1
10
100
1 10 100 1000
A B
Apparent shear rate [1/s]Apparent shear rate [1/s]
App
aren
t she
ar v
isco
sity
[Pa
s]
App
aren
t she
ar v
isco
sity
[Pa
s]0.01
0.1
1
10
100
1 10 100 10000.01
0.1
1
10
100
1 10 100 1000
A B
Apparent shear rate [1/s]Apparent shear rate [1/s]
App
aren
t she
ar v
isco
sity
[Pa
s]
App
aren
t she
ar v
isco
sity
[Pa
s]
Figure 38. Complex viscosity ( ) and steady shear viscosity obtained in a tube viscometer with d=20 ( ),
25 ( ) and 38 mm ( ), and a rotational rheometer with concentric cylinders (-), vane (x) and vane-vane
geometries (*), for: A) 5.6% dried potato fibres suspended in a syrup with viscosity 860 mPa s, and B) a
30% HB tomato suspension. (Adapted from Paper IV.)
Some theoretical work has also been devoted to extending the validity of the Cox-Merz
rule to concentrated suspensions with negligible yield stress (Gleissle & Hochstein, 2003)
and other materials with yield stress (Doraiswamy et al., 1991). The former researchers
modified the Cox-Merz rule to give:
0)()(
)(
)(
)(*vc
vv cBB
cB (26)
where B is a shifting factor used to superpose the steady shear ( ) and the complex
viscosity ( *) curves at a given concentration (cv) to the or * curves of the suspending
medium (cv=0). The equation works for situations where the particle-particle interaction
is negligible, i.e. the yield stress y<< , and hydrodynamic effects dominate, i.e. relatively
high shear rates. However, it might be difficult to apply this procedure to real food
systems, such as tomato paste, because the suspending medium is not well defined and is
difficult to reproduce in a lab, since it includes a range of soluble materials such as sugars,
pectins and proteins, among others. In addition, series of tomato paste concentrations
made by dilution in water change the viscosity (Fig. 22) and probably the nature of the
suspending medium.
Doraswamy et al. (1991) developed a model that takes into account the elastic and
viscous behaviour typical of concentrated suspensions, which led to a modified Cox-
61
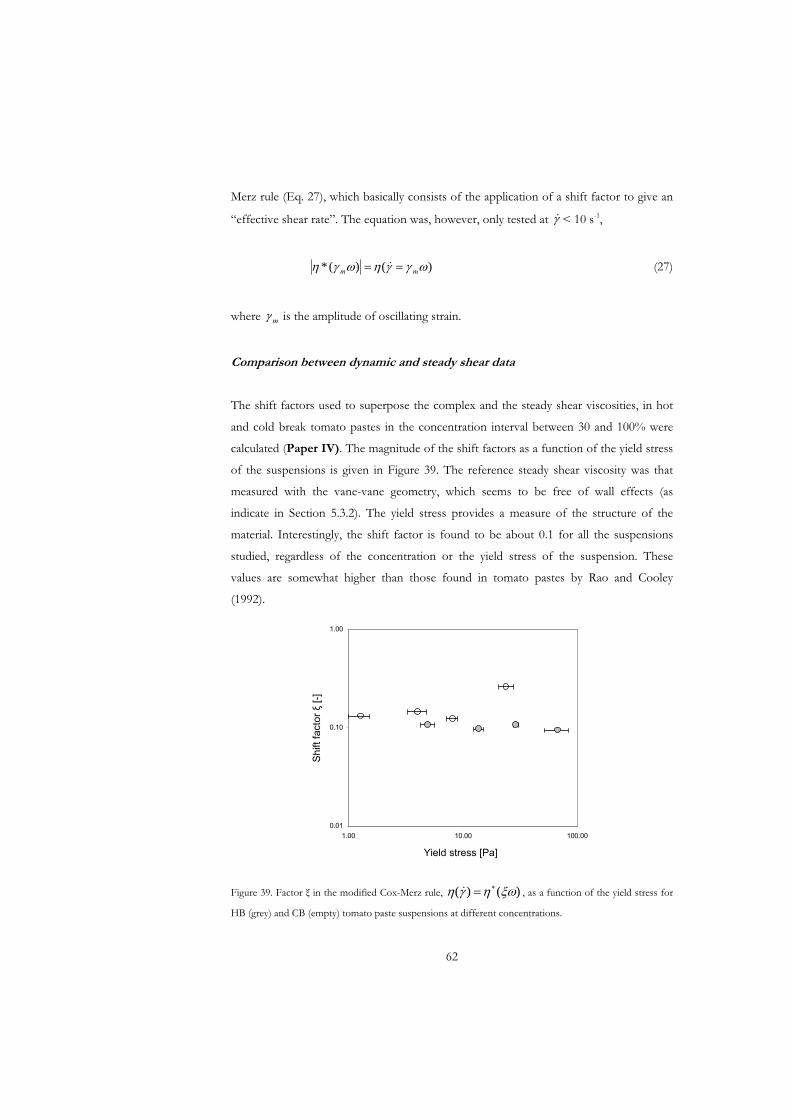
Merz rule (Eq. 27), which basically consists of the application of a shift factor to give an
“effective shear rate”. The equation was, however, only tested at < 10 s-1,
)()(* mm (27)
where m is the amplitude of oscillating strain.
Comparison between dynamic and steady shear data
The shift factors used to superpose the complex and the steady shear viscosities, in hot
and cold break tomato pastes in the concentration interval between 30 and 100% were
calculated (Paper IV). The magnitude of the shift factors as a function of the yield stress
of the suspensions is given in Figure 39. The reference steady shear viscosity was that
measured with the vane-vane geometry, which seems to be free of wall effects (as
indicate in Section 5.3.2). The yield stress provides a measure of the structure of the
material. Interestingly, the shift factor is found to be about 0.1 for all the suspensions
studied, regardless of the concentration or the yield stress of the suspension. These
values are somewhat higher than those found in tomato pastes by Rao and Cooley
(1992).
0.01
0.10
1.00
1.00 10.00 100.00
yield stress
shift
fact
or
Yield stress [Pa]
Shi
ft fa
ctor
[-]
0.01
0.10
1.00
1.00 10.00 100.00
yield stress
shift
fact
or
Yield stress [Pa]
Shi
ft fa
ctor
[-]
Figure 39. Factor in the modified Cox-Merz rule, , as a function of the yield stress for
HB (grey) and CB (empty) tomato paste suspensions at different concentrations.
)()(
62
These shift factors may allow the flow behaviour of the suspensions to be obtained using
oscillatory measurements, instead of the more common steady shear measurements,
which can be subject to a number of experimental errors. Dynamic data could then be
used in food processing design and engineering.
63

6. Conclusions
Processing of food materials, i.e. homogenisation and subsequent shearing, has a
considerable effect on the microstructure of the suspensions formed. These changes are
reflected in the textural and rheological characteristics of the processed foods. Structural
changes during processing seem to be related to the fractions of fine and coarse particles
present in the suspension, the viscosity of the suspending medium, and the
concentration.
The presence of fine particles results in marked time-dependent effects, which result
from the disruption of the network and the formation of elongated, densely packed flocs
of particles upon shearing. These effects are observed as rheopectic behaviour at low
deformations, caused by the tendency of the flocs to orient perpendicularly to the flow,
and as thixotropic behaviour at large deformations, with extensive disruption of the
network, densification of the flocs and an increase in the separation between them.
At high paste concentrations , the rearrangement of particles within the network induced
by processing is better reflected by values of the compressed volume fraction than the
magnitude of the elastic modulus obtained from small-amplitude oscillatory tests. The
relatively poor sensitivity of the elastic modulus to variations in the structure seems to be
a consequence of the suspensions being fully packed.
Tomato suspensions exhibit solid-like behaviour (G >G ), at concentrations as low as
10% tomato paste, which indicates the existence of a network, and the suspensions can
thus be described as weak gels. These suspensions are characterised by a yield stress,
below which the systems are found to deform elastically. Above the yield value, the
system begins to flow.
Tube viscometer measurements show that the flow behaviour of tomato paste is
substantially influenced by an apparent wall slip, which tends to disappear at lower
concentrations. Some difficulties are encountered in the extraction of the rheological data
using tube viscometers when wall slip is present.
65

7. Future Outlook
Basic knowledge on the mechanisms governing structural changes during processing and
their relationship to the textural and rheological properties of food suspensions is
desirable for the optimisation of industrial food processing. Some insights into these
relationships are given in this thesis, but further studies are required.
New approaches are needed, for example, to study and quantify the microstructure. The
use of confocal microscopy will allow the localisation of specific structural elements,
making it possible to follow their rearrangement in different stages of processing. In
addition, the visualisation of the material in three dimensions will be possible. Another
new technique, rheo-microscopy, may be useful to observe the structural changes taking
place on shearing and, at the same time, relate them to the rheological behaviour.
The process of homogenisation and its capacity to create different networks in the
material constitute an enormous field of investigation. The influence of the morphology
of the particles and the viscosity of the suspending medium requires further
investigation. Moreover, the investigation and understanding of the behaviour of
differently homogenised systems upon subsequent shearing are important in order to
prevent, or minimise, the loss of textural properties of products made using industrial
processes involving homogenisation.
The compressive volume fraction and its sensitivity in detecting small changes in the
microstructure of a suspension network should also be studied in greater depth, with the
aim of making it possible to measure the porosity of more concentrated suspension
networks.
Finally, the formation of slip at the wall in tube viscometers could be directly observed
and quantified using techniques such as magnetic resonance imaging (MRI) or
ultrasound. The comparison between direct observation of slip and the behaviour
predicted by Mooney and Mooney-Tikhonov analysis of the tube viscometer data will
give further insights into the “real” flow behaviour of these suspensions.
67

Acknowledgements
During the four years that it has taken to complete this degree, there have been many
people that have contributed in one way or another to this work. I would like to express
my gratitude to all of them.
I want to especially thank Eva Tornberg, my supervisor, for giving me the opportunity of
doing a PhD, and for her support and encouragement over the years, and her endless
enthusiasm about discussing every new result.
I want to thank also Ulf Bolmstedt, my second supervisor, for his positive and
supportive attitude over these years and for shearing his experience about the rheology
world. Fredrik Innings for good discussions and many comments that have made me
think about the results one more time. Also, for his invaluable help in the construction of
the rig equipment. Björn Bergenståhl, who gave me some interesting new thoughts for
interpreting the results in paper II. Petr Dejmek, always open for discussion, and I really
appreciate his help with the Matlab code used in the last paper. I would also like to thank
some undergraduate students that have helped me with part of the experimental work,
Pernilla Månsson and Peter Jansson.
The following companies are gratefully acknowledged for their financial support of this
work: Orkla Foods A/S, Tetra Pak Dairy & Beverage Systems AB and a number of
SMEs together with a regional EU fund. The SMEs are Sveriges Stärkelseproducenter,
Salico AB, Mariannes Farm AB, Kiviks Musteri AB and Reologica Instruments AB.
From them, I would like to thank Ene Pilman, for her support, and for bringing many
tomato samples to the department! Bengt Jakobsson, for revealing many secrets about
the potato fibres and bringing some samples every time I needed them. Mats Larsson,
who came over many times to check the rheometer, and answered all my questions about
it. And Anders Löfgren for shearing his experience about the rig with me. Many other
people from these companies, for many meetings and shearing of ideas.
69
Also, Mats Bergsten, who provided the pump for the rig measurements when I badly
needed it.
Many other people have contributed to this work in a more indirect way. My colleagues
at the department, especially my roommate Hanna, who insisted I could speak Swedish
and was very tolerant with my broken language, Carola for shearing the “writing a thesis
period” with me, Tomas who help me with some math problems, Mattias helping me
with some “tomato explosions” in the pilot plant, Margareta always knowing-
how…mmmh well, I can not mention everyone, but all of you have contributed to create
a friendly and nice atmosphere at the department!
My lunch-mates, Roberto, Ramiro, Federico, Christine, and some other people that join
us from time to time, for these nice, relaxing breaks. Thanks also to all my friends for so
many parties, and Sunday brunches, and dinners…, in short, thanks for your friendship
and for making life so interesting! Maru, Mario, Laura, Eric, Jenny, Carol, Jamil and little
Erik, Roberto, Lotta, Christine, Lucho, Anders, Krike, Ramiro, and Javi. I would also like
to thank my friends in Barcelona, because no matter the time I have been away, I always
feel like nothing has changed when I’m back there.
I would also like to thank my parents, Arturo y Rosa, for their unconditional support and
love, despite they were not very sure what I was really doing in Sweden for such a long
period of time… Gracias por estar siempre ahí, tan cerca, a pesar de la distancia.
Thanks, Giuliano, for being you, always.
70
References
Aguilera, J.M., 2005. Why food microstructure?. Journal of Food Fngineering, 67 (1-2), 3-11.
Annapragada, A., & Adjei, A., 1996. An analysis of the Fraunhofer diffraction method
for particle size distribution analysis and its application to aerosolized sprays. International
Journal of Pharmaceutics, 127 (2), 219-227.
Barnes H.A., & Nguyen, Q.D. 2001. Rotating vane rheometry – a review. Journal of Non-
Newtonian Fluid Mechanics, 98 (1): 1-14.
Barnes, H.A., 1999. The yield stress – ‘panta rei’ – everything flows? Journal of Non-
Newtonian Fluid Mechanics, 81 (1-2): 133-178.
Barnes, H.A. 1997. Thixotropy –a review. Journal of Non-Newtonian Fluid Mechanics, 70, 1-
33.
Barnes, HA, & Walters, K. 1985. The yield stress myth. Rheologica Acta, 24 (4): 323-326.
Bierwagen, G.P., & Saunders, T.E., 1974. Studies of effects of particle-size distribution
on packing efficiency of particles. Powder Technology, 10 (3), 111-119.
Bistany K.L., & Kokini J.L. 1983. Comparison of steady shear rheological properties and
small amplitude dynamic viscoelastic properties of fluid food materials. Journal of Texture
Studies 14 (2): 113-124
Brouwers, H.J.H., 2006. Particle-size distribution and packing fraction of geometric
random packing. Physical Review E, 74 (3), 031309.
Buscall, R., McGowan, I.J., Mills, P.D.A., Stewart, R.F., Sutton, D., White, L.R., & Yates,
G.E., 1987. The rheology of strongly-flocculated suspensions. Journal of Non-Newtonian
Fluid Mechanics, 24 (2), 183-202.
Buscall, R., Mills, P.D.A., Goodwin, J.W., & Lawson, D.W., 1988. Scaling behaviour of
the rheology of aggregate networks formed from colloidal particles. Journal of the Chemical
Society-Faraday Transactions I, 84, 4249-4260, Part 12.
Channell, G.M., Miller, & K.T., Zukoski, C.F., 2000. Effects of microstructure on the
compressive yield stress. AIChE Journal, 46 (1), 72-78.
71
Cheng, D.C.H. 1986. Yield stress - a time-dependent property and how to measure it.
Rheologica Acta, 25 (5): 542-554.
Chou, T.D., & Kokini, J.L. 1987. Rheological properties and conformation of tomato
paste pectins, citrus and apple pectins. Journal of Food Science, 52 (6): 1658-1664.
Citerne, G.P., Carreau, P.J. & Moan, M. 2001. Rheological properties of peanut butter.
Rheologica Acta, 40, 86-96.
Coussot, P., & Ancey, A., 1999. Rheophysical classification of concentrated suspensions
and granular pastes. Physical Review E, 59 (4), 4445-4457.
De Kee, D., Code, & R.K., Turcotte, G., 1983. Flow properties of time-dependent
foodstuffs. Journal of Rheology, 27 (6), 581-604.
Den Ouden, F.W.C., & Van Vliet, T., 1997. Particle size distribution in tomato
concentrate and effects on rheological properties. Journal of Food Science, 62 (3), 565-567.
Den Ouden, F.W.C., 1995. Physico-chemical stability of tomato products. Ph.D. Thesis,
Wageningen Agricultural University.
Dervisoglu, M., & Kokini, J.L. 1986. Effect of different tube materials on the steady
shear tube flow of semi-solid foods. Journal of Food Process Engineering, 8, 137-146.
Doraiswamy, D., Mujumdar, A.N., Tsao, I., Beris, A.N., Danforth, S.C. & Metzner, A.B.
1991. The Cox-Merz rule extended: a rheological model for concentrated suspensions
and other materials with yield stress. Journal of Rheology, 35 (4), 647-685.
Dzuy, N.Q., & Boger, D.V. 1983. Yield stress measurement for concentrated
suspensions. Journal of Rheology, 27 (4): 321-349.
Farris, R.J., 1968. Prediction of the viscosity of multimodal suspensions from unimodal
viscosity data. Transactions of the Society of Rheology, 12 (2), 281-301.
Ferry, J.D., 1980. Viscoelastic properties of polymers (3rd ed.). New York: Wiley.
Fito, P.J., Clemente, G., & Sanz, F.J., 1983. Rheological behavior of tomato concentrate
(hot break and cold break). Journal of Food Engineering, 2, 51-62.
Getchell, R.N., & Schlimme, D.V., 1985. Particle-size of water insoluble tomato solids
measured by laser instrumentation. Journal of Food Science, 50 (5), 1495-1496.
Gleissle, W. & Hochstein, B. 2003. Validity of the Cox-Merz rule for concentrated
suspensions. Journal of Rheology, 47 (4), 897-910.
72
Harper, J.C., & El Sahrigi, A.F., 1965. Viscometric behavior of tomato concentrates.
Journal of Food Science, 30 (3), 470-475.
Hurtado, M.C., Greve, L.C., Labavitch, J.M. 2002. Changes in cell wall pectins
accompanying tomato (Lycopersicon esculentum Mill.) paste manufacture. Journal of Agriculture
and Food Chemistry, 50, 273-278.
Ilker, R., & Szczesniak, A.S., 1990. Structural and chemical bases for texture of plant
foodstuffs. Journal of Texture Studies, 21 (1), 1-36.
Jeffery, BG.B. 1922. In: The structure and Rheology of Complex Fluids, ed. R.G. Larsson, 1999.
Kalyon, D.M. 2005. Apparent slip and viscoplasticity of concentrated suspensions. Journal
of Rheology, 49 (3), 621-640.
Kokini, J.L., & Dervisoglu, M. 1990. Wall effects in the laminar pipe flow of four semi-
solid foods. Journal of Food Engineering, 11, 29-42.
Krulis, M., & Rohm, H., 2004. Adaption of a vane tool for the viscosity determination of
flavoured yoghurt. European Food Research and Technology, 218 (6), 598-601.
Larsson, R.G., 1999. The Structure and Rheology of Complex Fluids. New York: Oxford
University Press.
Lee, D.I., 1970. Packing of spheres and its effect on viscosity of suspensions. Journal of
Paint Technology, 42 (550), 579-587
Lee, Y., Bobroff, S. & McCarthy, K.L. 2002. Rheological characterization of tomato
concentrates and the effect on uniformity of processing. Chemical Engineering
Communications, 189 (3), 339-351.
Lin, H.J., Qin, X.M., Aizawa, K., Inakuma, T., Yamauchi, R. & Kato, K. 2005. Chemical
properties of water-soluble pectins in hot- and cold-break tomato pastes. Food Chemistry,
93 (3), 409-415.
Liu, X., Qian, L., Shu, T., & Tong, Z., 2003. Rheology characterization of sol-gel
transition in aqueous alginate solutions induced by calcium cations through in situ
release. Polymer, 44, 407-412.
Macosko, C.W., 1994. Rheology: Principles, Measurements And Applications. New York: Wiley.
Marti, I., Höfler, O., Fischer, P. & Windhab, E.J. 2005. Rheology of concentrated
suspensions containing mixtures of spheres and fibres. Rheologica Acta, 44, 502-512.
73
Martin, P.J. & Wilson, D.I. 2005. A critical assessment of the Jastrzebski interface
condition for the capillary flow of pastes, foams and polymers. Chemical Engineering Science,
60, 493-502.
Mewis, J. 1979. Thixotropy – A general review. Journal of non-Newtonian Fluid Mechanics, 6,
1-20.
Miller, K.T., Melant, R.M., & Zukoski, C.F. 1996. Comparison of the compressive yield
response of aggregated suspensions: Pressure filtration, centrifugation and osmotic
consotidation. Journal Of The American Ceramic Society, 79 (10): 2545-2556.
Mills, P.D.A., Goodwin, J.W., & Grover, B.W., 1991. Shear field modification of strongly
flocculated suspensions – aggregate morphology. Colloid and Polymer Science, 269 (9), 949.
Mooney, M. 1931. Explicit formulas for slip and fluidity. Journal of Rheology, 2 (2), 210-222.
Muliawan, E.B & Hatzikiriakos, S.G. 2007. Rheology of mozzarella cheese. International
Dairy Journal, 17, 1063-1072.
Muthkumar, M. 1985. Dynamics of polymeric fractals. Journal of Chemical Physics, 83 (6),
3161-3168.
Nakajima, N., & Harrell, E.R., 2001. Rheology of PVC plastisol: particle size distribution
and viscoelastic properties. Journal of Colloid and Interface Science, 238 (1), 105-115.
Narine, S.S., & Marangoni, A.G., 1999. Mechanical and structural model of fractal
networks of fat crystals at low deformations. Physical Review E, 60 (6), 6991-7000.
Nguyen, Q.D., & Boger, D.V. 1992. Measuring the flow properties of yield stress fluids.
Annual Review of Fluid Mechanics 24: 47-88.
Plucinski, J., Gupta, R.K. & Chakrabarti, S. 1998. Wall slip of mayonnaises in
viscometers. Rheologica Acta, 37, 256-269.
Powers, S:R: & Somerford, D.J. 1978. Fibre sizing using Fraunhofer diffraction. Optics
Communications, 26 (3), 313-317.
Qiu, C.G., & Rao, M.A. 1989. Effect of dispersed phase on the slip coefficient of apple
sauce in a concentric cylinder viscometer. Journal of Texture Studies, 20 (1): 57-70.
Raeuber, H.J., & Nikolaus, H., 1980. Structure of foods. Journal of Texture Studies, 11 (3),
187-198.
74
Rao, M.A. & Cooley, H.J. 1992. Rheological behaviour of tomato pastes in steady and
dynamic shear. Journal of Texture Studies, 23, 415-425.
Rao, M.A., 1999. Rheology of Fluid and Semisolid Foods. Principles and Applications. Maryland,
Aspen Publishers, Inc.
Ross-Murphy, S.B., 1988. Small deformation measurements. In J.M.V. Blanshard, & J.R.
Mitchell (Eds.), Food Structure – its Creation and Evaluation (pp. 387-400), London:
Butterworths.
Russ, J.C. 2007. The Image Processing Handbook. Fifth edition, CRC, Boca Raton.
Servais, C., Jones, R., & Roberts, I., 2002. The influence of particle size distribution on
the processing of food. Journal of Food Engineering, 51 (3), 201-208.
Shah, S.A., Chen, Y.-L., Schweizer, K.S., & Zukoski, C.F., 2003. Viscoelasticity and
rheology of depletion flocculated gels and fluids. Journal of Chemical Physics, 119 (16), 8747-
8760.
Steeneken, P.A.M., 1989. Rheological properties of aqueous suspensions of swollen
starch granules. Carbohydrate Polymers, 11 (1), 23-42.
Steffe, J.F. 1996. Rheological Methods In Food Process Engineering. Second edition. Freeman
Press, USA.
Thakur B.R., Singh R.K., & Nelson P.E. 1996. Quality attributes of processed tomato
products: A review. Food Reviews International, 12 (3): 375-401.
Thakur, B.R., Singh, R.K., & Handa, A.K., 1995. Effect of homogenization pressure on
consistency of tomato juice. Journal of Food Quality, 18 (5), 389-396.
Tiziani, S., & Vodovotz, Y., 2005. Rheological effects of soy protein addition to tomato
juice. Food Hydrocolloids, 19 (1), 45-52.
Tornberg, E. 1978. Functional characterisation of protein stabilised emulsions:
emulsifying behaviour of proteins in a valve homogeniser. Journal of the Science of Food and
Agriculture, 29, 867-879.
Valencia, C., Sánchez, M.C., Ciruelos, A., & Gallegos, C., 2004. Influence of tomato
paste processing on the linear viscoelasticity of tomato ketchup. Food Science and Technology
International, 10 (2), 95-100.
75
Valencia, C., Sanchez, M.C., Ciruelos, A., Latorre, A., Madiedo, J.M., & Gallegos, C.
2003. Non-linear viscoelasticity modeling of tomato paste products. Food Research
International, 36 (9-10): 911-919.
Whittle, M, & Dickinson, E. 1998. Large deformation rheological behaviour of a model
particle gel. Journal Of The Chemical Society-Faraday Transactions 94 (16): 2453-2462.
Windhab, E. 1988. A new method for highly sensitive determination of the yield stress
and flow behaviour of concentrated suspensions. In Xth International Congress on Rheology,
Sydney, Australia.
Wyss, H.M., Deliormanli, A.M., Tervoort, E & Gauckler, L.J. 2005. Influence of
microstructure on the rheological behaviour of dense particle gels. AIChE Journal, 51 (1),
134-141.
Wyss, H.M., Tervoort, E.V., & Gauckler, L.J., 2005. Mechanics and microstructures of
concentrated particle gels. Journal of the American Ceramic Society, 88 (9), 2337-2348.
Xu, S.Y., Shoemaker, C.F., & Luh, B.S., 1986. Effect of break temperature on rheological
properties and microstructure of tomato juices and pastes. Journal of Food Science, 51, 399.
Xu, S.Y., Shoemaker, C.F., & Luh, B.S., 1986. Effect of Break Temperature on
Rheological Properties and Microstructure of Tomato Juices and Pastes. Journal of Food
Science, 51 (2), 399.
Yeow, Y.L., Lee, H.L., Melvani, A.R. & Mifsud, G.C. 2003. A new method of processing
capillary viscometry data in the presence of wall slip. Journal of Rheology, 47 (2), 337-348.
Yeow, Y.L., Nguyen, Y.T., Vu, T.D. & Wong, H.K. 2000. Processing the capillary
viscometry data of fluids with yield stress. Rheologica Acta, 39, 392-398.
Yeow, Y.L., Perona, P., & Leong, Y.K. 2001. A reliable method of extracting the
rheological properties of fruit purees from flow loop data. Journal of Food Engineering, 67
(4), 1407-1411.
Yilmazer U., & Kalyon D.M. 1989. Slip effects in capillary and parallel disk torsional
flows of highly filled suspensions. Journal of Rheology 33 (8): 1197-1212.
Yoo, B., Rao, M.A., & Steffe, J.F., 1995. Yield stress of food dispersions with the vane
method at controlled shear rate and shear-stress. Journal of Texture Studies, 26 (1), 1-10.
76