Microsoft ® PowerPoint Presentation to accompany Chapter 18 Global Climate Change Viewing...
12
Microsoft ® PowerPoint Presentation to accompany Chapter 18 Global Climate Change Viewing recommendations for Windows: Use the Arial TrueType font and set your screen area to at least 800 by 600 pixels with Colors set to Hi-Color (16 bit). Viewing recommendations for Macintosh: Use the Arial TrueType font and set your monitor resolution to at
-
date post
20-Dec-2015 -
Category
Documents
-
view
223 -
download
0
Transcript of Microsoft ® PowerPoint Presentation to accompany Chapter 18 Global Climate Change Viewing...

Microsoft® PowerPoint Presentation to accompany
Chapter 18Global Climate Change
Viewing recommendations for Windows: Use the Arial TrueType font and set your screen area to at least 800 by 600 pixels with Colors set to Hi-Color (16 bit).
Viewing recommendations for Macintosh: Use the Arial TrueType font and set your monitor resolution to at least 800 by 600 pixels with Color Depth set to thousands of colors.

Copyright © Houghton Mifflin Company. All rights reserved. 18–2
Figure 18-1: Carbon Emissions Due to Fossil Fuel Consumption, 1860–1995
Source: Adapted from Manne and Richels, Buying Greenhouse Insurance: The Economic Costs of CO2 Emission Limits. Cambridge, MA: MIT Press, 1994. Updated with data only from Carbon Dioxide Information Analysis Center (CDIAC), http://cdiac.esd.ornl.gov/. Courtesy of CDIAC.

Copyright © Houghton Mifflin Company. All rights reserved. 18–3
Figure 18-2: Temperature Trend 1000–2000
Source: Adapted from The Economist, Nov. 18-24, 2000; data from the Carbon Dioxide Information Analysis Center (CDAIC), http://cdiac.csd.esd.ornl.gov/.

Copyright © Houghton Mifflin Company. All rights reserved. 18–4
Figure 18-3: Global Temperature Trends Projected to 2100
Source: IPCC, 1996. IPCC, 2001, projects a slightly higher range of temperature increase from 2.4°C to 5.8°C by 2100.

Copyright © Houghton Mifflin Company. All rights reserved. 18–5
Figure 18-4: Projected Carbon Emissions Through 2020, Business as Usual Scenario
Source: Adapted from Duchin and Lange, 1994.

Copyright © Houghton Mifflin Company. All rights reserved. 18–6
Figure 18-5: Per Capita Emissions of Carbon by Region, Business as Usual Scenario
Source: Adapted from Duchin and Lange, 1994.

Copyright © Houghton Mifflin Company. All rights reserved. 18–7
Figure 18-6: Long-Term Costs and Benefits of Abating Global Climate Change
Source: Adapted from William R. Cline, The Economics of Global Warming, Washington D.C.: Institute for International Economics, 1992. Reprinted by permission of Institute for International Economics.
Copyright © Houghton Mifflin Company. All rights reserved. 18–8
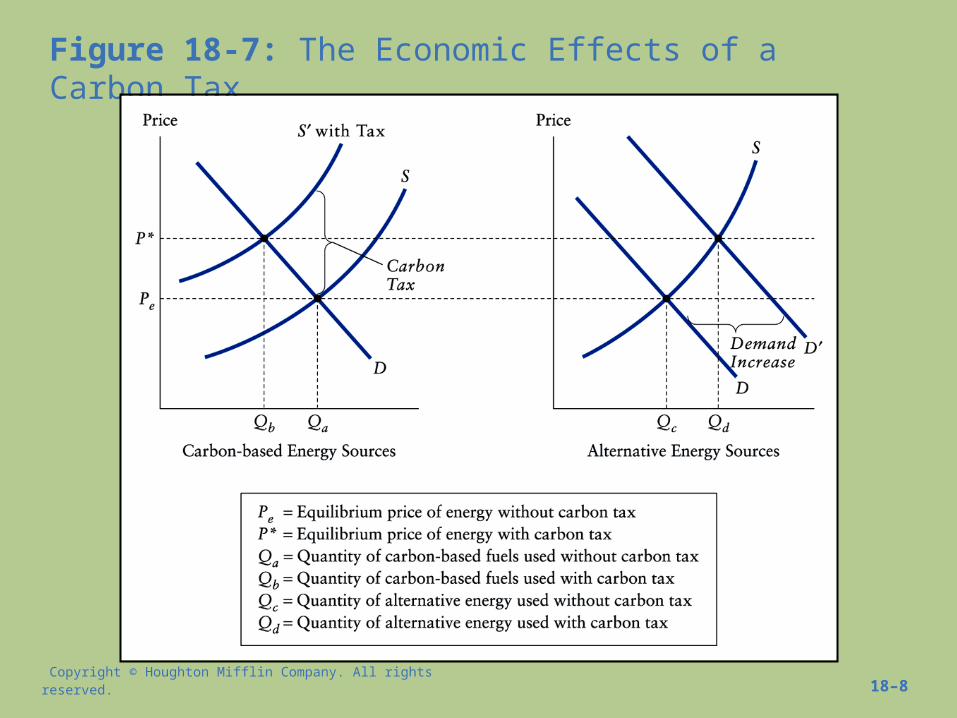
Figure 18-7: The Economic Effects of a Carbon Tax

Copyright © Houghton Mifflin Company. All rights reserved. 18–9
Figure 18-8: Gasoline Price Versus use in Industrial Countries, 1994
Source: Adapted from Roodman, 1997.

Copyright © Houghton Mifflin Company. All rights reserved. 18–10
Figure 18-9: United States Greenhouse Gas Emissions, 1990–2010
Source: Percentage growth and proposed emissions cuts cited in “American Demands Something for Nothing, But the World Needs an End to its Hot Air,” The Independent (London), November 27, 2000.
mirandj:
add source
mirandj:
add source

Copyright © Houghton Mifflin Company. All rights reserved. 18–11
Figure 18-10: Least-Cost Carbon Reduction with Tradable Permits—Determination of Carbon Permit Price

Copyright © Houghton Mifflin Company. All rights reserved. 18–12
Figure 18-10: Least-Cost Carbon Reduction with Tradable Permits—Determination of Carbon Permit Price