Microsensor measurements of hydrogen gas dynamics in ... ·...
12
ORIGINAL RESEARCH published: 21 July 2015 doi: 10.3389/fmicb.2015.00726 Edited by: Martin G. Klotz, Queens College, The City University of New York, USA Reviewed by: Tori Hoehler, National Aeronautics and Space Administration, USA Ferran Garcia-Pichel, Arizona State University, USA *Correspondence: Michael Kühl, Marine Biological Section, Department of Biology, University of Copenhagen, Strandpromenaden 5, Helsingør DK-3000, Denmark [email protected] Specialty section: This article was submitted to Microbial Physiology and Metabolism, a section of the journal Frontiers in Microbiology Received: 10 April 2015 Accepted: 02 July 2015 Published: 21 July 2015 Citation: Nielsen M, Revsbech NP and Kühl M (2015) Microsensor measurements of hydrogen gas dynamics in cyanobacterial microbial mats. Front. Microbiol. 6:726. doi: 10.3389/fmicb.2015.00726 Microsensor measurements of hydrogen gas dynamics in cyanobacterial microbial mats Michael Nielsen 1 , Niels P. Revsbech 1 and Michael Kühl 2,3 * 1 Section of Microbiology, Department of Bioscience, Aarhus University, Aarhus, Denmark, 2 Marine Biological Section, Department of Biology, University of Copenhagen, Helsingør, Denmark, 3 Plant Functional Biology and Climate Change Cluster, University of Technology, Sydney, Ultimo, NSW, Australia We used a novel amperometric microsensor for measuring hydrogen gas production and consumption at high spatio-temporal resolution in cyanobacterial biofilms and mats dominated by non-heterocystous filamentous cyanobacteria (Microcoleus chtonoplastes and Oscillatoria sp.). The new microsensor is based on the use of an organic electrolyte and a stable internal reference system and can be equipped with a chemical sulfide trap in the measuring tip; it exhibits very stable and sulfide-insensitive measuring signals and a high sensitivity (1.5–5 pA per μmol L −1 H 2 ). Hydrogen gas measurements were done in combination with microsensor measurements of scalar irradiance, O 2 , pH, and H 2 S and showed a pronounced H 2 accumulation (of up to 8– 10% H 2 saturation) within the upper mm of cyanobacterial mats after onset of darkness and O 2 depletion. The peak concentration of H 2 increased with the irradiance level prior to darkening. After an initial build-up over the first 1–2 h in darkness, H 2 was depleted over several hours due to efflux to the overlaying water, and due to biogeochemical processes in the uppermost oxic layers and the anoxic layers of the mats. Depletion could be prevented by addition of molybdate pointing to sulfate reduction as a major sink for H 2 . Immediately after onset of illumination, a short burst of presumably photo-produced H 2 due to direct biophotolysis was observed in the illuminated but anoxic mat layers. As soon as O 2 from photosynthesis started to accumulate, the H 2 was consumed rapidly and production ceased. Our data give detailed insights into the microscale distribution and dynamics of H 2 in cyanobacterial biofilms and mats, and further support that cyanobacterial H 2 production can play a significant role in fueling anaerobic processes like e.g., sulfate reduction or anoxygenic photosynthesis in microbial mats. Keywords: hydrogen, oxygen, sulfide, pH, irradiance, microsensor, microbial mat, cyanobacteria Introduction Molecular hydrogen (H 2 ) is produced during fermentative anaerobic degradation of organic matter (Conrad, 1988). Formation of H 2 as a by-product of nitrogenase activity is also described as a major H 2 producing process (Bothe et al., 2010). In excess of energy and reducing power, photosynthetic bacteria can also photo-produce H 2 (Gest and Kamen, 1949; Warthmann et al., 1992). Hydrogen is a very good energy source that is readily reacting with O 2 Frontiers in Microbiology | www.frontiersin.org 1 July 2015 | Volume 6 | Article 726
Transcript of Microsensor measurements of hydrogen gas dynamics in ... ·...
ORIGINAL RESEARCHpublished: 21 July 2015
doi: 10.3389/fmicb.2015.00726
Edited by:Martin G. Klotz,
Queens College, The City Universityof New York, USA
Reviewed by:Tori Hoehler,
National Aeronautics and SpaceAdministration, USA
Ferran Garcia-Pichel,Arizona State University, USA
*Correspondence:Michael Kühl,
Marine Biological Section,Department of Biology,
University of Copenhagen,Strandpromenaden 5,
Helsingør DK-3000, [email protected]
Specialty section:This article was submitted to
Microbial Physiology and Metabolism,a section of the journal
Frontiers in Microbiology
Received: 10 April 2015Accepted: 02 July 2015Published: 21 July 2015
Citation:Nielsen M, Revsbech NP and Kühl M
(2015) Microsensor measurementsof hydrogen gas dynamics
in cyanobacterial microbial mats.Front. Microbiol. 6:726.
doi: 10.3389/fmicb.2015.00726
Microsensor measurements ofhydrogen gas dynamics incyanobacterial microbial matsMichael Nielsen1, Niels P. Revsbech1 and Michael Kühl2,3*
1 Section of Microbiology, Department of Bioscience, Aarhus University, Aarhus, Denmark, 2 Marine Biological Section,Department of Biology, University of Copenhagen, Helsingør, Denmark, 3 Plant Functional Biology and Climate ChangeCluster, University of Technology, Sydney, Ultimo, NSW, Australia
We used a novel amperometric microsensor for measuring hydrogen gas productionand consumption at high spatio-temporal resolution in cyanobacterial biofilmsand mats dominated by non-heterocystous filamentous cyanobacteria (Microcoleuschtonoplastes and Oscillatoria sp.). The new microsensor is based on the use of anorganic electrolyte and a stable internal reference system and can be equipped with achemical sulfide trap in the measuring tip; it exhibits very stable and sulfide-insensitivemeasuring signals and a high sensitivity (1.5–5 pA per µmol L−1 H2). Hydrogen gasmeasurements were done in combination with microsensor measurements of scalarirradiance, O2, pH, and H2S and showed a pronounced H2 accumulation (of up to 8–10% H2 saturation) within the upper mm of cyanobacterial mats after onset of darknessand O2 depletion. The peak concentration of H2 increased with the irradiance level priorto darkening. After an initial build-up over the first 1–2 h in darkness, H2 was depletedover several hours due to efflux to the overlaying water, and due to biogeochemicalprocesses in the uppermost oxic layers and the anoxic layers of the mats. Depletioncould be prevented by addition of molybdate pointing to sulfate reduction as a majorsink for H2. Immediately after onset of illumination, a short burst of presumablyphoto-produced H2 due to direct biophotolysis was observed in the illuminated butanoxic mat layers. As soon as O2 from photosynthesis started to accumulate, the H2
was consumed rapidly and production ceased. Our data give detailed insights intothe microscale distribution and dynamics of H2 in cyanobacterial biofilms and mats,and further support that cyanobacterial H2 production can play a significant role infueling anaerobic processes like e.g., sulfate reduction or anoxygenic photosynthesisin microbial mats.
Keywords: hydrogen, oxygen, sulfide, pH, irradiance, microsensor, microbial mat, cyanobacteria
Introduction
Molecular hydrogen (H2) is produced during fermentative anaerobic degradation of organicmatter (Conrad, 1988). Formation of H2 as a by-product of nitrogenase activity is alsodescribed as a major H2 producing process (Bothe et al., 2010). In excess of energy andreducing power, photosynthetic bacteria can also photo-produce H2 (Gest and Kamen, 1949;Warthmann et al., 1992). Hydrogen is a very good energy source that is readily reacting with O2
Frontiers in Microbiology | www.frontiersin.org 1 July 2015 | Volume 6 | Article 726

Nielsen et al. Hydrogen microenvironment in microbial mats
(chemically or catalyzed by “Knallgas”-bacteria) or is consumedby anaerobic mineralization processes, e.g., as an electron donorin sulfate reduction and in methanogenesis (Hoehler et al., 2002).Anoxygenic photosynthetic bacteria can also utilize hydrogen asan electron donor (Overmann and Garcia-Pichel, 2000).
Efficient inter-species hydrogen transfer in consortiaof microorganisms allows for syntrophic processes, whichseparately would otherwise be energetically unfavorable (Wolin,1982; Hoehler et al., 2001). Consequently, only very low H2concentrations are detected in most natural environments.Higher H2 levels can, however, be found in special environmentslike the digestive tracts of termites (Ebert and Brune, 1997)or in legume nodules harboring N2-fixing bacteria (Witty,1991). Geothermal features can also exhibit high levels of H2,and hydrogenotrophs are widespread in many hot springs,where H2 metabolism can be predominant (Spear et al.,2005).
Hydrogen production in cyanobacteria has been knownfor a long time (Jackson and Ellms, 1896; Benemann andWeare, 1974; Oschchepkov et al., 1974) and has been studiedfor a large number of strains and in different environments(Lambert and Smith, 1981; Houchins, 1984; Kothari et al.,2012; Otaki et al., 2012). In recent years, cyanobacterialH2 production has also become a major research topic inconnection with the search for new clean energy generatingprocesses (e.g., Lee et al., 2010; Hallenbeck, 2012). Productionof H2 in cyanobacteria is primarily associated with N2fixation, where H2 is a major by-product (Bothe et al.,2010), or due to dark fermentation of storage productsaccumulated during daytime photosynthesis (Moezelaar et al.,1996; Stal and Moezelaar, 1997). In a survey of differentcyanobacterial strains, Kothari et al. (2014) demonstrated thatfermentative pathways and bidirectional NADH-linked [Ni-Fe]hydrogenases are of prime importance for H2 production underdark anoxic conditions in the filamentous non-heterocystouscyanobacteria Microcoleus chtonoplastes and Lyngbya aestuariithat form dense microbial mats in coastal and hypersalineenvironments; these species exhibited higher production ratesand reached much higher steady state H2 concentrations thanmany other cyanobacteria. Bidirectional hydrogenases are alsoinvolved in light-driven H2 formation under anoxia via directbiophotolysis, i.e., the light-driven splitting of water (Appel et al.,2000).
Earlier reports of significant H2 production in cyanobacterialmats were based on gas chromatographic analysis of intactmats (Skyring et al., 1988, 1989) and of gas bubbles carefullysampled from the surface of intact hypersaline cyanobacterialmats (Hoehler et al., 2001). The latter study, and more recentlyBurow et al. (2012) studying a coastal microbial mat alsoobtained a coarse depth distribution of H2 production byincubating 2 mm thick slices of mats from different depthhorizons below the surface, showing maximal H2 productionin the top 2 mm of the mat during night time. These findingswere used to hypothesize that H2 production by ancientmicrobial mats and subsequent escape of the H2 to spacewas a major mechanism for facilitating the oxidation of theprimitive Earth (Hoehler et al., 2001; Jørgensen, 2001). A series
of elegant follow up studies combining biogeochemical processmeasurements with modern molecular tools, have (i) identifiedfilamentous non-heterocystous cyanobacteria as the major H2producers in such mats (Burow et al., 2012; Marschall et al.,2012), (ii) demonstrated cyanobacterial fermentation as themajor H2 producing process (Burow et al., 2012; Lee et al.,2014), and (iii) demonstrated that sulfate reducing bacteria(SRB) are predominant hydrogenotrophs in cyanobacterialmats (Burow et al., 2014). There is thus increasing evidencethat fermentative H2 and organic acid production is a keycomponent in microbial mat biogeochemistry facilitating closeinteractions between cyanobacteria, anoxygenic phototrophsand heterotrophic bacteria (Otaki et al., 2012; Lee et al.,2014).
Despite an increasing interest in understanding theproduction and consumption of H2 in the environment,very few studies have described the fine scale distribution anddynamics of H2 (Witty, 1991; Ebert and Brune, 1997). Part of thereason has been lack of suitable technology (Hübert et al., 2011).Conventional Clark-type electrochemical H2 microsensors,which are based on the oxidation of H2 at a positively chargedplatinum electrode in an acidic KCl containing electrolyte (Wanget al., 1971; Witty, 1991), often suffer from unstable signals andcalibration drift when used in natural systems. This has limitedtheir applicability, especially in environments like sedimentsand microbial mats, where H2 measurements were hampered bysulfide interference on the measuring signal.
A sulfide-sensitive amperometric H2 microsensor based onthe use of non-aqueous electrolyte is commercially available(Unisense A/S, Denmark), and a robust version of the sensorhas proven useful for quantifying H2 production in vialswith cyanobacterial cultures (Kothari et al., 2012, 2014). Thissensor has very recently been employed for first microscaleH2 measurement in intertidal microbial mats (Hoffmann et al.,2015) showing pronounced accumulation and efflux of H2 indarkness driven by cyanobacterial fermentation in the uppermm’s of the mat. The microenvironmental dynamics of H2 inhypersaline water covered mats remain to be studied in moredetail, as these mat types often exhibit high sulfide levels causinginterference on the commercial H2 microsensor The sensordesign has now been further improved and a sulfide-insensitiveH2 microsensor was recently developed (Nielsen et al., 2015).In the present study we use these microsensors for studyingthe H2 microenvironment and its relation to light, O2, pH andH2S micro gradients in coastal and hypersaline microbial mats.We demonstrate pronounced H2 dynamics during experimentallight-dark shifts, and discuss the role of H2 for biogeochemicalprocesses in microbial mats.
Materials and Methods
Experimental SetupWe studied H2 dynamics in two different microbial mats, bothharboring a 1–3 mm thick dark-green surface layer with densepopulations of filamentous non-heterocystous cyanobacteria,and anoxygenic Chloroflexi-like phototrophs.
Frontiers in Microbiology | www.frontiersin.org 2 July 2015 | Volume 6 | Article 726
Nielsen et al. Hydrogen microenvironment in microbial mats
Hypersaline MatDense biofilms of filamentous cyanobacteria were retrieved fromthe top layer of a hypersaline microbial mat sampled in a saltevaporation pond of Saline de Giraud, Camargue, France. Themat locality and a detailed description of the biogeochemistryand microbial composition of the mat are presented elsewhere(Fourcans et al., 2004; Wieland et al., 2005). Microbial matsamples were transported to our laboratory and were kept intrays with aerated brine at in situ salinity (∼80–100 ppt) undera 12 h light-12 h dark period in a thermostated room at 16◦C.The mat was covered by a 2-3 mm thick deep-green biofilmof motile filamentous cyanobacteria. Microscopic investigationsof the biofilm showed a dominance of morphotypes similar toM. chtonoplastesmixed with other motile filaments ofOscillatoriasp. and Spirulina sp. The upper millimeters of the mat remainednon-sulfidic due to a conspicuous layer of oxidized iron below thecyanobacterial layer that buffered against sulfide formation in theuppermost mat layer during night-time (see details in Wielandet al., 2005).
Prior to experiments, a small piece of the surface biofilmwas transferred to a small 3–4 mm high and 8 mm wide glassbeaker with a thin layer of semisolid agar at ∼38–40◦C. Duringsubsequent cooling the biofilm bottom and side adhered to thesolidifying agar leaving the upper biofilm surface uncovered. Thesmall beaker was mounted in a flow chamber (Lorenzen et al.,1995) with the biofilm surface flush with a larger agar slab, andaerated brine (90 ppt, 25◦C, pH 8) was constantly circulated overthe biofilm surface. The air-saturated brine contained 154 µmolO2 l−1 according to a table compiled from published empiricalsolubility equations1. Illumination was provided with a fiber-optic halogen lamp equipped with a collimating lens (KL-2500,Schott, Germany), where the irradiance was regulated with abuilt-in neutral density screen. During long-term incubations thelamp was turned on and off at defined times by an electricalswitch with a timer. Irradiance levels at defined lamp settingswere determined with a quantum irradiance meter (LI-250,LiCor, USA) equipped with a small spherical irradiance sensor(Walz GmbH, Germany).
Coastal MatCoastal microbial mat samples were collected in smallacrylate coring tubes from the upper air-exposed yet moistpart of a sandbar in Limfjorden near Aggersund, Denmark(57◦00′02.15N; 9◦17′12.89E). The mat undergoes irregular cyclesof inundation and air exposure depending on prevailing winddirections and consisted of well sorted fine grained sand boundtogether by a dense 2–3 mm top layer of motile filamentouscyanobacteria (M. chtonoplastes and Oscillatoria sp.) and somegreen filamentous anoxygenic phototrophs Chloroflexus sp. andexopolymers on top of a black sulfidic layer, which also containedfilamentous sulfide oxidizing bacteria (Beggiatoa sp.; Lassenet al., 1992). The mat samples were incubated for 1–2 daysin aerated seawater under moderate illumination by halogenlamps (∼100–200 µmol photons m−2 s−1) prior to experiments.
1http://www.unisense.com/files/PDF/Diverse/Seawater%20&%20Gases%20table.pdf
During this time, the surface became densely covered by a denselayer of filamentous cyanobacteria (Supplementary Figure S1A).For comparison, we also sampled and investigated permanentlysubmerged sediment samples from the same locality that werepredominated by a dense benthic diatom film (SupplementaryFigure S1B); these samples were obtained at the same location butfrom a sandier and less sulfidic sediment that was permanentlywater covered.
Experiments were conducted with the core samples mountedin an aquarium 1 cm below the surface of continuously aeratedseawater (25 ppt, 21–22◦C), which was circulated over themat by a gentle airstream from a Pasteur pipette. The air-saturated seawater contained 240 µmol O2 l−1 according to atable compiled from published empirical solubility equations1.Illumination was provided by a halogen lamp bulb, where theirradiance was regulated by varying the distance to the matsurface. During long-term incubations, the lamp was turned onand off at defined times by an electrical switch with a timer.Irradiance levels at defined lamp distance were determined witha quantum irradiance meter (LI-250, LiCor, USA) equipped witha small spherical irradiance sensor (Walz GmbH, Germany).
Inhibition of sulfate reduction in the mat was done byincubating a mat sample in aerated and stirred sea water with2.5 mM sodium molybdate for 6 h prior to measurements.Using published diffusion coefficients (D) of molybdate in water(9.91·10−6 cm2 s−1; Li and Gregory, 1974) and gel (6.48·10−6
cm2 s−1; Mason et al., 2005), we estimated the penetration depthof molybdate after t = 6 h of incubation as L = √
2Dt assuming aone-dimensional diffusion geometry (Berg, 1983). This showedthat after 6 h of incubation, molybdate penetrated about 5.3–6.5 mm into the microbial mat ensuring sufficient exposure ofSRB’s in the complete photic zone as well as several mm’s of theunderlaying aphotic zone of the mat.
Microsensor Measurements of O2, pH, H2S,and H2Chemical microprofiles were measured with electrochemicalmicrosensors for O2, H2S, pH and H2 with tip diametersof 10–70 µm (Unisense A/S, Denmark). Construction ofelectrochemical O2, pH, and H2S microsensors, their calibrationand application have been described in previous publications(Revsbech and Jørgensen, 1986; Revsbech, 1989; Kühl et al., 1996,1998; Kühl and Revsbech, 2001).
The H2 microsensor is constructed like a Clark-type O2microsensor (Revsbech, 1989) and consists of an outer casingsealed by a thin silicon rubber membrane, and an internalmeasuring microanode polarized at +0.6 to +1.0 V relativeto an internal reference electrode. The casing is filled withan organic electrolyte and this configuration facilitates a stablemeasurement of H2 via its oxidation at the measuring anode.The H2 microsensor is commercially available and further detailson the sensor and its calibrations can be obtained from themanufacturer’s website2. We tested the interference of severalcompounds, which can pass the silicon membrane of the H2microsensor and react at the measuring anode. Compounds like
2www.unisense.com
Frontiers in Microbiology | www.frontiersin.org 3 July 2015 | Volume 6 | Article 726

Nielsen et al. Hydrogen microenvironment in microbial mats
dimethyl sulfide (DMS) andmethyl mercaptan can strongly affectthe microsensor performance and seem to have a poisoningeffect, but levels of these potential interfering agents in microbialmats have been found to be in the lower nM range (Visscher et al.,2003) and should thus not affect our measurements significantly.We found no interference from carbon monoxide, which hasbeen shown to be present in hypersaline microbial mats duringdaytime (Hoehler et al., 2001) and is a known interfering agentof amperometric H2 sensors with aquatic electrolytes (Hübertet al., 2011). No sensitivity to light was observed. In the absenceof a H2S shield, dissolved H2S is a major interfering substanceand for a given concentration gives rise to a signal of ∼20–30% of the signal measured for the same concentration of H2(Nielsen et al., 2015). However, bymounting a thin outer capillarycontaining ZnCl2 in propylene carbonate and sealed with a thinsilicone membrane, sulfide insensitive H2 microsensors can beconstructed (Nielsen et al., 2015). We did not repeat tests ofCO, DMS, and methyl mercaptan interference on the sulfideinsensitive H2 sensors, but such interference will not be largerthan on the unshielded sensors.
The new H2S insensitive H2 microsensor (see Nielsen et al.,2015 for details on construction and sensor design) exhibits alinear response from 0 to 100% H2. By varying the thicknessand diameter of the silicone membrane sealing the microsensortip as well as the distance from the membrane to the internalmeasuring anode, we could manufacture H2 microsensors withvarious measuring characteristics. Sensors without a H2S shieldcould be constructed with a very fast response time of <0.2 s,but they also exhibited a relatively large stirring sensitivity,which can cause severe measuring artifacts, especially whenmeasuring concentration gradients within a gradient of flow,e.g., in the diffusive boundary layer above sediments andbiofilms (Revsbech, 1989; Klimant et al., 1995). Hydrogen gasmicrosensors with a lower stirring sensitivity can be constructedby using smaller silicone membrane diameters and a longerinternal diffusion path, and here the presence of a H2S shieldcontributes to the latter. The sulfide insensitive H2 microsensorsused in this study exhibited a sensitivity of 1.5–5 pA µM−1 H2,with a negligible stirring sensitivity and a 90% response time of∼20–40 s. In all cases, the new H2 microsensors exhibited lowand stable zero currents (1–10 pA) and a temperature sensitivitysimilar to other amperometric microsensors, i.e., an increase insensor signal of 2–3% per ◦C.
We calibrated the sensor in salt water flushed with variousdefined amounts of H2, either by help of a gas-mixing unit orby using commercially available defined mixtures of H2 andN2. Hydrogen data were either expressed as partial pressures(%H2 saturation) or in molar concentration units. The H2concentration in saturated water at experimental salinity andtemperature was calculated from tabulated values of H2 solubilityaccording to Wiesenburg and Guinasso (1979).
The amperometric microsensors were used in connectionwith a pA-meter (PA2000 andMicrosensor Multimeter, UnisenseA/S, Denmark), while the pH microsensors were used witha standard calomel reference electrode both connected to ahigh impedance mV meter (Microsensor Multimeter, UnisenseA/S, Denmark). Measuring signals were either recorded on a
stripchart recorder (BD-25, Kipp&Zonen, Netherlands) or viaan A/D converter (Unisense A/S, Denmark) connected to a PC.Microsensors were mounted in a motorized micromanipulatorthat was mounted on a heavy stand and was remotely controlledby a PC-interfaced motor controller (Unisense A/S, Denmark).Automated data acquisition and positioning of microsensors wasdone with commercial software (Profix and Sensor TracePro,Unisense A/S, Denmark). The microsensors were inserted intothe biofilm vertically from above in defined steps of 100–200 µm.
The efflux of H2 from the microbial mats, J(H2) quantified netH2 production and was calculated from measured concentrationgradients using Fick’s firs law, J(H2)=D ∗ (dC/dz), where D is themolecular diffusion coefficient of H2 at experimental temperatureand salinity and dC/dz is the linear H2 concentration gradientin the diffusive boundary layer above the mat. Similar fluxcalculations, J(O2) were done with O2 concentration profiles toquantify net photosynthesis in the light and dark O2 uptake rates,using the molecular diffusion coefficient of O2 at experimentaltemperature and salinity. Diffusion coefficients were taken fromBroecker and Peng (1974) and corrected for temperature andsalinity according to Li and Gregory (1974): D(O2) = 2.05·10−5
cm2 s−1 and D(H2) = 3.93·10−5 cm2 s−1 at 21◦C and 25 ppt;D(O2) = 2.04·10−5 cm2 s−1 and D(H2) = 3.90·10−5 cm2 s−1 at25◦C and 90 ppt.
Microsensor Measurements of ScalarIrradianceLight penetration in the coastal microbial mat was measuredwith a scalar irradiance microsensor (Lassen et al., 1992; Kühlet al., 1997; Kühl, 2005) connected to a sensitive fiber-opticspectrometer (QE65000, Ocean Optics, USA) that was interfacedto a PC running dedicated spectral acquisition software(Spectrasuite, OceanOptics, USA).Mat samples were illuminatedvertically from above with a fiber-optic halogen lamp equippedwith a collimating lens (KL-2500, Schott, Germany), where thedownwelling photon irradiance was regulated with a built-inneutral density screen to 500 µmol photons m−2 s−1. A scalarirradiance microsensor was mounted in a manually operatedmicromanipulator (MM33, Märtzhäuser GmbH, Germany) andinserted into the mat at a 45◦ angle relative to the verticallyincident light. Measurements were corrected for the measuringangle, and depths are given as vertical depth below the matsurface. Data were normalized to the incident downwellingirradiance as measured with the scalar irradiance microsensorpositioned in the light path at similar distance as the mat surfacebut over a black light absorbing well.
Results and Discussion
We measured H2 dynamics in two different cyanobacterial mats:(i) a hypersaline mat with a pronounced layer of oxidizediron buffering the cyanobacterial top layer against sulfideexposure (Wieland et al., 2005), and (ii) a highly sulfidiccoastal cyanobacterial mat (Lassen et al., 1992). Data from thehypersaline mat were measured with H2 microsensors withouta sulfide trap and in the absence of H2S, as checked with a
Frontiers in Microbiology | www.frontiersin.org 4 July 2015 | Volume 6 | Article 726

Nielsen et al. Hydrogen microenvironment in microbial mats
H2S microsensor (data not shown). Data in the highly sulfidiccoastal mat were measured with H2 microsensors equipped witha chemical sulfide trap in front of the measuring tip (Nielsen et al.,2015).
Hydrogen Production in the HypersalineCyanobacterial MatWhen incubated under an irradiance of 800 µmol photonsm−2 s−1 for 2.5 h, intense photosynthesis in the dense 2–3 mm thick hypersaline cyanobacterial biofilm lead to hyperoxicconditions reaching 4–5 times air saturation in the upper mmand supersaturating O2 levels throughout the whole sample,which was contained in a small glass container (Figure 1A).Upon darkening, O2 was most rapidly depleted in the regionshowing highest O2 production activity in light, and H2 wasfirst detected in this zone after 15 min. As O2 became furtherdepleted, H2 accumulated to higher concentrations and over awider zone in the biofilm reaching a maximum of 8µmol H2 L−1
(∼1.6% H2) at 1 mm depth after 2 h in the dark. Hydrogen wasconsumed in the lowermost parts of the biofilm sample, whichwas constrained by the bottom of the small glass incubationcontainer. The apparent migration of the H2 peak into slightlydeeper layers probably reflects a shift in the relative balancebetween H2 production, consumption and transport, especiallyas the mat sample was confined in a small glass vial presenting adiffusion barrier ∼4 mm below the mat surface.
We note that the absolute amount of H2 produced in themats after darkening apparently depended on the irradiance levelduring the previous light incubation. When we increased theirradiance to 1800 µmol photons m−2 s−1 for 2.5 h we again sawa very strong O2 accumulation in the sample but observed amuchhigher H2 production reaching ∼2% H2 15 min after onset ofdarkness. Maximal levels of 40–50 µM (8–9% H2) were reachedin the upper millimeters of the mat within 30 min after darkening(Figure 2A). These H2 levels are higher than most other findings
FIGURE 1 | Concentration profiles of O2 (A) and H2 (B) in a hypersalinemicrobial mat measured after 2.5 h under a photon irradiance of800 µmol photons m−2 s−1 and as a function of time after darkening.
FIGURE 2 | (A) Concentration profiles of H2 in a hypersaline microbial mat asa function of time after darkening. (B) Concentration profiles of H2 and O2
measured after 15 min darkness. The mat sample was incubated 2.5 h undera photon irradiance of 1800 µmol photons m−2 s−1 prior to darkening.
in more permanently submerged hypersaline mats that generallyexhibit lower H2 accumulation than intertidal mats (Table 1).
We speculate that the apparent enhancement in H2production with irradiance reflects a higher accumulationof storage products in the cyanobacteria enhancing subsequentdark fermentation. A similar explanation was proposed byHoffmann et al. (2015), who measured sustained H2 productionduring darkness in intertidal microbial mats kept in a greenhousefor 1.5 years, and with an apparent positive correlation betweenthe solar radiative flux during daytime and the night-timeH2 production in the mats. A rigorous test of this hypothesiswould require measurements of cyanobacterial photosynthateaccumulation as well as H2 and fermentation products as afunction of light incubation time and may be complicated by thecross-feeding of cyanobacterial fermentation products to othermat members such as SRB and Chloroflexi (Burow et al., 2014;Lee et al., 2014). Measurements on cyanobacterial cultures usingmethodology described by Kothari et al. (2014) may thus bemore straightforward.
Alignment of H2 and O2 microsensor measurements showedthat H2 diffused out of the mat in the dark (Figure 2B) withan estimated maximal H2 efflux of ∼23.8 nmol H2 cm−2 h−1
amounting to about 13% of the diffusive O2 uptake of 182.2 nmolO2 cm−2 h−1 in the dark and 2% of the net photosynthetic O2production in light of 1420 nmol O2 cm−2 h−1. Hoffmann et al.(2015) did similar measurements in different intertidal mats andfound that H2 production in the dark amounted to 0.2–5% of netphotosynthesis and 0.4–28% of O2 respiration.
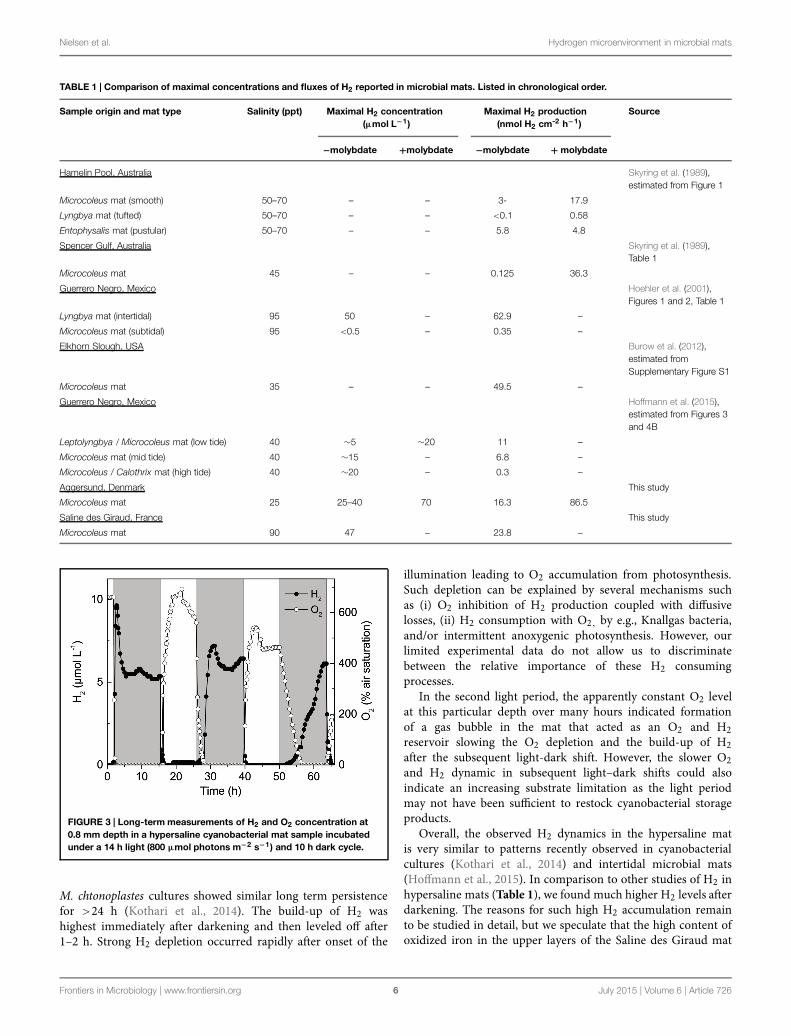
Long-term experiments with simultaneous O2 and H2measurements over several days (14 h dark: 10 h light) withthe microsensor tips positioned 0.8 mm below the mat surface,i.e., in the zone of maximal O2 production in the light,showed recurrent H2 production that persisted in the anoxicmat throughout the 14 h dark incubation period (Figure 3).Quantification of H2 production in Lyngbya aestuarii and
Frontiers in Microbiology | www.frontiersin.org 5 July 2015 | Volume 6 | Article 726
Nielsen et al. Hydrogen microenvironment in microbial mats
TABLE 1 | Comparison of maximal concentrations and fluxes of H2 reported in microbial mats. Listed in chronological order.
Sample origin and mat type Salinity (ppt) Maximal H2 concentration(µmol L−1)
Maximal H2 production(nmol H2 cm-2 h−1)
Source
−molybdate +molybdate −molybdate + molybdate
Hamelin Pool, Australia Skyring et al. (1989),estimated from Figure 1
Microcoleus mat (smooth) 50–70 – – 3- 17.9
Lyngbya mat (tufted) 50–70 – – <0.1 0.58
Entophysalis mat (pustular) 50–70 – – 5.8 4.8
Spencer Gulf, Australia Skyring et al. (1989),Table 1
Microcoleus mat 45 – – 0.125 36.3
Guerrero Negro, Mexico Hoehler et al. (2001),Figures 1 and 2, Table 1
Lyngbya mat (intertidal) 95 50 – 62.9 –
Microcoleus mat (subtidal) 95 <0.5 – 0.35 –
Elkhorn Slough, USA Burow et al. (2012),estimated fromSupplementary Figure S1
Microcoleus mat 35 – – 49.5 –
Guerrero Negro, Mexico Hoffmann et al. (2015),estimated from Figures 3and 4B
Leptolyngbya / Microcoleus mat (low tide) 40 ∼5 ∼20 11 –
Microcoleus mat (mid tide) 40 ∼15 – 6.8 –
Microcoleus / Calothrix mat (high tide) 40 ∼20 – 0.3 –
Aggersund, Denmark This study
Microcoleus mat 25 25–40 70 16.3 86.5
Saline des Giraud, France This study
Microcoleus mat 90 47 – 23.8 –
FIGURE 3 | Long-term measurements of H2 and O2 concentration at0.8 mm depth in a hypersaline cyanobacterial mat sample incubatedunder a 14 h light (800 µmol photons m−2 s−1) and 10 h dark cycle.
M. chtonoplastes cultures showed similar long term persistencefor >24 h (Kothari et al., 2014). The build-up of H2 washighest immediately after darkening and then leveled off after1–2 h. Strong H2 depletion occurred rapidly after onset of the
illumination leading to O2 accumulation from photosynthesis.Such depletion can be explained by several mechanisms suchas (i) O2 inhibition of H2 production coupled with diffusivelosses, (ii) H2 consumption with O2, by e.g., Knallgas bacteria,and/or intermittent anoxygenic photosynthesis. However, ourlimited experimental data do not allow us to discriminatebetween the relative importance of these H2 consumingprocesses.
In the second light period, the apparently constant O2 levelat this particular depth over many hours indicated formationof a gas bubble in the mat that acted as an O2 and H2reservoir slowing the O2 depletion and the build-up of H2after the subsequent light-dark shift. However, the slower O2and H2 dynamic in subsequent light–dark shifts could alsoindicate an increasing substrate limitation as the light periodmay not have been sufficient to restock cyanobacterial storageproducts.
Overall, the observed H2 dynamics in the hypersaline matis very similar to patterns recently observed in cyanobacterialcultures (Kothari et al., 2014) and intertidal microbial mats(Hoffmann et al., 2015). In comparison to other studies of H2 inhypersaline mats (Table 1), we found much higher H2 levels afterdarkening. The reasons for such high H2 accumulation remainto be studied in detail, but we speculate that the high content ofoxidized iron in the upper layers of the Saline des Giraud mat
Frontiers in Microbiology | www.frontiersin.org 6 July 2015 | Volume 6 | Article 726

Nielsen et al. Hydrogen microenvironment in microbial mats
(Wieland et al., 2005) may lead to less sulfate reduction and thusless consumption of H2, in contrast to most other hypersalinemat systems that often become highly sulfidic in darkness due tointense sulfate reduction in the top layers. However, the higher H2levels may also simply reflect that the small glass incubation vialconfined the sample to only a 3–4mm thick top layer and thus didnot allow a diffusive exchange and consumption in deeper moresulfidic mat layers. There is thus clearly a need for more detailedH2 and H2S measurements on deeper mat cores from Saline desGiraud.
Hydrogen Dynamics in Coastal CyanobacterialMatsMore detailedmicroenvironmental analyses of H2 dynamics weredone in a sulfidic coastal cyanobacterial mat (SupplementaryFigure S1A), whereas measurements in coastal sediment with asurface biofilm of diatoms (Supplementary Figure S1B) showedno accumulation of H2 (data not shown). Spectral scalarirradiance measurements showed strong light attenuation withdepth in the dense 1–2 mm thick top layer of the coastal mat,where distinct throughs in the transmission spectra indicateda high density of cyanobacteria with Chl a and phycobilins,as well as anoxygenic phototrophs with Bchl a and Bchl c(Supplementary Figure S2), with the latter being indicative ofthe presence of Chloroflexi. The euphotic zone for oxygenicphotosynthesis was limited to the uppermost mm of the mat,wherein visible light (PAR, 400–700 nm) was attenuated to∼0.1 µmol photons m−2 s−1 (Figure 4A). Similar opticalcharacteristics were found in samples from the same site byLassen et al. (1992) >20 years ago.
FIGURE 4 | Light and chemical gradients in a coastal cyanobacterialmat under an incident photon irradiance of 500 µmol photons m−2
s−1. (A) Depth profiles of photon scalar irradiance, O2 and H2Sconcentrations. (B) Depth profiles of pH and H2 concentration. Symbols witherror bars for chemical parameters represent the mean ± SD (n = 3).
Chemical Microenvironment in LightThe chemical conditions in the mat exhibited steep concentrationgradients (Figure 4). Under high irradiance of PAR (500 µmolphotons m−2 s−1), intense photosynthesis led to peak O2concentrations of ∼4.5 times air-saturation 0.5 mm below themat surface. However, O2 only penetrated to ∼1.2 mm in thelight due to intense respiration and re-oxidation of reducedchemical species. Sulfide was produced by SRB in deeper matlayers, where H2S levels reached about 0.5 mM at 3 mmdepth. Sulfide was re-oxidized by O2 in a thin zone around1.2-1.4 mm depth. Strong photosynthesis caused a strong pHincrease in the photic zone peaking at pH 10 around 0.5–0.7 mm below the mat surface, i.e., >2 pH units above theoverlaying water pH of 7.9. With increasing depth, pH droppedby ∼3 units reaching pH <7 in the sulfide oxidation zonebefore stabilizing around pH 7 in deeper mat layers. No H2was detected in the upper millimeters of the illuminated mat.Measurements in another mat sample from the same habitatshowed the same chemical zonations and extremes, albeit with asomewhat deeper O2 penetration depth in light of ∼1.5 mm anda more heterogeneous distribution of H2S in deeper mat layers(Supplementary Figure S3).
Hydrogen Gas Production and Chemical Dynamicsafter DarkeningThe chemical conditions in the coastal mat changed dramaticallyafter darkening (Figure 5). Within 5 min after darkening, O2became strongly depleted and only penetrated ∼0.3 mm intothe mat, with a further decrease in the O2 penetration depth to0.2mmover the following 85min. TheO2 andH2S concentrationprofiles were initially separated by a∼0.7 mmwide zone, whereinH2 accumulated rapidly after darkening. Peak concentrationswere measured 0.5–0.7 mm below the mat surface increasingfrom ∼13 µM H2 after 5 min to ∼22 µM H2 after 45 min darkincubation. Over this time interval, pH in the H2 production zonedecreased to a stable value of pH 7.2–7.8. Produced H2 diffusedboth toward the mat surface and toward the sulfidic zone, whereit was consumed. After 45 min, H2 levels in the mat started todecrease, while sulfide levels continued to increase in the uppermat layers. Sulfide started to overlap with the O2 concentrationprofile after 90 min. Hydrogen levels in the mat continuedto decrease slowly and in a second experiment complete H2depletion was only found after about 7 h dark incubation asseen in Figure 6, where data from continuous measurements at0.6 mm depth are shown. The observed pattern of rapid build-upfollowed by a slow decline in H2 concentration follows a similarpattern observed in studies of H2 evolution in cyanobacterialisolates (Kothari et al., 2012).
Hydrogen Accumulation in the Presence ofMolybdateAdditional measurements of H2 production after onset ofdarkness were done in another coastal mat sample from thesame habitat (Figure 7) that was incubated 8 h under a photonirradiance of 500 µmol photons m−2 s−1 prior to darkening.When incubated in normal seawater, the mat reached maximalconcentrations of ∼18 µM H2 at 0.5–0.7 mm depth within
Frontiers in Microbiology | www.frontiersin.org 7 July 2015 | Volume 6 | Article 726

Nielsen et al. Hydrogen microenvironment in microbial mats
FIGURE 5 | Chemical gradients in a coastal cyanobacterial mat (same sample as in Figure 4) as a function of time after darkening. Prior to darkening,the mat was incubated in aerated seawater under a photon irradiance of 500 µmol photons m−2 s−1.
FIGURE 6 | Accumulation and depletion of H2 in a coastalcyanobacterial mat (same sample as in Figure 4) as a function of timeafter darkening. Measurements were performed 0.6 mm below the matsurface in the zone of maximal H2 production (see Figure 5).
60 min after darkening, where after H2 levels in the matdeclined gradually to ∼1.5 µM H2 after 720 min in darkness(Figures 7A,B). Thereafter, the same mat was incubated 6 hunder a photon irradiance of 500 µmol photons m−2 s−1
in seawater with 2.5 mM molybdate, an inhibitor of sulfatereduction. Measurements in light at the end of this incubationshowed a similar O2 and pH distribution, whereas H2S levelsin the mat were much lower below the photic zone than inthe absence of molybdate (Supplementary Figures S3 and S5);interestingly, a slight accumulation of H2 (reaching 1–1.5 µM)was also observed in deeper mat layers around 3 mm depth afterthe molybdate treatment, i.e., in the aphotic zone that exhibitedhigh H2S levels in the absence of molybdate.
In presence of molybdate, the H2 accumulation in the matafter darkening was much stronger and H2 penetrated deeperinto the mat (Figure 7C). Within 30 min after darkening,H2 concentrations reached peak values of >60 µM H2 0.6–0.8 mm below the mat surface. The H2 concentrations remainedhigh in the dark incubated mat for about 5 h and showed
FIGURE 7 | Accumulation and depletion of H2 in a coastalcyanobacterial mat as a function of time after darkening (see numbersand color legends in the graph). Prior to darkening, the mat was incubatedunder a photon irradiance of 500 µmol photons m−2 s−1 in aerated seawaterfor 8 h without (A,B) and for 6 h with 2.5 mM molybdate (C). Note the use ofdifferent concentration ranges in the different panels.
much slower H2 depletion than in the absence of molybdate.Without molybdate, the produced H2 penetrated to a depthof 1.1–1.3 mm where it became fully depleted in a relativelynarrow zone (Figures 7A,B). In the presence of molybdate, H2penetrated to a depth of almost 2 mm and the H2 concentrationprofile showed a much more gradual depletion with depth(Figure 7B). Both with and without molybdate, there was noindication of strong H2 depletion in the uppermost mat layerand the microprofiles showed an efflux of H2 into the overlayingwater. The H2 efflux was strongly stimulated in the presence ofmolybdate (Table 1). In the absence of molybdate, the maximalH2 efflux 60 min after onset of darkness reached 16.3 nmolH2 cm−2 h−1 amounting to 5.5% of the dark O2 consumption(296.2 nmol O2 cm−2 h−1) and 1% of the net photosynthetic O2production prior to darkening (1500 nmol O2 cm−2 h−1). In the
Frontiers in Microbiology | www.frontiersin.org 8 July 2015 | Volume 6 | Article 726

Nielsen et al. Hydrogen microenvironment in microbial mats
presence of molybdate, the maximal H2 efflux reached 86.5 nmolH2 cm−2 h−1 amounting to 29% of the darkO2 consumption and6% of the net photosynthesis.
Hoffmann et al. (2015) did a similar experiment in intertidalmicrobial mats showing stimulated H2 production reaching 4times higher peak concentrations of H2 in the presence ofmolybdate reaching up to ∼20 µM H2 in the upper mm ofthe mat (Table 1). However, their measurements with a sulfidesensitive H2 microsensor showed a H2 concentration peak ontop of an apparent gradually increasing H2 concentration withdepth, which can be interpreted as an sulfide interference on themicrosensor signal (see below).
Bulk measurements of the H2 production of coastal andhypersaline mats (Skyring et al., 1989) and in the upper 2 mmof a coastal cyanobacterial mat (Burow et al., 2014) and twohypersaline cyanobacterial mats (Lee et al., 2014) all showed astrong stimulation of H2 production upon inhibition of sulfatereduction activity by addition of molybdate to the incubationvials. Molecular analyses of the microbial diversity and geneexpression in suchmats identified SRB asmajor hydrogenotrophsin the mat along with filamentous anoxygenic phototrophsbelonging to the Chloroflexi (Burow et al., 2014; Lee et al., 2014).In the present study, we did not investigate the distributionand identity of SRB or Chloroflexi or their hydrogenase geneexpression in the mat samples, but our H2 microsensor datastrongly support the findings in other cyanobacterial matsidentifying SRB as primary hydrogenotrophs in the upper matlayers.
A close spatial co-occurrence of SRB and cyanobacteria hasbeen demonstrated in the upper millimeters of several microbialmat environments (e.g., Baumgartner et al., 2006; Fike et al.,2008), including observation of migratory behavior of motile SRBtoward the photic zone (Krekeler et al., 1998). This has beenascribed to aerobic sulfate reduction (Canfield and Des Marais,1991) and/or a possible aerotaxis combined with aggregation andhigh O2 respiration as a survival mechanism for SRB in the photiczone (Cypionka, 2000; Baumgartner et al., 2006). But the presenceof SRB within the photic zone also reflects the easy access of SRBto both electron donor and acceptor immediately after onset ofdarkness and onset of fermentative H2 production (Lee et al.,2014), and we note that some SRB can also catalyze the oxidationof H2, organic substrates and inorganic sulfur species with O2as an electron acceptor (Dannenberg et al., 1992). Metabolicflexibility including a versatile H2 metabolism and chemotaxisof SRB may thus enable them to thrive in the highly variablechemical microenvironment of the photic zone in microbialmats.
Photo-Stimulation of H2 ProductionSimultaneous measurements of O2 and H2 concentration in thecoastal mat at a depth of 0.6 mm, i.e., within the zone of maximalH2 production in the dark and photosynthetic O2 productionin the light, showed pronounced dynamics (Figure 8). In thedark, O2 was depleted completely and H2 concentrations reachedlevels of 20–25 µM H2 after 15–20 min. However, immediatelyafter onset of illumination we observed a burst in H2 productiondriving local concentrations up to 30–40 µM H2. This burst
FIGURE 8 | Dynamics of H2 and O2 concentration measured 0.6 mmbelow the surface of a coastal cyanobacterial mat in darkness andupon onset of illumination (500 µmol photons m−2 s−1).
only lasted for 20–30 s, where after H2 became rapidly depletedas O2 from photosynthesis accumulated to super saturatingconcentration levels in the mat. Similar measurements (data notshown) in depth horizons closer to the mat surface showed ashorter and less intense burst due to more rapid O2 accumulationand thus faster H2 depletion, whereas measurement in deepermat layers showed a less intense build-up of H2 upon onsetof illumination due to strong light limitation; at 0.8 mm depthwe observed no photo stimulation of H2 production. Suchintermittent pulses of H2 upon illumination have been ascribedto direct biophotolysis in cyanobacteria involving a bidirectionalNi–Fe hydrogenase (Appel et al., 2000). While our data give firstevidence that such biophotolysis can occur in the uppermostparts of cyanobacterial mats, the process is limited to <1 minafter onset of illumination and thus plays a very minor role forthe total H2 production.
Sulfide Interference on H2 MicrosensorMeasurementsOur measurements in the hypersaline mat were done underabsence of sulfide (checked by H2S microsensor measurements)due to a pronounced layer of oxidized iron buffering againstaccumulation of free sulfide in the photic zone during darkness(Wieland et al., 2005). Under such conditions, the commerciallyavailable H2 microsensor from Unisense performs well and givesaccurate quantifications of H2 concentrations. However, thissensor is also sensitive to hydrogen sulfide giving rise to about 20–30% of the signal for a given H2S concentration as compared tothe same H2 concentration, and exposure to high H2S levels canalso affect sensor calibration (cf. H2 microsensor manual availableat: www.unisense.com/manuals/). Typical H2S concentrationsin the upper millimeters of hypersaline and coastal mats canreach up to 500 µM just below the photic zone in light orin the uppermost mat layers in darkness (Wieland and Kühl,2000). A strong gradient of increasing H2S concentration withdepth would thus be detected in H2 microsensor measurementsgiving rise to false H2 signals of up to >50 µM and typicallyshowing a continuously increasing H2 level with depth in the mat
Frontiers in Microbiology | www.frontiersin.org 9 July 2015 | Volume 6 | Article 726
Nielsen et al. Hydrogen microenvironment in microbial mats
following the increasing H2S concentration. Hoffmann et al.(2015) measured with the sulfide-sensitive H2 microsensor inthree types of intertidal mats. In the upper tidal apparentlyless sulfidic mat they found a clear peak of H2 productionoverlapping with the photic zone, while measurements in theother mats showed that such a H2 production peak was overlayedby a strong continuously increasing H2 concentration withdepth (cf. Figure 3 in Hoffmann et al., 2015). While theauthors did not report on H2S measurements in their mats,we suggest that their measurements in deeper mat layers mayinclude H2S interference. We have observed similar patternswhen using sulfide sensitive H2 microsensors in the coastalmat from Aggersund (data not shown). Such interferencewould also affect subsequent rate calculations on measured H2concentration profiles, especially in deeper zones. With the newsulfide-insensitive microsensor it is now possible to measurein strongly sulfidic microbial mats without such potentialartifacts.
Conclusion
Our measurements demonstrated distinct microscale dynamicsof H2 in hypersaline and coastal microbial mats that are denselypopulated by filamentous cyanobacteria. We found a pronouncedbuild-up of H2 in the upper millimeters of such mats upondarkening, while more oxidized coastal sediments with a surfacebiofilm of diatoms did not show any H2 accumulation. Ingeneral, our results support other recent demonstrations ofstrong H2 production in mat-forming cyanobacteria (Kothariet al., 2012, 2014) and intact microbial mats (Hoehler et al., 2001;Burow et al., 2012; Hoffmann et al., 2015), where cyanobacterialfermentation of photosynthate in darkness is the major H2source. Such H2 formation upon light–dark shifts in the upperphotic zone thus seems inherent in many coastal and hypersalinemicrobial mats and presents an important, yet intermittentenergy source that together with photosynthate fermentationproducts can fuel anaerobic respiration processes such as sulfatereduction (Lee et al., 2014).
In conclusion, this first application of a new H2 microsensor(Nielsen et al., 2015) in concert with microsensors for O2, pH,H2S, and scalar irradiance demonstrated a pronounced potentialfor H2 production in the photic zone of microbial mats. Strongintermittent H2 accumulation (up to 30–40 µM H2) and effluxof H2 to the overlaying water originated in the uppermostcyanobacterial layers, with the most intense H2 formation inthe depth horizons exhibiting maximal photosynthesis in thelight. In the dark, H2 first accumulates in the uppermost mmof the mat and is then released to the overlaying water and
consumed over 6–7 h by anaerobic respiration. Depletion of H2within the mat was strongly inhibited by molybdate additionpointing to SRB as major hydrogenotrophs in the mat. StrongH2 production by biophotolysis was observed in the uppermostanoxic mat layers (0.2–0.8 mm) immediately (for <1 min) afteronset of illumination but was quickly inhibited by oxygenicphotosynthesis and did not contribute significantly to the H2production, which was primarily observed in the dark. The newmicrosensors allow detailed studies of H2 dynamics in sulfidicenvironments at high spatio-temporal resolution. Such studieshave until recently been limited to mm-scale measurementsof net H2 production from incubated mat samples using gaschromatography or other bulk phase measurements. Here wehave focused on costal and hypersaline cyanobacterial mats,but the new H2 sensor is also suitable for measurements athigher temperatures (up to 60◦C; Nielsen et al., 2015) andwe are currently investigating H2 dynamics in hot springmicrobial mats, where H2 metabolism often plays a major role(Spear et al., 2005) although the relative importance of H2 andH2S as an energy source remains debated (D’Imperio et al.,2008).
Author Contributions
Planned and designed experiments (MN, NR, MK). Performedexperiments and analyzed data (MN, NR, MK). Wrote the article(MK with editorial help by MN and NR).
Acknowledgments
This study was supported by Innovation Fund Denmark (NPR,grant HYCON 0603-00443B), the European Research Council(NPR, grant no. 267233), the Danish Research Council forIndependent Research Natural Sciences (MK), and NordForsk(MK, NR). Special thanks are due to Preben Sørensen, Anni Glud,and Lars B. Pedersen for excellent technical assistance and toFanny Terrisse, Lasse Pedersen, Lasse Tor Nielsen, Anne KatrineBolvig Sørensen and Dorina Seitaj for assistance during partof the experiments. Andrea Wieland is thanked for providinghypersaline microbial mat samples.
Supplementary Material
The Supplementary Material for this article can be foundonline at: http://journal.frontiersin.org/article/10.3389/fmicb.2015.00726
References
Appel, J., Phunruch, S., Steinmüller, K., and Schulz, R. (2000). The bidirectionalhydrogenase of Synechocystis sp. PCC 6803 works as an electron valve duringphotosynthesis. Arch. Microbiol. 173, 333–338. doi: 10.1007/s002030000139
Baumgartner, L. K., Reid, R. P., Dupraz, C., Decho, A. W., Buckley,D. H., Spear, J. R., et al. (2006). Sulfate reducing bacteria in microbial
mats: changing paradigms, new discoveries. Sed. Geol. 185, 131–145. doi:10.1016/j.sedgeo.2005.12.008
Benemann, J. R., and Weare, N. M. (1974). Hydrogen evolution bynitrogen-fixing Anabaena cylindrica cultures. Science 184, 174–175. doi:10.1126/science.184.4133.174
Berg, H. C. (1983). RandomWalks in Biology. Princeton, NJ: Princeton UniversityPress.
Frontiers in Microbiology | www.frontiersin.org 10 July 2015 | Volume 6 | Article 726

Nielsen et al. Hydrogen microenvironment in microbial mats
Bothe, H., Schmitz, O., Yates, M. G., and Newton, W. E. (2010). Nitrogen fixationand hydrogen metabolism in cyanobacteria. Microbiol. Mol. Biol. Rev. 74,529–551. doi: 10.1128/MMBR.00033-10
Broecker, W. S., and Peng, T. H. (1974). Gas exchange rates between air and sea.Tellus 26, 21–35. doi: 10.1111/j.2153-3490.1974.tb01948.x
Burow, L. C., Woebken, D., Bebout, B. M., McMurdie, P. J., Singer, S. W., Pett-Ridge, J., et al. (2012). Hydrogen production in photosynthetic microbialmats in the Elkhorn Slough estuary, Monterey Bay. ISME J. 6, 863–874. doi:10.1038/ismej.2011.142
Burow, L. C., Woebken, D., Marshall, I. P. G., Singer, S. W., Pett-Ridge, J.,Prufert-Bebout, L., et al. (2014). Identification of desulfobacterales as primaryhydrogenotrophs in a complex microbial mat community. Geobiology 12,221–230. doi: 10.1111/gbi.12080
Canfield, D. E., and DesMarais, D. J. (1991). Aerobic sulfate reduction inmicrobialmats. Science 251, 1471–1473. doi: 10.1126/science.11538266
Conrad, R. (1988). Biogeochemistry and ecophysiology of atmospheric CO andH2.Adv. Microb. Ecol. 10, 231–283. doi: 10.1007/978-1-4684-5409-3_7
Cypionka, H. (2000). Oxygen respiration by Desulfovibrio species. Annu. Rev.Microbiol. 54, 827–848. doi: 10.1146/annurev.micro.54.1.827
Dannenberg, S., Kroder, M., Dilling, W., and Cypionka, H. (1992). Oxidation ofH2, organic compounds and inorganic sulfur compounds coupled to reductionof O2 or nitrate by sulfate-reducing bacteria. Arch. Microbiol. 158, 93–99. doi:10.1007/BF00245211
D’Imperio, S., Lehr, C. R., Oduro, H., Druschel, G., Kühl, M., andMcDermott, T. R.(2008). The relative importance of H2 and H2S as energy sources for primaryproduction in geothermal springs.Appl. Environ. Microbiol. 74, 5802–5808. doi:10.1128/AEM.00852-08
Ebert, A., and Brune, A. (1997). Hydrogen concentration profiles at the oxic-anoxicinterface: a microsensor study of the hindgut of the wood-feeding lower termiteReticulitermes flavipes (Kollar). Appl. Environ. Microbiol. 63, 4039–4046.
Fike, D. A., Gammon, C. L., Ziebis, W., and Orphan, V. J. (2008). Micron-scale mapping of sulfur cycling across the oxycline of a cyanobacterial mat:a paired nanoSIMS and CARD-FISH approach. ISME J. 2, 749–759. doi:10.1038/ismej.2008.39
Fourcans, A., Garcia de Oteyza, T., Wieland, A., Sole, A., Diestra, E., vanBleijswijk, J., et al. (2004). Characterization of functional bacterial groupsin a hypersaline microbial mat community (Salins-de-Giraud, Camargue,France). FEMS Microbiol. Ecol. 51, 55–70. doi: 10.1016/j.femsec.2004.07.012
Gest, H., and Kamen, M. D. (1949). Photoproduction of molecular hydrogenby Rhodospirillum rubrum. Science 109, 558–559. doi: 10.1126/science.109.2840.558
Hallenbeck, P.C. (2012). “Hydrogen production by cyanobacteria,” in MicrobialTechniques in Advanced Biofuels Production, ed. P. C. Hallenbeck (Berlin:Springer).
Hoehler, T., Albert, D. B., Alperin, M. J., Bebout, B. M., Martens, C. S., andDes Marais, D. J. (2002). Comparative ecology of H2 cycling in sedimentaryand phototrophic ecosystems. Antonie Van Leeuwenhoek 81, 575–585. doi:10.1023/A:1020517924466
Hoehler, T., Bebout, B. M., and DesMarais, D. J. (2001). The role of microbial matsin the production of reduced gases on the early Earth. Nature 412, 324–327. doi:10.1038/35085554
Hoffmann, D., Maldonado, J., Wojciechowski, M. F., and Garcia-Pichel, F. (2015).Hydrogen export from intertidal cyanobacterial mats: sources, fluxes, and theinfluence of community composition. Environ. Microbiol. doi: 10.1111/1462-2920.12769 [Epub ahead of print].
Houchins, J. P. (1984). The physiology and biochemistry of hydrogen metabolismin cyanobacteria. Biochim. Biophys. Acta 768, 227–255. doi: 10.1016/0304-4173(84)90018-1
Hübert, T., Boon-Brett, L., Black, G., and Banach, U. (2011). Hydrogensensors – a review. Sens. Act. B 157, 329–352. doi: 10.1016/j.snb.2011.04.070
Jackson, D. D., and Ellms, J. W. (1896). On odors and tastes of surfacewaters with special reference to Anabaena, a microscopical organism foundin certain water supplies of Massachusetts. Rep. Mass. State Board Health1896:410–420.
Jørgensen, B. B. (2001). Space for hydrogen. Nature 412, 286–289. doi:10.1038/35085676
Klimant, I., Meyer, V., and Kühl, M. (1995). Fiber-optic oxygen microsensors,a new tool in aquatic biology. Limnol. Oceanogr. 40, 1159–1165. doi:10.4319/lo.1995.40.6.1159
Kothari, A., Parameswaran, P., and Garcia-Pichel, F. (2014). Powerful fermentativehydrogen evolution of photosynthate in the cyanobacterium Lyngbya aestuariiBLJ mediated by a bidirectional hydrogenase. Front. Microbiol. 5:680. doi:10.3389/fmicb.2014.00680
Kothari, A., Potrofka, R., and Garcia-Pichel, F. (2012). Diversity in hydrogenevolution from bidirectional hydrogenases in cyanobacteria from terrestrial,freshwater andmarine intertidal environments. J. Biotechnol. 162, 105–114. doi:10.1016/j.jbiotec.2012.04.017
Krekeler, D., Teske, A., and Cypionka, H. (1998). Strategies of sulfate-reducingbacteria to escape oxygen stress in a cyanobacterial mat. FEMS Microbiol. Ecol.25, 89–96. doi: 10.1111/j.1574-6941.1998.tb00462.x
Kühl, M. (2005). Optical microsensors for analysis of microbial communities.Methods Enzymol. 397, 166–199. doi: 10.1016/S0076-6879(05)97010-9
Kühl, M., Glud, R. N., Ploug, H., and Ramsing, N. B. (1996). Microenvironmentalcontrol of photosynthesis and photosynthesis-coupled respiration in anepilithic cyanobacterial biofilm. J. Phycol. 32, 799–812. doi: 10.1111/j.0022-3646.1996.00799.x
Kühl, M., Lassen, C., and Revsbech, N. P. (1997). A simple light meter formeasurements of PAR (400-700 nm) with fiber-optic microprobes: applicationfor P vs. I measurements in microbenthic communities. Aq. Microb. Ecol. 13,197–207. doi: 10.3354/ame013197
Kühl, M., and Revsbech, N. P. (2001). “Biogeochemical microsensors for boundarylayer studies,” in The Benthic Boundary Layer, eds B. P. Boudreau and B. B.Jørgensen (Oxford: Oxford University Press), 180–210.
Kühl,M., Steuckart, C., Eickert, G., and Jeroschewski, P. (1998). AH2Smicrosensorfor profiling sediments and biofilms: application in acidic sediment.Aq. Microb.Ecol. 15, 201–209. doi: 10.3354/ame015201
Lambert, G. R., and Smith, G. D. (1981). The hydrogen metabolism ofcyanobacteria (blue-green algae). Biol. Rev. 56, 589–660. doi: 10.1111/j.1469-185X.1981.tb00360.x
Lassen, C., Ploug, H., and Jørgensen, B. B. (1992). Microalgal photosynthesis andspectral scalar irradiance in coastal marine sediments of Limfjorden, Denmark.Limnol. Oceanogr. 37, 760–772. doi: 10.4319/lo.1992.37.4.0760
Lee, H., Vermaas, W. F. J., and Rittman, B. E. (2010). Biological hydrogenproduction: prospects and challenges. Trends Biotechnol. 28, 262–271. doi:10.1016/j.tibtech.2010.01.007
Lee, J. Z., Burow, L. C., Woebken, D., Everroad, R. C., Kubo, M. D., Spormann,A. M., et al. (2014). Fermentation couples Chloroflexi and sulfate-reducingbacteria to cyanobacteria in hypersaline microbial mats. Front. Microbiol. 5:61.doi: 10.3389/fmicb.2014.00061
Li, Y. H., and Gregory, S. (1974). Diffusion of ions in seawater and in deep-sea sediments. Geochim. Cosmochim. Acta 38, 703–714. doi: 10.1016/0016-7037(74)90145-8
Lorenzen, J., Glud, R. N., and Revsbech, N. P. (1995). Impact of microsensor causedchanges in diffusive boundary layer thickness on O2 profiles and photosyntheticrates in benthic communities of microorganisms. Mar. Ecol. Prog. Ser. 119,237–241. doi: 10.3354/meps119237
Marschall, I. P. G., Berggren, D. R. V., Azizian, F., Burow, L., Semprini, L.,and Spormann, A. M. (2012). The hydrogenase chip: a tiling oligonucleotideDNA microarray technique for characterizing hydrogen-producing and –consuming microbes in microbial communities. ISME J. 6, 814–826. doi:10.1038/ismej.2011.136
Mason, S., Hamon, R., Nolan, A., Zhang, H., and Davison, W. (2005). Performanceof amixed binding layer for measuring anions and cations in a single assay usingthe diffusive gradients in thin films technique. Anal. Chem. 77, 6339–6346. doi:10.1021/ac0507183
Moezelaar, R., Bijvank, S. M., and Stal, L. J. (1996). Fermentation and sulfurreduction in the mat-building cyanobacterium Microcoleus chtonoplastes. Appl.Environ. Microbiol. 62, 1752–1758.
Nielsen, M., Larsen, L. H., Ottosen, L. D. M., and Revsbech, N. P. (2015).Hydrogen microsensors with hydrogen sulfide traps. Sens. Act. B 215, 1–8. doi:10.1016/j.snb.2015.03.035
Oschchepkov, V. P., Nikitina, A. A., Gusev, M. V., and Krasnovskii, A. A. (1974).Evolution of molecular hydrogen by cultures of blue-green algae. DokladyAkademii Nauk SSSR 213, 557–560.
Frontiers in Microbiology | www.frontiersin.org 11 July 2015 | Volume 6 | Article 726

Nielsen et al. Hydrogen microenvironment in microbial mats
Otaki, H., Everroad, R. C., Matsuura, K., and Haruta, S. (2012). Productionand consumption of hydrogen in hot spring microbial mats dominated byfilamentous anoxygenic photosynthetic bacterium. Microbes Environ. 27, 293–299. doi: 10.1264/jsme2.ME11348
Overmann, J., and Garcia-Pichel, F. (2000). “The phototrophic way of life,”in The Prokaryotes: An Evolving Electronic Resource for the MicrobiologicialCommunity, 3rd Edn, ed. M. Dworkin (New York: Springer).
Revsbech, N. P. (1989). An oxygen microelectrode with a guard cathode. Limnol.Oceanogr. 34, 474–478. doi: 10.4319/lo.1989.34.2.0474
Revsbech, N. P., and Jørgensen, B. B. (1986). Microelectrodes: their use inmicrobial ecology. Adv. Microb. Ecol. 9, 293–352. doi: 10.1007/978-1-4757-0611-6_7
Skyring, G. W., Lynch, R. M., and Smith, G. D. (1988). Acetylene reductionand hydrogen metabolism by a cyanobacterial/sulfate-reducing bacterialmat ecosystem. Geomicrobiol. J. 6, 25–31. doi: 10.1080/01490458809377819
Skyring, G. W., Lynch, R. M., and Smith, G. D. (1989). “Quantitative relationshipsbetween carbon, hydrogen, and sulfur metabolism in cyanobacterial mats,”in Microbial Mats, Physiological Ecology of Benthic Microbial Communities,eds Y. Cohen and E. Rosenberg (Washinton, DC: American Society forMicrobiology Press), 170–179.
Spear, J. R., Walker, J. J., McCollom, T. M., and Pace, N. R. (2005). Hydrogen andbioenergetics in the Yellowstone geothermal ecosystem. Proc. Nat. Acad. Sci.U.S.A. 102, 2555–2560. doi: 10.1073/pnas.0409574102
Stal, L. J., and Moezelaar, R. (1997). Fermentation in cyanobacteria.FEMS Microbiol. Rev. 21, 179–211. doi: 10.1016/S0168-6445(97)00056-9
Visscher, P. T., Baumgartner, L. K., Buckley, D. H., Rogers, D. R., Hogan, M. E.,Raleigh, C. D., et al. (2003). Dimethyl sulphide and methanethiol formation inmicrobial mats: potential pathways for biogenic signatures. Environ. Microbiol.5, 296–308. doi: 10.1046/j.1462-2920.2003.00418.x
Wang, R., Healey, F. P., and Myers, J. (1971). Amperometric measurementsof hydrogen evolution in Chlamydomonas. Plant Physiol. 48, 108–110. doi:10.1104/pp.48.1.108
Warthmann, R., Cypionka, H., and Pfennig, N. (1992). Photoproduction of H2from acetate by syntrophic co-cultures of green sulfur bacteria and sulfur-reducing bacteria. Arch. Microbiol. 157, 343–348. doi: 10.1007/BF00248679
Wieland, A., and Kühl, M. (2000). Short term temperature effects on oxygen andsulfide cycling in a hyper-saline cyanobacterial mat (Solar Lake, Egypt). Mar.Ecol. Progr. Ser. 196, 87–102. doi: 10.3354/meps196087
Wieland, A., Zopfi, J., Benthien, M., and Kühl, M. (2005). Biogeochemistry of aniron-rich hypersaline microbial mat (Camargue, France): oxygen, sulfur andcarbon cycling.Microb. Ecol. 49, 34–49. doi: 10.1007/s00248-003-2033-4
Wiesenburg, D. A., and Guinasso, N. L. Jr. (1979). Equilibrium solubilities ofmethane, carbon monoxide and hydrogen in water and sea water. J. Chem.Engin. Data 24, 359–360. doi: 10.1021/je60083a006
Witty, J. F. (1991). Microelectrode measurements of hydrogen concentrations andgradients in legume nodules. J. Exp. Bot. 42, 765–771. doi: 10.1093/jxb/42.6.765
Wolin, M. J. (1982). “Hydrogen transfer in microbial communities,” in MicrobialInteractions and Communities, eds A. T. Bull and J. H. Slater (New York:Academic Press, Inc.), 323–356.
Conflict of Interest Statement: The authors declare that the research wasconducted in the absence of any commercial or financial relationships that couldbe construed as a potential conflict of interest.
Copyright © 2015 Nielsen, Revsbech and Kühl. This is an open-access articledistributed under the terms of the Creative Commons Attribution License (CC BY).The use, distribution or reproduction in other forums is permitted, provided theoriginal author(s) or licensor are credited and that the original publication in thisjournal is cited, in accordance with accepted academic practice. No use, distributionor reproduction is permitted which does not comply with these terms.
Frontiers in Microbiology | www.frontiersin.org 12 July 2015 | Volume 6 | Article 726