Microsatellite DYS385 Polymorphism among the Tai and Mon ... Jatupol Kampuansai.pdf ·...
7
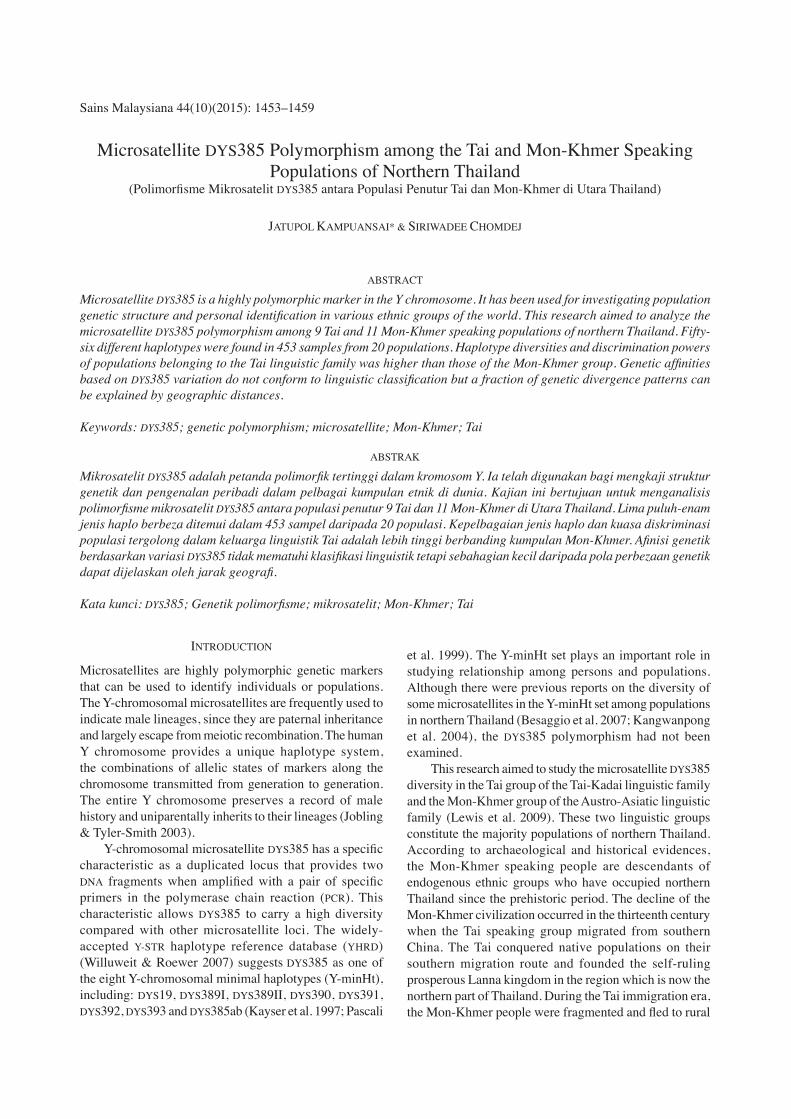
Sains Malaysiana 44(10)(2015): 1453–1459 Microsatellite DYS385 Polymorphism among the Tai and Mon-Khmer Speaking Populations of Northern Thailand (Polimorfisme Mikrosatelit DYS385 antara Populasi Penutur Tai dan Mon-Khmer di Utara Thailand) JATUPOL KAMPUANSAI* & SIRIWADEE CHOMDEJ ABSTRACT Microsatellite DYS385 is a highly polymorphic marker in the Y chromosome. It has been used for investigating population genetic structure and personal identification in various ethnic groups of the world. This research aimed to analyze the microsatellite DYS385 polymorphism among 9 Tai and 11 Mon-Khmer speaking populations of northern Thailand. Fifty- six different haplotypes were found in 453 samples from 20 populations. Haplotype diversities and discrimination powers of populations belonging to the Tai linguistic family was higher than those of the Mon-Khmer group. Genetic affinities based on DYS385 variation do not conform to linguistic classification but a fraction of genetic divergence patterns can be explained by geographic distances. Keywords: DYS385; genetic polymorphism; microsatellite; Mon-Khmer; Tai ABSTRAK Mikrosatelit DYS385 adalah petanda polimorfik tertinggi dalam kromosom Y. Ia telah digunakan bagi mengkaji struktur genetik dan pengenalan peribadi dalam pelbagai kumpulan etnik di dunia. Kajian ini bertujuan untuk menganalisis polimorfisme mikrosatelit DYS385 antara populasi penutur 9 Tai dan 11 Mon-Khmer di Utara Thailand. Lima puluh-enam jenis haplo berbeza ditemui dalam 453 sampel daripada 20 populasi. Kepelbagaian jenis haplo dan kuasa diskriminasi populasi tergolong dalam keluarga linguistik Tai adalah lebih tinggi berbanding kumpulan Mon-Khmer. Afinisi genetik berdasarkan variasi DYS385 tidak mematuhi klasifikasi linguistik tetapi sebahagian kecil daripada pola perbezaan genetik dapat dijelaskan oleh jarak geografi. Kata kunci: DYS385; Genetik polimorfisme; mikrosatelit; Mon-Khmer; Tai INTRODUCTION Microsatellites are highly polymorphic genetic markers that can be used to identify individuals or populations. The Y-chromosomal microsatellites are frequently used to indicate male lineages, since they are paternal inheritance and largely escape from meiotic recombination. The human Y chromosome provides a unique haplotype system, the combinations of allelic states of markers along the chromosome transmitted from generation to generation. The entire Y chromosome preserves a record of male history and uniparentally inherits to their lineages (Jobling & Tyler-Smith 2003). Y-chromosomal microsatellite DYS385 has a specific characteristic as a duplicated locus that provides two DNA fragments when amplified with a pair of specific primers in the polymerase chain reaction (PCR). This characteristic allows DYS385 to carry a high diversity compared with other microsatellite loci. The widely- accepted Y-STR haplotype reference database (YHRD) (Willuweit & Roewer 2007) suggests DYS385 as one of the eight Y-chromosomal minimal haplotypes (Y-minHt), including: DYS19, DYS389I, DYS389II, DYS390, DYS391, DYS392, DYS393 and DYS385ab (Kayser et al. 1997; Pascali et al. 1999). The Y-minHt set plays an important role in studying relationship among persons and populations. Although there were previous reports on the diversity of some microsatellites in the Y-minHt set among populations in northern Thailand (Besaggio et al. 2007; Kangwanpong et al. 2004), the DYS385 polymorphism had not been examined. This research aimed to study the microsatellite DYS385 diversity in the Tai group of the Tai-Kadai linguistic family and the Mon-Khmer group of the Austro-Asiatic linguistic family (Lewis et al. 2009). These two linguistic groups constitute the majority populations of northern Thailand. According to archaeological and historical evidences, the Mon-Khmer speaking people are descendants of endogenous ethnic groups who have occupied northern Thailand since the prehistoric period. The decline of the Mon-Khmer civilization occurred in the thirteenth century when the Tai speaking group migrated from southern China. The Tai conquered native populations on their southern migration route and founded the self-ruling prosperous Lanna kingdom in the region which is now the northern part of Thailand. During the Tai immigration era, the Mon-Khmer people were fragmented and fled to rural
Transcript of Microsatellite DYS385 Polymorphism among the Tai and Mon ... Jatupol Kampuansai.pdf ·...
Sains Malaysiana 44(10)(2015): 1453–1459
Microsatellite DYS385 Polymorphism among the Tai and Mon-Khmer Speaking Populations of Northern Thailand
(Polimorfisme Mikrosatelit DYS385 antara Populasi Penutur Tai dan Mon-Khmer di Utara Thailand)
JATUPOL KAMPUANSAI* & SIRIWADEE CHOMDEJ
ABSTRACT
Microsatellite DYS385 is a highly polymorphic marker in the Y chromosome. It has been used for investigating population genetic structure and personal identification in various ethnic groups of the world. This research aimed to analyze the microsatellite DYS385 polymorphism among 9 Tai and 11 Mon-Khmer speaking populations of northern Thailand. Fifty-six different haplotypes were found in 453 samples from 20 populations. Haplotype diversities and discrimination powers of populations belonging to the Tai linguistic family was higher than those of the Mon-Khmer group. Genetic affinities based on DYS385 variation do not conform to linguistic classification but a fraction of genetic divergence patterns can be explained by geographic distances.
Keywords: DYS385; genetic polymorphism; microsatellite; Mon-Khmer; Tai
ABSTRAK
Mikrosatelit DYS385 adalah petanda polimorfik tertinggi dalam kromosom Y. Ia telah digunakan bagi mengkaji struktur genetik dan pengenalan peribadi dalam pelbagai kumpulan etnik di dunia. Kajian ini bertujuan untuk menganalisis polimorfisme mikrosatelit DYS385 antara populasi penutur 9 Tai dan 11 Mon-Khmer di Utara Thailand. Lima puluh-enam jenis haplo berbeza ditemui dalam 453 sampel daripada 20 populasi. Kepelbagaian jenis haplo dan kuasa diskriminasi populasi tergolong dalam keluarga linguistik Tai adalah lebih tinggi berbanding kumpulan Mon-Khmer. Afinisi genetik berdasarkan variasi DYS385 tidak mematuhi klasifikasi linguistik tetapi sebahagian kecil daripada pola perbezaan genetik dapat dijelaskan oleh jarak geografi.
Kata kunci: DYS385; Genetik polimorfisme; mikrosatelit; Mon-Khmer; Tai
INTRODUCTION
Microsatellites are highly polymorphic genetic markers that can be used to identify individuals or populations. The Y-chromosomal microsatellites are frequently used to indicate male lineages, since they are paternal inheritance and largely escape from meiotic recombination. The human Y chromosome provides a unique haplotype system, the combinations of allelic states of markers along the chromosome transmitted from generation to generation. The entire Y chromosome preserves a record of male history and uniparentally inherits to their lineages (Jobling & Tyler-Smith 2003). Y-chromosomal microsatellite DYS385 has a specific characteristic as a duplicated locus that provides two DNA fragments when amplified with a pair of specific primers in the polymerase chain reaction (PCR). This characteristic allows DYS385 to carry a high diversity compared with other microsatellite loci. The widely-accepted Y-STR haplotype reference database (YHRD) (Willuweit & Roewer 2007) suggests DYS385 as one of the eight Y-chromosomal minimal haplotypes (Y-minHt), including: DYS19, DYS389I, DYS389II, DYS390, DYS391, DYS392, DYS393 and DYS385ab (Kayser et al. 1997; Pascali
et al. 1999). The Y-minHt set plays an important role in studying relationship among persons and populations. Although there were previous reports on the diversity of some microsatellites in the Y-minHt set among populations in northern Thailand (Besaggio et al. 2007; Kangwanpong et al. 2004), the DYS385 polymorphism had not been examined. This research aimed to study the microsatellite DYS385 diversity in the Tai group of the Tai-Kadai linguistic family and the Mon-Khmer group of the Austro-Asiatic linguistic family (Lewis et al. 2009). These two linguistic groups constitute the majority populations of northern Thailand. According to archaeological and historical evidences, the Mon-Khmer speaking people are descendants of endogenous ethnic groups who have occupied northern Thailand since the prehistoric period. The decline of the Mon-Khmer civilization occurred in the thirteenth century when the Tai speaking group migrated from southern China. The Tai conquered native populations on their southern migration route and founded the self-ruling prosperous Lanna kingdom in the region which is now the northern part of Thailand. During the Tai immigration era, the Mon-Khmer people were fragmented and fled to rural
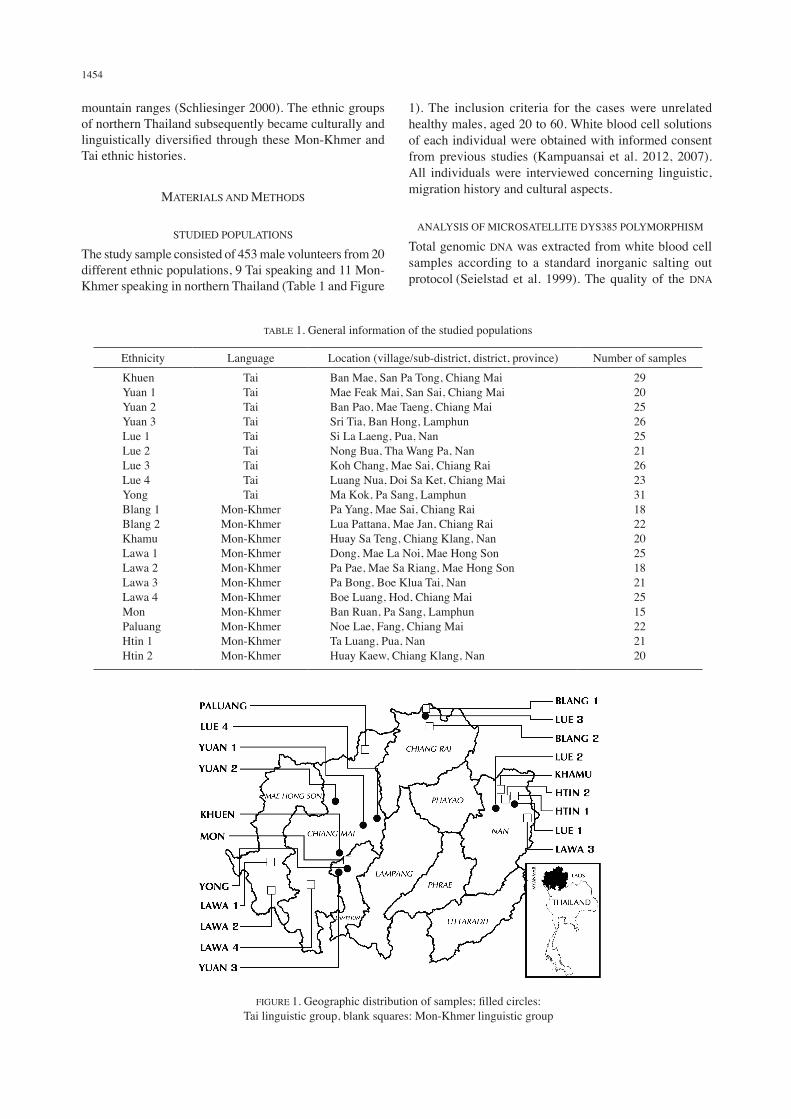
1454
mountain ranges (Schliesinger 2000). The ethnic groups of northern Thailand subsequently became culturally and linguistically diversified through these Mon-Khmer and Tai ethnic histories.
MATERIALS AND METHODS
STUDIED POPULATIONS
The study sample consisted of 453 male volunteers from 20 different ethnic populations, 9 Tai speaking and 11 Mon-Khmer speaking in northern Thailand (Table 1 and Figure
1). The inclusion criteria for the cases were unrelated healthy males, aged 20 to 60. White blood cell solutions of each individual were obtained with informed consent from previous studies (Kampuansai et al. 2012, 2007). All individuals were interviewed concerning linguistic, migration history and cultural aspects.
ANALYSIS OF MICROSATELLITE DYS385 POLYMORPHISM
Total genomic DNA was extracted from white blood cell samples according to a standard inorganic salting out protocol (Seielstad et al. 1999). The quality of the DNA
TABLE 1. General information of the studied populations
Ethnicity Language Location (village/sub-district, district, province) Number of samplesKhuenYuan 1Yuan 2Yuan 3Lue 1Lue 2Lue 3Lue 4YongBlang 1Blang 2KhamuLawa 1Lawa 2Lawa 3Lawa 4MonPaluangHtin 1 Htin 2
TaiTaiTaiTaiTaiTaiTaiTaiTai
Mon-KhmerMon-KhmerMon-KhmerMon-KhmerMon-KhmerMon-KhmerMon-KhmerMon-KhmerMon-KhmerMon-KhmerMon-Khmer
Ban Mae, San Pa Tong, Chiang MaiMae Feak Mai, San Sai, Chiang Mai Ban Pao, Mae Taeng, Chiang Mai Sri Tia, Ban Hong, Lamphun Si La Laeng, Pua, Nan Nong Bua, Tha Wang Pa, Nan Koh Chang, Mae Sai, Chiang Rai Luang Nua, Doi Sa Ket, Chiang MaiMa Kok, Pa Sang, Lamphun Pa Yang, Mae Sai, Chiang Rai Lua Pattana, Mae Jan, Chiang Rai Huay Sa Teng, Chiang Klang, Nan Dong, Mae La Noi, Mae Hong Son Pa Pae, Mae Sa Riang, Mae Hong SonPa Bong, Boe Klua Tai, Nan Boe Luang, Hod, Chiang Mai Ban Ruan, Pa Sang, Lamphun Noe Lae, Fang, Chiang Mai Ta Luang, Pua, Nan Huay Kaew, Chiang Klang, Nan
2920252625212623311822202518212515222120
FIGURE 1. Geographic distribution of samples; filled circles: Tai linguistic group, blank squares: Mon-Khmer linguistic group
1455
was examined using spectrophotometry. Microsatellite DYS385 fragments were amplified by PCR as previously described (Bhoopat et al. 2003). The size of PCR fragments was examined by 12% polyacrylamide gel electrophoresis (PAGE) compared with the DYS385 allelic ladder (Personal contact with Prof. Tanin Bhoopat, Department of Forensic Medicine, Faculty of Medicine, Chiang Mai University). For the samples containing homozygous genotype, the PCR products were directly sequenced at Macrogen Co. Ltd., South Korea, to confirm the accuracy in investigating the number of DYS385 tandem repeats.
DATA ANALYSIS
Types and number of observed DYS385 haplotypes found in each population were counted. Discrimination power (Dp) of each population was calculated by the equation Dp = 1- Sp2 (where p is the frequency of each haplotype). Analysis of molecular variance (AMOVA) was conducted and linearization Rst (Slatkin 1995) distances was examined using the Arlequin 3.5 package (Excoffier & Lischer 2010). The matrix of genetic distance was then employed to draw a multidimensional scaling (MDS) plot using the STATISTICA 7.0 software package (StatSoft Inc.) to depict the genetic relationships. Groups of populations that are maximally differentiated from each other based on linearization Rst distances were defined by the SAMOVA 2.0 program (Dupanloup et al. 2002). To test the hypothesis of a correlation between genetics and geographic locations (latitudes and longitudes), matrices of genetic and geographic distances were compared by means of the Mantel permutation test as implement in the Arlequin 3.5 package.
RESULTS
MICROSATELLITE DYS385 POLYMORPHISM
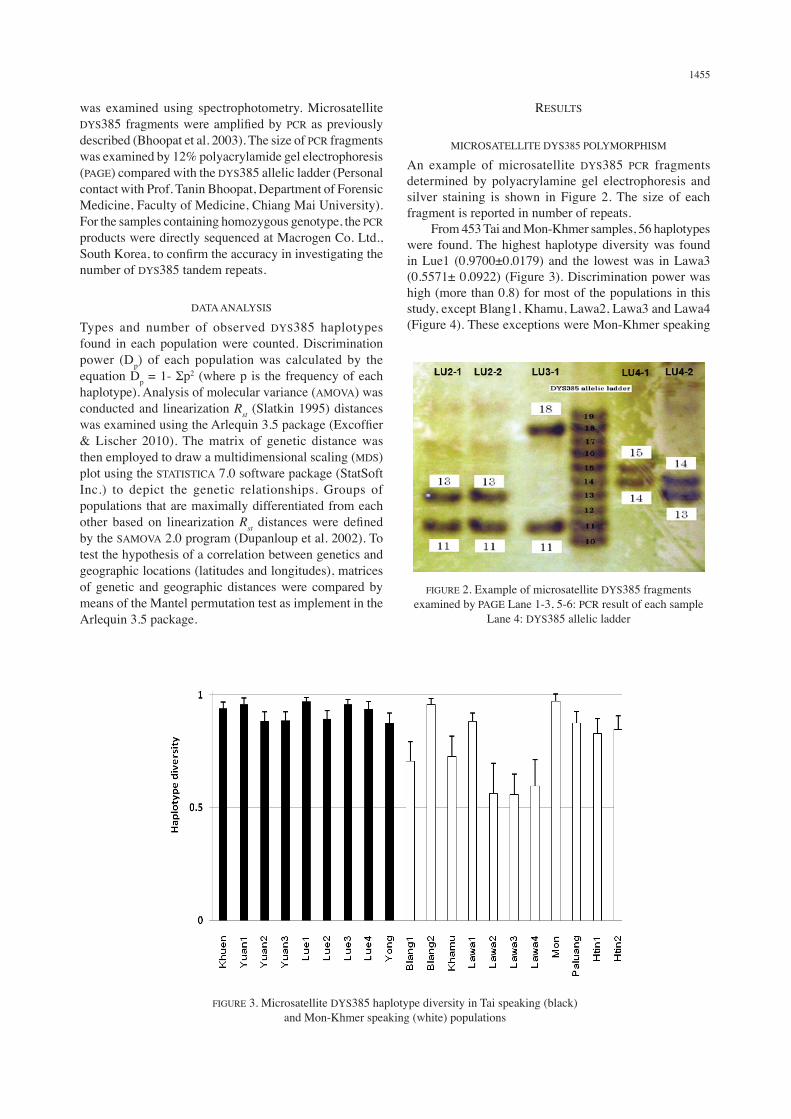
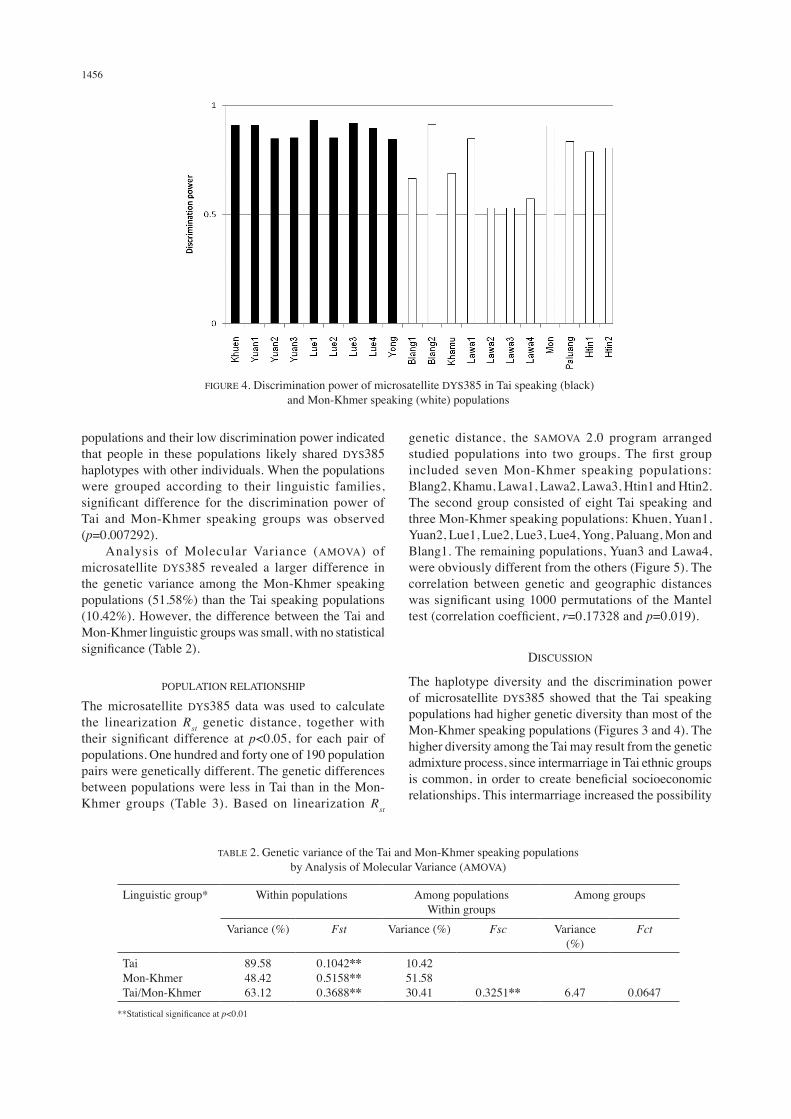
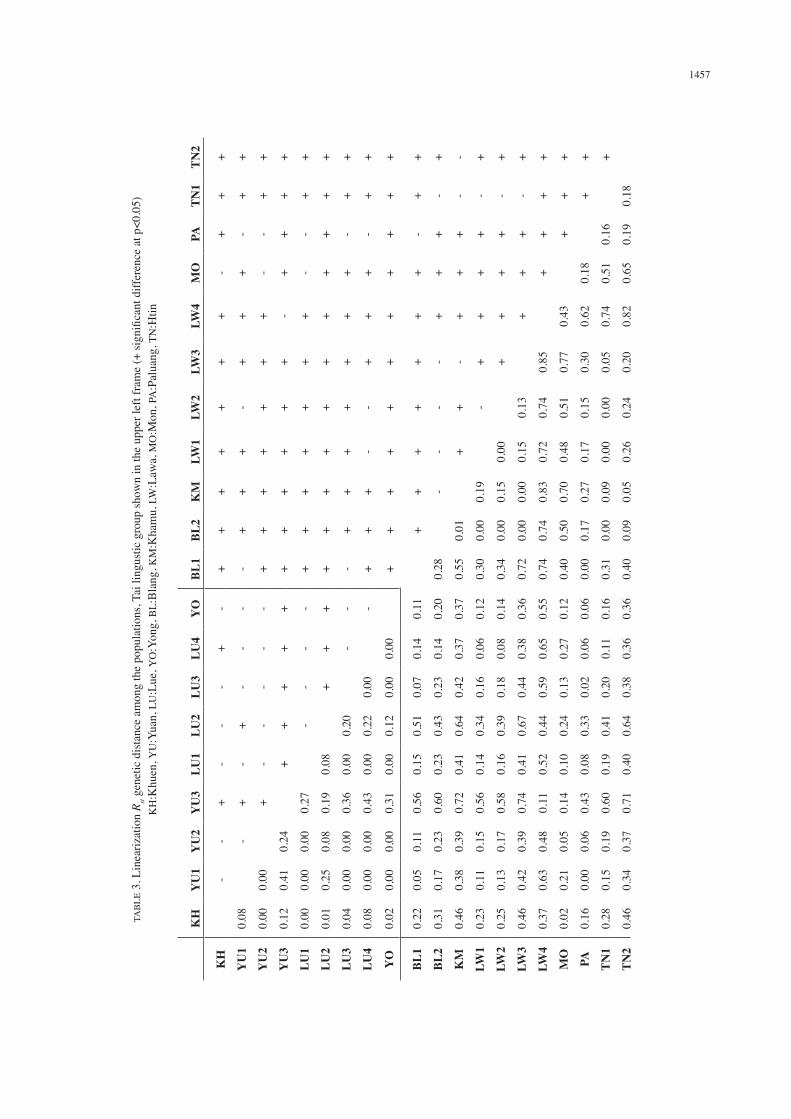
An example of microsatellite DYS385 PCR fragments determined by polyacrylamine gel electrophoresis and silver staining is shown in Figure 2. The size of each fragment is reported in number of repeats. From 453 Tai and Mon-Khmer samples, 56 haplotypes were found. The highest haplotype diversity was found in Lue1 (0.9700±0.0179) and the lowest was in Lawa3 (0.5571± 0.0922) (Figure 3). Discrimination power was high (more than 0.8) for most of the populations in this study, except Blang1, Khamu, Lawa2, Lawa3 and Lawa4 (Figure 4). These exceptions were Mon-Khmer speaking
FIGURE 2. Example of microsatellite DYS385 fragments examined by PAGE Lane 1-3, 5-6: PCR result of each sample
Lane 4: DYS385 allelic ladder
FIGURE 3. Microsatellite DYS385 haplotype diversity in Tai speaking (black) and Mon-Khmer speaking (white) populations
1456
populations and their low discrimination power indicated that people in these populations likely shared DYS385 haplotypes with other individuals. When the populations were grouped according to their linguistic families, significant difference for the discrimination power of Tai and Mon-Khmer speaking groups was observed (p=0.007292). Analysis of Molecular Variance (AMOVA) of microsatellite DYS385 revealed a larger difference in the genetic variance among the Mon-Khmer speaking populations (51.58%) than the Tai speaking populations (10.42%). However, the difference between the Tai and Mon-Khmer linguistic groups was small, with no statistical significance (Table 2).
POPULATION RELATIONSHIP
The microsatellite DYS385 data was used to calculate the linearization Rst genetic distance, together with their significant difference at p<0.05, for each pair of populations. One hundred and forty one of 190 population pairs were genetically different. The genetic differences between populations were less in Tai than in the Mon-Khmer groups (Table 3). Based on linearization Rst
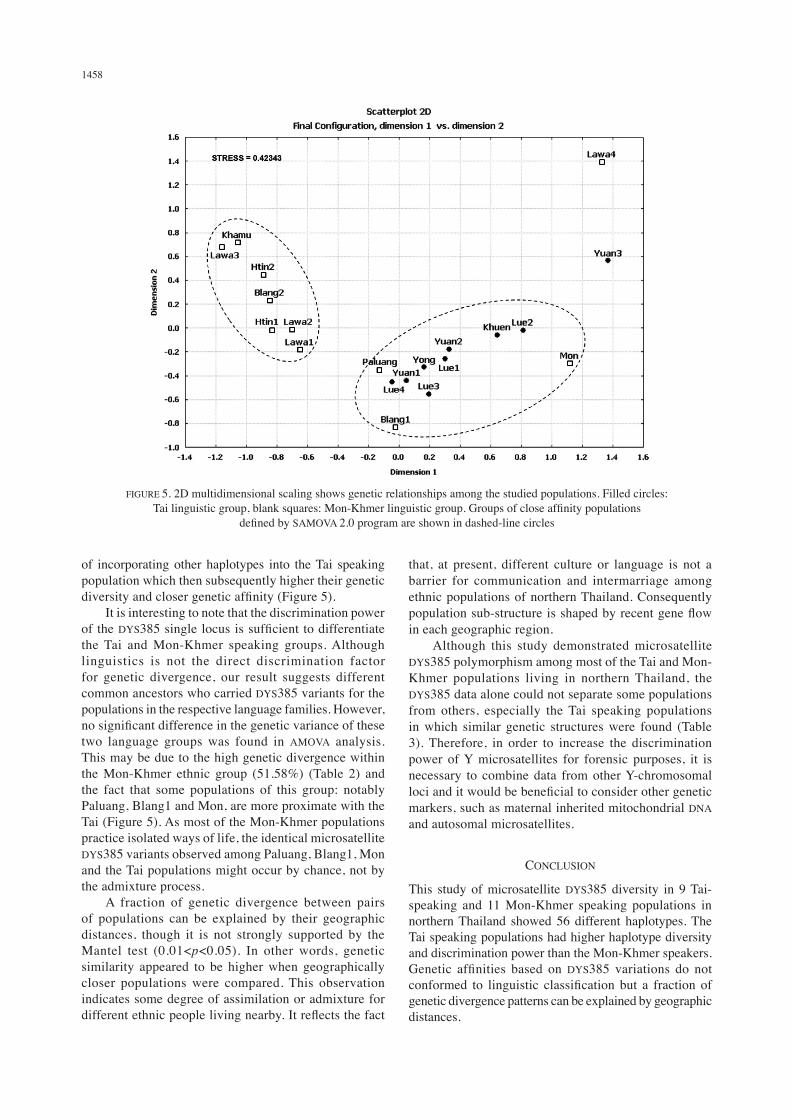
genetic distance, the SAMOVA 2.0 program arranged studied populations into two groups. The first group included seven Mon-Khmer speaking populations: Blang2, Khamu, Lawa1, Lawa2, Lawa3, Htin1 and Htin2. The second group consisted of eight Tai speaking and three Mon-Khmer speaking populations: Khuen, Yuan1, Yuan2, Lue1, Lue2, Lue3, Lue4, Yong, Paluang, Mon and Blang1. The remaining populations, Yuan3 and Lawa4, were obviously different from the others (Figure 5). The correlation between genetic and geographic distances was significant using 1000 permutations of the Mantel test (correlation coefficient, r=0.17328 and p=0.019).
DISCUSSION
The haplotype diversity and the discrimination power of microsatellite DYS385 showed that the Tai speaking populations had higher genetic diversity than most of the Mon-Khmer speaking populations (Figures 3 and 4). The higher diversity among the Tai may result from the genetic admixture process, since intermarriage in Tai ethnic groups is common, in order to create beneficial socioeconomic relationships. This intermarriage increased the possibility
FIGURE 4. Discrimination power of microsatellite DYS385 in Tai speaking (black) and Mon-Khmer speaking (white) populations
TABLE 2. Genetic variance of the Tai and Mon-Khmer speaking populations by Analysis of Molecular Variance (AMOVA)
Linguistic group* Within populations Among populations Within groups
Among groups
Variance (%) Fst Variance (%) Fsc Variance (%)
Fct
TaiMon-KhmerTai/Mon-Khmer
89.5848.4263.12
0.1042**0.5158**0.3688**
10.4251.5830.41 0.3251** 6.47 0.0647
**Statistical significance at p<0.01
1457
TAB
LE 3
. Lin
eariz
atio
n R st
gen
etic
dis
tanc
e am
ong
the
popu
latio
ns, T
ai li
ngus
tic g
roup
show
n in
the
uppe
r lef
t fra
me
(+ si
gnifi
cant
diff
eren
ce a
t p<0
.05)
K
H:K
huen
, YU
:Yua
n, L
U:L
ue, Y
O:Y
ong,
BL:
Bla
ng, K
M:K
ham
u, L
W:L
awa,
MO
:Mon
, PA
:Pal
uang
, TN
:Htin
KH
YU
1Y
U2
YU
3LU
1LU
2LU
3LU
4Y
OBL
1BL
2K
MLW
1LW
2LW
3LW
4M
OPA
TN1
TN2
KH
--
+-
--
+-
++
++
++
+-
++
+
YU
10.
08-
+-
+-
--
-+
++
-+
++
-+
+
YU
20.
000.
00+
--
--
-+
++
++
++
--
++
YU
30.
120.
410.
24+
++
++
++
++
++
-+
++
+
LU1
0.00
0.00
0.00
0.27
--
--
++
++
++
+-
-+
+
LU2
0.01
0.25
0.08
0.19
0.08
++
++
++
++
++
++
++
LU3
0.04
0.00
0.00
0.36
0.00
0.20
--
-+
++
++
++
-+
+
LU4
0.08
0.00
0.00
0.43
0.00
0.22
0.00
-+
++
--
++
+-
++
YO
0.02
0.00
0.00
0.31
0.00
0.12
0.00
0.00
++
++
++
++
++
+
BL1
0.22
0.05
0.11
0.56
0.15
0.51
0.07
0.14
0.11
++
++
++
+-
++
BL2
0.31
0.17
0.23
0.60
0.23
0.43
0.23
0.14
0.20
0.28
--
--
++
+-
+
KM
0.46
0.38
0.39
0.72
0.41
0.64
0.42
0.37
0.37
0.55
0.01
++
-+
++
--
LW1
0.23
0.11
0.15
0.56
0.14
0.34
0.16
0.06
0.12
0.30
0.00
0.19
-+
++
+-
+
LW2
0.25
0.13
0.17
0.58
0.16
0.39
0.18
0.08
0.14
0.34
0.00
0.15
0.00
++
++
-+
LW3
0.46
0.42
0.39
0.74
0.41
0.67
0.44
0.38
0.36
0.72
0.00
0.00
0.15
0.13
++
+-
+
LW4
0.37
0.63
0.48
0.11
0.52
0.44
0.59
0.65
0.55
0.74
0.74
0.83
0.72
0.74
0.85
++
++
MO
0.02
0.21
0.05
0.14
0.10
0.24
0.13
0.27
0.12
0.40
0.50
0.70
0.48
0.51
0.77
0.43
++
+
PA0.
160.
000.
060.
430.
080.
330.
020.
060.
060.
000.
170.
270.
170.
150.
300.
620.
18+
+
TN1
0.28
0.15
0.19
0.60
0.19
0.41
0.20
0.11
0.16
0.31
0.00
0.09
0.00
0.00
0.05
0.74
0.51
0.16
+
TN2
0.46
0.34
0.37
0.71
0.40
0.64
0.38
0.36
0.36
0.40
0.09
0.05
0.26
0.24
0.20
0.82
0.65
0.19
0.18
1458
of incorporating other haplotypes into the Tai speaking population which then subsequently higher their genetic diversity and closer genetic affinity (Figure 5). It is interesting to note that the discrimination power of the DYS385 single locus is sufficient to differentiate the Tai and Mon-Khmer speaking groups. Although linguistics is not the direct discrimination factor for genetic divergence, our result suggests different common ancestors who carried DYS385 variants for the populations in the respective language families. However, no significant difference in the genetic variance of these two language groups was found in AMOVA analysis. This may be due to the high genetic divergence within the Mon-Khmer ethnic group (51.58%) (Table 2) and the fact that some populations of this group: notably Paluang, Blang1 and Mon, are more proximate with the Tai (Figure 5). As most of the Mon-Khmer populations practice isolated ways of life, the identical microsatellite DYS385 variants observed among Paluang, Blang1, Mon and the Tai populations might occur by chance, not by the admixture process. A fraction of genetic divergence between pairs of populations can be explained by their geographic distances, though it is not strongly supported by the Mantel test (0.01<p<0.05). In other words, genetic similarity appeared to be higher when geographically closer populations were compared. This observation indicates some degree of assimilation or admixture for different ethnic people living nearby. It reflects the fact
that, at present, different culture or language is not a barrier for communication and intermarriage among ethnic populations of northern Thailand. Consequently population sub-structure is shaped by recent gene flow in each geographic region. Although this study demonstrated microsatellite DYS385 polymorphism among most of the Tai and Mon-Khmer populations living in northern Thailand, the DYS385 data alone could not separate some populations from others, especially the Tai speaking populations in which similar genetic structures were found (Table 3). Therefore, in order to increase the discrimination power of Y microsatellites for forensic purposes, it is necessary to combine data from other Y-chromosomal loci and it would be beneficial to consider other genetic markers, such as maternal inherited mitochondrial DNA and autosomal microsatellites.
CONCLUSION
This study of microsatellite DYS385 diversity in 9 Tai-speaking and 11 Mon-Khmer speaking populations in northern Thailand showed 56 different haplotypes. The Tai speaking populations had higher haplotype diversity and discrimination power than the Mon-Khmer speakers. Genetic affinities based on DYS385 variations do not conformed to linguistic classification but a fraction of genetic divergence patterns can be explained by geographic distances.
FIGURE 5. 2D multidimensional scaling shows genetic relationships among the studied populations. Filled circles: Tai linguistic group, blank squares: Mon-Khmer linguistic group. Groups of close affinity populations
defined by SAMOVA 2.0 program are shown in dashed-line circles
1459
ACKNOWLEDGEMENTS
We would like to express our gratitude to all volunteers participating in this research project for the interviews and blood samples. The team would also like to express our appreciation to Professor Tanin Bhoopat, M.D., Department of Forensic Science, Faculty of Medicine, Chiang Mai University and Associate Professor Dr. Daoroong Kangwanpong, Department of Biology, Faculty of Science, Chiang Mai University, for their assistance in completing this research. This research was financially supported by a Junior Researcher Development Grant, Chiang Mai University, in 2010.
REFERENCES
Besaggio, D., Fuselli, S., Srikummool, M., Kampuansai, J., Castrì, L., Tyler-Smith, C., Seielstad, M., Kangwanpong, D. & Bertorelle, G. 2007. Genetic variation in Northern Thailand Hill Tribes: Origins and relationships with social structure and linguistic differences. BMC Evolutionary Biology 7(Suppl 2): S12.
Bhoopat, T., Hohoff, C. & Steger, H.F. 2003. Identification of DYS385 allele variants by using shorter amplicons and Northern Thai haplotype data. Journal of Forensic Science 48(5): 1108-1112.
Dupanloup, I., Schneider, S. & Excoffier, L. 2002. A simulated annealing approach to define the genetic structure of populations. Molecular Ecology 11(12): 2571-2581.
Excoffier, L. & Lischer, H.L. 2010. Arlequin suite ver 3.5: A new series of programs to perform population genetics analyses under Linux and Windows. Molecular Ecology Resource 10: 564-567.
Jobling, M. & Tyler-Smith, C. 2003. The human Y chromosome: An evolutionary marker comes of age. Nature review 4: 598-612.
Kampuansai, J., Kutanan, W., Phuphanitcharoenkul, S. & Kangwanpong, D. 2012. A suggested Khmuic origin of the hunter-gatherer Mlabri in northern Thailand: Evidence from maternal DNA lineages. Thai Journal of Genetics 5(2): 203-215.
Kampuansai, J., Bertoelle, G., Castri, L., Nakbunluang, S., Seielsted, M. & Kangwanpong, K. 2007. Mitochondrial DNA variation of Tai speaking people in Northern Thailand. ScienceAsia 33: 443-448.
Kangwanpong, D., Chaijaruwanich, J., Srikummool, M. & Kampuansai, J. 2004. Selection of Y-Chromosomal microsatellites for phylogenetic study among Hilltribes in Northern Thailand using the decision tree induction algorithm. ScienceAsia 30: 239-245.
Kayser, M., Caglia, A., Corach, D., Fretwell, N., Gehrig, C., Graziosi, G., Heidorn, F., Herrmann, S., Herzog, B., Hidding, M., Honda, K., Jobling, M., Krawczak, M., Leim, K., Meuser, S., Meyer, E., Oesterreich, W., Pandya, A., Parson, W., Penacino, G., Perez-Lezaun, A., Piccinini, A., Prinz, M., Schmitt, C. & Roewer, L. 1997. Evaluation of Y-chromosomal STRs: A multicenter study. International Journal of Legal Medicine 110(3): 125-133.
Lewis, M.P., Gary, F.S. & Charles, D.F. 2009. Ethnologue: Languages of the World, 17th ed. Dallas, Tex.: SIL International. http://www.ethnologue.com. Access on 13 October 2014.
Pascali, V.L., Dobosz, M. & Brinkmann, B. 1999. Coordinating Y-chromosomal STR research for the Courts. International Journal of Legal Medicine 112(1): 1.
Schliesinger, J. 2000. Ethnic Groups of Thailand: Non-Tai-Speaking Peoples. Bangkok: White Lotus Press.
Seielstad, M., Bekele, E., Ibrahim, M., Toure, A. & Traore, M. 1999. A view of modern human origins from Y chromosome microsatellite variation. Genome Research 9: 558-567.
Slatkin, M. 1995. A measure of population subdivision based on microsatellite allele frequencies. Genetics 139: 457-462.
Willuweit, S. & Roewer, L. 2007. Y chromosome haplotype reference database (YHRD): Update. Forensic Science International: Genetics 1(2): 83-87.
Department of Biology, Faculty of ScienceChiang Mai University, 50202 Thailand
*Corresponding author; email: [email protected]
Received: 8 December 2014Accepted: 22 June 2015


![java1-lecture6.ppt [호환 모드]dis.dankook.ac.kr/lectures/java20/wp-content/... · Polymorphism 다형성(Polymorphism) 다형성(polymorphism)이란객체들의타입이다르면똑같은](https://static.fdocuments.net/doc/165x107/5fcfbaad9d9260016a636609/java1-eeoedisdankookackrlecturesjava20wp-content-polymorphism.jpg)