
Microphytobenthos primary production estimated by ...
22
HAL Id: hal-02323527 https://hal.archives-ouvertes.fr/hal-02323527 Submitted on 21 Oct 2019 HAL is a multi-disciplinary open access archive for the deposit and dissemination of sci- entific research documents, whether they are pub- lished or not. The documents may come from teaching and research institutions in France or abroad, or from public or private research centers. L’archive ouverte pluridisciplinaire HAL, est destinée au dépôt et à la diffusion de documents scientifiques de niveau recherche, publiés ou non, émanant des établissements d’enseignement et de recherche français ou étrangers, des laboratoires publics ou privés. Microphytobenthos primary production estimated by hyperspectral reflectance Vona Méléder, Bruno Jesus, Alexandre Barnett, Laurent Barillé, Johann Lavaud To cite this version: Vona Méléder, Bruno Jesus, Alexandre Barnett, Laurent Barillé, Johann Lavaud. Microphytobenthos primary production estimated by hyperspectral reflectance. PLoS ONE, Public Library of Science, 2018, 13 (5), pp.e0197093. 10.1371/journal.pone.0197093. hal-02323527
Transcript of Microphytobenthos primary production estimated by ...

HAL Id: hal-02323527https://hal.archives-ouvertes.fr/hal-02323527
Submitted on 21 Oct 2019
HAL is a multi-disciplinary open accessarchive for the deposit and dissemination of sci-entific research documents, whether they are pub-lished or not. The documents may come fromteaching and research institutions in France orabroad, or from public or private research centers.
L’archive ouverte pluridisciplinaire HAL, estdestinée au dépôt et à la diffusion de documentsscientifiques de niveau recherche, publiés ou non,émanant des établissements d’enseignement et derecherche français ou étrangers, des laboratoirespublics ou privés.
Microphytobenthos primary production estimated byhyperspectral reflectance
Vona Méléder, Bruno Jesus, Alexandre Barnett, Laurent Barillé, JohannLavaud
To cite this version:Vona Méléder, Bruno Jesus, Alexandre Barnett, Laurent Barillé, Johann Lavaud. Microphytobenthosprimary production estimated by hyperspectral reflectance. PLoS ONE, Public Library of Science,2018, 13 (5), pp.e0197093. �10.1371/journal.pone.0197093�. �hal-02323527�

RESEARCH ARTICLE
Microphytobenthos primary production
estimated by hyperspectral reflectance
Vona Meleder1*, Bruno Jesus1,2, Alexandre Barnett3,4, Laurent Barille1, Johann Lavaud3,5
1 Mer Molecules Sante (MMS)–EA 21 60, Universite de Nantes, Nates, France, 2 BioISI–Biosystems &
Integrative Sciences Institute, Campo Grande University of Lisboa, Faculty of Sciences, Lisboa, Portugal,
3 Littoral Environnement et Societes (LIENSs)–UMR 7266, CNRS/Universite de La Rochelle, Institut du
Littoral et de l’Environnement, 2 rue Olympe de Gouges, La Rochelle, France, 4 Botany and Plant Science–
National University of Ireland, Galway, Ireland, 5 Takuvik–UMI 3376, CNRS/Universite Laval, Departement
de Biologie, Pavillon Alexandre Vachon, Quebec, Canada
Abstract
The use of remote sensing techniques allows monitoring of photosynthesis at the ecosys-
tem level and improves our knowledge of plant primary productivity. The main objective of
the current study was to develop a remote sensing based method to measure microphyto-
benthos (MPB) primary production from intertidal mudflats. This was achieved by coupling
hyperspectral radiometry (reflectance, ρ and second derivative, δδ) and PAM-fluorometry
(non-sequential light curves, NSLC) measurements. The latter allowed the estimation of pri-
mary production using a light use efficiency parameter (LUE) and electron transport rates
(ETR) whereas ρ allowed to estimate pigment composition and optical absorption cross-
section (a*). Five MPB species representative of the main growth forms: epipelic (benthic
motile), epipsammic (benthic motile and non motile) and tychoplanktonic (temporarily resus-
pended in the water column) were submitted to increasing light intensities from dark to
1950 μmol photons.m-2.s-1. Different fluorescence patterns were observed for the three
growth-forms and were linked to their xanthophyll cycle (de-epoxydation state). After spec-
tral reflectance measurements, a* was retrieved using a radiative transfer model and sev-
eral radiometric indices were tested for their capacity to predict LUE and ETR measured by
PAM-fluorometry. Only one radiometric index was not species or growth-form specific, i.e.
δδ496/508. This index was named MPBLUE and could be used to predict LUE and ETR. The
applicability of this index was tested with simulated bands of a wide variety of hyperspectral
sensors at spectral resolutions between 3 and 15 nm of Full Width at Half Maximum
(FWHM).
Introduction
Microphytobenthos (MPB) assemblages are composed of photosynthetic bacteria and microal-
gae that colonize benthic sediments. Typically, diatoms are the dominant microalgae group
forming golden-brown biofilms at the sediment surface during low tides [1–3]. These biofilms
exhibit very high primary productivity rates that can result in contributions of up to 50% of
PLOS ONE | https://doi.org/10.1371/journal.pone.0197093 May 14, 2018 1 / 21
a1111111111
a1111111111
a1111111111
a1111111111
a1111111111
OPENACCESS
Citation: Meleder V, Jesus B, Barnett A, Barille L,
Lavaud J (2018) Microphytobenthos primary
production estimated by hyperspectral reflectance.
PLoS ONE 13(5): e0197093. https://doi.org/
10.1371/journal.pone.0197093
Editor: Francois G. Schmitt, CNRS, FRANCE
Received: May 17, 2017
Accepted: April 26, 2018
Published: May 14, 2018
Copyright: © 2018 Meleder et al. This is an open
access article distributed under the terms of the
Creative Commons Attribution License, which
permits unrestricted use, distribution, and
reproduction in any medium, provided the original
author and source are credited.
Data Availability Statement: All data underlying
the study are available from Figshare (doi: 10.6084/
m9.figshare.5615746).
Funding: This work is supported by the Centre
National de la Recherche Scientifique-CNRS
(sabbatical and EC2CO grant to VM), the Region
Poitou-Charentes (Ph.D. grant to AB), the French
consortium CPER-Littoral (to JL), the Region Pays
de la Loire (Atlantic Micro-algae program to VM)
and the Fondation de France (grant ‘Quels littoraux
pour demain ?’ to JL and VM); the Planetology and
Geodynamic laboratory (UMR 6112, University of
Nantes-CNRS) for supplying the ASD

the total estuarine autochtonous primary production [4] and provide essential ecosystem ser-
vices, e.g. food sources for various trophic webs, sediment stabilization via exopolysaccharide
secretion (EPS) cohesion, mediation of nutrients fluxes [2,5].
MPB spatial and temporal variability is a constraint for large-scale assessments of MPB bio-
mass and primary production making the estimation of its contribution at the ecosystem level
often limited to discrete stations, and then extrapolated to the whole mudflat. Most techniques
used to assess MPB primary production rates require single point in situ measurements which
are often inadequate to capture the spatial variability at the ecosystem level (for a review see
[6]). Regarding MPB biomass, synoptic information have been obtained by time-consuming
extensive field sampling campaigns [7], or using remote sensing technology [8].
Currently, remote sensing studies have mainly focused on quantifying MPB biomass [9–14]
and no algorithm exists yet for estimating MPB primary production from remote sensing
imagery. However, monitoring photosynthesis from Space, has been recently proposed for
land resources (for a review see [15]. It is a great challenge to improve our knowledge of the
main drivers and resources constraints of plant or algal productivity and it is needed for pre-
dicting impacts of climate change [10,15] and for the management of costal ecosystems [9,13].
The main objective of the current study is to develop a method to estimate MPB primary pro-
duction directly from hyperspectral imagery in the visible domain. It is based on pigment
absorption changes that are detected in reflectance spectra due to photosynthetic capacity
changes as a response to changes in light environment.
This was achieved by coupling PAM-fluorometry measurements for estimating primary
production [16–18], and spectroradiometry to measure reflectance spectra of five MPB spe-
cies representative of the main growth forms. Growth-forms are known to strongly affect
eco-physiological responses to light exposure: non photochemical quenching (NPQ) and
xanthophyll cycle (XC) patterns [19–23]. Epipelic (moving freely between sediment parti-
cles) and epipsammic species (living in close association with individual sand grains) show
respectively low and high NPQ values and XC efficiency during high light exposure,
whereas tychoplanktonic species show a light response similar to epipelon [19]. Because of
these different eco-physiological response features, different radiometric indices are
expected to estimate primary production for the different growth forms (i.e. epipelon/
tychoplankton vs. epipsammon). We propose here the first spectral index based on MPB
growth forms spectral properties for estimating primary production via electron transport
rate (ETR). Simulating airborne and satellite hyperspectral sensors in the VIS-NIR domain
using generic bandwidth, this index offers promising prospects for global primary produc-
tivity assessment of intertidal MPB biofilms.
Materials and methods
Diatoms culturing
Five diatoms species were selected from a previous study [19] to carry out spectroradiometric
and PAM-fluorescence measurements. These species were isolated from natural MPB biofilms
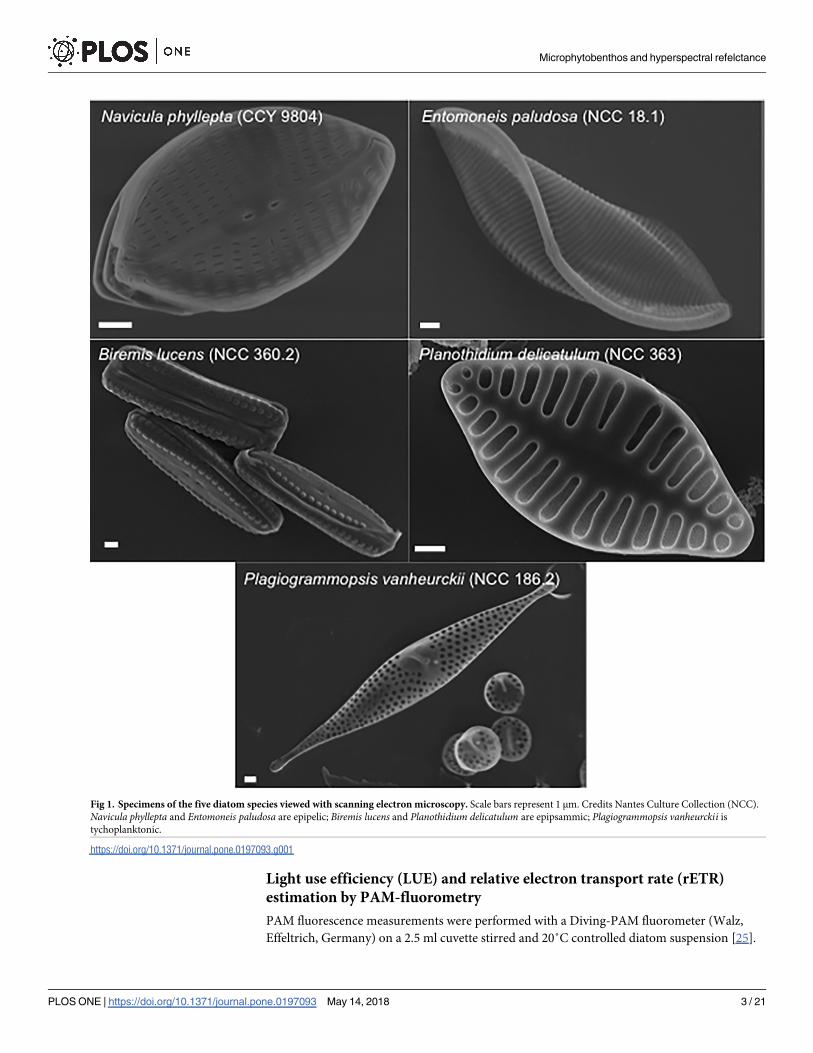
and are kept in the Nantes Culture Collection (NCC WDCM 856) (Fig 1). Navicula phyllepta(CCY 9804) and Entomoneis paludosa (NCC 18.1) are epipelic motile species; Biremis lucens(NCC 360.2) and Planothidium delicatulum (NCC 363) are epipsammic, respectively motile
and non-motile species; and Plagiogrammopsis vanheurckii (NCC 186.2) is a tychoplanktonic
species. All diatoms were grown in batch cultures at 20˚C in sterile artificial F/2 medium [24],
at 20 μmol photon.m-2.s-1 and a 16h:8h light:dark photoperiod. Cultures were acclimated dur-
ing 2 weeks before experiments. Diatom suspensions were concentrated to a final concentra-
tion of 10 mg Chla.L-1 before each experiment. For further details, see [19].
Microphytobenthos and hyperspectral refelctance
PLOS ONE | https://doi.org/10.1371/journal.pone.0197093 May 14, 2018 2 / 21
FieldSpec3spectrometer. The funders had no role
in study design, data collection and analysis,
decision to publish, or preparation of the
manuscript.
Competing interests: The authors have declared
that no competing interests exist.
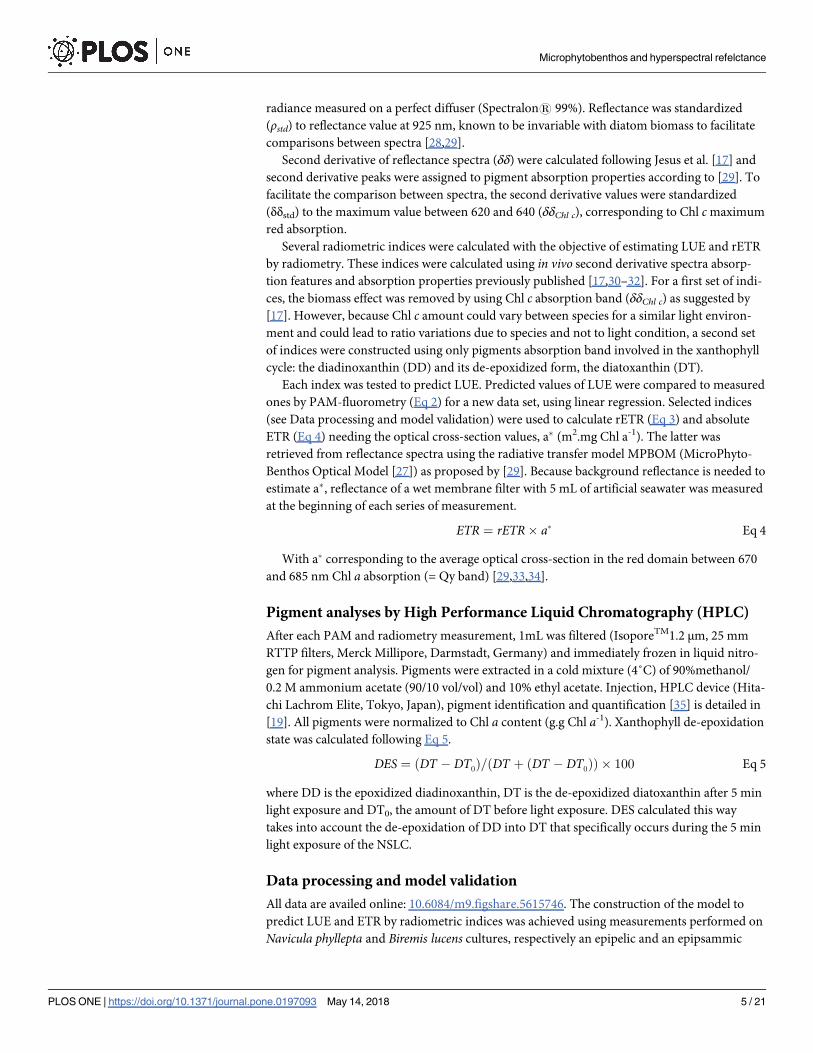
Light use efficiency (LUE) and relative electron transport rate (rETR)
estimation by PAM-fluorometry
PAM fluorescence measurements were performed with a Diving-PAM fluorometer (Walz,
Effeltrich, Germany) on a 2.5 ml cuvette stirred and 20˚C controlled diatom suspension [25].
Fig 1. Specimens of the five diatom species viewed with scanning electron microscopy. Scale bars represent 1 μm. Credits Nantes Culture Collection (NCC).
Navicula phyllepta and Entomoneis paludosa are epipelic; Biremis lucens and Planothidium delicatulum are epipsammic; Plagiogrammopsis vanheurckii is
tychoplanktonic.
https://doi.org/10.1371/journal.pone.0197093.g001
Microphytobenthos and hyperspectral refelctance
PLOS ONE | https://doi.org/10.1371/journal.pone.0197093 May 14, 2018 3 / 21

Suspension stirred was the selected configuration for these experimentations, rather than cells
deposited on a surface, imitating natural biofilm, to enhance the illumination of cells during
measurement. This choice avoided confusing physiological responses due to self-shading or
epipelic migration movements. These controlled conditions allowed to measure for each spe-
cies: minimum fluorescence yield (Fo), maximum fluorescence yield (Fm) and maximum pho-
tosystem II (PSII) quantum yield (Fv/Fm) after 15 min dark-adaptation with a saturating pulse
of 3600 μmol photons.m-2.s-1 (duration 400 ms). This was followed by non-sequential light
curve (NSLC) measurements [26] using continuous light (KL-2500 lamp, Schott, Mainz, Ger-
many) applied for 5 min at 9 light intensities (E) (48–1950 μmol photons.m-2.s-1); a new dia-
tom suspension was used for each light intensity. NSLCs methodology was selected for these
experimentations rather than RLCs (rapid light curve) for which the same suspension is used
for at all light levels. Thus, NSLCs avoid the effects of light history and light dose accumulation
in photosynthetic responses. At the end of each light level, the minimum fluorescence yield in
light adapted state (F’) was measured and, with a saturating pulse, the maximum fluorescence
yield in light acclimated state (Fm’). PSII effective quantum yield (FPSII), non-photochemical
quenching (NPQ) and relative electron transport rate (rETR) were calculated with Eqs 1, 2 and
3, respectively. According to [16], the FPSII can also be considered as the light utilization effi-
ciency (LUE).
NPQ ¼ ðFm=Fm0Þ � 1 Eq 1
FPSII ¼ LUE ¼ ðFm0 � FÞ=Fm
0 Eq 2
rETR ¼ LUE � E Eq 3
Spectroradiometry
At the end of each PAM measurement a volume of 0.5 mL diatom suspension was sampled,
immediately diluted in 5 mL of artificial seawater and deposited on anisoporeTM polycarbon-
ate membrane filter (IsoporeTM1.2 μm, 25 mm RTTP filters, Merck Millipore, Darmstadt, Ger-
many) by slow filtration limiting degradation of cells [27,28]. The filtration was done in the
dark, during less than 30 sec. allowing the cell pigment content to remain similar as in the
cuvette. This 5 mL volume allowed to homogenously cover membrane filters with a ~ 13 mg
Chl a.m-2 layer, a representative biomass value encountered at the mudflat surface [12]. This
value remains below saturation threshold occurring for values greater than 40 mg Chl a.m-2
[12]. All spectral measurements were performed immediately after filtration on wet membrane
filters deposited over a black background. This precaution allowed avoiding multiple back-
ground reflectances which could trigger the xanthophyll cycle if the background is highly
reflected as observed in pre-experimentation using Navicula phyllepta (data not shown). Five
measurements per membrane filter were performed using an ASD FieldSpec3spectrometer
(300–2500 nm, spectral resolution: 1 nm in the VIS-IR domain, property of the Laboratory of
Planetology and Geodynamic (LPG-UMR 6112 of the University of Nantes) to determine radi-
ance (mW.cm-2.nm-2.sr-1). The light source was provided by an internal halogen lamp (300–
2500 nm) and the distance between the membrane filter and the ASD optical fiber was kept
constant by using the ASD High Intensity Contact Probe. The distance of the lamp was 1.38
cm, the distance and viewing angle of the ASD fiber were respectively 0.76 cm and 55˚. The
field of view of the fiber with the contact probe was an oval (10.9 X 13.4 mm) smaller than the
diameter of filter (25 mm). This procedure assured that only the cells were being measured
and minimized any errors associated with stray light. Reflectance (ρ, dimensionless) was calcu-
lated as the ratio between the radiance of the cells on membrane filters and the incident
Microphytobenthos and hyperspectral refelctance
PLOS ONE | https://doi.org/10.1371/journal.pone.0197093 May 14, 2018 4 / 21
radiance measured on a perfect diffuser (Spectralon1 99%). Reflectance was standardized
(ρstd) to reflectance value at 925 nm, known to be invariable with diatom biomass to facilitate
comparisons between spectra [28,29].
Second derivative of reflectance spectra (δδ) were calculated following Jesus et al. [17] and
second derivative peaks were assigned to pigment absorption properties according to [29]. To
facilitate the comparison between spectra, the second derivative values were standardized
(δδstd) to the maximum value between 620 and 640 (δδChl c), corresponding to Chl c maximum
red absorption.
Several radiometric indices were calculated with the objective of estimating LUE and rETR
by radiometry. These indices were calculated using in vivo second derivative spectra absorp-
tion features and absorption properties previously published [17,30–32]. For a first set of indi-
ces, the biomass effect was removed by using Chl c absorption band (δδChl c) as suggested by
[17]. However, because Chl c amount could vary between species for a similar light environ-
ment and could lead to ratio variations due to species and not to light condition, a second set
of indices were constructed using only pigments absorption band involved in the xanthophyll
cycle: the diadinoxanthin (DD) and its de-epoxidized form, the diatoxanthin (DT).
Each index was tested to predict LUE. Predicted values of LUE were compared to measured
ones by PAM-fluorometry (Eq 2) for a new data set, using linear regression. Selected indices
(see Data processing and model validation) were used to calculate rETR (Eq 3) and absolute
ETR (Eq 4) needing the optical cross-section values, a� (m2.mg Chl a-1). The latter was
retrieved from reflectance spectra using the radiative transfer model MPBOM (MicroPhyto-
Benthos Optical Model [27]) as proposed by [29]. Because background reflectance is needed to
estimate a�, reflectance of a wet membrane filter with 5 mL of artificial seawater was measured
at the beginning of each series of measurement.
ETR ¼ rETR� a� Eq 4
With a� corresponding to the average optical cross-section in the red domain between 670
and 685 nm Chl a absorption (= Qy band) [29,33,34].
Pigment analyses by High Performance Liquid Chromatography (HPLC)
After each PAM and radiometry measurement, 1mL was filtered (IsoporeTM1.2 μm, 25 mm
RTTP filters, Merck Millipore, Darmstadt, Germany) and immediately frozen in liquid nitro-
gen for pigment analysis. Pigments were extracted in a cold mixture (4˚C) of 90%methanol/
0.2 M ammonium acetate (90/10 vol/vol) and 10% ethyl acetate. Injection, HPLC device (Hita-
chi Lachrom Elite, Tokyo, Japan), pigment identification and quantification [35] is detailed in
[19]. All pigments were normalized to Chl a content (g.g Chl a-1). Xanthophyll de-epoxidation
state was calculated following Eq 5.
DES ¼ ðDT � DT0Þ=ðDT þ ðDT � DT0ÞÞ � 100 Eq 5
where DD is the epoxidized diadinoxanthin, DT is the de-epoxidized diatoxanthin after 5 min
light exposure and DT0, the amount of DT before light exposure. DES calculated this way
takes into account the de-epoxidation of DD into DT that specifically occurs during the 5 min
light exposure of the NSLC.
Data processing and model validation
All data are availed online: 10.6084/m9.figshare.5615746. The construction of the model to
predict LUE and ETR by radiometric indices was achieved using measurements performed on
Navicula phyllepta and Biremis lucens cultures, respectively an epipelic and an epipsammic
Microphytobenthos and hyperspectral refelctance
PLOS ONE | https://doi.org/10.1371/journal.pone.0197093 May 14, 2018 5 / 21

growth form. Model significance was tested by linear regression (R software) and only radio-
metric indices explaining more than 40% (R2>0.4) of LUE variability measured by PAM fluo-
rometry were kept. Validation of these selected models was carried out by comparing LUE
measured by PAM-fluorometry with LUE predicted by radiometric indices for an independent
data set from Entomoneis paludosa, Planothidium delicatulum and Plagiogrammopsis van-heurckii cultures, respectively an epipelic, an epipsammic and a tychoplanktonic growth form.
Models with the smaller root mean square errors (RSME� 0.02) were thus used for further
calculation of ETR (Eq 4).
To demonstrate the viability of using the selected reflectance index to predict ETR on
hyperspectral images, each diatom spectrum was degraded at several spectral resolutions from
3 to 15 nm in the NIR-VIS domain (400–1000 nm). The objective was to simulate reflectance
spectra that would be obtained from existing or incoming hyperspectral sensors to calculate
second derivatives [17] and index values, and to retrieve a� using the MPBOM. No hyperspec-
tral images were used, but reflectance index values and a� were calculated from simulated spec-
tra of various sensors to predict ETR. Spectral resolution simulation was carried out using
ENVI software by convolving the reflectance data with Gaussian-like spectral response pro-
files. Actual spectral response profiles of varied sensors were used to generate a series of
generic bandwidths from 3 to 15 nm FWHM (Full Width at Half Maximum): HySpex, AVIR-
ISng, EnMAP, AVIRIS, Hyperion and HyMap. Spectral resolution where estimated ETR sig-
nificantly fitted to ETR measured by PAM-fluorometry (R2 > 0.80; p<0.001) were considered
strong enough to be used for monitoring MPB photosynthesis from Space.
Results
Xanthophyll cycle pigments
All diatom main pigments (Table 1), Chl c, fucoxanthin (Fuco), β-carotene and xanthophylls
(DD+DT) showed stable pigment to Chl a ratios during light exposures, but varied with spe-
cies (2 way ANOVA: p>0.2 for light exposure; p<0.001 for species). The only pigment ratio
that changed with light intensities was the xanthophyll cycle DES ratio estimating the conver-
sion of the DD into DT with increasing light intensity (Fig 2). As expected (see [19]), the epipe-
lic growth form showed the lowest DES values (17.37% ± 2.26 SD) together with the
tychoplanktonic form (20.72% ± 0.76 SD). Epipsammic growth form showed the highest DES
value (32.6% ± 4.65 SD). The stability in the pool of xanthophyll pigments (DD+DT) indicated
that no DT was synthesized ‘de novo’ during illumination (see [36]) and only arose from the
de-epoxidation of the DD.
Table 1. Pigment ratios relative to chlorophyll a of each strain, expressed in g.g-1 Chl a. Values are the mean of ratios obtained at the end of each light exposure (from
0 to 1950 μmol photon.m-2.s-1) ± variation coefficient. Growth form is presented for each strain.
Chl c Fuco β car DD+DT
Navicula phyllepta(epileplic)
15.41 ± 0.03 58.93 ± 0.01 3.78 ± 0.04 7.58 ± 0.06
Biremis lucens(epipsammic non-motile)
15.26 ± 0.02 56.80 ± 0.02 1.14 ± 0.22 9.68 ± 0.08
Entomoneis paludosa(epipelic)
18.91 ± 0.01 73.52 ± 0.01 3.59 ± 0.06 6.74 ± 0.04
Planothidium delicatulum(epipsammic motile)
17.57 ± 0.09 59.59 ± 0.09 1.25 ± 0.14 9.37 ± 0.10
Plagiogrammopsis vanheurckii(tychoplanktonic)
27.18 ± 0.05 92.78 ± 0.07 1.27 ± 0.2 9.95 ± 0.21
https://doi.org/10.1371/journal.pone.0197093.t001
Microphytobenthos and hyperspectral refelctance
PLOS ONE | https://doi.org/10.1371/journal.pone.0197093 May 14, 2018 6 / 21

Light use efficiency estimation based on PAM fluorescence
LUE and NPQ measured by PAM-fluorometry changed inversely with E: while NPQ
increased, LUE decreased with increasing E. Consequently, LUE and NPQ showed inversed
relationships with DES (Fig 3) and both could be predicted using DES (Eq 6 and Eq 7):
NPQ ¼ 0:001� DES2 þ 0:026� DESþ 0:046 ðR2 ¼ 0:94; p < 0:001Þ Eq 6
NPQ ¼ 0:0002� DES2 � 0:012� DESþ 0:679 ðR2 ¼ 0:78; p < 0:001Þ Eq 7
The trend observed for the DES as function of light intensity (Fig 2) was kept for NPQ and
LUE: epipsammic species were those with the highest NPQ and lowest LUE values, whereas
epipelic and tychoplanktonic species showed inverted trends (Fig 3). Maximum NPQ values
were reached by B. lucens (more than 2.0) for the highest light intensity corresponding to the
highest DES (Fig 3A). LUE lowest values (� 0.5) were mainly observed in the two epipsammic
species (B. lucens and P. delicatulum), even if N. phyllepta also showed low LUE at high light
intensities (Fig 3B). Thus, growth forms responses showed a pattern along the regression
curve: first epipelic and tychoplanktonic forms, then epipsammic ones for the highest DES
level, never reached by the other growth forms (Fig 2).
Selection of relevant indices from second derivative spectra
Spectral reflectance showed typical diatoms signatures [17,28] with specific pigment absorp-
tion bands respectively due to DD+DT (at 496 nm), Fuco (at 540 nm), Chl c (at 632 nm) and
Fig 2. DES versus light intensity after 5 min exposure for the three growth forms. ●Epipelic (Navicula phyllepta and
Entomoneis paludosa); ■Epipsammic (Biremis lucens and Planothidium delicatulum); ◆Tychoplanktonic
(Plagiogrammopsis vanheurckii). Averaged DES were fitted using the model proposed by [37], vertical bars represent
standard deviation.
https://doi.org/10.1371/journal.pone.0197093.g002
Microphytobenthos and hyperspectral refelctance
PLOS ONE | https://doi.org/10.1371/journal.pone.0197093 May 14, 2018 7 / 21

Fig 3. Relationships between NPQ and DES (a) and LUE and DES (b) for the three growth forms. ●Epipelic
(Navicula phyllepta and Entomoneis paludosa); ■Epipsammic (Biremis lucens and Planothidium delicatulum);
Microphytobenthos and hyperspectral refelctance
PLOS ONE | https://doi.org/10.1371/journal.pone.0197093 May 14, 2018 8 / 21

Chl a (at 588 and 673 nm) (Fig 4A). These absorption bands were confirmed using standard-
ized (to Chl c) second derivatives spectra (δδstd, Fig 4B). However, DD+DT absorption band
(around 496 nm) showed further absorption features (i.e. shoulders) in 2nd derivative spectra,
changing with light intensity as illustrated for B. lucens (Fig 5). Shoulders at 496, 500 and 505
nm were respectively assigned to DD+DT with a maximum during low light exposure (496
nm, DD+DTLL), no change with light at 500 nm, and DD+DTHL increasing with light expo-
sure (Fig 5). Shoulders at 487, 508 and 522nm were assigned to xanthophyll absorptions fea-
tures from literature: DD1 according to [30], DT3 according to [17] and the ‘activated’ DT
(DT4NPQ), i.e. the molecules of DT effectively involved in NPQ [31,38] (Fig 5). Note that
under our NSLC light conditions (i.e. 5 min exposure), DT arose from the xanthophyll cycle
only (i.e. DD de-epoxidation), DT was synthesized from DD de-epoxidation and no DT was
synthesized ‘de novo’ [36].
These spectral features were used to establish spectral indices built up as band ratios. Some
indices were standardized to the Chl c absorption at 632 nm. Linear relationships were calcu-
lated between each index and LUE values measured by PAM-fluorometry for two growth
forms: epipelic (represented by N. phyllepta) and epipsammic (represented by B. lucens). Thir-
teen indices displayed significant relationships (R2> 0.4; p� 0.001; Tables 2 and 3). Five fitted
to both growth forms: δδ508/632; δδ496/505; δδ496/508; δδ500/505 and δδ500/508, seven fitted only to
the epipsammic growth form: δδ496/632; δδ520/632; δδ496/500; δδ496/520; δδ500/520; δδ505/520 and
δδ508/520; one index, δδ505/632, fitted only to the epipelic growth form. Within these 13 linear
regressions, only 6 indices (Tables 2 and 3, in bold) allowed to predict LUE values of the three
other species (E. paludosa, P. delicatulum and P. vanheurckii) with RSME values� 0.02 (Eqs
8–13):
LUE ¼ � 3:130� dd505=632 þ 1:702 Eq 8
LUE ¼ 1:597� dd496=632 � 0:347 Eq 9
LUE ¼ � 5:313� dd520=632 þ 0:027 Eq 10
LUE ¼ 0:056� dd496=508L þ 0:247 Eq 11
LUE ¼ 0:064� dd496=508S þ 0:258 Eq 12
LUE ¼ 0:190� dd500=520 þ 1:316 Eq 13
Most of these six indices were species specific (Tables 2 and 3), except δδ496/508 which could
be used for both N. phyllepta and B. lucens (Tables 2 and 3, Eqs 11 and 12). Analyses of covari-
ance were performed with all the six regressions and confirmed that only those involving
δδ496/508L and δδ496/508S were not significantly different (ANCOVA, p>0.05), and therefore
not be affected by species. For this reason, we propose a single relationship based on the index
◆Tychoplanktonic (Plagiogrammopsis vanheurckii). Equations of non-linear regressions are reported in the text (Eqs 8
and 9). Dashed lines represent 95% CI.
https://doi.org/10.1371/journal.pone.0197093.g003
Microphytobenthos and hyperspectral refelctance
PLOS ONE | https://doi.org/10.1371/journal.pone.0197093 May 14, 2018 9 / 21
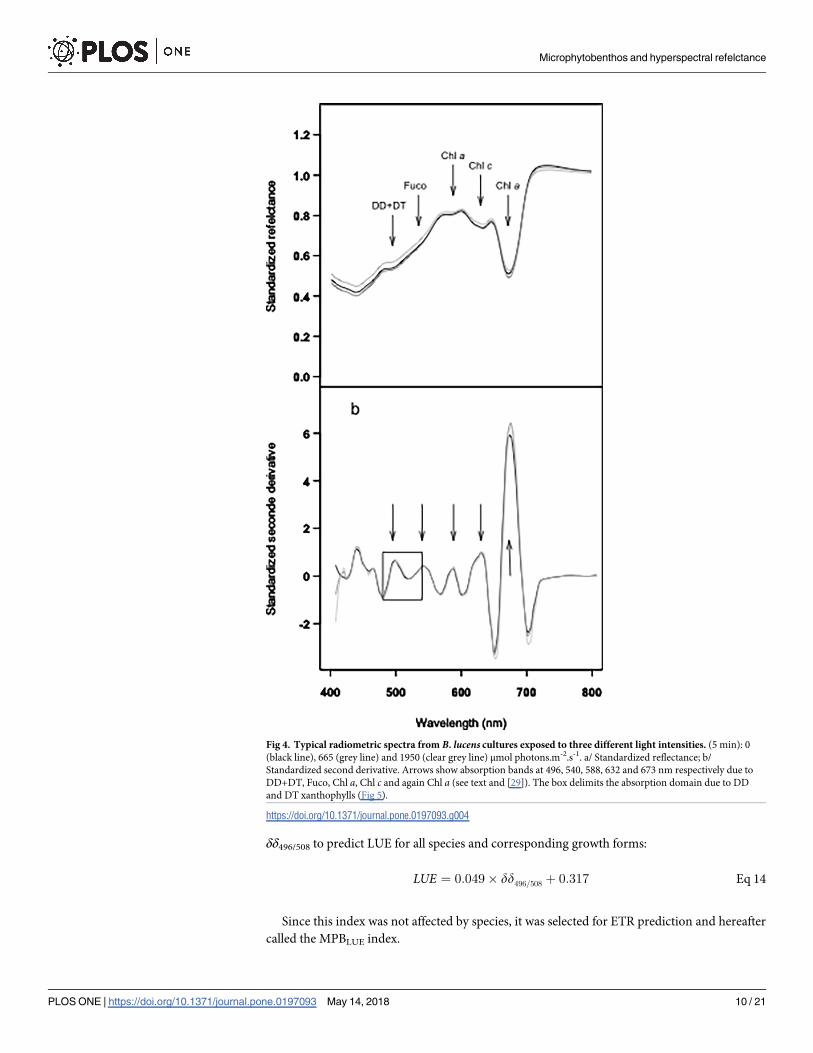
δδ496/508 to predict LUE for all species and corresponding growth forms:
LUE ¼ 0:049� dd496=508 þ 0:317 Eq 14
Since this index was not affected by species, it was selected for ETR prediction and hereafter
called the MPBLUE index.
Fig 4. Typical radiometric spectra from B. lucens cultures exposed to three different light intensities. (5 min): 0
(black line), 665 (grey line) and 1950 (clear grey line) μmol photons.m-2.s-1. a/ Standardized reflectance; b/
Standardized second derivative. Arrows show absorption bands at 496, 540, 588, 632 and 673 nm respectively due to
DD+DT, Fuco, Chl a, Chl c and again Chl a (see text and [29]). The box delimits the absorption domain due to DD
and DT xanthophylls (Fig 5).
https://doi.org/10.1371/journal.pone.0197093.g004
Microphytobenthos and hyperspectral refelctance
PLOS ONE | https://doi.org/10.1371/journal.pone.0197093 May 14, 2018 10 / 21

Electron transfer rate prediction using MPBLUE index
ETR prediction following Eqs 3 and 4, needed the estimation of LUE by radiometry (from
Eq 14), but also the optical absorption cross-section (a�) retrieved from the radiative transfer
model MPBOM applied to each reflectance spectrum. We verified that the a� parameter
remained stable at all light levels for all diatom species with a mean value of 0.09 m2.mg Chla-1
± 0.01 SD (ANOVA, p = 0.9, Fig 6). ETR predictions based on the MPBLUE index showed a
highly significant linear relationship with measured PAM-fluorometry ETR (R2 = 0.92,
p<0.001; Fig 7) with a slope of 0.93 not significantly different from 1 (p>0.05).
Fig 5. Zoom from Fig B for standardized second derivative over the absorption domain due to xanthophyll pigments involved in the XC (DD and DT) between
480 and 530 nm. Shoulders are assigned to absorption features of DD and DT from literature (DD1: [30]; DT3: [17]; and DT4NPQ: [31,38] and from this study (DD
+DT2LL, DD+DT2 and DD+DT2
HL). For details see text.
https://doi.org/10.1371/journal.pone.0197093.g005
Microphytobenthos and hyperspectral refelctance
PLOS ONE | https://doi.org/10.1371/journal.pone.0197093 May 14, 2018 11 / 21
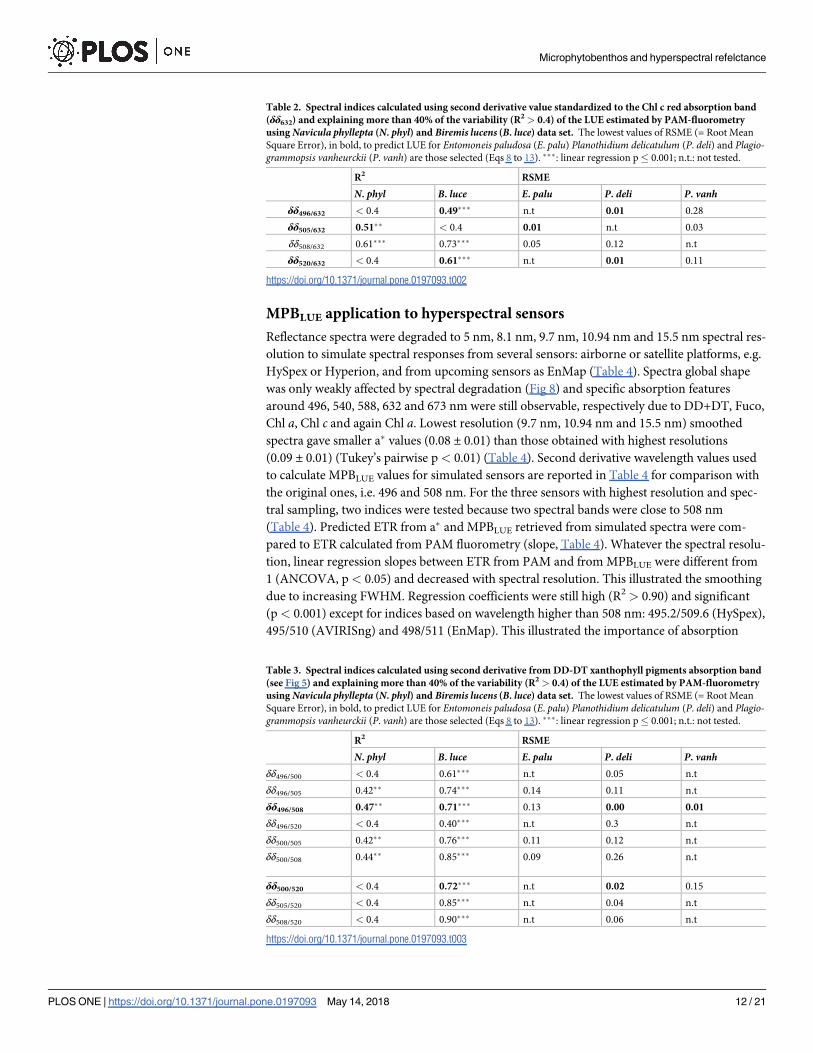
MPBLUE application to hyperspectral sensors
Reflectance spectra were degraded to 5 nm, 8.1 nm, 9.7 nm, 10.94 nm and 15.5 nm spectral res-
olution to simulate spectral responses from several sensors: airborne or satellite platforms, e.g.
HySpex or Hyperion, and from upcoming sensors as EnMap (Table 4). Spectra global shape
was only weakly affected by spectral degradation (Fig 8) and specific absorption features
around 496, 540, 588, 632 and 673 nm were still observable, respectively due to DD+DT, Fuco,
Chl a, Chl c and again Chl a. Lowest resolution (9.7 nm, 10.94 nm and 15.5 nm) smoothed
spectra gave smaller a� values (0.08 ± 0.01) than those obtained with highest resolutions
(0.09 ± 0.01) (Tukey’s pairwise p< 0.01) (Table 4). Second derivative wavelength values used
to calculate MPBLUE values for simulated sensors are reported in Table 4 for comparison with
the original ones, i.e. 496 and 508 nm. For the three sensors with highest resolution and spec-
tral sampling, two indices were tested because two spectral bands were close to 508 nm
(Table 4). Predicted ETR from a� and MPBLUE retrieved from simulated spectra were com-
pared to ETR calculated from PAM fluorometry (slope, Table 4). Whatever the spectral resolu-
tion, linear regression slopes between ETR from PAM and from MPBLUE were different from
1 (ANCOVA, p < 0.05) and decreased with spectral resolution. This illustrated the smoothing
due to increasing FWHM. Regression coefficients were still high (R2 > 0.90) and significant
(p< 0.001) except for indices based on wavelength higher than 508 nm: 495.2/509.6 (HySpex),
495/510 (AVIRISng) and 498/511 (EnMap). This illustrated the importance of absorption
Table 2. Spectral indices calculated using second derivative value standardized to the Chl c red absorption band
(δδ632) and explaining more than 40% of the variability (R2 > 0.4) of the LUE estimated by PAM-fluorometry
using Navicula phyllepta (N. phyl) and Biremis lucens (B. luce) data set. The lowest values of RSME (= Root Mean
Square Error), in bold, to predict LUE for Entomoneis paludosa (E. palu) Planothidium delicatulum (P. deli) and Plagio-grammopsis vanheurckii (P. vanh) are those selected (Eqs 8 to 13). ���: linear regression p� 0.001; n.t.: not tested.
R2 RSME
N. phyl B. luce E. palu P. deli P. vanhδδ496/632 < 0.4 0.49��� n.t 0.01 0.28
δδ505/632 0.51�� < 0.4 0.01 n.t 0.03
δδ508/632 0.61��� 0.73��� 0.05 0.12 n.t
δδ520/632 < 0.4 0.61��� n.t 0.01 0.11
https://doi.org/10.1371/journal.pone.0197093.t002
Table 3. Spectral indices calculated using second derivative from DD-DT xanthophyll pigments absorption band
(see Fig 5) and explaining more than 40% of the variability (R2 > 0.4) of the LUE estimated by PAM-fluorometry
using Navicula phyllepta (N. phyl) and Biremis lucens (B. luce) data set. The lowest values of RSME (= Root Mean
Square Error), in bold, to predict LUE for Entomoneis paludosa (E. palu) Planothidium delicatulum (P. deli) and Plagio-grammopsis vanheurckii (P. vanh) are those selected (Eqs 8 to 13). ���: linear regression p� 0.001; n.t.: not tested.
R2 RSME
N. phyl B. luce E. palu P. deli P. vanhδδ496/500 < 0.4 0.61��� n.t 0.05 n.t
δδ496/505 0.42�� 0.74��� 0.14 0.11 n.t
δδ496/508 0.47�� 0.71��� 0.13 0.00 0.01
δδ496/520 < 0.4 0.40��� n.t 0.3 n.t
δδ500/505 0.42�� 0.76��� 0.11 0.12 n.t
δδ500/508 0.44�� 0.85��� 0.09 0.26 n.t
δδ500/520 < 0.4 0.72��� n.t 0.02 0.15
δδ505/520 < 0.4 0.85��� n.t 0.04 n.t
δδ508/520 < 0.4 0.90��� n.t 0.06 n.t
https://doi.org/10.1371/journal.pone.0197093.t003
Microphytobenthos and hyperspectral refelctance
PLOS ONE | https://doi.org/10.1371/journal.pone.0197093 May 14, 2018 12 / 21

band location for indices calculation. However, index using the broader band sensor at 15.5
nm resolution (HyMap) remained useful in spite of the location of the band at 510 nm. This
result could be explained by the integration of spectral response at 508 nm and above in this
large spectral band whereas it was not the case for the smaller bands of high spectral resolution
sensors.
Discussion
Selection of a radiometric index for ETR prediction: The MPBLUE index
The objective of this study was to find a radiometric index to predict ETR from reflectance
spectra as a proxy for MPB primary production. The choice of PAM-fluorometry to estimate
ETR to calibrate a radiometric index was based on the fact that data time acquisition is in the
Fig 6. Optical absorption cross-section a�. Retrieved from the MPBOM transfer radiative model [27] and averaged over the Chl a absorption domain (670 to 685 nm)
and for all species. Vertical bars represent standard deviation.
https://doi.org/10.1371/journal.pone.0197093.g006
Microphytobenthos and hyperspectral refelctance
PLOS ONE | https://doi.org/10.1371/journal.pone.0197093 May 14, 2018 13 / 21

same time range for both techniques. Using NSLCs and other light curves [18], photosynthetic
parameters and reflectance data are obtained in the same time range, i.e. less than 1 second for
each measurement type [39]. This time range duration reflects similar processes: fluorescence
emission time due to actinic light effect and the reflectance of this light. Alternative techniques
require longer measuring times, e.g. CO2 fluxes using benthic chambers can take more than 20
min [40]; 14C based techniques take even longer [41], integrating processes that take much lon-
ger than pigment de-epoxydation or electron transfer. Furthermore, radiometric data are
closely linked to pigment composition as any change in pigment content is known to induce
reflectance and second derivative spectral changes [29,42]. Changes in chlorophyll fluores-
cence (especially via NPQ) is also closely related to pigment composition, namely to the xan-
thophylls DD and DT [17,43–45]. For these two reasons, i.e. time scale and strong relationship
Fig 7. Measured ETR (from PAM fluorometry) vs. predicted ETR (from radiometric measurements using the MPBLUE index). The dash line is the slope (= 0.93) of
the linear regression (R2 = 0.92, p<0.001). All species and growth forms were included: ●Epipelic (Navicula phyllepta and Entomoneis paludosa); ■Epipsammic (Biremislucens and Planothidium delicatulum); ◆Tychoplanktonic (Plagiogrammopsis vanheurckii).
https://doi.org/10.1371/journal.pone.0197093.g007
Microphytobenthos and hyperspectral refelctance
PLOS ONE | https://doi.org/10.1371/journal.pone.0197093 May 14, 2018 14 / 21

with pigments, PAM-fluorometry is probably the better technique to couple with spectroradio-
metry. Additionally, the choice of PAM-fluorometry to calibrate reflectance data with the pur-
pose of estimating MPB primary production is also supported by the results from [46]. They
observed correlation between MPB community production (measured with benthic chambers)
and rETR (measured by PAM-fluorometry) at different sites and different seasons [46], even if
the relationship could be site-dependent [47].
In this study, we focus on the light effect on ETR estimation whereas temperature also can
influence the ETR and thus its relationship with MBPLUE. However, measurements were done
at 20˚C, near to the optimal temperature for MPB primary production [41], and it is known
that MPB is adapted to a wide range of temperature without significant change in primary pro-
ductivity [48].
From all the indices tested in this study only one index was selected, i.e. the MPBLUE
index (δδ496/508) because it was independent of species and growth forms. This is an unex-
pected result because diatom growth forms strongly affect eco-physiological response to
light exposure as demonstrated previously [19–22]. It was confirmed by the present work
with expected differences between epipsammon and epipelon DD de-epoxidation
responses (i.e. highest and lowest, respectively, see [19]). Although DES differences were
significant between growth forms, it did not affect ETR prediction using the MPBLUE
index. This result could be explained by the direct link between this index and the DES
level: a high DES level corresponds to a low MPBLUE, whatever the growth forms. This is
confirmed by the other indices based on xanthophyll absorption bands: these indices are
still significant for all growth forms, but less than the MPBLUE. On the other hand, indices
using Chl c absorption band are highly growth form dependent, due to Chl c content
changing with species.
This is ideal for remote sensing applications since the MPBLUE index could be applied to
natural microphytobenthic assemblages independently of their growth form/specific
Table 4. Spectral resolution (full width at half maximum, FWHM) and corresponding sensors used to simulate new spectra and retrieve new a� and MPBLUE values
for estimating ETR. Slope and R2 of linear regression between ETR estimated from fluorometry and radiometry are reported. All regressions are significant (p< 0.001),
except (1); (2) Future sensors; (3) Spectral sampling is indicated when different of the FWHM.
Spectral resolution
(Spectral sampling)(3)
Spectral range
Sensors (Company) Platform
(Spatial resolution)a� ± std MPBLUE bands Slope
(R2)
3.5 nm
(3.6 nm)
416–992 nm
HySpex 1600
(Norsk Elekto Optikk)
Airborne
(� 1 m)0.09 ± 0.01 495.2/509.6
495.2/506
3.02 (0.19)
0.82
(0.95)
5 nm
380–2510 nmAVIRISng Airborne (1–4 m) 0.09 ± 0.01 495/510
495/505
0.99(1)
(0.14)
0.75
(0.92)
8.1 nm
(6.5 nm)
420–1000 nm
EnMAP(2) (DLR) Satelite (30 m) 0.09 ± 0.01 498/511
498/504.5
1.16 (0.23)
0.74
(0.98)
9.7 nm
for 360–670 nm9.5 nm
for 660–1280 nm
AVIRIS (NASA) Airborne (1–4 m) 0.08 ± 0.01 495/505 0.63 (0.94)
10.94 nm
(9.2 nm)
355.59–2577.08 nm
Hyperion
(NASA)
Satelite (30 m) 0.07 ± 0.01 498/508 0.66
(0.97)
15.5 nm
(15 nm)
450–1350 nm
HyMap (HyVista) Airborne
(5 m)0.08 ± 0.01 495/510 0.61 (0.97)
https://doi.org/10.1371/journal.pone.0197093.t004
Microphytobenthos and hyperspectral refelctance
PLOS ONE | https://doi.org/10.1371/journal.pone.0197093 May 14, 2018 15 / 21

composition as long as they are dominated by diatoms which is most often the case for temper-
ate mudflats [2,49–51].
All indices investigated here were mainly linked to DD and/or DT absorption bands around
500 nm. Globally, absorption before 500 nm decreased with light whereas over 500 nm it
increased. This pattern is due to the de-epoxidation of DD into DT as previously reported by
[17]. It explains why several indices identified in this study are close to the one proposed by
[17], i.e. δδ508/632. However, the relationship between second derivative wavelength and LUE
was different: [17] described an exponential relationship, whereas we found linear one. This
difference could be explained by: 1) light conditions (acclimation, intensity and duration)
were different and responsible for range of LUE smaller in the current study; 2) Chl c content
Fig 8. Spectra from B. lucens culture, after 5 min in the dark at different spectral resolutions. From the top (dark line) to the bottom (clear grey line): 1 nm (original
data from ASD), 3.26 nm (HySpex simulation), 3.5 nm (CASI simulation), 6 nm (EnMap simulation), 10 nm (AVIRIS, Hyperion and HypXim simulation) and 15 nm
(DAIS and HyMap simulation). Specific absorption features around 496, 540, 588, 632 and 673 nm respectively due to DD+DT, Fuco, Chl a, Chl c and again Chl a were
still observable. Reflectance is presented in arbitrary unit (A.U) to avoid overlaying of spectra.
https://doi.org/10.1371/journal.pone.0197093.g008
Microphytobenthos and hyperspectral refelctance
PLOS ONE | https://doi.org/10.1371/journal.pone.0197093 May 14, 2018 16 / 21

in species might have been different, leading to index variation not related to DES change but
rather to a change in Chl c content due to species-dependent feature. This latter observation
reinforces the use of the MPBLUE index to predict ETR, because it is both species- and Chl c-independent.
The radiometric index based on the 522 nm absorption band was expected to be more
robust because it has been shown to be a fingerprint for DT molecules effective in NPQ
[31,38]. However, among the species used here, only B. lucens showed a strong relationship
between PAM and radiometric indices using 522 nm band. The weakness of 522 nm-based
indices in N. phyllepta data was likely due to the low DES and DT content, and the subsequent
low NPQ [19]. Hence for some species, DT content might be too low to be detected by radiom-
etry, a less sensitive method than the spectrophotometric approaches used before [31,38].
Remote sensing applications
Remote sensing has been used to map MPB biomass, using multi- and hyperspectral imagers
[9,11–14,52]. It was also used to estimate optical absorption cross section (a�) retrieved from
optical properties of the MPB biofilm [27,29]. More recently, [15] suggested the use of remote
sensing to estimate primary production from Space, but using passive chlorophyll measure-
ments (solar-induced Chl fluorescence). However, issues related to spatial, spectral, and tem-
poral dynamics of passive vegetation fluorescence are still unresolved and hinder this method
[53]. The current study can be seen as an alternative for mapping MPB primary production
using VIS-NIR remote sensing.
Current results suggest that MPBLUE can be applied to existing hyperspectral sensors and
any future sensors with higher than 10 nm resolutions. Nevertheless, some possible limitations
and recommendations are discussed bellow: mixed assemblage effect, spectral resolution and
spatial heterogeneity.
Mixed assemblage effect. An expected difficulty, but overcome in this study, is the species
composition of natural MPB assemblages: sandy sediments are considered to be colonized by
epipsammic assemblages, whereas muddy sediment by epipelic ones [49,50,54]. However,
each assemblage can host other growth forms: e.g. epipelic growth forms in epipsammic
assemblage or tychoplanktonic growth forms in epipelic assemblages [55]. This could lead to a
mix of photophysiological response of each growth form [19] difficult to assess at the assem-
blage and ecosystem level. One possible difficulty to apply our methodology to field situation
is the self-shading by cells within the biofilm and/or the migration of epipelic species vertical
within a light gradient. The present work shows that this limitation can be partially overcome
by using the MPBLUE index as it is only affected by the xanthophyll pigments (DD and DT)
and not by diversity, i.e. the MPBLUE index appears to have a wide-ranging applicability
regardless of the growth form type, as the NDVI for vegetation biomass. However, the next
step is to test this index in situ taking into account not only the diversity, but also cell behavior
within a biofilm.
Spectral resolution requirements. MPBLUE was shown to work at several spectral resolu-
tions of 15 nm and less suggesting that the signal is strong enough for detecting xanthophyll
pigments absorbance variations between 496 and 508 nm. The spectral band location for
MPBLUE calculations is essential: they have to be as close as possible to 496 and 508 nm. Reso-
lution higher than 9 nm resulted in significant linear regressions between ETR form PAM-
fluorometry and from radiometry but with a clear ETR underestimation, due to the smoothing
of signal, as for a� estimation. To compensate low spectral resolution, spectral bands must be
located on the accurate wavelengths, with a bandwidth inferior or equal to 15 nm to avoid
spectral band overlays.
Microphytobenthos and hyperspectral refelctance
PLOS ONE | https://doi.org/10.1371/journal.pone.0197093 May 14, 2018 17 / 21

Spatial heterogeneity. It is well known that MPB biofilms exhibit spatially patchy biomass
distributions at both micro- and macro-scales [56] leading to non-linear reflectance mixing at
the pixel scale [8,11]. This constraints remote sensing applications, because using linear model
as indices (e.g. NDVI, MPBI, Idiatom [12]) could lead to misestimating biomass, LUE, and ETR
when distribution of biofilm is too patchy. The best way to limit this misestimation is to work
at very high spatial resolution (1 m2 or less) and at a very high spectral resolution, i.e. at least
10 nm with bands centered on the accurate wavelengths (see above). However, sensors with
high spectral and spatial resolutions are currently only airborne, (e.g. HySpex, CASI or
AVIRIS) and currently no satellite solution exists. Nevertheless some hyperspectral projects
are planned for a near future that will approximate the needed requirements, such as the
CNES (French Spatial Agency) project HypXim with a spatial resolution of less than 10 m and
spectral resolution of 10 nm.
Concluding remarks
Hyperspectral remote sensing is a highly promising technology to estimate MPB electron
transport rates and subsequently estimate primary production at the ecosystem level. Here we
showed how a new robust index, the MPBLUE based on reflectance data in the DD and DT
absorption domain, could be used to estimate ETR from hyperspectral imagery. We demon-
strated that the species diversity analyzed in this study did not affect MPBLUE index, and that it
can most probably be applied to epipelic, epipsammic and tychoplankton species in mixture,
i.e. in mixed sediments. We concluded that spectral resolution at 10 nm with bands centered
around 496 and 508 nm and spatial resolution of m2 (1 m2 or less) is the minimal requirement
needed to reach our goal: map MPB primary production. Meanwhile, further work is needed
to validate the MPBLUE index in field conditions (i.e. on natural MPB assemblages) including
vertical migration of epipelic species as a response to incident light, but also to day/night and
tidal cycles. The final step will be to thoroughly determine the relationship between reflectance,
ETR and carbon fixation in order to build maps of carbon fluxes (mg CO2.h-1.m-2) at the scale
of entire mudflats.
Acknowledgments
The authors acknowledge the Centre National de la Recherche Scientifique-CNRS (sabbatical
and EC2CO grant to VM), the Region Poitou-Charentes (Ph.D. grant to AB), the French con-
sortium CPER-Littoral (to JL), the Region Pays de la Loire (Atlantic Micro-algae program to
VM) and the Fondation de France (grant ‘Quels littoraux pour demain ?’ to JL and VM), for
their financial support; the Planetology and Geodynamic laboratory (UMR 6112, University of
Nantes-CNRS) for supplying the ASD FieldSpec3spectrometer.
Author Contributions
Conceptualization: Vona Meleder, Johann Lavaud.
Data curation: Vona Meleder, Bruno Jesus, Alexandre Barnett, Johann Lavaud.
Formal analysis: Vona Meleder, Bruno Jesus, Alexandre Barnett, Johann Lavaud.
Funding acquisition: Vona Meleder, Johann Lavaud.
Investigation: Vona Meleder, Bruno Jesus, Johann Lavaud.
Methodology: Vona Meleder, Johann Lavaud.
Project administration: Vona Meleder, Johann Lavaud.
Microphytobenthos and hyperspectral refelctance
PLOS ONE | https://doi.org/10.1371/journal.pone.0197093 May 14, 2018 18 / 21

Resources: Vona Meleder, Johann Lavaud.
Software: Vona Meleder, Bruno Jesus.
Supervision: Vona Meleder.
Validation: Vona Meleder, Bruno Jesus, Laurent Barille.
Visualization: Vona Meleder, Bruno Jesus, Johann Lavaud.
Writing – original draft: Vona Meleder, Johann Lavaud.
Writing – review & editing: Vona Meleder, Bruno Jesus, Laurent Barille, Johann Lavaud.
References1. Consalvey M, Jesus B, Perkins RG, Brotas V, Underwood GJC, Paterson DM. Monitoring migration
and measuring biomass in benthic biofilms: the effects of dark/far-red adaptation and vertical migration
on fluorescence measurements. Photosynth Res. 2004; 81(1):91–101. https://doi.org/10.1023/B:
PRES.0000028397.86495.b5 PMID: 16328850
2. MacIntyre H, Geider R, Miller D. Microphytobenthos: the ecological role of the “secret garden” of unve-
getated, shallow water marine habitats. I. Distribution, abundance and primary production. Estuaries.
1996; 19(2A):186–201.
3. Pinckney J, Zingmark RG. Biomass and Production of Benthic Microalgal Communities in Estuarine
Habitats. Estuaries. 1993; 16(4):887–97.
4. Underwood GJC, Kromkamp J. Primary production by phytoplancton and microphytobenthos in estuar-
ies. Adv Ecol Res. 1999; 29:93–153.
5. Miller DC, Geider RJ, MacIntyre HL. Microphytobenthos: the ecological role of the “secret garden” of
unvegetated, shallow-water marine habitats. II. Role in sediment stability and shallow-water food webs.
Estuaries. 1996; 19(2):202–12.
6. Kromkamp J, Forster RM. Development in microphytobenthos primary productivity studies. In: Krom-
kamp J, de Brouwer JFC, Blanchard GF, Forster RM, Creach V, editors. Functioning of microphyto-
benthos in estuaries. Edita; 2006. p. 9–30.
7. Guarini JM, Blanchard G, Richard P. Modelling the dynamics of the microphytobenthic biomass and
primary production in European intertidal mudflats. In: Kromkamp J, de Brouwer JFC, Blanchard GF,
Forster RM, Creach V, editors. Functioning of microphytobenthos in estuaries. Edita; 2006. p. 187–
226.
8. Meleder V, Launeau P, Barille L, Combe JP, Carrere V, Jesus B, et al. Hyperspectral imaging for map-
ping microphytobenthos in coastal areas. In: Maanan M, Robin M, editors. Geomatic solutions for
coastal environments. Nova Science Publishers, Inc.; 2010. p. 71–139.
9. Benyoucef I, Blandin E, Lerouxel A, Jesus B, Rosa P, Meleder V, et al. Microphytobenthos interannual
variations in a north-European estuary (Loire estuary, France) detected by visible-infrared multispectral
remote sensing. Estuar Coast Shelf Sci. 2014; 136:43–52.
10. Brito AC, Benyoucef I, Jesus B, Brotas V, Gernez P, Mendes CR, et al. Seasonality of microphyto-
benthos revealed by remote-sensing in a South European estuary. Cont Shelf Res. 2013; 66:83–91.
11. Combe JP, Launeau P, Carrere V, Despan D, Meleder V, Barille L, et al. Mapping microphytobenthos
biomass by non-linear inversion of visible-infrared hyperspectral images 10.1016/j.rse.2005.07.010.
Remote Sens Environ. 2005; 98(4):371–87.
12. Kazemipour F, Launeau P, Meleder V. Microphytobenthos biomass mapping using the optical model of
diatom biofilms: Application to hyperspectral images of Bourgneuf Bay. Remote Sens Environ. 2012;
127:1–13.
13. Ryu J-H, Choi J-K, Lee Y-K. Potential of remote sensing in management of tidal flats: A case study of
thematic mapping in the Korean tidal flats. Ocean Coast Manag. 2014; 102:458–70.
14. van der Wal D, Wielemaker-van den Dool A, Herman PM. Spatial synchrony in intertidal benthic algal
biomass in temperate coastal and estuarine ecosystems. Ecosystems. 2010; 13(2):338–51.
15. Huete A, Ponce-Campos G, Zhang Y, Restrepo-Coupe N, Ma X, Moran MS. Monitoring Photosynthesis
From Space. In: Thenkabail PS, editor. Land Resources Monitoring, Modeling, and Mapping with
Remote Sensing. CRC Press; 2015. p. 3–22. (Remote Sensing Hand Book; vol. II).
16. Consalvey M, Perkins RG, Paterson DM. PAM fluorescence: a beginners guide for benthic diatomists.
Diatom Res. 2005; 20:1–22.
Microphytobenthos and hyperspectral refelctance
PLOS ONE | https://doi.org/10.1371/journal.pone.0197093 May 14, 2018 19 / 21

17. Jesus B, Mouget J-L, Perkins RG. Detection of diatom xanthophyll cycle using spectral reflectance. J
Phycol. 2008; 44:1349–59. https://doi.org/10.1111/j.1529-8817.2008.00583.x PMID: 27041732
18. Perkins R, Kromkamp JC, Serodio J, Lavaud J, Jesus B, Mouget JL, et al. The application of variable
chlorophyll fluorescence to microphytobenthic biofilms. In: Prasil O, Sugget D, editors. Use of Chloro-
phyll Fluorescence in Aquatic Sciences. 2011. (Developments in Aplied Phycology; vol. 4).
19. Barnett A, Meleder V, Blommaert L, Lepetit B, Gaudin P, Vyverman W, et al. Growth form defines physi-
ological photoprotective capacity in intertidal benthic diatoms. Isme J. 2015 Jan; 9(1):32–45. https://doi.
org/10.1038/ismej.2014.105 PMID: 25003964
20. Blommaert L, Huysman MJ, Vyverman W, Lavaud J, Sabbe K. Contrasting NPQ dynamics and xantho-
phyll cycling in a motile and a non-motile intertidal benthic diatom. Limnol Oceanogr. 2017;
21. Cartaxana P, Ruivo M, Hubas C, Davidson I, Serodio J, Jesus B. Physiological versus behavioral photo-
protection in intertidal epipelic and epipsammic benthic diatom communities. J Exp Mar Biol Ecol. 2011;
405(1):120–7.
22. Jesus B, Brotas V, Ribeiro L, Mendes CR, Cartaxana P, Paterson DM. Adaptations of microphyto-
benthos assemblages to sediment type and tidal position. Cont Shelf Res. 2009; 29(13):1624–34.
23. Juneau P, Barnett A, Meleder V, Dupuy C, Lavaud J. Combined effect of high light and high salinity on
the regulation of photosynthesis in three diatom species belonging to the main growth forms of intertidal
flat inhabiting microphytobenthos. J Exp Mar Biol Ecol. 2015; 463:95–104.
24. Guillard RRL. Culture of phytoplankton for feeding marine invertebrates. In: Smith WL, Chanly MH, edi-
tors. Culture of marine invertebrate animals. New York: Plenum Press; 1982. p. 108–32.
25. Lavaud J, Rousseau B, Etienne AL. General features of photoprotection by energy dissipation in plank-
tonic diatoms (Bacillariophyceae). J Phycol. 2004 Feb; 40(1):130–7.
26. Perkins RG, Mouget JL, Lefebvre S, Lavaud J. Light response curve methodology and possible implica-
tions in the application of chlorophyll fluorescence to benthic diatoms 10.1007/s00227-005-0222-z. Mar
Biol. 2006; 149(4):703–12.
27. Kazemipour F, Meleder V, Launeau P. Optical properties of microphytobenthic biofilms (MPBOM): Bio-
mass retrieval implication. J Quant Spectrosc Radiat Transf. 2011; 112(1):131–42.
28. Meleder V, Barille L, Launeau P, Carrere V, Rince Y. Spectrometric constraint in analysis of benthic dia-
tom biomass using monospecific cultures 10.1016/j.rse.2003.08.009. Remote Sens Environ. 2003; 88
(4):386–400.
29. Meleder V, Laviale M, Jesus B, Mouget J-L, Lavaud J, Kazemipour F, et al. In vivo estimation of pigment
composition and optical absorption cross-section by spectroradiometry in four aquatic photosynthetic
micro-organisms. J Photochem Photobiol B-Biol. 2013 Dec 5; 129:115–24.
30. Olaizola M, Yamamoto H. Short-term response of the diadinoxanthin cycle and fluorescence yield to
high irradance in diatoms (Bacillariophyceue). J Phycol. 1994; 30(4):606–12.
31. Ruban AV, Lavaud J, Rousseau B, Guglielmi G, Horton P, Etienne AL. The super-excess energy dissi-
pation in diatom algae: comparative analysis with higher plants. Photosynth Res. 2004; 82(2):165–75.
https://doi.org/10.1007/s11120-004-1456-1 PMID: 16151872
32. Wilhelm C. The biochemistry and physiology of light-harvesting process in chlorophyll b and chlorophyll
c-containing algae. Plant Physiol Biochem. 1990; 28:293–306.
33. Falkowski PG, Raven JA. Aquatic Photosynthesis— Second Edition. Princeton: Princeton University
Press; 2007. 484 p.
34. Parson WW, Nagarajan V. Optical Spectroscopy in Photosynthetic Antennas. In: Green BR, Parson
WW, editors. Light-Harvesting Antennas in Photosynthesis. Dordrecht: Kluwer Academic Publishers;
2003. p. 83–127. (Advances in Photosynthesis and Respiration).
35. Roy S, Llewellyn C, Egeland ES, Johnsen G. Phytoplankton Pigments—Characterization, Chemotax-
onomy and Applications in Oceanography. SCOR, editor. Cambridge: Cambridge University Press;
2011. 845 p.
36. Lepetit B, Sturm S, Rogato A, Gruber A, Sachse M, Falciatore A, et al. High light acclimation in the sec-
ondary plastids containing diatom Phaeodactylum tricornutum is triggered by the redox state of the plas-
toquinone pool. Plant Physiol. 2013; 161(2):853–65. https://doi.org/10.1104/pp.112.207811 PMID:
23209128
37. Serodio J, Lavaud J. A model for describing the light response of the nonphotochemical quenching of
chlorophyll fluorescence. Photosynth Res. 2011; 108:61–76. https://doi.org/10.1007/s11120-011-9654-
0 PMID: 21516348
38. Lavaud J, Lepetit B. An explanation for the inter-species variability of the photoprotective non-photo-
chemical chlorophyll fluorescence quenching in diatoms. Biochim Biophys Acta BBA—Bioenerg. 2013;
1827(3):294–302.
Microphytobenthos and hyperspectral refelctance
PLOS ONE | https://doi.org/10.1371/journal.pone.0197093 May 14, 2018 20 / 21
39. Serodio J. A chlorophyll fluorescence index to estimate short-term rates of photosynthesis by intertidal
microphytobenthos. J Phycol. 2003; 39(1):33–46.
40. Migne A, Davoult D, Spilmont N, Menu D, Boucher G, Gattuso JP, et al. A closed-chamber CO2-flux
method for estimating intertidal primary production and respiration under emersed conditions. Mar Biol.
2002; 140(4):865–9.
41. Blanchard G, Guarini J-M, Gros P, Richard P. Seasonal effect on the relationship between the photo-
synthetic capacity of intertidal microphytobenthos and temperature. J Phycol. 1997; 3:723–8.
42. Jesus B, Rosa P, Mouget J-L, Meleder V, Launeau P, Barille L. Spectral-radiometric analysis of taxo-
nomically mixed microphytobenthic biofilms. Remote Sens Environ. 2014; 140:196–205.
43. Goss R, Jakob T. Regulation and function of xanthophyll cycle-dependent photoprotection in algae.
Photosynth Res. 2010 Nov; 106(1–2):103–22. https://doi.org/10.1007/s11120-010-9536-x PMID:
20224940
44. Lavaud J, Goss R. The peculiar features of non-photochemical fluorescence quenching in diatoms and
brown algae. In: Non-Photochemical Quenching and Energy Dissipation in Plants, Algae and Cyano-
bacteria. Springer; 2014. p. 421–43.
45. Lohr M, Wilhelm C. Pigment synthesis and xanthophyll cycle in diatoms under high light stress and dur-
ing low light recovery. In: Garab G, editor. Photosynthesis: Mechanisms and effets. Dordrecht, The
Netherlands: Kluwer Academic Publishers; 1998. p. 2313–6.
46. Migne A, Gevaert F, Creach A, Spilmont N, Chevalier E, Davoult D. Photosynthetic activity of intertidal
microphytobenthic communities during emersion: in situ measurements of chlorophyll fluorescence
(PAM) and CO2 flux (IRGA) 1. J Phycol. 2007; 43(5):864–73.
47. Davoult D, Migne A, Creach A, Gevaert F, Hubas C, Spilmont N, et al. Spatio-temporal variability of
intertidal benthic primary production and respiration in the western part of the Mont Saint-Michel Bay
(Western English Channel, France). Hydrobiologia. 2009; 620(1):163–72.
48. Laviale M, Barnett A, Ezequiel J, Lepetit B, Frankenbach S, Meleder V, et al. Response of intertidal ben-
thic microalgal biofilms to a coupled light–temperature stress: evidence for latitudinal adaptation along
the Atlantic coast of Southern Europe. Environ Microbiol. 2015; 17(10):3662–77. https://doi.org/10.
1111/1462-2920.12728 PMID: 25471657
49. Meleder V, Rince Y, Barille L, Gaudin P, Rosa P. Spatiotemporal changes in microphytobenthos
assemblages in a macrotidal flat (Bourgneuf Bay,France). J Phycol. 2007; 43(6):1177–90.
50. Paterson DM, Hagerthey SE. Microphytobenhthos in contrasting coastal ecosytems: Biology and
Dynamics. In: Reise K, editor. Ecological Comparisons of Sedimentary Shores. Berlin Heidelberg:
Spring-Verlag; 2001. p. 105–25.
51. Ribeiro L, Brotas V, Rince Y, Jesus B. Structure and diversity of intertidal benthic diatom assemblages
in contrasting shores: a case study from the Tagus estuary1. J Phycol. 2013; 49(2):258–70. https://doi.
org/10.1111/jpy.12031 PMID: 27008515
52. Meleder V, Launeau P, Barille L, Rince Y. Microphytobenthos assemblage mapping by spatial visible-
infrared remote sensing in a shellfish ecosystem https://doi.org/10.1016/s1631-0691(03)00125-2. C R
Biol. 2003; 326(4):377–89. PMID: 12876890
53. Magney TS, Frankenberg C, Fisher JB, Sun Y, North GB, Davis TS, et al. Connecting active to passive
fluorescence with photosynthesis: a method for evaluating remote sensing measurements of Chl fluo-
rescence. New Phytol. 2017; 215(4):1594–608. https://doi.org/10.1111/nph.14662 PMID: 28664542
54. Hamels I, Sabbe K, Muyleart K, Barranguet C, Lucas C, Herman P, et al. Organisation of microbenthic
communities in intertidal estuarine flats, a case study from the Molenplaat (Westerschelde estuary, The
Netherlands). Eur J Protistol. 1998; 34:308–20.
55. Ribeiro L, Brotas V, Mascarell G, Coute A. Taxonomic survey of the microphytobenthic communities of
two Tagus estuary mudflats. Acta Oecologica. 2003; 24(Supplement 1):S117–23.
56. Saburova MA, Polikarpov IG, Burkovsky IV. Spatial structure of an intertidal sandflat microphytobenthic
community as related to different spatial scales. Mar Ecol Prog Ser. 1995; 129:229–39.
Microphytobenthos and hyperspectral refelctance
PLOS ONE | https://doi.org/10.1371/journal.pone.0197093 May 14, 2018 21 / 21


