
Micron Technology, Inc.
58
©2015 Micron Technology, Inc. All rights reserved. Information, products, and/or specifications are subject to change without notice. All information is provided on an “AS IS” basis without warranties of any kind. Statements regarding products, including regarding their features, availability, functionality, or compatibility, are provided for informational purposes only and do not modify the warranty, if any, applicable to any product. Drawings may not be to scale. Micron, the Micron logo, and all other Micron trademarks are the property of Micron Technology, Inc. All other trademarks are the property of their respective owners. Micron Technology, Inc. 2015 Summer Analyst Day
Transcript of Micron Technology, Inc.

©2015 Micron Technology, Inc. 1
©2015 Micron Technology, Inc. All rights reserved. Information, products, and/or specifications are subject to change without notice. All information is provided on an “AS IS” basis without warranties of any kind.
Statements regarding products, including regarding their features, availability, functionality, or compatibility, are provided for informational purposes only and do not modify the warranty, if any, applicable to any
product. Drawings may not be to scale. Micron, the Micron logo, and all other Micron trademarks are the property of Micron Technology, Inc. All other trademarks are the property of their respective owners.
Micron Technology, Inc.
2015 Summer Analyst Day

©2015 Micron Technology, Inc. 2
Safe Harbor
During the course of this meeting, we may make projections or other forward-looking statements
regarding future events or the future financial performance of the Company and the industry. We wish
to caution you that such statements are predictions and that actual events or results may differ
materially. We refer you to the documents we file on a consolidated basis from time to time with
Securities and Exchange Commission, specifically our most recent Form 10-K and Form 10-Q. These
documents contain and identify important factors that could cause our actual results on a
consolidated basis to differ materially from those contained in our projections or forward-looking
statements. These certain factors can be found at http://investors.micron.com/riskFactors.cfm.
Although we believe that the expectations reflected in the forward-looking statements are reasonable,
we cannot guarantee future results, levels of activity, performance or achievements. We are under no
duty to update any of the forward-looking statements after the date of the presentation to conform
these statements to actual results.

©2015 Micron Technology, Inc. 3
Mark Durcan – Chief Executive Officer

©2015 Micron Technology, Inc. 4
Agenda
Industry Environment
Market Positioning and Operational Focus
Technology Roadmap
Finance Strategy and Updates
Strategic Focus – Key Investments
1
2
3
4
5

©2015 Micron Technology, Inc. 5
-60%
-30%
0%
30%
60%
90%
120%
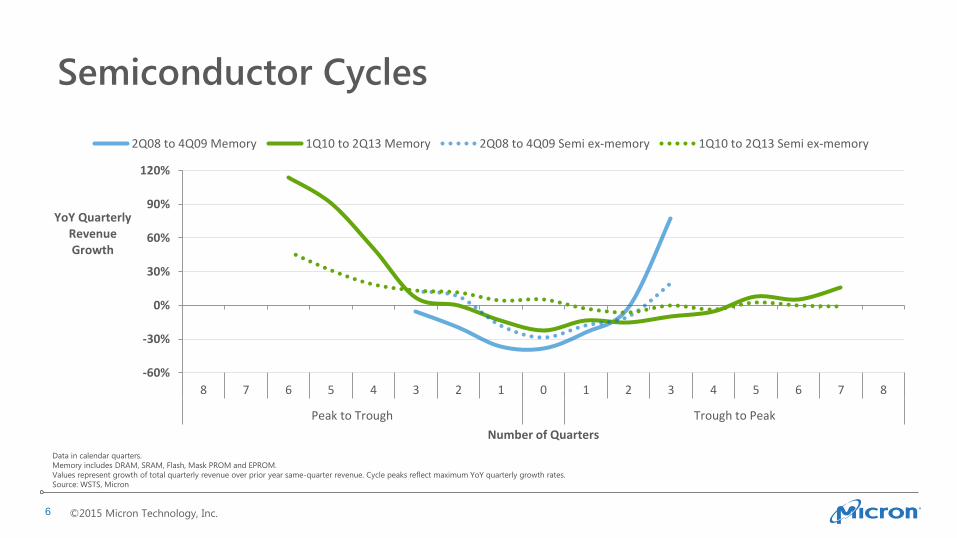
8 7 6 5 4 3 2 1 0 1 2 3 4 5 6 7 8
Peak to Trough Trough to Peak
YoY Quarterly Revenue Growth
Number of Quarters
2Q08 to 4Q09 Memory 2Q08 to 4Q09 Semi ex-memory
Data in calendar quarters.
Memory includes DRAM, SRAM, Flash, Mask PROM and EPROM.
Values represent growth of total quarterly revenue over prior year same-quarter revenue. Cycle peaks reflect maximum YoY quarterly growth rates.
Source: WSTS, Micron
Semiconductor Cycles
©2015 Micron Technology, Inc. 6
-60%
-30%
0%
30%
60%
90%
120%
8 7 6 5 4 3 2 1 0 1 2 3 4 5 6 7 8
Peak to Trough Trough to Peak
YoY Quarterly Revenue Growth
Number of Quarters
2Q08 to 4Q09 Memory 1Q10 to 2Q13 Memory 2Q08 to 4Q09 Semi ex-memory 1Q10 to 2Q13 Semi ex-memory
Semiconductor Cycles
Data in calendar quarters.
Memory includes DRAM, SRAM, Flash, Mask PROM and EPROM.
Values represent growth of total quarterly revenue over prior year same-quarter revenue. Cycle peaks reflect maximum YoY quarterly growth rates.
Source: WSTS, Micron

©2015 Micron Technology, Inc. 7
-60%
-30%
0%
30%
60%
90%
120%
3Q-13 4Q-13 1Q-14 2Q-14 3Q-14 4Q-14 1Q-15 2Q-15
YoY Quarterly Revenue Growth
2Q08 to 4Q09 Memory 1Q10 to 2Q13 Memory 3Q13 to Today Memory
2Q08 to 4Q09 Semi ex-memory 1Q10 to 2Q13 Semi ex-memory 3Q13 to Today Semi ex-memory
Semiconductor Cycles
Data in calendar quarters.
Memory includes DRAM, SRAM, Flash, Mask PROM and EPROM.
Values represent growth of total quarterly revenue over prior year same-quarter revenue. Cycle peaks reflect maximum YoY quarterly growth rates.
Source: WSTS, Micron

©2015 Micron Technology, Inc. 8
Long-Term Memory Market Conditions
Suppliers with
sufficient scale
Return-focused
investment and
supply environment
Limited new wafer
capacity
Slowing technology
migrations
Consolidated Suppliers Low Supply Growth
Differentiated
products
System solutions
Diversified customers
Broadening
applications
Diversifying Demand
©2015 Micron Technology, Inc. 9
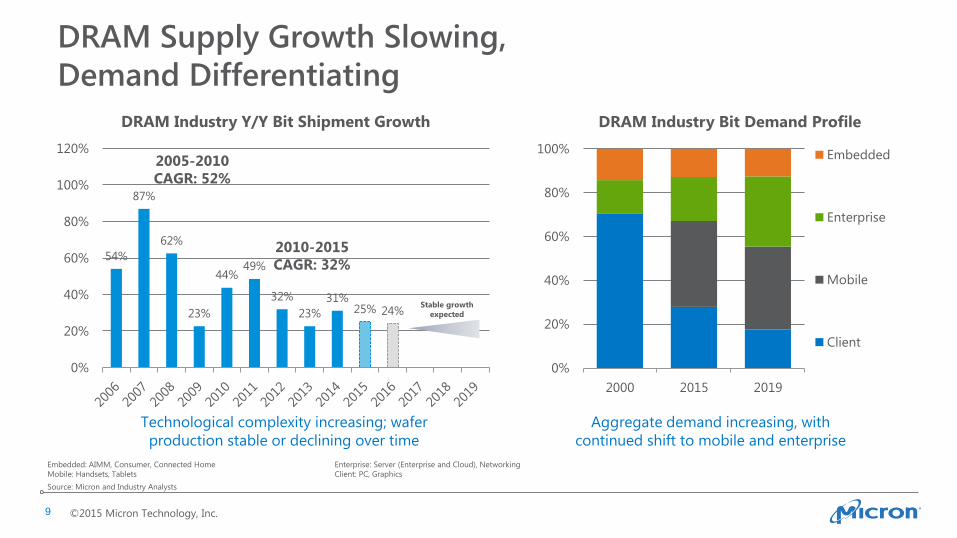
DRAM Supply Growth Slowing,
Demand Differentiating
Aggregate demand increasing, with
continued shift to mobile and enterprise
Technological complexity increasing; wafer
production stable or declining over time
0%
20%
40%
60%
80%
100%
2000 2015 2019
DRAM Industry Bit Demand Profile
Embedded
Enterprise
Mobile
Client
54%
87%
62%
23%
44% 49%
32%
23%
31% 25% 24%
0%
20%
40%
60%
80%
100%
120%
DRAM Industry Y/Y Bit Shipment Growth
2010-2015
CAGR: 32%
2005-2010
CAGR: 52%
Stable growth
expected
Embedded: AIMM, Consumer, Connected Home Enterprise: Server (Enterprise and Cloud), Networking
Mobile: Handsets, Tablets Client: PC, Graphics
Source: Micron and Industry Analysts

©2015 Micron Technology, Inc. 10
209%
174%
127%
45%
73% 77% 62%
41% 41% 37% 34%
0%
50%
100%
150%
200%
250%
NAND Industry Y/Y Bit Shipment Growth
NAND Supply Growth Slowing,
Growing Demand in SSD and Mobile
0%
20%
40%
60%
80%
100%
2005 2015 2019
NAND Industry Bit Demand Profile
SSD
Mobile
Consumer
Removable &
Other
2010-2015
CAGR: 51%
2005-2010
CAGR: 117%
New capacity
ROIC
dependent
Aggregate demand increasing, with
significant growth in SSDs and mobile
3D conversion does not result in increased industry
supply growth absent wafer capacity additions
SSD: Client, Data Center, Enterprise SSDs Mobile: Embedded NAND in Handsets and Tablets
Consumer: MP3, DSC/DVC, Other Consumer Removable & Other: Flash Cards, USB Drives, Other
Source: Micron and Industry Analysts
©2015 Micron Technology, Inc. 11
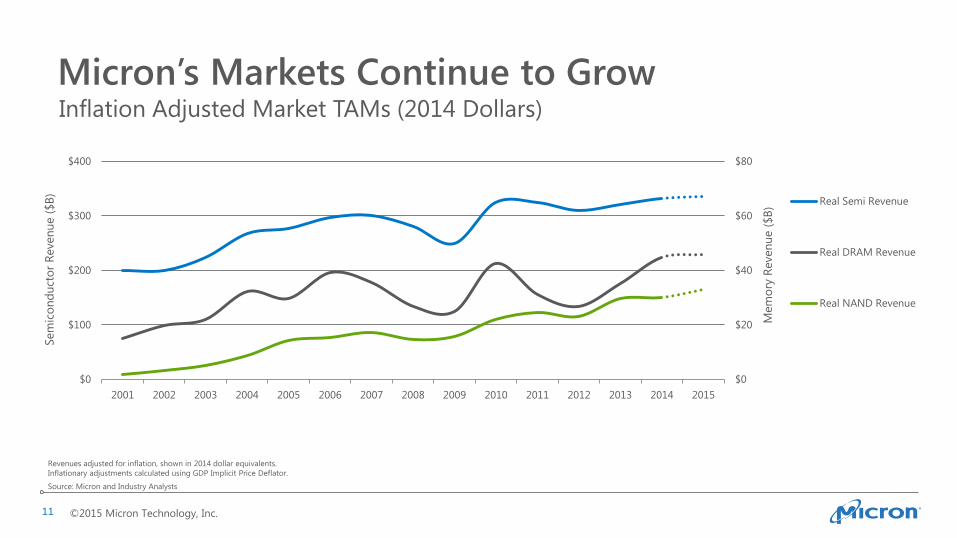
Micron’s Markets Continue to Grow
$0
$20
$40
$60
$80
$0
$100
$200
$300
$400
2001 2002 2003 2004 2005 2006 2007 2008 2009 2010 2011 2012 2013 2014 2015
Mem
ory
Reven
ue (
$B
)
Sem
ico
nd
uct
or
Reven
ue (
$B
)
Real Semi Revenue
Real DRAM Revenue
Real NAND Revenue
Inflation Adjusted Market TAMs (2014 Dollars)
Source: Micron and Industry Analysts
Revenues adjusted for inflation, shown in 2014 dollar equivalents.
Inflationary adjustments calculated using GDP Implicit Price Deflator.
©2015 Micron Technology, Inc. 12
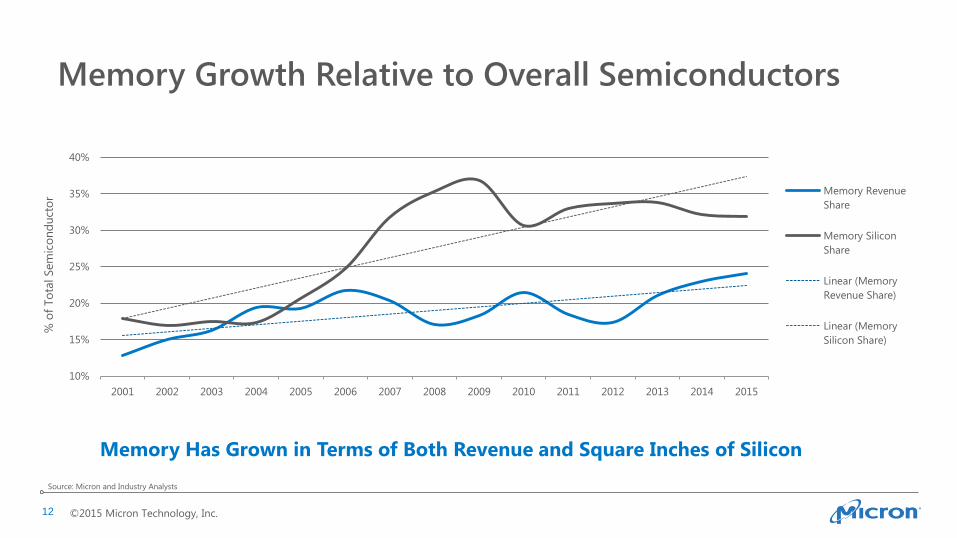
Memory Growth Relative to Overall Semiconductors
10%
15%
20%
25%
30%
35%
40%
2001 2002 2003 2004 2005 2006 2007 2008 2009 2010 2011 2012 2013 2014 2015
Memory Revenue
Share
Memory Silicon
Share
Linear (Memory
Revenue Share)
Linear (Memory
Silicon Share)
Memory Has Grown in Terms of Both Revenue and Square Inches of Silicon
Source: Micron and Industry Analysts
% o
f To
tal Sem
ico
nd
uct
or
©2015 Micron Technology, Inc. 13
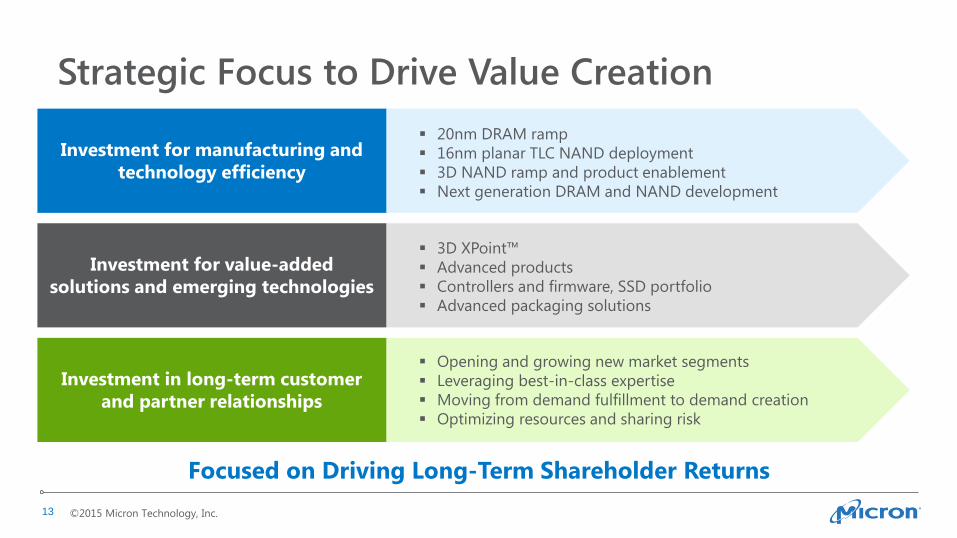
Strategic Focus to Drive Value Creation
Investment for manufacturing and
technology efficiency
Investment for value-added
solutions and emerging technologies
Investment in long-term customer
and partner relationships
Focused on Driving Long-Term Shareholder Returns
20nm DRAM ramp
16nm planar TLC NAND deployment
3D NAND ramp and product enablement
Next generation DRAM and NAND development
3D XPoint™
Advanced products
Controllers and firmware, SSD portfolio
Advanced packaging solutions
Opening and growing new market segments
Leveraging best-in-class expertise
Moving from demand fulfillment to demand creation
Optimizing resources and sharing risk

©2015 Micron Technology, Inc. 14
Mark Adams – President

©2015 Micron Technology, Inc. 15
Current Memory Market Conditions
PC demand and market conditions have been challenging
Mobile, cloud, and specialty DRAM segments have performed better
Mobile (eMCP) and SSD driving demand growth in NAND
Micron Continues to Leverage Demand Across Diversified End Markets
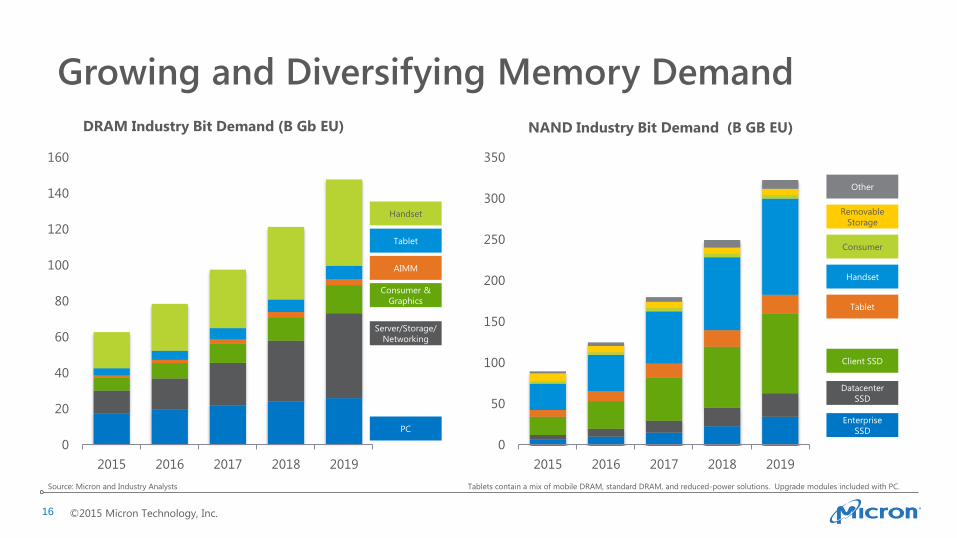
©2015 Micron Technology, Inc. 16
0
20
40
60
80
100
120
140
160
2015 2016 2017 2018 2019
DRAM Industry Bit Demand (B Gb EU)
Growing and Diversifying Memory Demand
Tablet
PC
Handset
AIMM
Consumer &
Graphics
Server/Storage/
Networking
Tablets contain a mix of mobile DRAM, standard DRAM, and reduced-power solutions. Upgrade modules included with PC. Source: Micron and Industry Analysts
0
50
100
150
200
250
300
350
2015 2016 2017 2018 2019
NAND Industry Bit Demand (B GB EU)
Tablet
Enterprise
SSD
Other
Removable
Storage
Handset
Client SSD
Consumer
Datacenter
SSD

©2015 Micron Technology, Inc. 17
Micron’s Value Proposition in Mobile
Energy efficient mobile computer
Immersive multimedia experience
Battery life and pleasing form factors
Low Power DRAM LPDDR2-LPDDR4, from 4Gb to 32Gb
Configurations to match any solution
Enables eMCP innovation
Mobile Managed Memory eMMC, eMCP
Next generation heterogeneous solutions
Leading-edge packaging technology
Customer Requirements Micron Portfolio

©2015 Micron Technology, Inc. 18
Micron’s Value Proposition in Automotive
Automotive quality and reliability
Leading-edge technology
10+ year longevity
Adoption of Leading Edge Technology
LPDDR4 in next generation Infotainment
High density eMMC and SSD (8GB – 240GB)
Enabling Innovation
Increasing car OEM engagement
Customer validation labs
Full Auto-grade NVM and DRAM
Legacy and mainstream DRAM
Broad NOR product line
SLC, MLC, eMMC and SSD NAND
Customer Requirements Micron Portfolio
Infotainment
Advanced Driver
Assistance Systems (ADAS)
Instrument
Cluster
©2015 Micron Technology, Inc. 19
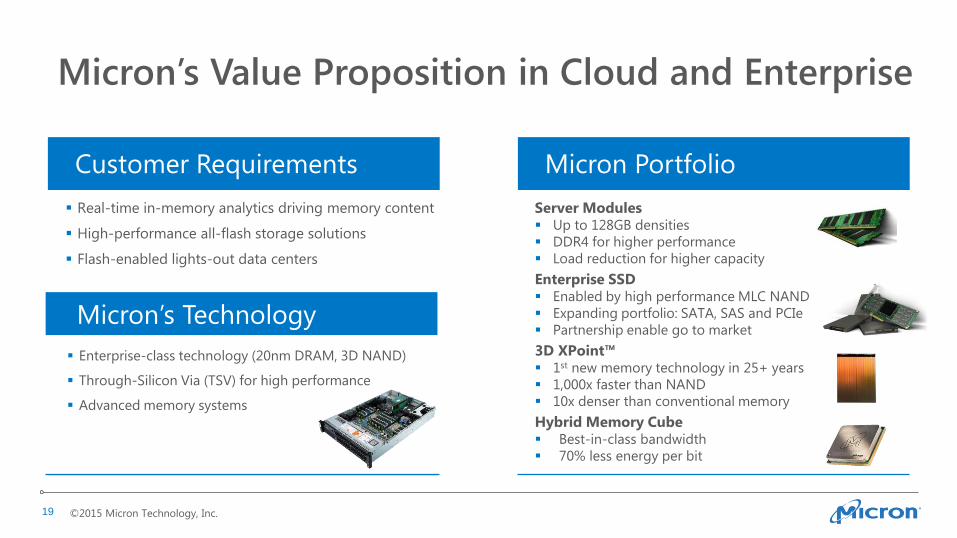
Micron’s Value Proposition in Cloud and Enterprise
Real-time in-memory analytics driving memory content
High-performance all-flash storage solutions
Flash-enabled lights-out data centers
Server Modules Up to 128GB densities
DDR4 for higher performance
Load reduction for higher capacity
Enterprise SSD Enabled by high performance MLC NAND
Expanding portfolio: SATA, SAS and PCIe
Partnership enable go to market
3D XPoint™ 1st new memory technology in 25+ years
1,000x faster than NAND
10x denser than conventional memory
Hybrid Memory Cube Best-in-class bandwidth
70% less energy per bit
Customer Requirements Micron Portfolio
Enterprise-class technology (20nm DRAM, 3D NAND)
Through-Silicon Via (TSV) for high performance
Advanced memory systems
Micron’s Technology

©2015 Micron Technology, Inc. 20
Micron’s Business is Evolving
Value
Added
Products
Legacy
Component
Business
Solutions
for
Emerging
Markets
Demand Fulfillment Relationship Demand Creation Relationship
OEMs
Hyperscale
Verticals/Influencers
– Financial
– Oil & Gas
– Automotive
– Media
– Telecom Service Providers
– Medical
– Government
Channel
Strategic Partners
ODM
OEMs

©2015 Micron Technology, Inc. 21
Our Focus on High Value Products and Segments
CQ3-13 CQ4-13 CQ1-14 CQ2-14 CQ3-14 CQ4-14 CQ1-15 CQ2-15
FQ4-13 FQ1-14 FQ2-14 FQ3-14 FQ4-14 FQ1-15 FQ2-15 FQ3-15
CQ3-13 CQ4-13 CQ1-14 CQ2-14 CQ3-14 CQ4-14 CQ1-15 CQ2-15
FQ4-13 FQ1-14 FQ2-14 FQ3-14 FQ4-14 FQ1-15 FQ2-15 FQ3-15
Premium Micron Fiscal ASP Industry ASP Average
Trade NAND and DRAM. Intel’s portion of IMFT is excluded. Micron fiscal data shifted to closest calendar quarter.
Source: Micron and Industry Analysts
DRAM Portfolio ASP/Gb Premium
NAND Portfolio ASP/GB Premium

©2015 Micron Technology, Inc. 22
Muted Growth in FY-15 / 1H-16 Stronger Growth Beyond
• 20nm transition-driven wafer loss • Mix shift from DDR3 to DDR4 and LP
• Volume ramp of 20nm (to >50% of bits)
• 3D NAND ramp preparations • Mix shift towards mobile/eMCP from
high density components
• 3D NAND ramp + TLC impact
Investments Will Drive Growth
DRAM
NAND Micron DRAM / NAND Normalized Bit Output
DRAM
NAND
FY 2015 FY 2016 FY 2017

©2015 Micron Technology, Inc. 23
Muted Growth in FY-15 / 1H-16 Stronger Growth Beyond
• 20nm transition-driven wafer loss • Mix shift from DDR3 to DDR4 and LP
• Volume ramp of 20nm (to >50% of bits)
• 3D NAND ramp preparations • Mix shift towards mobile/eMCP from
high density components
• 3D NAND ramp + TLC impact
Investments Will Drive Growth
DRAM
NAND Micron DRAM / NAND Normalized Bit Output
DRAM
NAND
3D XPoint™
FY 2015 FY 2016 FY 2017

©2015 Micron Technology, Inc. 24
Investments Will Drive Growth
1Two-year CAGR comparing total annual FY 2017 vs FY 2015.
Two Year CAGR (FY-17 vs. FY-15)1
Bit Shipments
DRAM ↑ 20-30%
NAND ↑ 30-40%
Exiting FY 2017 (FQ4-17 vs. FQ4-15)
Bits per Wafer
DRAM ↑ 65-75%
NAND ↑ 140-150%
©2015 Micron Technology, Inc. 25
Key Takeaways
Long-term market opportunities are favorable
Micron is pursuing high-value markets with a strong value proposition
We are making risk/reward trade-offs as we engage in new markets and new/ongoing customer and partner relationships
Over the next few years we expect to outpace market bit growth
– Fuels top-line growth
– Expect premium products to increase as a percentage of total revenue
We expect to drive relative operating profit expansion
©2015 Micron Technology, Inc. 26
Scott DeBoer – Vice President, R&D
©2015 Micron Technology, Inc. 27
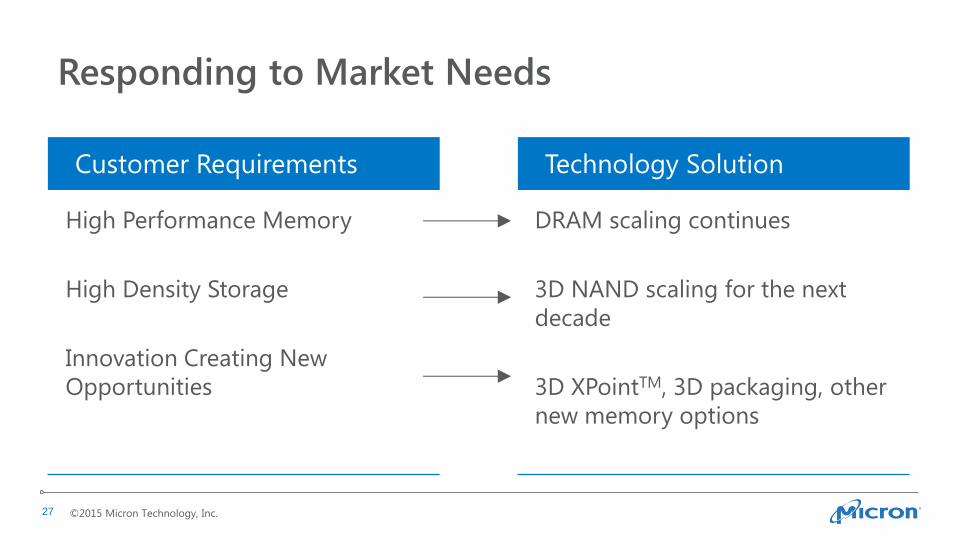
Responding to Market Needs
High Performance Memory
High Density Storage
Innovation Creating New
Opportunities
DRAM scaling continues
3D NAND scaling for the next
decade
3D XPointTM, 3D packaging, other
new memory options
Customer Requirements Technology Solution
©2015 Micron Technology, Inc. 28
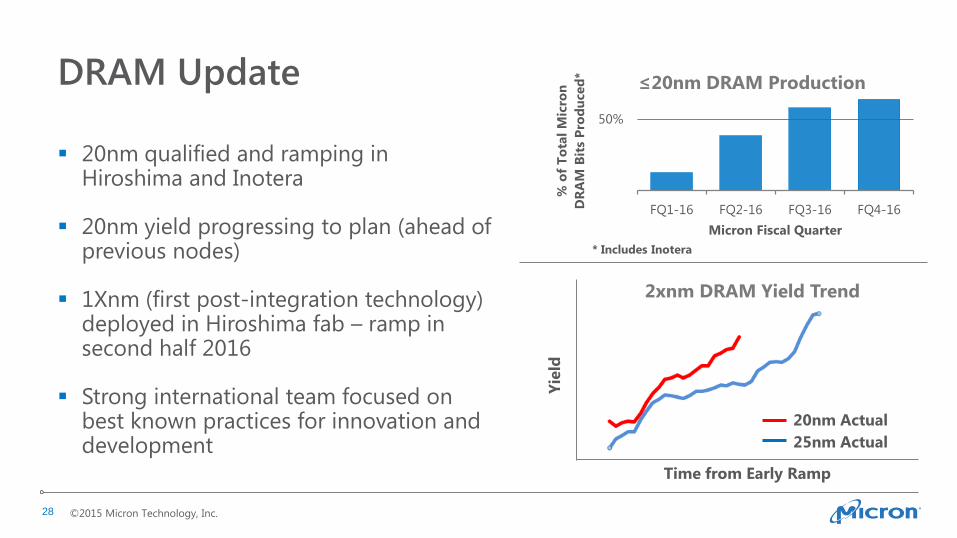
DRAM Update
20nm qualified and ramping in Hiroshima and Inotera
20nm yield progressing to plan (ahead of previous nodes)
1Xnm (first post-integration technology) deployed in Hiroshima fab – ramp in second half 2016
Strong international team focused on best known practices for innovation and development
0%
50%
FQ1-16 FQ2-16 FQ3-16 FQ4-16
% o
f T
ota
l M
icro
n
DR
AM
Bit
s P
rod
uced
*
Micron Fiscal Quarter
2xnm DRAM Yield Trend
≤20nm DRAM Production
Yie
ld
20nm Actual
Time from Early Ramp
25nm Actual
* Includes Inotera

©2015 Micron Technology, Inc. 29
3D NAND Update
Rapid yield progress on 3D NAND (ahead of plan)
Ramping TLC products for mobile and storage
Continuing innovative path to maintain Gb/mm2
leadership
Continue yield improvement and volume ramp
Enablement of 2nd generation 3D NAND in
Singapore manufacturing fab
First wafers out of Singapore expansion in
summer 2016
Status Next Major Milestones
Singapore
Fab
Expansion
Yie
ld
Time From Introduction
Planar Actual
Early 3D NAND Yield Trend
3D Actual

©2015 Micron Technology, Inc. 30
e-
Why Micron and Intel Chose
Floating Gate for 3D NAND
Floating Gate is a Proven Technology
Used in NVM since ’70s and technology of choice for industry NAND today
Physics and reliability surrounding floating gate are well understood
Not susceptible to charge spreading
Expect faster 3D NAND ramp in manufacturing
Cell enables industry’s highest Gb/mm2 and world’s first 384Gb die (TLC)
Floating Gate is a
Proven Technology
Floating Gate Flash Cell Charge Trap Flash Cell
Isolated charge
storage node for
good cell to cell
charge isolation
Continuous charge
storage node prone
to charge dispersion
between cells
e
e
e
e

©2015 Micron Technology, Inc. 31
Micron’s Portfolio of Innovative “Firsts” DRAM 6F2 architecture
Leading DRAM capacitor technology
Copper metallization
Package Hybrid memory cube using Through Silicon Via (TSV)
0.8mm four-layer LPDRAM package, thinnest LPDRAM
memory device in the industry
NAND Pitch multiplication patterning in manufacturing
Award-winning, industry-leading planar NAND
cell technology
Air-gap technology implementation
New Memory Productization of phase change memory technology
Demonstration of 16Gb resistive RAM
©2015 Micron Technology, Inc. 32
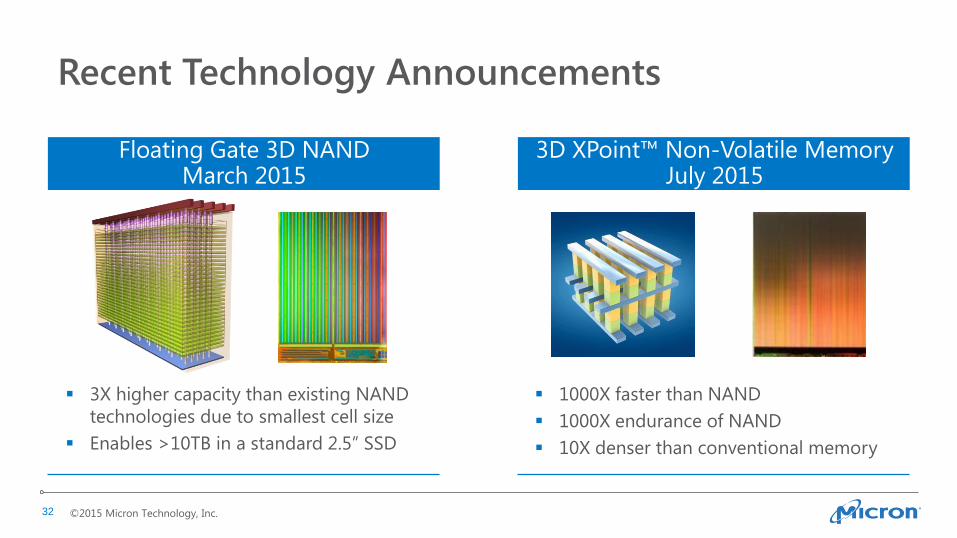
Recent Technology Announcements
3X higher capacity than existing NAND
technologies due to smallest cell size
Enables >10TB in a standard 2.5” SSD
1000X faster than NAND
1000X endurance of NAND
10X denser than conventional memory
Floating Gate 3D NAND March 2015
3D XPoint™ Non-Volatile Memory July 2015

©2015 Micron Technology, Inc. 33
Successful Development Path for 3D XPointTM Memory
Cross-point memory technology has been an
industry “aspiration” for decades
Unique enablers of 3D XPointTM:
– Novel new materials with electrical,
structural, and chemical compatibility
– Innovative integration concept
Proprietary and unique to the industry
Low latency, high endurance, non-volatile
Selector capable of demanding on/off currents
High endurance memory cell with large window
High performance logic beneath the array
Delivering 128Gb on a single die with a 2 deck
stacked 20nm cross point
It’s a great time to be a materials engineer!

©2015 Micron Technology, Inc. 34
3D XPoint™ Enables High Performance Solutions
MOBILE MEMORY ENTERPRISE STORAGE
CLASS MEMORY
CLIENT STORAGE
Saturates the PCIe interface for
reads and writes
High IOPS for low queue
workloads
Unlimited life for 5-year 100%
write workload
Enables extreme 4K video editing
Cost-sensitive performance with
TLC NAND in the general SSD
market
Eliminates interface bottleneck of
existing NVM storage solutions
Provides lower power standby (no
active refresh)
Optimized for low-latency, small
data transactions
Small data sizes with 16GB density Non-volatile, high endurance 1,000X faster than NAND

©2015 Micron Technology, Inc. 35
Future Memory Technologies
Exploring a broad range of materials
with RRAM capability
Investigation focused on unique
material system advantages
Unique memory based on electron spin
at the atomic level
Potential long-term DRAM replacement
Early application as a high-speed cache
Resistive Memory Spin Torque Memory
W, TiN etc,.
Cu, Ag etc,.
+V -V Top lead
Free layer
Barrier
Fixed layer
Antiferromagnet
Bottom lead
Cu/Ta
CoFeB MgO
CoFeB
PtMn
Cu/Ta
MTJ
MTJ

©2015 Micron Technology, Inc. 36
Current Key Technology Priorities
Continue to build positive momentum in the DRAM technology area
– Completion of 20nm DRAM ramp on plan
– Drive faster introduction cadence on DRAM technology with rapid 1Xnm and 1Ynm delivery
3D NAND and 3D XPointTM technology ramps in 2016
3D package technology enablement for multiple differentiated opportunities
DRAM
NAND
3D Package
New Memory
2016 2017
1Xnm 1Ynm
3D Gen 3
3D X-Pt 3D X-Pt Gen 2
HMC Gen 3
EM Gen 1
3D Gen 2
Position in time indicates volume enablement

©2015 Micron Technology, Inc. 37
Ernie Maddock – Chief Financial Officer

©2015 Micron Technology, Inc. 38
Capital Allocation Strategy
Return excess capital to
shareholders
Investment for manufacturing and technology
efficiency
Investment for value-added
solutions

©2015 Micron Technology, Inc. 39
Investing in Business Growth and Shareholder Returns
$5.2B cumulative investment in R&D
$11.6B cumulative investment in capital expenditures1
Innovating with new memory technologies and system-level solutions
Managing dilution through ~$3.8B of convertible note and share repurchases
Maintaining balance sheet flexibility for operational/strategic initiatives
1 Includes payments on equipment purchase contracts
$0
$5
$10
$15
$20
$25
Capital Return
R&D
Capex
$25,000
$20,000
$15,000
$10,000
$5,000
$0
Millions
1
FQ1-11 through FQ3-15

©2015 Micron Technology, Inc. 40
9%
Free Cash Flow (% of Sales)
33% 23%
FY2011 FY2015E*
Capital Expenditures (% of Sales)
28%
32%
FY2011 FY2015E*
Cash from Operations (% of Sales)
$8.8B
$16.2B
FY2011 FY2015E*
Revenue
Significant Increase in Scale and Financial Flexibility
16% CAGR,
~2X Growth 23% CAGR,
~2X Growth
~$1.8B
Increase
-4% 1 Based on Bloomberg analyst consensus 2 Based on mid-point of FY 2015 guidance
FY-11 FY-151 FY-11 FY-151
FY-11 FY-152 FY-11 FY-151,2

©2015 Micron Technology, Inc. 41
Return of Capital Framework
Minimum cash target
Leverage target
Credit rating target
Returned ~90% of FY-14
FCF and ~79% in FY-151
~$3.8B in convertible
note / share repurchases
Annual review
Disciplined approach
based on operational
and strategic initiatives
Established Target
Capital Structure Dilution Management Capital Return Policy
1 Through FQ3-15

©2015 Micron Technology, Inc. 42
1,000
1,100
1,200
1,300
$16 $18 $20 $22 $24 $26 $28 $30 $32 $34 $36
Mill
ion
s o
f Sh
ares
Dilution Management Results
Start of FY 2014 GAAP Dilutive Shares1
Through FQ3-152
~12% reduction in dilutive shares
for stock price range of $20-$30
From FY 2014 through FQ3 2015, total share reduction of ~141M shares at $202
* Assume FQ3-15 basic shares and stock based compensation for analysis. All transactions assume full quarter of impact. 1 Does not include benefit of capped calls 2 Includes the benefit of capped calls

©2015 Micron Technology, Inc. 43
Financial Performance
Expanded revenues to $16B+ in FY 2014 with strong operating cash flow
Diversified market segments, customers and products
Strengthened balance sheet to support operational/strategic initiatives
Invested in R&D and capital expenditures to drive technology efficiency
and innovation
Enabled significant capital return and dilution management
©2015 Micron Technology, Inc. 44
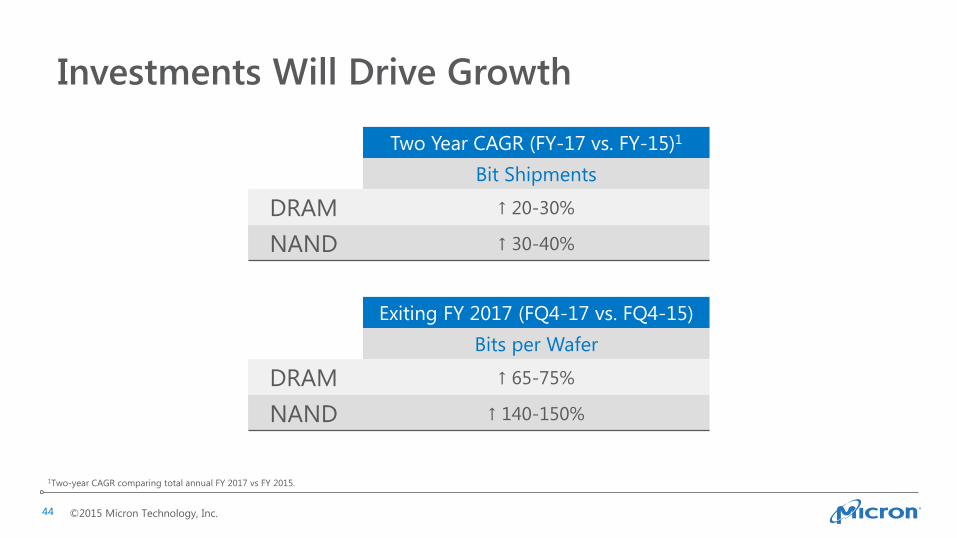
Investments Will Drive Growth
1Two-year CAGR comparing total annual FY 2017 vs FY 2015.
Two Year CAGR (FY-17 vs. FY-15)1
Bit Shipments
DRAM ↑ 20-30%
NAND ↑ 30-40%
Exiting FY 2017 (FQ4-17 vs. FQ4-15)
Bits per Wafer
DRAM ↑ 65-75%
NAND ↑ 140-150%

©2015 Micron Technology, Inc. 45
0%
100%
FY 2016
FY 2016 Capital Expenditure Guidance: $5.3B to $5.8B Technology and Product Enablement Non-supply related investments with focus on driving next-
generation memory technologies and packaging capabilities to
enable high-margin, differentiated solutions
Emerging memory
Packaging and controller capabilities
Other investments including R&D fab space in Boise
Non-Volatile Memory Investments related to 3D NAND development, TLC enablement
and Fab 10X to drive cost reductions and margin improvements
3D NAND
Fab 10X facility
3D XPoint™
DRAM Investments in leading edge technology to improve efficiencies
and margins
20nm and 1xnm ramp
CapEx Breakdown
20-30%
40-50%
25-35%
Flexible, Return-Focused Capital Expenditure Plan
©2015 Micron Technology, Inc. 46
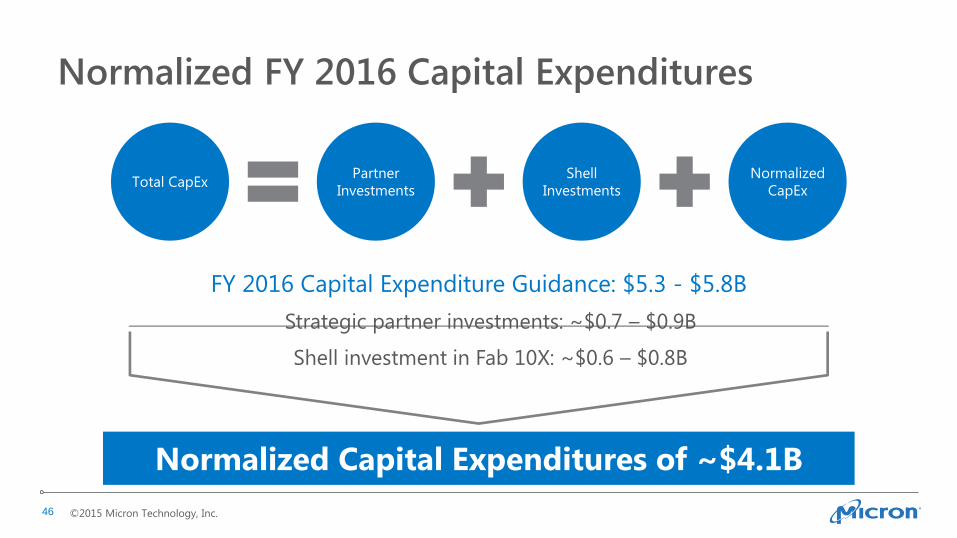
Normalized FY 2016 Capital Expenditures
Normalized Capital Expenditures of ~$4.1B
Total CapEx Partner
Investments
Shell
Investments
Normalized
CapEx
FY 2016 Capital Expenditure Guidance: $5.3 - $5.8B
Strategic partner investments: ~$0.7 – $0.9B
Shell investment in Fab 10X: ~$0.6 – $0.8B
©2015 Micron Technology, Inc. 47
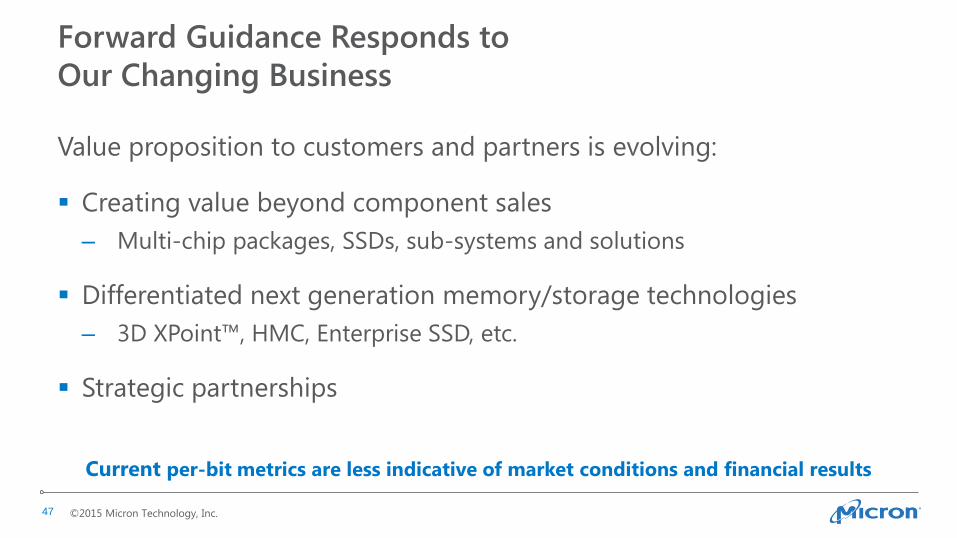
Forward Guidance Responds to
Our Changing Business
Value proposition to customers and partners is evolving:
Creating value beyond component sales
– Multi-chip packages, SSDs, sub-systems and solutions
Differentiated next generation memory/storage technologies
– 3D XPoint™, HMC, Enterprise SSD, etc.
Strategic partnerships
Current per-bit metrics are less indicative of market conditions and financial results

©2015 Micron Technology, Inc. 48
Changes to Forward Guidance Effective FQ1-16
Quarterly Guidance Metrics (on a Total Company, Non-GAAP basis)
Revenue
Gross Margin
Operating Expense
Operating Income
Diluted EPS
We expect quarterly call and financial reporting to be similar to current practice

©2015 Micron Technology, Inc. 49
Executing to a Capital Management Framework
Target Minimum Cash Balance
Target Leverage Ratio Cap Ex / Sales
Return on Assets > Cost of Capital
Efficient Free Cash
Flow Model
Value Creation
Strong Balance Sheet
Access to Low-Cost
Capital
LTM SG&A +
R&D + Current Debt2
(Currently ~$3.4B)
GAAP Debt to EBITDA < 1.5x Target 20-25% of Sales
Weighted Average
Cost of Capital
Currently ~10%1
1 Weighted average cost of capital as of June 4, 2015, based on Micron’s internal model 2 LTM SG&A and R&D = $2.2B; Current Debt (based on GAAP value, not principal amount) = $1.2B.

©2015 Micron Technology, Inc. 50
Financial Takeaways
Driving long-term returns with focused capital allocation
Delivering scale, a strong balance sheet, and significant shareholder returns/dilution management in recent years
Investing for future growth while remaining flexible and return-focused
Aligning financial communications to our evolving strategy
Executing efficient and effective capital management
– FQ4-15 QTD1: Repurchases of ~$0.5B of common shares and ~$0.1B of convertible notes
1 As of August 12, 2015

©2015 Micron Technology, Inc. 51
Mark Durcan – Chief Executive Officer

©2015 Micron Technology, Inc. 52
Analyst Day Summary
Industry conditions remain favorable over the long term:
Investing in technology, solutions, and strategic relationships to improve
competitive position
Delivering value-added solutions to our customers in diverse segments
Focusing on operational execution
Leveraging world-class technology to enable differentiated solutions
Deploying efficient and effective capital management
Focused on Driving Long-Term Shareholder Returns

©2015 Micron Technology, Inc. 53
Q & A
©2015 Micron Technology, Inc. 54

©2015 Micron Technology, Inc. 55
Amounts in millions FQ3-15 FQ4-14 to FQ3-15
Beginning of period:
Total assets $ 23,818 $ 20,495
Cash, current and noncurrent marketable investments (6,348) (4,809)
Current and noncurrent restricted cash (67) (62)
Non-controlling share (974) (949)
Non-GAAP total assets $ 16,429 $ 14,675
End of period:
Total assets $ 25,136 $ 25,136
Cash, current and noncurrent marketable investments (7,330) (7,330)
Current and noncurrent restricted cash (70) (70)
Non-controlling share (1,061) (1,061)
Non-GAAP total assets $ 16,675 $ 16,675
Non-GAAP average total assets $ 16,552 $ 15,675
Non-GAAP Asset Reconciliation
©2015 Micron Technology, Inc. 56
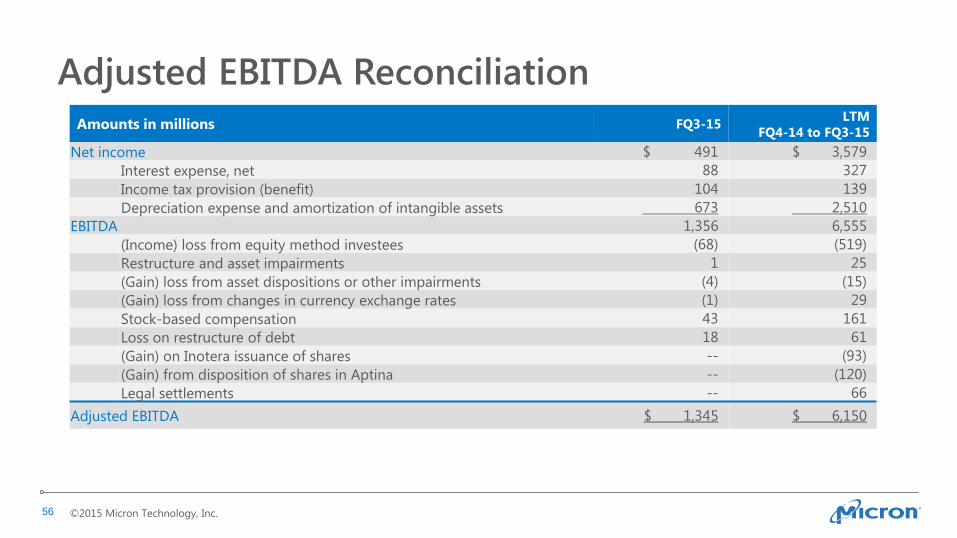
Amounts in millions FQ3-15 LTM
FQ4-14 to FQ3-15
Net income $ 491 $ 3,579
Interest expense, net 88 327
Income tax provision (benefit) 104 139
Depreciation expense and amortization of intangible assets 673 2,510
EBITDA 1,356 6,555
(Income) loss from equity method investees (68) (519)
Restructure and asset impairments 1 25
(Gain) loss from asset dispositions or other impairments (4) (15)
(Gain) loss from changes in currency exchange rates (1) 29
Stock-based compensation 43 161
Loss on restructure of debt 18 61
(Gain) on Inotera issuance of shares -- (93)
(Gain) from disposition of shares in Aptina -- (120)
Legal settlements -- 66
Adjusted EBITDA $ 1,345 $ 6,150
Adjusted EBITDA Reconciliation

©2015 Micron Technology, Inc. 57
Amounts in millions FQ3-15 LTM
FQ4-14 to FQ3-15
GAAP net income attributable to Micron $ 491 $ 3,578
Non-GAAP adjustments:
Tessera license -- 66
Restructure and asset impairments 1 35
Amortization of debt discount and other costs 34 142
Loss on restructure of debt 18 65
(Gain) loss from changes in currency exchange rates (1) 29
(Gain) from Inotera issuance of shares -- (93)
(Gain) from disposition of shares in Aptina -- (120)
Estimated tax effects of above items -- (7)
Non-cash taxes from MMJ and MMT 22 (25)
Non-cash taxes from MMJ for changes in Japan tax laws and rates 45 45
Non-cash taxes from Inotera 10 (55)
Non-GAAP net income (loss) attributable to Micron $ 620 $ 3,660
x4
$ 2,480 $ 3,660
Non-GAAP Net Income Reconciliation

©2015 Micron Technology, Inc. 58


