Micrometer‐scale magnetic imaging of geological samples...
14
TECHNICAL REPORTS: METHODS 10.1002/2017GC006946 Micrometer-scale magnetic imaging of geological samples using a quantum diamond microscope D. R. Glenn 1 , R. R. Fu 2 , P. Kehayias 3 , D. Le Sage 1 , E. A. Lima 2 , B. P. Weiss 2 , and R. L. Walsworth 1,3 1 Department of Physics, Harvard University, Cambridge, Massachusetts, USA, 2 Department of Earth, Atmospheric, and Planetary Sciences, Massachusetts Institute of Technology, Cambridge, Massachusetts, USA, 3 Harvard-Smithsonian Center for Astrophysics, Cambridge, Massachusetts, USA Abstract Remanent magnetization in geological samples may record the past intensity and direction of planetary magnetic fields. Traditionally, this magnetization is analyzed through measurements of the net magnetic moment of bulk millimeter to centimeter sized samples. However, geological samples are often mineralogically and texturally heterogeneous at submillimeter scales, with only a fraction of the ferromag- netic grains carrying the remanent magnetization of interest. Therefore, characterizing this magnetization in such cases requires a technique capable of imaging magnetic fields at fine spatial scales and with high sensitivity. To address this challenge, we developed a new instrument, based on nitrogen-vacancy centers in diamond, which enables direct imaging of magnetic fields due to both remanent and induced magnetization, as well as optical imaging, of room-temperature geological samples with spatial resolution approaching the optical diffraction limit. We describe the operating principles of this device, which we call the quantum diamond microscope (QDM), and report its optimized image-area-normalized magnetic field sensitivity (20 mTmm/Hz 1/2 ), spatial resolution (5 mm), and field of view (4 mm), as well as trade-offs between these parameters. We also perform an absolute magnetic field calibration for the device in different modes of operation, including three-axis (vector) and single-axis (projective) magnetic field imaging. Finally, we use the QDM to obtain magnetic images of several terrestrial and meteoritic rock samples, demonstrating its ability to resolve spatially distinct populations of ferromagnetic carriers. 1. Introduction Reliable characterization of ancient magnetic fields using geological samples requires the survival of ferro- magnetic phases that were present to record the magnetic field of interest. However, metamorphism, aque- ous alteration, and surface weathering are common processes that may destroy and replace all or a subset of a rock sample’s ferromagnetic minerals. At the same time, erosion may lead to the physical disintegration of rocks and the reassembly of their constituent parts in clastic sediments. As a result of these secondary chemical and physical processes, diachronous populations of ferromagnetic minerals are frequently juxta- posed at the micrometer to millimeter scales. The difficulty of extracting useful paleomagnetic information from such complex samples is a key limiting factor to our understanding of the early Earth magnetic field [e.g., Weiss et al., 2015], the past configuration of lithospheric plates [e.g., Kent et al., 1987], and the stability of the Earth’s rotation and geomagnetic field axis in the mantle reference frame [e.g., Swanson-Hysell et al., 2012]. Furthermore, even in the absence of secondary remagnetization, geological samples often contain different populations of ferromagnetic minerals with disparate capacities for recording a high-fidelity, inter- pretable remanence [Fu et al., 2014a]. Obtaining useful paleomagnetic data from samples with complex geological histories and/or fine-scale mix- tures of ferromagnetic grains with varying recording properties requires the isolation of magnetic signal car- ried by high-fidelity ferromagnetic grains that were magnetized during the time period of interest. Standard paleomagnetic techniques, limited in part by the magnetometer sensitivity, typically measure the net mag- netic moment of whole-rock samples with volumes of several cubic centimeters. For such samples, mag- netic cleaning techniques such as thermal and alternating-field demagnetization have been used to isolate the magnetization carried by subpopulations of ferromagnetic grains [Tauxe, 2010]. However, magnetic cleaning often does not fully isolate a single population of grains due to overlapping ranges of unblocking Key Points: We developed a quantum diamond microscope (QDM) for imaging magnetic fields produced by geological samples This instrument offers a combination of superior spatial resolution (5 mm), magnetic sensitivity (20 mT mm/Hz 1/2 ), and wide field of view (4 mm) We demonstrate the application of this instrument to magnetic mapping of several terrestrial and meteoritic rock samples Supporting Information: Supporting Information S1 Data Set S1 Correspondence to: R. Walsworth, [email protected] Citation: Glenn, D. R., R. R. Fu, P. Kehayias, D. Le Sage, E. A. Lima, B. P. Weiss, and R. L. Walsworth (2017), Micrometer- scale magnetic imaging of geological samples using a quantum diamond microscope, Geochem. Geophys. Geosyst., 18, doi:10.1002/ 2017GC006946. Received 3 APR 2017 Accepted 10 JUL 2017 Accepted article online 26 JUL 2017 V C 2017. American Geophysical Union. All Rights Reserved. GLENN ET AL. QUANTUM DIAMOND MICROSCOPE 1 Geochemistry, Geophysics, Geosystems PUBLICATIONS
Transcript of Micrometer‐scale magnetic imaging of geological samples...

TECHNICALREPORTS: METHODS10.1002/2017GC006946
Micrometer-scale magnetic imaging of geological samplesusing a quantum diamond microscopeD. R. Glenn1, R. R. Fu2, P. Kehayias3 , D. Le Sage1 , E. A. Lima2 , B. P. Weiss2, andR. L. Walsworth1,3
1Department of Physics, Harvard University, Cambridge, Massachusetts, USA, 2Department of Earth, Atmospheric, andPlanetary Sciences, Massachusetts Institute of Technology, Cambridge, Massachusetts, USA, 3Harvard-Smithsonian Centerfor Astrophysics, Cambridge, Massachusetts, USA
Abstract Remanent magnetization in geological samples may record the past intensity and direction ofplanetary magnetic fields. Traditionally, this magnetization is analyzed through measurements of the netmagnetic moment of bulk millimeter to centimeter sized samples. However, geological samples are oftenmineralogically and texturally heterogeneous at submillimeter scales, with only a fraction of the ferromag-netic grains carrying the remanent magnetization of interest. Therefore, characterizing this magnetization insuch cases requires a technique capable of imaging magnetic fields at fine spatial scales and with highsensitivity. To address this challenge, we developed a new instrument, based on nitrogen-vacancy centersin diamond, which enables direct imaging of magnetic fields due to both remanent and inducedmagnetization, as well as optical imaging, of room-temperature geological samples with spatial resolutionapproaching the optical diffraction limit. We describe the operating principles of this device, which we callthe quantum diamond microscope (QDM), and report its optimized image-area-normalized magnetic fieldsensitivity (20 mT�mm/Hz1/2), spatial resolution (5 mm), and field of view (4 mm), as well as trade-offs betweenthese parameters. We also perform an absolute magnetic field calibration for the device in different modesof operation, including three-axis (vector) and single-axis (projective) magnetic field imaging. Finally, we usethe QDM to obtain magnetic images of several terrestrial and meteoritic rock samples, demonstrating itsability to resolve spatially distinct populations of ferromagnetic carriers.
1. Introduction
Reliable characterization of ancient magnetic fields using geological samples requires the survival of ferro-magnetic phases that were present to record the magnetic field of interest. However, metamorphism, aque-ous alteration, and surface weathering are common processes that may destroy and replace all or a subsetof a rock sample’s ferromagnetic minerals. At the same time, erosion may lead to the physical disintegrationof rocks and the reassembly of their constituent parts in clastic sediments. As a result of these secondarychemical and physical processes, diachronous populations of ferromagnetic minerals are frequently juxta-posed at the micrometer to millimeter scales. The difficulty of extracting useful paleomagnetic informationfrom such complex samples is a key limiting factor to our understanding of the early Earth magnetic field[e.g., Weiss et al., 2015], the past configuration of lithospheric plates [e.g., Kent et al., 1987], and the stabilityof the Earth’s rotation and geomagnetic field axis in the mantle reference frame [e.g., Swanson-Hysell et al.,2012]. Furthermore, even in the absence of secondary remagnetization, geological samples often containdifferent populations of ferromagnetic minerals with disparate capacities for recording a high-fidelity, inter-pretable remanence [Fu et al., 2014a].
Obtaining useful paleomagnetic data from samples with complex geological histories and/or fine-scale mix-tures of ferromagnetic grains with varying recording properties requires the isolation of magnetic signal car-ried by high-fidelity ferromagnetic grains that were magnetized during the time period of interest. Standardpaleomagnetic techniques, limited in part by the magnetometer sensitivity, typically measure the net mag-netic moment of whole-rock samples with volumes of several cubic centimeters. For such samples, mag-netic cleaning techniques such as thermal and alternating-field demagnetization have been used to isolatethe magnetization carried by subpopulations of ferromagnetic grains [Tauxe, 2010]. However, magneticcleaning often does not fully isolate a single population of grains due to overlapping ranges of unblocking
Key Points:� We developed a quantum diamond
microscope (QDM) for imagingmagnetic fields produced bygeological samples� This instrument offers a combination
of superior spatial resolution (5 mm),magnetic sensitivity (20 mT� mm/Hz1/2),and wide field of view (4 mm)� We demonstrate the application of
this instrument to magnetic mappingof several terrestrial and meteoriticrock samples
Supporting Information:� Supporting Information S1� Data Set S1
Correspondence to:R. Walsworth,[email protected]
Citation:Glenn, D. R., R. R. Fu, P. Kehayias,D. Le Sage, E. A. Lima, B. P. Weiss, andR. L. Walsworth (2017), Micrometer-scale magnetic imaging of geologicalsamples using a quantum diamondmicroscope, Geochem. Geophys.Geosyst., 18, doi:10.1002/2017GC006946.
Received 3 APR 2017
Accepted 10 JUL 2017
Accepted article online 26 JUL 2017
VC 2017. American Geophysical Union.
All Rights Reserved.
GLENN ET AL. QUANTUM DIAMOND MICROSCOPE 1
Geochemistry, Geophysics, Geosystems
PUBLICATIONS

temperatures or coercivities. Furthermore, because the microscopic contexts of ferromagnetic grain popula-tions are generally not directly constrained by magnetic cleaning, correctly identifying the relative age andorigin of the magnetization component of interest is often ambiguous.
The development of mapping magnetometers capable of resolving ferromagnetic carriers at the submilli-meter scale—such as the SQUID microscope [Weiss et al., 2007; Kawai et al., 2016], magneto-impedancemicroscopes [Nakamura et al., 2010], magnetoresistance (MR) microscopes [Hankard et al., 2009], magneto-optical imaging (MOI) [Uehara et al., 2010], Hall-effect microscopes [Kletetschka et al., 2013], and the mag-netic tunnel junction (MTJ) microscope [Lima et al., 2014]—has led to a new approach for analyzing rocksamples with complex, heterogeneous magnetizations. These instruments are capable of imaging the spa-tial distribution of remanent fields so that they can be spatially correlated with the fine-scale magnetizationdistribution within a sample [Fu et al., 2014a].
It has recently been demonstrated that nitrogen-vacancy (NV) centers in diamond [Doherty et al., 2013;Schirhagl et al., 2014; Rondin et al., 2014] enable sensitive imaging of static magnetic field distributions withsubmicrometer spatial resolution [Pham et al., 2011]. Perhaps the simplest and most robust implementationof NV magnetic imaging is the quantum diamond microscope (QDM) [Glenn et al., 2015]. This device con-sists of a thin (10 nm–10 mm) layer of NV centers implanted or grown into the surface of a diamond chipthat is brought into close proximity with the magnetic sources of interest and interrogated using opticallydetected magnetic resonance (ODMR) [Gruber et al., 1997]. The QDM is readily applicable to the study ofgeological samples at room temperature (<508C) and low ambient magnetic field (<50 mT), making it anattractive platform for spatially resolved measurements of artificial and natural remanent magnetization(NRM). Furthermore, because the NV centers can typically be placed within �10 mm of the magnetic sourcesof interest (or closer, if special care is taken with sample and sensor preparation), even a relatively modestQDM magnetic noise floor of �100 nT RMS is sufficient to detect moments as small as �10216 A�m2, provid-ing sensitivity comparable or superior to scanning SQUID, MR, MOI, Hall-effect, and MTJ microscope tech-nologies. The QDM also allows optical imaging in the same configuration, providing spatially correlatedmagnetic and optical images of the sample.
2. Description of the QDM
2.1. Basic Operating PrinciplesIn the QDM implementation described here (Figures 1a and 1b), a diamond sensor chip (labeled as D1–D4in our experiments; see supporting information Table S1 for details) is placed, NV layer face down, abovethe polished surface of the rock sample. The sample is mounted on a printed circuit board patterned with apair of decoupled, crossed stripline microwave resonators. The striplines are excited in-phase (or 908 out-of-phase) to produce a linearly (or circularly) polarized, GHz-frequency magnetic field for driving continuousspin rotations in the NV centers. The NV centers are continuously probed with green laser excitation (wave-length 532 nm, intensity 105–107 W/m2), and their emitted red fluorescence (wavelength 637–800 nm) isimaged with a scientific complementary metal oxide semiconductor (sCMOS) camera.
For geological samples that could be adversely affected by heating during prolonged laser illumination, thediamond chip may be angle-polished such that excitation light is totally internally reflected from the bot-tom surface and exits the opposite facet (Figure 1b). In contrast, with a square-cut chip and laser lightdirectly impinging on the sample, we observe up to �308C heating above room temperature under realisticimaging conditions for most sample substrates (supporting information Figure S2).
Three pairs of Helmholtz-configured magnet coils produce a spatially homogeneous static field (B0) at therock sample and NV layer, which can be used to cancel the local Earth’s field and provide the NV centerswith a controlled magnetic bias. The accuracy of the field nulling achieved with the present system is �0.1mT, comparable to the magnetic sensitivity of our measurements, but could be improved with the use ofhigh-precision current supplies and/or secondary shim coils if needed.
The ODMR measurement proceeds by simultaneous application of optical and microwave fields (the latterdenoted B1) to the ensemble of NV centers, generating a spatially dependent NV fluorescence signal withfeatures dependent on the sample-induced, local magnetic field (See supporting information Figure S3 forbackground on the physics and level structure of NV centers in diamond.) In the absence of microwaves,
Geochemistry, Geophysics, Geosystems 10.1002/2017GC006946
GLENN ET AL. QUANTUM DIAMOND MICROSCOPE 2

the optical excitation induces a baseline fluorescence level by continuously driving the NV population intoan excited electronic state, which spontaneously decays (lifetime s � 13 ns [Robledo et al., 2011]) by emit-ting red fluorescence. The addition of a microwave B1 field resonant with one of the ground state spin tran-sitions causes a fraction of the NV population to be transferred from the ms 5 0 to the ms 5 21 or ms 5 11states. These states, when optically excited, have a finite branching ratio to a long-lived metastable state(lifetime s � 220 ns [Acosta et al., 2010]), decreasing the emitted fluorescence. Off-resonant microwave driv-ing leaves the baseline fluorescence unchanged. The spin resonance frequency for each NV center isZeeman-shifted by the local magnetic field, resulting in a spatially varying fluorescence pattern where thelight emitted at each position is suppressed below the baseline only if the microwave drive is resonant. Inthe low-field limit (g lB B� fZFS, for Land�e g-factor g � 2, lB � 14 GHz/T the Bohr magneton, and fZFS �2.87 GHz the NV zero-field splitting), the Zeeman shift is Df 5 6 g mB |Bp|, where Bp is the magnitude of the
Figure 1. Rock magnetic imaging using a quantum diamond microscope (QDM). (a) Schematic of QDM configuration. The rock sample is placed on a glass slide near the focus of amicroscope objective. A diamond chip is positioned above it, with a dense layer of nitrogen-vacancy (NV) centers facing down. The NV centers are interrogated using green laser lightand continuous microwave driving, with the microwaves delivered by strip-line resonators below the sample mount. Red fluorescence from the NV centers is imaged onto a scientificCMOS camera to map the sample magnetic fields. Inset shows full QDM including three orthogonal pairs of Helmholtz coils that control the bias field B0 at the NV center layer. (b) Iso-lated top and side views of the sample mount plus microwave strip-lines, which are driven to produce a resonant field (B1) to manipulate the NV spins. When the strip-lines are driven inphase, B1 is linearly polarized along x1y . When the strip-lines are driven out-of-phase, B1 is circularly polarized about the z axis (with polarization vector x6i y ). Laser light impinges onthe NV center layer at the bottom of the diamond chip, and NV fluorescence is imaged through the top of the diamond. (c) Characteristic NV optically detected magnetic resonance(ODMR) spectrum for vector magnetic microscopy (VMM). Inset shows the orientation of B0, which projects unequally onto the [111] diamond lattice directions so that transitions for allfour NV orientations are resolved. Each orientation allows two spin transitions, Dms 5 61, which are further split into triplets due to hyperfine coupling to the 14N nucleus of the NV cen-ter. The Dms 5 11 (or Dms 5 21) triplets are indicated with grey (or white) bars. During data acquisition, the B1 frequency is swept across all resonances, the NV fluorescence is mea-sured at each frequency (blue dots) and a portion of the spectrum is fit (red curve) to determine the local vector magnetic field. (d) ODMR spectrum for projective magnetic microscopy(PMM). B0 is parallel to one of the [111] directions, distinguishing it spectrally, while the other three NV orientations are degenerate. The B1 frequency is scanned and line shapes are fit(red curves) only for the aligned transitions, enabling rapid acquisition of single-axis magnetic field data. In a real experiment, data points corresponding to the nonaligned transitionswould not be acquired—they are included here for illustrative purposes only. (e) ODMR spectrum for circularly polarized magnetic microscopy (CPMM). The NV centers are formed from15N, resulting in hyperfine doublets instead of the triplets associated with 14N. B0 is applied perpendicular to the chip surface, with equal projection on all four [111] directions, makingthe four pairs of NV transitions degenerate. Also, B0 is small, such that the electronic Zeeman shift is weaker than the nuclear hyperfine coupling. Transitions for which the nuclear spinstate is mI 5 11=2 (or mI 5 21=2) are indicated with squares (or circles). The Dms 5 11 (or Dms 5 21) transitions are indicated with grey (or white) markers. In the first (second) plot, B1
has right- (left-) circular polarization about the B0 axis, favoring excitation of the Dms 5 11 (Dms 5 21) transitions. Data acquisition consists of alternating between circular-polarizationorientations while scanning the B1 frequency and fitting line shapes over the full spectrum (red curve).
Geochemistry, Geophysics, Geosystems 10.1002/2017GC006946
GLENN ET AL. QUANTUM DIAMOND MICROSCOPE 3
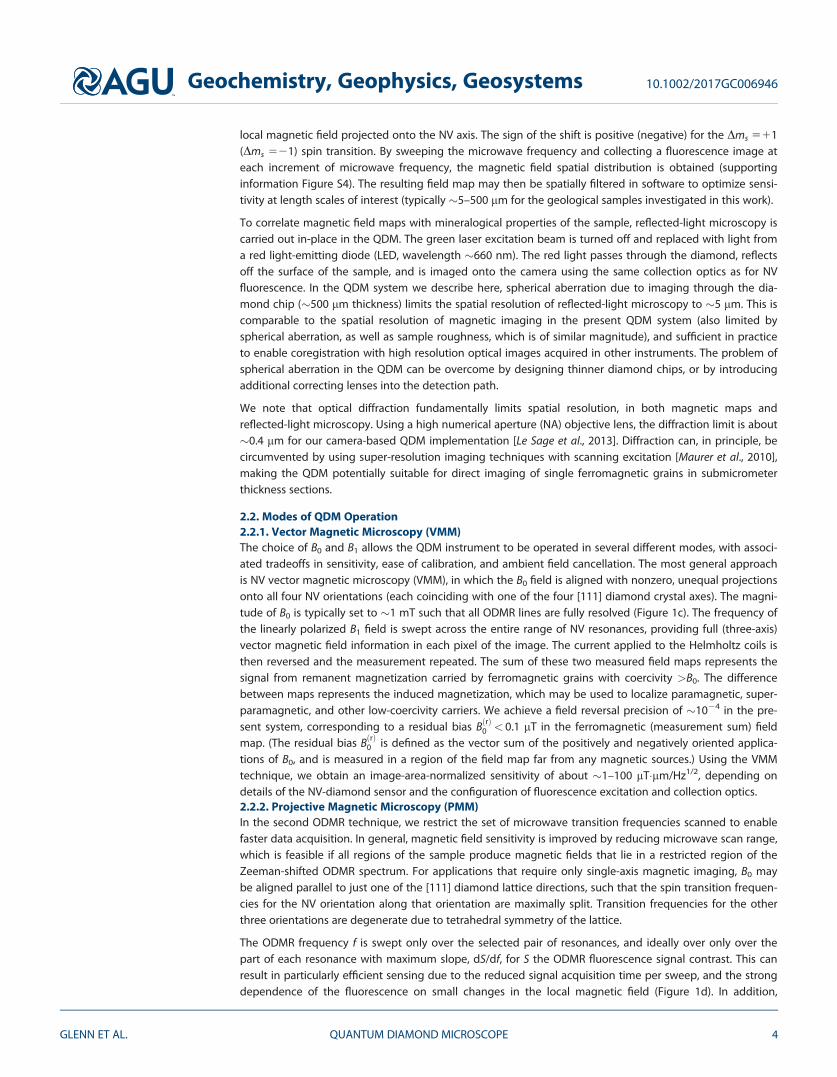
local magnetic field projected onto the NV axis. The sign of the shift is positive (negative) for the Dms 511(Dms 521) spin transition. By sweeping the microwave frequency and collecting a fluorescence image ateach increment of microwave frequency, the magnetic field spatial distribution is obtained (supportinginformation Figure S4). The resulting field map may then be spatially filtered in software to optimize sensi-tivity at length scales of interest (typically �5–500 mm for the geological samples investigated in this work).
To correlate magnetic field maps with mineralogical properties of the sample, reflected-light microscopy iscarried out in-place in the QDM. The green laser excitation beam is turned off and replaced with light froma red light-emitting diode (LED, wavelength �660 nm). The red light passes through the diamond, reflectsoff the surface of the sample, and is imaged onto the camera using the same collection optics as for NVfluorescence. In the QDM system we describe here, spherical aberration due to imaging through the dia-mond chip (�500 mm thickness) limits the spatial resolution of reflected-light microscopy to �5 mm. This iscomparable to the spatial resolution of magnetic imaging in the present QDM system (also limited byspherical aberration, as well as sample roughness, which is of similar magnitude), and sufficient in practiceto enable coregistration with high resolution optical images acquired in other instruments. The problem ofspherical aberration in the QDM can be overcome by designing thinner diamond chips, or by introducingadditional correcting lenses into the detection path.
We note that optical diffraction fundamentally limits spatial resolution, in both magnetic maps andreflected-light microscopy. Using a high numerical aperture (NA) objective lens, the diffraction limit is about�0.4 mm for our camera-based QDM implementation [Le Sage et al., 2013]. Diffraction can, in principle, becircumvented by using super-resolution imaging techniques with scanning excitation [Maurer et al., 2010],making the QDM potentially suitable for direct imaging of single ferromagnetic grains in submicrometerthickness sections.
2.2. Modes of QDM Operation2.2.1. Vector Magnetic Microscopy (VMM)The choice of B0 and B1 allows the QDM instrument to be operated in several different modes, with associ-ated tradeoffs in sensitivity, ease of calibration, and ambient field cancellation. The most general approachis NV vector magnetic microscopy (VMM), in which the B0 field is aligned with nonzero, unequal projectionsonto all four NV orientations (each coinciding with one of the four [111] diamond crystal axes). The magni-tude of B0 is typically set to �1 mT such that all ODMR lines are fully resolved (Figure 1c). The frequency ofthe linearly polarized B1 field is swept across the entire range of NV resonances, providing full (three-axis)vector magnetic field information in each pixel of the image. The current applied to the Helmholtz coils isthen reversed and the measurement repeated. The sum of these two measured field maps represents thesignal from remanent magnetization carried by ferromagnetic grains with coercivity >B0. The differencebetween maps represents the induced magnetization, which may be used to localize paramagnetic, super-paramagnetic, and other low-coercivity carriers. We achieve a field reversal precision of �1024 in the pre-sent system, corresponding to a residual bias BðrÞ0 < 0.1 mT in the ferromagnetic (measurement sum) fieldmap. (The residual bias BðrÞ0 is defined as the vector sum of the positively and negatively oriented applica-tions of B0, and is measured in a region of the field map far from any magnetic sources.) Using the VMMtechnique, we obtain an image-area-normalized sensitivity of about �1–100 mT�mm/Hz1/2, depending ondetails of the NV-diamond sensor and the configuration of fluorescence excitation and collection optics.2.2.2. Projective Magnetic Microscopy (PMM)In the second ODMR technique, we restrict the set of microwave transition frequencies scanned to enablefaster data acquisition. In general, magnetic field sensitivity is improved by reducing microwave scan range,which is feasible if all regions of the sample produce magnetic fields that lie in a restricted region of theZeeman-shifted ODMR spectrum. For applications that require only single-axis magnetic imaging, B0 maybe aligned parallel to just one of the [111] diamond lattice directions, such that the spin transition frequen-cies for the NV orientation along that orientation are maximally split. Transition frequencies for the otherthree orientations are degenerate due to tetrahedral symmetry of the lattice.
The ODMR frequency f is swept only over the selected pair of resonances, and ideally over only over thepart of each resonance with maximum slope, dS/df, for S the ODMR fluorescence signal contrast. This canresult in particularly efficient sensing due to the reduced signal acquisition time per sweep, and the strongdependence of the fluorescence on small changes in the local magnetic field (Figure 1d). In addition,
Geochemistry, Geophysics, Geosystems 10.1002/2017GC006946
GLENN ET AL. QUANTUM DIAMOND MICROSCOPE 4

precise alignment of B0 along one NV orientation can enable optical polarization of the nitrogen nuclearspin, providing improved ODMR contrast [Fischer et al. 2013]. We refer to this approach as projective mag-netic microscopy (PMM), because, to a good approximation (supporting information Figure S4), only thecomponent of the sample field projected along the selected NV orientation is detected. As with VMM, eachset of PMM measurements consists of magnetic field maps acquired with an aligned and an antialignedbias field relative to the chosen [111] lattice direction. The sum and difference of these two maps yield themagnetic fields due to remanent and induced magnetizations, respectively. PMM can enhance sensitivityby a factor of �2–3 compared with typical VMM, although the largest gains are available only if the rangeof sample magnetic field values to be imaged, DBsamp, is small, (i.e., lB DBsamp � CNV , for CNV the NVODMR half width and at half maximum (HWHM) linewidth defined in supporting information Figure 4),such that the frequency sweep range may be restricted to the sharpest part of the resonance [Glenn et al.,2015]. This tradeoff between sensitivity and dynamic range is generic for NV ODMR measurements. Anotherpotential drawback of PMM is that CVD diamond chips are typically grown with [100] normal to the sensingplane, such that the magnetic projection direction in PMM measurements is at an angle of 54.78 to the nor-mal. Diamond chips with [111] normal to the plane can be produced by cleaving or polishing at the appro-priate angle, usually at the expense of a smaller available field of view.2.2.3. Circularly Polarized Magnetic Microscopy (CPMM)Bias fields B0� 1 mT are necessary during data acquisition in the VMM and PMM configurations to spectrallyresolve the projected field magnitude along different NV orientations. Although the sum of successivemeasurements under a reversed B0 rejects the induced magnetic response of the sample to B0 during ameasurement, down to the residual bias BðrÞ0 < 0.1 mT, inaccuracy in the reversal of the bias field may intro-duce systematic errors. To avoid this potential problem and recover only the magnetic fields due to rema-nent magnetization without exposing the sample to significant magnetic fields, we adapt a single-axisODMR technique (Figure 1e) previously demonstrated [Alegre et al., 2007] to work at very small bias (B0< 10mT in our system), by using a drive field B1 that is circularly polarized with respect to B0.
The B0 field is aligned normal to the diamond surface such that it projects equally on all NV orientations.In this configuration, the component of the sample magnetic field parallel to B0 produces asymmetric shiftsof the four sets of degenerate ODMR resonances relative to the zero-field splitting frequency, with thesign of the shift depending on the handedness of B1. By switching between left-circular and right-circulardrive fields, the centroid of the degenerate resonance lines is modulated to higher or lower frequency,allowing detection of small shifts, g lB B� CNV . The data shown in Figure 1e were obtained at B0 5 40 mT,where the Dms 5 11 and Dms 5 21 transitions are resolved, to clearly illustrate the procedure. However,small line shifts can be detected even in the unresolved case, in practice. Sample magnetic fields perpendic-ular to B0 give rise instead to a symmetric broadening of the degenerate resonances, and therefore cannoteasily be detected. We refer to this approach as circularly polarized magnetic microscopy (CPMM). CPMM istypically performed with NV centers formed from 15N, which have simpler spectra than NV centers formedfrom 14N (i.e., hyperfine doublets instead of triplets). Despite the extra technical overhead of the circularlypolarized NV drive, as well the need for careful calibration when strain terms in the NV Hamiltonian becomecomparable to the Zeeman term (see section 3.3), this is the only technique known to us that enables NVmagnetic imaging at very low bias field. (See supporting information Figure S5 for an extended discussionof the CPMM technique.)
3. Measurements and Discussion
The high spatial resolution of the QDM, together with the ability to acquire optical and magnetic imagessimultaneously, enables local magnetic field maps to be precisely correlated with images of petrographicstructure obtained in other instruments. To illustrate the constraints on ferromagnetic mineralogy offeredby these measurements, we acquired coregistered optical and magnetic maps of three different rock sam-ples, each of which displays heterogeneous magnetization at the 1–100 mm scale.
3.1. Correlative Optical and Magnetic MicroscopyAs an example QDM application, we acquired spatially correlated optical magnetic images of a 30 mm thinsection of the Allende CV3 chondrite to identify the primary or secondary origin of ferromagnetic carriers.As in the case of most chondrites, Allende contains millimeter scale igneous chondrules embedded in a
Geochemistry, Geophysics, Geosystems 10.1002/2017GC006946
GLENN ET AL. QUANTUM DIAMOND MICROSCOPE 5

finer-grain matrix consisting of primitive and recrystallized minerals. Early paleomagnetic studies have sug-gested that Allende chondrules recorded primordial solar system magnetic fields as they formed andcooled in the solar nebula [Lanoix et al., 1978; Sugiura and Strangway, 1985]. However, subsequent paleo-magnetic studies of Allende have revealed pervasive recrystallization of ferromagnetic phases, includingthe formation of pyrrhotite, magnetite, and awaruite during metasomatism on the CV parent body[Carporzen et al., 2011; Fu et al., 2014b]. The identification of ferromagnetic phases within individual chon-drules is therefore necessary to assess the interpretation of chondrule remanent magnetization due to neb-ular magnetic fields. If the ferromagnetic mineralogy of chondrules consists of secondary minerals, thechondrules cannot preserve magnetization acquired prior to the accretion of the parent body.
To facilitate the identification of magnetic sources inside individual chondrules, we imparted a strong in-plane isothermal remanent magnetization (IRM) in a 200 mT field on a 30 mm thick section of Allende.Although this applied field does not saturate the pyrrhotite grains present in Allende, it covers the majorityof the coercivity range within which the NRM is observed [Carporzen et al., 2011]. We therefore regard ourmaps of the 200 mT IRM as a satisfactory approximation of the distribution of ferromagnetic grains carryingNRM in the Allende meteorite. The diamond D1 (with 14NV layer depth of �20 nm—see supporting infor-mation Table S1) was placed directly onto the sample, such that the effective standoff distance to the sen-sor was set by the roughness of the polished sample surface (�1–3 mm, estimated by high-magnificationoptical microscopy). The full field of view (FOV) had dimensions �800 mm 3 600 mm. Comparison of thereflected light, plane-polarized image (Figure 2a), and VMM magnetic map (Figure 2b, acquired in1.5 3 103 s of averaging) shows the concentration of ferromagnetic carriers in the rim and mesostasisregions of the chondrule. Reflected-light microscopy indicates that the chondrule rim contains abundantmagnetite. Meanwhile, although the ferromagnetic phases in the mesostasis regions of our measured chon-drule were not visible in optical microscopy, previous analyses have shown that they also contain exclu-sively mineral assemblages formed during aqueous alteration [Brearley and Krot, 2012]. As such, the spatiallocalization of ferromagnetism in these areas using the QDM indicates the secondary nature of ferromag-netic grains from Allende chondrules [Fu et al., 2014b].
A similar application of the QDM to image a strong artificial magnetization has already been demonstratedin the literature [Fu et al., 2014a], as a means to identify the mineralogy of the strongest sources in the sam-ple after the volume-averaged natural remanence had been extracted by conventional thermal oralternating-field demagnetization. In principle, it should be possible to obtain spatially resolved demagneti-zation curves within each magnetically homogeneous subregion of a QDM image directly, although thistechnology has yet to be implemented.
To test the repeatability of QDM magnetic field maps, as well as the agreement between different ODMRacquisition modes, we reimaged a smaller field of view (sub-FOV) of the Allende chondrule containing sev-eral altered mesostasis regions using diamond D2 (with a 15NV layer depth of �20 nm) in VMM and CPMM(Figure 2c). The diamond position and laser illumination pattern were kept fixed between the two measure-ments; only the direction of B0 and the polarization and frequency sweep range of B1 were changed. Eachimage was acquired in 2.0 3 104 s of averaging. After mean-subtraction to account for the difference in B0,the field maps showed good qualitative agreement, with all of the dipolar magnetic features from the fullFOV map clearly discernible in the new sub-FOVs. However, careful comparison shows that the peak fieldvalues of magnetic features measured in CPMM are greater than those in VMM, typically by �5–10%. Thissuggests the need for calibration of the different ODMR imaging techniques, as described in the followingsections. In addition, we note that the full FOV field map contains a prominent, sharp noise feature (whitearrow) that does not appear in either of the sub-FOVs. We attribute this to local diamond-strain-inducedshifts in NV resonance frequencies in the affected pixels, likely due to an edge dislocation in the diamondcrystal running perpendicular to the chip surface. (Changing to a different diamond for the sub-FOVs thuseliminated the feature.) Because such crystal defects produce strong strain fields that are not completelyaccounted for by our NV Hamiltonian fitting procedure, their positions must be recorded for each diamondand the affected pixels excluded from measured magnetic field maps.
3.2. Illustration of Sensitivity and Spatial ResolutionTo establish performance benchmarks for rock magnetometry with the QDM, we obtained maps of mag-netic fields produced by remanent magnetization in a 30 mm thin section from the eucrite ALHA81001
Geochemistry, Geophysics, Geosystems 10.1002/2017GC006946
GLENN ET AL. QUANTUM DIAMOND MICROSCOPE 6
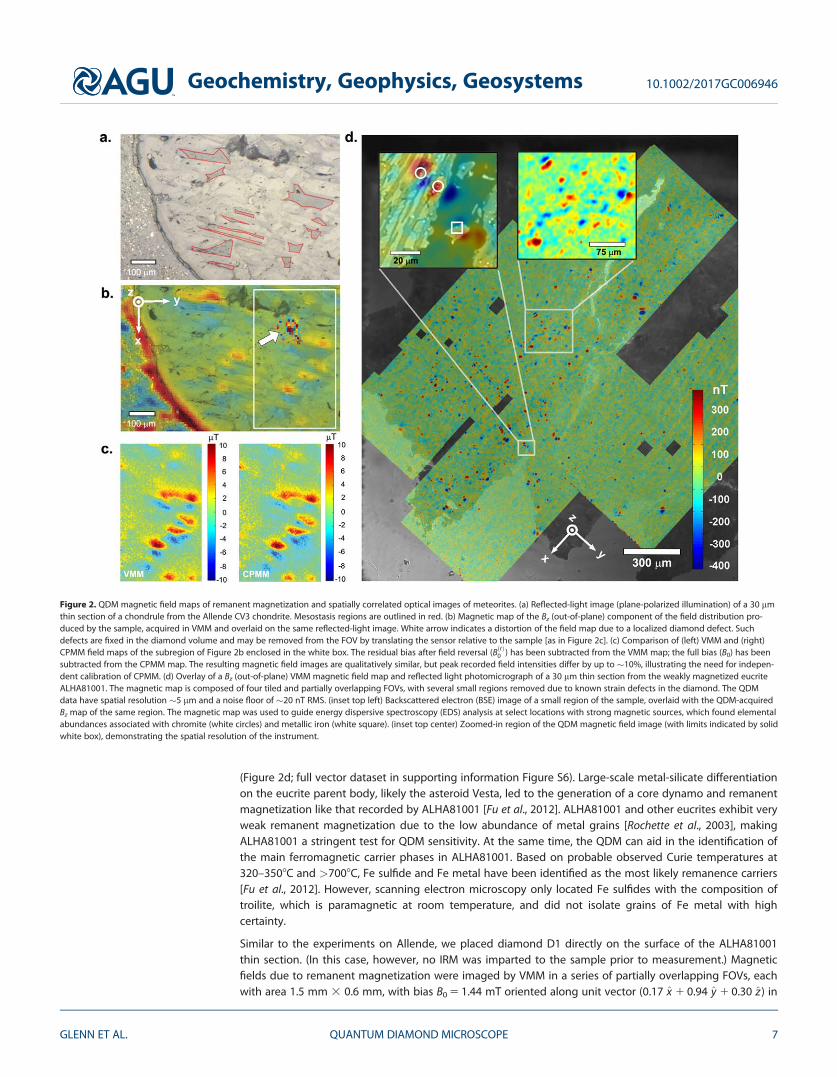
(Figure 2d; full vector dataset in supporting information Figure S6). Large-scale metal-silicate differentiationon the eucrite parent body, likely the asteroid Vesta, led to the generation of a core dynamo and remanentmagnetization like that recorded by ALHA81001 [Fu et al., 2012]. ALHA81001 and other eucrites exhibit veryweak remanent magnetization due to the low abundance of metal grains [Rochette et al., 2003], makingALHA81001 a stringent test for QDM sensitivity. At the same time, the QDM can aid in the identification ofthe main ferromagnetic carrier phases in ALHA81001. Based on probable observed Curie temperatures at320–3508C and >7008C, Fe sulfide and Fe metal have been identified as the most likely remanence carriers[Fu et al., 2012]. However, scanning electron microscopy only located Fe sulfides with the composition oftroilite, which is paramagnetic at room temperature, and did not isolate grains of Fe metal with highcertainty.
Similar to the experiments on Allende, we placed diamond D1 directly on the surface of the ALHA81001thin section. (In this case, however, no IRM was imparted to the sample prior to measurement.) Magneticfields due to remanent magnetization were imaged by VMM in a series of partially overlapping FOVs, eachwith area 1.5 mm 3 0.6 mm, with bias B0 5 1.44 mT oriented along unit vector (0.17 x 1 0.94 y 1 0.30 z ) in
Figure 2. QDM magnetic field maps of remanent magnetization and spatially correlated optical images of meteorites. (a) Reflected-light image (plane-polarized illumination) of a 30 mmthin section of a chondrule from the Allende CV3 chondrite. Mesostasis regions are outlined in red. (b) Magnetic map of the Bz (out-of-plane) component of the field distribution pro-duced by the sample, acquired in VMM and overlaid on the same reflected-light image. White arrow indicates a distortion of the field map due to a localized diamond defect. Suchdefects are fixed in the diamond volume and may be removed from the FOV by translating the sensor relative to the sample [as in Figure 2c]. (c) Comparison of (left) VMM and (right)CPMM field maps of the subregion of Figure 2b enclosed in the white box. The residual bias after field reversal (BðrÞ0 ) has been subtracted from the VMM map; the full bias (B0) has beensubtracted from the CPMM map. The resulting magnetic field images are qualitatively similar, but peak recorded field intensities differ by up to �10%, illustrating the need for indepen-dent calibration of CPMM. (d) Overlay of a Bz (out-of-plane) VMM magnetic field map and reflected light photomicrograph of a 30 mm thin section from the weakly magnetized eucriteALHA81001. The magnetic map is composed of four tiled and partially overlapping FOVs, with several small regions removed due to known strain defects in the diamond. The QDMdata have spatial resolution �5 mm and a noise floor of �20 nT RMS. (inset top left) Backscattered electron (BSE) image of a small region of the sample, overlaid with the QDM-acquiredBz map of the same region. The magnetic map was used to guide energy dispersive spectroscopy (EDS) analysis at select locations with strong magnetic sources, which found elementalabundances associated with chromite (white circles) and metallic iron (white square). (inset top center) Zoomed-in region of the QDM magnetic field image (with limits indicated by solidwhite box), demonstrating the spatial resolution of the instrument.
Geochemistry, Geophysics, Geosystems 10.1002/2017GC006946
GLENN ET AL. QUANTUM DIAMOND MICROSCOPE 7

the sensor coordinate system. We used a total averaging time of �4 3 104 s for each FOV, with an opticalexcitation intensity �106 W/m2 and imaging pixel size of (2.4 mm)2. Spatial filters were applied in postpro-cessing, including a 5 mm FWHM Gaussian low-pass to improve the signal-to-noise ratio (SNR), and a 200mm Butterworth high-pass to eliminate offsets in each FOV associated with our nonzero residual bias BðrÞ0 .After this procedure, we obtained a magnetic noise floor of �20 nT RMS, estimated by calculating the pixel-wise magnetic field standard deviation for image regions where no sources were present. The sharpestmagnetic features observed were on length scales of 5–10 mm and were not blurred significantly by filtering(Figure 2d, top center inset). To distinguish between features produced by sources within the sample andthose due to strain features or magnetic contaminants on the diamond surface, we rotated the diamond908 and repeated the measurement for each FOV (supporting information Figure S7). Spurious strain-induced patterns were manually removed from the image, resulting in several blank areas in the mapshown in the figure. These could be filled in by translating or rotating the diamond and measuring again,but were retained here for illustrative purposes. The measurement noise floor corresponds to an image-area-normalized magnetic field sensitivity of �20 mT�mm/Hz1/2 at long averaging times over a �1 mm2 FOV,which is typical VMM performance for the present QDM for diamonds D1 and D2 with NV layer thicknesstNV � 10 nm (supporting information Figure S8).
Guided by the high-resolution QDM magnetic maps, we identified three strongly magnetized locations inALHA81001 (Figure 2d, top left inset) for compositional analysis using energy dispersive spectroscopy (EDS).These measurements were performed on a Zeiss EVO 60 environmental scanning electron microscope(ESEM) at the American Museum of Natural History (AMNH). Although the �1 mm diameters of the grains ofinterest precluded quantitative measurements of composition, we found that magnetization is spatiallyassociated with (i) an Fe-bearing phase with no other transition metals or sulfur, interpreted to be Fe metal,and (ii) an Fe-Ni-Cr-bearing phase, interpreted to be nonstoichiometric chromite (supporting informationFigure S9). The identification of Fe metal is consistent with the >7008C Curie temperature observed duringthermal demagnetization [Fu et al., 2012]. Meanwhile, chromite in terrestrial rocks have been observed todemagnetize between 3008C and 4008C [Kumar et al., 1984], again consistent with the demagnetizationbehavior of ALHA81001. If this interpretation is correct, ALHA81001 would be the second achondrite afterthe martian orthopyroxenite ALH84001 where spatial correlation of magnetic field sources suggests chro-mite as a ferromagnetic carrier [Weiss et al., 2002]. Because our EDS characterization of the Fe-Ni-Cr-bearingphase lacks the spatial resolution necessary to quantify the composition, we cannot make a positive identifi-cation of chromite or rule out the possibility of unresolved, nanoscale intergrowths of, for example, Fe metalthat carry the observed magnetization. Future TEM-based work is required to address these ambiguities.Even so, a Fe-Ni-Cr-bearing phase likely crystallized during the primary cooling of ALHA81001 on its parentbody, as it is not consistent with terrestrial weathering products [Buchwald and Clark, 1989]. As such, ourQDM measurements provide further support for the extraterrestrial origin of magnetization on ALHA81001.
The QDM magnetic sensitivity demonstrated in our map of the ALHA81001 thin section can likely beimproved for many applications by increasing the NV layer thickness, tNV. The transverse spatial resolutionof the QDM is generally limited by the sensor-sample standoff distance ds-s, and the NV layer thickness canbe increased up to a significant fraction of ds-s without adversely affecting the resolution (supporting infor-mation Figure S10). Proposed QDM paleomagnetic imaging applications require spatial resolution of �1–100 mm to resolve ferromagnetic grain populations in a wide range of geological samples, suggesting thatthe thin NV layers of D1 and D2 (with tNV � 10 nm) should be replaced with thicker NV layers to enablemore sensitive detection. For example, a diamond with NV layer thickness tNV 5 10 mm and equal NV den-sity to a diamond with tNV � 10 nm will produce �103 times higher fluorescence at the same illuminationintensity, yielding an SNR improvement of �30 for photon shot-noise limited detection. Thick NV layer dia-monds can be produced by doping with high N concentration during the last stage of CVD growth, fol-lowed by electron irradiation and annealing to create NV centers. To date, we have tested one such thick-NV-layer diamond, D3, and applied it successfully to large-FOV magnetic imaging studies of zircons (see dis-cussion in section 3.4). We have yet to optimize the QDM for the high-throughput fluorescence collectionneeded to obtain maximum SNR improvement from thick-NV-layer diamonds when using smaller FOVs.
To achieve optimal spatial resolution and sensitivity in future QDM imaging applications, geological samplethickness, tsamp, will also be an important consideration. Because inversion of magnetic field maps to obtainvolume distributions of dipolar sources in the sample is in general an ill-posed problem, the highest
Geochemistry, Geophysics, Geosystems 10.1002/2017GC006946
GLENN ET AL. QUANTUM DIAMOND MICROSCOPE 8

confidence determination of magnetization distribution uses samples with large area relative to their thick-ness [Lima et al., 2013]. This requirement imposes a practical bound on QDM standoff distance and hencethe imaging resolution, ds-s tsamp. The sample thickness constraint is relevant to the ALHA81001 field
Figure 3. (continued)
Geochemistry, Geophysics, Geosystems 10.1002/2017GC006946
GLENN ET AL. QUANTUM DIAMOND MICROSCOPE 9

maps, where the QDM is most sensitive to sources in the top 5 mm. For the chosen QDM resolution, a muchthinner rock section would be preferable for unambiguous determination of sample magnetization.
3.3. Accuracy of Magnetic Field MeasurementsAbsolute accuracy of magnetic field maps is necessary for correct determination of sample remanence and forproper comparison of magnetic measurements made in different devices. When ODMR spectra are acquiredfor both the Dms 5 11 and Dms 5 21 transitions, the accuracy of the QDM is relatively insensitive to tempera-ture variations and other systematic effects that result in equal frequency shifts for the two resonances. Never-theless, the linearity of magnetic field-induced spectral line shifts may break down at small B0, when theZeeman term in the NV Hamiltonian becomes comparable to nuclear hyperfine couplings and strain [Dohertyet al., 2013; Barson et al., 2017; Felton et al., 2009]. We therefore calibrated the QDM by incorporating anadditional coil under the sample holder so as to produce uniform, well-defined fields perpendicular to thesensor surface (Figure 3a). Coil currents were driven using a diode laser driver and the coil geometry was pre-cisely measured in an optical microscope, such that the expected magnetic field could be calculated withuncertainty <1% (supporting information Figure S11). We first obtained calibration curves of measured Bz as afunction of applied current for PMM (Figure 3b) and VMM (Figure 3c) using diamond D4 at both high andlow bias fields (B0 5 18.6 mT and B0 5 1.6 mT, respectively). The measured slope agreed well with calculations(Figure 3d) to within the estimated uncertainty (grey band is 1 r in figure), except in the case of VMM at lowB0. This deviation was likely due to strain inhomogeneity over the imaged region, which can cause line shifts aslarge as �1 MHz in D4. The NV orientation with the smallest projection of B0 may experience a Zeeman shift ofonly a few MHz in low-bias VMM, such that strain significantly broadens and/or shifts the spin transition fre-quencies for this orientation (Figure 3d, inset). This is an important potential drawback of VMM at low B0.
Diamond strain and NV hyperfine effects may play an even greater role for CPMM imaging at low bias,B0< 0.2 mT. In this mode, we use only diamonds with NVs formed from 15N (nuclear spin I 5 1=2) implants,to avoid the spectral congestion and inhomogeneity associated with transitions involving mI 5 0 states (forwhich the absence of hyperfine coupling makes strain the dominant interaction) in NVs formed from 14N(I 5 1). Nevertheless, sensor calibration is still essential to extract accurate magnetic field values, as demon-strated in our measurements on diamond D2 (Figure 3e). We observed a strong deviation from linearity inthe QDM response for Bz � 112 mT, where the Zeeman and hyperfine energies are approximately equal,due to a transverse-strain-induced anticrossing between energies of the jms561;mI571ji states. In addi-tion, our spectral fitting algorithm was unable to determine independent line shape parameters for thetransitions near degeneracy, resulting in a gap in our calibration. A second deviation from linearity forBz< 20 mT (Figure 3e, bottom inset) could also be attributed to strain. Because these nonlinearities are dueto fixed material properties of the diamond chip, the calibration is repeatable (for a given FOV) and exact towithin the accuracy of the applied calibration field.
3.4. Reconfigurable Multiscale Imaging for Magnetic SurveysThe magnetic signal-to-noise ratio (SNR) of the QDM varies inversely with the laser excitation spot diameterin the shot-noise detection limit, for fixed laser power. It is therefore technically straightforward to alternatebetween rapid, wide-FOV magnetic mapping and targeted, sensitive acquisition in a small region of interest,
Figure 3. Absolute magnetic field calibration of the QDM. (a) QDM calibration setup schematic. A precisely characterized coil, placedbelow the diamond chip, generated known magnetic fields at the NV sensing layer. The ODMR signal was averaged over a 1.0 mm 3
0.5 mm FOV, and the resulting measured magnetic fields compared against the calculated coil field. (b) Magnetic field values obtained inPMM as a function of coil current, for both high bias (B0 5 18.6 mT, closed circles) and low bias (B0 5 1.6 mT, open circles). Linear fits to thedata (red lines) are consistent with the calculated fields (black dashed lines) for each current value. (c) Magnetic field values obtained inVMM as a function of coil current, for both high bias (B0 5 7.87 mT, closed triangles) and low bias (B0 5 1.37 mT, open triangles). A linear fitto the data (red lines) is consistent with the calculated fields (black dashed lines) for the high bias case, but differs by more than the esti-mated uncertainty in the calculation for the low bias case. (d) Summary of fit slopes from Figures 3b and 3c, normalized to the calculatedvalue. Grey band indicates uncertainty (1r) in the calculated slope. Error bars on the individual measured slopes are also 1r. (inset) Charac-teristic low-B0 VMM spectrum, with the innermost peaks (black arrows) broadened by transverse strain. (e) CPMM calibration, showingmeasured magnetic field versus expected field as calculated from the applied current. Black dashed line is the ideal calibration with unitslope; grey band indicates uncertainty in the calculation. Measurements (blue data points) differ significantly from the ideal curve due to atransverse strain-induced avoided crossing. (inset bottom right) Zoomed-in data for Bz< 10 mT. The measured magnetic field is nonzero atzero applied field due to a finite splitting induced by transverse strain. (inset top left) Calculated energy structure of the ms 6¼ 0 NV spinstates as a function of applied magnetic field for a nominal transverse strain parameter of 0.5 MHz (black curve), compared to the zero-strain case (dashed blue curve). Strain results in an avoided crossing, as well as a small additional splitting of the energies at zero magneticfield.
Geochemistry, Geophysics, Geosystems 10.1002/2017GC006946
GLENN ET AL. QUANTUM DIAMOND MICROSCOPE 10
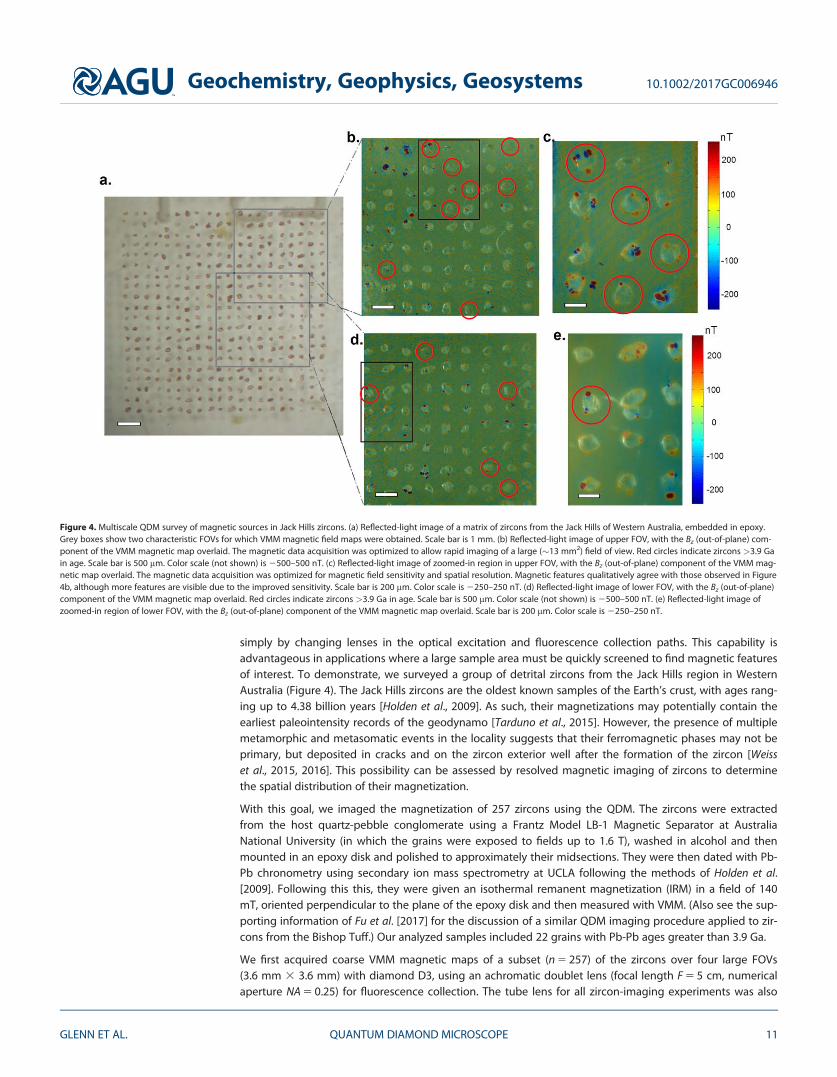
simply by changing lenses in the optical excitation and fluorescence collection paths. This capability isadvantageous in applications where a large sample area must be quickly screened to find magnetic featuresof interest. To demonstrate, we surveyed a group of detrital zircons from the Jack Hills region in WesternAustralia (Figure 4). The Jack Hills zircons are the oldest known samples of the Earth’s crust, with ages rang-ing up to 4.38 billion years [Holden et al., 2009]. As such, their magnetizations may potentially contain theearliest paleointensity records of the geodynamo [Tarduno et al., 2015]. However, the presence of multiplemetamorphic and metasomatic events in the locality suggests that their ferromagnetic phases may not beprimary, but deposited in cracks and on the zircon exterior well after the formation of the zircon [Weisset al., 2015, 2016]. This possibility can be assessed by resolved magnetic imaging of zircons to determinethe spatial distribution of their magnetization.
With this goal, we imaged the magnetization of 257 zircons using the QDM. The zircons were extractedfrom the host quartz-pebble conglomerate using a Frantz Model LB-1 Magnetic Separator at AustraliaNational University (in which the grains were exposed to fields up to 1.6 T), washed in alcohol and thenmounted in an epoxy disk and polished to approximately their midsections. They were then dated with Pb-Pb chronometry using secondary ion mass spectrometry at UCLA following the methods of Holden et al.[2009]. Following this this, they were given an isothermal remanent magnetization (IRM) in a field of 140mT, oriented perpendicular to the plane of the epoxy disk and then measured with VMM. (Also see the sup-porting information of Fu et al. [2017] for the discussion of a similar QDM imaging procedure applied to zir-cons from the Bishop Tuff.) Our analyzed samples included 22 grains with Pb-Pb ages greater than 3.9 Ga.
We first acquired coarse VMM magnetic maps of a subset (n 5 257) of the zircons over four large FOVs(3.6 mm 3 3.6 mm) with diamond D3, using an achromatic doublet lens (focal length F 5 5 cm, numericalaperture NA 5 0.25) for fluorescence collection. The tube lens for all zircon-imaging experiments was also
Figure 4. Multiscale QDM survey of magnetic sources in Jack Hills zircons. (a) Reflected-light image of a matrix of zircons from the Jack Hills of Western Australia, embedded in epoxy.Grey boxes show two characteristic FOVs for which VMM magnetic field maps were obtained. Scale bar is 1 mm. (b) Reflected-light image of upper FOV, with the Bz (out-of-plane) com-ponent of the VMM magnetic map overlaid. The magnetic data acquisition was optimized to allow rapid imaging of a large (�13 mm2) field of view. Red circles indicate zircons >3.9 Gain age. Scale bar is 500 mm. Color scale (not shown) is 2500–500 nT. (c) Reflected-light image of zoomed-in region in upper FOV, with the Bz (out-of-plane) component of the VMM mag-netic map overlaid. The magnetic data acquisition was optimized for magnetic field sensitivity and spatial resolution. Magnetic features qualitatively agree with those observed in Figure4b, although more features are visible due to the improved sensitivity. Scale bar is 200 mm. Color scale is 2250–250 nT. (d) Reflected-light image of lower FOV, with the Bz (out-of-plane)component of the VMM magnetic map overlaid. Red circles indicate zircons >3.9 Ga in age. Scale bar is 500 mm. Color scale (not shown) is 2500–500 nT. (e) Reflected-light image ofzoomed-in region of lower FOV, with the Bz (out-of-plane) component of the VMM magnetic map overlaid. Scale bar is 200 mm. Color scale is 2250–250 nT.
Geochemistry, Geophysics, Geosystems 10.1002/2017GC006946
GLENN ET AL. QUANTUM DIAMOND MICROSCOPE 11
an achromatic doublet, F 5 15 cm. Each FOV was acquired using pixel size (8.7 mm)2 and averaging time 1.83104 s, yielding a noise floor of �70 nT RMS. (Two of these FOVs are indicated in Figure 4a.) At this resolu-tion, 147 out of 257 of zircons mapped produced magnetic signals distinguishable from background,although 122 of these were due to sources distributed on the exterior surface of the zircon. To assign mag-netic features, coregistered magnetic and reflected-light images were overlaid and inspected visually (Fig-ures 4b and 4d). Magnetic sources were defined to be on the exterior of a zircon if the center of the dipolefield pattern fell within �20 mm of the boundary of that zircon in the reflected-light image. The mix of mag-netization directions observed from the zircon ferromagnetic sources is due to the combined effects ofstrong fields during magnetic separation and a weaker, 140 mT IRM in the out-of-plane direction.
We then changed to a higher magnification aspherized achromat lens (F 5 1.4 cm, NA 5 0.45) for light col-lection, and focused the excitation laser spot down to an area of 1.6 mm 3 1.2 mm. This allowed us tozoom in on smaller FOVs that contained a high fraction of zircons dated to >3.9 Ga. We acquired maps ofsix such FOVs using a pixel size of (3.6 mm)2 and averaging time of 1.8 3 104 s, resulting in a noise floor of�25 nT RMS. Field maps at the higher resolution were consistent with those of the original four large FOVs,but more magnetic features were visible due to the improved sensitivity and spatial resolution (Figures 4cand 4e). Of the 78 zircons measured under these conditions, 71 now had detectable magnetic signatures,with 52 of those clearly attributable to sources on the exterior of the zircon. These results contrast withour QDM study of young (767 ka) relatively unaltered zircons from the Bishop Tuff [Fu et al., 2017], whichfound that most of the magnetization is in the interior of the grains. Therefore, the present results empha-size that the natural remanent magnetization (NRM) in Jack Hills zircons [Tarduno et al., 2015] could be faryounger than their crystallization ages. In particular, because Tarduno [2015] measured the bulk NRM of zir-cons rather than imaging the NRM distribution, their data do not constrain where in the grains the magneti-zation carriers reside. A caveat is that these QDM data are images of IRM rather than NRM. In any case,these results also illustrate the flexibility of the QDM for imaging at different scales, from coarse surveys oflarge (�10–20 mm2) FOVs, to detailed maps of smaller FOVs (�1 mm2) with improved sensitivity, and hencebetter fidelity in detection of weak magnetic sources.
4. Conclusion
We constructed a new instrument, the quantum diamond microscope (QDM), for imaging magnetic fieldsfrom room-temperature geological samples with spatial resolution �5 mm. The QDM also provides opticalimages of the sample that are spatially correlated with the magnetic images. The device can be operated inthree modes, including (i) a vector (three-axis) magnetic imaging mode, (ii) a projective (single-axis) modeoptimized to improve magnetic field sensitivity by a factor of 2–3, and (iii) a single-axis mode using circu-larly polarized microwaves that allows operation at low bias B0< 10 mT. The first two modes (VMM andPMM) provide superior absolute accuracy in magnetic field estimation (�1% without calibration), particu-larly at B0> 10 mT, but rely on precise bias reversal (with BðrÞ0 < 0.1 mT) to distinguish between paramagneticand ferromagnetic sources. The third mode (CPMM) avoids the bias-reversal constraint by operating at lowambient field, but requires careful calibration to account for strain-induced shifts in the NV ODMR spectra.The typical image-area-normalized magnetic field sensitivity of the present QDM is �20 mT�mm/Hz1/2 for a1 mm 3 1 mm FOV, and scales linearly with the diameter of the FOV for fixed laser power. The best demon-strated noise floor is �20 nT RMS. We recently began to work with diamond chips that possess considerablythicker NV layers than were previously available (�10 mm rather than �10 nm), which are expected to pro-vide a sensitivity improvement of �303 with the implementation of a faster camera and data acquisitionsystem. We used the QDM to image magnetic fields from a variety of magnetically heterogeneous rocksamples, and confirmed that we can distinguish populations of ferromagnetic carriers separated by <10mm. In particular, QDM imaging shows that magnetization carriers in ancient zircon crystals from the JackHills of Western Australia are largely confined to the exteriors of most grains, suggesting that their ferro-magnetic minerals are secondary in origin and therefore that they do not retain pristine records of the earli-est history of the dynamo.
A number of technical improvements are planned for future QDM systems, including (i) tools for rapid sam-ple exchange and alignment, to increase measurement throughput and facilitate QDM imaging inter-spersed with multiple rounds of AF or thermal demagnetization, (ii) improved heatsinking and thermal
Geochemistry, Geophysics, Geosystems 10.1002/2017GC006946
GLENN ET AL. QUANTUM DIAMOND MICROSCOPE 12

stabilization, enabling the use of higher laser power for better QDM sensitivity, and (iii) development ofmicron-scale magnetic standard samples, to allow quantitative comparison between QDM magnetic mapsand those obtained in other instruments at different standoff distances.
ReferencesAcosta, V. M., A. Jarmola, E. Bauch, and D. Budker (2010), Optical properties of the nitrogen-vacancy singlet levels in diamond, Phys. Rev. B,
82, 201,202, doi:10.1103/PhysRevB.82.201202.Alegre, T. P. M., C. Santori, G. Medeiros-Ribeiro, and R. G. Beausoleil (2007), Polarization-selective excitation of nitrogen vacancy centers in
diamond, Phys. Rev. B, 76, 165,205, doi:10.1103/PhysRevB.76.165205.Barson, M. S. J., et al. (2017), Nanomechanical sensing using spins in diamond, Nano Lett., 17, 1496–1503, doi:10.1021/acs.nanolett.6b04544.Brearley, A. J., and A. Krot (2012), Metasomatism in the early solar system: The record from chondritic meteorites, in Metasomatism and the
Chemical Transformation of Rock, Lecture Notes in Earth System Sciences, edited by D. E. Harlov and H. Austrheim, pp. 659–789, Springer,Berlin, Heidelberg, doi:10.1007/978-3-642-28394-9_15.
Buchwald, V. F., and R. S. Clark (1989), Corrosion of Fe-Ni alloys by Cl-containing akaganeite (beta-FeOOH): The Antarctic meteorite case,Am. Mineral., 74, 656–667.
Carporzen, L., B. P. Weiss, L. Elkins-Tanton, D. L, Shuster, D. S. Ebel, and J. Gattacceca (2011), Magnetic evidence for a partially differentiatedcarbonaceous chondrite parent body, Proc. Natl. Acad. Sci. U.S.A., 108, 6386–6389, doi:10.1073/pnas.1017165108.
Doherty, M. W., N. B. Manson, P. Delaney, F. Jelezko, J. Wrachtrup, and L. C. L. Hollenberg (2013), The nitrogen-vacancy center in diamond,Phys. Rep., 528, 1–45, doi:10.1016/j.physrep.2013.02.001.
Felton, S., A. M. Edmonds, M. E. Newton, P. M. Martineau, D. Fisher, D. J. Twitchen, and J. M. Baker (2009), Hyperfine interaction in theground state of the negatively charged nitrogen vacancy center in diamond, Phys. Rev. B, 79, 075203, doi:10.1103/PhysRevB.79.075203.
Fischer, R., A. Jarmola, P. Kehayias, and D. Budker (2013), Optical polarization of nuclear ensembles in diamond, Phys. Rev. B, 87, 125,207,doi:10.1103/PhysRevB.87.125207.
Fu, R. R., B. P. Weiss, D. L. Shuster, J. Gattacceca, T. L. Grove, C. Sauvet, E. A. Lima, L. Li, and A. T. Kuan (2012), An ancient core dynamo inasteroid vesta, Science, 338, 238–241, doi:10.1126/science.1225648.
Fu, R. R., et al. (2014a), Solar nebula magnetic fields recorded in the Semarkona meteorite, Science, 346, 1089–1092, doi:10.1126/science.1258022.
Fu, R. R., E. A. Lima, and B. P. Weiss (2014b), No nebular magnetization in the Allende CV carbonaceous chondrite, Earth Planet. Sci. Lett.,404, 54–56, doi:10.1016/j.epsl.2014.07.014.
Fu, R. R., et al. (2017), Evaluating the paleomagnetic potential of single zircon crystals using the Bishop Tuff, Earth Planet. Sci. Lett., 458,1–13, doi:10.1016/j.epsl.2016.09.038.
Glenn, D.R., K. Lee, H. Park, R. Weissleder, A. Yacoby, M. D. Lukin, H. Lee, R. L. Walsworth, and C. B. Connolly (2015), Single-cell magneticimaging using a quantum diamond microscope, Nat. Methods, 12, 736–738, doi:10.1038/nmeth.3449.
Gruber, A., A. Draebenstedt, C. Tietz, L. Fleury, J. Wrachtrup, and C. von Borczyskowski (1997), Scanning confocal optical microscopy andmagnetic resonance on single defect centers, Science, 276, 2012–2014, doi:10.1126/science.276.5321.2012.
Hankard, F., J. Gattacceca, C. Fermon, M. Pannetier-Lecoeur, B. Langlais, Y. Quesnel, P. Rochette, and S. A. McEnroe (2009), Magnetic fieldmicroscopy of rock samples using a giant magnetoresistance-based scanning magnetometer, Geochem. Geophys. Geosyst., 10, Q10Y06,doi:10.1029/2009GC002750.
Holden, P., P. Lanc, T. R. Ireland, T. M. Harrison, J. J. Foster, and Z. Bruce (2009), Mass-spectrometric mining of Hadean zircons by automatedSHRIMP multi-collector and single-collector U/Pb zircon age dating: The first 100,000 grains, Int. J. Mass Spectrom., 286, 53–63, doi:10.1016/j.ijms.2009.06.007.
Kawai, J., H. Oda, J. Fujihira, M. Miyamoto, I. Miyagi, and M. Sato (2016), SQUID microscope with hollow-structured cryostat for magneticfield imaging of room temperature samples, IEEE Trans. Appl. Supercond., 26, 1600,905, doi:10.1109/TASC.2016.2536751.
Kent, D. V., X. S. Zeng, W. Y. Zhang, and N. D. Opdyke (1987), Widespread late Mesozoic to Recent remagnetization of Paleozoic and lowerTriassic sedimentary rocks from South China, Tectonophysics, 139, 133, doi:10.1016/0040-1951(87)90202-2.
Kletetschka, G., P. Schnabl, K. �Sifnerov�a, Z. Tas�aryova, �S. Manda, and P. Pruner (2013), Magnetic scanning and interpretation of paleomag-netic data from Prague Synform’s volcanics, Stud. Geophys. Geod., 57, 103–117, doi:10.1007/s11200-012-0723-4.
Kumar, A., and M. S. Bhalla (1984), Source of stable remanence in chromite ores, Geophys. Res. Lett., 11, 177–180, doi:10.1029/GL011i003p00177.Lanoix, M., D. W. Strangway, and G. W. Pearce (1978), The primordial magnetic field preserved in chondrules of the Allende meteorite, Geo-
phys. Res. Lett., 5, 73–76, doi:10.1029/GL005i001p00073.Le Sage, D., K. Arai, D. R. Glenn, S. J. Devience, L. M. Pham, L. Rahn-Lee, M. D. Lukin, A. Yacoby, A. Komeili, and R. L. Walsworth (2013), Opti-
cal magnetic imaging of living cells, Nature, 496, 486–489, doi:10.1038/nature12072.Lima, E. A., B. P. Weiss, L. Baratchart, D. P. Hardin, and E. B. Saff (2013), Fast inversion of magnetic field maps of unidirectional planar geo-
logical magnetization, J. Geophys. Res., 118, 2723–2752, doi:10.1002/jgrb.50229.Lima, E. A., A. C. Bruno, H. R. Carvalho, and B. P. Weiss (2014), Scanning magnetic tunnel junction microscope for high-resolution imaging
of remanent magnetization fields, Meas. Sci. Technol., 25, 105,401, doi:10.1088/0957-0233/25/10/105401.Maurer, P. C., et al. (2010), Far-field optical imaging and manipulation of individual spins with nanoscale resolution, Nat. Phys., 6, 912–918,
doi:10.1038/NPHYS1774.Nakamura, N., K. Okuno, M. Uehara, T. Ozawa, L. Tatsumi-Petrocholis, and M. Fuller (2010), Coarse-grained magnetites in biotite as a possi-
ble stable remanence-carrying phase in Vredefort granites, Geol. Soc. Am. Spec. Pap., 465, 165–172, doi:10.1130/2010.2465(11).Pham, L. M., et al. (2011), Magnetic field imaging with nitrogen-vacancy ensembles, New J. Phys., 13, 045021, doi:10.1088/1367-2630/13/4/
045021.Robledo, L., H. Bernien, T. van der Sar, and R. Hanson (2011), Spin dynamics in the optical cycle of single nitrogen-vacancy centres in dia-
mond, New J. Phys., 13, 025013, doi:10.1088/1367-2630/13/2/025013.Rochette, P., L. Sagnotti, M. Bournot-Denise, G. Consolmagno, L. Folco, J. Gattacceca, M. L. Osete, and L. Pesonen (2003), Magnetic classifi-
cation of stony meteorites: 1. Ordinary chondrites, Meteorit. Planet. Sci., 38, 1–18, doi:10.1111/j.1945-5100.2003.tb00263.x.Rondin, L., J.-P. Tetienne, T. Hingant, J.-F. Roch, P. Maletinsky, and V. Jacques (2014), Magnetometry with nitrogen-vacancy defects in dia-
mond, Rep. Prog. Phys., 77, 056503, doi:10.1088/0034-4885/77/5/056503.Schirhagl, R., K. Chang, M. Loretz, and C. L. Degen (2014), Nitrogen-vacancy centers in diamond: Nanoscale sensors for physics and biology,
Annu. Rev. Phys. Chem., 65, 83–105, doi:10.1146/annurev-physchem-040513-103659.
AcknowledgmentsWe thank the NASA Emerging Worldsand NASA Planetary Major Equipmentprograms (grant NNX15AH72G), theNSF Integrated Support PromotingInterdisciplinary Research andEducation (INSPIRE) program (grantEAR 1647504), the NSF Electronics,Photonics and Magnetic Devices(EPMD) program (grant 1408075), andthe DARPA Quantum Assisted SensingAnd Readout (QuASAR) program(contract HR0011-11-C-0073) forsupport. P.K. acknowledges supportfrom the IC Postdoctoral ResearchFellowship Program. B.P.W., E.A.L., andR.R.F. thank Thomas F. Peterson Jr. fora generous gift. We also thank T.M.Harrison for providing the Jack Hillszircons used for QDM imaging. Datapresented in this work are included ina zip archive in supporting informationsection S12. Magnetic field andreflected-light images acquired in theQDM are provided in .csv format; highresolution reflected-light imagesacquired in other instruments areprovided as .tif images.
Geochemistry, Geophysics, Geosystems 10.1002/2017GC006946
GLENN ET AL. QUANTUM DIAMOND MICROSCOPE 13

Sugiura, N., and D. W. Strangway (1985), NRM directions around a centimetersized dark inclusion in Allende, J. Geophys. Res., 90,C729–C738.
Swanson-Hysell, N. L., A. C. Maloof, J. L. Kirschvink, D. A. D. Evans, G. P. Halversong, and M. T. Hurtgen (2012), Constraints on Neoproterozoicpaleogeography and Paleozoic orogenesis from paleomagnetic records of the Bitter Springs Formation, Amadeus Basin, central Austra-lia, Am. J. Sci., 312, 817–884, doi:10.2475/08.2012.01.
Tarduno, J. A., R. D. Cottrell, W. J. Davis, F. Nimmo, and R. K. Bono (2015), A Hadean to Paleoarchean geodynamo recorded by single zirconcrystals, Science, 349, 521–524, doi:10.1126/science.aaa9114.
Tauxe, L. (2010), Essentials of Paleomagnetism, Univ. of Calif. Press, Berkeley, Calif.Uehara, M., C. J. Van Der Beek, J. Gattacceca, V. A. Skidanov, and Y. Quesnel (2010), Advances in magneto-optical imaging applied to rock
magnetism and paleomagnetism, Geochem. Geophys. Geosyst., 11, Q05Y09, doi:10.1029/2009GC002653.Weiss, B. P., H. Vali, F. J. Baudenbacher, J. L. Kirschvink, S. T. Stewart, and D. L. Shuster (2002), Records of an ancient Martian magnetic field
in ALH84001, Earth Planet. Sci. Lett., 201, 449–463, doi:10.1016/S0012-821X(02)00728-8.Weiss, B. P., E. A. Lima, L. E. Fong, and F. J. Baudenbacher (2007), Paleomagnetic analysis using SQUID microscopy, J. Geophys. Res., 112,
B09105, doi:10.1029/2007JB004940.Weiss, B. P., et al. (2015), Pervasive remagnetization of detrital zircon host rocks in the Jack Hills, Western Australia and implications for
records of the early geodynamo, Earth Planet. Sci. Lett., 430, 115–128, doi:10.1016/j.epsl.2015.07.067.Weiss, B. P., A. C. Maloof, T. M. Harrison, N. L. Swanson-Hysell, R. R. Fu, J. L. Kirschvink, E. B. Watson, R. S. Coe, S. M. Tikoo, and J. Ramezani
(2016), Reply to Comment on ‘‘Pervasive remagnetization of detrital zircon host rocks in the Jack Hills, Western Australia and implica-tions for records of the early geodynamo’’, Earth Planet. Sci. Lett., 450, 409–412, doi:10.1016/j.epsl.2016.06.006.
Geochemistry, Geophysics, Geosystems 10.1002/2017GC006946
GLENN ET AL. QUANTUM DIAMOND MICROSCOPE 14