Micromechanical analysis of strain rate-dependent ... analysis of strain rate-dependent deformation...
30
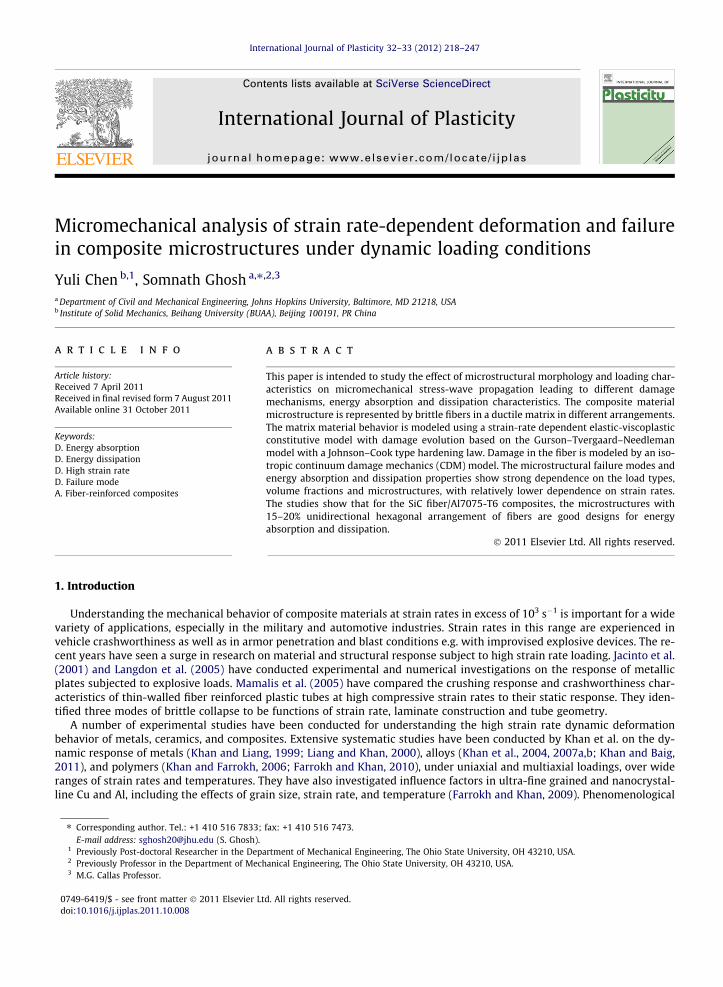
Micromechanical analysis of strain rate-dependent deformation and failure in composite microstructures under dynamic loading conditions Yuli Chen b,1 , Somnath Ghosh a,⇑,2,3 a Department of Civil and Mechanical Engineering, Johns Hopkins University, Baltimore, MD 21218, USA b Institute of Solid Mechanics, Beihang University (BUAA), Beijing 100191, PR China article info Article history: Received 7 April 2011 Received in final revised form 7 August 2011 Available online 31 October 2011 Keywords: D. Energy absorption D. Energy dissipation D. High strain rate D. Failure mode A. Fiber-reinforced composites abstract This paper is intended to study the effect of microstructural morphology and loading char- acteristics on micromechanical stress-wave propagation leading to different damage mechanisms, energy absorption and dissipation characteristics. The composite material microstructure is represented by brittle fibers in a ductile matrix in different arrangements. The matrix material behavior is modeled using a strain-rate dependent elastic-viscoplastic constitutive model with damage evolution based on the Gurson–Tvergaard–Needleman model with a Johnson–Cook type hardening law. Damage in the fiber is modeled by an iso- tropic continuum damage mechanics (CDM) model. The microstructural failure modes and energy absorption and dissipation properties show strong dependence on the load types, volume fractions and microstructures, with relatively lower dependence on strain rates. The studies show that for the SiC fiber/Al7075-T6 composites, the microstructures with 15–20% unidirectional hexagonal arrangement of fibers are good designs for energy absorption and dissipation. Ó 2011 Elsevier Ltd. All rights reserved. 1. Introduction Understanding the mechanical behavior of composite materials at strain rates in excess of 10 3 s 1 is important for a wide variety of applications, especially in the military and automotive industries. Strain rates in this range are experienced in vehicle crashworthiness as well as in armor penetration and blast conditions e.g. with improvised explosive devices. The re- cent years have seen a surge in research on material and structural response subject to high strain rate loading. Jacinto et al. (2001) and Langdon et al. (2005) have conducted experimental and numerical investigations on the response of metallic plates subjected to explosive loads. Mamalis et al. (2005) have compared the crushing response and crashworthiness char- acteristics of thin-walled fiber reinforced plastic tubes at high compressive strain rates to their static response. They iden- tified three modes of brittle collapse to be functions of strain rate, laminate construction and tube geometry. A number of experimental studies have been conducted for understanding the high strain rate dynamic deformation behavior of metals, ceramics, and composites. Extensive systematic studies have been conducted by Khan et al. on the dy- namic response of metals (Khan and Liang, 1999; Liang and Khan, 2000), alloys (Khan et al., 2004, 2007a,b; Khan and Baig, 2011), and polymers (Khan and Farrokh, 2006; Farrokh and Khan, 2010), under uniaxial and multiaxial loadings, over wide ranges of strain rates and temperatures. They have also investigated influence factors in ultra-fine grained and nanocrystal- line Cu and Al, including the effects of grain size, strain rate, and temperature (Farrokh and Khan, 2009). Phenomenological 0749-6419/$ - see front matter Ó 2011 Elsevier Ltd. All rights reserved. doi:10.1016/j.ijplas.2011.10.008 ⇑ Corresponding author. Tel.: +1 410 516 7833; fax: +1 410 516 7473. E-mail address: [email protected] (S. Ghosh). 1 Previously Post-doctoral Researcher in the Department of Mechanical Engineering, The Ohio State University, OH 43210, USA. 2 Previously Professor in the Department of Mechanical Engineering, The Ohio State University, OH 43210, USA. 3 M.G. Callas Professor. International Journal of Plasticity 32–33 (2012) 218–247 Contents lists available at SciVerse ScienceDirect International Journal of Plasticity journal homepage: www.elsevier.com/locate/ijplas
Transcript of Micromechanical analysis of strain rate-dependent ... analysis of strain rate-dependent deformation...
International Journal of Plasticity 32–33 (2012) 218–247
Contents lists available at SciVerse ScienceDirect
International Journal of Plasticity
journal homepage: www.elsevier .com/locate / i jp las
Micromechanical analysis of strain rate-dependent deformation and failurein composite microstructures under dynamic loading conditions
Yuli Chen b,1, Somnath Ghosh a,⇑,2,3
a Department of Civil and Mechanical Engineering, Johns Hopkins University, Baltimore, MD 21218, USAb Institute of Solid Mechanics, Beihang University (BUAA), Beijing 100191, PR China
a r t i c l e i n f o
Article history:Received 7 April 2011Received in final revised form 7 August 2011Available online 31 October 2011
Keywords:D. Energy absorptionD. Energy dissipationD. High strain rateD. Failure modeA. Fiber-reinforced composites
749-6419/$ - see front matter � 2011 Elsevier Ltoi:10.1016/j.ijplas.2011.10.008
⇑ Corresponding author. Tel.: +1 410 516 7833;E-mail address: [email protected] (S. Ghosh).
1 Previously Post-doctoral Researcher in the Dep2 Previously Professor in the Department of Mech3 M.G. Callas Professor.
a b s t r a c t
This paper is intended to study the effect of microstructural morphology and loading char-acteristics on micromechanical stress-wave propagation leading to different damagemechanisms, energy absorption and dissipation characteristics. The composite materialmicrostructure is represented by brittle fibers in a ductile matrix in different arrangements.The matrix material behavior is modeled using a strain-rate dependent elastic-viscoplasticconstitutive model with damage evolution based on the Gurson–Tvergaard–Needlemanmodel with a Johnson–Cook type hardening law. Damage in the fiber is modeled by an iso-tropic continuum damage mechanics (CDM) model. The microstructural failure modes andenergy absorption and dissipation properties show strong dependence on the load types,volume fractions and microstructures, with relatively lower dependence on strain rates.The studies show that for the SiC fiber/Al7075-T6 composites, the microstructures with15–20% unidirectional hexagonal arrangement of fibers are good designs for energyabsorption and dissipation.
� 2011 Elsevier Ltd. All rights reserved.
1. Introduction
Understanding the mechanical behavior of composite materials at strain rates in excess of 103 s�1 is important for a widevariety of applications, especially in the military and automotive industries. Strain rates in this range are experienced invehicle crashworthiness as well as in armor penetration and blast conditions e.g. with improvised explosive devices. The re-cent years have seen a surge in research on material and structural response subject to high strain rate loading. Jacinto et al.(2001) and Langdon et al. (2005) have conducted experimental and numerical investigations on the response of metallicplates subjected to explosive loads. Mamalis et al. (2005) have compared the crushing response and crashworthiness char-acteristics of thin-walled fiber reinforced plastic tubes at high compressive strain rates to their static response. They iden-tified three modes of brittle collapse to be functions of strain rate, laminate construction and tube geometry.
A number of experimental studies have been conducted for understanding the high strain rate dynamic deformationbehavior of metals, ceramics, and composites. Extensive systematic studies have been conducted by Khan et al. on the dy-namic response of metals (Khan and Liang, 1999; Liang and Khan, 2000), alloys (Khan et al., 2004, 2007a,b; Khan and Baig,2011), and polymers (Khan and Farrokh, 2006; Farrokh and Khan, 2010), under uniaxial and multiaxial loadings, over wideranges of strain rates and temperatures. They have also investigated influence factors in ultra-fine grained and nanocrystal-line Cu and Al, including the effects of grain size, strain rate, and temperature (Farrokh and Khan, 2009). Phenomenological
d. All rights reserved.
fax: +1 410 516 7473.
artment of Mechanical Engineering, The Ohio State University, OH 43210, USA.anical Engineering, The Ohio State University, OH 43210, USA.
0d
Y. Chen, S. Ghosh / International Journal of Plasticity 32–33 (2012) 218–247 219
constitutive models have been proposed based on these comprehensive experimental studies, including the KHL model(Khan and Liang, 1999) and the KLF model (Farrokh and Khan, 2009). The compressive response of metals has been studiedin (Nemat-Nasser et al., 2005a,b; Nemat-Nasser and Choi, 2005). Porous NiTi shape-memory alloys have been investigated atdifferent strain rates in (Nemat-Nasser et al., 2005c), where the transition stress for stress-induced martensite formation isfound to reach the yield stress of the austenite phase at a critical strain-rate level. This suggests two different micromech-anisms of deformation of this alloy under high and low strain rates. Valiev et al. (1997) have observed high strain rate super-plasticity in commercial aluminum alloys with ultrafine grain sizes and have reported different stress–strain behavior atdifferent strain rates. Benallal et al. (2008) have investigated negative strain-rate sensitivity in the aluminum alloyAA5083, a phenomenon that has been also observed in recent room temperature experimental studies on the aluminum al-loy AA5182-O by Khan and Baig (2011). Brar et al. (2009) have studied the mechanical response of Aluminum 7075-T651 and7075-T6 alloys at quasi-static and high strain rates and have inferred that while strength does not show much variation, thefracture properties do exhibit a large variation with strain rates. Meyers et al. (1995) have experimentally observed similarresponse of copper at low- and high-strain-rates. Grain-size is found to have a profound effect on the mechanical responsesuggesting the dependence of shock response on the microstructure. For ceramics, Kanel et al. (2009) have discussed threedifferent experimental configurations, a layered target assembly, a pre-stressed target plate, and a convex flyer plate, fordiagnosing the modes of inelastic deformation and evaluating the failure thresholds at shock compression. Various highstrain response studies have been conducted for composite materials as well. Experimental studies include those by Kumarand Garg (1988), who have tested unidirectional glass–epoxy composite under dynamic compressive loading conditions tostudy the effect of fiber orientations on failure modes. They have found that fiber orientations have significant influence onthe failure modes. Oguni and Ravichandran (2001) have examined rate dependent behavior in their experiments on E-glass/vinylester composites, showing that the compressive strength increases with strain rate.
A number of theoretical and numerical models have also been developed on high strain-rate material deformation andfailure response. For metals, well known models that are currently used include the Johnson and Cook (1983) model, Stein-berg–Cochran–Guinan–Lund model (Steinberg et al., 1980; Steinberg and Lund, 1988), Zerilli and Armstrong (1987) model,mechanical threshold-stress model by Follansbee and Kocks (1988), Preston et al. (2003) model, the nonlocal gradient-en-hanced visco-inelasticity model (Abu Al-Rub and Voyiadjis, 2006; Voyiadjis and Abu Al-Rub, 2006), as well as the KHL model(Khan and Liang, 1999) and KLF model (Farrokh and Khan, 2009), among others. For modeling high strain rate behavior ofcomposites, Zhou et al. (2005) have combined the shear-lag model and Monte Carlo simulation technique to simulate highstrain rate tensile failure process of unidirectional SiC fiber-reinforced metal-matrix composites. Batra and Hassan (2007)have developed a three-dimensional finite element model with rate-dependent damage evolution equations to ascertaindamage due to fiber/matrix debonding, fiber breakage, matrix cracking, and delamination in fiber-reinforced compositesin underwater explosions. Recently Brünig and Gerke (2011) have developed a set of constitutive equations for large rate-dependent elastic–plastic-damage materials. This model is based on the concepts of continuum damage mechanics, and isable to analyze adiabatic, high strain rate dependent deformation processes for a wide range of stress triaxialities. For poly-crystalline metals and alloys subjected to very high rates of deformation (104–108 s�1), Austin and McDowell (2011) havedeveloped a physically-based model based on physical descriptions of slip resistance and the plastic flow rate, where mobileand immobile dislocation densities are assigned as path dependent internal state variables.
The present paper is aimed at developing a three-dimensional finite deformation computational model for investigatingthe microstructural mechanisms of deformation and damage in fiber-reinforced metal-matrix composites subjected to highstrain rate loading conditions �103–105 s�1. The microstructures considered, consist of an elastic fiber phase that undergoesbrittle damage and a rate-dependent plastic matrix phase that is assumed to undergo ductile failure by nucleation, growthand coalescence of microscopic voids. Brittle damage in the fiber is modeled by a scalar continuum damage mechanics(CDM) model, while ductile fracture in the matrix is modeled by the Gurson, Tvergaard and Needleman or GTN model (Gur-son, 1977; Tvergaard, 1990; Chu and Needleman, 1980; Tvergaard and Needleman, 1984) thataccounts for damage accumu-lation due to shearing in (Nahshon and Hutchinson, 2008; Nahshon and Xue, 2009; Xue et al., 2010). The GTN model isaugmented with a rate dependent plastic behavior for the pure matrix phase through the Johnson–Cook model (Johnsonand Cook, 1983) representation that is widely used in high-strain-rate deformation of many metallic materials. A focus ofthis paper is on the effect of microstructural morphology and loading characteristics on micromechanical stress-wave prop-agation leading to different damage mechanisms. The study also has important implications in the energy absorption anddissipation at high strain rates. The paper begins with a development of the micro-mechanical model, including the repre-sentative volume element (RVE) model with associated boundary conditions, the constitutive models for both the fiber andthe matrix phases, and its numerical implementation. Simulations are subsequently done to investigate the damage and fail-ure mechanisms as well as the influence factors on the failure modes and the ability of energy absorption and dissipation.
2. Model of the microstructural representative volume element
The microstructural representative volume element (RVE), a small micro-region for which the volume average of vari-ables are the same as those for the entire body (Drugan and Willis, 1996; Kouznetsova et al., 2002; Kanit et al., 2003; Khanet al., 2004; Peng et al., 2008; Jain and Ghosh, 2009), is essential for the determination of effective material properties byhomogenization. It generally depends on the material property of interest and can vary significantly from one class of
220 Y. Chen, S. Ghosh / International Journal of Plasticity 32–33 (2012) 218–247
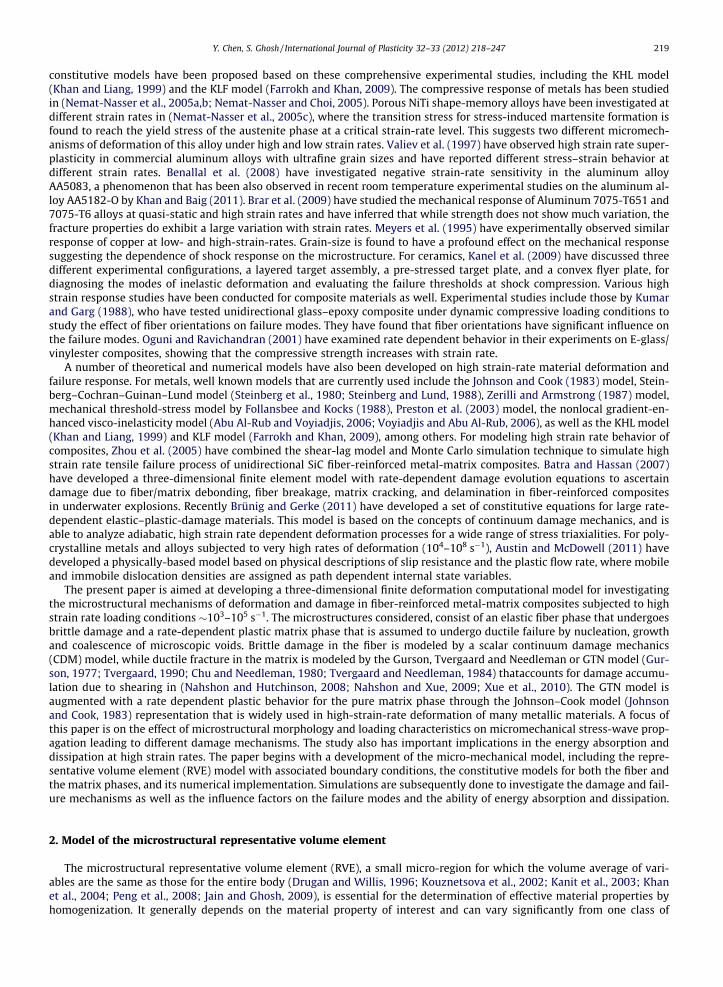
properties to another (Swaminathan et al., 2006; Swaminathan and Ghosh, 2006). Conventionally, studies have been con-ducted with the RVE represented by a unit cell consisting of a single heterogeneity in a uniform matrix as shown in Fig. 1e.g. (Lee and Mal, 1998; Jain and Ghosh, 2009). The underlying assumptions are that the microstructure depicts a uniform,periodically repetitive array of heterogeneities and the body is subjected to homogeneous boundary conditions.
2.1. The RVE domain and boundary conditions
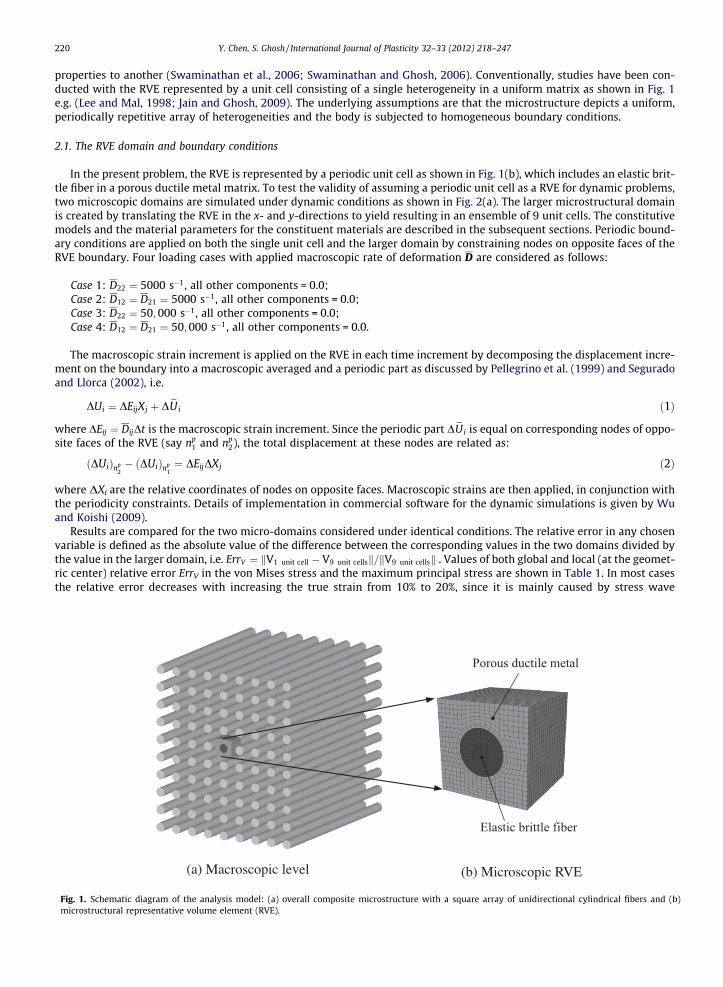
In the present problem, the RVE is represented by a periodic unit cell as shown in Fig. 1(b), which includes an elastic brit-tle fiber in a porous ductile metal matrix. To test the validity of assuming a periodic unit cell as a RVE for dynamic problems,two microscopic domains are simulated under dynamic conditions as shown in Fig. 2(a). The larger microstructural domainis created by translating the RVE in the x- and y-directions to yield resulting in an ensemble of 9 unit cells. The constitutivemodels and the material parameters for the constituent materials are described in the subsequent sections. Periodic bound-ary conditions are applied on both the single unit cell and the larger domain by constraining nodes on opposite faces of theRVE boundary. Four loading cases with applied macroscopic rate of deformation D are considered as follows:
Case 1: D22 ¼ 5000 s�1, all other components = 0.0;Case 2: D12 ¼ D21 ¼ 5000 s�1, all other components = 0.0;Case 3: D22 ¼ 50; 000 s�1, all other components = 0.0;Case 4: D12 ¼ D21 ¼ 50;000 s�1, all other components = 0.0.
The macroscopic strain increment is applied on the RVE in each time increment by decomposing the displacement incre-ment on the boundary into a macroscopic averaged and a periodic part as discussed by Pellegrino et al. (1999) and Seguradoand Llorca (2002), i.e.
Fig. 1micro
DUi ¼ DEijXj þ DeUi ð1Þ
where DEij ¼ DijDt is the macroscopic strain increment. Since the periodic part DeUi is equal on corresponding nodes of oppo-site faces of the RVE (say np
1 and np2), the total displacement at these nodes are related as:
ðDUiÞnp2� ðDUiÞnp
1¼ DEijDXj ð2Þ
where DXi are the relative coordinates of nodes on opposite faces. Macroscopic strains are then applied, in conjunction withthe periodicity constraints. Details of implementation in commercial software for the dynamic simulations is given by Wuand Koishi (2009).
Results are compared for the two micro-domains considered under identical conditions. The relative error in any chosenvariable is defined as the absolute value of the difference between the corresponding values in the two domains divided bythe value in the larger domain, i.e. ErrV ¼ V1 unit cell � V9 unit cellsk k V9 unit cellsk k= . Values of both global and local (at the geomet-ric center) relative error ErrV in the von Mises stress and the maximum principal stress are shown in Table 1. In most casesthe relative error decreases with increasing the true strain from 10% to 20%, since it is mainly caused by stress wave
(a) Macroscopic level (b) Microscopic RVE
. Schematic diagram of the analysis model: (a) overall composite microstructure with a square array of unidirectional cylindrical fibers and (b)structural representative volume element (RVE).
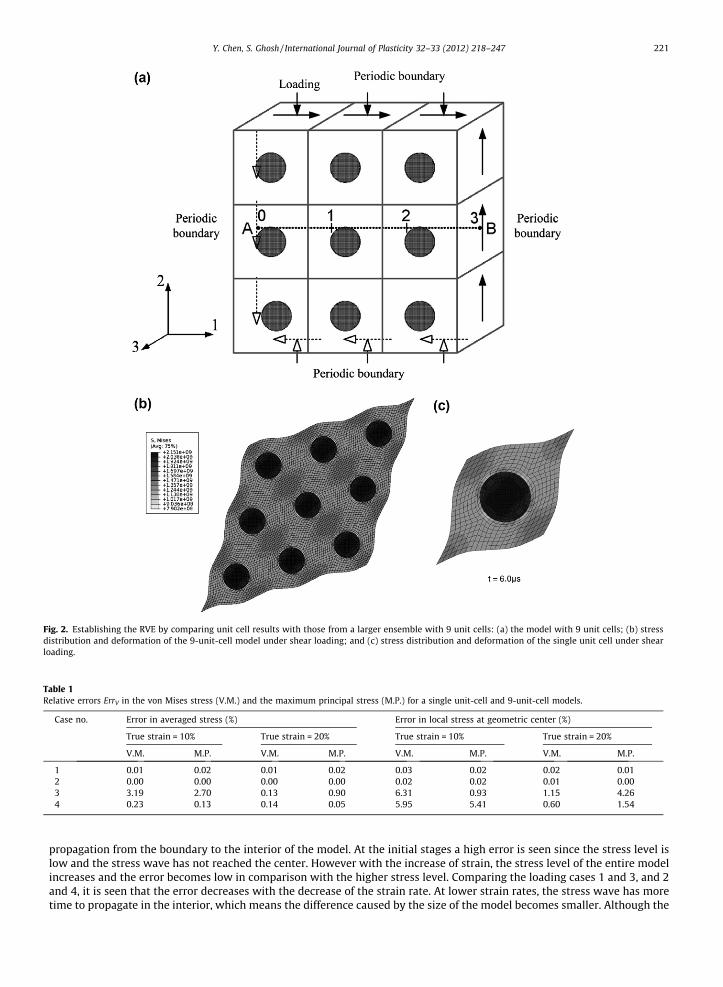
Fig. 2. Establishing the RVE by comparing unit cell results with those from a larger ensemble with 9 unit cells: (a) the model with 9 unit cells; (b) stressdistribution and deformation of the 9-unit-cell model under shear loading; and (c) stress distribution and deformation of the single unit cell under shearloading.
Table 1Relative errors ErrV in the von Mises stress (V.M.) and the maximum principal stress (M.P.) for a single unit-cell and 9-unit-cell models.
Case no. Error in averaged stress (%) Error in local stress at geometric center (%)
True strain = 10% True strain = 20% True strain = 10% True strain = 20%
V.M. M.P. V.M. M.P. V.M. M.P. V.M. M.P.
1 0.01 0.02 0.01 0.02 0.03 0.02 0.02 0.012 0.00 0.00 0.00 0.00 0.02 0.02 0.01 0.003 3.19 2.70 0.13 0.90 6.31 0.93 1.15 4.264 0.23 0.13 0.14 0.05 5.95 5.41 0.60 1.54
Y. Chen, S. Ghosh / International Journal of Plasticity 32–33 (2012) 218–247 221
propagation from the boundary to the interior of the model. At the initial stages a high error is seen since the stress level islow and the stress wave has not reached the center. However with the increase of strain, the stress level of the entire modelincreases and the error becomes low in comparison with the higher stress level. Comparing the loading cases 1 and 3, and 2and 4, it is seen that the error decreases with the decrease of the strain rate. At lower strain rates, the stress wave has moretime to propagate in the interior, which means the difference caused by the size of the model becomes smaller. Although the
222 Y. Chen, S. Ghosh / International Journal of Plasticity 32–33 (2012) 218–247
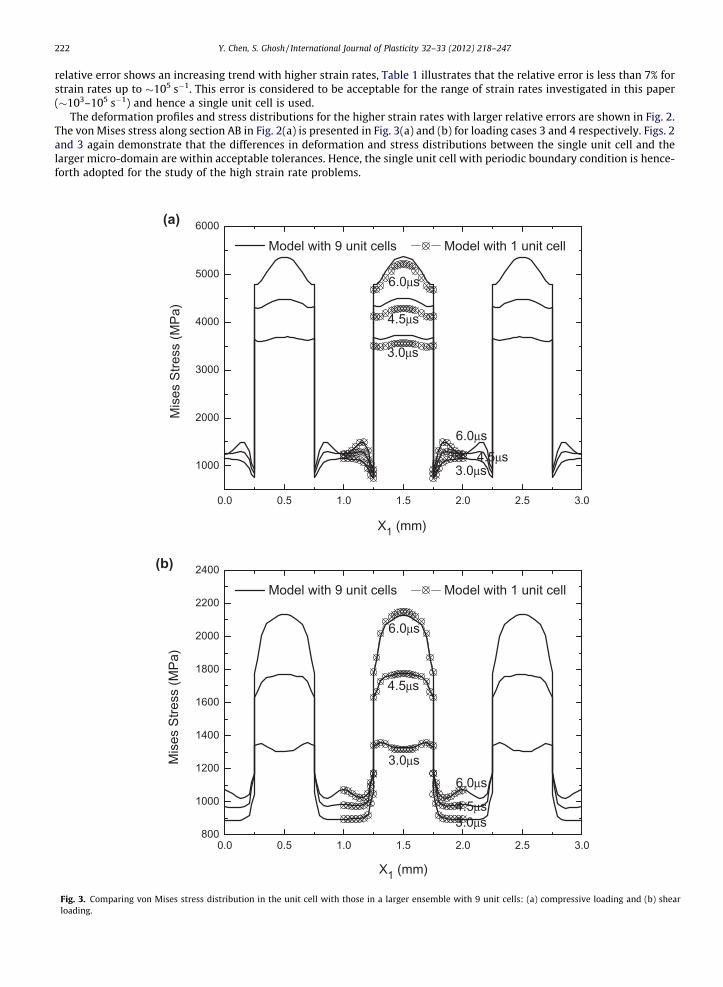
relative error shows an increasing trend with higher strain rates, Table 1 illustrates that the relative error is less than 7% forstrain rates up to �105 s�1. This error is considered to be acceptable for the range of strain rates investigated in this paper(�103–105 s�1) and hence a single unit cell is used.
The deformation profiles and stress distributions for the higher strain rates with larger relative errors are shown in Fig. 2.The von Mises stress along section AB in Fig. 2(a) is presented in Fig. 3(a) and (b) for loading cases 3 and 4 respectively. Figs. 2and 3 again demonstrate that the differences in deformation and stress distributions between the single unit cell and thelarger micro-domain are within acceptable tolerances. Hence, the single unit cell with periodic boundary condition is hence-forth adopted for the study of the high strain rate problems.
0.0 0.5 1.0 1.5 2.0 2.5 3.0
1000
2000
3000
4000
5000
6000
Mis
es S
tress
(MPa
)
X1 (mm)
Model with 9 unit cells Model with 1 unit cell
6.0μs
4.5μs
3.0μs
6.0μs4.5μs
3.0μs
(a)
0.0 0.5 1.0 1.5 2.0 2.5 3.0800
1000
1200
1400
1600
1800
2000
2200
2400
Mis
es S
tress
(MPa
)
X1 (mm)
Model with 9 unit cells Model with 1 unit cell
6.0μs
4.5μs
3.0μs
6.0μs
4.5μs3.0μs
(b)
Fig. 3. Comparing von Mises stress distribution in the unit cell with those in a larger ensemble with 9 unit cells: (a) compressive loading and (b) shearloading.
Ff
Y. Chen, S. Ghosh / International Journal of Plasticity 32–33 (2012) 218–247 223
2.2. Constitutive models
This section briefly discusses the constitutive and continuum damage models that are used to describe the deformationand damage response of fiber reinforced ductile matrix composites, consisting of fiber and the matrix phases. Their mechan-ical responses are modeled by two different sets of constitutive and damage models respectively. The interface between thematrix and fiber phases is assumed to be coherent with no explicit debonding.
2.2.1. Fiber phase modelThe mechanical behavior of the hard and brittle fiber is characterized by high stiffness and strength and low failure strain.
For example, the tensile strength for silicon carbide (SiC) fibers is typically of the order of 6 GPa with a failure strain ofapproximately 1.4%. The failure process is short and the stress drops very suddenly at the inception of brittle fracture.The brittle fiber is assumed to be isotropic, elastic undergoing small deformation, but finite rotation. The stress–strain rela-tion in a rotated system is given as:
ig. 4. Sailure.
r ¼ C : e ð3Þ
in which C is the fourth order isotropic secant stiffness tensor as
Cijkl ¼ 2Gdikdjl þ K � 23
G� �
dijdkl ð4Þ
where G = E/[2(1 + m)] and K = E/[3(1 � 2m)] are the shear and bulk moduli, depending only on the stiffness E and Poisson’sratio m. Fiber damage is modeled using a continuum damage mechanics (CDM) model proposed in (Kachanov, 1958; Simoand Ju, 1987; Chaboche, 1988; Jain and Ghosh, 2009), in which the elastic stiffness reduces with increasing deformation in-duced damage. From elastic energy equivalence, which assumes that the elastic complimentary energy in a damaged mate-rial with the actual stress is equal to that in a hypothetical material with a fictitious effective stress, the relation between thedamaged and undamaged elastic stiffness for an isotropic material may be established as
E ¼ ð1� DÞ2E0 ð5Þ
where D represents the damage, and E and E0 are elastic modulus in the damaged and undamaged state respectively. For thebrittle materials in the absence of plasticity, the damage variable is assumed to evolve following a damage evolution law(Lemaitre and Chaboche, 1990) as:
_D ¼ ð�e=e0ÞS�_�e when �e P eD and _�e > 0
0 when �e < eD or _�e 6 0
(ð6Þ
where �e ¼ffiffiffiffiffiffiffiffiffiffiffiffiffiffiffiffiffi2eijeij=3
pis the equivalent strain, eD is a variable threshold of equivalent strain, and e0 and S⁄ are constant mate-
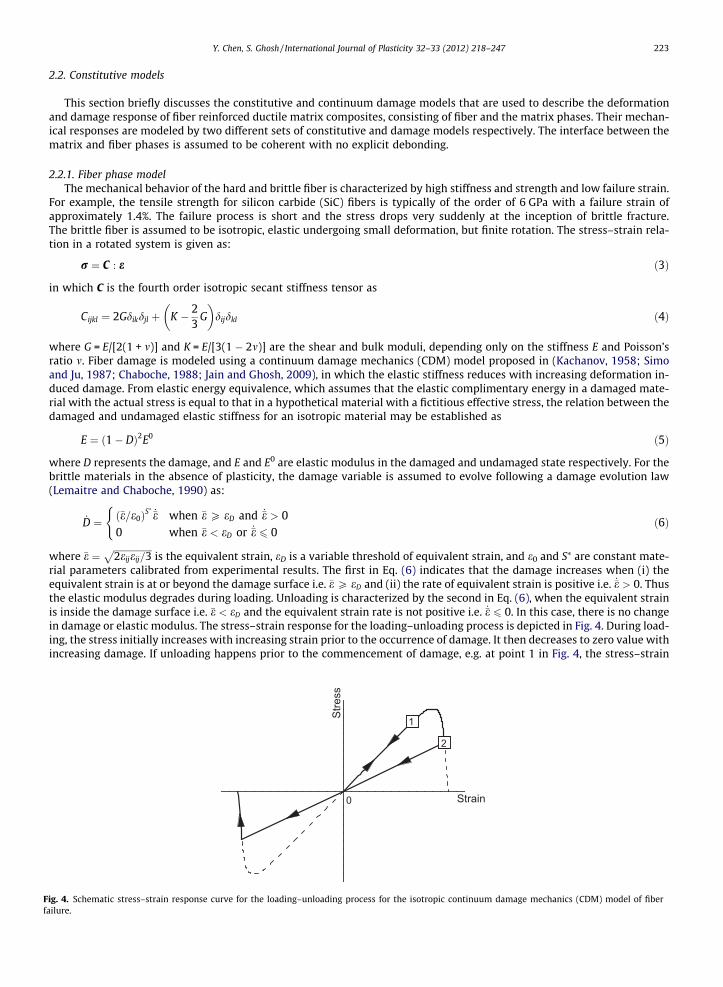
rial parameters calibrated from experimental results. The first in Eq. (6) indicates that the damage increases when (i) theequivalent strain is at or beyond the damage surface i.e. �e P eD and (ii) the rate of equivalent strain is positive i.e. _�e > 0. Thusthe elastic modulus degrades during loading. Unloading is characterized by the second in Eq. (6), when the equivalent strainis inside the damage surface i.e. �e < eD and the equivalent strain rate is not positive i.e. _�e 6 0. In this case, there is no changein damage or elastic modulus. The stress–strain response for the loading–unloading process is depicted in Fig. 4. During load-ing, the stress initially increases with increasing strain prior to the occurrence of damage. It then decreases to zero value withincreasing damage. If unloading happens prior to the commencement of damage, e.g. at point 1 in Fig. 4, the stress–strain
Stre
ss
Strain
1
2
0
chematic stress–strain response curve for the loading–unloading process for the isotropic continuum damage mechanics (CDM) model of fiber
224 Y. Chen, S. Ghosh / International Journal of Plasticity 32–33 (2012) 218–247
curve retraces its original path. If unloading occurs during the damage phase, e.g. at point 2 in Fig. 4, the stress–strain curvegoes approaches the origin with a constant damaged elastic modulus. For transitioning from tension to compression, thecurve continues in the reverse direction with the same constant elastic modulus until the equivalent strain reaches the dam-age surface. Subsequently, the damage increases and elastic modulus decreases as shown in Fig. 4. For complete damage, thestress reduces to zero indicating loss of load carrying capacity.
2.2.2. Matrix phase modelDuctile metals are used as the matrix phase in composites for their good energy absorption properties. The matrix phase
in this study is assumed to undergo rate-dependent elasto-plastic deformation and ductile failure due to nucleation, growthand coalescence of microscopic voids (Tvergaard, 1990). The matrix material is modeled using finite deformation constitu-tive relations for strain-rate-dependent porous plasticity with microscopic voids in a rotated framework (Green and Naghdi,1965; Ghosh and Kikuchi, 1991). In this formulation, the constitutive relations are expressed in a rotated Lagrangian systemin terms of the rotated Cauchy stress tensor DrR = RTDrR and the rotated rate of deformation tensor DR = RTDR, where R is aproper orthogonal tensor representing a pure rotation obtained from the polar F = RU decomposition of the deformation gra-dient tensor F =r0x. The subscript 0 refers to the reference configuration. All the following equations are developed in a ro-tated Lagrangian system.The total strain rate is assumed to follow an additive decomposition into elastic and plastic parts as:
DR ¼ DeR þ Dp
R ð7Þ
Ductile fracture in metallic materials is governed by the mechanisms of microscopic void nucleation, growth and coales-cence (Tvergaard, 1990). The most widely used model for ductile failure is the Gurson, Tvergaard and Needleman or GTNmodel (Gurson, 1977; Tvergaard, 1990; Chu and Needleman, 1980; Tvergaard and Needleman, 1984). It is a micromechanicalmodel, in flow surface depends on the evolution of damage or porosity parameter f as well as on the hydrostatic stress. Avariety of modifications have been made to the GTN model to extend its range of applications (Leblond et al., 1994; Bessonet al., 2003; Wen et al., 2005; Nahshon and Hutchinson, 2008; Ghosh et al., 2009; Paquet and Ghosh, 2010). Hao and Brocks(1997) have established a constitutive law of ductile fracture for rate and temperature-dependent materials with isotropicand kinematic hardening by introducing two additional parameters to the GTN model, which account for the influences ofstrain rate, inertia and the average distance between voids. Recently Paquet and Ghosh (2010) have extended GTN model torate-dependent porous elastic-viscoplastic model by using Perzynas viscoplastic over-stress model. However, both thesemodels are only suitable for low strain rate problems (less than 10�1 s�1).
The rate-dependent plastic behavior of the porous ductile matrix is governed by the GTN yield function (Gurson, 1977;Tvergaard, 1990; Chu and Needleman, 1980; Tvergaard and Needleman, 1984) in a rotated Lagrangian system as:
/ð�rMÞ ¼qR
�rM
� �2
þ 2q1f � cosh �32
q2pR
�rM
� �� ð1þ q3f �
2 Þ ¼ 0 ð8Þ
where q1, q2, q3 are parameters related to void growth proposed in Tvergaard (1981, 1982), qR ¼ffiffiffiffiffiffiffiffiffiffiffiffiffiffiffiffiffiffiffiffiffiffiffi3r0R : r0R=2
pand
pR = �rR : I/3 are the von Mises equivalent stress and the hydrostatic pressure respectively, r0R is the rotated Cauchy stressdeviator, �rM is the yield stress of the undamaged matrix material. Subscript M is used to designate association with the pureunderlying matrix without voids, and the acceleration function f⁄, which accounts for rapid loss of stress carrying capacitydue to void, is given by
f � ¼f f 6 fC
fC þ f �u�fCfF�fCðf � fCÞ f > fC
(ð9Þ
Here f is the void volume fraction, fC is a critical value for void coalescence, fF is its value at failure and f �u is the value of f⁄ atfailure.
The high strain rate response of the pure underlying matrix without voids is assumed to be governed by the rate-depen-dent hardening law (Johnson and Cook, 1983) given as:
_�epM ¼ H½/ðr0Þ� _e0 exp
�rM
Cr0ð1� hmÞ� 1
C
" #ð10Þ
where _�epM is the equivalent plastic strain rate, r0 ¼ Aþ B �ep
M
� �n is the material yield stress under static load, and A, B, C, m andn are material parameters that can be calibrated from experimental data. _e0 is a reference strain rate, h is a normalized tem-perature, and H[x] is the Heaviside step function expressed as
H½x� ¼0 x 6 01 x > 0
�ð11Þ
The material plastic strain rate tensor is consequently expressed as
_epM ¼
ffiffiffi32
rH½/ðr0Þ� _e0 exp
�rM
Cr0ð1� hmÞ� 1
C
" #@/=@rM
k@/=@rMkð12Þ
Y. Chen, S. Ghosh / International Journal of Plasticity 32–33 (2012) 218–247 225
Next for the porous matrix material, the overall plastic strain rate follows the associated flow rule as:
DpR ¼ _k
@/@rR
ð13Þ
where _k is a viscoplastic multiplier. The equivalence of the rate of dissipative energy yields
rR : DpR ¼ ð1� f Þ�rM
_�epM ð14Þ
Substituting the flow rule (13) into the energy equivalence equation (14), the viscoplastic multiplier _k can be obtained as
_k ¼ð1� f Þ�rMH½/ðr0Þ� _e0 exp �rM
C AþB �epMð Þ
n� �
ð1�hmÞ� 1
C
� rR : @/
@rR
ð15Þ
Substituting Eq. (15) into Eq. (13) yields the overall plastic strain rate as:
DpR ¼ð1� f Þ�rMH½/ðr0Þ� _e0 exp �rM
C AþB �epMð Þ
n� �
ð1�hmÞ� 1
C
� rR : @/
@rR
@/@rR
ð16Þ
The evolution rate of the macroscopic void volume fraction f is additively decomposed into growth and nucleation parts(Chu and Needleman, 1980; Tvergaard and Needleman, 1984, 1995), as:
_f ¼ _f nucleation þ _f growth ð17Þ
The void nucleation rate is given as:
_f nucleation ¼ A �epM
� �_�ep
M ð18Þ
where the parameter A is defined as a function of the matrix equivalent plastic strain �epM , i.e.
A �epM
� �¼ fN
sN
ffiffiffiffiffiffiffi2pp exp �1
2�ep
M � eN
sN
� �2" #
ð19Þ
fN is the void volume fraction of nucleated voids, eN is the mean value of normal distribution of the nucleation strain, and sN
the distribution’s standard deviation. It is assumed that voids are nucleated only in tension and no nucleation occurs incompression.
The matrix void growth rate is expressed as:
_f growth ¼ ð1� f ÞDpR : Iþ kxfxðrRÞ
r0R : DpR
qRð20Þ
The first term is due to the dilatation, while the second term is an amendment for the low stress triaxiality failure introducedby Nahshon and Hutchinson (2008). Here the coefficient kx is a material parameter, specifying the magnitude of the damagegrowth rate in shear, and the invariant measure x(rR) (Nahshon and Hutchinson, 2008; Nahshon and Xue, 2009; Xue et al.,2010) is given by the expression:
xðrRÞ ¼ 1� 27J3ðrRÞ2q3
R
� �2
ð21Þ
where J3ðrRÞ ¼ detðr0RÞ is the third invariant of the stress deviator. For axisymmetric stress states x is equal to zero, while forall states consisting of pure or simple shear in addition to an arbitrary hydrostatic stress, x is equal to unity.
2.3. Numerical implementation of the constitutive models in FEM codes
2.3.1. CDM model for fiber phaseThe CDM model is implemented for finite element analysis using the user material interface (VUMAT) in the commercial
code ABAQUS/Explicit (2005). The essential steps in the VUMAT update algorithm for the nth increment are described below.
1. Initialize the threshold strain at the beginning of the first increment as eð0ÞD ¼ e0D.
2. Given eðnþ1Þij , evaluate the value of the equivalent strain �eðnþ1Þ ¼
ffiffiffiffiffiffiffiffiffiffiffiffiffiffiffiffiffiffiffiffiffiffiffiffiffiffiffiffiffiffiffiffi2eðnþ1Þ
ij eðnþ1Þij
.3
r.
3. If �eðnþ1Þ < eðnÞD or �eðnþ1Þ � �eðnÞ 6 0, there is no additional damage. In this case, update the state variable with the unchanged
values as eðnþ1ÞD ¼ eðnÞD ; Dðnþ1Þ ¼ DðnÞ. Proceed to step 5 with unchanged secant elastic stiffness E(n+1) = E(n) and unchanged
secant stiffness tensor C(n+1) = C(n).4. If �eðnþ1Þ P eðnÞD and �eðnþ1Þ � �eðnÞ > 0, damage evolves. In this case:
226 Y. Chen, S. Ghosh / International Journal of Plasticity 32–33 (2012) 218–247
� update the threshold as e nþ1ð ÞD ¼ �eðnþ1Þ;
� update the damage state variable as Dðnþ1Þ ¼ DðnÞ þ �eðnþ1Þþ�eðnÞ2e0
�S�
ð�eðnþ1Þ � �eðnÞÞ;
� update the secant stiffness using Eq. (5) as E(n+1) = (1 � D(n+1))2E0;� update the secant stiffness tensor using Eq. (4) as:
Cðnþ1Þijkl ¼ Eðnþ1Þ
1þ mdikdjl þ
mEðnþ1Þ
ð1þ mÞð1� 2mÞ dijdkl
5. Update the stresses with the updated secant stiffness tensor C(n+1) as rðnþ1Þij ¼ Cðnþ1Þ
ijkl eðnþ1Þij .
2.3.2. Strain-rate-dependent porous plasticity model for matrix phaseThe finite deformation high-strain-rate-dependent porous plasticity constitutive relations are integrated by an extension
of the backward Euler algorithm proposed by Aravas (1987) following the work in Paquet and Ghosh (2010). The rotatedCauchy stress is updated in the increment between the time steps t(n) and t(n+1) as
rðnþ1ÞR ¼ rðnÞR þ DrR ¼ re
R � Ce : DepR ð22Þ
where Ce is the fourth order isotropic elasticity tensor, reR ¼ rðnÞR þ Ce : DeR is the elastic predictor for this integration algo-
rithm, and DepR ¼ Dt Dp
R
� �ðnþ1Þ is increment of rotated plastic strain tensor. Using an update algorithm, the rotated stress incre-ment DrR is calculated from a known increment in the strain tensor DeR, which is related to the rotated strain increment DeR
as:
DeR ¼ ðRTÞðnþ1ÞDeRðnþ1Þ ð23Þ
The stress increment is obtained by solving the nonlinear constitutive relations of Section 2.2.2 in the rotated Lagrangiancoordinates.
Integrating Eq. (13) in the time step Dt between t(n) and t(n+1) by the backward Euler algorithm, the increment of rotatedplastic strain Dep
R can be decomposed into hydrostatic and deviatoric parts as
DepR ¼
13
DeRpI þ DeRqnðnþ1ÞR ð24Þ
where nR ¼ 32qR
r0R is a unit normal tensor representing the flow direction of the deviatoric plastic strain and DeRp and DeRq arethe hydrostatic and deviatoric parts of Dep
R respectively, expressed as:
DeRp ¼ �Dk@/@pR
� �ðnþ1Þ
; DeRq ¼ Dk@/@qR
� �ðnþ1Þ
ð25Þ
Here pR and qR are hydrostatic and deviatoric components of the rotated Cauchy stress, given as:
rR ¼ �pRI þ qRnR ð26Þ
Substituting Eq. (24) in Eq. (22) and expressing the elasticity tensor in terms of the shear and bulk moduli asCe
ijkl ¼ 2Gdikdjl þ K � 23 G
� �dijdkl, the rotated Cauchy stress is expressed by the hydrostatic and deviatoric components of the
incremental rotated plastic strain DeRp and DeRq as:
rðnþ1ÞR ¼ re
R � KDeRpI � 2GDeRqnðnþ1ÞR ð27Þ
Eq. (27) implies nðnþ1ÞR ; re
R
� �0 and the deviatoric part of rðnþ1ÞR are coaxial. So nðnþ1Þ
R can be calculated from the elastic predictor
reR as nR ¼ 3
2qeR
reR
� �0.The resulting stress update algorithm is reduced to a two-parameter nonlinear problem involving the hydrostatic and
deviatoric parts of the constitutive relations. The two nonlinear equations to be solved for DeRp and DeRq are derived fromthe flow rule and the viscoplastic law in the rotated Lagrangian frame, as enumerated below (Paquet and Ghosh, 2010).
(1) Rate-dependent flow rule: Dk can be eliminated from the two expressions in Eq. (25) and expressed in the rotatedLagrangian system as
DeRp@/@q
� �ðnþ1Þ
R
þ DeRq@/@p
� �ðnþ1Þ
R
¼ 0 ð28Þ
where DeRp and DeRq are the hydrostatic and deviatoric parts of DepR respectively. They satisfy the relations below.
(2) Viscoplastic law: The first relation in Eq. (25) can be rewritten as
DeRp þ Dk@/@p
� �ðnþ1Þ
R
¼ 0 ð29Þ
TM
Y. Chen, S. Ghosh / International Journal of Plasticity 32–33 (2012) 218–247 227
Here the increment of viscoplastic multiplier, i.e. Dk ¼ Dt _kðnþ1Þ, is derived from the integration of Eq. (15).Eqs. (28) and (29) are iteratively solved for DeRp and DeRq using the Newton–Raphson method. Corrections cp and cq to the
primary solution variables DeRp and DeRq are solved from the equations
able 2aterial
Fiber
Matrix
Ai1cp þ Ai2cq ¼ bi i ¼ 1;2 ð30Þ
The coefficients Aij and biare given in Appendix. The state variables �epM , f, and r0 are updated using the evolution equations
below
D�epM ¼�pDeRp þ qDeRq
ð1� f Þ�rMð31Þ
Df ¼ ð1� f ÞDeRp þ A �epM
� �R þ kxxfDeRq ð32Þ
Dr0 ¼ nB �epM
� �n�1D�ep
M ð33Þ
Finally, the rotated plastic strain tensor epR
� �ðnþ1Þ is obtained from Eq. (24) as:
epR
� �ðnþ1Þ ¼ epR
� �ðnÞ þ 13
DeRpI þ DeRqnðnþ1ÞR
� �ð34Þ
The stress r(n+1), plastic strain (ep)(n+1) and corresponding increments are obtained by tensor rotation.The constitutive law and accompanying integration scheme are implemented in the ABAQUS/Explicit (2005) finite ele-
ment code via its VUMAT user material subroutine interface.
3. Simulation and results
3.1. Material choice and parameters used
Aluminum matrix composites are widely used in aerospace structures, automobile components, semi-conductor packag-ing, impact mitigation and other engineering systems due to their high specific elastic modulus and specific strength (Lloyd,1994; Clausen et al., 2004; Shalu et al., 2009; Brar et al., 2009; Hu et al., 2010). Aluminum 7075 alloys are candidate materialsused in armor applications (Brar et al., 2009), and hence the alloy Al 7075-T6 is selected as matrix phase material for thesimulations. On the other hand, silicon carbide (SiC) fibers, which have high specific strength and elastic modulus, excellentheat resistance and good high-temperature stability, are attractive for reinforcements in advanced lightweight composites.This is selected as the fiber material in these simulations. For SiC fiber reinforced Al 7075-T6 matrix composites, the materialparameters for the isotropic CDM model of the SiC fiber, as well as for the GTN and Johnson–Cook constitutive models of theAl 7075-T6 matrix are given in Table 2. The properties for SiC (SCS-Ultra) are taken from Specialty Materials Inc. website(2010) and for Al 7075-T6 from Brar et al. (2009).
3.2. Volume-averaged variables
The volume-averaged Cauchy stress and Lagrangian strain are given as (Nemat-Nasser, 1999)
R ¼ 1V
ZrdV ; E ¼ 1
2ðhFiThFi � 1Þ ð35Þ
where V is the current total volume of the RVE, hFi ¼ 1V0
RF dV0 is the volume-averaged measure of the deformation gradient
F, and V0 is the initial total volume of the RVE. In finite element analysis, the average stress and deformation gradient arerewritten as the weighted sum of the respective phase values as:
R ¼ 1V
XNf
k¼1
ref ðkÞV
ef ðkÞ þ
XNm
k¼1
remðkÞV
emðkÞ
!; hFi ¼ 1
V0
XNf
k¼1
FefðkÞ
Ve0f ðkÞ þ
XNm
k¼1
FemðkÞV
e0mðkÞ
!ð36Þ
where Nf and Nm are the total number of elements in the fiber and matrix phases respectively, Vef ðkÞ; Ve
0f ðkÞ; ref ðkÞ and Ff(k)
e arethe current and initial volumes, stress and deformation gradient in the kth element in the fiber phase, and Ve
mðkÞ; Ve0mðkÞ; re
mðkÞ
constitutive parameters for the matrix and fiber.
E0 (GPa) m q (kg/m3) e0D
e0 S⁄
415 0.17 2800 0.0164 0.01 7.0
E (GPa) m q (kg/m3) fN sN eN f0 fC
71.7 0.33 2810 0.01 0.1 0.3 0.0001 0.15fF f �u A (MPa) B (MPa) C n m kx
0.25 0.666667 546 678 0.024 0.71 1.56 1.0
228 Y. Chen, S. Ghosh / International Journal of Plasticity 32–33 (2012) 218–247
and FemðkÞ are the current and initial volumes, stress and deformation gradient in the kth matrix element. Energy absorption
and dissipation are also important properties that relate to the localized deformation and damage in composites at highstrain rates (Nemat-Nasser et al., 2007; Han et al., 1998). An estimate of the energy dissipation property is defined as theaverage non-recoverable energy density as:
WD ¼1V
XNf
k¼1
weDf ðkÞV
ef ðkÞ þ
XNm
k¼1
weDmðkÞV
emðkÞ
!ð37Þ
where Vf ¼PNf
k¼1Vef ðkÞ and Vm ¼
PNmk¼1Ve
mðkÞ are the current volumes of the fiber and the matrix respectively, and weDf and we
Dm
are the non-recoverable energy densities in elements of the fiber and matrix phases respectively. In the CDM model, the non-
recoverable energy density in the kth fiber element wef ðkÞ
�is defined as the dissipation energy density due to stiffness deg-
radation (Carol et al., 1994)
weDf ðkÞ ¼ �
12
ZeijðkÞeijðkÞdEðkÞ ð38Þ
The non-recoverable energy density in the kth matrix element wemðkÞ
�is defined as the viscoplastic energy density:
weDmðkÞ ¼
ZrijðkÞdep
ijðkÞ ð39Þ
In a similar vein, an estimate of the absorption energy is assumed as the average recoverable energy density defined as
WA ¼1V
XNf
k¼1
weAf ðkÞV
ef ðkÞ þ
XNm
k¼1
weAmðkÞV
emðkÞ
!ð40Þ
where weAf and we
Am are the recoverable energy densities in the fiber and matrix phase elements respectively. The recoverable
energy density in the kth fiber element weAf ðkÞ
�is given as:
weAf ðkÞ ¼
ZrijðkÞdeijðkÞ �we
Df ðkÞ ð41Þ
whereas the recoverable energy density in the kth matrix element weAmðkÞ
�is defined as the elastic energy density:
weAmðkÞ ¼
ZrijðkÞdeijðkÞ �we
DmðkÞ ¼Z
rijðkÞdeeijðkÞ ð42Þ
The total internal energy density WT, corresponding to the sum of the absorption and dissipation energy densities is de-fined as
WT ¼WA þWD ¼1V
XNf
k¼1
ZrijðkÞ deijðkÞV
ef ðkÞ þ
XNm
k¼1
ZrijðkÞdeijðkÞV
emðkÞ ð43Þ
The normalized energy absorption and energy dissipation are expressed as:
cW A ¼WA=WT ; cW D ¼WD=WT ð44Þ3.3. Mesh convergence study
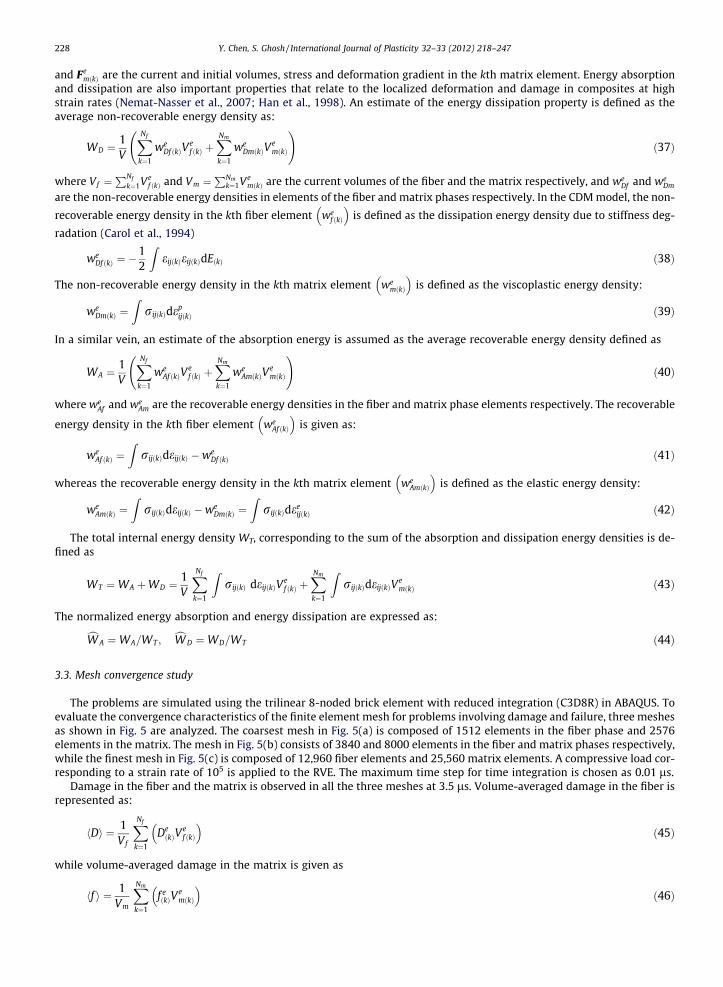
The problems are simulated using the trilinear 8-noded brick element with reduced integration (C3D8R) in ABAQUS. Toevaluate the convergence characteristics of the finite element mesh for problems involving damage and failure, three meshesas shown in Fig. 5 are analyzed. The coarsest mesh in Fig. 5(a) is composed of 1512 elements in the fiber phase and 2576elements in the matrix. The mesh in Fig. 5(b) consists of 3840 and 8000 elements in the fiber and matrix phases respectively,while the finest mesh in Fig. 5(c) is composed of 12,960 fiber elements and 25,560 matrix elements. A compressive load cor-responding to a strain rate of 105 is applied to the RVE. The maximum time step for time integration is chosen as 0.01 ls.
Damage in the fiber and the matrix is observed in all the three meshes at 3.5 ls. Volume-averaged damage in the fiber isrepresented as:
hDi ¼ 1Vf
XNf
k¼1
DeðkÞV
ef ðkÞ
�ð45Þ
while volume-averaged damage in the matrix is given as
hf i ¼ 1Vm
XNm
k¼1
f eðkÞV
emðkÞ
�ð46Þ
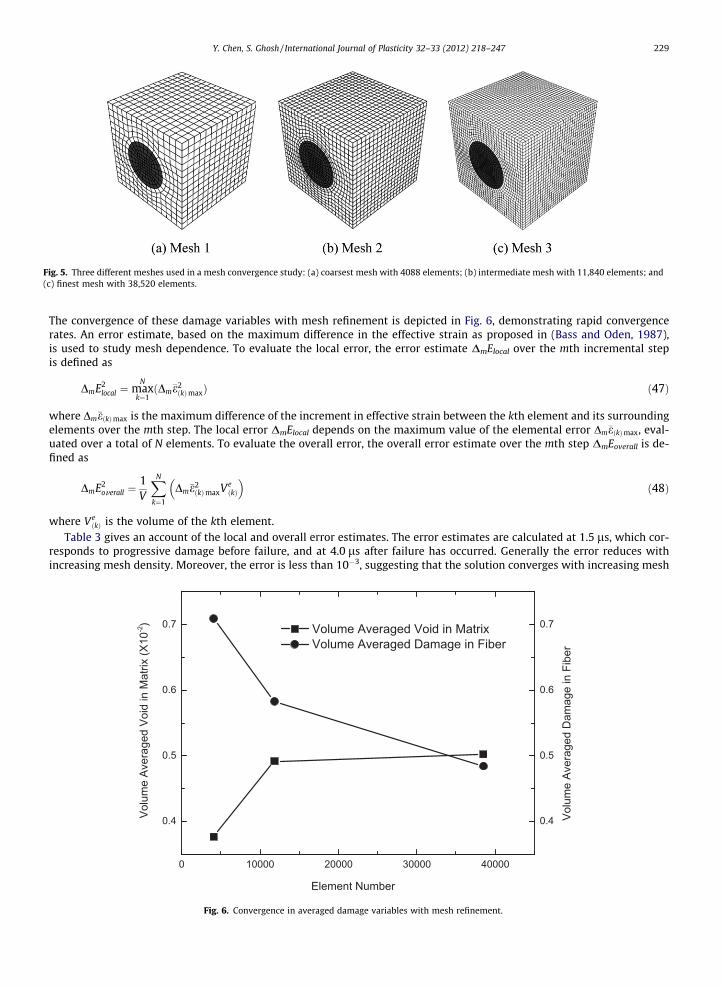
Fig. 5. Three different meshes used in a mesh convergence study: (a) coarsest mesh with 4088 elements; (b) intermediate mesh with 11,840 elements; and(c) finest mesh with 38,520 elements.
Y. Chen, S. Ghosh / International Journal of Plasticity 32–33 (2012) 218–247 229
The convergence of these damage variables with mesh refinement is depicted in Fig. 6, demonstrating rapid convergencerates. An error estimate, based on the maximum difference in the effective strain as proposed in (Bass and Oden, 1987),is used to study mesh dependence. To evaluate the local error, the error estimate DmElocal over the mth incremental stepis defined as
DmE2local ¼ max
N
k¼1ðDm�e2
ðkÞmaxÞ ð47Þ
where Dm�eðkÞmax is the maximum difference of the increment in effective strain between the kth element and its surroundingelements over the mth step. The local error DmElocal depends on the maximum value of the elemental error Dm�eðkÞmax, eval-uated over a total of N elements. To evaluate the overall error, the overall error estimate over the mth step DmEoverall is de-fined as
DmE2overall ¼
1V
XN
k¼1
Dm�e2ðkÞmaxVe
ðkÞ
�ð48Þ
where VeðkÞ is the volume of the kth element.
Table 3 gives an account of the local and overall error estimates. The error estimates are calculated at 1.5 ls, which cor-responds to progressive damage before failure, and at 4.0 ls after failure has occurred. Generally the error reduces withincreasing mesh density. Moreover, the error is less than 10�3, suggesting that the solution converges with increasing mesh
0 10000 20000 30000 40000
0.4
0.5
0.6
0.7
0.4
0.5
0.6
0.7 Volume Averaged Void in Matrix Volume Averaged Damage in Fiber
Volu
me
Aver
aged
Dam
age
in F
iber
Volu
me
Aver
aged
Voi
d in
Mat
rix (X
10-2)
Element Number
Fig. 6. Convergence in averaged damage variables with mesh refinement.
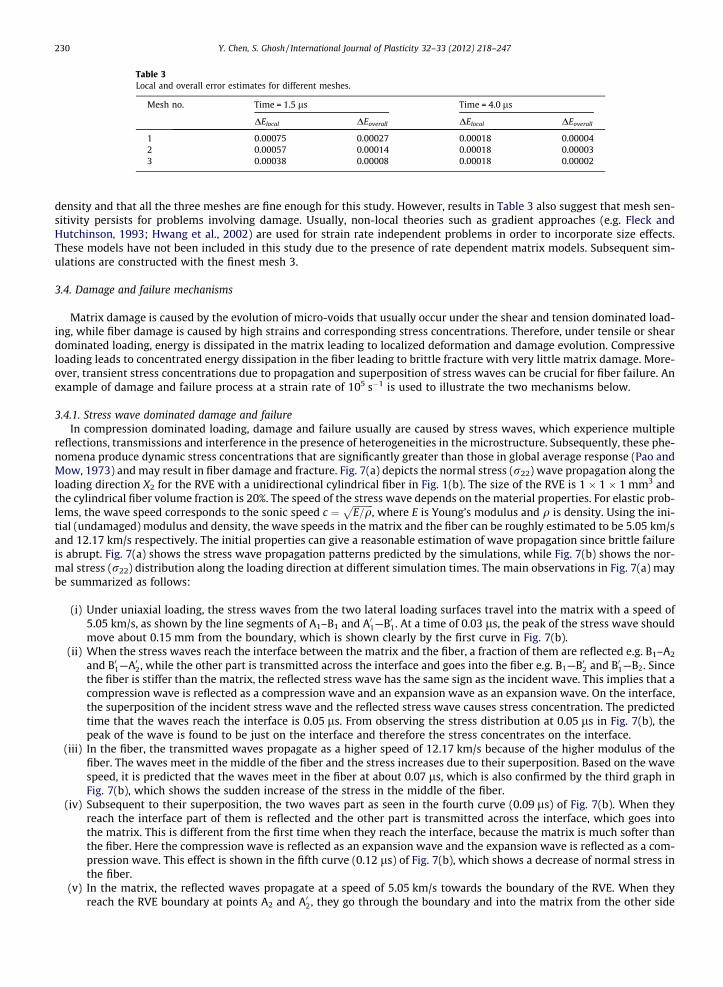
Table 3Local and overall error estimates for different meshes.
Mesh no. Time = 1.5 ls Time = 4.0 ls
DElocal DEoverall DElocal DEoverall
1 0.00075 0.00027 0.00018 0.000042 0.00057 0.00014 0.00018 0.000033 0.00038 0.00008 0.00018 0.00002
230 Y. Chen, S. Ghosh / International Journal of Plasticity 32–33 (2012) 218–247
density and that all the three meshes are fine enough for this study. However, results in Table 3 also suggest that mesh sen-sitivity persists for problems involving damage. Usually, non-local theories such as gradient approaches (e.g. Fleck andHutchinson, 1993; Hwang et al., 2002) are used for strain rate independent problems in order to incorporate size effects.These models have not been included in this study due to the presence of rate dependent matrix models. Subsequent sim-ulations are constructed with the finest mesh 3.
3.4. Damage and failure mechanisms
Matrix damage is caused by the evolution of micro-voids that usually occur under the shear and tension dominated load-ing, while fiber damage is caused by high strains and corresponding stress concentrations. Therefore, under tensile or sheardominated loading, energy is dissipated in the matrix leading to localized deformation and damage evolution. Compressiveloading leads to concentrated energy dissipation in the fiber leading to brittle fracture with very little matrix damage. More-over, transient stress concentrations due to propagation and superposition of stress waves can be crucial for fiber failure. Anexample of damage and failure process at a strain rate of 105 s�1 is used to illustrate the two mechanisms below.
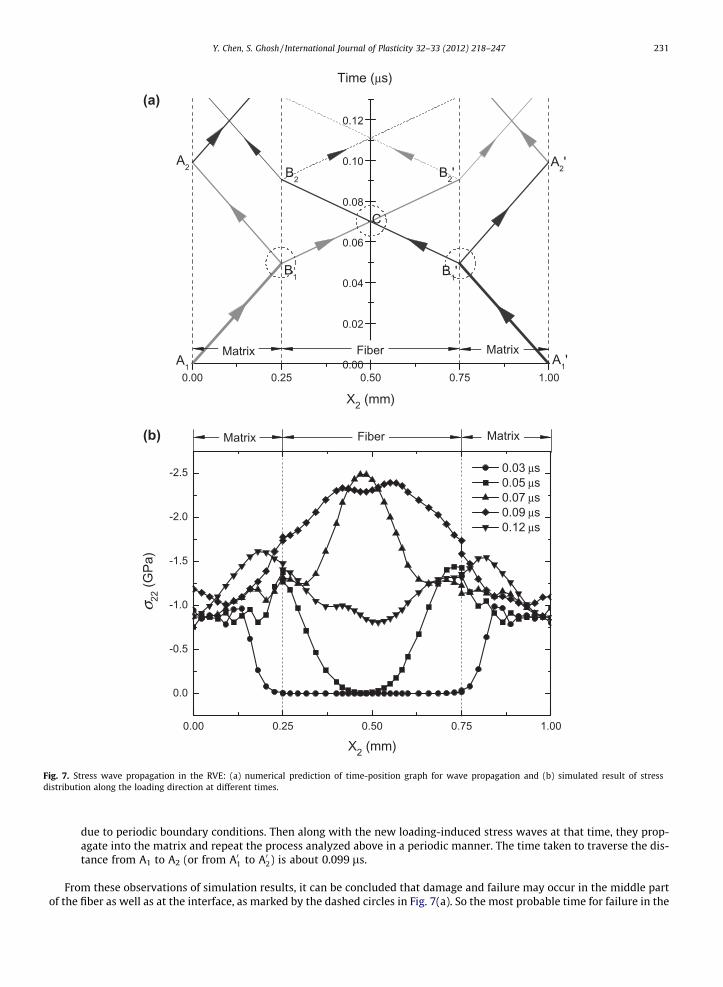
3.4.1. Stress wave dominated damage and failureIn compression dominated loading, damage and failure usually are caused by stress waves, which experience multiple
reflections, transmissions and interference in the presence of heterogeneities in the microstructure. Subsequently, these phe-nomena produce dynamic stress concentrations that are significantly greater than those in global average response (Pao andMow, 1973) and may result in fiber damage and fracture. Fig. 7(a) depicts the normal stress (r22) wave propagation along theloading direction X2 for the RVE with a unidirectional cylindrical fiber in Fig. 1(b). The size of the RVE is 1 � 1 � 1 mm3 andthe cylindrical fiber volume fraction is 20%. The speed of the stress wave depends on the material properties. For elastic prob-lems, the wave speed corresponds to the sonic speed c ¼
ffiffiffiffiffiffiffiffiffiE=q
p, where E is Young’s modulus and q is density. Using the ini-
tial (undamaged) modulus and density, the wave speeds in the matrix and the fiber can be roughly estimated to be 5.05 km/sand 12.17 km/s respectively. The initial properties can give a reasonable estimation of wave propagation since brittle failureis abrupt. Fig. 7(a) shows the stress wave propagation patterns predicted by the simulations, while Fig. 7(b) shows the nor-mal stress (r22) distribution along the loading direction at different simulation times. The main observations in Fig. 7(a) maybe summarized as follows:
(i) Under uniaxial loading, the stress waves from the two lateral loading surfaces travel into the matrix with a speed of5.05 km/s, as shown by the line segments of A1–B1 and A01—B01. At a time of 0.03 ls, the peak of the stress wave shouldmove about 0.15 mm from the boundary, which is shown clearly by the first curve in Fig. 7(b).
(ii) When the stress waves reach the interface between the matrix and the fiber, a fraction of them are reflected e.g. B1–A2
and B01—A02, while the other part is transmitted across the interface and goes into the fiber e.g. B1—B02 and B01—B2. Sincethe fiber is stiffer than the matrix, the reflected stress wave has the same sign as the incident wave. This implies that acompression wave is reflected as a compression wave and an expansion wave as an expansion wave. On the interface,the superposition of the incident stress wave and the reflected stress wave causes stress concentration. The predictedtime that the waves reach the interface is 0.05 ls. From observing the stress distribution at 0.05 ls in Fig. 7(b), thepeak of the wave is found to be just on the interface and therefore the stress concentrates on the interface.
(iii) In the fiber, the transmitted waves propagate as a higher speed of 12.17 km/s because of the higher modulus of thefiber. The waves meet in the middle of the fiber and the stress increases due to their superposition. Based on the wavespeed, it is predicted that the waves meet in the fiber at about 0.07 ls, which is also confirmed by the third graph inFig. 7(b), which shows the sudden increase of the stress in the middle of the fiber.
(iv) Subsequent to their superposition, the two waves part as seen in the fourth curve (0.09 ls) of Fig. 7(b). When theyreach the interface part of them is reflected and the other part is transmitted across the interface, which goes intothe matrix. This is different from the first time when they reach the interface, because the matrix is much softer thanthe fiber. Here the compression wave is reflected as an expansion wave and the expansion wave is reflected as a com-pression wave. This effect is shown in the fifth curve (0.12 ls) of Fig. 7(b), which shows a decrease of normal stress inthe fiber.
(v) In the matrix, the reflected waves propagate at a speed of 5.05 km/s towards the boundary of the RVE. When theyreach the RVE boundary at points A2 and A02, they go through the boundary and into the matrix from the other side
0.00 0.25 0.50 0.75 1.000.00
0.02
0.04
0.06
0.08
0.10
0.12
B2'B2
A2
Time (μs)
X2 (mm)
Matrix MatrixFiberA1
A1'
A2'
B1
C
B1'
0.00 0.25 0.50 0.75 1.00
0.0
-0.5
-1.0
-1.5
-2.0
-2.5 0.03 μs 0.05 μs 0.07 μs 0.09 μs 0.12 μs
σ 22 (G
Pa)
X2 (mm)
Matrix MatrixFiber
(a)
(b)
Fig. 7. Stress wave propagation in the RVE: (a) numerical prediction of time-position graph for wave propagation and (b) simulated result of stressdistribution along the loading direction at different times.
Y. Chen, S. Ghosh / International Journal of Plasticity 32–33 (2012) 218–247 231
due to periodic boundary conditions. Then along with the new loading-induced stress waves at that time, they prop-agate into the matrix and repeat the process analyzed above in a periodic manner. The time taken to traverse the dis-tance from A1 to A2 (or from A01 to A02) is about 0.099 ls.
From these observations of simulation results, it can be concluded that damage and failure may occur in the middle partof the fiber as well as at the interface, as marked by the dashed circles in Fig. 7(a). So the most probable time for failure in the
232 Y. Chen, S. Ghosh / International Journal of Plasticity 32–33 (2012) 218–247
fiber is (0.099n + 0.070) ls, where n is a number count and 0.070 ls is the time to travel from A1 (or A01) to C. Similarly forfailure on the boundary, the time is expected to be (0.099 n + 0.049) ls, where 0.049 ls is the time from A1 to B1 (or A01 to B01).
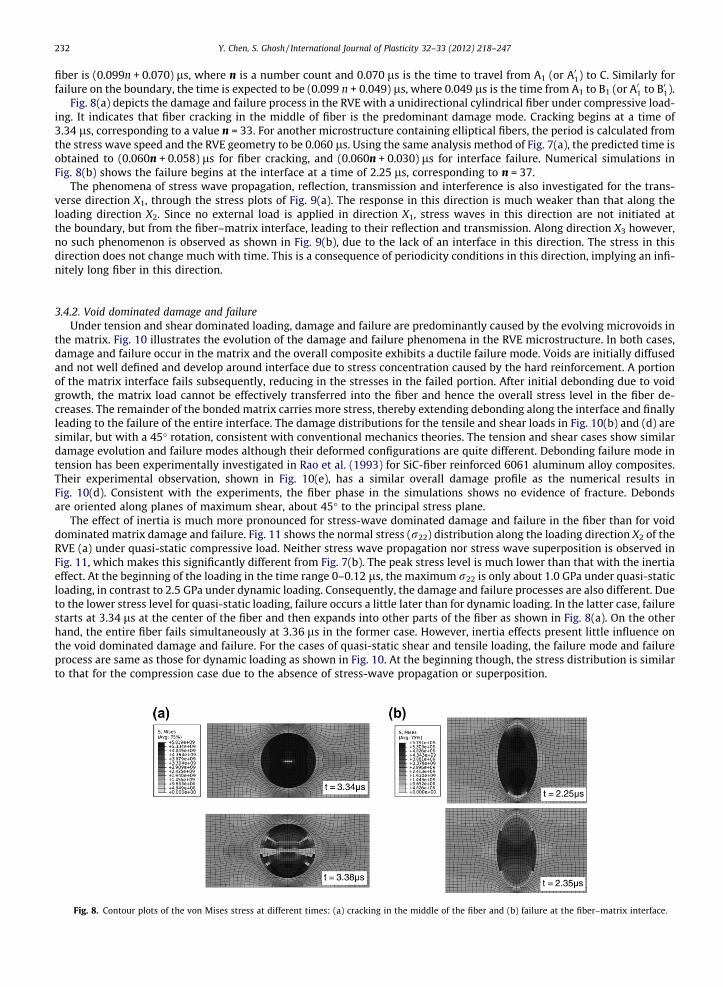
Fig. 8(a) depicts the damage and failure process in the RVE with a unidirectional cylindrical fiber under compressive load-ing. It indicates that fiber cracking in the middle of fiber is the predominant damage mode. Cracking begins at a time of3.34 ls, corresponding to a value n = 33. For another microstructure containing elliptical fibers, the period is calculated fromthe stress wave speed and the RVE geometry to be 0.060 ls. Using the same analysis method of Fig. 7(a), the predicted time isobtained to (0.060n + 0.058) ls for fiber cracking, and (0.060n + 0.030) ls for interface failure. Numerical simulations inFig. 8(b) shows the failure begins at the interface at a time of 2.25 ls, corresponding to n = 37.
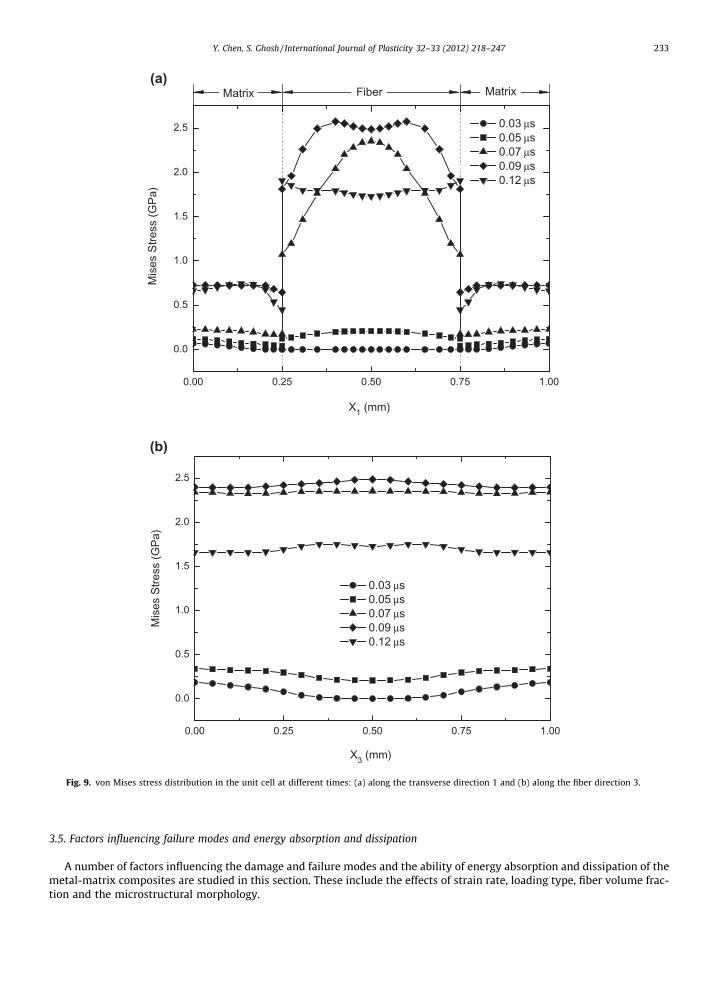
The phenomena of stress wave propagation, reflection, transmission and interference is also investigated for the trans-verse direction X1, through the stress plots of Fig. 9(a). The response in this direction is much weaker than that along theloading direction X2. Since no external load is applied in direction X1, stress waves in this direction are not initiated atthe boundary, but from the fiber–matrix interface, leading to their reflection and transmission. Along direction X3 however,no such phenomenon is observed as shown in Fig. 9(b), due to the lack of an interface in this direction. The stress in thisdirection does not change much with time. This is a consequence of periodicity conditions in this direction, implying an infi-nitely long fiber in this direction.
3.4.2. Void dominated damage and failureUnder tension and shear dominated loading, damage and failure are predominantly caused by the evolving microvoids in
the matrix. Fig. 10 illustrates the evolution of the damage and failure phenomena in the RVE microstructure. In both cases,damage and failure occur in the matrix and the overall composite exhibits a ductile failure mode. Voids are initially diffusedand not well defined and develop around interface due to stress concentration caused by the hard reinforcement. A portionof the matrix interface fails subsequently, reducing in the stresses in the failed portion. After initial debonding due to voidgrowth, the matrix load cannot be effectively transferred into the fiber and hence the overall stress level in the fiber de-creases. The remainder of the bonded matrix carries more stress, thereby extending debonding along the interface and finallyleading to the failure of the entire interface. The damage distributions for the tensile and shear loads in Fig. 10(b) and (d) aresimilar, but with a 45� rotation, consistent with conventional mechanics theories. The tension and shear cases show similardamage evolution and failure modes although their deformed configurations are quite different. Debonding failure mode intension has been experimentally investigated in Rao et al. (1993) for SiC-fiber reinforced 6061 aluminum alloy composites.Their experimental observation, shown in Fig. 10(e), has a similar overall damage profile as the numerical results inFig. 10(d). Consistent with the experiments, the fiber phase in the simulations shows no evidence of fracture. Debondsare oriented along planes of maximum shear, about 45� to the principal stress plane.
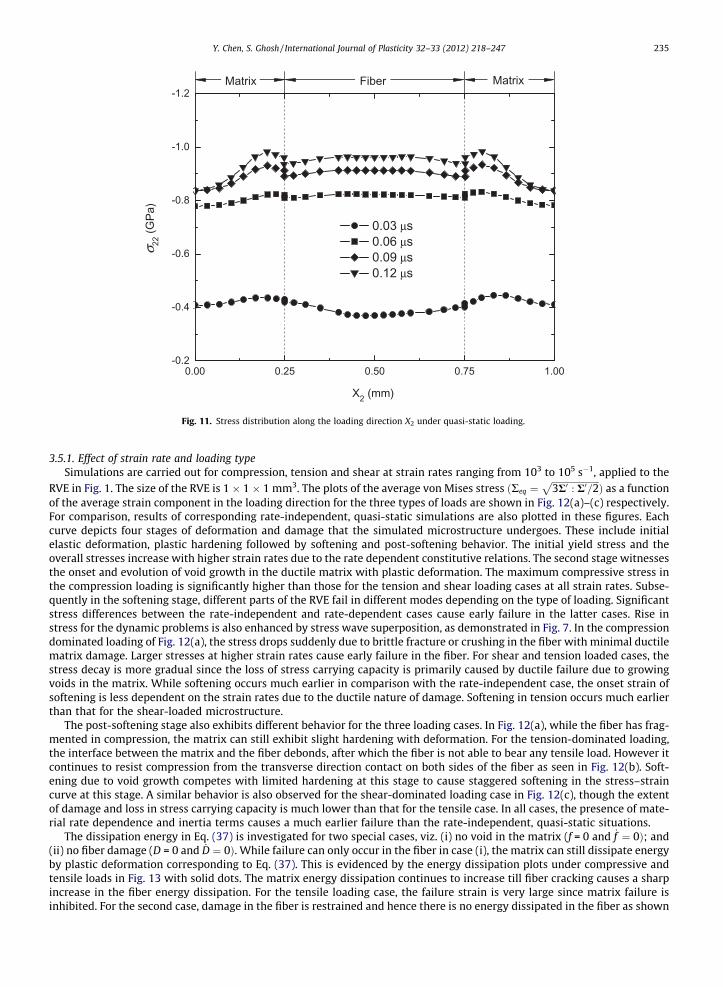
The effect of inertia is much more pronounced for stress-wave dominated damage and failure in the fiber than for voiddominated matrix damage and failure. Fig. 11 shows the normal stress (r22) distribution along the loading direction X2 of theRVE (a) under quasi-static compressive load. Neither stress wave propagation nor stress wave superposition is observed inFig. 11, which makes this significantly different from Fig. 7(b). The peak stress level is much lower than that with the inertiaeffect. At the beginning of the loading in the time range 0–0.12 ls, the maximum r22 is only about 1.0 GPa under quasi-staticloading, in contrast to 2.5 GPa under dynamic loading. Consequently, the damage and failure processes are also different. Dueto the lower stress level for quasi-static loading, failure occurs a little later than for dynamic loading. In the latter case, failurestarts at 3.34 ls at the center of the fiber and then expands into other parts of the fiber as shown in Fig. 8(a). On the otherhand, the entire fiber fails simultaneously at 3.36 ls in the former case. However, inertia effects present little influence onthe void dominated damage and failure. For the cases of quasi-static shear and tensile loading, the failure mode and failureprocess are same as those for dynamic loading as shown in Fig. 10. At the beginning though, the stress distribution is similarto that for the compression case due to the absence of stress-wave propagation or superposition.
Fig. 8. Contour plots of the von Mises stress at different times: (a) cracking in the middle of the fiber and (b) failure at the fiber–matrix interface.
0.00 0.25 0.50 0.75 1.00
0.0
0.5
1.0
1.5
2.0
2.5 0.03 μs 0.05 μs 0.07 μs 0.09 μs 0.12 μs
Matrix MatrixFiber
Mis
es S
tress
(GPa
)
X1 (mm)
(a)
0.00 0.25 0.50 0.75 1.00
0.0
0.5
1.0
1.5
2.0
2.5
0.03 μs 0.05 μs 0.07 μs 0.09 μs 0.12 μs
Mis
es S
tress
(GPa
)
X3 (mm)
(b)
Fig. 9. von Mises stress distribution in the unit cell at different times: (a) along the transverse direction 1 and (b) along the fiber direction 3.
Y. Chen, S. Ghosh / International Journal of Plasticity 32–33 (2012) 218–247 233
3.5. Factors influencing failure modes and energy absorption and dissipation
A number of factors influencing the damage and failure modes and the ability of energy absorption and dissipation of themetal-matrix composites are studied in this section. These include the effects of strain rate, loading type, fiber volume frac-tion and the microstructural morphology.
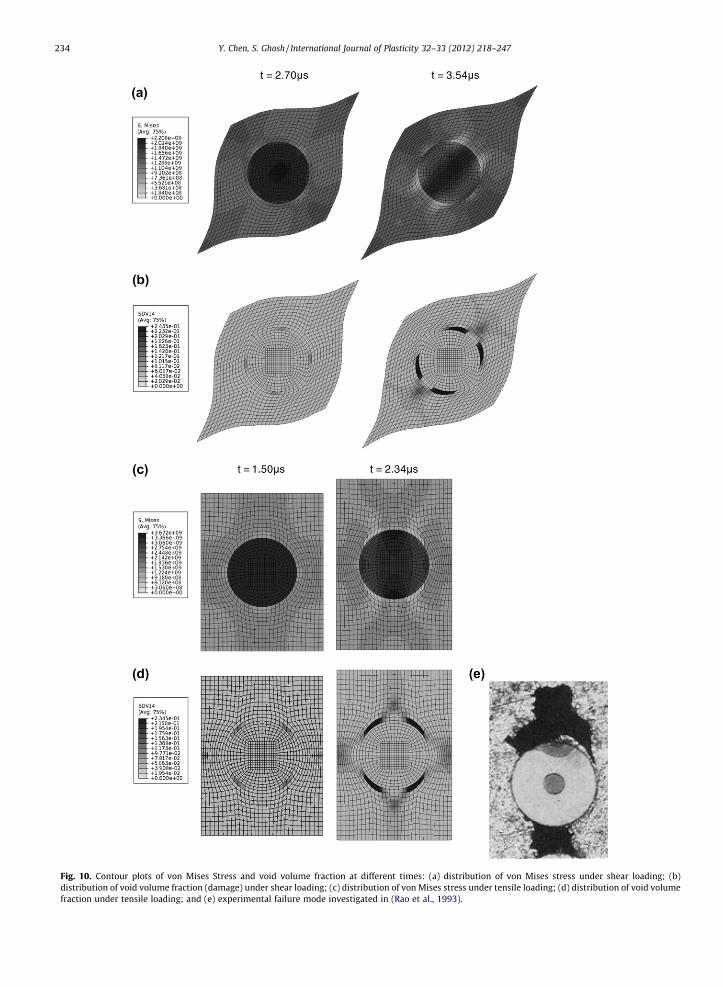
Fig. 10. Contour plots of von Mises Stress and void volume fraction at different times: (a) distribution of von Mises stress under shear loading; (b)distribution of void volume fraction (damage) under shear loading; (c) distribution of von Mises stress under tensile loading; (d) distribution of void volumefraction under tensile loading; and (e) experimental failure mode investigated in (Rao et al., 1993).
234 Y. Chen, S. Ghosh / International Journal of Plasticity 32–33 (2012) 218–247
0.00 0.25 0.50 0.75 1.00-0.2
-0.4
-0.6
-0.8
-1.0
-1.2
0.03 μs 0.06 μs 0.09 μs 0.12 μs
σ 22 (G
Pa)
X2 (mm)
Matrix Fiber Matrix
Fig. 11. Stress distribution along the loading direction X2 under quasi-static loading.
Y. Chen, S. Ghosh / International Journal of Plasticity 32–33 (2012) 218–247 235
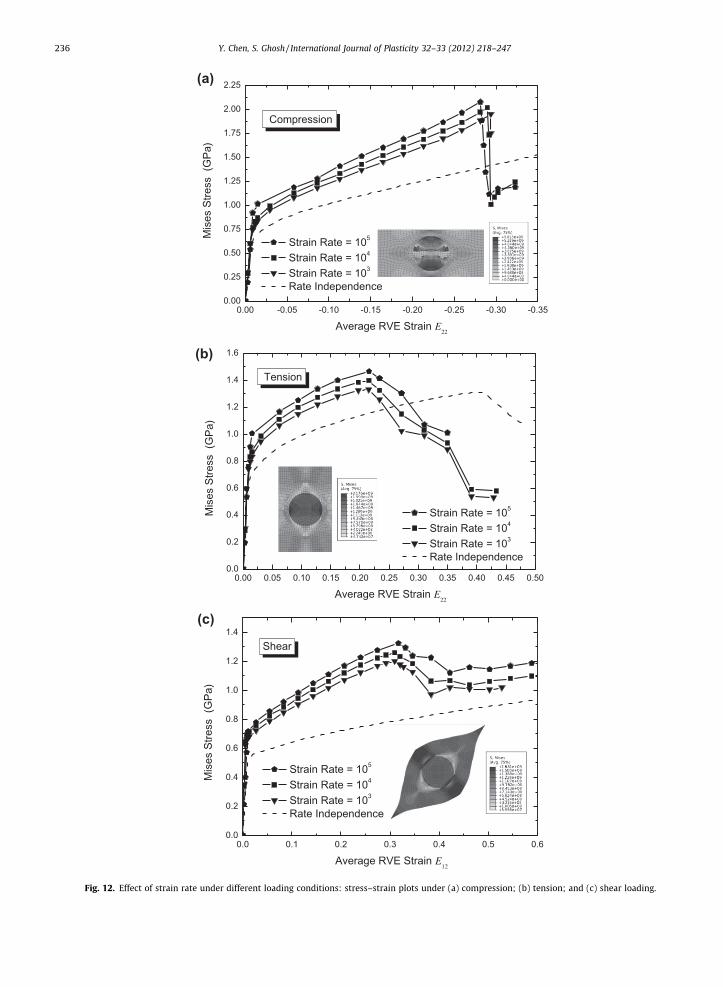
3.5.1. Effect of strain rate and loading typeSimulations are carried out for compression, tension and shear at strain rates ranging from 103 to 105 s�1, applied to the
RVE in Fig. 1. The size of the RVE is 1 � 1 � 1 mm3. The plots of the average von Mises stress ðReq ¼ffiffiffiffiffiffiffiffiffiffiffiffiffiffiffiffiffiffiffiffiffi3R0 : R0=2
pÞ as a function
of the average strain component in the loading direction for the three types of loads are shown in Fig. 12(a)–(c) respectively.For comparison, results of corresponding rate-independent, quasi-static simulations are also plotted in these figures. Eachcurve depicts four stages of deformation and damage that the simulated microstructure undergoes. These include initialelastic deformation, plastic hardening followed by softening and post-softening behavior. The initial yield stress and theoverall stresses increase with higher strain rates due to the rate dependent constitutive relations. The second stage witnessesthe onset and evolution of void growth in the ductile matrix with plastic deformation. The maximum compressive stress inthe compression loading is significantly higher than those for the tension and shear loading cases at all strain rates. Subse-quently in the softening stage, different parts of the RVE fail in different modes depending on the type of loading. Significantstress differences between the rate-independent and rate-dependent cases cause early failure in the latter cases. Rise instress for the dynamic problems is also enhanced by stress wave superposition, as demonstrated in Fig. 7. In the compressiondominated loading of Fig. 12(a), the stress drops suddenly due to brittle fracture or crushing in the fiber with minimal ductilematrix damage. Larger stresses at higher strain rates cause early failure in the fiber. For shear and tension loaded cases, thestress decay is more gradual since the loss of stress carrying capacity is primarily caused by ductile failure due to growingvoids in the matrix. While softening occurs much earlier in comparison with the rate-independent case, the onset strain ofsoftening is less dependent on the strain rates due to the ductile nature of damage. Softening in tension occurs much earlierthan that for the shear-loaded microstructure.
The post-softening stage also exhibits different behavior for the three loading cases. In Fig. 12(a), while the fiber has frag-mented in compression, the matrix can still exhibit slight hardening with deformation. For the tension-dominated loading,the interface between the matrix and the fiber debonds, after which the fiber is not able to bear any tensile load. However itcontinues to resist compression from the transverse direction contact on both sides of the fiber as seen in Fig. 12(b). Soft-ening due to void growth competes with limited hardening at this stage to cause staggered softening in the stress–straincurve at this stage. A similar behavior is also observed for the shear-dominated loading case in Fig. 12(c), though the extentof damage and loss in stress carrying capacity is much lower than that for the tensile case. In all cases, the presence of mate-rial rate dependence and inertia terms causes a much earlier failure than the rate-independent, quasi-static situations.
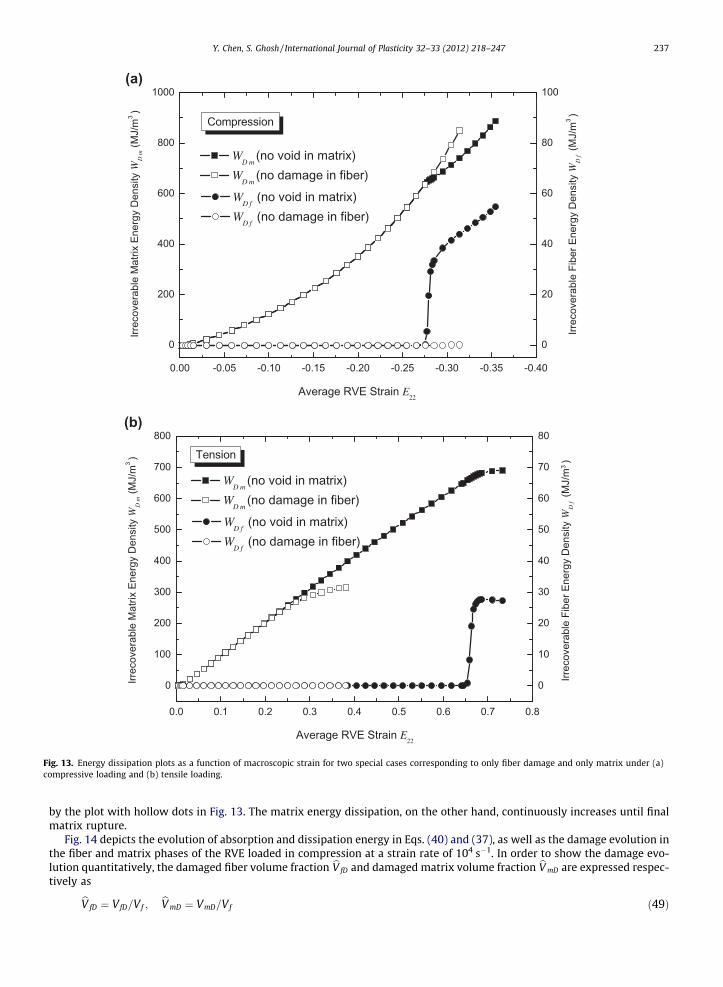
The dissipation energy in Eq. (37) is investigated for two special cases, viz. (i) no void in the matrix (f = 0 and _f ¼ 0Þ; and(ii) no fiber damage (D = 0 and _D ¼ 0Þ. While failure can only occur in the fiber in case (i), the matrix can still dissipate energyby plastic deformation corresponding to Eq. (37). This is evidenced by the energy dissipation plots under compressive andtensile loads in Fig. 13 with solid dots. The matrix energy dissipation continues to increase till fiber cracking causes a sharpincrease in the fiber energy dissipation. For the tensile loading case, the failure strain is very large since matrix failure isinhibited. For the second case, damage in the fiber is restrained and hence there is no energy dissipated in the fiber as shown
0.00 -0.05 -0.10 -0.15 -0.20 -0.25 -0.30 -0.350.00
0.25
0.50
0.75
1.00
1.25
1.50
1.75
2.00
2.25
Average RVE Strain E22
Mis
es S
tress
(G
Pa)
Compression
Strain Rate = 105
Strain Rate = 104
Strain Rate = 103
Rate Independence
(a)
0.00 0.05 0.10 0.15 0.20 0.25 0.30 0.35 0.40 0.45 0.500.0
0.2
0.4
0.6
0.8
1.0
1.2
1.4
1.6
Mis
es S
tress
(G
Pa)
Average RVE Strain E22
Tension
Strain Rate = 105
Strain Rate = 104
Strain Rate = 103
Rate Independence
(b)
0.0 0.1 0.2 0.3 0.4 0.5 0.60.0
0.2
0.4
0.6
0.8
1.0
1.2
1.4
Strain Rate = 105
Strain Rate = 104
Strain Rate = 103
Rate Independence
Mis
es S
tress
(G
Pa)
Shear
Average RVE Strain E12
(c)
Fig. 12. Effect of strain rate under different loading conditions: stress–strain plots under (a) compression; (b) tension; and (c) shear loading.
236 Y. Chen, S. Ghosh / International Journal of Plasticity 32–33 (2012) 218–247
0.00 -0.05 -0.10 -0.15 -0.20 -0.25 -0.30 -0.35 -0.40
0
200
400
600
800
1000
0
20
40
60
80
100
Compression
WD m
(no void in matrix) W
D m (no damage in fiber)
Irrec
over
able
Fib
er E
nerg
y D
ensi
ty W
D f (M
J/m
3 )
WD f
(no void in matrix) W
D f (no damage in fiber)
Irrec
over
able
Mat
rix E
nerg
y D
ensi
ty W
D m
(MJ/
m3 )
Average RVE Strain E22
(a)
0.0 0.1 0.2 0.3 0.4 0.5 0.6 0.7 0.8
0
100
200
300
400
500
600
700
800
0
10
20
30
40
50
60
70
80
Tension
WD m
(no void in matrix) W
D m (no damage in fiber)
Irrec
over
able
Fib
er E
nerg
y D
ensi
ty W
D f (M
J/m
3 )
WD f
(no void in matrix) W
D f (no damage in fiber)
Irrec
over
able
Mat
rix E
nerg
y D
ensi
ty W
D m
(MJ/
m3 )
Average RVE Strain E22
(b)
Fig. 13. Energy dissipation plots as a function of macroscopic strain for two special cases corresponding to only fiber damage and only matrix under (a)compressive loading and (b) tensile loading.
Y. Chen, S. Ghosh / International Journal of Plasticity 32–33 (2012) 218–247 237
by the plot with hollow dots in Fig. 13. The matrix energy dissipation, on the other hand, continuously increases until finalmatrix rupture.
Fig. 14 depicts the evolution of absorption and dissipation energy in Eqs. (40) and (37), as well as the damage evolution inthe fiber and matrix phases of the RVE loaded in compression at a strain rate of 104 s�1. In order to show the damage evo-lution quantitatively, the damaged fiber volume fraction bV fD and damaged matrix volume fraction bV mD are expressed respec-tively as
bV fD ¼ VfD=Vf ; bV mD ¼ VmD=Vf ð49Þ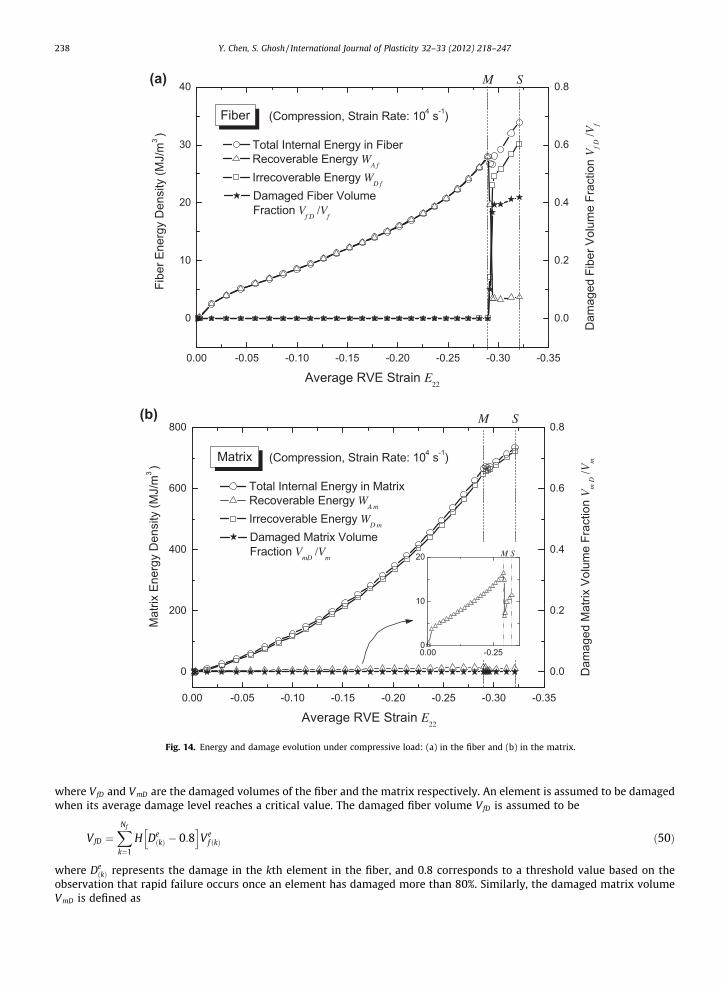
0.00 -0.05 -0.10 -0.15 -0.20 -0.25 -0.30 -0.35
0
10
20
30
40
0.0
0.2
0.4
0.6
0.8
Total Internal Energy in Fiber Recoverable Energy W
A f
Irrecoverable Energy WD f
Fiber (Compression, Strain Rate: 104 s-1)
Average RVE Strain E22
Fibe
r Ene
rgy
Den
sity
(MJ/
m3 )
M S
Damaged Fiber Volume Fraction V
f D/V
f
Dam
aged
Fib
er V
olum
e Fr
actio
n V
f D/V
f
(a)
0.00 -0.05 -0.10 -0.15 -0.20 -0.25 -0.30 -0.35
0
200
400
600
800
0.0
0.2
0.4
0.6
0.8
0.00 -0.250
10
20
Matrix (Compression, Strain Rate: 104 s-1)
Average RVE Strain E22
Mat
rix E
nerg
y D
ensi
ty (M
J/m
3 )
Total Internal Energy in Matrix Recoverable Energy W
A m
Irrecoverable Energy WD m
S
Dam
aged
Mat
rix V
olum
e Fr
actio
n V
m D
/Vm
Damaged Matrix Volume Fraction V
mD/V
m
M
M S
(b)
Fig. 14. Energy and damage evolution under compressive load: (a) in the fiber and (b) in the matrix.
238 Y. Chen, S. Ghosh / International Journal of Plasticity 32–33 (2012) 218–247
where VfD and VmD are the damaged volumes of the fiber and the matrix respectively. An element is assumed to be damagedwhen its average damage level reaches a critical value. The damaged fiber volume VfD is assumed to be
VfD ¼XNf
k¼1
H DeðkÞ � 0:8
h iVe
f ðkÞ ð50Þ
where DeðkÞ represents the damage in the kth element in the fiber, and 0.8 corresponds to a threshold value based on the
observation that rapid failure occurs once an element has damaged more than 80%. Similarly, the damaged matrix volumeVmD is defined as
Y. Chen, S. Ghosh / International Journal of Plasticity 32–33 (2012) 218–247 239
VmD ¼XNm
k¼1
H f eðkÞ � fC
h iVe
mðkÞ ð51Þ
where f eðkÞ is the void volume fraction in the kth element. When f e
ðkÞ reaches the critical value fC in Eq. (9), void growth is accel-erated and the void volume fraction reaches its failure value fF in a very short time.
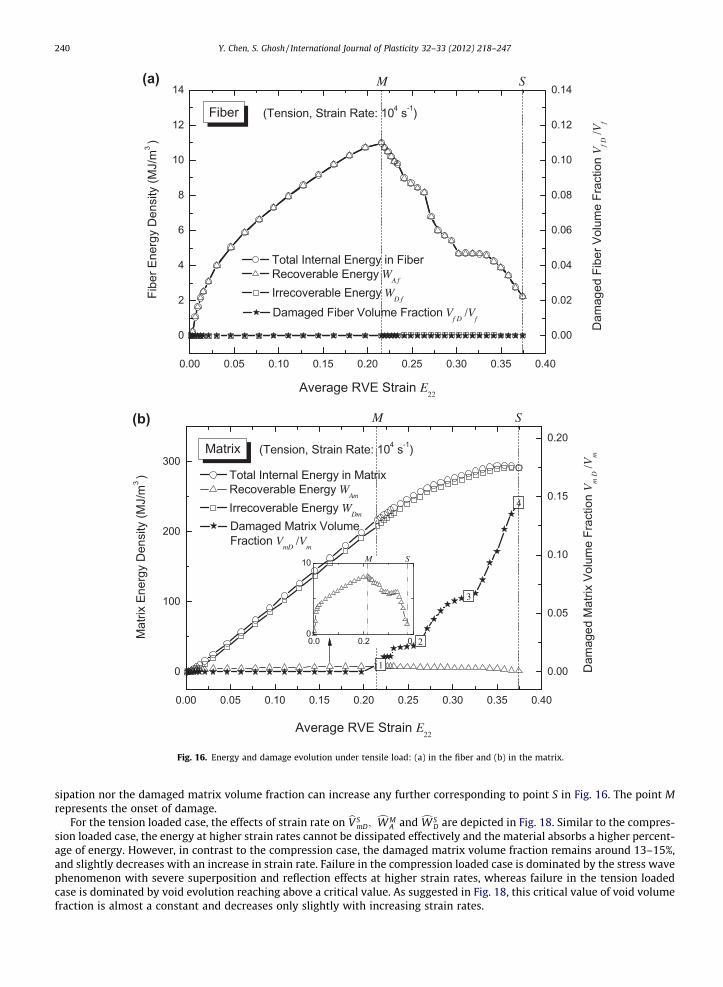
The fiber responses are shown in the graphs of Fig. 14(a). Before fiber damage, there is no energy dissipation in the fiberand all the energy is absorbed. When the macroscopic Lagrangian strain reaches a value of approximately 0.29, the damaged
fiber volume fraction bV fD climbs sharply, which suggests fiber brittle fracture. At this time, the energy absorption drops sud-denly, while most of the energy is dissipated by fiber fracture. This sudden drop occurs at the point M in the graph for which
the value of absorbed energy is a maximum. Beyond this point, the damaged fiber volume fraction bV fD saturates with theabsorption energy remaining at a very low value, and the dissipation energy increasing after a sharp ascent. The damaged
fiber volume fraction bV fD saturates at the point S in the graph of Fig. 14. The fiber damage also affects the matrix behavior
as shown in Fig. 14(b). Although there is no matrix failure ðbV mD � 0Þ, there is a sudden change in the matrix energy. The ma-trix absorbs and dissipates viscoplastic energy at the same time before fiber cracking. At the point M, the average stress levelin the matrix decreases due to the fiber fracture, causing a sudden release in the absorption energy with a slower energydissipation.
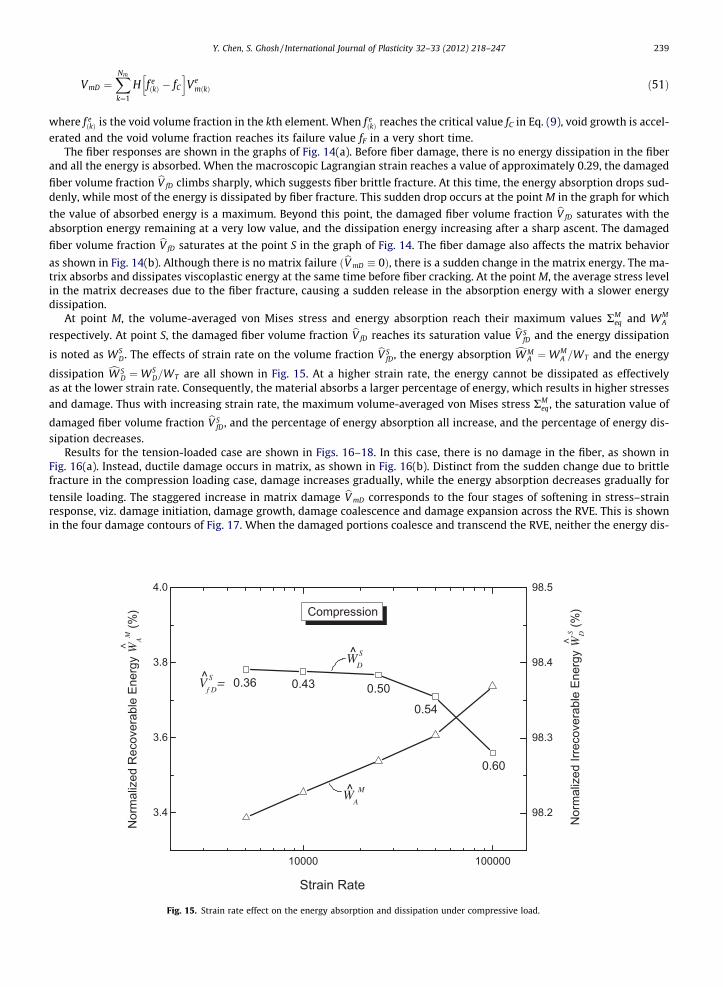
At point M, the volume-averaged von Mises stress and energy absorption reach their maximum values RMeq and WM
A
respectively. At point S, the damaged fiber volume fraction bV fD reaches its saturation value bV SfD and the energy dissipation
is noted as WSD. The effects of strain rate on the volume fraction bV S
fD, the energy absorption cW MA ¼WM
A =WT and the energy
dissipation cW SD ¼WS
D=WT are all shown in Fig. 15. At a higher strain rate, the energy cannot be dissipated as effectivelyas at the lower strain rate. Consequently, the material absorbs a larger percentage of energy, which results in higher stressesand damage. Thus with increasing strain rate, the maximum volume-averaged von Mises stress RM
eq, the saturation value of
damaged fiber volume fraction bV SfD, and the percentage of energy absorption all increase, and the percentage of energy dis-
sipation decreases.Results for the tension-loaded case are shown in Figs. 16–18. In this case, there is no damage in the fiber, as shown in
Fig. 16(a). Instead, ductile damage occurs in matrix, as shown in Fig. 16(b). Distinct from the sudden change due to brittlefracture in the compression loading case, damage increases gradually, while the energy absorption decreases gradually for
tensile loading. The staggered increase in matrix damage bV mD corresponds to the four stages of softening in stress–strainresponse, viz. damage initiation, damage growth, damage coalescence and damage expansion across the RVE. This is shownin the four damage contours of Fig. 17. When the damaged portions coalesce and transcend the RVE, neither the energy dis-
10000 100000
3.4
3.6
3.8
4.0
98.2
98.3
98.4
98.5
^
^
^
Compression
Strain Rate
W S
D
V S
f D=
WA
M
0.36 0.43 0.50
0.54
0.60
Nor
mal
ized
Rec
over
able
Ene
rgy
WA
M (%
) ^
Nor
mal
ized
Irre
cove
rabl
e En
ergy
W S D (%
)^
Fig. 15. Strain rate effect on the energy absorption and dissipation under compressive load.
0.00 0.05 0.10 0.15 0.20 0.25 0.30 0.35 0.40
0
2
4
6
8
10
12
14
0.00
0.02
0.04
0.06
0.08
0.10
0.12
0.14
Total Internal Energy in Fiber Recoverable Energy W
A f
Irrecoverable Energy WD f
Fiber (Tension, Strain Rate: 104 s-1)
Average RVE Strain E22
Fibe
r Ene
rgy
Den
sity
(MJ/
m3 )
M S
Damaged Fiber Volume Fraction Vf D
/Vf
Dam
aged
Fib
er V
olum
e Fr
actio
n V
f D/V
f
(a)
0.00 0.05 0.10 0.15 0.20 0.25 0.30 0.35 0.40
0
100
200
300
0.00
0.05
0.10
0.15
0.20
0.0 0.2 0.40
10
1
2
3
4
Matrix (Tension, Strain Rate: 104 s-1)
Average RVE Strain E22
Mat
rix E
nerg
y D
ensi
ty (M
J/m
3 ) Total Internal Energy in Matrix
Recoverable Energy WAm
Irrecoverable Energy WDm
S
Dam
aged
Mat
rix V
olum
e Fr
actio
n V
m D
/Vm
Damaged Matrix Volume Fraction V
mD/V
m
M
M S
(b)
Fig. 16. Energy and damage evolution under tensile load: (a) in the fiber and (b) in the matrix.
240 Y. Chen, S. Ghosh / International Journal of Plasticity 32–33 (2012) 218–247
sipation nor the damaged matrix volume fraction can increase any further corresponding to point S in Fig. 16. The point Mrepresents the onset of damage.
For the tension loaded case, the effects of strain rate on bV SmD;
cW MA and cW S
D are depicted in Fig. 18. Similar to the compres-sion loaded case, the energy at higher strain rates cannot be dissipated effectively and the material absorbs a higher percent-age of energy. However, in contrast to the compression case, the damaged matrix volume fraction remains around 13–15%,and slightly decreases with an increase in strain rate. Failure in the compression loaded case is dominated by the stress wavephenomenon with severe superposition and reflection effects at higher strain rates, whereas failure in the tension loadedcase is dominated by void evolution reaching above a critical value. As suggested in Fig. 18, this critical value of void volumefraction is almost a constant and decreases only slightly with increasing strain rates.
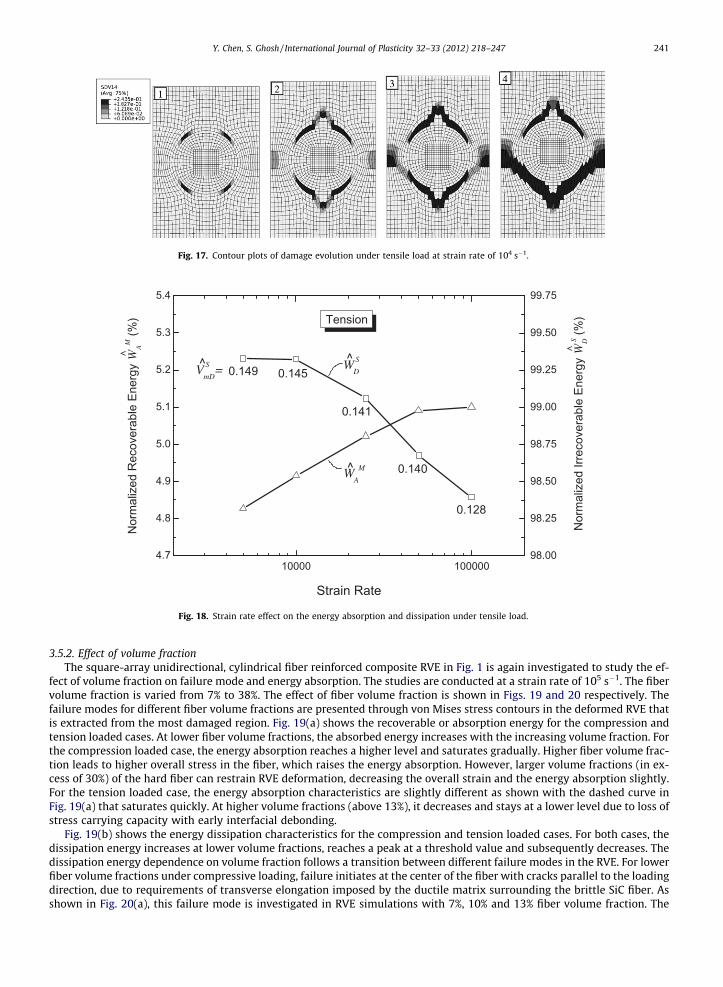
Fig. 17. Contour plots of damage evolution under tensile load at strain rate of 104 s�1.
98.00
98.25
98.50
98.75
99.00
99.25
99.50
99.75
10000 1000004.7
4.8
4.9
5.0
5.1
5.2
5.3
5.4
Strain Rate
^
^
^
Tension
Nor
mal
ized
Rec
over
able
Ene
rgy
WA
M (%
)
W S
D
WA
M
V S
mD=
Nor
mal
ized
Irre
cove
rabl
e En
ergy
W S D (%
)^
0.149 0.145
0.141
0.140
0.128
Fig. 18. Strain rate effect on the energy absorption and dissipation under tensile load.
Y. Chen, S. Ghosh / International Journal of Plasticity 32–33 (2012) 218–247 241
3.5.2. Effect of volume fractionThe square-array unidirectional, cylindrical fiber reinforced composite RVE in Fig. 1 is again investigated to study the ef-
fect of volume fraction on failure mode and energy absorption. The studies are conducted at a strain rate of 105 s�1. The fibervolume fraction is varied from 7% to 38%. The effect of fiber volume fraction is shown in Figs. 19 and 20 respectively. Thefailure modes for different fiber volume fractions are presented through von Mises stress contours in the deformed RVE thatis extracted from the most damaged region. Fig. 19(a) shows the recoverable or absorption energy for the compression andtension loaded cases. At lower fiber volume fractions, the absorbed energy increases with the increasing volume fraction. Forthe compression loaded case, the energy absorption reaches a higher level and saturates gradually. Higher fiber volume frac-tion leads to higher overall stress in the fiber, which raises the energy absorption. However, larger volume fractions (in ex-cess of 30%) of the hard fiber can restrain RVE deformation, decreasing the overall strain and the energy absorption slightly.For the tension loaded case, the energy absorption characteristics are slightly different as shown with the dashed curve inFig. 19(a) that saturates quickly. At higher volume fractions (above 13%), it decreases and stays at a lower level due to loss ofstress carrying capacity with early interfacial debonding.
Fig. 19(b) shows the energy dissipation characteristics for the compression and tension loaded cases. For both cases, thedissipation energy increases at lower volume fractions, reaches a peak at a threshold value and subsequently decreases. Thedissipation energy dependence on volume fraction follows a transition between different failure modes in the RVE. For lowerfiber volume fractions under compressive loading, failure initiates at the center of the fiber with cracks parallel to the loadingdirection, due to requirements of transverse elongation imposed by the ductile matrix surrounding the brittle SiC fiber. Asshown in Fig. 20(a), this failure mode is investigated in RVE simulations with 7%, 10% and 13% fiber volume fraction. The
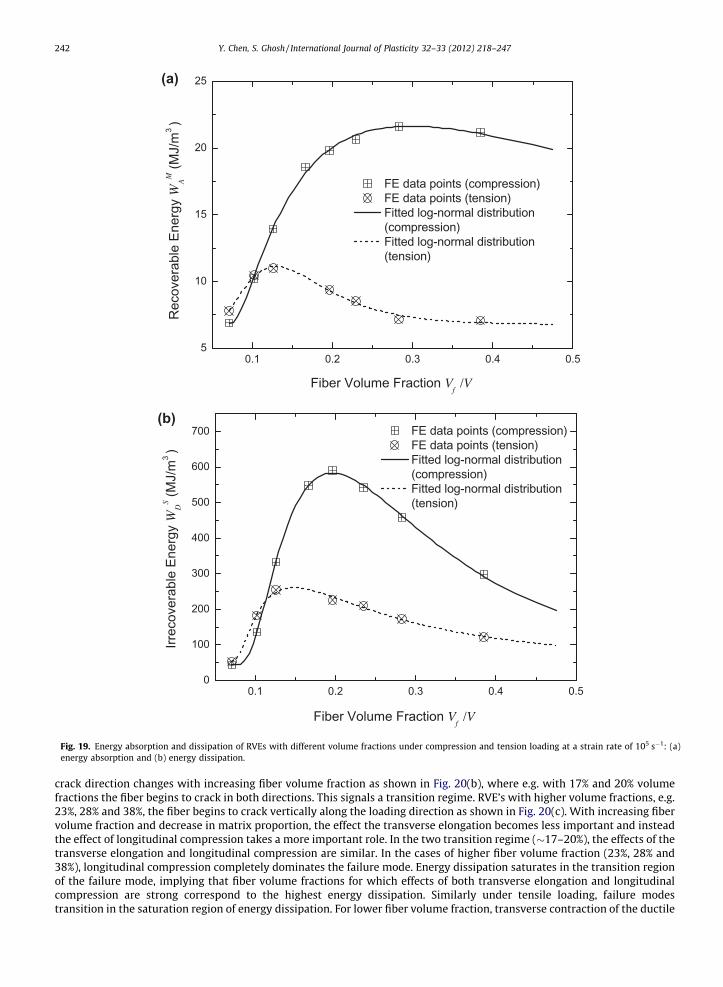
0.1 0.2 0.3 0.4 0.55
10
15
20
25
FE data points (compression) FE data points (tension) Fitted log-normal distribution
(compression) Fitted log-normal distribution
(tension)
Rec
over
able
Ene
rgy
WA
M (M
J/m
3 )
Fiber Volume Fraction Vf
/V
(a)
0.1 0.2 0.3 0.4 0.50
100
200
300
400
500
600
700
Irrec
over
able
Ene
rgy
WD
S (MJ/
m3 )
Fiber Volume Fraction Vf
/V
FE data points (compression) FE data points (tension) Fitted log-normal distribution
(compression) Fitted log-normal distribution
(tension)
(b)
Fig. 19. Energy absorption and dissipation of RVEs with different volume fractions under compression and tension loading at a strain rate of 105 s�1: (a)energy absorption and (b) energy dissipation.
242 Y. Chen, S. Ghosh / International Journal of Plasticity 32–33 (2012) 218–247
crack direction changes with increasing fiber volume fraction as shown in Fig. 20(b), where e.g. with 17% and 20% volumefractions the fiber begins to crack in both directions. This signals a transition regime. RVE’s with higher volume fractions, e.g.23%, 28% and 38%, the fiber begins to crack vertically along the loading direction as shown in Fig. 20(c). With increasing fibervolume fraction and decrease in matrix proportion, the effect the transverse elongation becomes less important and insteadthe effect of longitudinal compression takes a more important role. In the two transition regime (�17–20%), the effects of thetransverse elongation and longitudinal compression are similar. In the cases of higher fiber volume fraction (23%, 28% and38%), longitudinal compression completely dominates the failure mode. Energy dissipation saturates in the transition regionof the failure mode, implying that fiber volume fractions for which effects of both transverse elongation and longitudinalcompression are strong correspond to the highest energy dissipation. Similarly under tensile loading, failure modestransition in the saturation region of energy dissipation. For lower fiber volume fraction, transverse contraction of the ductile
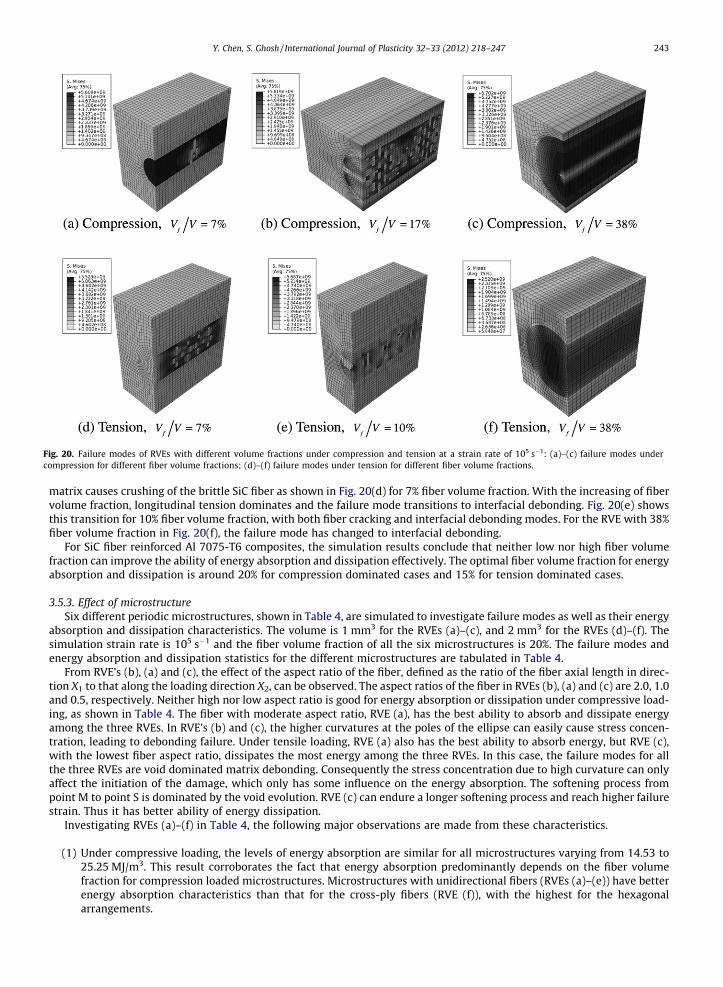
Fig. 20. Failure modes of RVEs with different volume fractions under compression and tension at a strain rate of 105 s�1: (a)–(c) failure modes undercompression for different fiber volume fractions; (d)–(f) failure modes under tension for different fiber volume fractions.
Y. Chen, S. Ghosh / International Journal of Plasticity 32–33 (2012) 218–247 243
matrix causes crushing of the brittle SiC fiber as shown in Fig. 20(d) for 7% fiber volume fraction. With the increasing of fibervolume fraction, longitudinal tension dominates and the failure mode transitions to interfacial debonding. Fig. 20(e) showsthis transition for 10% fiber volume fraction, with both fiber cracking and interfacial debonding modes. For the RVE with 38%fiber volume fraction in Fig. 20(f), the failure mode has changed to interfacial debonding.
For SiC fiber reinforced Al 7075-T6 composites, the simulation results conclude that neither low nor high fiber volumefraction can improve the ability of energy absorption and dissipation effectively. The optimal fiber volume fraction for energyabsorption and dissipation is around 20% for compression dominated cases and 15% for tension dominated cases.
3.5.3. Effect of microstructureSix different periodic microstructures, shown in Table 4, are simulated to investigate failure modes as well as their energy
absorption and dissipation characteristics. The volume is 1 mm3 for the RVEs (a)–(c), and 2 mm3 for the RVEs (d)–(f). Thesimulation strain rate is 105 s�1 and the fiber volume fraction of all the six microstructures is 20%. The failure modes andenergy absorption and dissipation statistics for the different microstructures are tabulated in Table 4.
From RVE’s (b), (a) and (c), the effect of the aspect ratio of the fiber, defined as the ratio of the fiber axial length in direc-tion X1 to that along the loading direction X2, can be observed. The aspect ratios of the fiber in RVEs (b), (a) and (c) are 2.0, 1.0and 0.5, respectively. Neither high nor low aspect ratio is good for energy absorption or dissipation under compressive load-ing, as shown in Table 4. The fiber with moderate aspect ratio, RVE (a), has the best ability to absorb and dissipate energyamong the three RVEs. In RVE’s (b) and (c), the higher curvatures at the poles of the ellipse can easily cause stress concen-tration, leading to debonding failure. Under tensile loading, RVE (a) also has the best ability to absorb energy, but RVE (c),with the lowest fiber aspect ratio, dissipates the most energy among the three RVEs. In this case, the failure modes for allthe three RVEs are void dominated matrix debonding. Consequently the stress concentration due to high curvature can onlyaffect the initiation of the damage, which only has some influence on the energy absorption. The softening process frompoint M to point S is dominated by the void evolution. RVE (c) can endure a longer softening process and reach higher failurestrain. Thus it has better ability of energy dissipation.
Investigating RVEs (a)–(f) in Table 4, the following major observations are made from these characteristics.
(1) Under compressive loading, the levels of energy absorption are similar for all microstructures varying from 14.53 to25.25 MJ/m3. This result corroborates the fact that energy absorption predominantly depends on the fiber volumefraction for compression loaded microstructures. Microstructures with unidirectional fibers (RVEs (a)–(e)) have betterenergy absorption characteristics than that for the cross-ply fibers (RVE (f)), with the highest for the hexagonalarrangements.
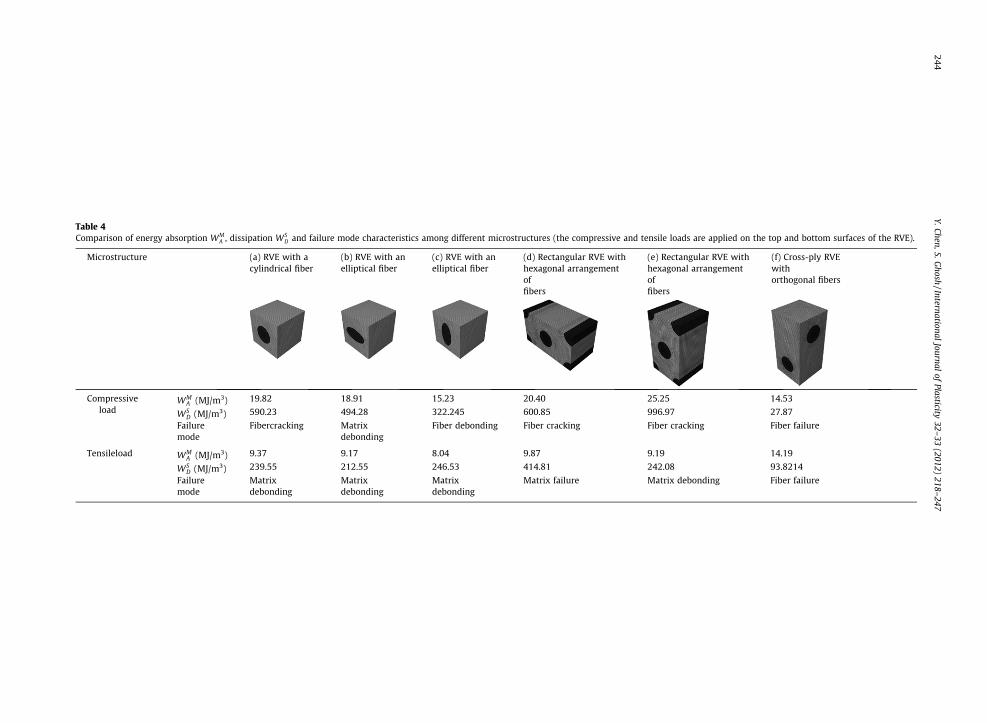
Table 4Comparison of energy absorption WM
A , dissipation WSD and failure mode characteristics among different microstructures (the compressive and tensile loads are applied on the top and bottom surfaces of the RVE).
Microstructure (a) RVE with acylindrical fiber
(b) RVE with anelliptical fiber
(c) RVE with anelliptical fiber
(d) Rectangular RVE withhexagonal arrangementoffibers
(e) Rectangular RVE withhexagonal arrangementoffibers
(f) Cross-ply RVEwithorthogonal fibers
Compressiveload
WMA (MJ/m3) 19.82 18.91 15.23 20.40 25.25 14.53
WSD (MJ/m3) 590.23 494.28 322.245 600.85 996.97 27.87
Failuremode
Fibercracking Matrixdebonding
Fiber debonding Fiber cracking Fiber cracking Fiber failure
Tensileload WMA (MJ/m3) 9.37 9.17 8.04 9.87 9.19 14.19
WSD (MJ/m3) 239.55 212.55 246.53 414.81 242.08 93.8214
Failuremode
Matrixdebonding
Matrixdebonding
Matrixdebonding
Matrix failure Matrix debonding Fiber failure
244Y.Chen,S.G
hosh/International
Journalof
Plasticity32–
33(2012)
218–247
Y. Chen, S. Ghosh / International Journal of Plasticity 32–33 (2012) 218–247 245
(2) Energy dissipation characteristics under compressive loading have a strong dependence on the microstructure. Theunidirectional cylindrical fiber-based RVEs (a), (d) and (e) have high energy dissipation values, with RVE (e) beingthe highest (�60% higher than the others). The corresponding failure mode is fiber cracking. RVEs (b) and (c) with uni-directional elliptical fibers undergo moderate energy dissipation with interfacial debonding failure at locations ofhighest curvature (poles of the ellipse). In RVE (b), transverse elongation dominates and the interfacial debonding ini-tiates in the matrix, while in RVE (c) longitudinal compression dominates, and debonding initiates in the fiber. The RVE(b) has higher energy absorption properties than RVE (c), while the cross-ply fiber microstructure (RVE (f)) has a lowenergy dissipation characteristic. In the latter case, the transverse deformation in both directions is constrained by thehard and brittle SiC fibers and even a small deformation can cause fiber failure.
(3) Under tensile loading, RVEs (a)–(e) with unidirectional fibers have similar energy absorption characteristics, varyingfrom 8.04 to 9.87 MJ/m3. The RVE (f) however has about 50% higher absorption capability, since both the transversedirections are constrained by the hard fiber.
(4) RVEs (a)–(e) with unidirectional fibers have high ductility and possess good energy dissipation properties under ten-sile loading, with RVE (d) being the highest. The primary failure mode for all the RVEs is interfacial debonding. Similarto item (2), the RVE (f) with cross-ply fibers has the lowest energy dissipation under tensile loading.
In view of the energy absorption and dissipation properties, microstructures (d) and (e) with hexagonal arrangement offibers are desirable. In addition, RVE (e) possesses the highest compressive energy dissipation property in one direction,while RVE (d) has the highest tension energy dissipation ability in another direction. It should be noted that microstructureswith hexagonal arrangement of fibers RVEs (d) and (e) are nearly isotropic for elastic behavior. However, their plastic anddamage behavior induces significant anisotropy with increasing deformation.
4. Conclusions
This paper investigates the effect of microstructural morphology and loading characteristics on micromechanical stress-wave propagation leading to different damage mechanisms, energy absorption and dissipation characteristics. The materialmicrostructure is represented by a brittle fiber in a ductile matrix in different arrangements. The matrix material behavior ismodeled using a high-strain-rate dependent elastic-viscoplastic constitutive model with damage evolution. This model isbased on the extended GTN model with a Johnson–Cook type hardening law. It accounts for damage evolution, strain-ratedependence and shear-dominated failure in the matrix. Damage in the fiber is modeled by an isotropic continuum damagemechanics (CDM) model. The damage and failure mechanisms are studied to comprehend microstructural deformation anddamage mechanisms at high strain rates (103–105 s�1). Two types of damage and failure mechanisms are investigated in thispaper, viz. stress wave dominated and void dominated damage and failure. The former mechanism prevails in compressiondominated loading, in which the transmission, reflection and interference of stress waves play an important role in fibercracking at the center or interfaces. The latter mechanism dominates in shear and tension loading, for which damage is gov-erned by void nucleation, growth and coalescence in the matrix. For both mechanisms, stress wave propagation makes thematerials under high strain-rate loading fail at much lower strain levels than those under quasi-static and low strain-rateloadings.
The influence of strain rate, loading type, fiber volume fraction and microstructure on the failure modes, as well as onenergy absorption and dissipation properties, are investigated for SiC fiber/Al7075-T6 composites under high strain-rateloading. Three different failure modes are investigated, viz. fiber cracking, debonding initiating in the matrix and debondinginitiating in the fiber. The microstructural failure modes and energy absorption and dissipation properties show strongdependence on the load types, volume fractions and microstructures, with relatively lower dependence on strain rates.For the same microstructure, the stress–strain curve is very sensitive to the strain rate and higher strain rate causes higherstress. The failure mode and the energy absorption and dissipation characteristics mainly depend on the loading type. Mate-rials under compressive loading can absorb more energy than those under shear and tension loadings. For different micro-structures, it is found that the composites with 15–20% hexagonal arrangement of fibers provide good designs for energyabsorption and dissipation. The micromechanical analysis and results in this paper can be used to develop a homogenizedstrain-rate dependent constitutive model for rate-dependent deformation and failure in composites under dynamic loading.
Acknowledgments
This work has been supported by the Army Research Office through Grant No. DAAD19-02-1-0428 (Program Director: Dr.B. Lamattina) and by the State of Ohio RCP grant. This sponsorship is gratefully acknowledged. Computer support by the OhioSupercomputer Center through Grant PAS813-2 is also gratefully acknowledged.
Appendix A
The coefficients Aij and bi for stress update are given below.
246 Y. Chen, S. Ghosh / International Journal of Plasticity 32–33 (2012) 218–247
A11 ¼@/@qþ DeRp K
@2/@p@q
þ @2/
@q@Ha@Ha
@DeRq
!þ DeRq K
@2/@p2 þ
@2/
@p@Ha@Ha
@DeRp
!
A12 ¼@/@pþ DeRp �3G
@2/@q2 þ
@2/
@q@Ha@Ha
@DeRq
!þ DeRq �3G
@2/@p@q
þ @2/
@p@Ha@Ha
@DeRq
!
b1 ¼ �DeRp@/@q� DeRq
@/@p
A21 ¼ 1þ Dt K@ _k@pþ @ _k
@Ha@Ha
@DeRp
!@/@pþ Dt _k K
@2/@p2 þ
@2/
@p@Ha@Ha
@DeRp
!
A22 ¼ Dt �3G@ _k@qþ @ _k
@Ha@Ha
@DeRq
!@/@pþ Dt _k �3G
@2/@p@q
þ @2/
@p@Ha@Ha
@DeRq
!
b2 ¼ �DeRp � Dt _k@/@p
ðA:1Þ
where Ha (a = 1,2,3) represents the state variables �epM , f, and r0.
References
ABAQUS, 2005. ABAQUS/Explicit User’s Manual, Version 6.5. Providence, Rhode Island, USA.Abu Al-Rub, R.K., Voyiadjis, G.Z., 2006. A finite strain plastic-damage model for high velocity impact using combined viscosity and gradient localization
limiters. Part I – theoretical formulation. Int. J. Damage Mech. 15, 293–334.Aravas, N., 1987. On the numerical integration of a class of pressure-dependent plasticity models. Int. J. Numer. Methods Eng. 24, 1395–1416.Austin, R.A., McDowell, D.L., 2011. A dislocation-based constitutive model for viscoplastic deformation of fcc metals at very high strain rates. Int. J. Plast. 27,
1–24.Bass, J.M., Oden, J.T., 1987. Adaptive finite element methods for a class of evolution problem in viscoplasticity. Int. J. Eng. Sci. 25, 623–653.Batra, R.C., Hassan, N.M., 2007. Response of fiber reinforced composites to underwater explosive loads. Compos. Pt. B-Eng. 38, 448–468.Benallal, A., Berstad, T., Borvik, T., Hopperstad, O.S., Koutiri, I., Nogueira de Codes, R., 2008. An experimental and numerical investigation of the behaviour of
AA5083 aluminium alloy in presence of the Portevin–Le Chatelier effect. Int. J. Plast. 24, 1916–1945.Besson, J., Steglich, D., Brocks, W., 2003. Modeling of plane strain ductile rupture. Int. J. Plast. 19, 1517–1541.Brar, N.S., Joshi, V.S., Harris, B.W., 2009. Constitutive model constants for Al7075-T651 and Al7075-T6. American Physical Society. In: 16th APS Topical
Conference on Shock Compression of Condensed Matter.Brünig, M., Gerke, S., 2011. Simulation of damage evolution in ductile metals undergoing dynamic loading conditions. Int. J. Plast. 27, 1598–1617.Carol, I., Rizzi, E., William, K., 1994. A unified theory of elastic degradation and damage based on a loading surface. Int. J. Solids Struct. 31, 2835–2865.Chaboche, J.L., 1988. Continuum damage mechanics 1. General concepts. J. Appl. Mech.-Trans. ASME 55, 59–64.Chu, C.C., Needleman, A., 1980. Void nucleation effects in biaxially stretched sheets. J. Eng. Matl. Tech. 102, 249–256.Clausen, A.H., Børvik, T., Hopperstad, O.S., Benallal, A., 2004. Flow and fracture characteristics of aluminium alloy AA5083-H116 as function of strain rate,
temperature and triaxiality. Mater. Sci. Eng. A-Struct. Mater. Prop. Microstruct. Process. 364, 260–272.Drugan, W.J., Willis, J.R., 1996. A micromechanics-based nonlocal constitutive equation and estimates of representative volume element size for elastic
composites. J. Mech. Phys. Solids 44, 497–524.Farrokh, B., Khan, A.S., 2009. Grain size, strain rate, and temperature dependence of flow stress in ultra-fine grained and nanocrystalline Cu and Al:
synthesis, experiment, and constitutive modeling. Int. J. Plast. 25, 715–732.Farrokh, B., Khan, A.S., 2010. A strain rate dependent yield criterion for isotropic polymers: low to high rates of loading. Eur. J. Mech. A-Solids 29, 274–282.Fleck, N.A., Hutchinson, J.W., 1993. A phenomenological theory for strain gradient effects in plasticity. J. Mech. Phys. Solids 41, 1825–1857.Follansbee, P.S., Kocks, U.F., 1988. A constitutive description of the deformation of copper based on the use of the mechanical threshold. Acta Metall. 36, 81–
93.Ghosh, S., Kikuchi, N., 1991. An arbitrary Lagrangian–Eulerian finite element method for large deformation analysis of elastic-viscoplastic solids. Comput.
Method Appl. M. 86, 127–188.Ghosh, S., Bai, J., Paquet, D., 2009. A homogenization based continuum plasticity-damage model for ductile failure of materials containing heterogeneities. J.
Mech. Phys. Solids 57, 1017–1044.Green, A.E., Naghdi, P.M., 1965. A general theory of an elastic–plastic continuum. Arch. Ration. Mech. An. 18, 251–281.Gurson, A., 1977. Continuum theory of ductile rupture by void nucleation and growth. J. Eng. Mater. Trans. ASME 99, 2–15.Han, F.S., Zhu, Z.G., Gao, J.C., 1998. Compressive deformation and energy absorbing characteristic of foamed aluminum. Metall. Mater. Trans. A-Phys. Metall.
Mater. Sci. 29, 2497–2502.Hao, S., Brocks, W., 1997. The Gurson–Tvergaard–Needleman-model for rate and temperature-dependent materials with isotropic and kinematic hardening.
Comput. Mech. 20, 34–40.Hu, H.E., Zhen, L., Imai, T., 2010. Strain rate sensitivity of a high strain rate superplastic TiNp/2014 Al composite. J. Mater. Process. Technol. 210, 734–740.Hwang, K.C., Jiang, H., Huang, Y., Gao, H., Hu, N., 2002. A finite deformation theory of strain gradient plasticity. J. Mech. Phys. Solids 50, 81–99.Jacinto, A.C., Ambrosini, R.D., Danesi, R.F., 2001. Experimental and computational analysis of plates under air blast loading. Int. J. Impact Eng. 25, 927–947.Jain, J.R., Ghosh, S., 2009. Damage evolution in composites with a homogenization-based continuum damage mechanics model. Int. J. Damage Mech. 18,
533–568.Johnson, G.R., Cook, W.H., 1983. A constitutive model and data for metals subjected to large strains, high strain rates and high temperatures. In: Proceedings
of the 7th International Symposium on Ballistics, pp. 541–547.Kachanov, L.M., 1958. Time of the rupture process under creep conditions. Isv. Akad. Nauk. SSR. Otd Tekh. Nauk. 8, 26–31.Kanel, G.I., Zaretsky, E.B., Rajendran, A.M., Razorenov, S.V., Savinykh, A.S., Paris, V., 2009. Search for conditions of compressive fracture of hard brittle
ceramics at impact loading. Int. J. Plast. 25, 649–670.Kanit, T., Forest, S., Galliet, I., Mounoury, V., Jeulin, D., 2003. Determination of the size of the representative volume element for random composites:
statistical and numerical approach. Int. J. Solids Struct. 40, 3647–3679.Khan, A.S., Baig, M., 2011. Anisotropic responses, constitutive modeling and the effects of strain-rate and temperature on the formability of an aluminum
alloy. Int. J. Plast. 27, 522–538.Khan, A.S., Farrokh, B., 2006. Thermo-mechanical response of nylon 101 under uniaxial and multi-axial loadings. Part I: experimental results over wide
ranges of temperatures and strain rates. Int. J. Plast. 22, 1506–1529.
Y. Chen, S. Ghosh / International Journal of Plasticity 32–33 (2012) 218–247 247
Khan, A.S., Liang, R.Q., 1999. Behaviors of three BCC metals over wide range of strain rates and temperatures: experiments and modeling. Int. J. Plast. 15,1089–1109.
Khan, A.S., Suh, Y.S., Kazmi, R., 2004. Quasi-static and dynamic loading responses and constitutive modeling of titanium alloys. Int. J. Plast. 20, 2233–2248.Khan, A.S., Kazmi, R., Farrokh, B., 2007a. Multiaxial and non-proportional loading responses, anisotropy and modeling of Ti–6Al–4V titanium alloy over wide
ranges of strain rates and temperatures. Int. J. Plast. 23, 931–950.Khan, A.S., Kazmi, R., Farrokh, B., Zupan, M., 2007b. Effect of oxygen content and microstructure on the thermo-mechanical response of three Ti-6Al-4V
alloys: experiments and modeling over a wide range of strain-rates and temperatures. Int. J. Plast. 23, 1105–1125.Kouznetsova, V., Geers, M.G.D., Brekelmans, W.A.M., 2002. Multi-scale constitutive modelling of heterogeneous materials with a gradient-enhanced
computational homogenization scheme. Int. J. Numer. Methods Eng. 54, 1235–1260.Kumar, P., Garg, A., 1988. Failure modes and fractographic study of glass-epoxy composite under dynamic compression. J. Mater. Sci. 23, 2305–2309.Langdon, G.S., Chung Kim Yuen, S., Nurick, G.N., 2005. Experimental and numerical studies on the response of quadrangular stiffened plates. Part II: localised
blast loading. Int. J. Impact Eng. 31, 85–111.Leblond, J.B., Perrin, G., Suquet, P., 1994. Exact results and approximate models for porous viscoplastic solids. Int. J. Plast. 10, 213–235.Lee, J., Mal, A., 1998. Chracterization of matrix damage in metal matrix composites under transverse loads. Comput. Mech. 21, 339–346.Lemaitre, J., Chaboche, J.-L., 1990. Mechanics of Solid Materials. Cambridge University Press.Liang, R., Khan, A.S., 2000. Behaviors of three BCC metals during non-proportional multi-axial loadings and predictions using a recently proposed model. Int.
J. Plast. 16, 1443–1458.Lloyd, D.J., 1994. Particle-reinforced aluminum and magnesium matrix composites. Int. Mater. Rev. 39, 1–23.Mamalis, A.G., Manolakos, D.E., Ioannidis, M.B., Papapostolou, D.P., 2005. On the response of thin-walled CFRP composite tubular components subjected to
static and dynamic axial compressive loading: experimental. Compos. Struct., 69 407–420.Meyers, M.A., Andrade, U.R., Chokshi, A.H., 1995. The effect of grain size on the high-strain, high-strain-rate behavior of copper. Metall. Mater. Trans. A-Phys.
Metall. Mater. Sci. 26, 2881–2893.Nahshon, K., Hutchinson, J.W., 2008. Modification of the Gurson model for shear failure. Eur. J. Mech. A. Solids 27, 1–17.Nahshon, K., Xue, Z., 2009. A modified Gurson model and its application to punch-out experiments. Eng. Fract. Mech. 76, 997–1009.Nemat-Nasser, S., 1999. Averaging theorems in finite deformation plasticity. Mech. Mater. 31, 493–523.Nemat-Nasser, S., Choi, Y.C., 2005. Strain rate dependence of deformation mechanisms in a Ni–Ti–Cr shape-memory alloy. Acta Mater. 53, 449–454.Nemat-Nasser, S., Choi, J.Y., Guo, W.-G., Isaacs, J.B., Taya, M., 2005a. High strain-rate, small strain response of a NiTi shape-memory alloy. J. Eng. Mater.
Technol. 127, 83–89.Nemat-Nasser, S., Choi, J.Y., Guo, W.-G., Isaacs, J.B., 2005b. Very high strain-rate response of a NiTi shape-memory alloy. Mech. Mater. 37, 287–298.Nemat-Nasser, S., Su, Y., Guo, W.G., Isaacs, J., 2005c. Experimental characterization and micromechanical modeling of superelastic response of a porous NiTi
shape-memory alloy. J. Mech. Phys. Solids 53, 2320–2346.Nemat-Nasser, S., Kang, W.J., McGee, J.D., Guo, W.-G., Isaacs, J.B., 2007. Experimental investigation of energy-absorption characteristics of components of
sandwich structures. Int. J. Impact Eng. 34, 1119–1146.Oguni, K., Ravichandran, G., 2001. Dynamic compressive behavior of unidirectional E-glass/vinylester composites. J. Mater. Sci. 36, 831–838.Pao, Y.H., Mow, C.C., 1973. The Diffraction of Elastic Waves and Dynamic Stress Concentrations. Crane Russak.Paquet, D., Ghosh, S., 2010. Microstructural effects on ductile fracture in heterogeneous materials: Part I. sensitivity analysis with LE-VCFEM. Eng. Fract.
Mech.Pellegrino, C., Galvanetto, U., Schrefler, B.A., 1999. Numerical homogenization of periodic composite materials with non-linear material components. Int. J.
Numer. Methods Eng. 46, 1609–1637.Peng, X., Pi, W., Fan, J., 2008. A microstructure-based constitutive model for the pseudoelastic behavior of NiTi SMAs. Int. J. Plast. 24, 966–990.Preston, D.L., Tonks, D.L., Wallace, D.C., 2003. Model of plastic deformation for extreme loading conditions. J. Appl. Phys. 93, 211–220.Rao, K.T.V., Siu, S.C., Ritchie, R.O., 1993. Failure mechanisms in SiC-fiber reinforced 6061 aluminum alloy composites under monotonic and cyclic loading.
Metall. Mater. Trans. A-Phys. Metall. Mater. Sci. 24, 721–734.Segurado, J., Llorca, J., 2002. A numerical approximation to the elastic properties of sphere-reinforced composites. J. Mech. Phys. Solids 50, 2107–2121.Shalu, T., Abhilash, E., Joseph, M.A., 2009. Development and characterization of liquid carbon fibre reinforced aluminium matrix composite. J. Mater. Process.
Technol. 209, 4809–4813.Simo, J.C., Ju, J.W., 1987. Strain- and stress-based continuum damage models-I. Formulation. Int. J. Solids Struct. 23, 821–840.Specialty Materials Inc., 2010. <http://www.specmaterials.com/>.Steinberg, D.J., Lund, C.M., 1988. A constitutive model for strain rates from 10�4 to 106 s�1. Journal de physique. Colloques 49, 3-3.Steinberg, D.J., Cochran, S.G., Guinan, M.W., 1980. A constitutive model for metals applicable at high-strain rate. J. Appl. Phys. 51, 1498–1504.Swaminathan, S., Ghosh, S., 2006. Statistically equivalent representative volume elements for composite microstructures. Part II: with damage. J. Comput.
Mater. 40 (7), 605–621.Swaminathan, S., Ghosh, S., Pagano, N.J., 2006. Statistically equivalent representative volume elements for composite microstructures. Part I: without
damage. J. Comput. Mater. 40 (7), 583–604.Tvergaard, V., 1981. Influence of voids on shear band instabilities under plain strain conditions. Int. J. Fract. 17, 389–407.Tvergaard, V., 1982. On localization in ductile materials containing spherical voids. Int. J. Fract. 18, 237–252.Tvergaard, V., 1990. Material failure by void growth to coalescence. Adv. Appl. Mech. 27, 83–151.Tvergaard, V., Needleman, A., 1984. Analysis of cup-cone fracture in a round tensile bar. Acta Metall. 32, 157–169.Tvergaard, V., Needleman, A., 1995. Effect of nonlocal damage in porous plastic solids. Int. J. Solids Struct. 32, 1063–1077.Valiev, R.Z., Salimonenko, D.A., Tsenev, N.K., Berbon, P.B., Langdon, T.G., 1997. Observations of high strain rate superplasticity in commercial aluminum
alloys with ultrafine grain sizes. Scripta. Mater. 37, 1945–1950.Voyiadjis, G.Z., Abu Al-Rub, R.K., 2006. A finite strain plastic-damage model for high velocity impact using combined viscosity and gradient localization
limiters. Part II: numerical aspects and simulation. Int. J. Damage Mech. 15, 335–373.Wen, J., Huang, Y., Hwang, K.C., Liu, C., Li, M., 2005. The modified Gurson model accounting for the void size effect. Int. J. Plast. 21, 381–395.Wu, C.T., Koishi, M., 2009. A meshfree procedure for the microscopic analysis of particle-reinforced rubber compounds. Interact. Multiscale Mech. 2, 147–
169.Xue, Z., Pontin, M.G., Zok, F.W., Hutchinson, J.W., 2010. Calibration procedures for a computational model of ductile fracture. Eng. Fract. Mech. 77, 492–509.Zerilli, F.J., Armstrong, R.W., 1987. Dislocation-mechanics-based constitutive relations for material dynamics calculations. J. Appl. Phys. 61, 1816–1825.Zhou, Y., Mahfuz, H., Jeelani, S., 2005. Numerical simulation for high strain rate failure process of unidirectional Sicf-Al composites. Int. J. Damage Mech. 14,
321–341.