MicroLog - Temp & Humidity Logger · MicroLab establishes a connection with the MicroLog. The...
46
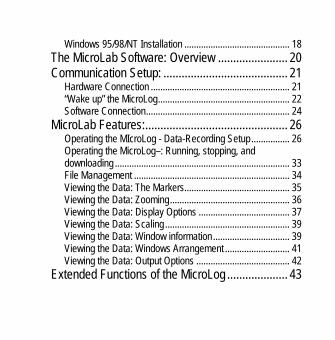
Page MicroLog - Temp & Humidity Logger Contents .................................................. 2 Introduction ............................................. 5 Principles of Data Logging...................................... 5 The MicroLog Device................................. 6 Keys and Connections............................................ 6 Battery Replacement .............................................. 7 The Default State of the MicroLog .......................... 8 The MicroLog’s Buttons .......................................... 9 Viewing Min. and Max Values in the Last 1-24 Hours ......... 10 Viewing Min. and Max Values in the last 1-30 Days............ 11 Viewing the MicroLog’'s Status ............................................ 13 Downloading Data to a computer via IRDA Port ................. 15 The MicroLab Software ............................17 Introduction ........................................................... 17 Installation ............................................................ 18 Windows 3.X Installation ...................................................... 18
Transcript of MicroLog - Temp & Humidity Logger · MicroLab establishes a connection with the MicroLog. The...

Page
MicroLog - Temp & Humidity LoggerContents .................................................. 2Introduction ............................................. 5
Principles of Data Logging...................................... 5The MicroLog Device................................. 6
Keys and Connections............................................ 6Battery Replacement .............................................. 7The Default State of the MicroLog.......................... 8The MicroLog’s Buttons.......................................... 9
Viewing Min. and Max Values in the Last 1-24 Hours......... 10Viewing Min. and Max Values in the last 1-30 Days............ 11Viewing the MicroLog’'s Status ............................................ 13Downloading Data to a computer via IRDA Port ................. 15
The MicroLab Software ............................17Introduction........................................................... 17Installation ............................................................ 18
Windows 3.X Installation...................................................... 18
Page
Windows 95/98/NT Installation ............................................ 18The MicroLab Software: Overview ....................... 20Communication Setup: ......................................... 21
Hardware Connection .......................................................... 21“Wake up” the MicroLog....................................................... 22Software Connection............................................................ 24
MicroLab Features:............................................... 26Operating the MIcroLog - Data-Recording Setup................ 26Operating the MicroLog–: Running, stopping, anddownloading ......................................................................... 33File Management ................................................................. 34Viewing the Data: The Markers............................................ 35Viewing the Data: Zooming.................................................. 36Viewing the Data: Display Options ...................................... 37Viewing the Data: Scaling .................................................... 39Viewing the Data: Window information................................ 39Viewing the Data: Windows Arrangement ........................... 41Viewing the Data: Output Options ....................................... 42
Extended Functions of the MicroLog .................... 43

Page
Technical Specifications ...........................46

Page
IntroductionPrinciples of Data LoggingA data logger is a device that collects data andstores it in its memory for further analysis ordisplay. The MicroLog is a small data logger with2 internal sensors and 1 external sensor port.Before working with a data logger, you need tobe familiarized with a few basic terms:Sensor –A component that transforms physicaldata to electronic data recorded by theMicroLog’s processor.Selected Sensors – As a user, you can decidewhich of the sensors will participate in the datarecording. You select the sensors by using theMicroLab software.Sample – A single measurement taken by thedata-logging device, and stored in its memory. In
Page
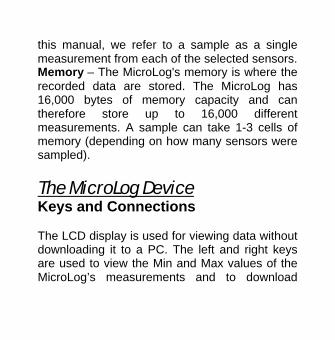
this manual, we refer to a sample as a singlemeasurement from each of the selected sensors.Memory – The MicroLog's memory is where therecorded data are stored. The MicroLog has16,000 bytes of memory capacity and cantherefore store up to 16,000 differentmeasurements. A sample can take 1-3 cells ofmemory (depending on how many sensors weresampled).
The MicroLog DeviceKeys and Connections
The LCD display is used for viewing data withoutdownloading it to a PC. The left and right keysare used to view the Min and Max values of theMicroLog’s measurements and to download
Page
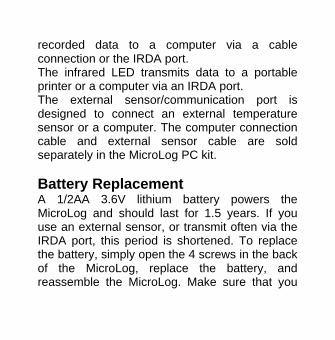
recorded data to a computer via a cableconnection or the IRDA port.The infrared LED transmits data to a portableprinter or a computer via an IRDA port.The external sensor/communication port isdesigned to connect an external temperaturesensor or a computer. The computer connectioncable and external sensor cable are soldseparately in the MicroLog PC kit.
Battery ReplacementA 1/2AA 3.6V lithium battery powers theMicroLog and should last for 1.5 years. If youuse an external sensor, or transmit often via theIRDA port, this period is shortened. To replacethe battery, simply open the 4 screws in the backof the MicroLog, replace the battery, andreassemble the MicroLog. Make sure that you
Page
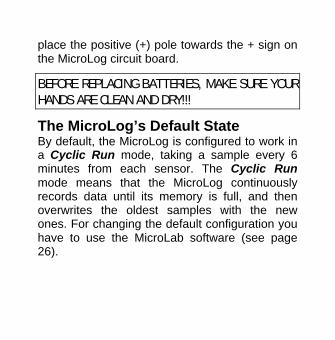
place the positive (+) pole towards the + sign onthe MicroLog circuit board.
BEFORE REPLACING BATTERIES, MAKE SURE YOURHANDS ARE CLEAN AND DRY!!!
The MicroLog’s Default StateBy default, the MicroLog is configured to work ina Cyclic Run mode, taking a sample every 6minutes from each sensor. The Cyclic Runmode means that the MicroLog continuouslyrecords data until its memory is full, and thenoverwrites the oldest samples with the newones. For changing the default configuration youhave to use the MicroLab software (see page26).

Page
The MicroLog’s ButtonsThe MicroLog device has 2 keys used to displayand transmit its data and status. The following
pages deal with the functions of these 2 keys.
Page
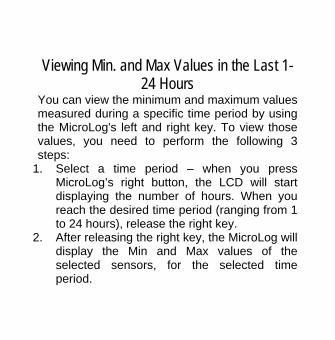
Viewing Min. and Max Values in the Last 1-24 Hours
You can view the minimum and maximum valuesmeasured during a specific time period by usingthe MicroLog's left and right key. To view thosevalues, you need to perform the following 3steps: 1. Select a time period – when you press
MicroLog’s right button, the LCD will startdisplaying the number of hours. When youreach the desired time period (ranging from 1to 24 hours), release the right key.
2. After releasing the right key, the MicroLog willdisplay the Min and Max values of theselected sensors, for the selected timeperiod.

Page
3. (Optional) After releasing the right key, theMicroLog will send an IR signal of the Minand Max values for the time period selectedin step 1. To receive a printout of this data,point the MicroLog to the IR printer (HPportable printer – model No. 82240B).
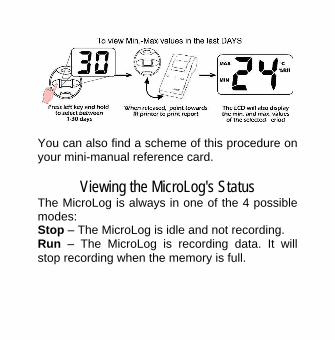
Viewing Min. and Max Values in the last 1-30 Days
Using the MicroLog’s keys you can view the Minand Max values measured during a specific timeperiod. To perform this function you need toperform the following 3 steps: 1. Select a time period – When you press the
MicroLog’s left key, the LCD will startdisplaying the number of days. When you

Page
reach the desired time period (ranging from 1to 30 days) release the left key.
2. After releasing the left key, the MicroLog willdisplay the Min and Max values of theselected sensors, for the selected timeperiod.
3. (Optional) After releasing the left key, theMicroLog will send an IR signal of the Minand Max values for the time period youselected in step 1. To receive a printout ofthis data, point the MicroLog to the IR printer(HP portable printer – model No. 82240B).
Page
You can also find a scheme of this procedure onyour mini-manual reference card.
Viewing the MicroLog's StatusThe MicroLog is always in one of the 4 possiblemodes:Stop – The MicroLog is idle and not recording.Run – The MicroLog is recording data. It willstop recording when the memory is full.

Page
Cyclic Run – Same as Run, but the MicroLogoverwrites the old measurements (starting withthe oldest one) when the memory is full.Timer Run – You can configure the MicroLog tostart recording at a predetermined time. Whenthe MicroLog is set for such a delayed run, theMicroLog’s status is set to Timer Run. Once theMicroLog starts recording, the status changes toeither Run or Cyclic Run, depending on yourconfiguration. The following diagram indicateshow to view the status of the MicroLog:

Page
When you press both keys simultaneously, theMicroLog’s LCD will display the status of theMicroLog. It will also “wake up” the MicroLogdevice for communication with a computer.
Downloading Data to a computer via IRDAPort
The MicroLog is equipped with an infraredtransmitter. Using the MicroLog’s keys you cantransmit the data stored in the MicroLog’smemory to your computer’s IRDA port. To

Page
perform this function you need to perform thefollowing 4 steps: 1. Open the MicroLab software in yourcomputer.
2. Point the MicroLog towards the computer’sIRDA port.
3. Hold both keys down for 2 seconds. TheMicroLog’s LCD will change to PC.
4. The MicroLog downloads all the data to thecomputer and displays a graph of it.
The following scheme shows how to downloadthe data:

Page
The MicroLab Software
IntroductionTo set the MicroLog up for recording data, youhave to use the MicroLab software. TheMicroLab software is also required fordownloading, viewing and saving recorded data.This section provides you with a detailedguideline for the MicroLab.

Page
InstallationWindows 3.X Installation 1. Insert the MicroLab diskette into your 3.5”
drive. 2. From the File menu in the Program
Manager, choose Run. 3. Type in the full path to the installation
program in the command line- setup.exe(e.g., a:\setup), and press Enter.
4. Follow the simple instructions outlined inthe setup program.
Windows 95/98/NT Installation 1. Insert the MicroLab diskette into your 3.5”
drive. 2. Choose Run from the START menu.
Page
3. Type the full path to the installationprogram in the command line- setup.exe(e.g., a:\setup), and press ENTER.
4. Follow the simple instructions outlined inthe setup program.

Page
The MicroLab Software: OverviewThe following diagram provides you with a briefdescription of MicroLab's screen:
Open File
Save As…
Full view
Stop
Download Data tocomputer
CommentDisplay options
Windowsarrangements
Save File
Zoom tool
Run
Set alarm level
Com-portselection
Output to…
MicroLog setupSelect sensors for next measurement::
Temperature
Humidity, click the arrow t calibrate
External temperature sensor
Select the time increment for datarecording
Select starting time for data recording orclick here to reset.
Select regular run or cyclic run
Click to send setup to the MicroLog
Page
Communication Setup:You set the MicroLog up for recording, saving,downloading, and viewing the data from yourcomputer. Connecting the MicroLog to thecomputer is a 3-step operation: 1. Hardware connection – Connect the
MicroLog to the computer. 2. “Wake up” the MicroLog – Open the
MicroLog’s COM port for computer communi-cation.
3. Software Connection – Establish aconnection using MicroLab (Done once onlyafter installation)
Hardware ConnectionIn your MicroLog PC connection kit you will finda serial cable. One end of this cable connects toan empty serial port on the back of your
Page
computer. Note that you may need to use a9/25-pin adapter (this applies mostly to non-Pentium computers).Connect the other end of this serial cable to thecomputer connection socket on the back of yourMicroLog device.
“Wake up” the MicroLogSince communication utilizes a lot of power, theMicroLog device is not generally open forcommunication. When transferring data to andfrom the MicroLog we must first open theMicroLog communication port. This is doneeither manually by pressing the 2 MicroLogbuttons until the MicroLog shows its status, orfrom the MicroLab software.
Page
Whenever sending a command from theMicroLab the software “checks” whether theprevious command was acknowledged by theMicroLog. If it was not acknowledged theMicroLab next command will “wake up” theMicroLog.
Page
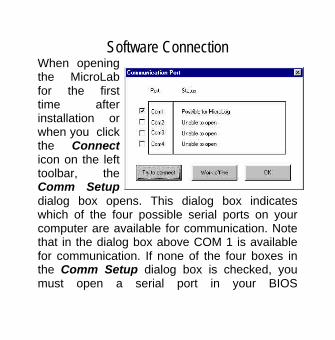
Software ConnectionWhen openingthe MicroLabfor the firsttime afterinstallation orwhen you clickthe Connecticon on the lefttoolbar, theComm Setupdialog box opens. This dialog box indicateswhich of the four possible serial ports on yourcomputer are available for communication. Notethat in the dialog box above COM 1 is availablefor communication. If none of the four boxes inthe Comm Setup dialog box is checked, youmust open a serial port in your BIOS

Page
configuration. If you do not know how to open aserial port on your computer, refer to yourcomputer vendor.
By clicking the Try to connect button, theMicroLab establishes a connection with theMicroLog. The Connected window opens. ClickOK - the MicroLog is nowready to communicate withthe computer. Once aconnection is establishedwith the MicroLog, you can perform alloperations from the MicroLab software. Thefollowing section provides additional informationregarding various MicroLab features.
Note: Click the Connect icon only when you want tochange the communication COM port
Page
MicroLab Features:Operating the MicroLog - Data-Recording
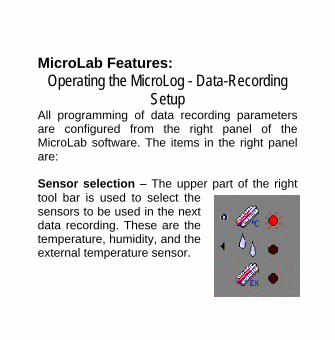
SetupAll programming of data recording parametersare configured from the right panel of theMicroLab software. The items in the right panelare:
Sensor selection – The upper part of the righttool bar is used to select thesensors to be used in the nextdata recording. These are thetemperature, humidity, and theexternal temperature sensor.
Page
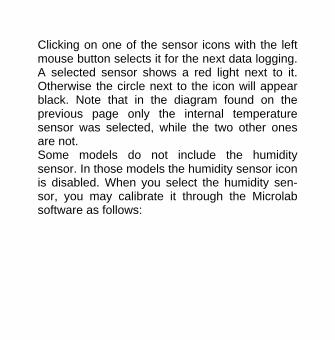
Clicking on one of the sensor icons with the leftmouse button selects it for the next data logging.A selected sensor shows a red light next to it.Otherwise the circle next to the icon will appearblack. Note that in the diagram found on theprevious page only the internal temperaturesensor was selected, while the two other onesare not.Some models do not include the humiditysensor. In those models the humidity sensor iconis disabled. When you select the humidity sen-sor, you may calibrate it through the Microlabsoftware as follows:

Page
1. Click the arrowto the left of theHumidity sensoricon. TheCalibrate dialogbox opens.
2. Make sure thatthe MicroLog ison standbymode (i.e. itmeasures, but doesn’t save the result in itsmemory).
3. Measure the humidity in two known values(e.g. 23% and 75%).
4. Fill in those values together with the valuesthe MicroLog is showing.

Page
5. Click Calibrate. The MicroLog takes aboutfive seconds to calculate the new linearconversion for the relative humidity. After theMicroLog finishes the calculation, thecalibration dialog box closes.
Sample interval – This digital display is used todetermine the amount of time between every twosamples taken by theMicroLog. To change thesample interval, simplyclick on the digit that youwish to change. A click onthe left mouse button makes the digit rise by oneunit. A click on the right mouse button lowers itaccordingly. The largest sample interval is 120minutes and the smallest one 10 seconds. The

Page
picture found on the previous page shows asample interval of 10 seconds.
Start Time – You may set the MicroLog to startthe data recording at apredetermined date andtime. This is done bychanging the Start Timedisplay. By default, thestart time is set to your current time and date. Aclick on the left or right mouse button on timeand date changes it to the start time of yourchoice. If you want to return to the default timeand date, click on the small reset button. In thepicture above, the starting time was set to4:30pm on January 1st, 2001. The number 01refers to the year 2001.
Page
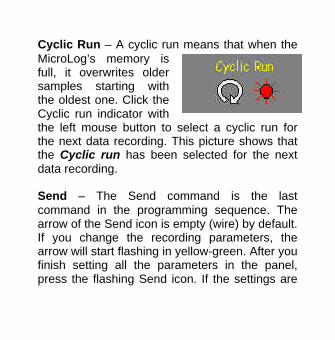
Cyclic Run – A cyclic run means that when theMicroLog’s memory isfull, it overwrites oldersamples starting withthe oldest one. Click theCyclic run indicator withthe left mouse button to select a cyclic run forthe next data recording. This picture shows thatthe Cyclic run has been selected for the nextdata recording.
Send – The Send command is the lastcommand in the programming sequence. Thearrow of the Send icon is empty (wire) by default.If you change the recording parameters, thearrow will start flashing in yellow-green. After youfinish setting all the parameters in the panel,press the flashing Send icon. If the settings are

Page
downloaded properly to the MicroLog device, theSend arrow stops flashing and returns to thedefault wire-frame mode.
If the icon changes to a broken red arrow, thesettings were not saved in the MicroLog due to acommunication problem.
Note: Make sure that the MicroLog is in Standbymode before using the Send command
Page
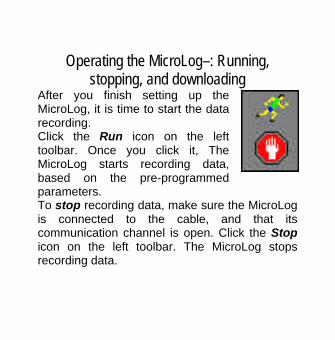
Operating the MicroLog–: Running,stopping, and downloading
After you finish setting up theMicroLog, it is time to start the datarecording.Click the Run icon on the lefttoolbar. Once you click it, TheMicroLog starts recording data,based on the pre-programmedparameters.To stop recording data, make sure the MicroLogis connected to the cable, and that itscommunication channel is open. Click the Stopicon on the left toolbar. The MicroLog stopsrecording data.

Page
Downloading is done by clickingthe Data Download icon on the lefttoolbar. Make sure that theMicroLog's communication port is open.
File managementThe three top icons found on theMicroLab’s left toolbar are used forfile management. Clicking the Openicon opens saved files. Clicking theSave icon saves the file you arecurently working on. If you save yourresults the first time, you have toenter a file name into a dialog boxopening up. The file name cannotconsist of more than 8 characters.The extension of the data files used by MicroLabis *.SMP.
Page
The Save As… icon is used to save an alreadysaved data file under a different name.
Viewing the Data: The MarkersThe MicroLab software supplies you with ahelpful marker tool. The marker is used to viewthe data at a specific moment, or to measure thedifference between two points in a graph.To place a marker on a graph, simply double-click on the desired place on the graph. A blackarrow will appear on the graph and at the bottomof the graph a window displaying thecorresponding Y and t values will open. You canmove the marker by placing the mouse pointeron it, holding the left mouse button, and draggingthe marker to the left or right. You can also placethe mouse pointer on the marker, left-click once,
Page
and then move the marker by using the left andright arrow keys on your keyboard.Placing a second marker is done the same way.When you place the second marker, the data atthe bottom of the window include the values for∆X; ∆t. ∆ refers to the difference values betweenthe markers.To remove a marker, click on it with the rightmouse button.
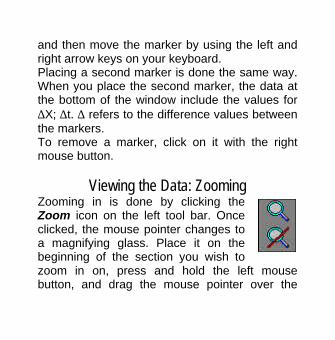
Viewing the Data: ZoomingZooming in is done by clicking theZoom icon on the left tool bar. Onceclicked, the mouse pointer changes toa magnifying glass. Place it on thebeginning of the section you wish tozoom in on, press and hold the left mousebutton, and drag the mouse pointer over the
Page
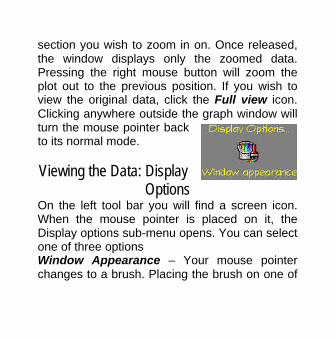
section you wish to zoom in on. Once released,the window displays only the zoomed data.Pressing the right mouse button will zoom theplot out to the previous position. If you wish toview the original data, click the Full view icon.Clicking anywhere outside the graph window willturn the mouse pointer backto its normal mode.
Viewing the Data: DisplayOptions
On the left tool bar you will find a screen icon.When the mouse pointer is placed on it, theDisplay options sub-menu opens. You can selectone of three optionsWindow Appearance – Your mouse pointerchanges to a brush. Placing the brush on one of

Page
the graphs or on the background of your datawindow and clicking there with the left mousebutton opens a color dialog box, in which youcan select a different color for graphs orbackground.Clicking on one of the data graphs with the rightmouse button opens the Line preferences dialogbox, where you can select line type, line width,and a symbol to be placed where the data pointswere recorded.Placing the brush on the X or Y-axis of yourgraphs, or on the graph title, opens the Fontdialog box, in which you can select the font type,size and color for the axis and the main title.
Page
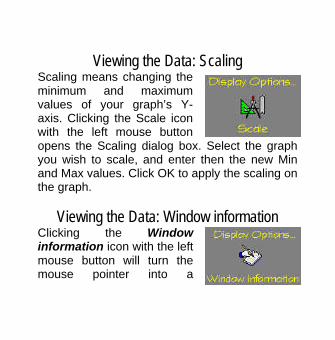
Viewing the Data: ScalingScaling means changing theminimum and maximumvalues of your graph’s Y-axis. Clicking the Scale iconwith the left mouse buttonopens the Scaling dialog box. Select the graphyou wish to scale, and enter then the new Minand Max values. Click OK to apply the scaling onthe graph.
Viewing the Data: Window informationClicking the Windowinformation icon with the leftmouse button will turn themouse pointer into a

Page
notepad. Placing it on a graph and clicking itopens the Information window, where you cansee or change the graph's name, enter a title forthe graph’s Y-axis, view the applied sensor andstart time for that graph.Placing the notepad icon on the graph’s titlewindow and clicking on the left button of themouse, opens the Information window whereyou can change the title of the window, enter atitle for the X-axis, and view the sensor and thetotal number of samples taken. In both the dialogboxes, the mouse pointer returns to its normalmode upon clicking OK. If you wish to continueusing the notepad mouse pointer, click “SeeMore Info”.

Page
Viewing the Data: Windows ArrangementOn the bottom of the lefttoolbar, you will find theWindows submenu.Place the mouse pointeron the icon to see theoptions for arranging the windows:Tile – Displays all open windows next to eachother so that they fill the MicroLab’s work area.Cascade – Alters all open windows so that theyall have the same size, and arranges them in acascading fashion on the top at the left side ofthe screen.Close all – Closes all open windows.Exit – Exits MicroLab.

Page
Viewing the Data: Output OptionsPlacing the mouse pointer on theoutput icon in the left toolbardisplays the output options of theMicroLab software. There are 3output options:Output to printer –printsthe active graph.Output to CSV file – ACSV (Comma SeparatedValues) file is a standardspreadsheet data file, compatible with Excel,Lotus, and many other spreadsheet programs.Output to Excel – Saves the data as a CSV fileand automatically opens the file in Excel (ifEXCEL 5 is installed on your computer).
Page
Extended Functions of the MicroLogThe MicroLog has a few unique featuresextending its functionality and making it mucheasier to use.
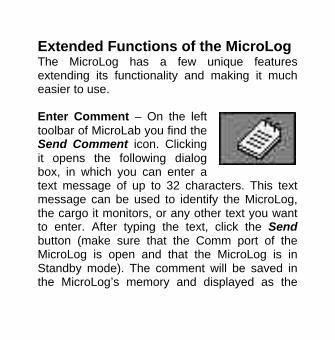
Enter Comment – On the lefttoolbar of MicroLab you find theSend Comment icon. Clickingit opens the following dialogbox, in which you can enter atext message of up to 32 characters. This textmessage can be used to identify the MicroLog,the cargo it monitors, or any other text you wantto enter. After typing the text, click the Sendbutton (make sure that the Comm port of theMicroLog is open and that the MicroLog is inStandby mode). The comment will be saved inthe MicroLog’s memory and displayed as the

Page
main title of the data graph after the data aredownloaded.
Alarm Level – In the left toolbaryou find the Alarm icon. Thealarm function enables the userto select a specific alarm levelfor internal and externaltemperature sensors and the humidity sensor.When this level is crossed, the MicroLog’sdisplay starts flashing on and off. The displaycontinues flashing even if the measurement thatset the alarm off returns to its normal state. Tocancel the flashing of the MicroLog’s display andto view the Min and Max values, which triggeredthe alarm, press one of the MicroLog’s keys.Upon displaying these values, the MicroLog

Page
continues the data recording and the flashingstops.To select the alarm levels, click the alarm icon inthe MicroLab software. The Alarm Levels dialogbox opens. Note that the set default valuesdisplayed for the alarm levels are the max.Values possible for each sensor. Change thelevels of internal and external temperature andhumidity sensors. Click the Send button to sendthe alarm data to the MicroLog (make sure thatthe MicroLog is open for communication and inStandby mode). The RESET button changes thelevels back to their default values.

Page
Technical SpecificationsInputTwo Built-in sensors:
Temperature: -30°C - 50°C (-22.3°F - 121.7°F), Resolution0.5°C (0.9°F), accuracy ±0.6°C (±1.08°F).Humidity: 0-90% (resolution 0.5%, accuracy ±3% @ 25°C).
One ext. temperature sensor: -50°C - 100°C (-57.6°F - 211.7°F),accuracy ±1.5°C (±2.7°F)
Model: EC600: Temperature + External InputEC650: Temperature + Humidity + External Input
OutputTwo digits 7-segment LCDIRDA Interface to Portable HP-PrinterIRDA Interface to PC Host (RS-232)RS-232 Cable connection to the PC (additional to IRDA port)

Page
Memory Capacity16000 recording samples
Power SupplyInternal Lithium Battery - 3.6V TL5101Battery Life - About two years, replaceable(Might vary when external sensors are connected )
Sampling RateUser defined: from every 10 sec to every 2 hours
DimensionsThickness - 22.9 mmWidth - 72 mm diameterWeight - 55 gr.
EC650 – Dust proof IP60 standard compliance.EC600 – Water and Dust proof IP65 standard.Year 2000 bug compatible - 4 digit year value.CE, FCC compliance.