
Microfluidic Synthesis of Superparamagnetic Iron Oxide ... · PDF fileMicrofluidic Synthesis...
151
Microfluidic Synthesis of Superparamagnetic Iron Oxide Nanocrystals for Magnetic Resonance Imaging Submitted for the degree of Doctor of Philosophy BY Kritika Kumar -August13- Department of Chemistry Imperial College London University of London
Transcript of Microfluidic Synthesis of Superparamagnetic Iron Oxide ... · PDF fileMicrofluidic Synthesis...

Microfluidic Synthesis of
Superparamagnetic Iron Oxide
Nanocrystals for Magnetic Resonance
Imaging
Submitted for the degree of Doctor of Philosophy
BY
Kritika Kumar
-August13-
Department of Chemistry
Imperial College London
University of London

Microfluidic Synthesis of Superparamagnetic Iron Oxide Nanocrystals for Magnetic Resonance Imaging
1
With love to my husband & daughter

Microfluidic Synthesis of Superparamagnetic Iron Oxide Nanocrystals for Magnetic Resonance Imaging
2
Declaration of Originality
Except where specific reference is made, the material contained in this thesis is the result of
my own work and has not already been submitted, either wholly or in part, to satisfy any
degree requirement at this or any other university.
Kritika Kumar
August 2013

Microfluidic Synthesis of Superparamagnetic Iron Oxide Nanocrystals for Magnetic Resonance Imaging
3
Copyright Declaration
‘The copyright of this thesis rests with the author and is made available under a Creative
Commons Attribution Non-Commercial No Derivatives Licence. Researchers are free to
copy, distribute or transmit the ethesis on the condition that they attribute it, that they do not
use it for commercial purposes and that they do not alter, transform or build upon it. For any
resue or redistribution, researchers must take clear to others the licence terms of this work’.

Microfluidic Synthesis of Superparamagnetic Iron Oxide Nanocrystals for Magnetic Resonance Imaging
4
“We must conduct research and then accept the results. If they don't
stand up to experimentation, Buddha's own words must be rejected.”
-Dalai Lama XIV
Microfluidic Synthesis of Superparamagnetic Iron Oxide Nanocrystals for Magnetic Resonance Imaging
5
Abstract
Superparamagnetic iron oxide nanoparticles (SPIONs) are of significant interest in areas
such as drug delivery, hyperthermic treatment, magnetic resonance imaging (MRI) and
selective separation of biological fluids. For all these applications there is a recognised need
for improved synthetic methods that are capable of yielding SPIONs of uniform size,
geometry and stoichiometry.
Microfluidic reactors offer an attractive route to nanoparticle synthesis due to the superior
control they provide over reaction conditions and particle properties relative to traditional bulk
methods. In 2002 Edel et al.1 proposed the use of microfluidic reactors for nanoparticle
synthesis due to the high levels of control they provide over key reaction parameters such as
temperature, reagent concentrations and reaction time. Since that report a diversity of metal,
metal oxide, compound semiconductor and organic nanomaterials have been successfully
synthesised in microfluidic systems.
Most reports of nanoparticle synthesis in microreactors have involved single-phase mode of
operation, in which continuous streams of miscible fluids are manoeuvred through
microscale channels where nucleation and growth take place. Such reactors, however, are
poorly suited to the synthesis of SPIONs due to their high susceptibility to fouling. An
alternative approach is to use droplet-based reactors in which an immiscible liquid is injected
alongside the reaction mixture, causing the latter to spontaneously divide into a series of
near identical droplets.
In this thesis microfluidic synthesis of SPIONs in a controlled and reproducible manner is
described. This work is focussed on improving the microfluidic methods for controlled
synthesis of SPIONs and utilise the produced nanoparticles directly as contrast enhancers in
MR imaging. The droplet based reactions were initially performed on polydimethylsiloxane
(PDMS) microfluidic devices, however on such devices, low throughput was obtained. To
overcome fabrication difficulty and to increase throughput, droplet-based synthesis was
performed on the capillary-based reactor.

Microfluidic Synthesis of Superparamagnetic Iron Oxide Nanocrystals for Magnetic Resonance Imaging
6
Acknowledgements
Firstly, I would like to thank both my supervisors Prof. John deMello and Prof. Andrew
deMello. John for believing in me and helping me get departmental funding for the final year,
and Andrew for providing this area of research to me. They have been highly motivating and
supportive and without their encouragement and contribution this thesis wouldn’t have been
possible.
Secondly, I would like to thank Dr. Adrian Nightingale who stood by me in distress and
helped me with all the experimental problems I faced. In addition his contribution towards the
content and figures of the paper got me my first publication. Thanks to Dr Xize Niu for
teaching me device fabrication. I would also like to thank Dr Siva Krishnadasan for helping
me solve the technical problems and being a good friend. Thanks to all my group members
for keeping the office lively.
I would also like to thank Dr Ekaterina Ware and Dr. Adrakani at TEM suite for training me to
use electron microscope and Dr. Will Branford and Katharina Zeissler in the physics
department for helping with the VSM measurements. I would like to extend my special
thanks to Dr Nazila Kamaly and Dr Marzena Wylenzinska-Arridge at Hammersmith hospital
for performing MRI studies on my samples.
This acknowledgement wouldn’t be complete without thanking my husband for his immense
love and support and my mom in law for being there when I needed her the most and the
entire family for putting up with me throughout this phase.
Finally, I would end by thanking my beloved parents especially my dad for his guidance, love
and to make me what I am today. I wouldn’t have come this far without them.
Microfluidic Synthesis of Superparamagnetic Iron Oxide Nanocrystals for Magnetic Resonance Imaging
7
List of Publications and Presentations
Microfluidic Synthesis of Superparamagnetic Iron Oxide Nanoparticles for Biomedical Applications
K. Kumar M.C. González, A.J. deMello, IV Workshop Nanosciencia y Nanotecnología Analíticas, Zaragoza 9 Septiembre 2010, Oral and Poster presentation
Colloidal nanocrystals synthesised in a versatile capillary-based droplet
reactor
Adrian M. Nightingale, Siva H. Krishnadasan, Kritika Kumar, Deborah Berhanu, Chris
Drury, Rob McIntyre, Eva Valsami-Jones, John C. de Mello, RSC's 10th International
Conference on Materials Chemistry, Manchester, 4-7th July 2011, Poster presentation
Direct Synthesis of Dextran-Coated Superparamagnetic Iron Oxide
Nanoparticles in a Capillary-Based Droplet Reactor
K. Kumar, A. M. Nightingale, S. H. Krishnadasan, N. Kamaly, M. Wylenzinska-
Arridge, K. Zeissler, W.R. Branford, E.Ware, A.J. deMello and J.C. deMello, Journal
of Materials Chemistry, 2012,22, 4704-4708

Microfluidic Synthesis of Superparamagnetic Iron Oxide Nanocrystals for Magnetic Resonance Imaging
8
List of Symbols and Abbreviations
SPIONs Superparamagnetic Iron Oxide Nanoparticles
MRI Magnetic Resonance Imaging
nm Nanometre
MNPs Magnetic Nanoparticles
Hc Coercivity
χ Susceptibility
Dc Critical diameter
U Magnetic anisotropic energy barrier
Ku Magnetic anisotropic constant
V Volume
kT Thermal energy
Tb Blocking temperature
Fe3O4 Magnetite
γ-Fe2O3 Maghemite
RES Reticulo Endothelial System
α-Fe2O3 Hematite
FeO Wüstite
Oh Octahedral
Td Tetrahedral
pHPzc pH at point zero charge
T1 Spin-Lattice relaxation time
T2 Spin-Spin relaxation time
Re Reynolds number
δ Hydrodynamic diameter
ρ Density of the fluid
ν Velocity of the flowing fluid
Microfluidic Synthesis of Superparamagnetic Iron Oxide Nanocrystals for Magnetic Resonance Imaging
9
η
Fluid viscosity
Ca
Capillary number
Γ
Surface Tension
Sf
Solvent fraction
PDMS
Polydimethylsiloxane
PTFE
Polytetrafluoroethylene
ODE
Octadecene
FEP
Fluorinated Ethylene Propylene
PEEK Polyether Ether Ketone
TEM
Transmission Electron Microscopy
VSM
Vibrating sample Magnetometry
SAED
Selected Area Electron Diffraction
EDX
Electron Dispersive X-Ray Spectroscopy
Msat
Saturation Magnetization
FTIR
Fourier Transform Infrared Spectroscopy
Vd
Droplet volume
Vc
Merging chamber volume
σd
Size distribution
S
Signal intensity
TE
Echo time
S0
Signal intensity
ICP-AES
Inductively Coupled Plasma-Atomic Emission Spectroscopy
r2
Relaxivity
Microfluidic Synthesis of Superparamagnetic Iron Oxide Nanocrystals for Magnetic Resonance Imaging
10
List of Figures
Figure 1.1 A) Plot showing the transition of a particle from multiple domains to single
domain. As the particle size decreases, the nanoparticles become single domain and
possess superparamagnetism B) Superparamagnetic materials show zero remnance and
coercivity as can be seen in red. Image adapted from reference [9b].
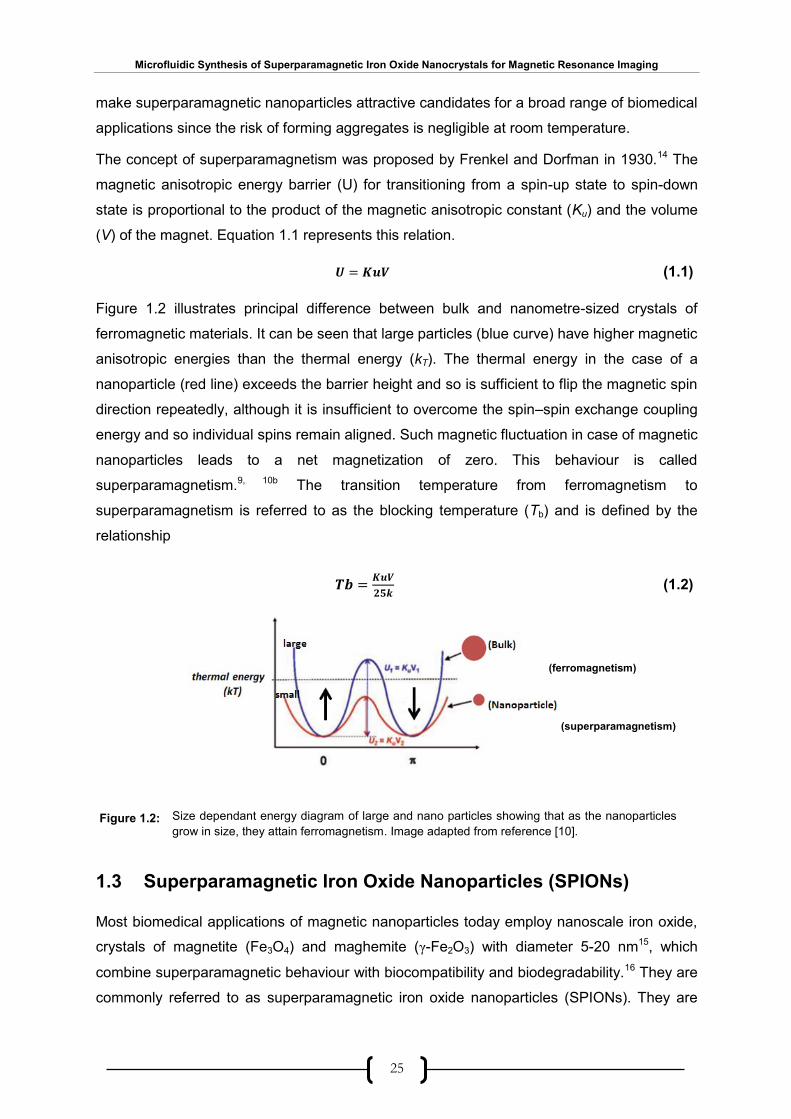
Figure 1.2 Size dependant energy diagram of large and nanoparticles showing that as
the nanoparticles grow in size, they attain ferromagnetism. Image adapted from reference
[10].
Figure 1.3 Spinel structures of A) magnetite and B) maghemite. In magnetite Fe ions
fully occupy the tetrahedral and octahedral sites of the spinel structure, while in case of
maghemite cationic vacancies are present within the octahedral sites. Image reproduced
from reference [19].
Figure 1.4 Schematic of polymer coated γ-Fe2O3 nanoparticles and chemical structures
of two widely used polymer coatings. The branched poly (ethylene imine) (PEI) was used for
the first layer (red), and poly (ethylene oxide)-b-poly (glutamic acid) (PEO-PGA) was used for
the second layer (blue and green, respectively). Image reproduced from reference [25].
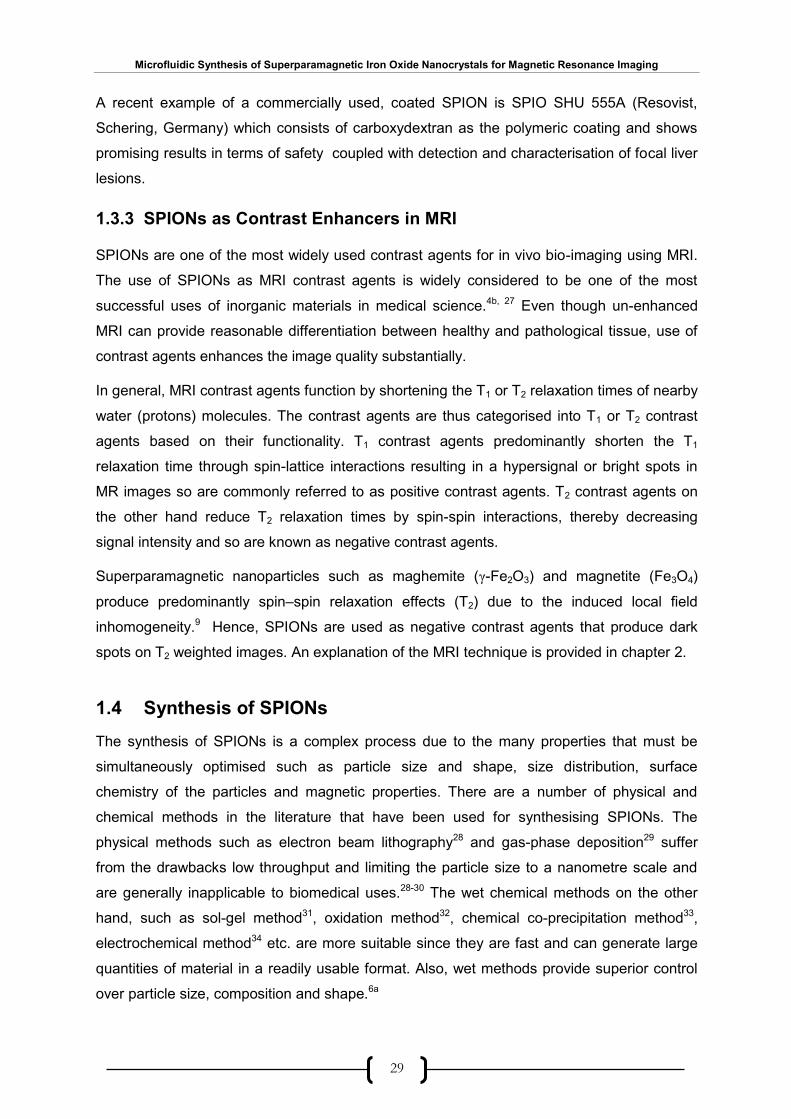
Figure 1.5 Schematic of the reaction of magnetite formation, from an aqueous mixture of
ferrous and ferric chlorides, by the addition of a base. Equation 1.3 shows the oxidation of
magnetite to maghemite. Image reproduced from reference [5a].
Figure 1.6 TEM results of A) γ-Fe2O3 nanoparticles synthesised by thermal
decomposition of Fe(Cup)3) B) Fe3O4 nanocrystals prepared by thermal decomposition of
Fe(acac)3. Image reproduced from reference [45].
Figure 1.7 TEM images of γ-Fe2O3 nanoparticles: (A) 7 nm, (B) 11 nm, (C) 13 nm. Image
reproduced from reference [40].
Figure 1.8 Scheme for the ultra-large-scale synthesis of monodisperse nanocrystals.
Metal–oleate precursors were prepared from the reaction of metal chlorides and sodium
oleate. The thermal decomposition of the metal–oleate precursors in high boiling solvent
produced monodisperse nanocrystals. Image reproduced from reference [40].
Figure 1.9 TEM micrograph of 12 nm magnetite nanocrystals prepared by Park et al. The
image shows that the nanoparticles are highly uniform in particle-size distribution. Inset is a
photograph showing a petridish containing 40 g of the monodisperse magnetite
nanocrystals. Image reproduced from reference [47].
Figure 1.10 La’mer diagram showing the formation of nuclei by supersaturation followed
by growth to form the nanoparticles Image reproduced from reference [49].
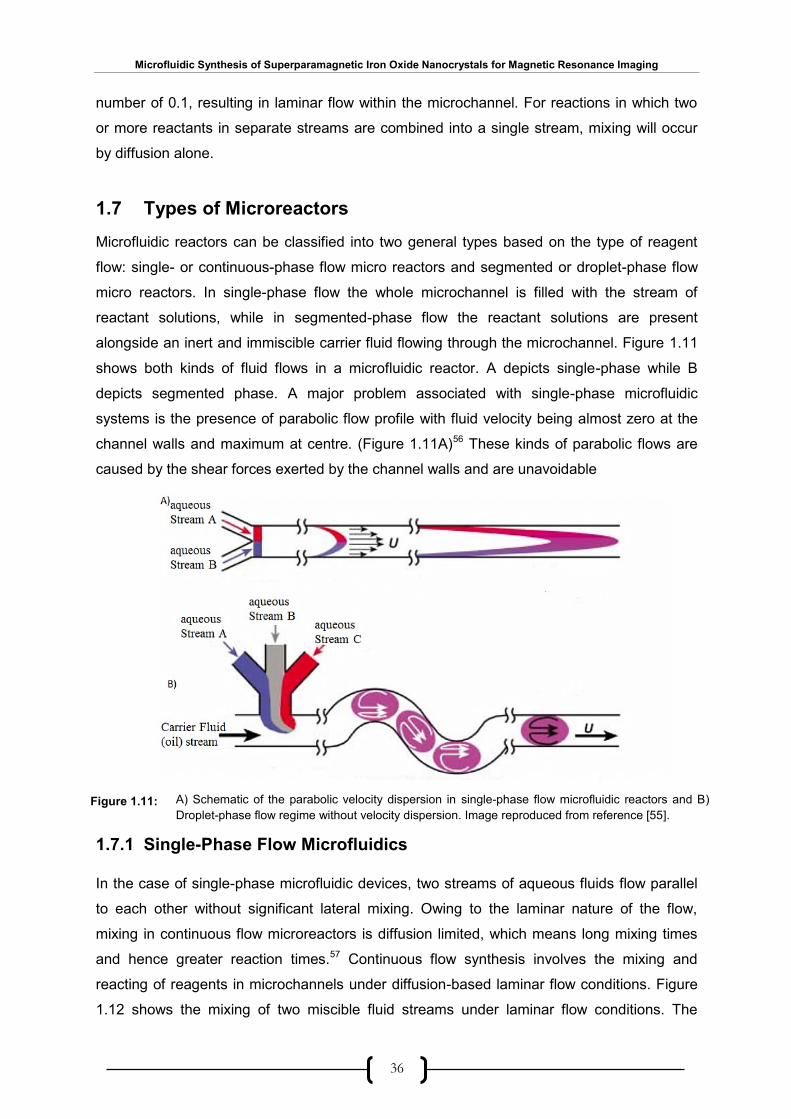
Figure 1.11 A) Schematic of the parabolic velocity dispersion in single-phase flow
microfluidic reactors and B) Droplet-phase flow regime without velocity dispersion. Image
reproduced from reference [55].
Figure 1.12 Schematic of two miscible fluid streams under laminar flow conditions. Image
reproduced from reference [56].

Microfluidic Synthesis of Superparamagnetic Iron Oxide Nanocrystals for Magnetic Resonance Imaging
11
Figure 1.13 Schematic of oil/water droplet-based microfluidic reactor. Droplets are formed
by injecting aqueous solutions into a stream of water-immiscible carrier fluid. Fluid flow within
the droplets is indicated by white arrows. Image reproduced from reference [60].
Figure 1.14 Formation of droplets in A) Flow-focussing geometry B) T-junction geometry.
Images reproduced from references [64] and [65] respectively.
Figure 1.15 Schematic view of generation of droplet pairs through hydrodynamically
coupled nozzles. Two aqueous phases are injected through the outer channels and are
synchronously emulsified by the central oil inlet. The flow rates are Qo=800 µl h-1 for oil,
Qx=400 µl h-1, Qy=100 µl h-1 for the aqueous phases. Image reproduced from reference [68].
Figure 1.16 Schematic view of Frenz’s system for coalescence of droplet pairs by applying
voltage U between the two electrodes. Image reproduced from reference [68].
Figure 1.17 A) Schematic of the pillar based merging element. The merging chamber is
250 um in width and divided into three branches by two rows of pillars B) Illustration of
merging of two droplets. Image reproduced from reference [69].
Figure 1.18 Mixing process in droplets moving through a straight channel A)
Compartmentalization of droplet into two vortices B) solutions are mixed only in the left and
right halves, resulting in slow and inefficient mixing C) Solutions in the front and back halves
of the channel are mixed via recirculation resulting in efficient mixing. Image reproduced from
reference [60].
Figure 1.19 Clay model demonstrating the mixing of two components by chaotic advection
due to stretching and folding within droplets. Image reproduced from reference [60].
Figure 1.20 A) Picture showing the synthesis of CdS by continuous flow system leading to
the accumulation of solid CdS on the walls of the channels after 6 minutes. B) Picture
showing no accumulation of solid CdS on the walls of the channels 6 minutes after the flow
when the synthesis was performed using droplet flow. Image reproduced from reference [76].
Figure 1.21 Formation of iron oxide precipitates after coalescence of pairs of droplets.
Qo=650 µl h-1(oil), Qx =60 µl h-1 (iron chloride solution), and Qy =120 µl h-1 (ammonium
hydroxide). Image reproduced from reference [68].
Figure 1.22 A) TEM micrograph showing 4±1 nm iron oxide nanoparticles synthesised in a
droplet-based microfluidic device using fusion of droplets by electrocoalescence (shown in
bottom inset). The inset on the left shows the crystalline nature of the nanoparticles. Image
reproduced from reference [68].
Figure 1.23 A) Schematic diagram of the experimental setup used by Duraiswamy et al. to
grow Au nanorods from seeds in droplets using a PDMS chip. B) Schematic showing droplet
generation, mixing of the reagents and subsequent growth of Au nanorods. C) TEM image of
typical Au nanorods obtained at low Ag+ concentration D) TEM image of the product at high
Ag+ concentration. Image reproduced from reference [79].
Figure 1.24 A) Schematic of droplet reactor used for high temperature nanoparticle
synthesis, showing the complete system of droplet generation, heating by oil bath and in-line
optical detection for real time analysis B) Fluorescence spectra of CdSe quantum dots

Microfluidic Synthesis of Superparamagnetic Iron Oxide Nanocrystals for Magnetic Resonance Imaging
12
synthesised in the droplet reactor showing the variation of the emission characteristics with
(a) temperature, (b) residence time in the heated oil-bath. Images reproduced from reference
[58c].
Figure 2.1 Backbone structure of Polydimethylsiloxane (PDMS) showing organosilicon
bonds. PDMS is the selected material for chip-based microfluidic devices employed for
SPIONs synthesis.
Figure 2.2 Schematic for fabricating a SU-8 master. There are four steps namely,
deposition of SU-8 photoresist on the silicon wafer, UV-exposure, development and
silanization
Figure 2.3 Spin speed versus thickness curves for selected SU-8 photoresists. Image
reproduced from reference [82].
Figure 2.4 Recommended exposure time required for selected SU-8 photoresist. Image
reproduced from reference [82].
Figure 2.5 Schematic for PDMS microfluidic device fabrication. There are four steps
namely, pouring, baking, peeling and bonding.
Figure 2.6 Schematic of the experimental setup used for the chip-based microfluidic
synthesis of SPIONs. The setup consists of syringe pumps fitted with syringes, a microfluidic
reactor, in this case a PDMS micro-chip, an optical microscope.
Figure 2.7 A) Experimental setup for microfluidic synthesis of SPIONs, showing each of
the individual components, labelled in red arrows B) Photograph of the operational PDMS
microfluidic chip with PTFE tubing connected to inlets and outlets.
Figure 2.8: Photograph of the capillary-droplet reactor while it is being used for SPION
synthesis. The reactor is made up of silicone tubing into which two glass capillaries are
inserted. PTFE tubing is inserted into the other end of the silicone tubing within which
droplets containing the SPIONs are flowed.
Figure 2.9 Zeeman diagram, showing the splitting of nuclear spins into lower and higher
energy states under the influence of external magnetic field Bo. Higher energy state is
composed of spins aligned anti-parallel to Bo, while lower energy state consist of spins
aligned parallel to Bo. Image reproduced from reference [87a].
Figure 2.10 Protons precess around the applied field at Larmor frequency, resulting in a
net magnetization vector, M, along Z-axis. Image reproduced from reference [88a].
Figure 2.11 Spin-lattice (T1) and spin-spin (T2) relaxation processes which occur after the
radiofrequency pulse is switched off. Image reproduced from reference [88a].
Figure 1.12: MRI images of hepatic dome comparing the visibility of the lesion before and
after injecting commercial SPIONs (Ferumoxide: 1.4 ml) A) MR image without contrast agent
where lesion is not visible B) MR image after injection of contrast agent, clearly showing the
lesion marked in white arrow. Image reproduced from reference [92].
Figure 3.1 A) TEM micrograph of SPIONs synthesised via co-precipitation route using
NH4OH as the base B) Size distribution showing average diameter of ~ 9 nm C) SAED
Microfluidic Synthesis of Superparamagnetic Iron Oxide Nanocrystals for Magnetic Resonance Imaging
13
pattern showing a crystal structure corresponding to Fe3O4 and γ-Fe2O3. Images are
representative of the entire sample.
Figure 3.2 A) EDX spectrum showing the peaks of all the elements in the sample B)
VSM plot of iron oxide nanoparticles prepared via co-precipitation using NH4OH as the base,
having Msat value of 17.85 emu g-1.
Figure 3.3 A) TEM micrograph of SPIONs synthesised via co-precipitation route using
NaOH as the base B) Size distribution showing average diameter of ~ 5 nm C) SAED pattern
showing a crystal structure corresponding to Fe3O4 and γ-Fe2O3. Images are representative
of the entire sample.
Figure 3.4 A) EDX spectrum showing the peaks of all the elements in the sample B)
VSM plot of iron oxide nanoparticles prepared via co-precipitation using NaOH as the base,
having Msat value of 7.9 emu g-1.
Figure 3.5 Molecular structure of dextran.
Figure 3.6 Reaction sketch map showing the preparation of dextran-coated Fe3O4
nanoparticles. Image reproduced from reference [14].
Figure 3.7 A) TEM micrograph of dextran-coated SPIONs synthesized via co-
precipitation route in the presence of hydrazine hydrate B) Size distribution showing an
average diameter of 5 nm C) SAED pattern showing crystal structure corresponding to Fe3O4
and γ-Fe2O3.The images are representative of the entire sample.
Figure 3.8 A) EDX spectrum showing elemental sample composition B) VSM plot of iron
oxide nanoparticles prepared via co-precipitation using hydrazine hydrate, having Msat value
of 21.43 emu g-1.
Figure 3.9 A) TEM micrograph of dextran-coated SPIONs prepared in the absence of
hydrazine hydrate B) Size distribution showing average diameter of 17 nm C) SAED pattern
showing crystal structure corresponding to Fe3O4 and γ-Fe2O3.The images are
representative of the entire sample.
Figure 3.10 A) EDX spectrum showing the peaks of all the elements in the sample B)
VSM plot of iron oxide nanoparticles prepared via co-precipitation using hydrazine hydrate,
having Msat value of 25.85 emu g-1.
Figure 3.11 FTIR Spectrum of synthesised nanoparticles showing that the nanoparticles
are capped with dextran.
Figure 3.12 TEM micrographs showing the influence of increasing cation concentration on
the average diameter of SPIONs at 60°C and pH 10. Average particle size increases with
increasing concentration.
Figure 3.13 A) Size distribution plot of SPIONs synthesised at a concentration of 0.02 M
Fe(ll) / 0.04 M Fe(lll) B) SAED pattern showing crystal structure corresponding to Fe3O4 and
γ-Fe2O3. The images are representative of the entire sample.
Microfluidic Synthesis of Superparamagnetic Iron Oxide Nanocrystals for Magnetic Resonance Imaging
14
Figure 3.14 TEM micrographs and corresponding SAED patterns showing the effect of
increasing temperature at constant concentration [0.02 M (Fe (II)/0.04 M Fe (III)] and pH (10)
on the average size of SPIONs.
Figure 3.15 A) TEM micrograph B) Selected Area Electron Diffraction Pattern showing
crystal structure corresponding to Fe3O4 C) Size distribution showing average size of 8 nm
of iron oxide nanoparticles prepared by thermal decomposition of Fe(acac)3. The image is
representative of the entire sample.
Figure 3.16 EDX spectrum showing the peaks of different elements in the sample.
Figure 3.17 TEM results of SPIONs synthesized by thermal decomposition of (Fe(acac)3)
using A) 2:1 B) 3:2 and C) 1:1 volume ratios of benzyl ether: oleylamine. The TEM
micrographs in all the three panels A, B and C show that the particles are highly
monodispersed and narrowly distributed with average size of 7 nm, 9 nm, 10 nm
respectively. (Size distribution shown as an inset in micrographs) SAED patterns indicate
good crystallinity with the interplanar spacing corresponding to Fe3O4 or γ-Fe2O3.
Figure 3.18 TEM results of oleylamine capped nanoparticles prepared at reaction times of
A) start B) 10 and C) 60 minutes respectively. The average size varies between 7 and 8 nm
in 60 minutes.
Figure 3.19 TEM micrographs of iron oxide nanoparticles extracted at different
temperatures showing a general increase in the average size of the nanoparticles with
temperature.
Figure 4.1 Analysis of SPIONs synthesised on chip by A) Hassan et al and B) Frenz at
al. A) TEM image of iron oxide nanoparticles prepared using continuous flow having an
average size of 7 nm. The inset shows the SAED pattern with crystal plane corresponding to
γ-Fe2O3 Ba) TEM image of the nanoparticles prepared in droplets. Inset: High resolution
TEM image of a particle Bb) SAED pattern showing different planes of the spinel structure of
Fe3O4 Bc) Magnetisation curve of iron oxide nanoparticles indicating superparamagnetism.
Images reproduced from reference [76] and [69] respectively.
Figure 4.2 Pictures of blocked channels of a microfluidic device A) Deposition of
precipitates of SPIONs on channel walls formed immediately after first contact of aqueous
streams B) Completely blocked channels C) Fully Blocked microchip, rendered unusable
after the deposition of precipitates SPIONs.
Figure 4.3 A) TEM micrograph of bare SPIONs synthesised via continuous flow route,
showing highly aggregated but small particles B) The SAED pattern shows crystallinity with
only a few faint diffraction planes which correspond to γ-Fe2O3.
Figure 4.4 A) TEM micrograph of SPIONs synthesised in the presence of dextran via
continuous flow, showing the presence of a large amount of unbound dextran scattered all
over the grid, thereby screening the SPIONs B) The SAED pattern shows only a few faint
diffraction planes corresponding to γ-Fe2O3.
Figure 4.5 Schematic of the fluidic chip used for droplet synthesis of SPIONs and
enlarged view of the pillar based merging chamber. Image reproduced from reference [69].

Microfluidic Synthesis of Superparamagnetic Iron Oxide Nanocrystals for Magnetic Resonance Imaging
15
Figure 4.6 Stability diagram correlating the volume ratio Vd/Vc with the volumetric flow
rate. In region I no droplet merging occurs, in region II between 2 and 5 droplets will merge
depending on the flow conditions, and in region III no droplet merging occurs. Image
reproduced from reference [69].
Figure 4.7 Droplets pushing each other instead of merging in the pillared-based merging
chamber when oil:surfactant ratio is 5:1.
Figure 4.8 Extremely small sized droplets are formed, which do not stop in the merging
chamber when oil: surfactant ratio is 1:10.
Figure 4.9 Detailed merging sequences of two ammonia droplets and one iron precursor
solution droplet. Droplets are trapped in the merging chamber and flow out after three
droplets have merged together with the SPIONs encapsulated within each droplet.
Figure 4.10 Images of blocked parts of the microfluidic reactor used for SPION synthesis.
Figure 4.11 Images showing unstable droplet flow in the serpentine channels. The
droplets fuse before reaching the merging chamber because they are too close to each
other. The flow rates of carrier fluid, iron precursor solution and NH4OH are 1 µl min-1, 0.5 µl
min-1 and 1 µl min-1respectively.
Figure 4.12 Image of the microfluidic reactor employed for SPION synthesis showing
improper generation and merging of droplets (encircled in red) in the lower serpentine
channels.
Figure 4.13 Image showing the droplet synthesis SPIONs in the microfluidic reactor with
fusion of the droplet pairs in the pillared array. The SPIONs generated flow out of the
chamber well encapsulated within individual droplets. The flow rates of oil, Fe solution and
NH4OH solution were 0.1 μl min-1, 0.5 μl min-1, 1 μl min-1 respectively.
Figure 4.14 A) TEM micrograph of bare SPIONs synthesised in the microfluidic device
using droplet based synthesis, showing highly aggregated but small particles of diameter~3
nm. B) The diffraction pattern shows spinel rings corresponding to Fe3O4 and γ-Fe2O3.
Figure 4.15 A) TEM micrograph of SPIONs synthesised in the presence of dextran in
Niu’s device using droplet based synthesis showing the presence of a large amount of
unreacted polymer (dextran) scattered all over the grid, which obscures the particles. B) The
diffraction pattern shows reduction in crystallanity, due to the presence of unreacted dextran.
Figure 4.16 AutoCAD drawings of Niu’s design and Spacer design. The distinguishing
feature between the two designs is the absence of serpentine channels and addition of
spacer oil inlets.
Figure 4.17 Picture showing how the spacing between the aqueous droplets is increased
along with an increase in their size which leads to controlled merging within the chamber.
The flow rates used in were; oil infusion rate-5 μl min-1, spacing oil infusion rate- 5 μl min-1
and a water infusion rate- 5 μl min-1.
Microfluidic Synthesis of Superparamagnetic Iron Oxide Nanocrystals for Magnetic Resonance Imaging
16
Figure 4.18 Image of the droplet-based microfluidic ‘‘spacer’ ’device used for the synthesis
of SPIONs. The oil flowing through the spacer inlets increases the spacing between
consecutive droplets leading to controlled merging in the pillared array.
Figure 4.19 A) TEM micrograph of uncoated iron oxide nanoparticles prepared in the
spacer device with average size of t ~3 nm B) SAED Pattern showing crystal structure
corresponding to Fe3O4 and γ-Fe2O3 C) VSM plots showing the superparamagnetic curve
with Msat ~ 6.9 emu g-1.
Figure 4.20 A) TEM micrograph of dextran coated iron oxide nanoparticles with average
size of ~ 3.7 nm B) SAED Pattern showing crystal structure corresponding to Fe3O4 and γ-
Fe2O3 C) VSM plots showing the superparamagnetic curve with Msat ~ 8.34 emu g-1.
Figure 4.21 AutoCAD schematic of the modified spacer device used to study effect of on
chip dextran addition on the size of SPION; 4 dextran inlets are added after the merging
chamber.
Figure 4.22 Dextran addition after the merging chamber, with a dextran flow rate of 20 μl
min-1. The bare SPIONs after crossing the merging chamber meet the inflowing dextran
stream and are thereby capped with dextran.
Figure 4.23 TEM analysis of on chip dextran coated SPIONs. A) Addition of dextran 80 ms
after the formation of bare nanoparticles, micrograph shows small rod like structures (~ 10
nm) with very low crystallanity B) Addition of dextran 160 ms after the formation of bare
nanoparticles, the rods increase in size (~ 20 nm) with even further faint diffraction rings
C) Addition of dextran 240 ms after the formation of bare nanoparticles, the size of the rods
is further increased to ~ 40 nm and crystallinity decreases further which is evidenced by
diffused rings as shown in the diffraction pattern.
Figure 4.24 AutoCAD schematic of the combined device showing pillar based merging
chamber as the microfluidic reactor. This device consists of three inlets one each for oil, iron
/dextran solution and NH4OH solution.
Figure 4.25 Sequence of droplets flowing through the merging chamber without stopping
and flowing out unmerged. A specific droplet is encircled in red to show its pathway. Flow
rates used were same as Frenz’s system, carrier oil-13.33 μl min-1 & aqueous phase-6.67 μl
min-1.
Figure 4.26 Images showing sequential merging in a combined device, one droplet each
of water and dye merge before reaching the chamber to form the product (frame 3). All the
droplets are equal sized with similar consistency but the set of flow rates were discarded as
the merging occurred outside the pillared array. Oil infusion rate -10 μl min-1, water infusion
rate - 5 μl min-1 and dye infusion rate - 5 μl min-1.
Figure 4.27 Images showing alternate generation and merging of water and dye filled
droplets in the pillar based merging chamber. The infusion rates are: oil: 10 µl min-1 and
dye/water: 4.5 µl min-1.
Figure 4.28 Images showing alternate generation and merging of water and dye filled
droplets in the pillar based merging chamber. The infusion rates are: oil: 10 µl min-1 and
dye/water: 4.0 µl min-1.
Microfluidic Synthesis of Superparamagnetic Iron Oxide Nanocrystals for Magnetic Resonance Imaging
17
Figure 4.29 Pictures showing A) Cross talks and B) Fouling in the merging chamber
during the synthesis of SPIONs.
Figure 4.30 Images showing the synthesis of SPIONs on a combined device. The flow
rates of carrier fluid, Fe/dextran and NH4OH were 10 µl min-1, 2.5 µl min-1 and 1 µl min-1
respectively.
Figure 4.31 TEM and VSM results of SPIONs synthesised in a combined device. A) TEM
micrograph showing discrete particles with average size of ~ 3.2 nm B) Diffraction pattern
showing distinct diffraction rings corresponding to Fe3O4 NPs. C) Size distribution plot
showing that the particles were narrowly distributed D) Magnetization plot showing the Msat
value of 23 emu g-1.
Figure 5.1 A) Schematic of complete system for nanoparticle synthesis and
characterisation, comprising droplet generator, heated oil-bath, and in-line optical detection
for real-time analysis B) Close-up of droplet generation stage. Image reproduced from
reference [58c].
Figure 5.2 A) Schematic of capillary-based droplet reactor showing injection of precursor
solutions of Fe2+/Fe3+/dextran and NH4OH into separate auxiliary capillaries B) Photograph
showing the fouling due to iron oxide precipitation in the capillary.
Figure 5.3 A) TEM micrograph of dextran-coated iron oxide nanoparticles prepared by
continuous flow using the capillary-based droplet reactor B) SAED pattern of dextran- coated
iron oxide nanoparticles prepared in the capillary reactor, under continuous flow conditions.
Figure 5.4 EDX spectrum indicating presence of different elements in the sample.
Figure 5.5 A) Schematic showing synthesis of dextran-coated SPIONs in a capillary
based droplet reactor B) Photograph showing the synthesis of SPIONs at the confluence of
reagent streams.
Figure 5.6 Photographs comparing the synthesis of iron oxide under continuous (left)
and droplet (right) modes of operation. Visible deposition of iron-oxide on the channel walls
is evident after just one minute when the reactor is operating in continuous flow. No
deposition is seen in droplet flow.
Figure 5.7 A) TEM micrograph B) Size distribution C) SAED pattern and D) EDX
spectrum of the droplet-synthesised, dextran-coated iron oxide nanoparticles. The data
indicated isotropic particles with average size ~ 3.6 nm and diffraction planes corresponding
to Fe3O4 and/or γ- Fe2O3
Figure 5.8 Solid-state FT-IR spectra of A) droplet-synthesised uncoated iron oxide B)
dextran and C) droplet-synthesised dextran-coated iron oxide D) Photographs of bare and
dextran-coated nanoparticle solutions after storage for three weeks E) Transmission
Electron Micrograph of a ~22 nm reactor-synthesised SPION, clearly indicating the presence
of the dextran shell surrounding the iron-oxide core. Note, different reaction conditions were
used from those reported in the main text to attain the higher particle size
Figure 5.9 A) TEM showing the influence of temperature on particle size for SPIONs
synthesised in a capillary droplet reactor. Average size decreases with increasing
Microfluidic Synthesis of Superparamagnetic Iron Oxide Nanocrystals for Magnetic Resonance Imaging
18
temperature up to 60°C and then increases. B) Diffraction patterns for each sample showing
interplanar rings corresponding to Fe3O4 and γ-Fe2O3, with the appropriate crystallinity for
particles synthesised at 60°C.
Figure 5.10 Size distribution histograms of SPIONs synthesised in the capillary-droplet
reactor to study the influence of temperature on average particle size. A plot showing the
variation of particle diameter with temperature is also shown. As the temperature is
increased from 20°C to 60°C, there occurs a decrease in particle diameter then above 60°C
the size becomes constant within a range of 0.3 nm. From the study 60°C was considered
the optimum temperature for SPION synthesis, since the particles were smallest, less
polydispersed and crystalline.
Figure 5.11 A) TEM showing the influence of cation concentration on particle size for
SPIONs synthesised in a capillary droplet reactor. Average size increases with increasing
concentration B) Diffraction patterns for each sample showing interplanar rings
corresponding to Fe3O4 and γ-Fe2O3, with the appropriate crystallinity for particles
synthesised at 0.02 M Fe(II)/0.04 M Fe(III)
Figure 5.12 Size distribution histograms of SPIONs synthesised in the capillary-based
droplet reactor at different ionic concentrations of Fe(II) and Fe(III) cations. A plot showing
the variation of average particle size with increasing concentration is also shown. The
particle size increases with increasing concentration of Fe(II0 and Fe(III) ions. The
experiment was repeated three times to demonstrate the reproducibility of the data.
Figure 5.13 Schematic of organic-phase synthesis of oleylamine-capped SPIONs in a
droplet-based capillary reactor.
Figure 5.14 TEM micrographs of iron oxide nanoparticles synthesised in organic phase at
temperatures in the range 175 to 240°C. The images show an increase in size with
increasing temperature on the particle size of the oleylamine coated iron oxide nanoparticles
synthesised in capillary based droplet reactor.
Figure 5.15 Plot showing general increase in average particle size with increasing
temperature for SPIONs synthesised in organic phase.
Figure 5.16 TEM micrographs of iron oxide nanoparticles synthesised in organic phase in
a capillary droplet reactor at different residence times and a constant temperature of 240°C.
The images show an increase in particle size with residence time of oleylamine coated iron
oxide nanoparticles.
Figure 5.17 Plot showing general increase in the average particle size with increasing
residence times of SPIONs synthesised in organic phase.
Figure 5.18 A) Room temperature magnetization traces of superparamagnetic iron oxide
nanoparticles obtained by vibrating sample magnetometry
Figure 5.19 Photograph of vials containing SPIONs in increasing concentrations for
in-vitro MRI study, for echo time of 27 ms are shown.
Figure 5.20 A) Normalised signal intensity versus echo time for particles synthesised in
the capillary droplet reactor B) Relaxation rate versus Fe concentration for particles
synthesised in the capillary droplet reactor (relaxivity of 66 mM s-1).
Microfluidic Synthesis of Superparamagnetic Iron Oxide Nanocrystals for Magnetic Resonance Imaging
19
Table of Contents
Declaration of Originality 2
Abstract 4
Acknowledgments 5
List of Publications 6
List of Symbols and Abbreviations 7
List of Figures 9
Chapter 1 Introduction and Background 21
1.1 Introduction 22
1.2 Magnetic Nanoparticles (MNPs) 22
1.2.1 Superparamagnetism in Magnetic Nanoparticles 23
1.3 Superparamagnetic Iron Oxide Nanoparticles (SPIONs) 24
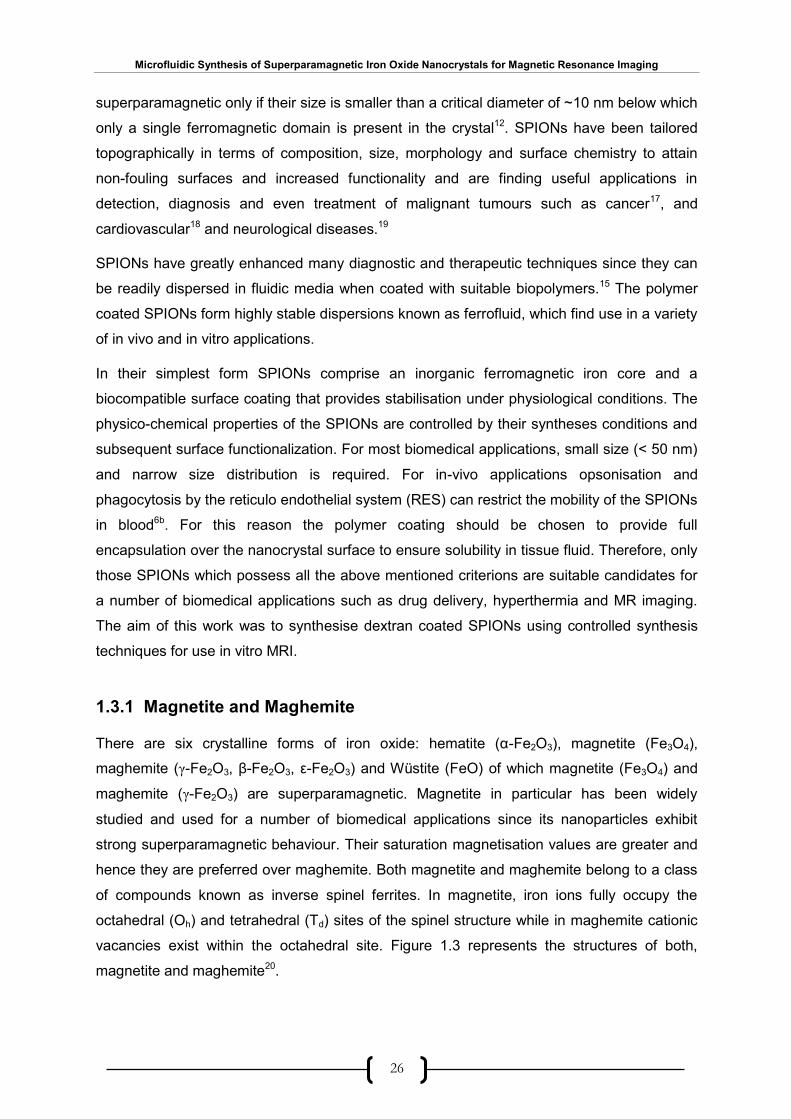
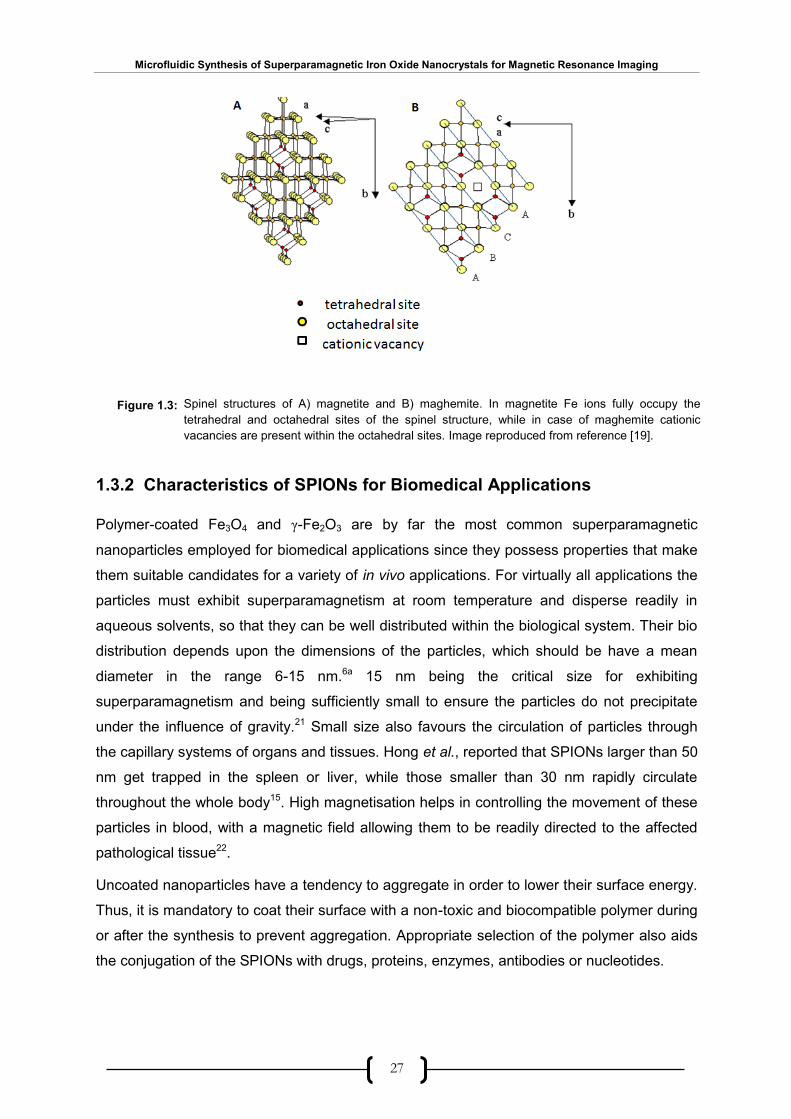
1.3.1 Magnetite and Maghemite 25
1.3.2 Characteristics of SPIONs for Biomedical Applications 26
1.3.2.1 Coating Agents for SPIONs 27
1.3.3 SPIONs as Contrast Enhancers in MRI 28
1.4 Synthesis of SPIONs 28
1.5 Nanoparticle Crystal Growth in Solution 33
1.6 Microfluidic Reactors 34
1.7 Types of Microreactors 35
1.7.1 Single-Phase Microfluidic Devices 35
1.7.2 Segmented-Phase Flow Microfluidics 36
1.7.2.1 Droplet Characteristics 37
1.7.2.2 Carrier Fluid 38
1.7.2.3 Droplet Generation and Merging 39
1.7.2.4 Droplet Mixing 42
1.8 Applications of Microfluidic Reactors in Nanoparticle Synthesis 44
1.8.1 Single-Phase Synthesis of Nanoparticles 44
1.8.2 Droplet-Phase Synthesis of Nanoparticles 45
1.8.3 High Temperature Nanoparticle Synthesis in Droplet Reactors 49
1.9 Summary of Thesis 50
Chapter 2 Materials & Methodology 52
2.1 Introduction 53
2.2 Microfluidic Device Fabrication 53
2.2.1 Fabrication of SU-8 Master 53

Microfluidic Synthesis of Superparamagnetic Iron Oxide Nanocrystals for Magnetic Resonance Imaging
20
2.3 PDMS Device Fabrication 56
2.4 Microfluidic Device Assembly and Experimental Setup 57
2.5 Fabrication of the Droplet Reactor for SPION Synthesis 58
2.6 Offline Analysis of SPIONs 59
2.6.1 Transmission Electron Microscopy (TEM) 59
2.6.1.1 Selected Area Electron Diffraction (SAED) 60
2.6.1.2 Electron Dispersive X-Ray Spectroscopy (EDX) 60
2.6.2 Vibrating Sample Magnetometry (VSM) 60
2.6.3 Magnetic Resonance Imaging (MRI) 61
2.6.4 Analytical Software 64
Chapter 3 Bulk Synthesis of SPIONs 65
3.1 Evaluation of Literature Methods for Aqueous Synthesis of SPIONs 66
3.1.1 Experimental 67
3.1.1.1 Synthesis of SPIONs by Co-precipitation using Ammonium Hydroxide 67
3.1.1.2 Synthesis of SPIONs by Co-precipitation using Sodium Hydroxide 69
3.2 Synthesis of SPIONs by Co-Precipitation in the Presence of Dextran 70
3.2.1 Synthesis of Dextran-Coated SPIONs Using Hydrazine Hydrate 71
3.2.2 Synthesis of Dextran-Coated SPIONs without Hydrazine Hydrate 73
3.3 Optimization of Reaction Parameters by Using Dextran and NH4OH 75
3.3.1 Influence of Cation Concentration on Average Size of SPIONs 75
3.3.2 Influence of Temperature on Average Size of SPIONs 77
3.4 Evaluation of Literature Methods for Organic Synthesis of SPIONs 77
3.4.1 Synthesis of SPIONs by High Temperature Decomposition of Fe(acac)3 79
3.4.2 Synthesis of SPIONs by using Oleylamine 80
3.5 Conclusion 85
Chapter 4 Microchip-Based Synthesis of SPIONs86
4.1 Introduction 87
4.2 Microfluidic Synthesis of SPIONs 87
4.2.1 Continuous Flow Synthesis 89
4.2.2 Droplet-based Synthesis 91
4.3 Droplet Experiments: Preliminary Results 92
4.3.1 Design Limitations 96
4.3.1.1 Fouling of the Microfluidic Channels 96
4.3.1.2 Unstable Droplet Flow in Serpentine Channels 97
4.4 Improved device 101
4.4.1 Spacer Device 102
Microfluidic Synthesis of Superparamagnetic Iron Oxide Nanocrystals for Magnetic Resonance Imaging
21
4.4.1.1 Influence of time of dextran addition on nanoparticle size 103
4.4.2 Combined Device 106
4.4.2.1 Optimisation of the device for SPION synthesis 107
4.4.2.2 SPION Synthesis on the Combined Device 110
Chapter 5 Synthesis of SPIONs in a Capillary-Based Droplet Reactor 113
5.1 Introduction 114
5.2 Capillary-Based Droplet Reactor for Nanocrystal Synthesis 115
5.2.1 Continuous Flow Synthesis of SPIONs in a Capillary-Based Microreactor 116
5.2.2 Droplet-Based Synthesis of SPIONs in a Capillary- Based Reactor 118
5.3 Influence of Temperature and Reagent Concentration on SPION Properties 121
5.3.1 Influence of Temperature on Particle Size of SPIONs 122
5.3.2 Influence of Cation Concentration on Particle Size of SPIONs 124
5.4 Organic Phase Synthesis of SPIONs in Capillary-Based Droplet Reactor 125
5.4.1 Influence of Temperature on Particle Size of SPIONs 127
5.4.2 Influence of Residence Time on Particle Size of SPIONs 128
5.5 MRI study 130
5.6 Conclusions 133
Chapter 6 Conclusions & Future Work 133
6.1 Conclusions 134
6.2 Further Work 137
6.2.1 Time of Growth Studies 137
6.2.2 Scalability to Increase Throughput 137
6.2.3 Ligand Exchange Reactions 138
6.2.4 In Vivo MRI Studies 138
Chapter 7 Bibliography 139
7.1 Bibliography 140
Chapter 8 Appendix 146
8.1 Calculation of Crystal Planes 147
8.2 Videos 148

Microfluidic Synthesis of Superparamagnetic Iron Oxide Nanocrystals for Magnetic Resonance Imaging
22
I
Chapter 1
Introduction & Background
In this chapter a detailed description of the synthetic methods, properties and biomedical
applications of iron oxide nanoparticles is provided. The microfluidic routes for nanoparticle
synthesis are also discussed with reference to previous work with special emphasis on
droplet-phase synthesis.

Microfluidic Synthesis of Superparamagnetic Iron Oxide Nanocrystals for Magnetic Resonance Imaging
23
1.1 Introduction
This thesis describes in detail various synthetic methods for the controlled synthesis of
superparamagnetic iron oxide nanoparticles (SPIONs). These nanoparticles (with
appropriate surface chemistry) can be successfully used for a number of biomedical
applications such as drug delivery3, hyperthermic treatment2, magnetic resonance imaging
(MRI)4 and selective separation of biological fluids.5 For all the above mentioned bio-
applications it is required that the nanoparticles have high magnetisation values and
diameter smaller than 50 nm and a narrow size distribution.6 It is also critical to coat the
surface of the nanoparticles with a suitable biopolymer so that they can be homogeneously
dispersed in aqueous media.
In recent years, there has been much interest in the field of nanotechnology, which focusses
on nanosized particles, the dimensions of which fall in the range of 1 nm to several 100 nm
diameter.7 For instance owing to very high ratio of surface area to volume, and quantum
confinement effects nanoscale materials can exhibit drastically different physical and
chemical properties compared to micro or millimetre sized particles. Importantly, by
controlling their size and shape it is feasible to tailor their physical and chemical properties to
suit their application.
The main focus of this research was the synthesis of superparamagnetic iron oxide
nanoparticles (SPIONs) and study of their magnetic resonance imaging (MRI) applications.
The superparamagnetic forms of iron oxide are magnetite (Fe3O4) and maghemite (γ-Fe2O3).
However, out of the two, magnetite is often preferred since it has a higher biocompatibility
over maghemite.8
1.2 Magnetic Nanoparticles (MNPs)
Magnetic nanoparticles belong to a category of nanomaterials which can be manipulated
under the influence of a magnetic field. They comprise either one or a combination of iron,
nickel and cobalt elements or compounds. Bulk magnetic materials contain multiple magnetic
domains within which individual magnetic moments of the atoms are aligned with one
another. However, below a size of around 500 nm it is unfavourable to form multiple domains
and single domain particles result. This ultimate limit is represented by single domain
particles called the magnetic nanoparticles.9 Magnetic nanoparticles exhibit a variety of
unique magnetic phenomena that are drastically different from those of their bulk
counterparts. The fundamental magnetic properties, such as coercivity (Hc) and susceptibility
(χ) are dependent on the size, shape, and composition effects of nanoparticles.10 These
inherent properties can be synthetically altered by varying the crystalline or chemical

Microfluidic Synthesis of Superparamagnetic Iron Oxide Nanocrystals for Magnetic Resonance Imaging
24
structure of the particles. Thus, they may be used in a variety of applications ranging from
storage media to enhancers in MR imaging.9
Another important feature of magnetic nanoparticles is that they can be easily linked with
different kinds of biomolecules such as DNA, peptides, and antibodies. Upon conjugation
with an appropriate biomolecule, the nanoparticles can be easily biodistributed. Alternatively,
they can be used to direct therapeutic agents to a localized target by focusing an external
magnetic field to the target region.9, 10b
1.2.1 Superparamagnetism in Magnetic Nanoparticles
In general terms, superparamagnetism is a phenomenon exhibited by ferromagnetic
materials at the nanoscale. The magnetic properties of ferromagnetic materials are based on
quantum size effects. A ferromagnetic material is composed of particles possessing multiple
domains. These domains interact and the material remains magnetic even in the absence of
a magnetic field. In contrast magnetic nanoparticles exhibit superparamagnetism. For
magnetic nanoparticles to be utilized in biomedical applications they must be below a critical
value (Dc), which is dependent on the material.11 Each nanoparticle comprises a single
magnetic domain and shows superparamagnetic behaviour, with all magnetic spins in the
nanoparticle aligning unidirectionally.10b, c, 11-12 (Figure 1.1)
Such nanoparticles have a large constant magnetic moment and behave like a single
paramagnetic atom, being rapidly reoriented by the applied magnetic fields and exhibiting
negligible remnance (magnetization left behind in a ferromagnetic material such as iron after
an external magnetic field is removed) and coercivity (the intensity of the applied magnetic
field required to reduce the magnetization of that material to zero after the magnetization of
the sample has been driven to saturation).13 The absence of a net magnetization at zero field
A) Plot showing the transition of a particle from multiple domains to single domain. As the particle
size decreases, the nanoparticles become single domain and possess superparamagnetism B)
Superparamagnetic materials show zero remnance and coercivity as can be seen in red. Image
adapted from reference [9b].
Figure 1.1:
Microfluidic Synthesis of Superparamagnetic Iron Oxide Nanocrystals for Magnetic Resonance Imaging
25
make superparamagnetic nanoparticles attractive candidates for a broad range of biomedical
applications since the risk of forming aggregates is negligible at room temperature.
The concept of superparamagnetism was proposed by Frenkel and Dorfman in 1930.14 The
magnetic anisotropic energy barrier (U) for transitioning from a spin-up state to spin-down
state is proportional to the product of the magnetic anisotropic constant (Ku) and the volume
(V) of the magnet. Equation 1.1 represents this relation.
(1.1)
Figure 1.2 illustrates principal difference between bulk and nanometre-sized crystals of
ferromagnetic materials. It can be seen that large particles (blue curve) have higher magnetic
anisotropic energies than the thermal energy (kT). The thermal energy in the case of a
nanoparticle (red line) exceeds the barrier height and so is sufficient to flip the magnetic spin
direction repeatedly, although it is insufficient to overcome the spin–spin exchange coupling
energy and so individual spins remain aligned. Such magnetic fluctuation in case of magnetic
nanoparticles leads to a net magnetization of zero. This behaviour is called
superparamagnetism.9, 10b The transition temperature from ferromagnetism to
superparamagnetism is referred to as the blocking temperature (Tb) and is defined by the
relationship
(1.2)
1.3 Superparamagnetic Iron Oxide Nanoparticles (SPIONs)
Most biomedical applications of magnetic nanoparticles today employ nanoscale iron oxide,
crystals of magnetite (Fe3O4) and maghemite (γ-Fe2O3) with diameter 5-20 nm15, which
combine superparamagnetic behaviour with biocompatibility and biodegradability.16 They are
commonly referred to as superparamagnetic iron oxide nanoparticles (SPIONs). They are
Size dependant energy diagram of large and nano particles showing that as the nanoparticles
grow in size, they attain ferromagnetism. Image adapted from reference [10]. Figure 1.2:
(ferromagnetism)
(superparamagnetism)
Microfluidic Synthesis of Superparamagnetic Iron Oxide Nanocrystals for Magnetic Resonance Imaging
26
superparamagnetic only if their size is smaller than a critical diameter of ~10 nm below which
only a single ferromagnetic domain is present in the crystal12. SPIONs have been tailored
topographically in terms of composition, size, morphology and surface chemistry to attain
non-fouling surfaces and increased functionality and are finding useful applications in
detection, diagnosis and even treatment of malignant tumours such as cancer17, and
cardiovascular18 and neurological diseases.19
SPIONs have greatly enhanced many diagnostic and therapeutic techniques since they can
be readily dispersed in fluidic media when coated with suitable biopolymers.15 The polymer
coated SPIONs form highly stable dispersions known as ferrofluid, which find use in a variety
of in vivo and in vitro applications.
In their simplest form SPIONs comprise an inorganic ferromagnetic iron core and a
biocompatible surface coating that provides stabilisation under physiological conditions. The
physico-chemical properties of the SPIONs are controlled by their syntheses conditions and
subsequent surface functionalization. For most biomedical applications, small size (< 50 nm)
and narrow size distribution is required. For in-vivo applications opsonisation and
phagocytosis by the reticulo endothelial system (RES) can restrict the mobility of the SPIONs
in blood6b. For this reason the polymer coating should be chosen to provide full
encapsulation over the nanocrystal surface to ensure solubility in tissue fluid. Therefore, only
those SPIONs which possess all the above mentioned criterions are suitable candidates for
a number of biomedical applications such as drug delivery, hyperthermia and MR imaging.
The aim of this work was to synthesise dextran coated SPIONs using controlled synthesis
techniques for use in vitro MRI.
1.3.1 Magnetite and Maghemite
There are six crystalline forms of iron oxide: hematite (α-Fe2O3), magnetite (Fe3O4),
maghemite (γ-Fe2O3, β-Fe2O3, ε-Fe2O3) and Wüstite (FeO) of which magnetite (Fe3O4) and
maghemite (γ-Fe2O3) are superparamagnetic. Magnetite in particular has been widely
studied and used for a number of biomedical applications since its nanoparticles exhibit
strong superparamagnetic behaviour. Their saturation magnetisation values are greater and
hence they are preferred over maghemite. Both magnetite and maghemite belong to a class
of compounds known as inverse spinel ferrites. In magnetite, iron ions fully occupy the
octahedral (Oh) and tetrahedral (Td) sites of the spinel structure while in maghemite cationic
vacancies exist within the octahedral site. Figure 1.3 represents the structures of both,
magnetite and maghemite20.
Microfluidic Synthesis of Superparamagnetic Iron Oxide Nanocrystals for Magnetic Resonance Imaging
27
1.3.2 Characteristics of SPIONs for Biomedical Applications
Polymer-coated Fe3O4 and γ-Fe2O3 are by far the most common superparamagnetic
nanoparticles employed for biomedical applications since they possess properties that make
them suitable candidates for a variety of in vivo applications. For virtually all applications the
particles must exhibit superparamagnetism at room temperature and disperse readily in
aqueous solvents, so that they can be well distributed within the biological system. Their bio
distribution depends upon the dimensions of the particles, which should be have a mean
diameter in the range 6-15 nm.6a 15 nm being the critical size for exhibiting
superparamagnetism and being sufficiently small to ensure the particles do not precipitate
under the influence of gravity.21 Small size also favours the circulation of particles through
the capillary systems of organs and tissues. Hong et al., reported that SPIONs larger than 50
nm get trapped in the spleen or liver, while those smaller than 30 nm rapidly circulate
throughout the whole body15. High magnetisation helps in controlling the movement of these
particles in blood, with a magnetic field allowing them to be readily directed to the affected
pathological tissue22.
Uncoated nanoparticles have a tendency to aggregate in order to lower their surface energy.
Thus, it is mandatory to coat their surface with a non-toxic and biocompatible polymer during
or after the synthesis to prevent aggregation. Appropriate selection of the polymer also aids
the conjugation of the SPIONs with drugs, proteins, enzymes, antibodies or nucleotides.
Figure 1.3: Spinel structures of A) magnetite and B) maghemite. In magnetite Fe ions fully occupy the
tetrahedral and octahedral sites of the spinel structure, while in case of maghemite cationic
vacancies are present within the octahedral sites. Image reproduced from reference [19].

Microfluidic Synthesis of Superparamagnetic Iron Oxide Nanocrystals for Magnetic Resonance Imaging
28
1.3.2.1 Coating Agents for SPIONs
SPIONs with suitable, bio-compatible coatings find useful applications in MRI, tissue
engineering, drug delivery etc. The protective layer on the surface of the nanoparticle plays a
critical role in stabilising them in the biological fluids. The surface of the SPIONs, functionally
labelled with biologically active compounds can be transferred from blood, bone marrow or
tissue fluid to the target under the influence of external magnetic field.23 For any kind of bio-
application it is very important that the SPIONs are colloidally stable in aqueous media at
physiological pH (7.35-7.45 for human blood). ‘‘Naked’’ iron oxide has a pHPzc (pH at point
zero charge) around 7 due to which they have a tendency to flocculate, therefore, it is
essential to coat their surface with a suitable polymer, which would bring additional charges
to the particle surface and help attain electrostatic stability in fluidic media. It has been
demonstrated that the attachment of small chelating agents on the surface of the iron oxide
nanoparticle can greatly shift the pHPZC point of iron oxide particles away from neutral pH, in
addition it also restricts nanoparticle growth6b, 24.
Numerous coating agents have been applied to iron oxide nanoparticles incorporating many
different functional groups, with important examples being, polyethylene imide, poly(l-lysine),
chitosan, dextran, folic acid and TAT(transactivator of transcription) peptide etc.
Li et al. synthesised biocompatible SPIONs with a surface coating of monocarboxyl
terminated-poly(ethylene glycol) which were shown to possess very good biocompatibility
and had long blood circulation times when monitored by magnetic resonance imaging.25
Thunemann et al. prepared SPIONs covered with two layers, first layer was made of
poly(ethylene imine) and the second of poly(ethylene oxide)-block-poly(glutamic acid)
(Figure 1.4). Preliminary MRI experiments showed that the particles caused a strong MR
imaging contrast and indicated good biocompatibility.26
Figure 1.4: Schematic of polymer coated γ-Fe2O3 nanoparticles and chemical structures of two widely used
polymer coatings. The branched poly (ethylene imine) (PEI) was used for the first layer (red),
and poly (ethylene oxide)-b-poly (glutamic acid) (PEO-PGA) was used for the second layer (blue
and green, respectively). Image reproduced from reference [25].
Microfluidic Synthesis of Superparamagnetic Iron Oxide Nanocrystals for Magnetic Resonance Imaging
29
A recent example of a commercially used, coated SPION is SPIO SHU 555A (Resovist,
Schering, Germany) which consists of carboxydextran as the polymeric coating and shows
promising results in terms of safety coupled with detection and characterisation of focal liver
lesions.
1.3.3 SPIONs as Contrast Enhancers in MRI
SPIONs are one of the most widely used contrast agents for in vivo bio-imaging using MRI.
The use of SPIONs as MRI contrast agents is widely considered to be one of the most
successful uses of inorganic materials in medical science.4b, 27 Even though un-enhanced
MRI can provide reasonable differentiation between healthy and pathological tissue, use of
contrast agents enhances the image quality substantially.
In general, MRI contrast agents function by shortening the T1 or T2 relaxation times of nearby
water (protons) molecules. The contrast agents are thus categorised into T1 or T2 contrast
agents based on their functionality. T1 contrast agents predominantly shorten the T1
relaxation time through spin-lattice interactions resulting in a hypersignal or bright spots in
MR images so are commonly referred to as positive contrast agents. T2 contrast agents on
the other hand reduce T2 relaxation times by spin-spin interactions, thereby decreasing
signal intensity and so are known as negative contrast agents.
Superparamagnetic nanoparticles such as maghemite (γ-Fe2O3) and magnetite (Fe3O4)
produce predominantly spin–spin relaxation effects (T2) due to the induced local field
inhomogeneity.9 Hence, SPIONs are used as negative contrast agents that produce dark
spots on T2 weighted images. An explanation of the MRI technique is provided in chapter 2.
1.4 Synthesis of SPIONs
The synthesis of SPIONs is a complex process due to the many properties that must be
simultaneously optimised such as particle size and shape, size distribution, surface
chemistry of the particles and magnetic properties. There are a number of physical and
chemical methods in the literature that have been used for synthesising SPIONs. The
physical methods such as electron beam lithography28 and gas-phase deposition29 suffer
from the drawbacks low throughput and limiting the particle size to a nanometre scale and
are generally inapplicable to biomedical uses.28-30 The wet chemical methods on the other
hand, such as sol-gel method31, oxidation method32, chemical co-precipitation method33,
electrochemical method34 etc. are more suitable since they are fast and can generate large
quantities of material in a readily usable format. Also, wet methods provide superior control
over particle size, composition and shape.6a
Microfluidic Synthesis of Superparamagnetic Iron Oxide Nanocrystals for Magnetic Resonance Imaging
30
Of all the reported wet chemical methods, chemical co-precipitation is the most common and
widely used method for SPION synthesis. The method was first demonstrated by Massart
et al. in 1981.33a SPIONs, either Fe3O4 or γ-Fe2O3 , with average diameters below 50 nm35,
can be readily synthesised by the co-precipitation of aqueous salt solutions of Fe3+ and Fe2+
ions (usually 2:1 molar ratio) upon the addition of a base such as ammonium hydroxide or
sodium hydroxide36.
The precipitation of SPIONs occurs between pH 9 and 14 for Fe3O4 synthesis.6a Oxygen
should be rigorously excluded from the reaction environment (by bubbling Nitrogen or
Argon), since Fe3O4 is readily oxidised to γ- Fe2O3 (which as noted above has a lower
saturation magnetisation) (equation1.3).
The co-precipitation reaction leads to a gelatinous iron hydroxide precipitate, which is heated
in the presence of a surfactant such as dextran, to stabilise the ferrofluid. In case of
precipitation reactions, it is possible to control the particle characteristics by altering the type
of salt used, ionic ratio, pH, temperature and strength of base.30a, 33a, 37 Figure 1.5 shows the
complete process of magnetite formation and its oxidation to maghemite.
Synthesising SPIONs in an oxygen free environment prevents the oxidation of magnetite to
maghemite and also reduces the particle size.38 Careful selection of the biopolymer can
inhibit further oxidation post-synthesis. One of the advantages of using co-precipitation
process is that a high yield of nanoparticles can be achieved. However, it is difficult to control
the particle size distribution, because only kinetic factors control the growth of the crystal.
The detail about the growth of crystals in solution is discussed in section 1.5.
Schematic of the reaction of magnetite formation, from an aqueous mixture of ferrous and ferric
chlorides, by the addition of a base. Equation 1.3 shows the oxidation of magnetite to maghemite.
Image reproduced from reference [5a].
Figure 1.5:
(1.3)
Microfluidic Synthesis of Superparamagnetic Iron Oxide Nanocrystals for Magnetic Resonance Imaging
31
Thermal decomposition of metal precursors, most often organometallic complexes of iron
such as metal carbonyls, offers an alternative method of iron oxide nanoparticle synthesis
and in contrast to co-precipitation reactions typically yields highly crystalline, monodispersed
particles. The organometallic complexes are metastable and can be readily decomposed by
heat, light or even sound.39 This method was introduced by Alivisatos40 and co-workers in
1999 and later developed by many others including Hyeon41, Sun42, Peng43, Cheon44 and
Gao.45
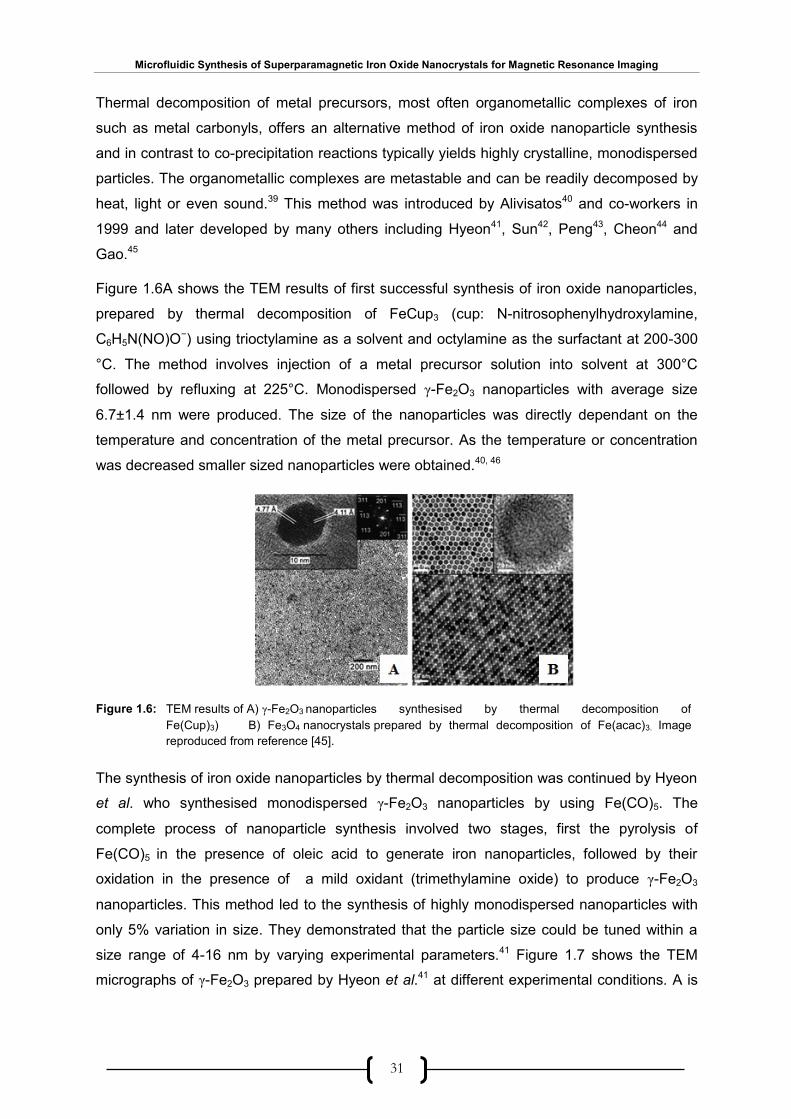
Figure 1.6A shows the TEM results of first successful synthesis of iron oxide nanoparticles,
prepared by thermal decomposition of FeCup3 (cup: N-nitrosophenylhydroxylamine,
C6H5N(NO)O−) using trioctylamine as a solvent and octylamine as the surfactant at 200-300
°C. The method involves injection of a metal precursor solution into solvent at 300°C
followed by refluxing at 225°C. Monodispersed γ-Fe2O3 nanoparticles with average size
6.7±1.4 nm were produced. The size of the nanoparticles was directly dependant on the
temperature and concentration of the metal precursor. As the temperature or concentration
was decreased smaller sized nanoparticles were obtained.40, 46
The synthesis of iron oxide nanoparticles by thermal decomposition was continued by Hyeon
et al. who synthesised monodispersed γ-Fe2O3 nanoparticles by using Fe(CO)5. The
complete process of nanoparticle synthesis involved two stages, first the pyrolysis of
Fe(CO)5 in the presence of oleic acid to generate iron nanoparticles, followed by their
oxidation in the presence of a mild oxidant (trimethylamine oxide) to produce γ-Fe2O3
nanoparticles. This method led to the synthesis of highly monodispersed nanoparticles with
only 5% variation in size. They demonstrated that the particle size could be tuned within a
size range of 4-16 nm by varying experimental parameters.41 Figure 1.7 shows the TEM
micrographs of γ-Fe2O3 prepared by Hyeon et al.41 at different experimental conditions. A is
Figure 1.6: TEM results of A) γ-Fe2O3 nanoparticles synthesised by thermal decomposition of
Fe(Cup)3) B) Fe3O4 nanocrystals prepared by thermal decomposition of Fe(acac)3. Image
reproduced from reference [45].

Microfluidic Synthesis of Superparamagnetic Iron Oxide Nanocrystals for Magnetic Resonance Imaging
32
the TEM micrograph of particles with average size 7 nm, B shows 11 nm particles on the grid
and C shows the particles with average size 13 nm.
The organic-phase synthesis of monodisperse Fe3O4 nanoparticles with sizes variable from
3-20 nm was first reported by Sun et al.47 They demonstrated that Fe3O4 nanoparticles could
be produced by the reaction of Fe(acac)3 in phenyl ether in the presence of alcohol, oleic
acid and oleylamine at high temperature (265°C). In their paper they also reported that larger
particles are formed at higher temperature. When they used benzyl ether (boiling point
298°C) instead of phenyl ether (boiling point 259°C) size of the nanoparticles increased from
4 nm to 6 nm. Figure 1.8 shows a schematic of the synthesis of monodisperse nanocrystals.
Initially a metal chloride is reacted with sodium oleate to generate metal-oleate complex. This
complex then undergoes thermal decomposition in high boiling solvent such as phenyl ether
to produce metal nanocrystals.
In all of the above mentioned synthetic routes only sub-gram quantities of monodisperse
nanoparticles were produced. In 2004, Hyeon et al.41 reported an ‘‘ultra-large scale’’
synthesis of monodisperse nanocrystals using inexpensive and non-toxic reagents. They
synthesised about 40 g of the product in a single reaction, and demonstrated that the particle
TEM images of γ-Fe2O3 nanoparticles: (A) 7 nm, (B) 11 nm, (C) 13 nm. Image reproduced from
reference [40].
Scheme for the ultra-large-scale synthesis of monodisperse nanocrystals. Metal–oleate precursors
were prepared from the reaction of metal chlorides and sodium oleate. The thermal decomposition
of the metal–oleate precursors in high boiling solvent produced monodisperse nanocrystals. Image
reproduced from reference [40].
Figure 1.7:
Figure 1.8:
Microfluidic Synthesis of Superparamagnetic Iron Oxide Nanocrystals for Magnetic Resonance Imaging
33
size could be controlled by varying the experimental conditions. The overall reaction scheme
is depicted in Figure 1.8.
The mechanism of nanoparticle formation involves the breakdown of iron complex in the
presence of oleic acid to generate iron-oleate complex. This complex then undergoes
thermal decomposition in a high boiling solvent to form iron oxide nanoparticles. Park et al.48,
performed the synthesis by reacting inexpensive and environmental friendly reagents, ferric
chloride and sodium oleate. The reaction yielded similar iron-oleate complex, which was
slowly heated in octadecene up to 320°C and aged at this temperature for 30 minutes
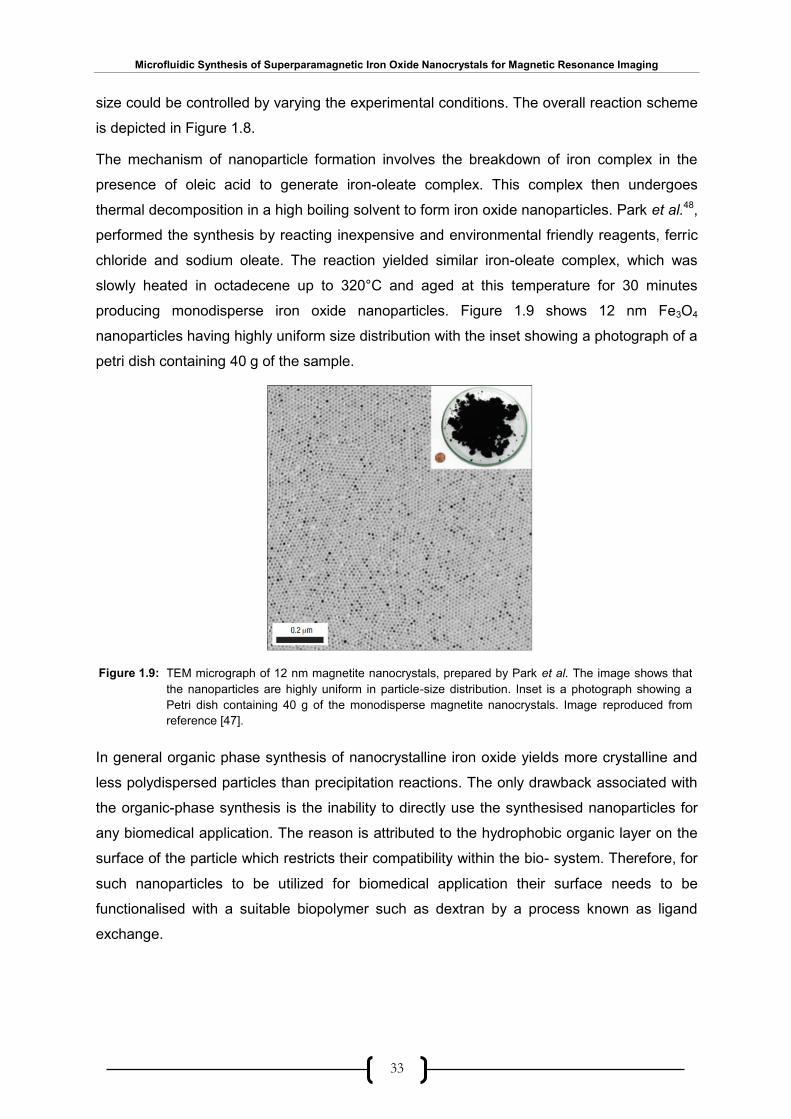
producing monodisperse iron oxide nanoparticles. Figure 1.9 shows 12 nm Fe3O4
nanoparticles having highly uniform size distribution with the inset showing a photograph of a
petri dish containing 40 g of the sample.
In general organic phase synthesis of nanocrystalline iron oxide yields more crystalline and
less polydispersed particles than precipitation reactions. The only drawback associated with
the organic-phase synthesis is the inability to directly use the synthesised nanoparticles for
any biomedical application. The reason is attributed to the hydrophobic organic layer on the
surface of the particle which restricts their compatibility within the bio- system. Therefore, for
such nanoparticles to be utilized for biomedical application their surface needs to be
functionalised with a suitable biopolymer such as dextran by a process known as ligand
exchange.
TEM micrograph of 12 nm magnetite nanocrystals, prepared by Park et al. The image shows that
the nanoparticles are highly uniform in particle-size distribution. Inset is a photograph showing a
Petri dish containing 40 g of the monodisperse magnetite nanocrystals. Image reproduced from
reference [47].
Figure 1.9:
Microfluidic Synthesis of Superparamagnetic Iron Oxide Nanocrystals for Magnetic Resonance Imaging
34
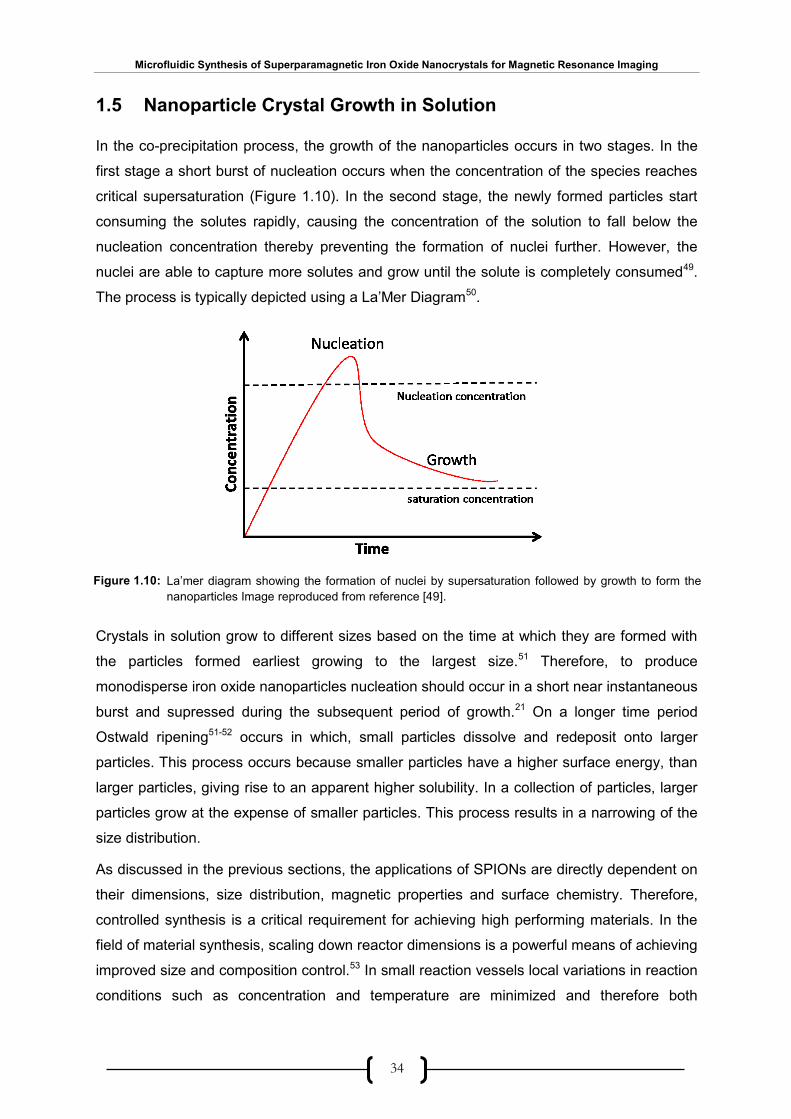
1.5 Nanoparticle Crystal Growth in Solution
In the co-precipitation process, the growth of the nanoparticles occurs in two stages. In the
first stage a short burst of nucleation occurs when the concentration of the species reaches
critical supersaturation (Figure 1.10). In the second stage, the newly formed particles start
consuming the solutes rapidly, causing the concentration of the solution to fall below the
nucleation concentration thereby preventing the formation of nuclei further. However, the
nuclei are able to capture more solutes and grow until the solute is completely consumed49.
The process is typically depicted using a La’Mer Diagram50.
Crystals in solution grow to different sizes based on the time at which they are formed with
the particles formed earliest growing to the largest size.51 Therefore, to produce
monodisperse iron oxide nanoparticles nucleation should occur in a short near instantaneous
burst and supressed during the subsequent period of growth.21 On a longer time period
Ostwald ripening51-52 occurs in which, small particles dissolve and redeposit onto larger
particles. This process occurs because smaller particles have a higher surface energy, than
larger particles, giving rise to an apparent higher solubility. In a collection of particles, larger
particles grow at the expense of smaller particles. This process results in a narrowing of the
size distribution.
As discussed in the previous sections, the applications of SPIONs are directly dependent on
their dimensions, size distribution, magnetic properties and surface chemistry. Therefore,
controlled synthesis is a critical requirement for achieving high performing materials. In the
field of material synthesis, scaling down reactor dimensions is a powerful means of achieving
improved size and composition control.53 In small reaction vessels local variations in reaction
conditions such as concentration and temperature are minimized and therefore both
La’mer diagram showing the formation of nuclei by supersaturation followed by growth to form the
nanoparticles Image reproduced from reference [49].
Figure 1.10:
Microfluidic Synthesis of Superparamagnetic Iron Oxide Nanocrystals for Magnetic Resonance Imaging
35
nucleation and particle growth can be controlled to produce nanoparticles with desired
properties.54 The following sections discuss in detail, microreactor technologies, and their
application to nanoparticle synthesis.
1.6 Microfluidic Reactors
The origin of microfluidic technology dates back to late 1980’s with its first application being
in inkjet print heads, which used microfluidic channels to carry the ink.55 Today microfluidic
technology finds applications in a number of fields such as biology, chemistry, physics and
engineering involving high throughput screening and chemical synthesis. In terms of
technology this is referred to as ‘‘Lab-on-chip’’ technology. The advantages of miniaturisation
are small sample volumes, improved analytical performance, low cost, portability, control of
size, high synthetic throughput, short times for analysis, higher sensitivity and resolution in
molecular analysis, time dependent control of reaction conditions, safer operational
environments, ease of transport and rapid heat and mass transfer.55-56
In simple terms, microfluidic systems involve fluid flow and manipulation within channels that
vary in cross-sectional width from one to several hundred microns. This reduction in the
dimensions of the reaction vessel allows the exploitation of fluidic effects that are not
normally observed in macroscale environments. Fluids flowing in an enclosed channel
exhibit either turbulent or laminar flow. An effect of miniaturisation on fluid properties is that
viscous forces control the fluid flow rather than inertial forces as in case of macroscopic
systems. Fluids in micro channels flow parallel, without turbulence, and mixing occurs via
molecular diffusion across fluid interfaces.57 Fluid flow can be characterised by a
dimensionless number known as the Reynolds Number (Re).55, 57
The Reynolds number, Re defines the ratio of inertial force to the viscous force in a fluid flow:
(1.5)
Here, δ is the hydrodynamic diameter of the channel, ρ is the density of the fluid, ν is the
velocity of the flowing fluid and η is the fluid viscosity.
In general, Re values above 2000 indicate turbulent flow and Re values below 1 indicate
laminar flow. Values between 1 and 2000 indicate an intermediate regime where both
laminar and turbulent flows are significant. From the above equation we see that length scale
has a direct impact on Re. As δ approaches 10-6, the Reynolds number is reduced to less
than 2000, resulting in loss of turbulence and an increase in laminar flow. A microfluidic
channel of 100 μm diameter, with water flowing at a speed of 1 mm s-1 has a Reynolds
Microfluidic Synthesis of Superparamagnetic Iron Oxide Nanocrystals for Magnetic Resonance Imaging
36
number of 0.1, resulting in laminar flow within the microchannel. For reactions in which two
or more reactants in separate streams are combined into a single stream, mixing will occur
by diffusion alone.
1.7 Types of Microreactors
Microfluidic reactors can be classified into two general types based on the type of reagent
flow: single- or continuous-phase flow micro reactors and segmented or droplet-phase flow
micro reactors. In single-phase flow the whole microchannel is filled with the stream of
reactant solutions, while in segmented-phase flow the reactant solutions are present
alongside an inert and immiscible carrier fluid flowing through the microchannel. Figure 1.11
shows both kinds of fluid flows in a microfluidic reactor. A depicts single-phase while B
depicts segmented phase. A major problem associated with single-phase microfluidic
systems is the presence of parabolic flow profile with fluid velocity being almost zero at the
channel walls and maximum at centre. (Figure 1.11A)56 These kinds of parabolic flows are
caused by the shear forces exerted by the channel walls and are unavoidable
1.7.1 Single-Phase Flow Microfluidics
In the case of single-phase microfluidic devices, two streams of aqueous fluids flow parallel
to each other without significant lateral mixing. Owing to the laminar nature of the flow,
mixing in continuous flow microreactors is diffusion limited, which means long mixing times
and hence greater reaction times.57 Continuous flow synthesis involves the mixing and
reacting of reagents in microchannels under diffusion-based laminar flow conditions. Figure
1.12 shows the mixing of two miscible fluid streams under laminar flow conditions. The
A) Schematic of the parabolic velocity dispersion in single-phase flow microfluidic reactors and B)
Droplet-phase flow regime without velocity dispersion. Image reproduced from reference [55].
Figure 1.11:
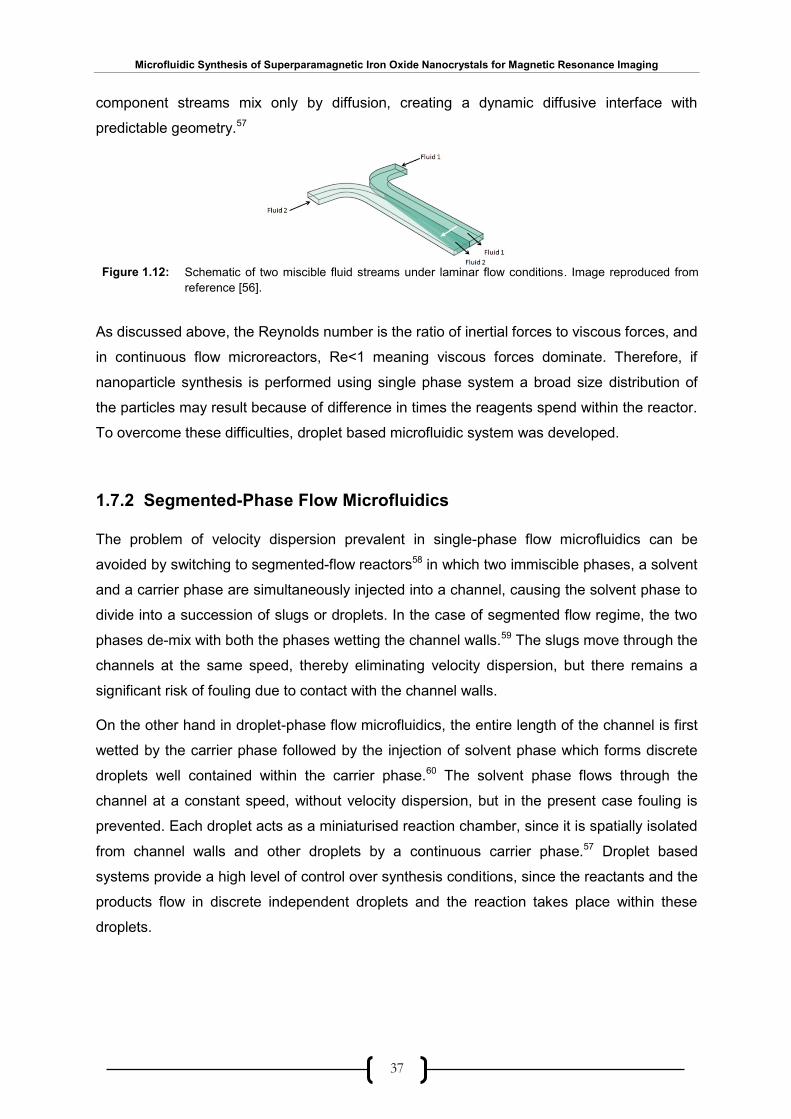
Microfluidic Synthesis of Superparamagnetic Iron Oxide Nanocrystals for Magnetic Resonance Imaging
37
component streams mix only by diffusion, creating a dynamic diffusive interface with
predictable geometry.57
As discussed above, the Reynolds number is the ratio of inertial forces to viscous forces, and
in continuous flow microreactors, Re<1 meaning viscous forces dominate. Therefore, if
nanoparticle synthesis is performed using single phase system a broad size distribution of
the particles may result because of difference in times the reagents spend within the reactor.
To overcome these difficulties, droplet based microfluidic system was developed.
1.7.2 Segmented-Phase Flow Microfluidics
The problem of velocity dispersion prevalent in single-phase flow microfluidics can be
avoided by switching to segmented-flow reactors58 in which two immiscible phases, a solvent
and a carrier phase are simultaneously injected into a channel, causing the solvent phase to
divide into a succession of slugs or droplets. In the case of segmented flow regime, the two
phases de-mix with both the phases wetting the channel walls.59 The slugs move through the
channels at the same speed, thereby eliminating velocity dispersion, but there remains a
significant risk of fouling due to contact with the channel walls.
On the other hand in droplet-phase flow microfluidics, the entire length of the channel is first
wetted by the carrier phase followed by the injection of solvent phase which forms discrete
droplets well contained within the carrier phase.60 The solvent phase flows through the
channel at a constant speed, without velocity dispersion, but in the present case fouling is
prevented. Each droplet acts as a miniaturised reaction chamber, since it is spatially isolated
from channel walls and other droplets by a continuous carrier phase.57 Droplet based
systems provide a high level of control over synthesis conditions, since the reactants and the
products flow in discrete independent droplets and the reaction takes place within these
droplets.
Schematic of two miscible fluid streams under laminar flow conditions. Image reproduced from
reference [56].
Figure 1.12:

Microfluidic Synthesis of Superparamagnetic Iron Oxide Nanocrystals for Magnetic Resonance Imaging
38
Figure 1.13 is a schematic illustration of the droplet approach forming droplets of multiple
reagent solutions by injecting them into a stream of oil. Droplets are mixed rapidly by
recirculation shown by white arrows in Figure 1.13. The droplets flow down the channels with
rapid mixing and no dispersion.61
1.7.2.1 Droplet Characteristics
Droplet formation takes place due to the shear force exerted by the carrier fluid onto the
solvent which is expelled into the continuous carrier phase. An important criterion is that the
surface tension at the solvent/carrier interface must be sufficiently high so as to prevent the
breakdown of plugs by shear force exerted on them by the channel walls.61 Droplet
formation is ascertained by a dimensionless number called the Capillary number, Ca:
(1.7)
Here U (m s-1) is the flow velocity, µ (kg m-1) is the fluid viscosity and γ (kg m-1s-1) is the
surface tension at the water/oil interface. Normally, stable droplets are produced when Ca (<
~0.1).61
The distance between adjacent droplets is known as the period. Both the period and the
droplet length are independent of the total flow rate and Ca.61 However, the factor which
strongly affects the period and the droplet length is the solvent fraction, Sf, which is the ratio
of the volumetric flow rate of solvent stream (Vw) to the volumetric flow rate of the carrier fluid
(VC) represented in Equation 1.8
Schematic of oil/water droplet-based microfluidic reactor. Droplets are formed by injecting
aqueous solutions into a stream of water-immiscible carrier fluid. Fluid flow within the droplets
is indicated by white arrows. Image reproduced from reference [60].
Figure 1.13:
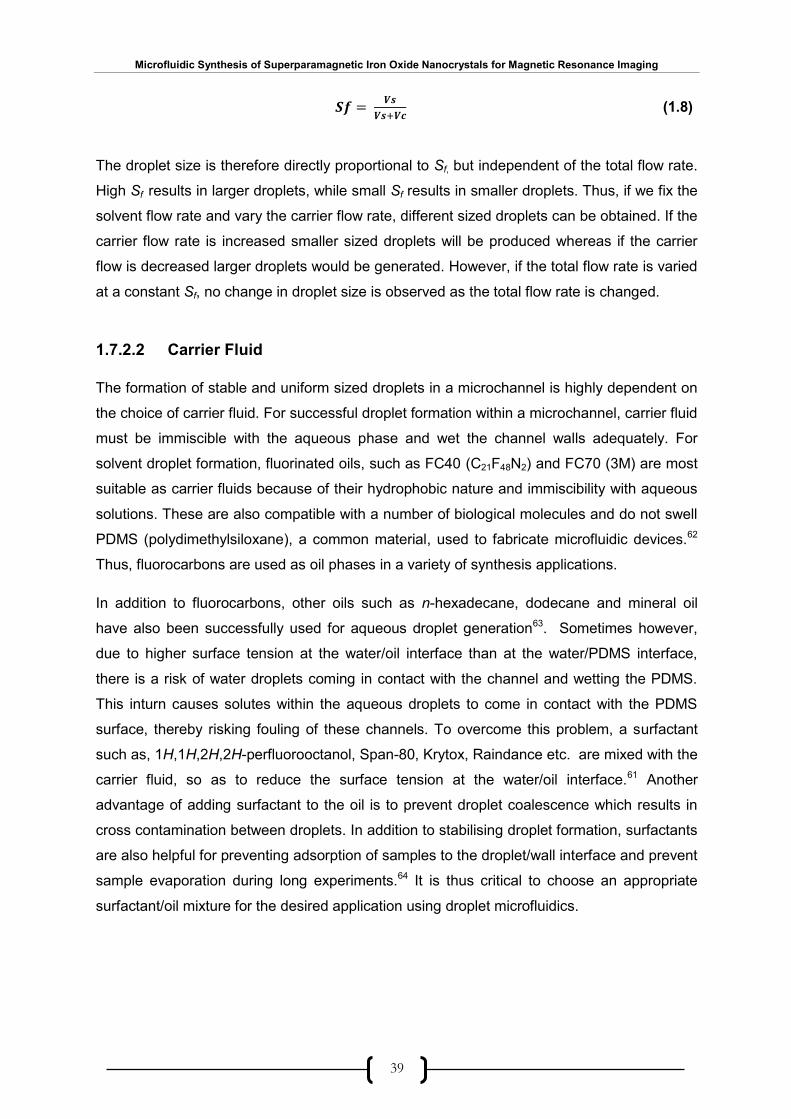
Microfluidic Synthesis of Superparamagnetic Iron Oxide Nanocrystals for Magnetic Resonance Imaging
39
(1.8)
The droplet size is therefore directly proportional to Sf, but independent of the total flow rate.
High Sf results in larger droplets, while small Sf results in smaller droplets. Thus, if we fix the
solvent flow rate and vary the carrier flow rate, different sized droplets can be obtained. If the
carrier flow rate is increased smaller sized droplets will be produced whereas if the carrier
flow is decreased larger droplets would be generated. However, if the total flow rate is varied
at a constant Sf, no change in droplet size is observed as the total flow rate is changed.
1.7.2.2 Carrier Fluid
The formation of stable and uniform sized droplets in a microchannel is highly dependent on
the choice of carrier fluid. For successful droplet formation within a microchannel, carrier fluid
must be immiscible with the aqueous phase and wet the channel walls adequately. For
solvent droplet formation, fluorinated oils, such as FC40 (C21F48N2) and FC70 (3M) are most
suitable as carrier fluids because of their hydrophobic nature and immiscibility with aqueous
solutions. These are also compatible with a number of biological molecules and do not swell
PDMS (polydimethylsiloxane), a common material, used to fabricate microfluidic devices.62
Thus, fluorocarbons are used as oil phases in a variety of synthesis applications.
In addition to fluorocarbons, other oils such as n-hexadecane, dodecane and mineral oil
have also been successfully used for aqueous droplet generation63. Sometimes however,
due to higher surface tension at the water/oil interface than at the water/PDMS interface,
there is a risk of water droplets coming in contact with the channel and wetting the PDMS.
This inturn causes solutes within the aqueous droplets to come in contact with the PDMS
surface, thereby risking fouling of these channels. To overcome this problem, a surfactant
such as, 1H,1H,2H,2H-perfluorooctanol, Span-80, Krytox, Raindance etc. are mixed with the
carrier fluid, so as to reduce the surface tension at the water/oil interface.61 Another
advantage of adding surfactant to the oil is to prevent droplet coalescence which results in
cross contamination between droplets. In addition to stabilising droplet formation, surfactants
are also helpful for preventing adsorption of samples to the droplet/wall interface and prevent
sample evaporation during long experiments.64 It is thus critical to choose an appropriate
surfactant/oil mixture for the desired application using droplet microfluidics.

Microfluidic Synthesis of Superparamagnetic Iron Oxide Nanocrystals for Magnetic Resonance Imaging
40
1.7.2.3 Droplet Generation and Merging
Droplets within microchannels are normally generated by using either flow-focussing or
T-Junction geometries65 as shown in Figure 1.14.
In a flow-focusing geometry, the carrier fluid (continuous-phase) is injected through two
symmetric side channels and the aqueous streams (dispersed-phase) are pumped through a
central inlet of a microfluidic device (Figure 1.14A). Both phases are subsequently propelled
through a nozzle leading into the main channel. The aqueous stream breaks down into
droplets under the influence of a uniform shear force exerted by the carrier phase flowing
through the side channels. Based on this mechanism, spherical droplets can be generated
reproducibly. Droplet size can be controlled by varying the ratio of aqueous-phase to carrier-
phase. Large droplets are produced by either decreasing the flow rate of the carrier phase
and/or increasing the flow rate of the aqueous phase.66
On the other hand in T-junction geometries (Figure 1.14 B), droplets are formed by injecting
an aqueous phase orthogonally to the carrier fluid flowing through the main channel, which
breaks the aqueous stream into droplets due to shear forces. In this geometry, the carrier
fluid exerts a pressure which leads to the whirling of the aqueous stream right at the droplet
forming junction. This process enhances the mixing of aqueous solutions within the droplets.
The size of droplets produced using T-Junctions can be as large as the cross-sectional
dimensions of the microchannel and can be varied by changing the channel widths, flow
rates, or the viscosities of the two phases58.
Formation of droplets in A) Flow-focussing geometry B) T-junction geometry. Images
reproduced from references [64] and [65] respectively.
Figure1.14:
Microfluidic Synthesis of Superparamagnetic Iron Oxide Nanocrystals for Magnetic Resonance Imaging
41
As discussed above in a droplet based system, reagents are injected into a continuous
stream of carrier fluid and undergo droplet formation in the first stage followed by the
reaction within the droplet in the second stage. However, in reactions wherein instant
precipitates are generated and channel fouling is the major problem, reagent steams cannot
be injected simultaneously into the carrier phase. Therefore, for such reactions reagents
have to be encapsulated within individual droplets first followed by subsequent pairing to
generate the desired nanoparticles which are well encapsulated within the product droplet.
Thus, pairing of reagent droplets is critical and hence a suitable pairing device is needed.
Since the droplets are surfactant-stabilised they do not pair until stimulated to do so by an
external force. Therefore, active control of droplet release using an electric field has been
proposed by Link et al.67 or passive hydrodynamic coupling at a single nozzle by Zheng et
al.68 However, in certain instances, even if pairing is controlled there still occurs some
undesirable coalescence. To overcome the difficulty of uncontrolled coalescence, Frenz et
al.69 reported a way of generating droplet pairs based on hydrodynamic coupling of two
spatially separated nozzles. The droplet generation part of their device is shown in Figure
1.15.
Frenz’s device consisted of two hydrodynamically coupled nozzles. The oil phase (from a
central inlet having flow rate Qo) hydrodynamically emulsifies two aqueous streams of
reagents. The reactants flow from two different nozzles at flow rates QX and QY respectively.
As the droplet is formed at the first nozzle, the aqueous stream blocks the oil flowing in
through the central channel leading to an increased oil flow through the second nozzle. Once
the droplet is released the oil flow returns back to the first channel. This alternation of oil flow
helps to ensure droplet pairing at various flow rates. The droplet volume ratio in this case is
easily controllable, because it is simply equal to the flow rate ratio of carrier fluid and
aqueous reagents.
Schematic view of generation of droplet pairs through hydrodynamically coupled nozzles. Two aqueous phases are injected through the outer channels and are synchronously emulsified by the central oil inlet. The flow rates are Qo=800 µl h
-1 for oil, Qx=400 µl h
-1, Qy=100 µl h
-1for the
aqueous phases. Image reproduced from reference [68].
Figure 1.15:
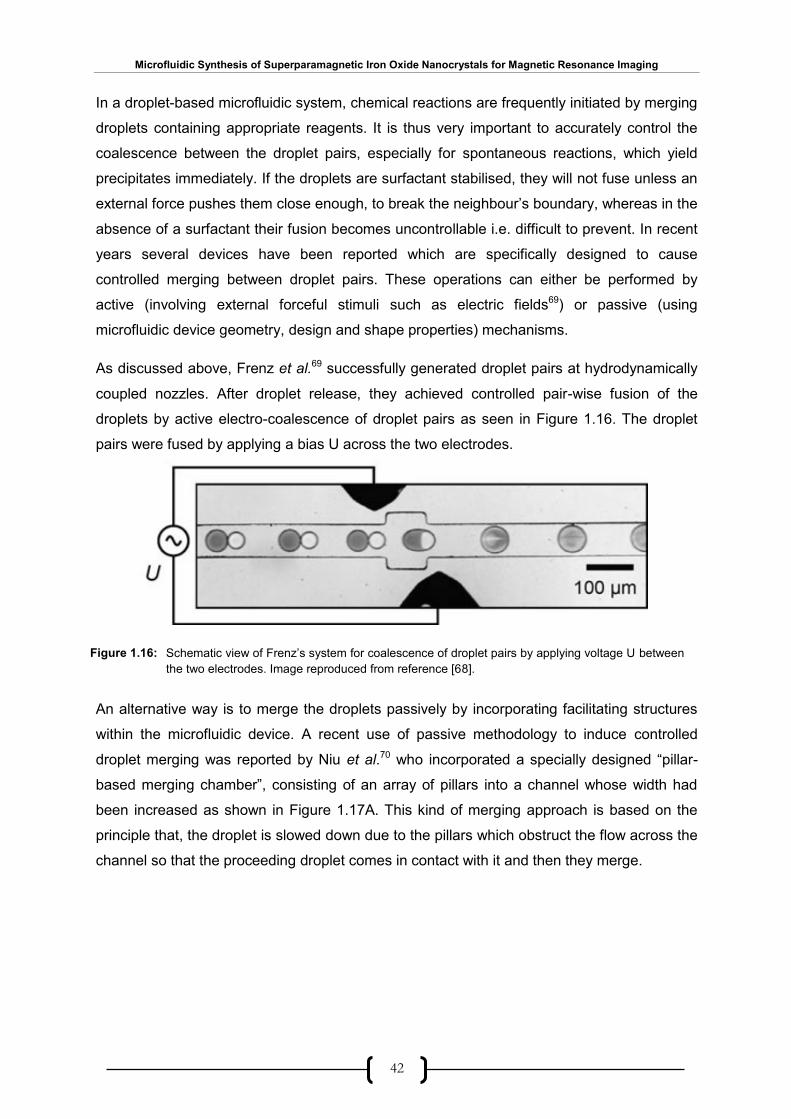
Microfluidic Synthesis of Superparamagnetic Iron Oxide Nanocrystals for Magnetic Resonance Imaging
42
In a droplet-based microfluidic system, chemical reactions are frequently initiated by merging
droplets containing appropriate reagents. It is thus very important to accurately control the
coalescence between the droplet pairs, especially for spontaneous reactions, which yield
precipitates immediately. If the droplets are surfactant stabilised, they will not fuse unless an
external force pushes them close enough, to break the neighbour’s boundary, whereas in the
absence of a surfactant their fusion becomes uncontrollable i.e. difficult to prevent. In recent
years several devices have been reported which are specifically designed to cause
controlled merging between droplet pairs. These operations can either be performed by
active (involving external forceful stimuli such as electric fields69) or passive (using
microfluidic device geometry, design and shape properties) mechanisms.
As discussed above, Frenz et al.69 successfully generated droplet pairs at hydrodynamically
coupled nozzles. After droplet release, they achieved controlled pair-wise fusion of the
droplets by active electro-coalescence of droplet pairs as seen in Figure 1.16. The droplet
pairs were fused by applying a bias U across the two electrodes.
An alternative way is to merge the droplets passively by incorporating facilitating structures
within the microfluidic device. A recent use of passive methodology to induce controlled
droplet merging was reported by Niu et al.70 who incorporated a specially designed “pillar-
based merging chamber”, consisting of an array of pillars into a channel whose width had
been increased as shown in Figure 1.17A. This kind of merging approach is based on the
principle that, the droplet is slowed down due to the pillars which obstruct the flow across the
channel so that the proceeding droplet comes in contact with it and then they merge.
Schematic view of Frenz’s system for coalescence of droplet pairs by applying voltage U between
the two electrodes. Image reproduced from reference [68].
Figure 1.16:
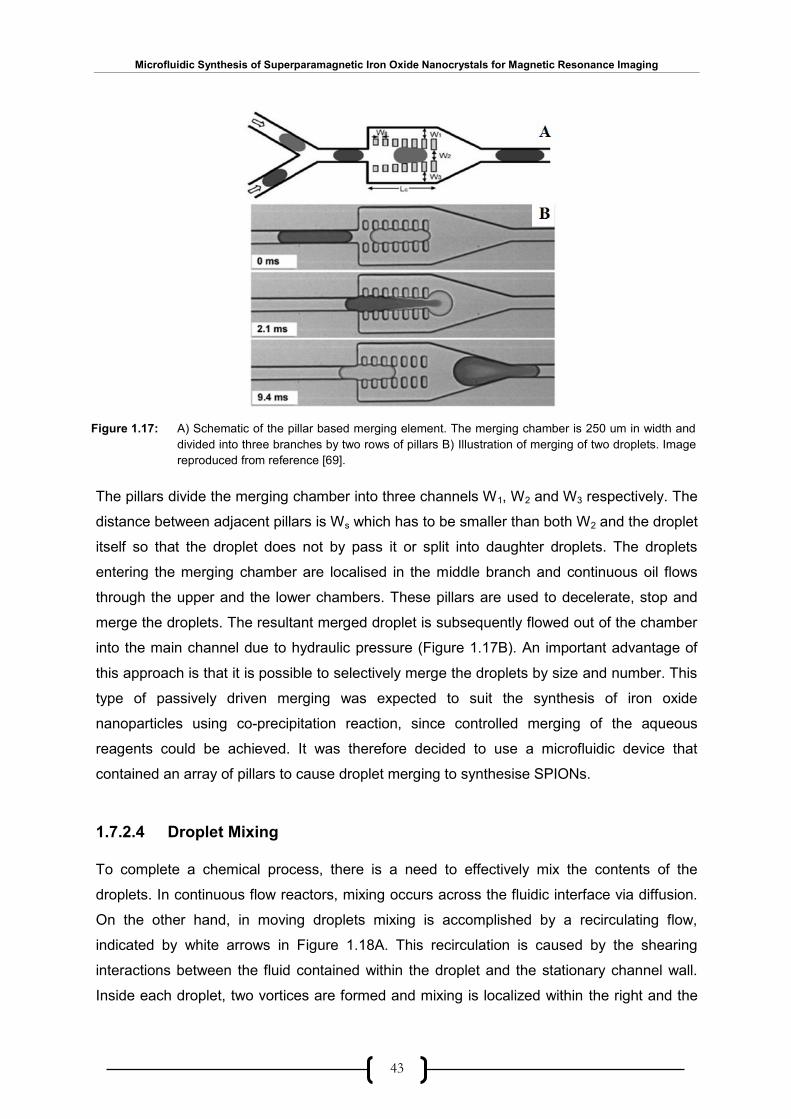
Microfluidic Synthesis of Superparamagnetic Iron Oxide Nanocrystals for Magnetic Resonance Imaging
43
The pillars divide the merging chamber into three channels W1, W2 and W3 respectively. The
distance between adjacent pillars is Ws which has to be smaller than both W2 and the droplet
itself so that the droplet does not by pass it or split into daughter droplets. The droplets
entering the merging chamber are localised in the middle branch and continuous oil flows
through the upper and the lower chambers. These pillars are used to decelerate, stop and
merge the droplets. The resultant merged droplet is subsequently flowed out of the chamber
into the main channel due to hydraulic pressure (Figure 1.17B). An important advantage of
this approach is that it is possible to selectively merge the droplets by size and number. This
type of passively driven merging was expected to suit the synthesis of iron oxide
nanoparticles using co-precipitation reaction, since controlled merging of the aqueous
reagents could be achieved. It was therefore decided to use a microfluidic device that
contained an array of pillars to cause droplet merging to synthesise SPIONs.
1.7.2.4 Droplet Mixing
To complete a chemical process, there is a need to effectively mix the contents of the
droplets. In continuous flow reactors, mixing occurs across the fluidic interface via diffusion.
On the other hand, in moving droplets mixing is accomplished by a recirculating flow,
indicated by white arrows in Figure 1.18A. This recirculation is caused by the shearing
interactions between the fluid contained within the droplet and the stationary channel wall.
Inside each droplet, two vortices are formed and mixing is localized within the right and the
A) Schematic of the pillar based merging element. The merging chamber is 250 um in width and
divided into three branches by two rows of pillars B) Illustration of merging of two droplets. Image
reproduced from reference [69].
Figure 1.17:
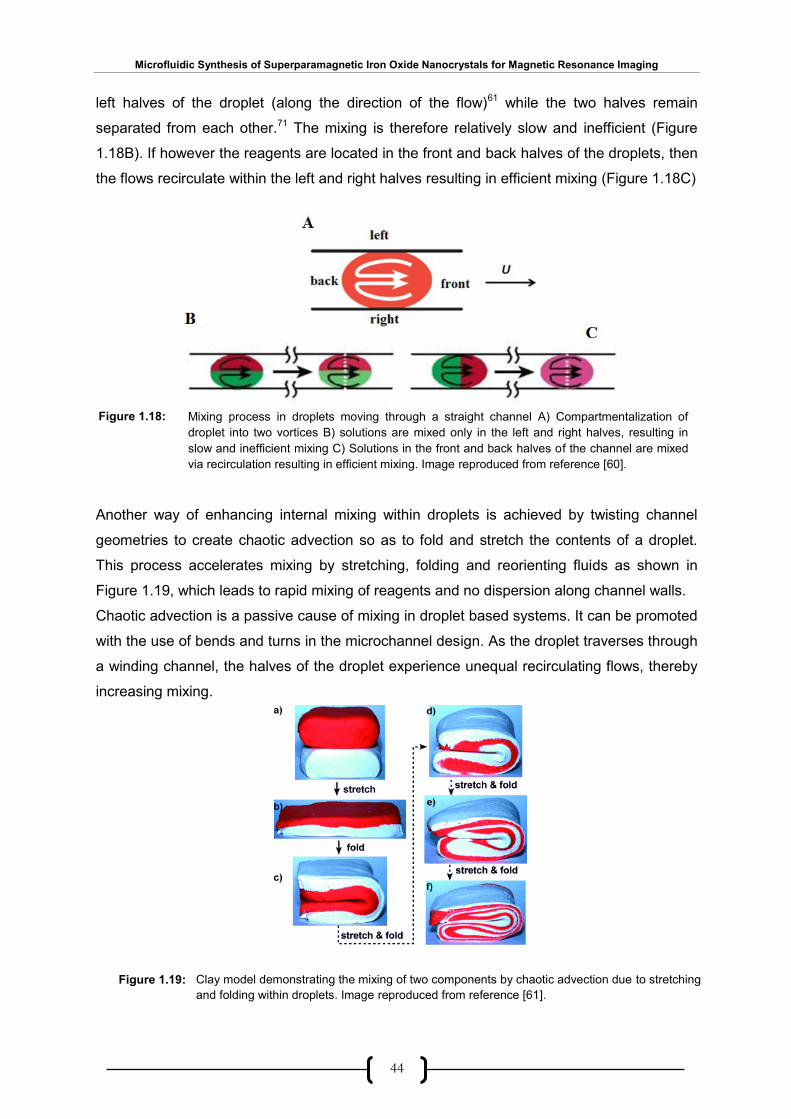
Microfluidic Synthesis of Superparamagnetic Iron Oxide Nanocrystals for Magnetic Resonance Imaging
44
left halves of the droplet (along the direction of the flow)61 while the two halves remain
separated from each other.71 The mixing is therefore relatively slow and inefficient (Figure
1.18B). If however the reagents are located in the front and back halves of the droplets, then
the flows recirculate within the left and right halves resulting in efficient mixing (Figure 1.18C)
Another way of enhancing internal mixing within droplets is achieved by twisting channel
geometries to create chaotic advection so as to fold and stretch the contents of a droplet.
This process accelerates mixing by stretching, folding and reorienting fluids as shown in
Figure 1.19, which leads to rapid mixing of reagents and no dispersion along channel walls.
Chaotic advection is a passive cause of mixing in droplet based systems. It can be promoted
with the use of bends and turns in the microchannel design. As the droplet traverses through
a winding channel, the halves of the droplet experience unequal recirculating flows, thereby
increasing mixing.
Clay model demonstrating the mixing of two components by chaotic advection due to stretching
and folding within droplets. Image reproduced from reference [61].
Figure 1.18: Mixing process in droplets moving through a straight channel A) Compartmentalization of
droplet into two vortices B) solutions are mixed only in the left and right halves, resulting in
slow and inefficient mixing C) Solutions in the front and back halves of the channel are mixed
via recirculation resulting in efficient mixing. Image reproduced from reference [60].
Figure 1.19:
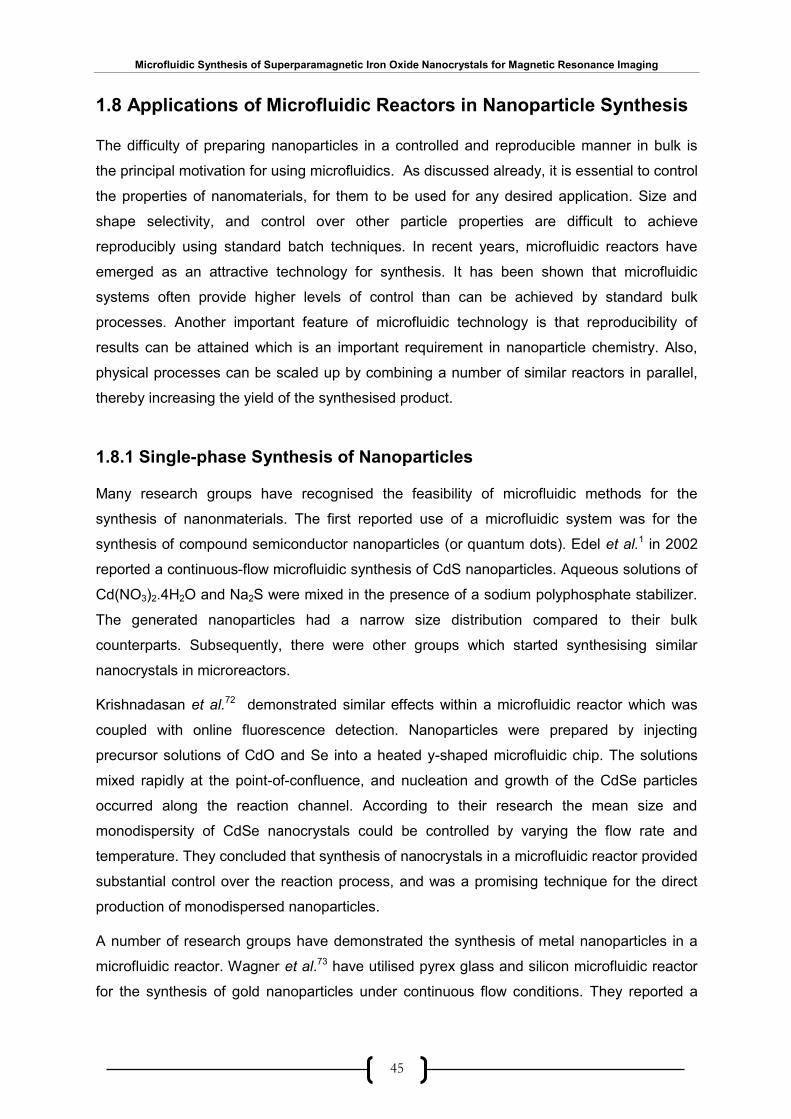
Microfluidic Synthesis of Superparamagnetic Iron Oxide Nanocrystals for Magnetic Resonance Imaging
45
1.8 Applications of Microfluidic Reactors in Nanoparticle Synthesis
The difficulty of preparing nanoparticles in a controlled and reproducible manner in bulk is
the principal motivation for using microfluidics. As discussed already, it is essential to control
the properties of nanomaterials, for them to be used for any desired application. Size and
shape selectivity, and control over other particle properties are difficult to achieve
reproducibly using standard batch techniques. In recent years, microfluidic reactors have
emerged as an attractive technology for synthesis. It has been shown that microfluidic
systems often provide higher levels of control than can be achieved by standard bulk
processes. Another important feature of microfluidic technology is that reproducibility of
results can be attained which is an important requirement in nanoparticle chemistry. Also,
physical processes can be scaled up by combining a number of similar reactors in parallel,
thereby increasing the yield of the synthesised product.
1.8.1 Single-phase Synthesis of Nanoparticles
Many research groups have recognised the feasibility of microfluidic methods for the
synthesis of nanonmaterials. The first reported use of a microfluidic system was for the
synthesis of compound semiconductor nanoparticles (or quantum dots). Edel et al.1 in 2002
reported a continuous-flow microfluidic synthesis of CdS nanoparticles. Aqueous solutions of
Cd(NO3)2.4H2O and Na2S were mixed in the presence of a sodium polyphosphate stabilizer.
The generated nanoparticles had a narrow size distribution compared to their bulk
counterparts. Subsequently, there were other groups which started synthesising similar
nanocrystals in microreactors.
Krishnadasan et al.72 demonstrated similar effects within a microfluidic reactor which was
coupled with online fluorescence detection. Nanoparticles were prepared by injecting
precursor solutions of CdO and Se into a heated y-shaped microfluidic chip. The solutions
mixed rapidly at the point-of-confluence, and nucleation and growth of the CdSe particles
occurred along the reaction channel. According to their research the mean size and
monodispersity of CdSe nanocrystals could be controlled by varying the flow rate and
temperature. They concluded that synthesis of nanocrystals in a microfluidic reactor provided
substantial control over the reaction process, and was a promising technique for the direct
production of monodispersed nanoparticles.
A number of research groups have demonstrated the synthesis of metal nanoparticles in a
microfluidic reactor. Wagner et al.73 have utilised pyrex glass and silicon microfluidic reactor
for the synthesis of gold nanoparticles under continuous flow conditions. They reported a

Microfluidic Synthesis of Superparamagnetic Iron Oxide Nanocrystals for Magnetic Resonance Imaging
46
synthesis of gold nanoparticles (5-50 nm) directly from a gold salt (HAuCl4) and a reducing
agent, ascorbic acid. They presented that by adjusting experimental parameters such as the
flow rate, pH, amount of reducing agent the mean diameter and size distribution of the
nanoparticles could be modulated. They concluded that the size distribution achieved by
carrying out the synthesis on a microreactor was two times smaller than reaction performed
in bulk. Similar work on production of silver nanoparticles was performed by Lin et al.74 to
generate monodispersed particles.
Hassan at al.75 demonstrated the use of a millimetric axial flow device to produce iron oxide
nanoparticles by mixing co-flowing streams of FeCl3.6H2O and FeCl2.4H2O with
tetramethylammonium hydroxide ((CH3)4NOH, TMAOH). They were able to synthesise
magnetic and stable colloidal iron oxide nanoparticles with a size less than 7 nm
continuously, by controlling the flow rate of the different reagents.
From the above examples it is concluded that microreactors have ascertained their utilisation
as vessels for carrying out a number of synthetic reactions. As discussed previously, the
important parameters that can be controlled by miniaturising the generation of nanoparticles
are monodispersity and size distribution which thereby enable the implementation of a
number of these nanoparticles in commercial sectors. Synthesis carried out in microfluidic
channels can be carried out with excellent control of reaction conditions and reproducible
efficient mixing. Both of these factors are extremely important in ensuring low size
distributions in nanoparticle synthesis.
1.8.2 Droplet-Phase Synthesis of Nanoparticles
It has already been discussed in the previous sections that droplet based microfluidics is
more suitable for nanoparticle synthesis, compared to continuous-phase microfluidics, since
there is virtually no velocity dispersion - a potential cause of polydispersity in nanocrystals.
Another important advantage of droplet flow is that the risk of fouling, associated with
precipitation reactions, is greatly reduced since any reaction products that might deposit on
channel walls are well contained within the droplet. Shestapalov et al.76 demonstrated the
first droplet synthesis of colloidal nanocrystals of CdS quantum dots in a PDMS droplet
reactor using CdCl2 and Na2S as the reactants. He compared both continuous and droplet
modes of CdS synthesis in a microreactor. Figure 1.20 shows both the synthetic methods.
When the synthesis was performed in continuous-flow (Figure 1.20A), the generated
particles started depositing on the channel walls almost immediately: after 6 minutes of
operation the mouth of the channel showed significant particle deposition, and after 30
minutes, the whole device was coated with CdS particles and rendered unusable.
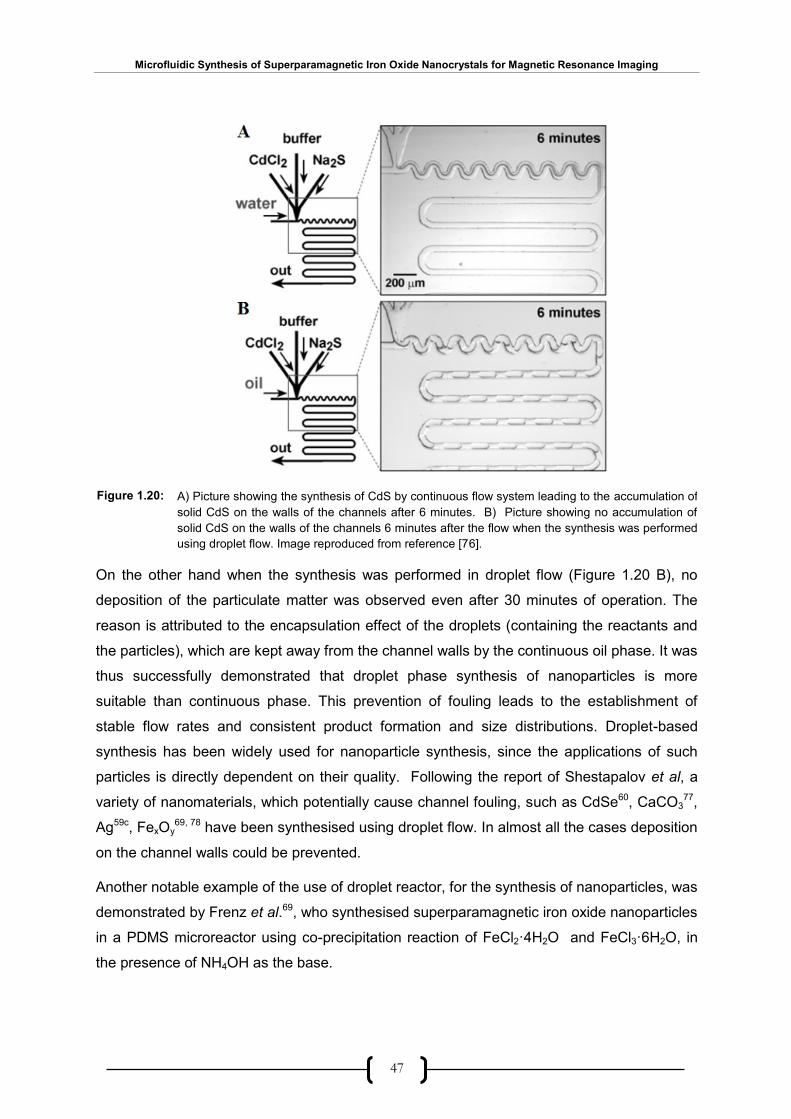
Microfluidic Synthesis of Superparamagnetic Iron Oxide Nanocrystals for Magnetic Resonance Imaging
47
On the other hand when the synthesis was performed in droplet flow (Figure 1.20 B), no
deposition of the particulate matter was observed even after 30 minutes of operation. The
reason is attributed to the encapsulation effect of the droplets (containing the reactants and
the particles), which are kept away from the channel walls by the continuous oil phase. It was
thus successfully demonstrated that droplet phase synthesis of nanoparticles is more
suitable than continuous phase. This prevention of fouling leads to the establishment of
stable flow rates and consistent product formation and size distributions. Droplet-based
synthesis has been widely used for nanoparticle synthesis, since the applications of such
particles is directly dependent on their quality. Following the report of Shestapalov et al, a
variety of nanomaterials, which potentially cause channel fouling, such as CdSe60, CaCO377,
Ag59c, FexOy69, 78 have been synthesised using droplet flow. In almost all the cases deposition
on the channel walls could be prevented.
Another notable example of the use of droplet reactor, for the synthesis of nanoparticles, was
demonstrated by Frenz et al.69, who synthesised superparamagnetic iron oxide nanoparticles
in a PDMS microreactor using co-precipitation reaction of FeCl2·4H2O and FeCl3·6H2O, in
the presence of NH4OH as the base.
A) Picture showing the synthesis of CdS by continuous flow system leading to the accumulation of
solid CdS on the walls of the channels after 6 minutes. B) Picture showing no accumulation of
solid CdS on the walls of the channels 6 minutes after the flow when the synthesis was performed
using droplet flow. Image reproduced from reference [76].
Figure 1.20:
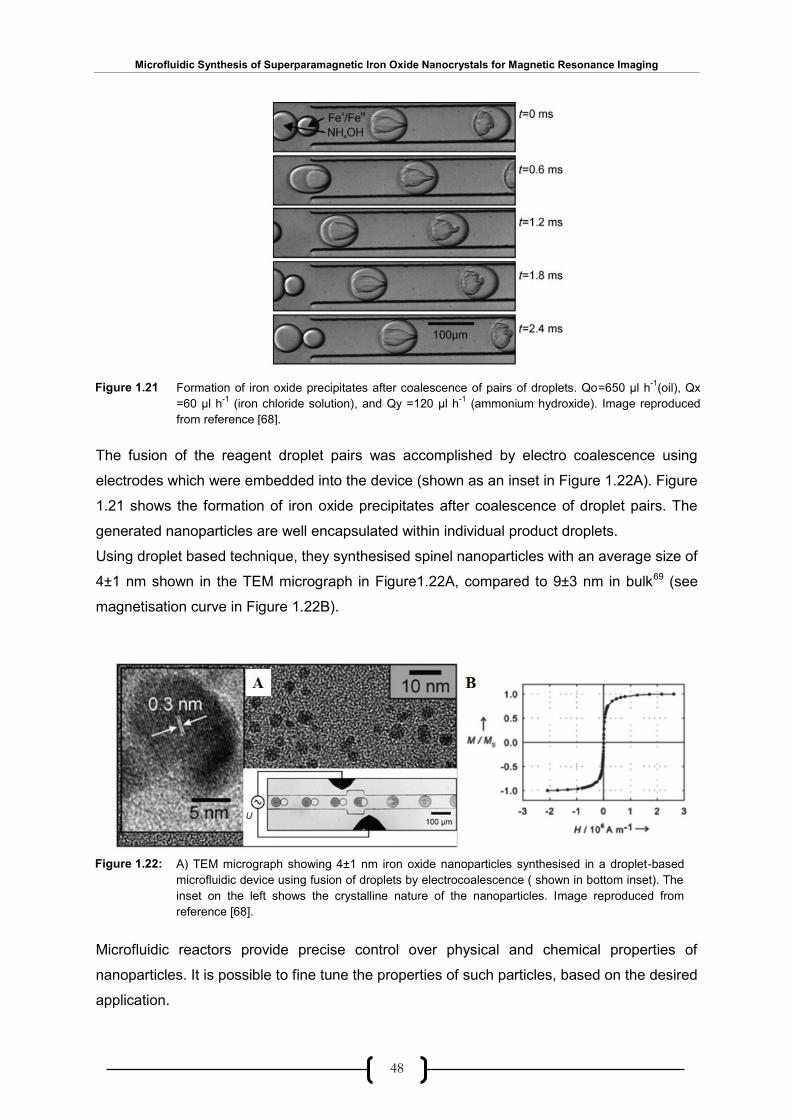
Microfluidic Synthesis of Superparamagnetic Iron Oxide Nanocrystals for Magnetic Resonance Imaging
48
The fusion of the reagent droplet pairs was accomplished by electro coalescence using
electrodes which were embedded into the device (shown as an inset in Figure 1.22A). Figure
1.21 shows the formation of iron oxide precipitates after coalescence of droplet pairs. The
generated nanoparticles are well encapsulated within individual product droplets.
Using droplet based technique, they synthesised spinel nanoparticles with an average size of
4±1 nm shown in the TEM micrograph in Figure1.22A, compared to 9±3 nm in bulk69 (see
magnetisation curve in Figure 1.22B).
Microfluidic reactors provide precise control over physical and chemical properties of
nanoparticles. It is possible to fine tune the properties of such particles, based on the desired
application.
A) TEM micrograph showing 4±1 nm iron oxide nanoparticles synthesised in a droplet-based
microfluidic device using fusion of droplets by electrocoalescence ( shown in bottom inset). The
inset on the left shows the crystalline nature of the nanoparticles. Image reproduced from
reference [68].
Figure 1.22:
Formation of iron oxide precipitates after coalescence of pairs of droplets. Qo=650 µl h-1
(oil), Qx
=60 µl h-1
(iron chloride solution), and Qy =120 µl h-1
(ammonium hydroxide). Image reproduced
from reference [68].
Figure 1.21
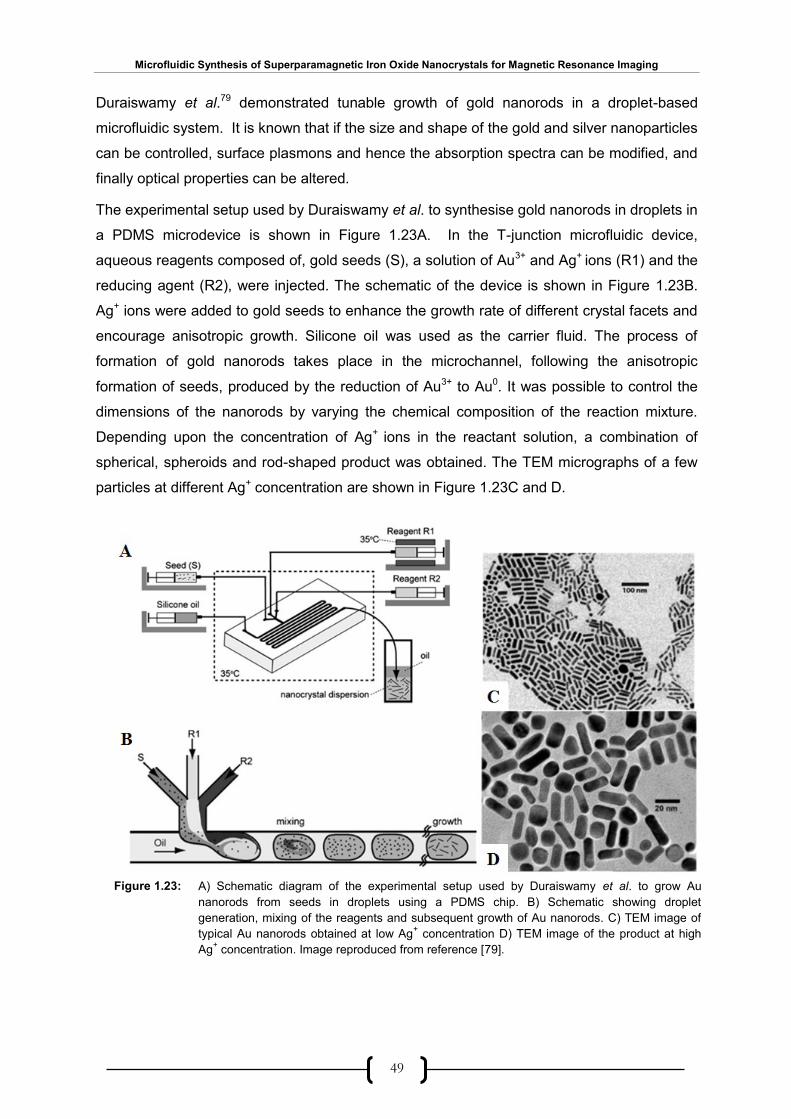
Microfluidic Synthesis of Superparamagnetic Iron Oxide Nanocrystals for Magnetic Resonance Imaging
49
Duraiswamy et al.79 demonstrated tunable growth of gold nanorods in a droplet-based
microfluidic system. It is known that if the size and shape of the gold and silver nanoparticles
can be controlled, surface plasmons and hence the absorption spectra can be modified, and
finally optical properties can be altered.
The experimental setup used by Duraiswamy et al. to synthesise gold nanorods in droplets in
a PDMS microdevice is shown in Figure 1.23A. In the T-junction microfluidic device,
aqueous reagents composed of, gold seeds (S), a solution of Au3+ and Ag+ ions (R1) and the
reducing agent (R2), were injected. The schematic of the device is shown in Figure 1.23B.
Ag+ ions were added to gold seeds to enhance the growth rate of different crystal facets and
encourage anisotropic growth. Silicone oil was used as the carrier fluid. The process of
formation of gold nanorods takes place in the microchannel, following the anisotropic
formation of seeds, produced by the reduction of Au3+ to Au0. It was possible to control the
dimensions of the nanorods by varying the chemical composition of the reaction mixture.
Depending upon the concentration of Ag+ ions in the reactant solution, a combination of
spherical, spheroids and rod-shaped product was obtained. The TEM micrographs of a few
particles at different Ag+ concentration are shown in Figure 1.23C and D.
A) Schematic diagram of the experimental setup used by Duraiswamy et al. to grow Au
nanorods from seeds in droplets using a PDMS chip. B) Schematic showing droplet
generation, mixing of the reagents and subsequent growth of Au nanorods. C) TEM image of
typical Au nanorods obtained at low Ag+ concentration D) TEM image of the product at high
Ag+ concentration. Image reproduced from reference [79].
Figure 1.23:
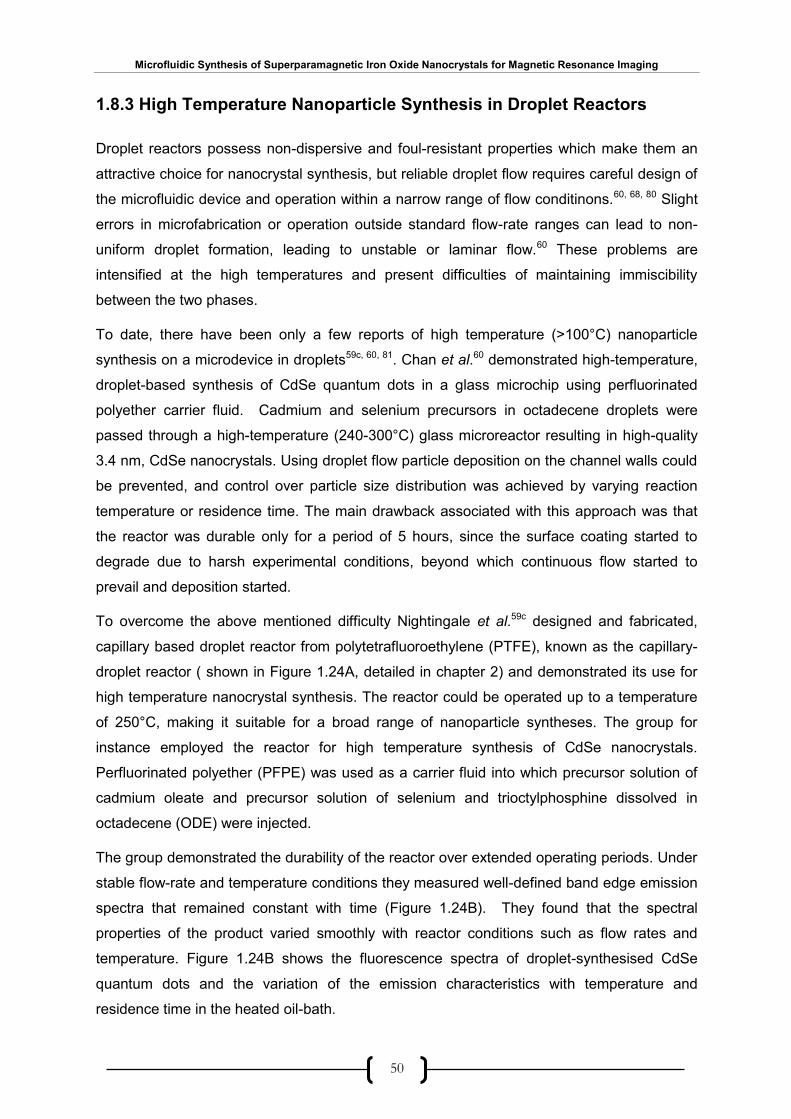
Microfluidic Synthesis of Superparamagnetic Iron Oxide Nanocrystals for Magnetic Resonance Imaging
50
1.8.3 High Temperature Nanoparticle Synthesis in Droplet Reactors
Droplet reactors possess non-dispersive and foul-resistant properties which make them an
attractive choice for nanocrystal synthesis, but reliable droplet flow requires careful design of
the microfluidic device and operation within a narrow range of flow conditinons.60, 68, 80 Slight
errors in microfabrication or operation outside standard flow-rate ranges can lead to non-
uniform droplet formation, leading to unstable or laminar flow.60 These problems are
intensified at the high temperatures and present difficulties of maintaining immiscibility
between the two phases.
To date, there have been only a few reports of high temperature (>100°C) nanoparticle
synthesis on a microdevice in droplets59c, 60, 81. Chan et al.60 demonstrated high-temperature,
droplet-based synthesis of CdSe quantum dots in a glass microchip using perfluorinated
polyether carrier fluid. Cadmium and selenium precursors in octadecene droplets were
passed through a high-temperature (240-300°C) glass microreactor resulting in high-quality
3.4 nm, CdSe nanocrystals. Using droplet flow particle deposition on the channel walls could
be prevented, and control over particle size distribution was achieved by varying reaction
temperature or residence time. The main drawback associated with this approach was that
the reactor was durable only for a period of 5 hours, since the surface coating started to
degrade due to harsh experimental conditions, beyond which continuous flow started to
prevail and deposition started.
To overcome the above mentioned difficulty Nightingale et al.59c designed and fabricated,
capillary based droplet reactor from polytetrafluoroethylene (PTFE), known as the capillary-
droplet reactor ( shown in Figure 1.24A, detailed in chapter 2) and demonstrated its use for
high temperature nanocrystal synthesis. The reactor could be operated up to a temperature
of 250°C, making it suitable for a broad range of nanoparticle syntheses. The group for
instance employed the reactor for high temperature synthesis of CdSe nanocrystals.
Perfluorinated polyether (PFPE) was used as a carrier fluid into which precursor solution of
cadmium oleate and precursor solution of selenium and trioctylphosphine dissolved in
octadecene (ODE) were injected.
The group demonstrated the durability of the reactor over extended operating periods. Under
stable flow-rate and temperature conditions they measured well-defined band edge emission
spectra that remained constant with time (Figure 1.24B). They found that the spectral
properties of the product varied smoothly with reactor conditions such as flow rates and
temperature. Figure 1.24B shows the fluorescence spectra of droplet-synthesised CdSe
quantum dots and the variation of the emission characteristics with temperature and
residence time in the heated oil-bath.
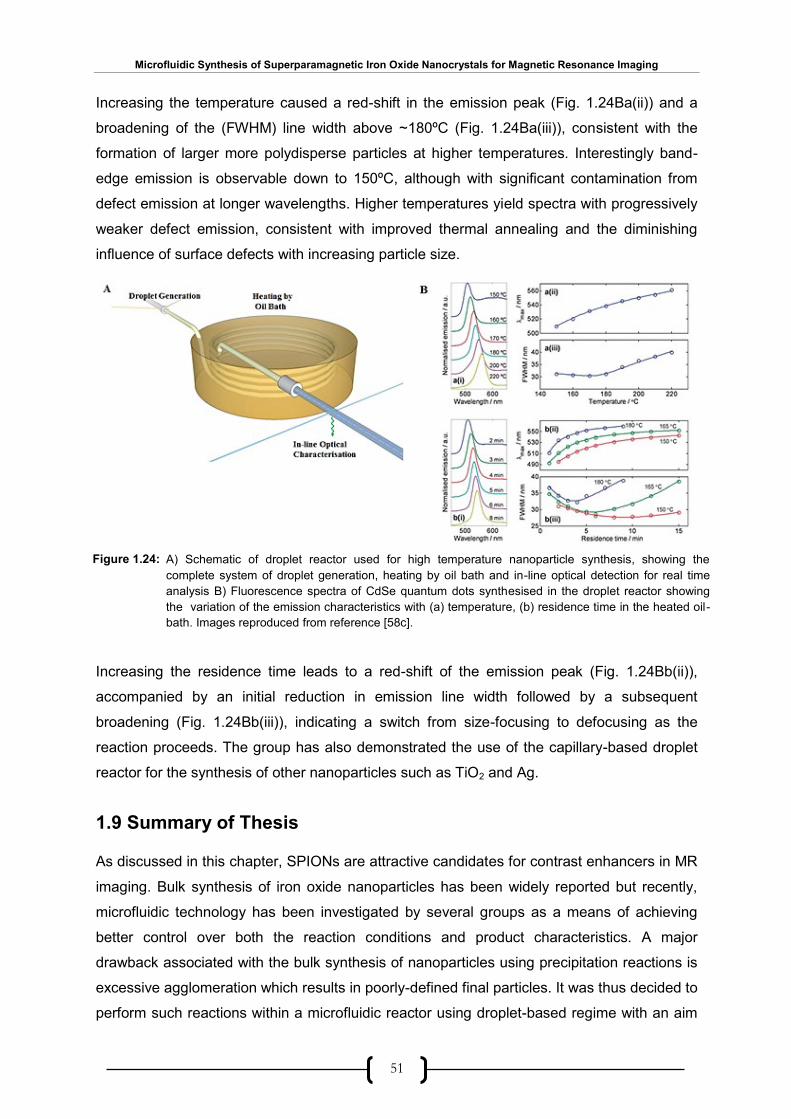
Microfluidic Synthesis of Superparamagnetic Iron Oxide Nanocrystals for Magnetic Resonance Imaging
51
Increasing the temperature caused a red-shift in the emission peak (Fig. 1.24Ba(ii)) and a
broadening of the (FWHM) line width above ~180ºC (Fig. 1.24Ba(iii)), consistent with the
formation of larger more polydisperse particles at higher temperatures. Interestingly band-
edge emission is observable down to 150ºC, although with significant contamination from
defect emission at longer wavelengths. Higher temperatures yield spectra with progressively
weaker defect emission, consistent with improved thermal annealing and the diminishing
influence of surface defects with increasing particle size.
Increasing the residence time leads to a red-shift of the emission peak (Fig. 1.24Bb(ii)),
accompanied by an initial reduction in emission line width followed by a subsequent
broadening (Fig. 1.24Bb(iii)), indicating a switch from size-focusing to defocusing as the
reaction proceeds. The group has also demonstrated the use of the capillary-based droplet
reactor for the synthesis of other nanoparticles such as TiO2 and Ag.
1.9 Summary of Thesis
As discussed in this chapter, SPIONs are attractive candidates for contrast enhancers in MR
imaging. Bulk synthesis of iron oxide nanoparticles has been widely reported but recently,
microfluidic technology has been investigated by several groups as a means of achieving
better control over both the reaction conditions and product characteristics. A major
drawback associated with the bulk synthesis of nanoparticles using precipitation reactions is
excessive agglomeration which results in poorly-defined final particles. It was thus decided to
perform such reactions within a microfluidic reactor using droplet-based regime with an aim
Figure 1.24: A) Schematic of droplet reactor used for high temperature nanoparticle synthesis, showing the
complete system of droplet generation, heating by oil bath and in-line optical detection for real time
analysis B) Fluorescence spectra of CdSe quantum dots synthesised in the droplet reactor showing
the variation of the emission characteristics with (a) temperature, (b) residence time in the heated oil-
bath. Images reproduced from reference [58c].

Microfluidic Synthesis of Superparamagnetic Iron Oxide Nanocrystals for Magnetic Resonance Imaging
52
of producing good quality monodisperse dextran coated SPIONs that could directly be used
in MR studies. This kind of combined synthesis and coating of iron oxide nanoparticles has
not previously been carried out within a microfluidic device. The purpose of this work was to
first synthesise iron oxide nanoparticles and secondly coat them with dextran within the
same microfluidic device. In most of the syntheses methods employed clear advantages over
bulk methods have been observed, most notably in terms of their size, shape and
crystallinity. This report is a compilation of various attempts to controllably synthesise
SPIONs starting form known bulk methods to an efficient and simple microdroplet method
and finally demonstrate the utility of in-house generated SPIONs as MR contrast enhancers.
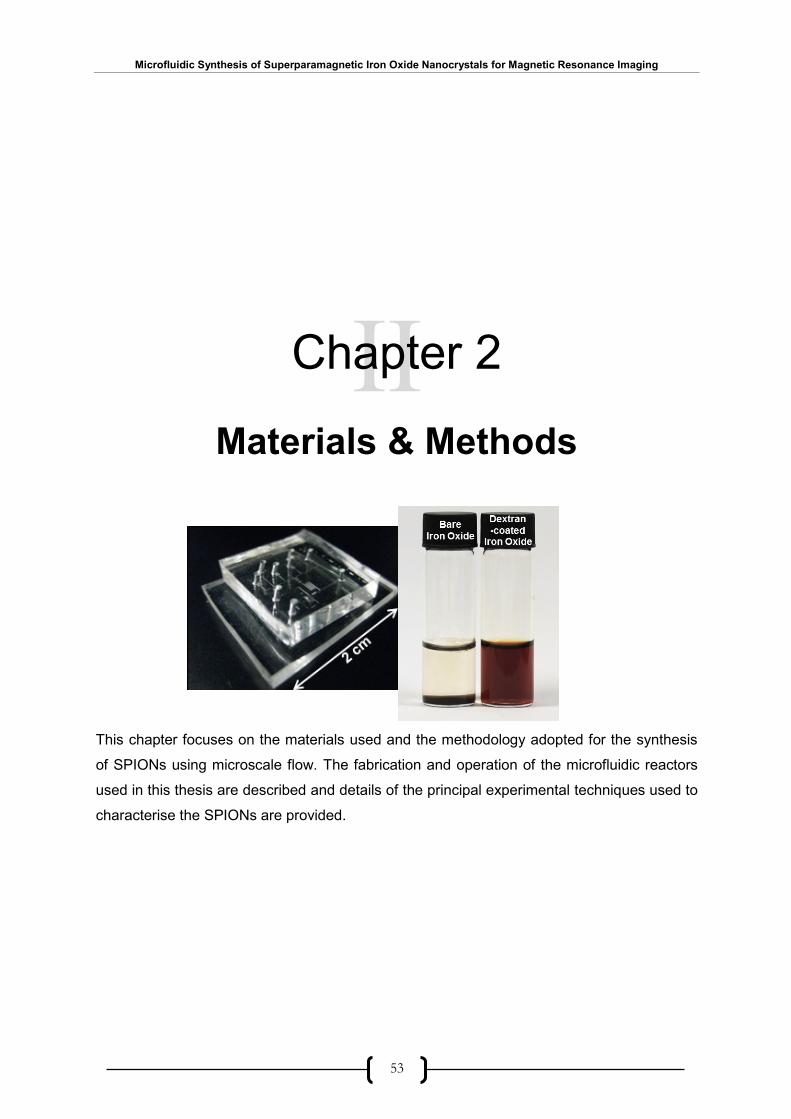
Microfluidic Synthesis of Superparamagnetic Iron Oxide Nanocrystals for Magnetic Resonance Imaging
53
II
Chapter 2
Materials & Methods
This chapter focuses on the materials used and the methodology adopted for the synthesis
of SPIONs using microscale flow. The fabrication and operation of the microfluidic reactors
used in this thesis are described and details of the principal experimental techniques used to
characterise the SPIONs are provided.
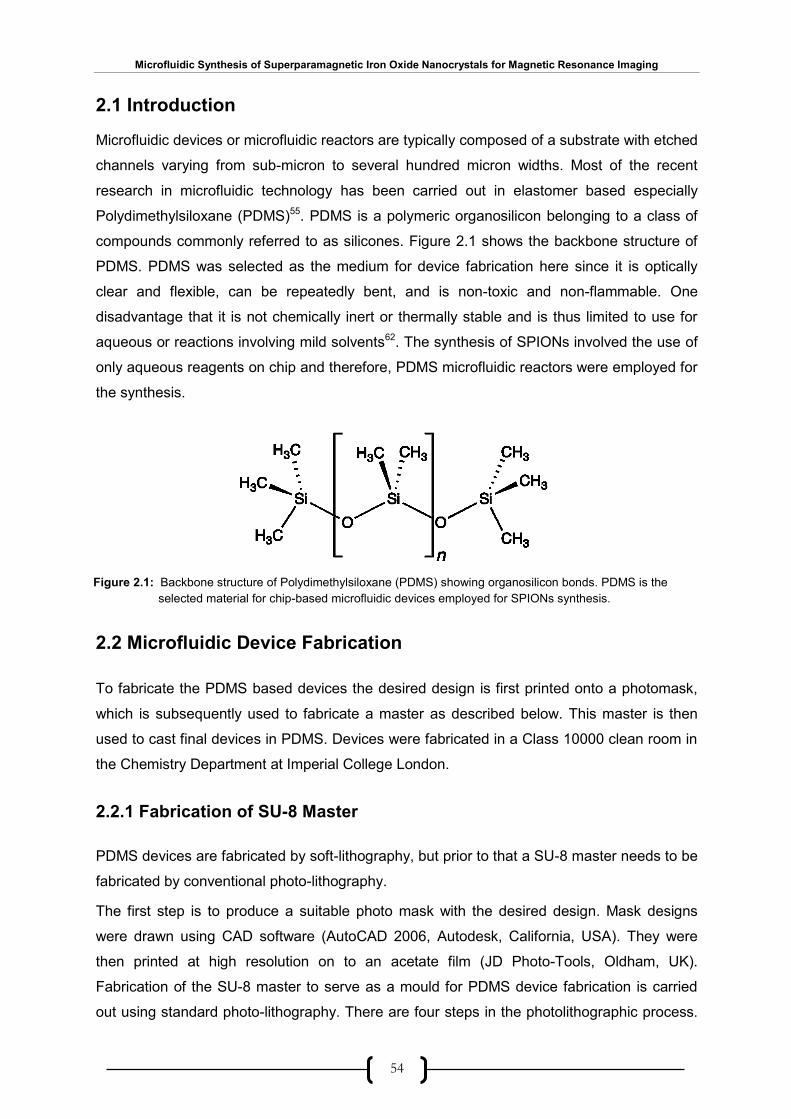
Microfluidic Synthesis of Superparamagnetic Iron Oxide Nanocrystals for Magnetic Resonance Imaging
54
2.1 Introduction
Microfluidic devices or microfluidic reactors are typically composed of a substrate with etched
channels varying from sub-micron to several hundred micron widths. Most of the recent
research in microfluidic technology has been carried out in elastomer based especially
Polydimethylsiloxane (PDMS)55. PDMS is a polymeric organosilicon belonging to a class of
compounds commonly referred to as silicones. Figure 2.1 shows the backbone structure of
PDMS. PDMS was selected as the medium for device fabrication here since it is optically
clear and flexible, can be repeatedly bent, and is non-toxic and non-flammable. One
disadvantage that it is not chemically inert or thermally stable and is thus limited to use for
aqueous or reactions involving mild solvents62. The synthesis of SPIONs involved the use of
only aqueous reagents on chip and therefore, PDMS microfluidic reactors were employed for
the synthesis.
2.2 Microfluidic Device Fabrication
To fabricate the PDMS based devices the desired design is first printed onto a photomask,
which is subsequently used to fabricate a master as described below. This master is then
used to cast final devices in PDMS. Devices were fabricated in a Class 10000 clean room in
the Chemistry Department at Imperial College London.
2.2.1 Fabrication of SU-8 Master
PDMS devices are fabricated by soft-lithography, but prior to that a SU-8 master needs to be
fabricated by conventional photo-lithography.
The first step is to produce a suitable photo mask with the desired design. Mask designs
were drawn using CAD software (AutoCAD 2006, Autodesk, California, USA). They were
then printed at high resolution on to an acetate film (JD Photo-Tools, Oldham, UK).
Fabrication of the SU-8 master to serve as a mould for PDMS device fabrication is carried
out using standard photo-lithography. There are four steps in the photolithographic process.
Figure 2.1: Backbone structure of Polydimethylsiloxane (PDMS) showing organosilicon bonds. PDMS is the
selected material for chip-based microfluidic devices employed for SPIONs synthesis.
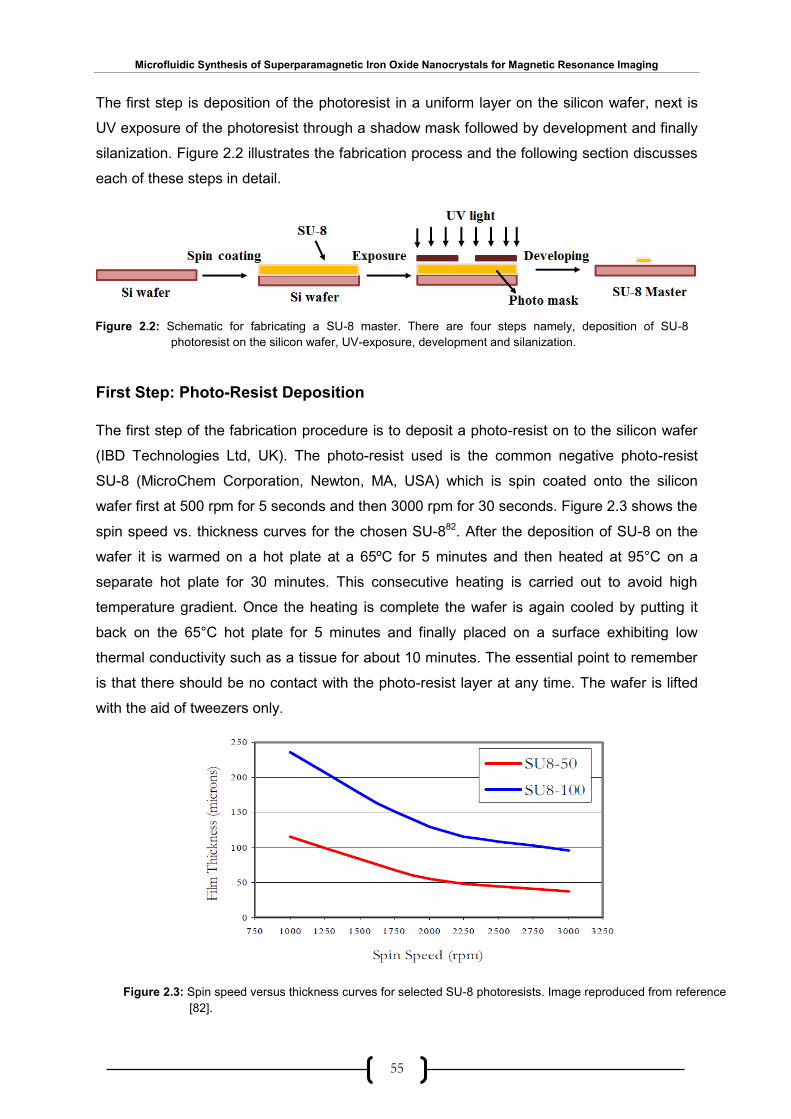
Microfluidic Synthesis of Superparamagnetic Iron Oxide Nanocrystals for Magnetic Resonance Imaging
55
The first step is deposition of the photoresist in a uniform layer on the silicon wafer, next is
UV exposure of the photoresist through a shadow mask followed by development and finally
silanization. Figure 2.2 illustrates the fabrication process and the following section discusses
each of these steps in detail.
First Step: Photo-Resist Deposition
The first step of the fabrication procedure is to deposit a photo-resist on to the silicon wafer
(IBD Technologies Ltd, UK). The photo-resist used is the common negative photo-resist
SU-8 (MicroChem Corporation, Newton, MA, USA) which is spin coated onto the silicon
wafer first at 500 rpm for 5 seconds and then 3000 rpm for 30 seconds. Figure 2.3 shows the
spin speed vs. thickness curves for the chosen SU-882. After the deposition of SU-8 on the
wafer it is warmed on a hot plate at a 65ºC for 5 minutes and then heated at 95°C on a
separate hot plate for 30 minutes. This consecutive heating is carried out to avoid high
temperature gradient. Once the heating is complete the wafer is again cooled by putting it
back on the 65°C hot plate for 5 minutes and finally placed on a surface exhibiting low
thermal conductivity such as a tissue for about 10 minutes. The essential point to remember
is that there should be no contact with the photo-resist layer at any time. The wafer is lifted
with the aid of tweezers only.
Figure 2.3: Spin speed versus thickness curves for selected SU-8 photoresists. Image reproduced from reference
[82].
Figure 2.2: Schematic for fabricating a SU-8 master. There are four steps namely, deposition of SU-8
photoresist on the silicon wafer, UV-exposure, development and silanization.
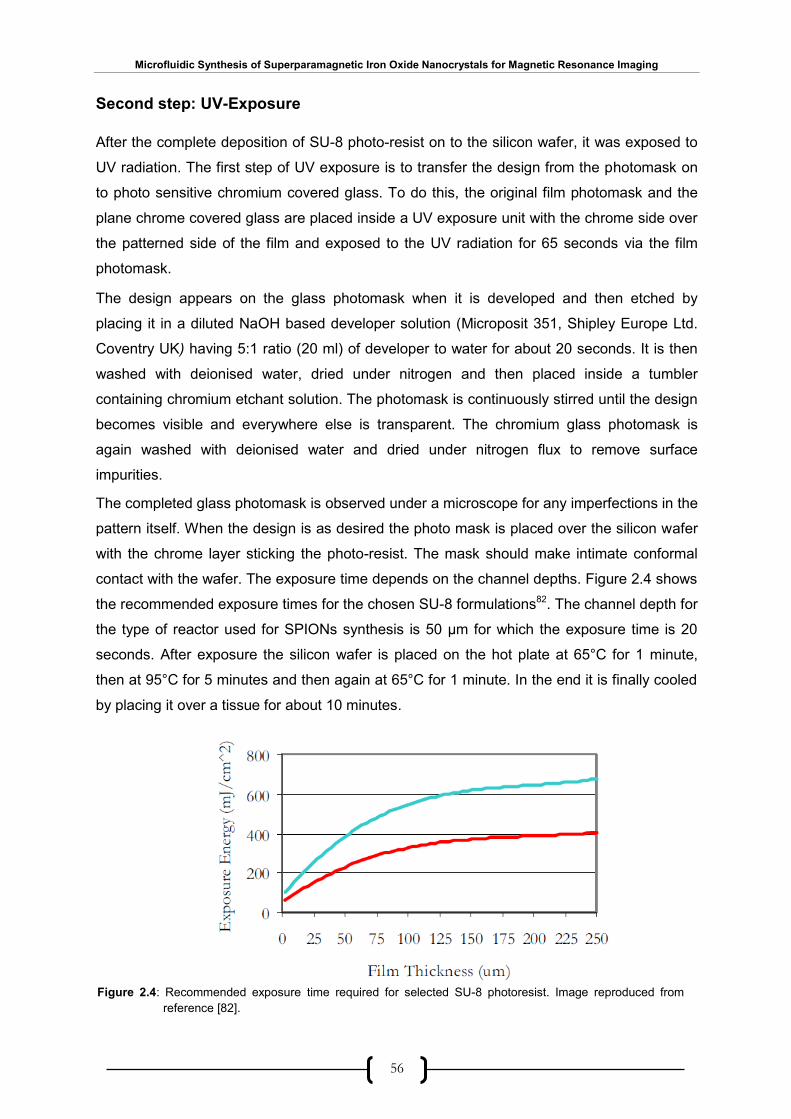
Microfluidic Synthesis of Superparamagnetic Iron Oxide Nanocrystals for Magnetic Resonance Imaging
56
Second step: UV-Exposure
After the complete deposition of SU-8 photo-resist on to the silicon wafer, it was exposed to
UV radiation. The first step of UV exposure is to transfer the design from the photomask on
to photo sensitive chromium covered glass. To do this, the original film photomask and the
plane chrome covered glass are placed inside a UV exposure unit with the chrome side over
the patterned side of the film and exposed to the UV radiation for 65 seconds via the film
photomask.
The design appears on the glass photomask when it is developed and then etched by
placing it in a diluted NaOH based developer solution (Microposit 351, Shipley Europe Ltd.
Coventry UK) having 5:1 ratio (20 ml) of developer to water for about 20 seconds. It is then
washed with deionised water, dried under nitrogen and then placed inside a tumbler
containing chromium etchant solution. The photomask is continuously stirred until the design
becomes visible and everywhere else is transparent. The chromium glass photomask is
again washed with deionised water and dried under nitrogen flux to remove surface
impurities.
The completed glass photomask is observed under a microscope for any imperfections in the
pattern itself. When the design is as desired the photo mask is placed over the silicon wafer
with the chrome layer sticking the photo-resist. The mask should make intimate conformal
contact with the wafer. The exposure time depends on the channel depths. Figure 2.4 shows
the recommended exposure times for the chosen SU-8 formulations82. The channel depth for
the type of reactor used for SPIONs synthesis is 50 μm for which the exposure time is 20
seconds. After exposure the silicon wafer is placed on the hot plate at 65°C for 1 minute,
then at 95°C for 5 minutes and then again at 65°C for 1 minute. In the end it is finally cooled
by placing it over a tissue for about 10 minutes.
Figure 2.4: Recommended exposure time required for selected SU-8 photoresist. Image reproduced from
reference [82].
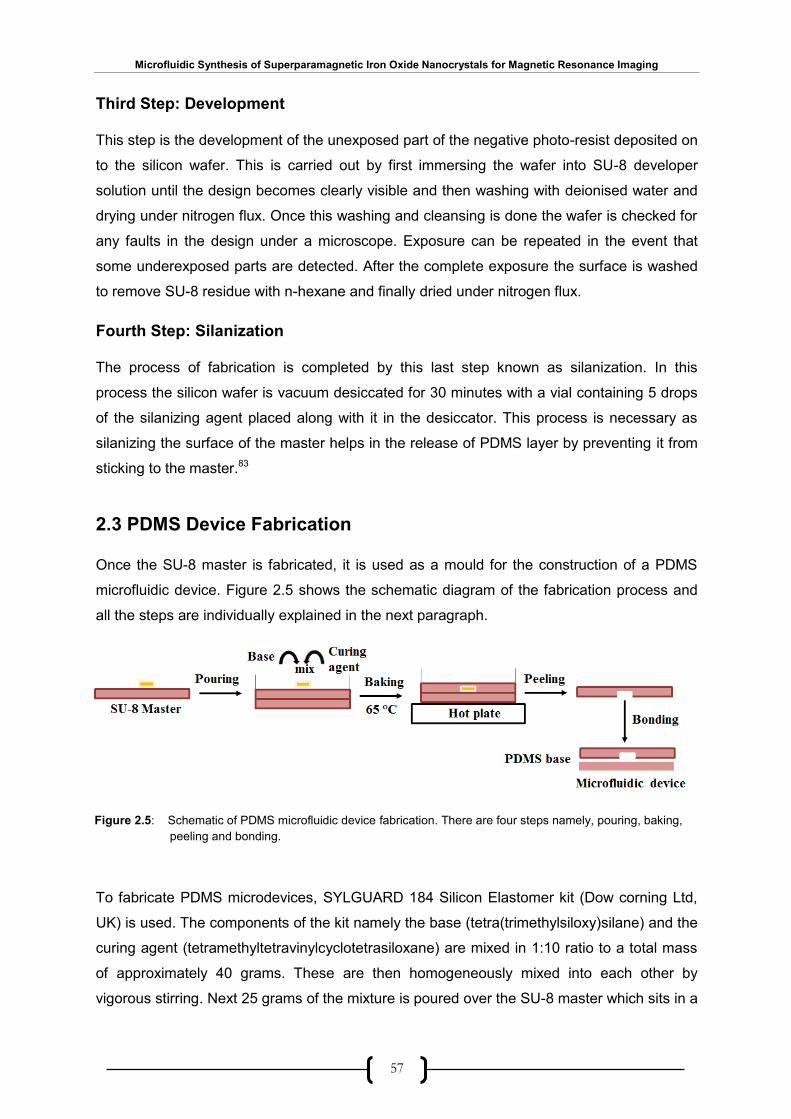
Microfluidic Synthesis of Superparamagnetic Iron Oxide Nanocrystals for Magnetic Resonance Imaging
57
Third Step: Development
This step is the development of the unexposed part of the negative photo-resist deposited on
to the silicon wafer. This is carried out by first immersing the wafer into SU-8 developer
solution until the design becomes clearly visible and then washing with deionised water and
drying under nitrogen flux. Once this washing and cleansing is done the wafer is checked for
any faults in the design under a microscope. Exposure can be repeated in the event that
some underexposed parts are detected. After the complete exposure the surface is washed
to remove SU-8 residue with n-hexane and finally dried under nitrogen flux.
Fourth Step: Silanization
The process of fabrication is completed by this last step known as silanization. In this
process the silicon wafer is vacuum desiccated for 30 minutes with a vial containing 5 drops
of the silanizing agent placed along with it in the desiccator. This process is necessary as
silanizing the surface of the master helps in the release of PDMS layer by preventing it from
sticking to the master.83
2.3 PDMS Device Fabrication
Once the SU-8 master is fabricated, it is used as a mould for the construction of a PDMS
microfluidic device. Figure 2.5 shows the schematic diagram of the fabrication process and
all the steps are individually explained in the next paragraph.
To fabricate PDMS microdevices, SYLGUARD 184 Silicon Elastomer kit (Dow corning Ltd,
UK) is used. The components of the kit namely the base (tetra(trimethylsiloxy)silane) and the
curing agent (tetramethyltetravinylcyclotetrasiloxane) are mixed in 1:10 ratio to a total mass
of approximately 40 grams. These are then homogeneously mixed into each other by
vigorous stirring. Next 25 grams of the mixture is poured over the SU-8 master which sits in a
Figure 2.5: Schematic of PDMS microfluidic device fabrication. There are four steps namely, pouring, baking,
peeling and bonding.
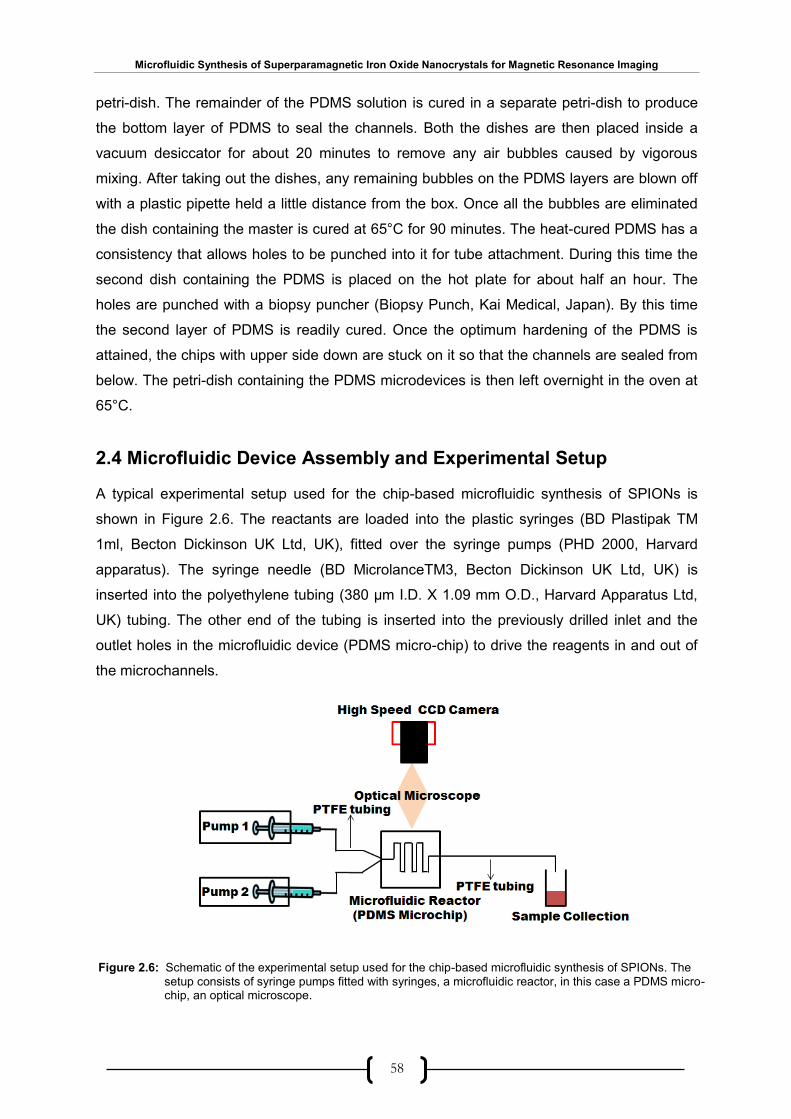
Microfluidic Synthesis of Superparamagnetic Iron Oxide Nanocrystals for Magnetic Resonance Imaging
58
petri-dish. The remainder of the PDMS solution is cured in a separate petri-dish to produce
the bottom layer of PDMS to seal the channels. Both the dishes are then placed inside a
vacuum desiccator for about 20 minutes to remove any air bubbles caused by vigorous
mixing. After taking out the dishes, any remaining bubbles on the PDMS layers are blown off
with a plastic pipette held a little distance from the box. Once all the bubbles are eliminated
the dish containing the master is cured at 65°C for 90 minutes. The heat-cured PDMS has a
consistency that allows holes to be punched into it for tube attachment. During this time the
second dish containing the PDMS is placed on the hot plate for about half an hour. The
holes are punched with a biopsy puncher (Biopsy Punch, Kai Medical, Japan). By this time
the second layer of PDMS is readily cured. Once the optimum hardening of the PDMS is
attained, the chips with upper side down are stuck on it so that the channels are sealed from
below. The petri-dish containing the PDMS microdevices is then left overnight in the oven at
65°C.
2.4 Microfluidic Device Assembly and Experimental Setup
A typical experimental setup used for the chip-based microfluidic synthesis of SPIONs is
shown in Figure 2.6. The reactants are loaded into the plastic syringes (BD Plastipak TM
1ml, Becton Dickinson UK Ltd, UK), fitted over the syringe pumps (PHD 2000, Harvard
apparatus). The syringe needle (BD MicrolanceTM3, Becton Dickinson UK Ltd, UK) is
inserted into the polyethylene tubing (380 μm I.D. X 1.09 mm O.D., Harvard Apparatus Ltd,
UK) tubing. The other end of the tubing is inserted into the previously drilled inlet and the
outlet holes in the microfluidic device (PDMS micro-chip) to drive the reagents in and out of
the microchannels.
Figure 2.6: Schematic of the experimental setup used for the chip-based microfluidic synthesis of SPIONs. The
setup consists of syringe pumps fitted with syringes, a microfluidic reactor, in this case a PDMS micro-chip, an optical microscope.
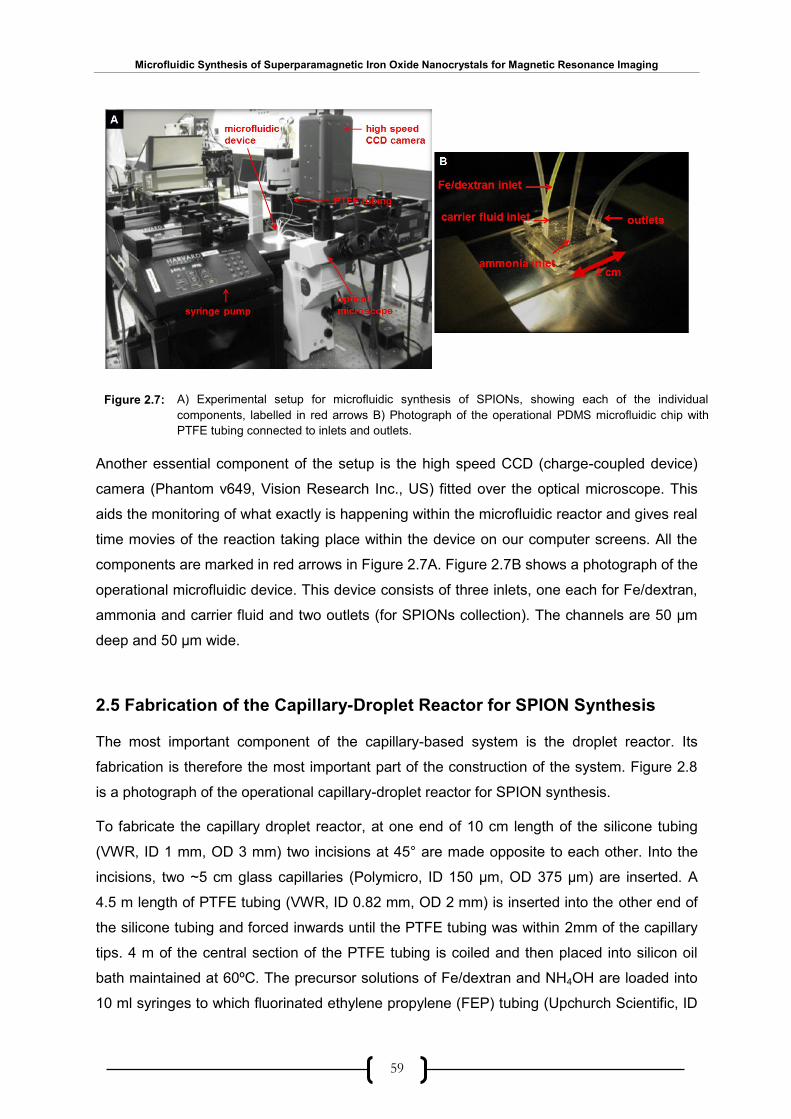
Microfluidic Synthesis of Superparamagnetic Iron Oxide Nanocrystals for Magnetic Resonance Imaging
59
Another essential component of the setup is the high speed CCD (charge-coupled device)
camera (Phantom v649, Vision Research Inc., US) fitted over the optical microscope. This
aids the monitoring of what exactly is happening within the microfluidic reactor and gives real
time movies of the reaction taking place within the device on our computer screens. All the
components are marked in red arrows in Figure 2.7A. Figure 2.7B shows a photograph of the
operational microfluidic device. This device consists of three inlets, one each for Fe/dextran,
ammonia and carrier fluid and two outlets (for SPIONs collection). The channels are 50 µm
deep and 50 µm wide.
2.5 Fabrication of the Capillary-Droplet Reactor for SPION Synthesis
The most important component of the capillary-based system is the droplet reactor. Its
fabrication is therefore the most important part of the construction of the system. Figure 2.8
is a photograph of the operational capillary-droplet reactor for SPION synthesis.
To fabricate the capillary droplet reactor, at one end of 10 cm length of the silicone tubing
(VWR, ID 1 mm, OD 3 mm) two incisions at 45° are made opposite to each other. Into the
incisions, two ~5 cm glass capillaries (Polymicro, ID 150 μm, OD 375 μm) are inserted. A
4.5 m length of PTFE tubing (VWR, ID 0.82 mm, OD 2 mm) is inserted into the other end of
the silicone tubing and forced inwards until the PTFE tubing was within 2mm of the capillary
tips. 4 m of the central section of the PTFE tubing is coiled and then placed into silicon oil
bath maintained at 60ºC. The precursor solutions of Fe/dextran and NH4OH are loaded into
10 ml syringes to which fluorinated ethylene propylene (FEP) tubing (Upchurch Scientific, ID
A) Experimental setup for microfluidic synthesis of SPIONs, showing each of the individual
components, labelled in red arrows B) Photograph of the operational PDMS microfluidic chip with
PTFE tubing connected to inlets and outlets.
Figure 2.7:
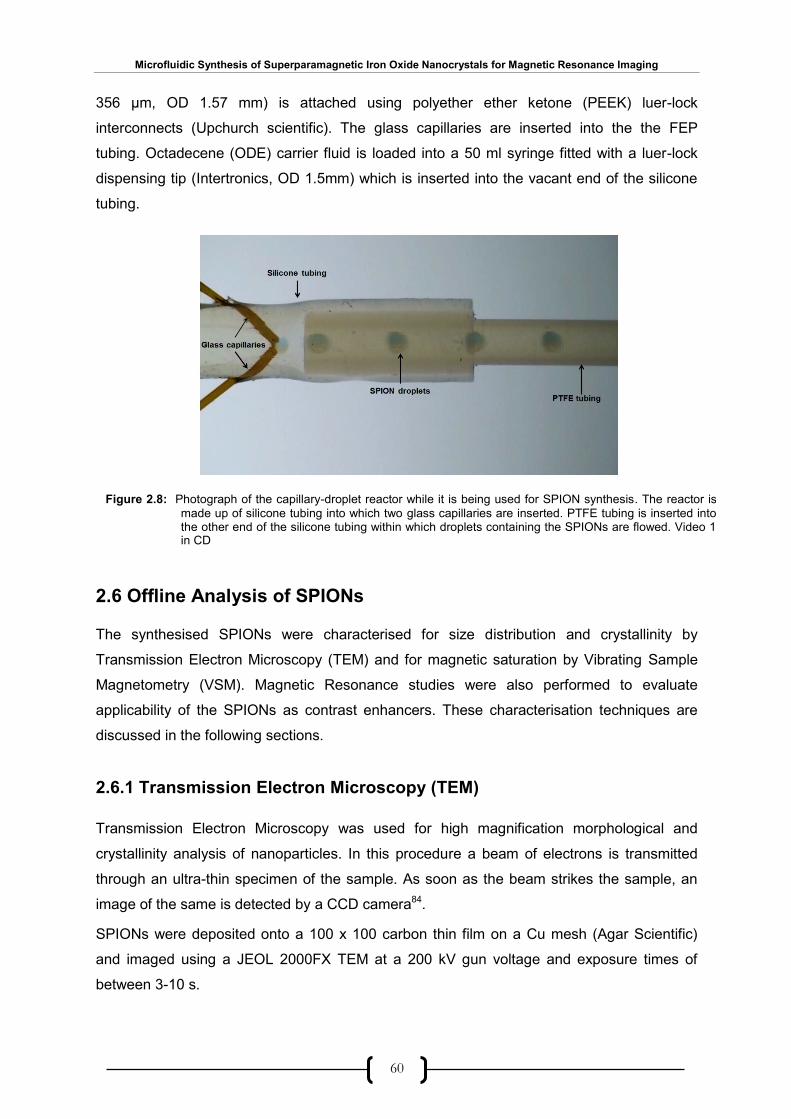
Microfluidic Synthesis of Superparamagnetic Iron Oxide Nanocrystals for Magnetic Resonance Imaging
60
356 μm, OD 1.57 mm) is attached using polyether ether ketone (PEEK) luer-lock
interconnects (Upchurch scientific). The glass capillaries are inserted into the the FEP
tubing. Octadecene (ODE) carrier fluid is loaded into a 50 ml syringe fitted with a luer-lock
dispensing tip (Intertronics, OD 1.5mm) which is inserted into the vacant end of the silicone
tubing.
2.6 Offline Analysis of SPIONs
The synthesised SPIONs were characterised for size distribution and crystallinity by
Transmission Electron Microscopy (TEM) and for magnetic saturation by Vibrating Sample
Magnetometry (VSM). Magnetic Resonance studies were also performed to evaluate
applicability of the SPIONs as contrast enhancers. These characterisation techniques are
discussed in the following sections.
2.6.1 Transmission Electron Microscopy (TEM)
Transmission Electron Microscopy was used for high magnification morphological and
crystallinity analysis of nanoparticles. In this procedure a beam of electrons is transmitted
through an ultra-thin specimen of the sample. As soon as the beam strikes the sample, an
image of the same is detected by a CCD camera84.
SPIONs were deposited onto a 100 x 100 carbon thin film on a Cu mesh (Agar Scientific)
and imaged using a JEOL 2000FX TEM at a 200 kV gun voltage and exposure times of
between 3-10 s.
Figure 2.8: Photograph of the capillary-droplet reactor while it is being used for SPION synthesis. The reactor is
made up of silicone tubing into which two glass capillaries are inserted. PTFE tubing is inserted into the other end of the silicone tubing within which droplets containing the SPIONs are flowed. Video 1 in CD
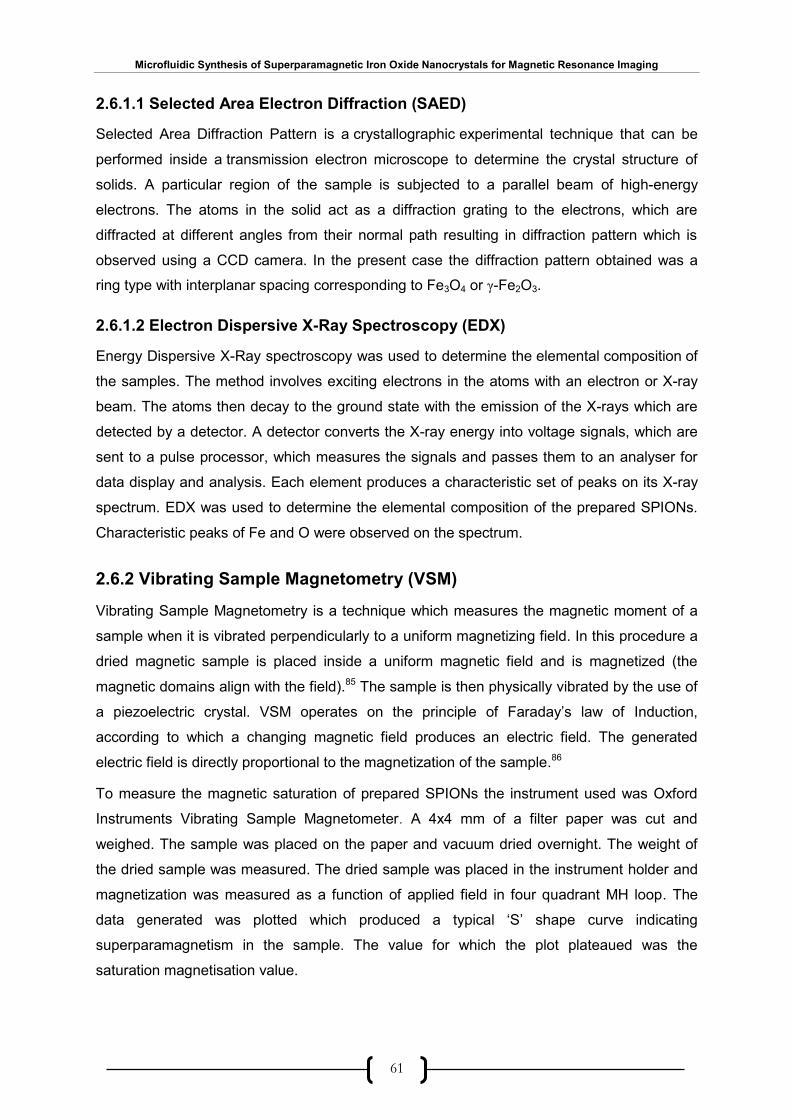
Microfluidic Synthesis of Superparamagnetic Iron Oxide Nanocrystals for Magnetic Resonance Imaging
61
2.6.1.1 Selected Area Electron Diffraction (SAED)
Selected Area Diffraction Pattern is a crystallographic experimental technique that can be
performed inside a transmission electron microscope to determine the crystal structure of
solids. A particular region of the sample is subjected to a parallel beam of high-energy
electrons. The atoms in the solid act as a diffraction grating to the electrons, which are
diffracted at different angles from their normal path resulting in diffraction pattern which is
observed using a CCD camera. In the present case the diffraction pattern obtained was a
ring type with interplanar spacing corresponding to Fe3O4 or γ-Fe2O3.
2.6.1.2 Electron Dispersive X-Ray Spectroscopy (EDX)
Energy Dispersive X-Ray spectroscopy was used to determine the elemental composition of
the samples. The method involves exciting electrons in the atoms with an electron or X-ray
beam. The atoms then decay to the ground state with the emission of the X-rays which are
detected by a detector. A detector converts the X-ray energy into voltage signals, which are
sent to a pulse processor, which measures the signals and passes them to an analyser for
data display and analysis. Each element produces a characteristic set of peaks on its X-ray
spectrum. EDX was used to determine the elemental composition of the prepared SPIONs.
Characteristic peaks of Fe and O were observed on the spectrum.
2.6.2 Vibrating Sample Magnetometry (VSM)
Vibrating Sample Magnetometry is a technique which measures the magnetic moment of a
sample when it is vibrated perpendicularly to a uniform magnetizing field. In this procedure a
dried magnetic sample is placed inside a uniform magnetic field and is magnetized (the
magnetic domains align with the field).85 The sample is then physically vibrated by the use of
a piezoelectric crystal. VSM operates on the principle of Faraday’s law of Induction,
according to which a changing magnetic field produces an electric field. The generated
electric field is directly proportional to the magnetization of the sample.86
To measure the magnetic saturation of prepared SPIONs the instrument used was Oxford
Instruments Vibrating Sample Magnetometer. A 4x4 mm of a filter paper was cut and
weighed. The sample was placed on the paper and vacuum dried overnight. The weight of
the dried sample was measured. The dried sample was placed in the instrument holder and
magnetization was measured as a function of applied field in four quadrant MH loop. The
data generated was plotted which produced a typical ‘S’ shape curve indicating
superparamagnetism in the sample. The value for which the plot plateaued was the
saturation magnetisation value.
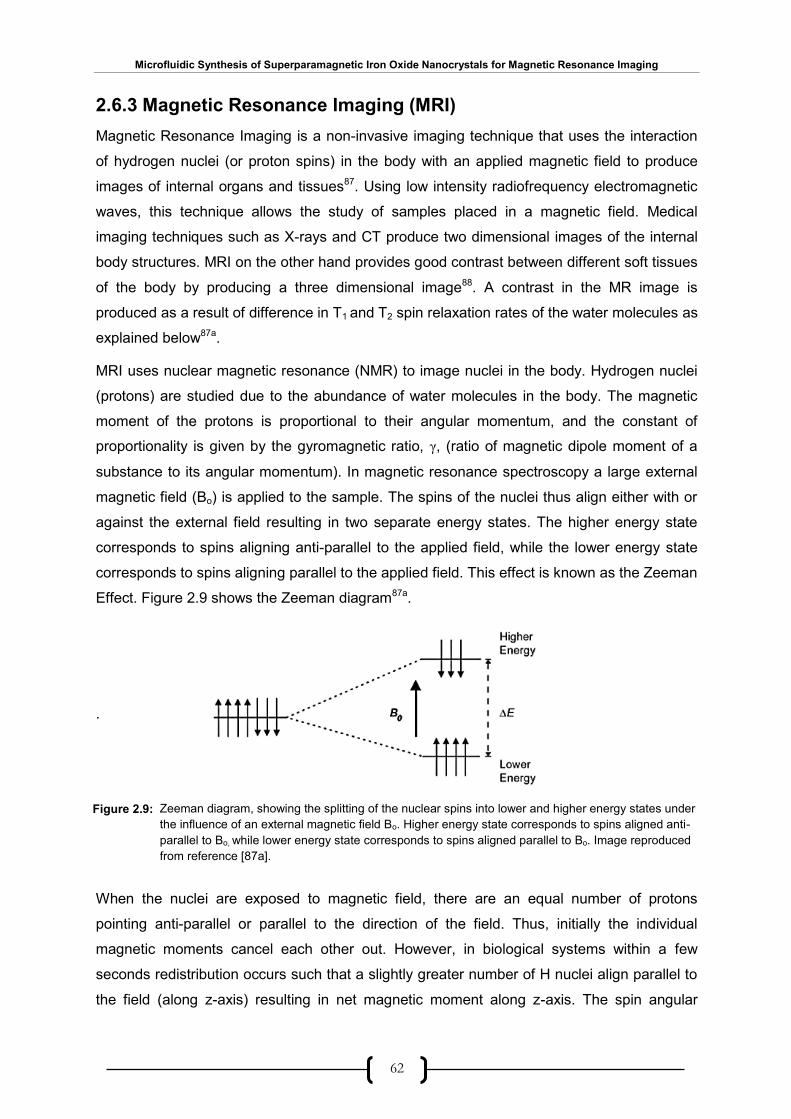
Microfluidic Synthesis of Superparamagnetic Iron Oxide Nanocrystals for Magnetic Resonance Imaging
62
2.6.3 Magnetic Resonance Imaging (MRI)
Magnetic Resonance Imaging is a non-invasive imaging technique that uses the interaction
of hydrogen nuclei (or proton spins) in the body with an applied magnetic field to produce
images of internal organs and tissues87. Using low intensity radiofrequency electromagnetic
waves, this technique allows the study of samples placed in a magnetic field. Medical
imaging techniques such as X-rays and CT produce two dimensional images of the internal
body structures. MRI on the other hand provides good contrast between different soft tissues
of the body by producing a three dimensional image88. A contrast in the MR image is
produced as a result of difference in T1 and T2 spin relaxation rates of the water molecules as
explained below87a.
MRI uses nuclear magnetic resonance (NMR) to image nuclei in the body. Hydrogen nuclei
(protons) are studied due to the abundance of water molecules in the body. The magnetic
moment of the protons is proportional to their angular momentum, and the constant of
proportionality is given by the gyromagnetic ratio, γ, (ratio of magnetic dipole moment of a
substance to its angular momentum). In magnetic resonance spectroscopy a large external
magnetic field (Bo) is applied to the sample. The spins of the nuclei thus align either with or
against the external field resulting in two separate energy states. The higher energy state
corresponds to spins aligning anti-parallel to the applied field, while the lower energy state
corresponds to spins aligning parallel to the applied field. This effect is known as the Zeeman
Effect. Figure 2.9 shows the Zeeman diagram87a.
.
When the nuclei are exposed to magnetic field, there are an equal number of protons
pointing anti-parallel or parallel to the direction of the field. Thus, initially the individual
magnetic moments cancel each other out. However, in biological systems within a few
seconds redistribution occurs such that a slightly greater number of H nuclei align parallel to
the field (along z-axis) resulting in net magnetic moment along z-axis. The spin angular
Zeeman diagram, showing the splitting of the nuclear spins into lower and higher energy states under
the influence of an external magnetic field Bo. Higher energy state corresponds to spins aligned anti-
parallel to Bo, while lower energy state corresponds to spins aligned parallel to Bo. Image reproduced
from reference [87a].
Figure 2.9:
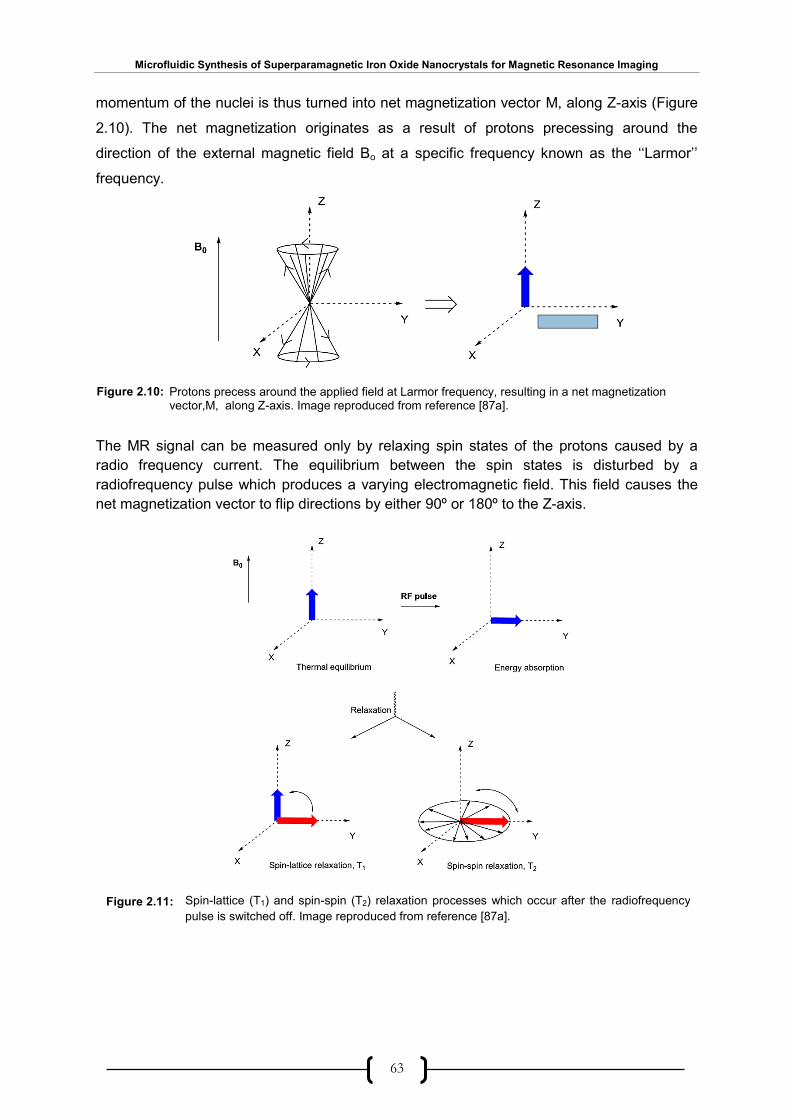
Microfluidic Synthesis of Superparamagnetic Iron Oxide Nanocrystals for Magnetic Resonance Imaging
63
momentum of the nuclei is thus turned into net magnetization vector M, along Z-axis (Figure
2.10). The net magnetization originates as a result of protons precessing around the
direction of the external magnetic field Bo at a specific frequency known as the ‘‘Larmor’’
frequency.
The MR signal can be measured only by relaxing spin states of the protons caused by a
radio frequency current. The equilibrium between the spin states is disturbed by a
radiofrequency pulse which produces a varying electromagnetic field. This field causes the
net magnetization vector to flip directions by either 90º or 180º to the Z-axis.
Figure 2.10: Protons precess around the applied field at Larmor frequency, resulting in a net magnetization vector,M, along Z-axis. Image reproduced from reference [87a].
Spin-lattice (T1) and spin-spin (T2) relaxation processes which occur after the radiofrequency
pulse is switched off. Image reproduced from reference [87a].
Figure 2.11:
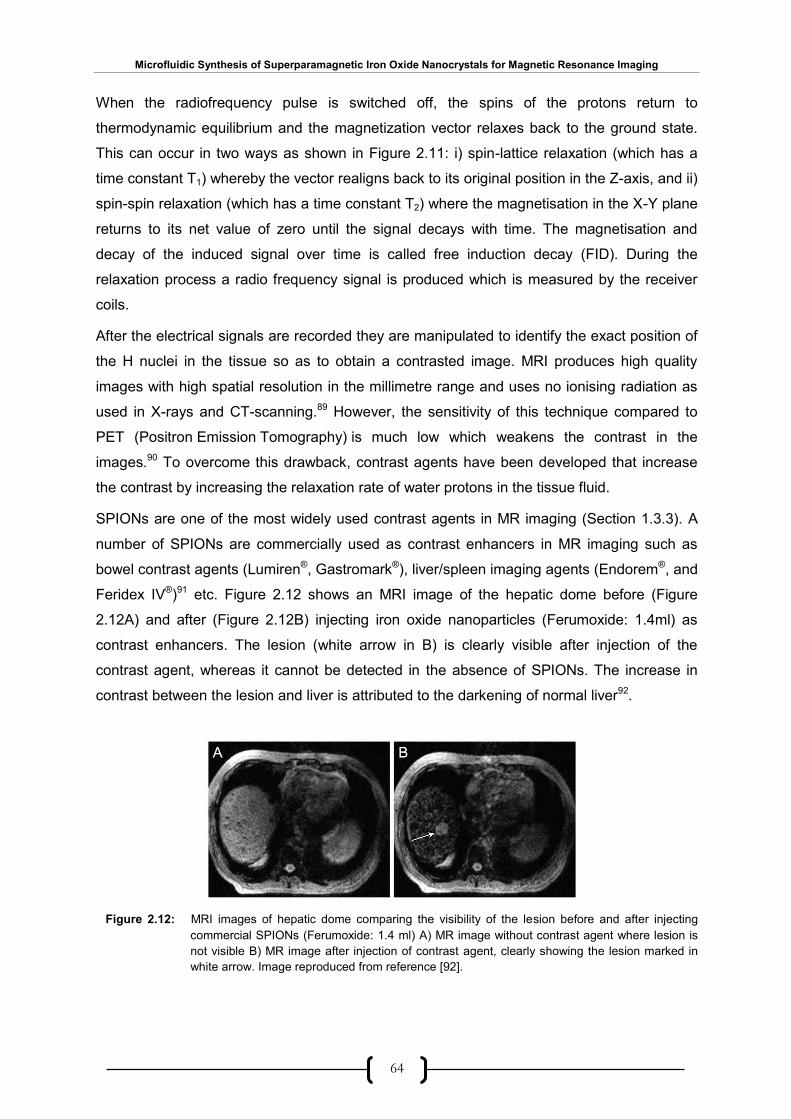
Microfluidic Synthesis of Superparamagnetic Iron Oxide Nanocrystals for Magnetic Resonance Imaging
64
When the radiofrequency pulse is switched off, the spins of the protons return to
thermodynamic equilibrium and the magnetization vector relaxes back to the ground state.
This can occur in two ways as shown in Figure 2.11: i) spin-lattice relaxation (which has a
time constant T1) whereby the vector realigns back to its original position in the Z-axis, and ii)
spin-spin relaxation (which has a time constant T2) where the magnetisation in the X-Y plane
returns to its net value of zero until the signal decays with time. The magnetisation and
decay of the induced signal over time is called free induction decay (FID). During the
relaxation process a radio frequency signal is produced which is measured by the receiver
coils.
After the electrical signals are recorded they are manipulated to identify the exact position of
the H nuclei in the tissue so as to obtain a contrasted image. MRI produces high quality
images with high spatial resolution in the millimetre range and uses no ionising radiation as
used in X-rays and CT-scanning.89 However, the sensitivity of this technique compared to
PET (Positron Emission Tomography) is much low which weakens the contrast in the
images.90 To overcome this drawback, contrast agents have been developed that increase
the contrast by increasing the relaxation rate of water protons in the tissue fluid.
SPIONs are one of the most widely used contrast agents in MR imaging (Section 1.3.3). A
number of SPIONs are commercially used as contrast enhancers in MR imaging such as
bowel contrast agents (Lumiren®, Gastromark®), liver/spleen imaging agents (Endorem®, and
Feridex IV®)91 etc. Figure 2.12 shows an MRI image of the hepatic dome before (Figure
2.12A) and after (Figure 2.12B) injecting iron oxide nanoparticles (Ferumoxide: 1.4ml) as
contrast enhancers. The lesion (white arrow in B) is clearly visible after injection of the
contrast agent, whereas it cannot be detected in the absence of SPIONs. The increase in
contrast between the lesion and liver is attributed to the darkening of normal liver92.
Figure 2.12: MRI images of hepatic dome comparing the visibility of the lesion before and after injecting
commercial SPIONs (Ferumoxide: 1.4 ml) A) MR image without contrast agent where lesion is
not visible B) MR image after injection of contrast agent, clearly showing the lesion marked in
white arrow. Image reproduced from reference [92].

Microfluidic Synthesis of Superparamagnetic Iron Oxide Nanocrystals for Magnetic Resonance Imaging
65
2.6.4 Analytical Software
SPION size distributions were ascertained using ImageJ software (version 1.42, National
Institute of Health) on the TEM micrograph. For each micrograph, scale was set before
measuring the size of each individual particle. At least 100 particles were analysed in each
experiment.

Microfluidic Synthesis of Superparamagnetic Iron Oxide Nanocrystals for Magnetic Resonance Imaging
66
III
Chapter 3
Bulk Synthesis of SPIONs
This chapter evaluates various bulk methods for the synthesis of bare and dextran coated
SPIONs. Both aqueous and organic-phase synthesis routes were investigated using
traditional bench-top chemistry. The influence of reaction parameters such as temperature
and concentration on nanoparticle size and crystallinity were studied.
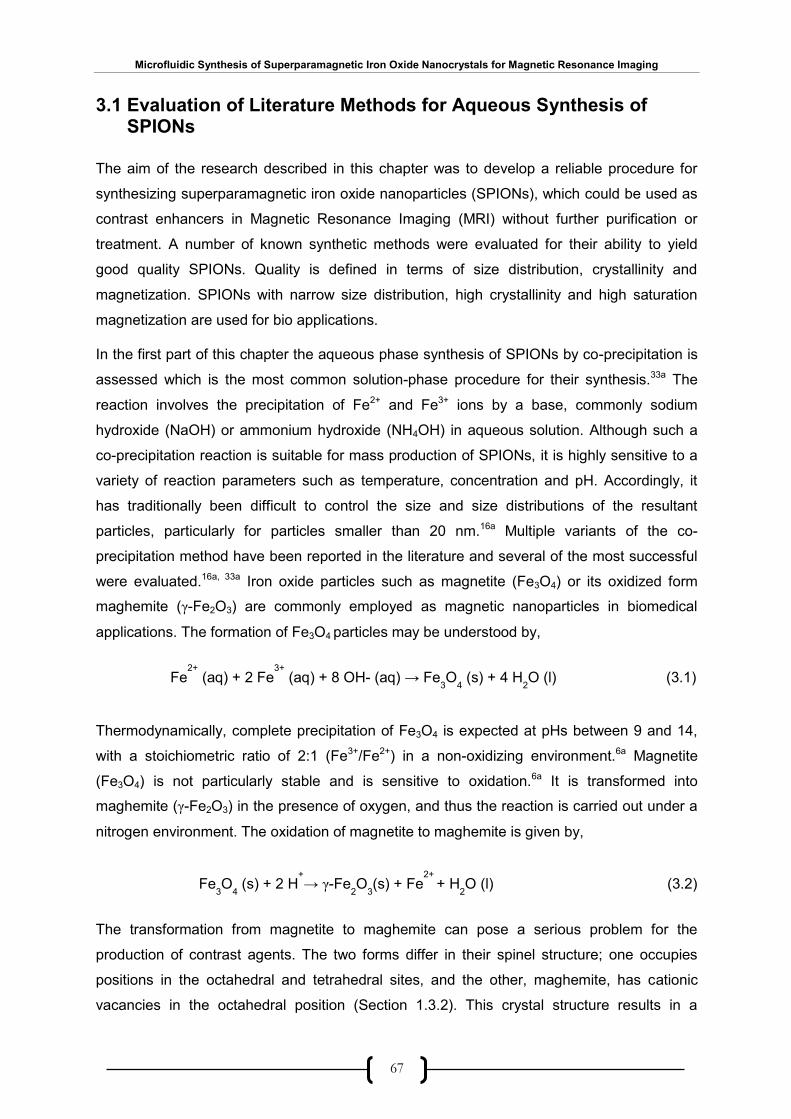
Microfluidic Synthesis of Superparamagnetic Iron Oxide Nanocrystals for Magnetic Resonance Imaging
67
3.1 Evaluation of Literature Methods for Aqueous Synthesis of SPIONs
The aim of the research described in this chapter was to develop a reliable procedure for
synthesizing superparamagnetic iron oxide nanoparticles (SPIONs), which could be used as
contrast enhancers in Magnetic Resonance Imaging (MRI) without further purification or
treatment. A number of known synthetic methods were evaluated for their ability to yield
good quality SPIONs. Quality is defined in terms of size distribution, crystallinity and
magnetization. SPIONs with narrow size distribution, high crystallinity and high saturation
magnetization are used for bio applications.
In the first part of this chapter the aqueous phase synthesis of SPIONs by co-precipitation is
assessed which is the most common solution-phase procedure for their synthesis.33a The
reaction involves the precipitation of Fe2+ and Fe3+ ions by a base, commonly sodium
hydroxide (NaOH) or ammonium hydroxide (NH4OH) in aqueous solution. Although such a
co-precipitation reaction is suitable for mass production of SPIONs, it is highly sensitive to a
variety of reaction parameters such as temperature, concentration and pH. Accordingly, it
has traditionally been difficult to control the size and size distributions of the resultant
particles, particularly for particles smaller than 20 nm.16a Multiple variants of the co-
precipitation method have been reported in the literature and several of the most successful
were evaluated.16a, 33a Iron oxide particles such as magnetite (Fe3O4) or its oxidized form
maghemite (γ-Fe2O3) are commonly employed as magnetic nanoparticles in biomedical
applications. The formation of Fe3O4 particles may be understood by,
Thermodynamically, complete precipitation of Fe3O4 is expected at pHs between 9 and 14,
with a stoichiometric ratio of 2:1 (Fe3+/Fe2+) in a non-oxidizing environment.6a Magnetite
(Fe3O4) is not particularly stable and is sensitive to oxidation.6a It is transformed into
maghemite (γ-Fe2O3) in the presence of oxygen, and thus the reaction is carried out under a
nitrogen environment. The oxidation of magnetite to maghemite is given by,
The transformation from magnetite to maghemite can pose a serious problem for the
production of contrast agents. The two forms differ in their spinel structure; one occupies
positions in the octahedral and tetrahedral sites, and the other, maghemite, has cationic
vacancies in the octahedral position (Section 1.3.2). This crystal structure results in a
Fe2+
(aq) + 2 Fe3+
(aq) + 8 OH- (aq) → Fe3O
4 (s) + 4 H
2O (l) (3.1)
Fe3O
4 (s) + 2 H
+
→ γ-Fe2O
3(s) + Fe
2+
+ H2O (l) (3.2)

Microfluidic Synthesis of Superparamagnetic Iron Oxide Nanocrystals for Magnetic Resonance Imaging
68
different net spontaneous magnetisation. In order to prevent oxidation as well as
agglomeration of Fe3O4 nanoparticles, SPIONs can be coated with a biocompatible polymer
such as dextran, polyethylene imide, poly(l-lysine), chitosan and folic acid etc. (Section
1.3.2.1).The following sections describe various procedures for the synthesis of both bare
and coated SPIONs using co-precipitation method.
3.1.1 Experimental
Unless stated otherwise, all chemicals were reagent grade purity and obtained from
Sigma‐Aldrich, UK. All chemicals were used as received. Deionized water was obtained
using a reverse osmosis system, the purity of which was monitored using a
conductivity/resistivity meter (Thornton 200CR, Mettler Toledo) and was typically ~15 MΩ.
3.1.1.1 Synthesis of SPIONs by Co-precipitation using Ammonium Hydroxide
The first method evaluated for the synthesis of SPIONs was based on precipitation using
ammonium hydroxide (NH4OH) as the base. This method was originally described by
Massart et al.33a The iron oxide nanoparticles were synthesized in solution without the use of
surfactant. The iron oxide nanoparticles synthesized by Massart were gelatinous and
aggregated.
In a three neck round bottom flask, a precursor solution comprising 0.02 M Ferrous chloride
tetrahydrate (FeCl2.4H2O) and 0.04 M Ferric chloride hexahydrate (FeCl3.6H2O) dissolved in
0.4 M Hydrochloric acid (HCl) was poured, under a constant nitrogen (N2) flux (to prevent
oxidation of Fe2+ to Fe3+). The solution was stirred for 20 minutes after which an aqueous
solution of NH4OH (28% NH3 in H2O) was added dropwise to the mixture, with vigorous
stirring under N2. Upon addition, the colour of the solution gradually changed from yellow to
brown. The pH of the solution was monitored, and NH4OH addition continued until the pH
reached 10. At this point the mixture was stirred for 1 hour at 60°C, ultimately forming a
black precipitate of SPIONs. The suspension was then cooled and centrifuged at 4000 rpm
for 15 minutes. The effluent was discarded and the precipitate washed with deionized water.
The precipitate was dried overnight in a vacuum oven. One half of the sample was removed
for magnetic characterization by Vibrating Sample Magnetometry (VSM) while the second
half was redispersed in deionized water for characterization by Transmission Electron
Microscopy (TEM).
A typical TEM micrograph of the SPIONs synthesized according to Massart’s method is
shown in Figure 3.1A. Significant aggregation of the formed particles was evident.
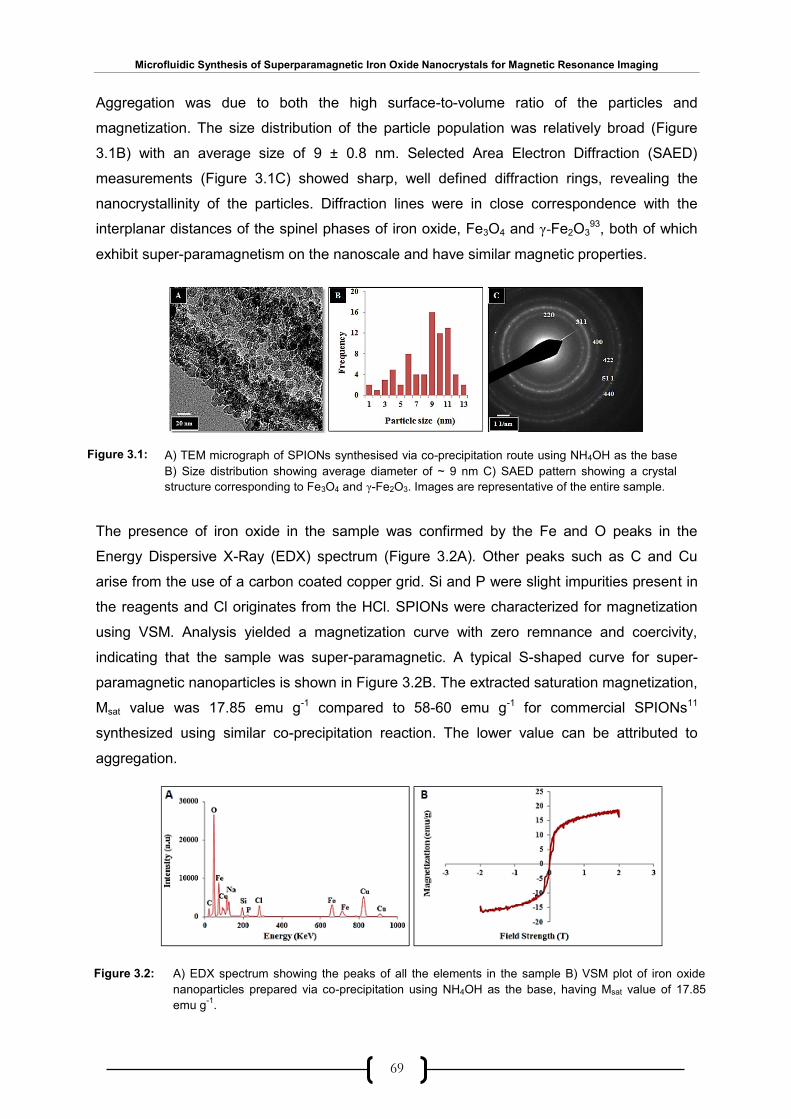
Microfluidic Synthesis of Superparamagnetic Iron Oxide Nanocrystals for Magnetic Resonance Imaging
69
Aggregation was due to both the high surface-to-volume ratio of the particles and
magnetization. The size distribution of the particle population was relatively broad (Figure
3.1B) with an average size of 9 ± 0.8 nm. Selected Area Electron Diffraction (SAED)
measurements (Figure 3.1C) showed sharp, well defined diffraction rings, revealing the
nanocrystallinity of the particles. Diffraction lines were in close correspondence with the
interplanar distances of the spinel phases of iron oxide, Fe3O4 and γ-Fe2O393, both of which
exhibit super-paramagnetism on the nanoscale and have similar magnetic properties.
The presence of iron oxide in the sample was confirmed by the Fe and O peaks in the
Energy Dispersive X-Ray (EDX) spectrum (Figure 3.2A). Other peaks such as C and Cu
arise from the use of a carbon coated copper grid. Si and P were slight impurities present in
the reagents and Cl originates from the HCl. SPIONs were characterized for magnetization
using VSM. Analysis yielded a magnetization curve with zero remnance and coercivity,
indicating that the sample was super-paramagnetic. A typical S-shaped curve for super-
paramagnetic nanoparticles is shown in Figure 3.2B. The extracted saturation magnetization,
Msat value was 17.85 emu g-1 compared to 58-60 emu g-1 for commercial SPIONs11
synthesized using similar co-precipitation reaction. The lower value can be attributed to
aggregation.
A) A) TEM micrograph of SPIONs synthesised via co-precipitation route using NH4OH as the base
B) Size distribution showing average diameter of ~ 9 nm C) SAED pattern showing a crystal
structure corresponding to Fe3O4 and γ-Fe2O3. Images are representative of the entire sample.
A) EDX spectrum showing the peaks of all the elements in the sample B) VSM plot of iron oxide
nanoparticles prepared via co-precipitation using NH4OH as the base, having Msat value of 17.85
emu g-1
.
Figure 3.1:
Figure 3.2:
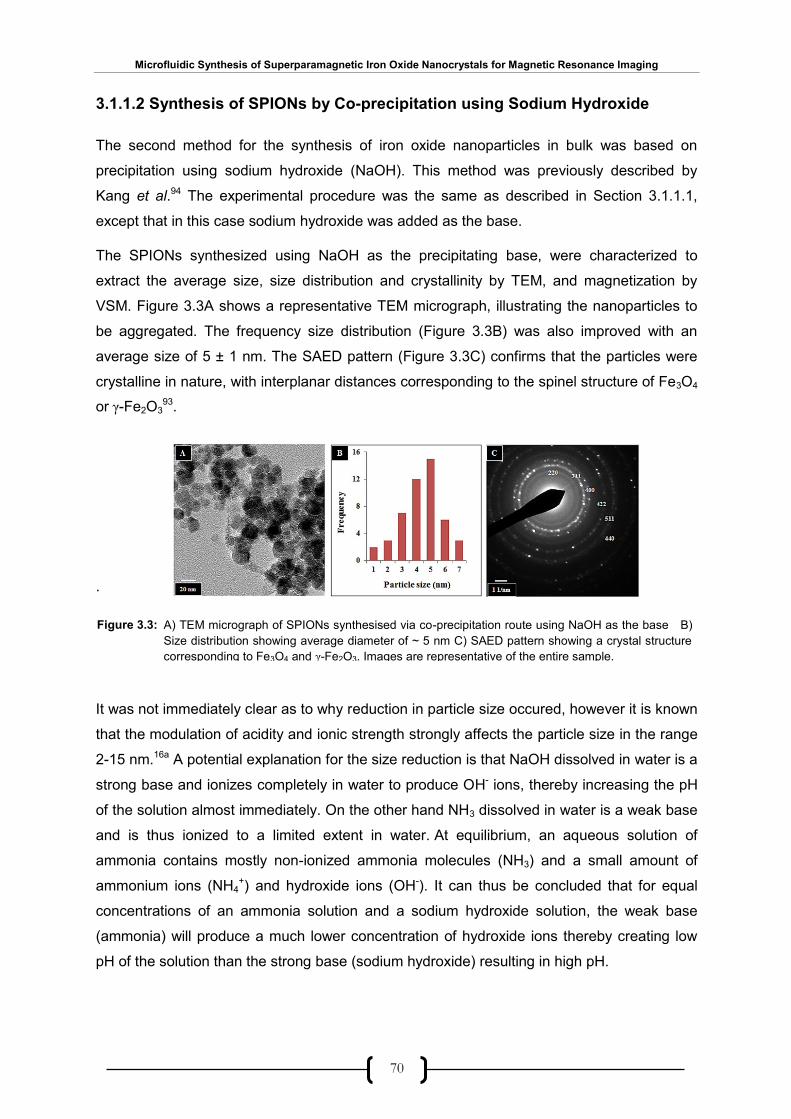
Microfluidic Synthesis of Superparamagnetic Iron Oxide Nanocrystals for Magnetic Resonance Imaging
70
3.1.1.2 Synthesis of SPIONs by Co-precipitation using Sodium Hydroxide
The second method for the synthesis of iron oxide nanoparticles in bulk was based on
precipitation using sodium hydroxide (NaOH). This method was previously described by
Kang et al.94 The experimental procedure was the same as described in Section 3.1.1.1,
except that in this case sodium hydroxide was added as the base.
The SPIONs synthesized using NaOH as the precipitating base, were characterized to
extract the average size, size distribution and crystallinity by TEM, and magnetization by
VSM. Figure 3.3A shows a representative TEM micrograph, illustrating the nanoparticles to
be aggregated. The frequency size distribution (Figure 3.3B) was also improved with an
average size of 5 ± 1 nm. The SAED pattern (Figure 3.3C) confirms that the particles were
crystalline in nature, with interplanar distances corresponding to the spinel structure of Fe3O4
or γ-Fe2O393.
.
It was not immediately clear as to why reduction in particle size occured, however it is known
that the modulation of acidity and ionic strength strongly affects the particle size in the range
2-15 nm.16a A potential explanation for the size reduction is that NaOH dissolved in water is a
strong base and ionizes completely in water to produce OH- ions, thereby increasing the pH
of the solution almost immediately. On the other hand NH3 dissolved in water is a weak base
and is thus ionized to a limited extent in water. At equilibrium, an aqueous solution of
ammonia contains mostly non-ionized ammonia molecules (NH3) and a small amount of
ammonium ions (NH4+) and hydroxide ions (OH-). It can thus be concluded that for equal
concentrations of an ammonia solution and a sodium hydroxide solution, the weak base
(ammonia) will produce a much lower concentration of hydroxide ions thereby creating low
pH of the solution than the strong base (sodium hydroxide) resulting in high pH.
B) A) TEM micrograph of SPIONs synthesised via co-precipitation route using NaOH as the base B)
Size distribution showing average diameter of ~ 5 nm C) SAED pattern showing a crystal structure
corresponding to Fe3O4 and γ-Fe2O3. Images are representative of the entire sample.
Figure 3.3:

Microfluidic Synthesis of Superparamagnetic Iron Oxide Nanocrystals for Magnetic Resonance Imaging
71
The presence of iron oxide in the sample was indicated from Fe and O peaks in the EDX
spectrum (Figure 3.4A). The Na peak in the spectrum originates from NaOH. The
nanoparticles were characterised for super-paramagnetism using VSM. The expected
magnetization curve was again obtained (Figure 3.4B), although the extracted saturation
magnetization, Msat is only 7.9 emu g-1. This reduction is attributed to randomly aligned
magnetic dipoles at the surface reducing the net magnetization per atom95. In the present
case a noisy spectrum was obtained perhaps as a consequence of higher impurity content or
a mechanical/electrical disturbance during measurement.
It was observed that the SPIONs synthesized using both co-precipitation methods were
heavily aggregated. To overcome the problem of agglomeration and to ensure dispersibility
of the SPIONs in water or tissue fluid there was a need to coat the bare nanoparticles with a
suitable biopolymer. The following sections discuss the synthetic procedures for coating iron
oxide nanoparticles with dextran.
3.2 Synthesis of SPIONs by Co-Precipitation in the Presence of Dextran
The SPIONs synthesised in Section 3.1.1 were bare and surfactant free. Consequently the
nanoparticles were polydisperse and tended to aggregate. In addition these nanoparticles
were not usable as contrast enhancers (or indeed for other kind of biomedical applications)
since they were insoluble in aqueous media. To overcome the problem of aggregation and
insolubility, the nanoparticle surface should be coated with a suitable biopolymer6a, 16a.
Moreover, the SPIONs should be smaller than 20 nm for biomedical applicability so that
these are not trapped by the Reticulo Endothelial System (RES) in the liver or spleen and
can easily be transported in the blood or tissue fluid. Accordingly, there was a need for a
A) EDX spectrum showing the peaks of all the elements in the sample B) VSM plot of iron
oxide nanoparticles prepared via co-precipitation using NaOH as the base, having Msat value of
7.9 emu g-1
.
Figure 3.4:
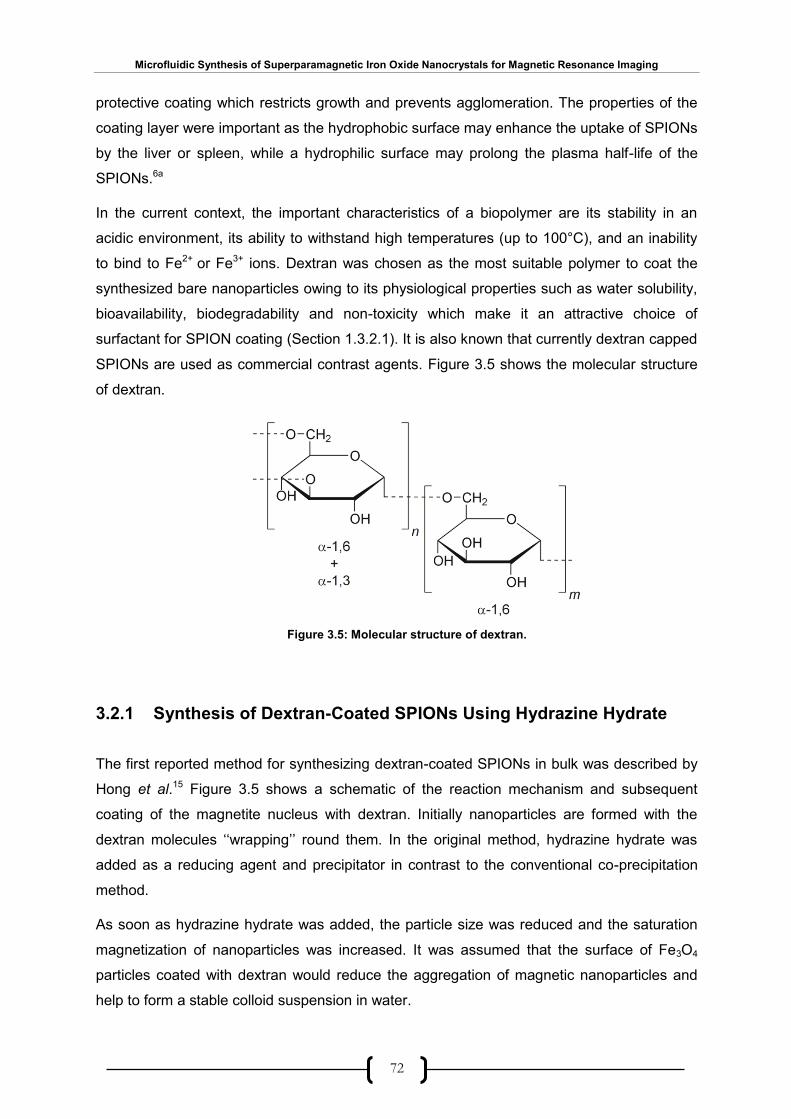
Microfluidic Synthesis of Superparamagnetic Iron Oxide Nanocrystals for Magnetic Resonance Imaging
72
protective coating which restricts growth and prevents agglomeration. The properties of the
coating layer were important as the hydrophobic surface may enhance the uptake of SPIONs
by the liver or spleen, while a hydrophilic surface may prolong the plasma half-life of the
SPIONs.6a
In the current context, the important characteristics of a biopolymer are its stability in an
acidic environment, its ability to withstand high temperatures (up to 100°C), and an inability
to bind to Fe2+ or Fe3+ ions. Dextran was chosen as the most suitable polymer to coat the
synthesized bare nanoparticles owing to its physiological properties such as water solubility,
bioavailability, biodegradability and non-toxicity which make it an attractive choice of
surfactant for SPION coating (Section 1.3.2.1). It is also known that currently dextran capped
SPIONs are used as commercial contrast agents. Figure 3.5 shows the molecular structure
of dextran.
3.2.1 Synthesis of Dextran-Coated SPIONs Using Hydrazine Hydrate
The first reported method for synthesizing dextran-coated SPIONs in bulk was described by
Hong et al.15 Figure 3.5 shows a schematic of the reaction mechanism and subsequent
coating of the magnetite nucleus with dextran. Initially nanoparticles are formed with the
dextran molecules ‘‘wrapping’’ round them. In the original method, hydrazine hydrate was
added as a reducing agent and precipitator in contrast to the conventional co-precipitation
method.
As soon as hydrazine hydrate was added, the particle size was reduced and the saturation
magnetization of nanoparticles was increased. It was assumed that the surface of Fe3O4
particles coated with dextran would reduce the aggregation of magnetic nanoparticles and
help to form a stable colloid suspension in water.
Figure 3.5: Molecular structure of dextran.
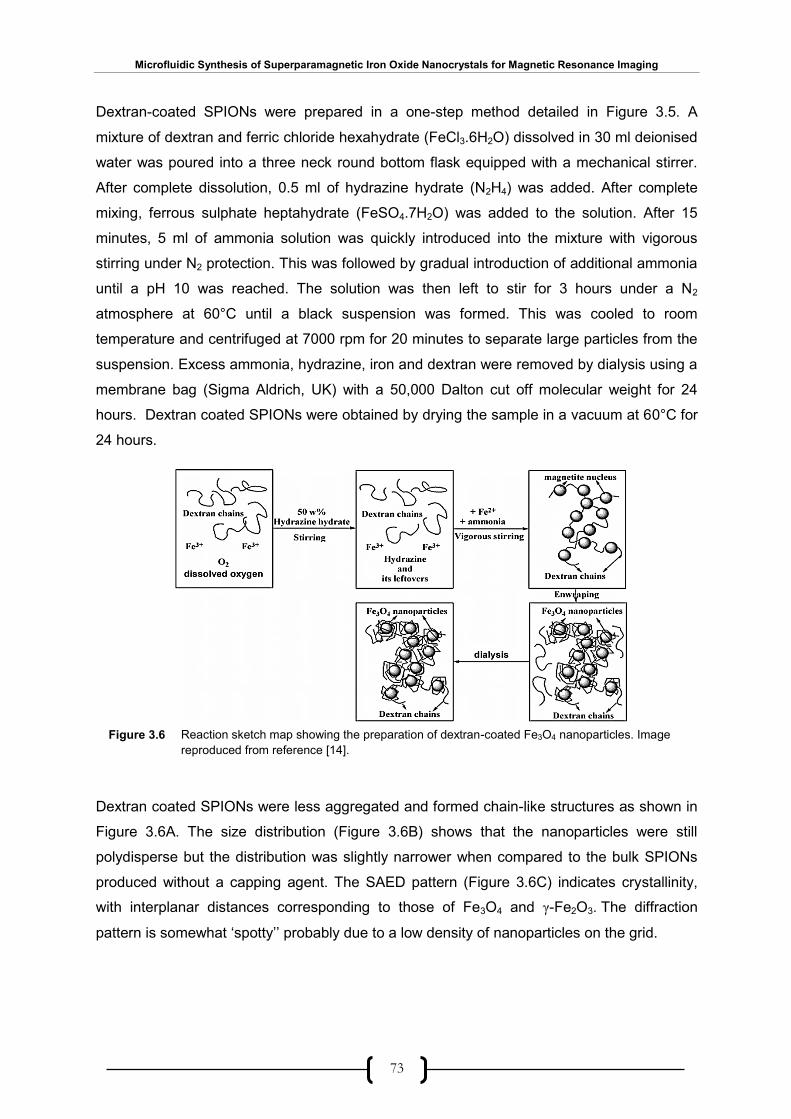
Microfluidic Synthesis of Superparamagnetic Iron Oxide Nanocrystals for Magnetic Resonance Imaging
73
Dextran-coated SPIONs were prepared in a one-step method detailed in Figure 3.5. A
mixture of dextran and ferric chloride hexahydrate (FeCl3.6H2O) dissolved in 30 ml deionised
water was poured into a three neck round bottom flask equipped with a mechanical stirrer.
After complete dissolution, 0.5 ml of hydrazine hydrate (N2H4) was added. After complete
mixing, ferrous sulphate heptahydrate (FeSO4.7H2O) was added to the solution. After 15
minutes, 5 ml of ammonia solution was quickly introduced into the mixture with vigorous
stirring under N2 protection. This was followed by gradual introduction of additional ammonia
until a pH 10 was reached. The solution was then left to stir for 3 hours under a N2
atmosphere at 60°C until a black suspension was formed. This was cooled to room
temperature and centrifuged at 7000 rpm for 20 minutes to separate large particles from the
suspension. Excess ammonia, hydrazine, iron and dextran were removed by dialysis using a
membrane bag (Sigma Aldrich, UK) with a 50,000 Dalton cut off molecular weight for 24
hours. Dextran coated SPIONs were obtained by drying the sample in a vacuum at 60°C for
24 hours.
Dextran coated SPIONs were less aggregated and formed chain-like structures as shown in
Figure 3.6A. The size distribution (Figure 3.6B) shows that the nanoparticles were still
polydisperse but the distribution was slightly narrower when compared to the bulk SPIONs
produced without a capping agent. The SAED pattern (Figure 3.6C) indicates crystallinity,
with interplanar distances corresponding to those of Fe3O4 and γ-Fe2O3. The diffraction
pattern is somewhat ‘spotty’’ probably due to a low density of nanoparticles on the grid.
Reaction sketch map showing the preparation of dextran-coated Fe3O4 nanoparticles. Image
reproduced from reference [14].
Figure 3.6
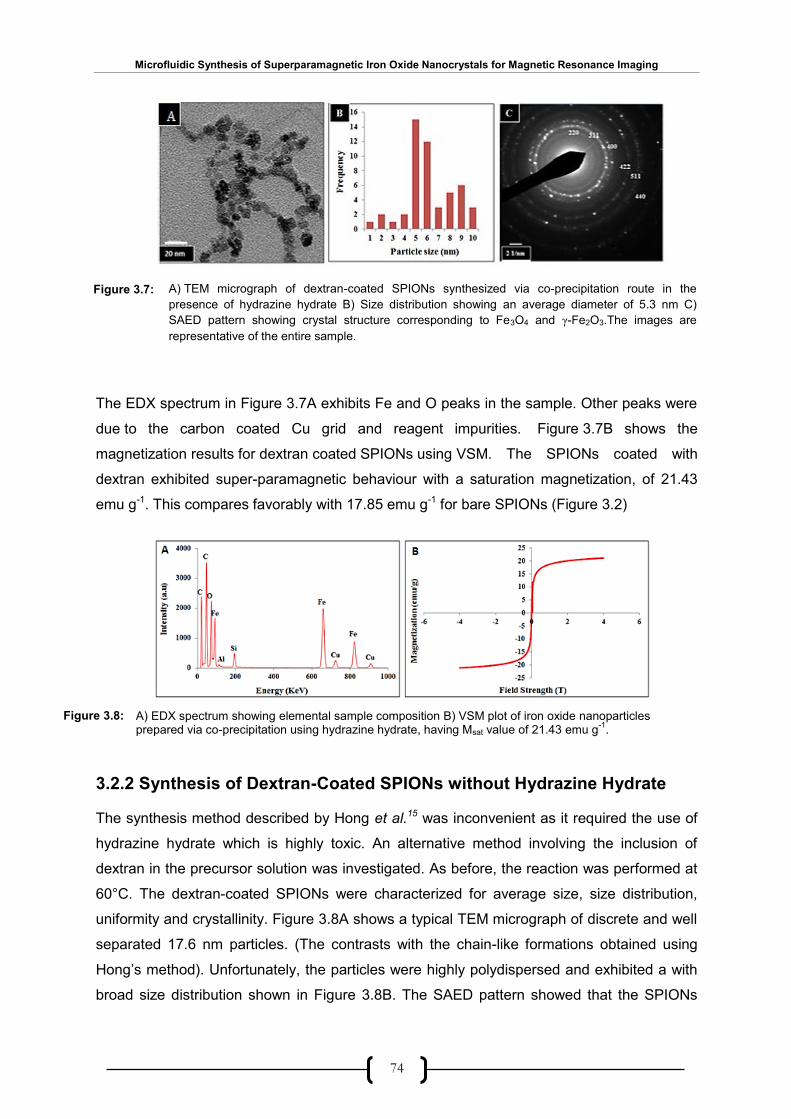
Microfluidic Synthesis of Superparamagnetic Iron Oxide Nanocrystals for Magnetic Resonance Imaging
74
The EDX spectrum in Figure 3.7A exhibits Fe and O peaks in the sample. Other peaks were
due to the carbon coated Cu grid and reagent impurities. Figure 3.7B shows the
magnetization results for dextran coated SPIONs using VSM. The SPIONs coated with
dextran exhibited super-paramagnetic behaviour with a saturation magnetization, of 21.43
emu g-1. This compares favorably with 17.85 emu g-1 for bare SPIONs (Figure 3.2)
3.2.2 Synthesis of Dextran-Coated SPIONs without Hydrazine Hydrate
The synthesis method described by Hong et al.15 was inconvenient as it required the use of
hydrazine hydrate which is highly toxic. An alternative method involving the inclusion of
dextran in the precursor solution was investigated. As before, the reaction was performed at
60°C. The dextran-coated SPIONs were characterized for average size, size distribution,
uniformity and crystallinity. Figure 3.8A shows a typical TEM micrograph of discrete and well
separated 17.6 nm particles. (The contrasts with the chain-like formations obtained using
Hong’s method). Unfortunately, the particles were highly polydispersed and exhibited a with
broad size distribution shown in Figure 3.8B. The SAED pattern showed that the SPIONs
A) TEM micrograph of dextran-coated SPIONs synthesized via co-precipitation route in the
presence of hydrazine hydrate B) Size distribution showing an average diameter of 5.3 nm C)
SAED pattern showing crystal structure corresponding to Fe3O4 and γ-Fe2O3.The images are
representative of the entire sample.
Figure 3.7:
A) EDX spectrum showing elemental sample composition B) VSM plot of iron oxide nanoparticles prepared via co-precipitation using hydrazine hydrate, having Msat value of 21.43 emu g
-1.
Figure 3.8:

Microfluidic Synthesis of Superparamagnetic Iron Oxide Nanocrystals for Magnetic Resonance Imaging
75
were crystalline (Figure 3.8C), with interplanar spacing corresponding to those of spinel
structure Fe3O4 and γ-Fe2O3.
The EDX spectrum (Figure 3.9A) showed Fe and O peaks. Other peaks in the spectrum
arise from the carbon coated copper grid and impurities in the reagents used. The
magnetization curve obtained by VSM (Figure 3.9B) indicated superparamagnetic behaviour
of iron oxide nanoparticles with high saturation magnetization of 16.35 emu g-1.
To confirm the attachment of dextran to SPIONs, FTIR spectra with and without dextran in
the precursor solution, were measured. Figure 3.10 shows solid-state (FTIR) spectra for
dextran, bare iron oxide nanoparticles and (presumed) dextran-coated iron oxide
nanoparticles. FTIR spectra were measured on an Agilent 5500 Series FTIR spectrometer.
The obtained sample was dried overnight in a vacuum oven and subsequently used for
analysis.
A) TEM micrograph of dextran-coated SPIONs prepared in the absence of hydrazine hydrate B)
Size distribution showing average diameter of 17.6 nm C) SAED pattern showing crystal structure
corresponding to Fe3O4 and γ-Fe2O3.The images are representative of the entire sample.
Figure 3.9:
Figure 3.10: A) EDX spectrum showing the peaks of all the elements in the sample B) VSM plot of iron oxide
nanoparticles prepared via co-precipitation without using hydrazine hydrate, having Msat value of
16.35 emu g-1
.
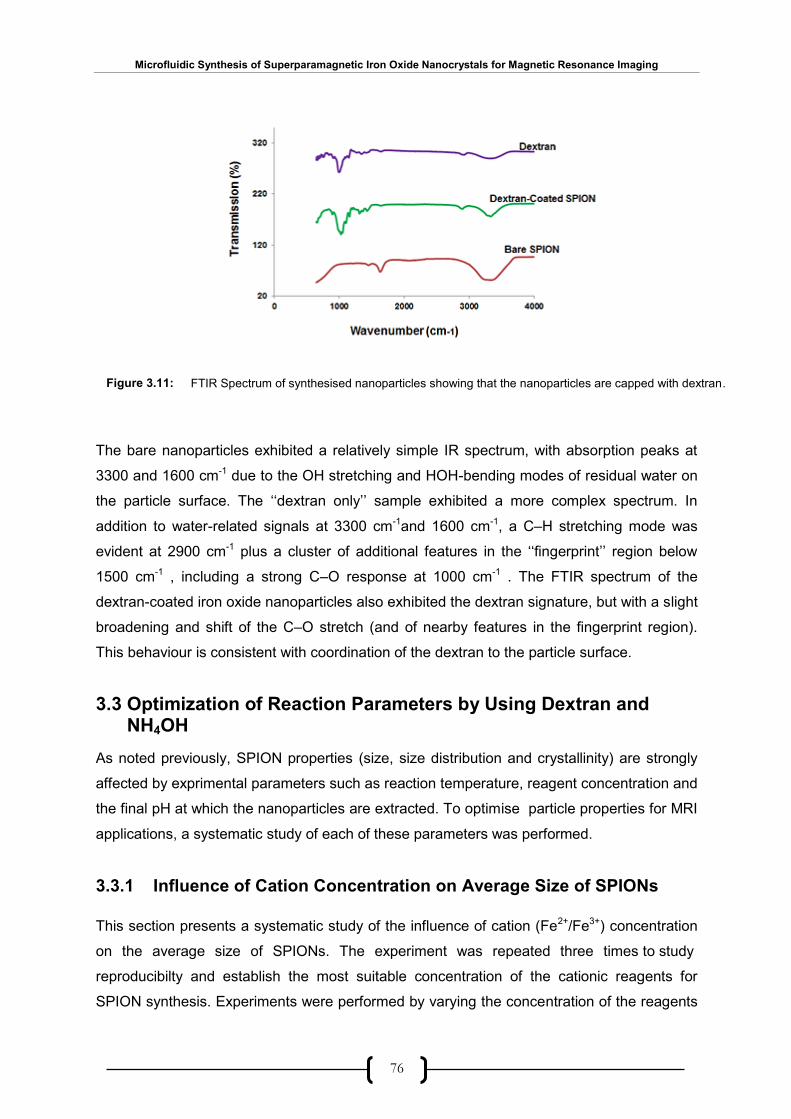
Microfluidic Synthesis of Superparamagnetic Iron Oxide Nanocrystals for Magnetic Resonance Imaging
76
The bare nanoparticles exhibited a relatively simple IR spectrum, with absorption peaks at
3300 and 1600 cm-1 due to the OH stretching and HOH-bending modes of residual water on
the particle surface. The ‘‘dextran only’’ sample exhibited a more complex spectrum. In
addition to water-related signals at 3300 cm-1and 1600 cm-1, a C–H stretching mode was
evident at 2900 cm-1 plus a cluster of additional features in the ‘‘fingerprint’’ region below
1500 cm-1 , including a strong C–O response at 1000 cm-1 . The FTIR spectrum of the
dextran-coated iron oxide nanoparticles also exhibited the dextran signature, but with a slight
broadening and shift of the C–O stretch (and of nearby features in the fingerprint region).
This behaviour is consistent with coordination of the dextran to the particle surface.
3.3 Optimization of Reaction Parameters by Using Dextran and NH4OH
As noted previously, SPION properties (size, size distribution and crystallinity) are strongly
affected by exprimental parameters such as reaction temperature, reagent concentration and
the final pH at which the nanoparticles are extracted. To optimise particle properties for MRI
applications, a systematic study of each of these parameters was performed.
3.3.1 Influence of Cation Concentration on Average Size of SPIONs
This section presents a systematic study of the influence of cation (Fe2+/Fe3+) concentration
on the average size of SPIONs. The experiment was repeated three times to study
reproducibilty and establish the most suitable concentration of the cationic reagents for
SPION synthesis. Experiments were performed by varying the concentration of the reagents
FTIR Spectrum of synthesised nanoparticles showing that the nanoparticles are capped with dextran.
Figure 3.11:
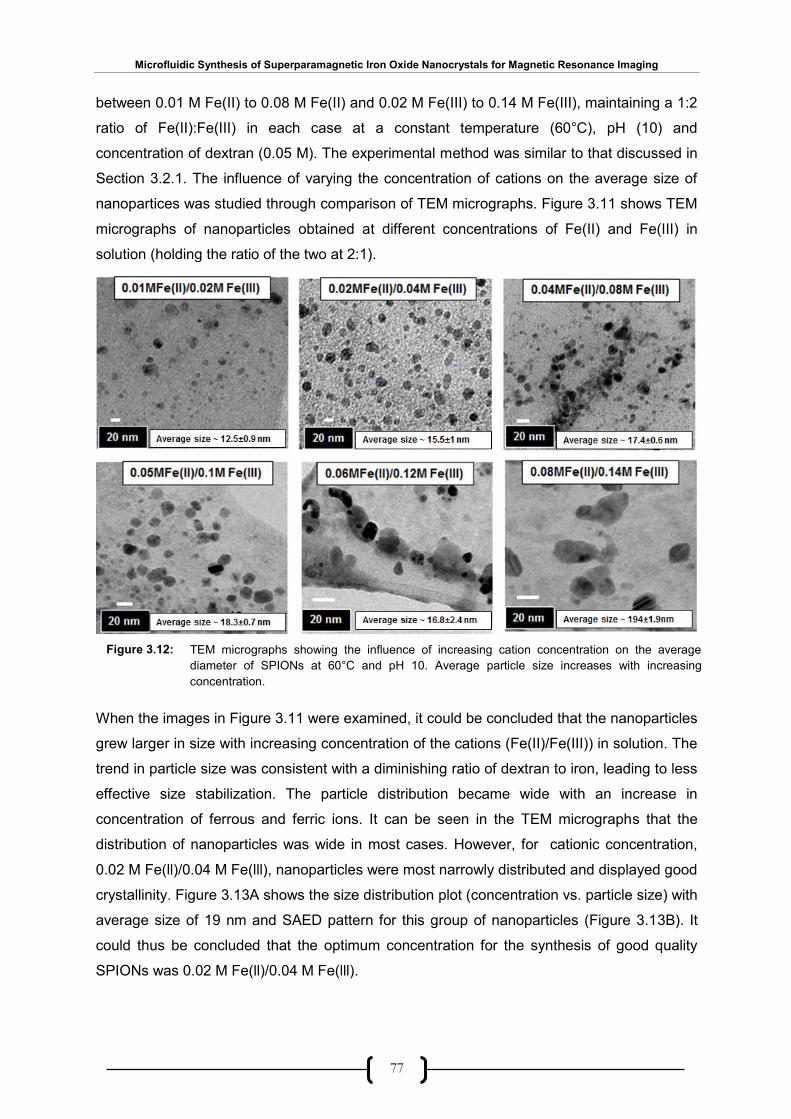
Microfluidic Synthesis of Superparamagnetic Iron Oxide Nanocrystals for Magnetic Resonance Imaging
77
between 0.01 M Fe(ІІ) to 0.08 M Fe(ІІ) and 0.02 M Fe(ІІІ) to 0.14 M Fe(ІІІ), maintaining a 1:2
ratio of Fe(II):Fe(III) in each case at a constant temperature (60°C), pH (10) and
concentration of dextran (0.05 M). The experimental method was similar to that discussed in
Section 3.2.1. The influence of varying the concentration of cations on the average size of
nanopartices was studied through comparison of TEM micrographs. Figure 3.11 shows TEM
micrographs of nanoparticles obtained at different concentrations of Fe(II) and Fe(III) in
solution (holding the ratio of the two at 2:1).
When the images in Figure 3.11 were examined, it could be concluded that the nanoparticles
grew larger in size with increasing concentration of the cations (Fe(II)/Fe(III)) in solution. The
trend in particle size was consistent with a diminishing ratio of dextran to iron, leading to less
effective size stabilization. The particle distribution became wide with an increase in
concentration of ferrous and ferric ions. It can be seen in the TEM micrographs that the
distribution of nanoparticles was wide in most cases. However, for cationic concentration,
0.02 M Fe(ll)/0.04 M Fe(lll), nanoparticles were most narrowly distributed and displayed good
crystallinity. Figure 3.13A shows the size distribution plot (concentration vs. particle size) with
average size of 19 nm and SAED pattern for this group of nanoparticles (Figure 3.13B). It
could thus be concluded that the optimum concentration for the synthesis of good quality
SPIONs was 0.02 M Fe(ll)/0.04 M Fe(lll).
TEM micrographs showing the influence of increasing cation concentration on the average
diameter of SPIONs at 60°C and pH 10. Average particle size increases with increasing
concentration.
Figure 3.12:
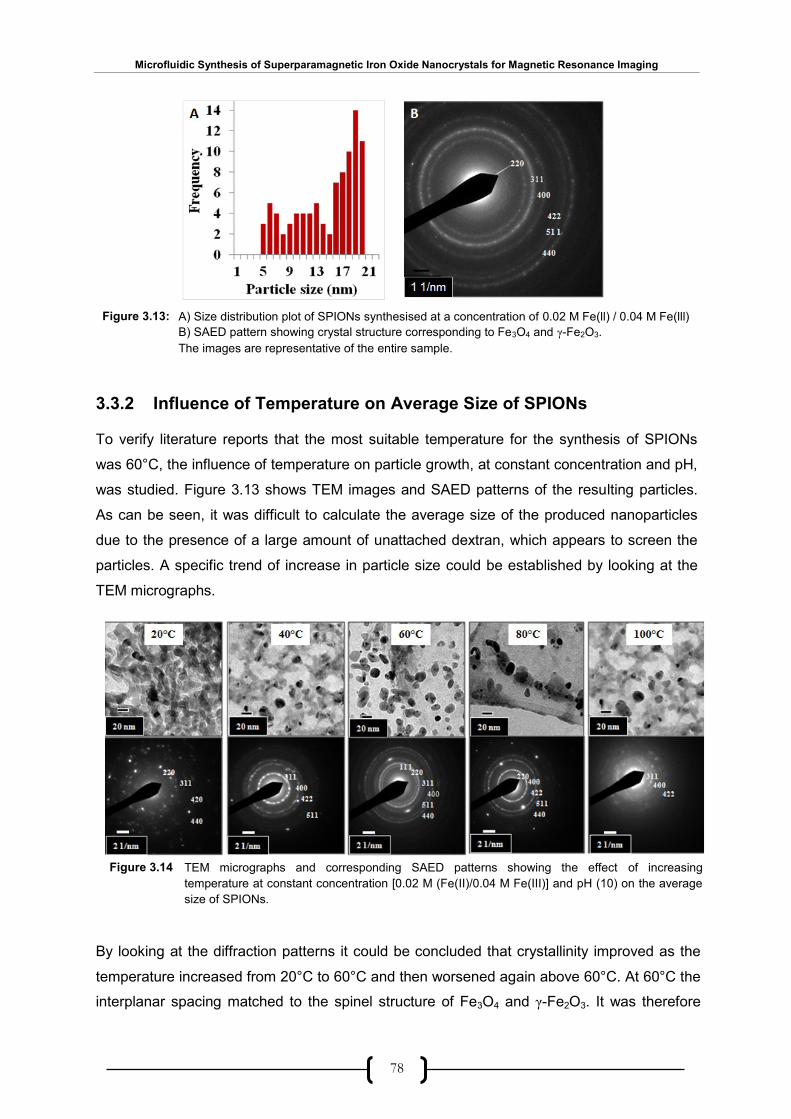
Microfluidic Synthesis of Superparamagnetic Iron Oxide Nanocrystals for Magnetic Resonance Imaging
78
3.3.2 Influence of Temperature on Average Size of SPIONs
To verify literature reports that the most suitable temperature for the synthesis of SPIONs
was 60°C, the influence of temperature on particle growth, at constant concentration and pH,
was studied. Figure 3.13 shows TEM images and SAED patterns of the resulting particles.
As can be seen, it was difficult to calculate the average size of the produced nanoparticles
due to the presence of a large amount of unattached dextran, which appears to screen the
particles. A specific trend of increase in particle size could be established by looking at the
TEM micrographs.
By looking at the diffraction patterns it could be concluded that crystallinity improved as the
temperature increased from 20°C to 60°C and then worsened again above 60°C. At 60°C the
interplanar spacing matched to the spinel structure of Fe3O4 and γ-Fe2O3. It was therefore
Figure 3.13: A) Size distribution plot of SPIONs synthesised at a concentration of 0.02 M Fe(ll) / 0.04 M Fe(lll)
B) SAED pattern showing crystal structure corresponding to Fe3O4 and γ-Fe2O3.
The images are representative of the entire sample.
TEM micrographs and corresponding SAED patterns showing the effect of increasing
temperature at constant concentration [0.02 M (Fe(II)/0.04 M Fe(III)] and pH (10) on the average
size of SPIONs.
Figure 3.14
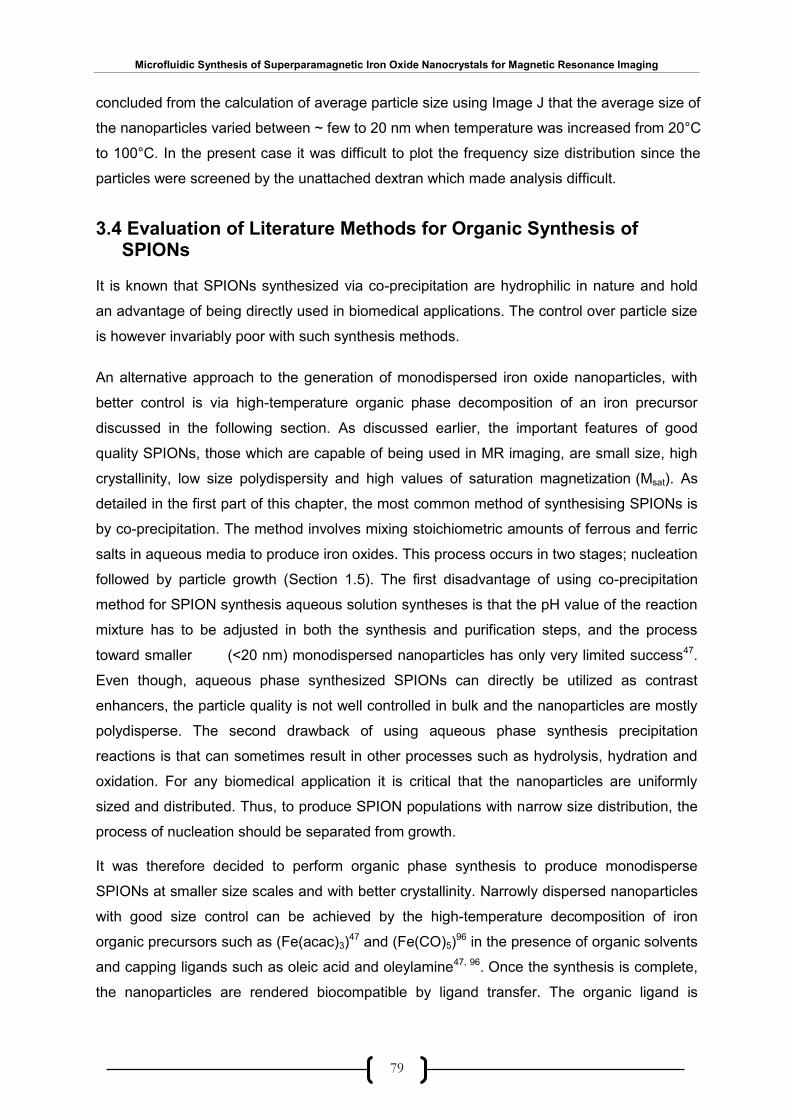
Microfluidic Synthesis of Superparamagnetic Iron Oxide Nanocrystals for Magnetic Resonance Imaging
79
concluded from the calculation of average particle size using Image J that the average size of
the nanoparticles varied between ~ few to 20 nm when temperature was increased from 20°C
to 100°C. In the present case it was difficult to plot the frequency size distribution since the
particles were screened by the unattached dextran which made analysis difficult.
3.4 Evaluation of Literature Methods for Organic Synthesis of SPIONs It is known that SPIONs synthesized via co-precipitation are hydrophilic in nature and hold
an advantage of being directly used in biomedical applications. The control over particle size
is however invariably poor with such synthesis methods.
An alternative approach to the generation of monodispersed iron oxide nanoparticles, with
better control is via high-temperature organic phase decomposition of an iron precursor
discussed in the following section. As discussed earlier, the important features of good
quality SPIONs, those which are capable of being used in MR imaging, are small size, high
crystallinity, low size polydispersity and high values of saturation magnetization (Msat). As
detailed in the first part of this chapter, the most common method of synthesising SPIONs is
by co-precipitation. The method involves mixing stoichiometric amounts of ferrous and ferric
salts in aqueous media to produce iron oxides. This process occurs in two stages; nucleation
followed by particle growth (Section 1.5). The first disadvantage of using co-precipitation
method for SPION synthesis aqueous solution syntheses is that the pH value of the reaction
mixture has to be adjusted in both the synthesis and purification steps, and the process
toward smaller (<20 nm) monodispersed nanoparticles has only very limited success47.
Even though, aqueous phase synthesized SPIONs can directly be utilized as contrast
enhancers, the particle quality is not well controlled in bulk and the nanoparticles are mostly
polydisperse. The second drawback of using aqueous phase synthesis precipitation
reactions is that can sometimes result in other processes such as hydrolysis, hydration and
oxidation. For any biomedical application it is critical that the nanoparticles are uniformly
sized and distributed. Thus, to produce SPION populations with narrow size distribution, the
process of nucleation should be separated from growth.
It was therefore decided to perform organic phase synthesis to produce monodisperse
SPIONs at smaller size scales and with better crystallinity. Narrowly dispersed nanoparticles
with good size control can be achieved by the high-temperature decomposition of iron
organic precursors such as (Fe(acac)3)47 and (Fe(CO)5)
96 in the presence of organic solvents
and capping ligands such as oleic acid and oleylamine47, 96. Once the synthesis is complete,
the nanoparticles are rendered biocompatible by ligand transfer. The organic ligand is
Microfluidic Synthesis of Superparamagnetic Iron Oxide Nanocrystals for Magnetic Resonance Imaging
80
exchanged to transfer the nanoparticles from the organic to the aqueous phase. The high
temperature solution phase reaction of iron (III) acetylacetonate, (Fe(acac)3), with 1,2-
hexadecanediol in the presence of oleic acid and oleylamine has been shown to yield
monodisperse Fe3O4 nanoparticles.39 It is possible to control the size of the oxide particles by
varying the reaction temperature or changing the ratio of solvents. The hydrophobic
nanoparticles produced by such oil phase reactions can be transformed into hydrophilic
particles by adding bipolar surfactants such as 2,3-dimercaptosuccinic acid (DMSA) in a
procedure of ligand exchange to disperse the colloid in water16a, 97 The following sections
discuss various methods to synthesize size controlled SPIONs by thermal decomposition of
iron complexes. Iron oxide nanoparticles were first synthesised via the high temperature
decomposition of Fe(acac)3 in the presence of 1,2-hexadecanediol, oleic acid and
oleylamine. A second method was also attempted which according to the literature gives a
higher yield (> 95% yield). Both the methods are detailed in the following sections.
3.4.1 Synthesis of SPIONs by High Temperature Decomposition of Fe(acac)3
The first organic phase method evaluated for the synthesis of monodispersed Fe3O4
nanoparticles via thermal decomposition of (Fe(acac)3) is represented in Scheme 3.1. The
reaction of (Fe(acac)3) with surfactants at high temperature leads to monodisperse Fe3O4
nanoparticles, which can easily be isolated from the reaction by-products and (high boiling
point) ether solvent.
In a round bottom flask, 2 mM iron acetlylacetonate [Fe(acac)3], 10 mM 1, 2-hexadecanediol,
6 mM oleic acid, 6 mM oleylamine, and 20 ml benzyl ether were mixed and stirred under a
constant flow of N2. The mixture was heated to 200°C for 2 hours and then, under a blanket
of N2, heated to reflux (~240°C) for 1 hour. The black-coloured mixture was passively cooled
to room temperature by removing the heat source. Under ambient conditions, 40 ml of
ethanol was added to the mixture, and a black material precipitated and separated via
centrifugation. The product was dissolved in hexane in the presence of 0.05 ml oleic acid
and 0.05 ml oleylamine. The sample was centrifuged at 6000 rpm for 10 minutes to remove
any undispersed residue. The product was then precipitated with ethanol, centrifuged at
6000 rpm for 10 minutes to separate off the solvent, and redispersed in hexane for analysis.
This reaction involves heating the reagents to 200°C for 2 hours then to 300°C for 1 hour.
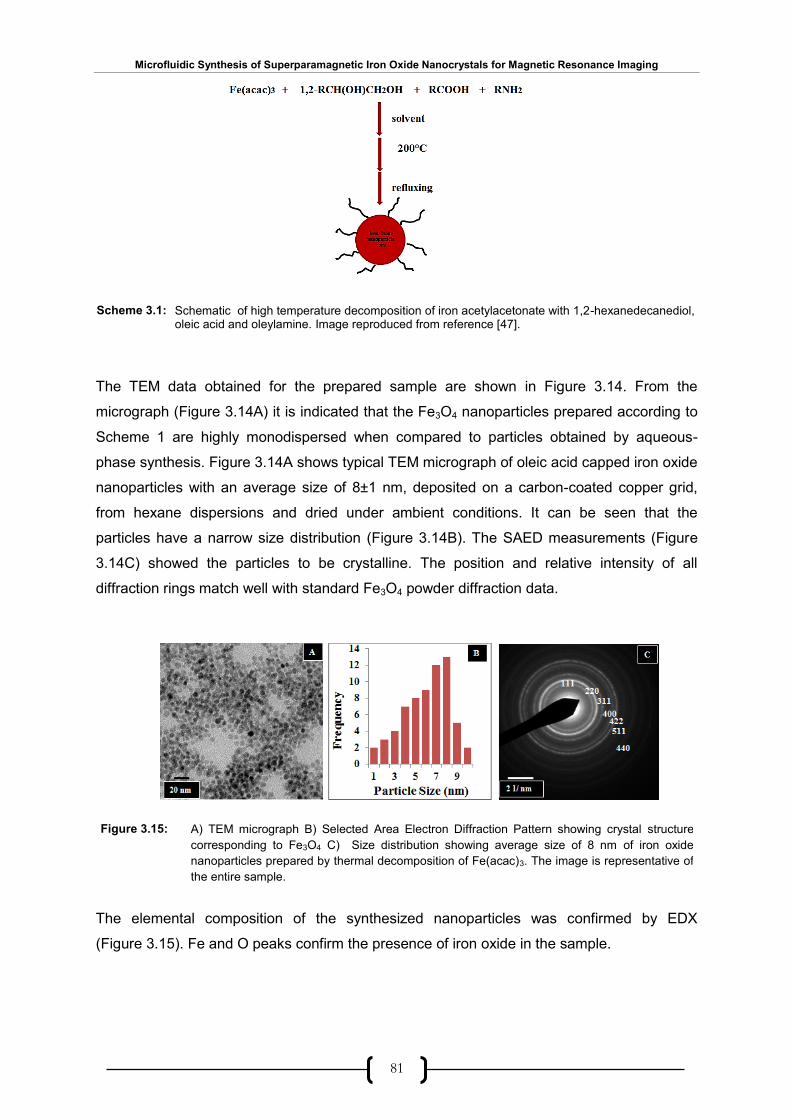
Microfluidic Synthesis of Superparamagnetic Iron Oxide Nanocrystals for Magnetic Resonance Imaging
81
The TEM data obtained for the prepared sample are shown in Figure 3.14. From the
micrograph (Figure 3.14A) it is indicated that the Fe3O4 nanoparticles prepared according to
Scheme 1 are highly monodispersed when compared to particles obtained by aqueous-
phase synthesis. Figure 3.14A shows typical TEM micrograph of oleic acid capped iron oxide
nanoparticles with an average size of 8±1 nm, deposited on a carbon-coated copper grid,
from hexane dispersions and dried under ambient conditions. It can be seen that the
particles have a narrow size distribution (Figure 3.14B). The SAED measurements (Figure
3.14C) showed the particles to be crystalline. The position and relative intensity of all
diffraction rings match well with standard Fe3O4 powder diffraction data.
The elemental composition of the synthesized nanoparticles was confirmed by EDX
(Figure 3.15). Fe and O peaks confirm the presence of iron oxide in the sample.
Figure 3.15: A) TEM micrograph B) Selected Area Electron Diffraction Pattern showing crystal structure
corresponding to Fe3O4 C) Size distribution showing average size of 8 nm of iron oxide
nanoparticles prepared by thermal decomposition of Fe(acac)3. The image is representative of
the entire sample.
Scheme 3.1: Schematic of high temperature decomposition of iron acetylacetonate with 1,2-hexanedecanediol, oleic acid and oleylamine. Image reproduced from reference [47].

Microfluidic Synthesis of Superparamagnetic Iron Oxide Nanocrystals for Magnetic Resonance Imaging
82
3.4.2 Synthesis of SPIONs by Using Oleylamine
Until recently, among all the synthetic procedures developed so far, thermal decomposition
of (Fe (acac)3) in a high boiling point organic solvent in the presence of a reducing agent and
surfactants has been the most effective method for synthesizing monodisperse Fe3O4
nanoparticles. To synthesize high quality SPIONs by thermal decomposition, the reactants
(iron precursor, reducing agent, capping agent and solvent) have to undergo a series of
complicated chemical conversions. During the reaction the reagents influence each other
and the overall chemical reaction, so it is desirable to have as few reactants as possible.
To overcome this problem, Xu et al.98 proposed a novel method to synthesize good quality
SPIONs in the absence of organic solvents. This method of iron oxide synthesis is carried
out without the use of an additional reducing agent. The reaction is based on a mixture of
oleylamine and oleic acid. The authors reported that they could control the size of
nanoparticles between 14 nm and 100 nm by varying the heating conditions and the ratios of
oleylamine and oleic acid. They found that oleylamine acts as an alternative reducing agent,
which is inexpensive and even stronger than the previously used 1,2-hexadecanediol, readily
providing the decomposition of (Fe(acac)3). According to the literature, this method is the
most reliable and simplified route to Fe3O4 nanoparticle synthesis and uses oleylamine as
both the reducing agent and capping agent.
Using the multifunctional capabilities of oleylamine good quality SPIONs could be
synthesised via thermal decomposition of iron acetylacetonate. Scheme 3.2 represents the
thermal decomposition of (Fe (acac) 3) in benzyl ether and oleylamine.
EDX spectrum showing the peaks of different elements in the sample.
Figure 3.16:
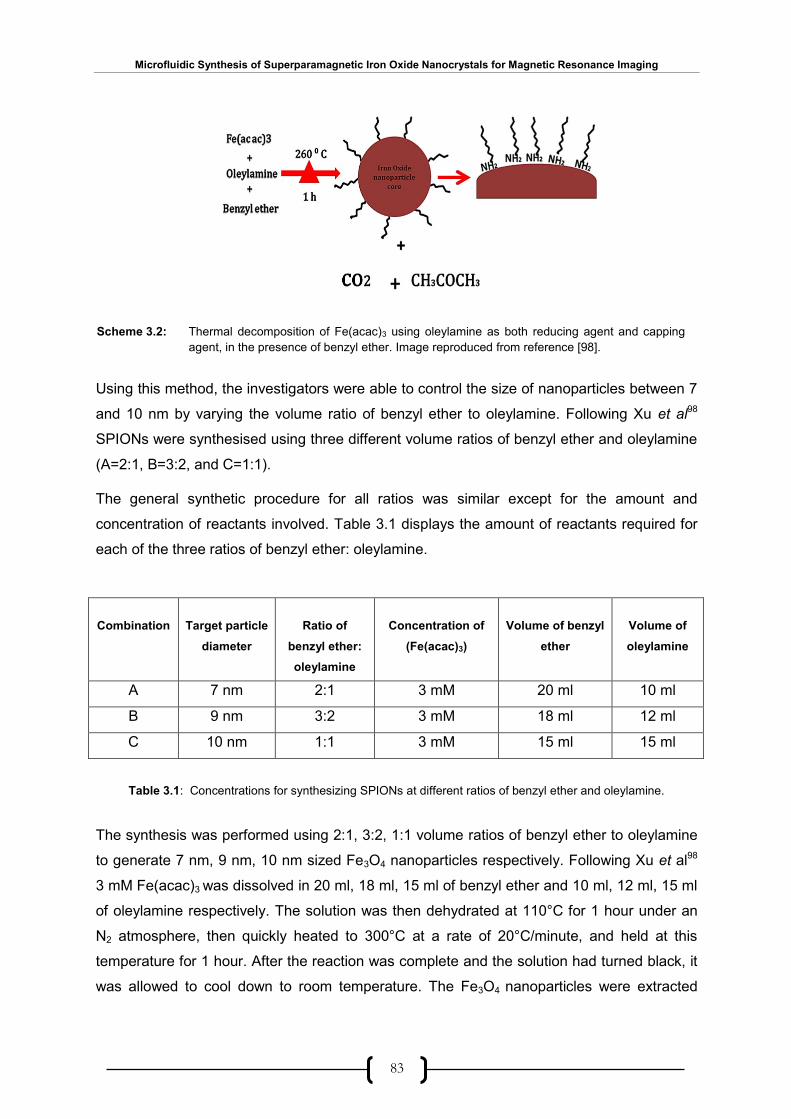
Microfluidic Synthesis of Superparamagnetic Iron Oxide Nanocrystals for Magnetic Resonance Imaging
83
Using this method, the investigators were able to control the size of nanoparticles between 7
and 10 nm by varying the volume ratio of benzyl ether to oleylamine. Following Xu et al98
SPIONs were synthesised using three different volume ratios of benzyl ether and oleylamine
(A=2:1, B=3:2, and C=1:1).
The general synthetic procedure for all ratios was similar except for the amount and
concentration of reactants involved. Table 3.1 displays the amount of reactants required for
each of the three ratios of benzyl ether: oleylamine.
Table 3.1: Concentrations for synthesizing SPIONs at different ratios of benzyl ether and oleylamine.
The synthesis was performed using 2:1, 3:2, 1:1 volume ratios of benzyl ether to oleylamine
to generate 7 nm, 9 nm, 10 nm sized Fe3O4 nanoparticles respectively. Following Xu et al98
3 mM Fe(acac)3 was dissolved in 20 ml, 18 ml, 15 ml of benzyl ether and 10 ml, 12 ml, 15 ml
of oleylamine respectively. The solution was then dehydrated at 110°C for 1 hour under an
N2 atmosphere, then quickly heated to 300°C at a rate of 20°C/minute, and held at this
temperature for 1 hour. After the reaction was complete and the solution had turned black, it
was allowed to cool down to room temperature. The Fe3O4 nanoparticles were extracted
Combination
Target particle
diameter
Ratio of
benzyl ether:
oleylamine
Concentration of
(Fe(acac)3)
Volume of benzyl
ether
Volume of
oleylamine
A 7 nm 2:1 3 mM 20 ml 10 ml
B 9 nm 3:2 3 mM 18 ml 12 ml
C 10 nm 1:1 3 mM 15 ml 15 ml
Thermal decomposition of Fe(acac)3 using oleylamine as both reducing agent and capping
agent, in the presence of benzyl ether. Image reproduced from reference [98].
Scheme 3.2:

Microfluidic Synthesis of Superparamagnetic Iron Oxide Nanocrystals for Magnetic Resonance Imaging
84
upon the addition of 50 ml of ethanol, followed by centrifugation. The Fe3O4 nanoparticles
were finally dispersed in hexane for further characterization.
TEM analysis of Fe3O4 nanoparticles synthesized using different ratios of benzyl ether:
oleylamine are shown in Figure 3.16. It can be seen that the particles are monodisperse with
an average size ~7 nm, 9 nm and 10 nm for 2:1, 3:2 and 1:1 ratios respectively. The size
distribution in each of the three groups has narrowed compared to the aqueous-phase
syntheses. The corresponding size distribution histograms are shown as insets in
each of the TEM micrographs.
The SAED patterns closely correspond with standard Fe3O4 powder diffraction data. The
patterns show sharp, well defined diffraction rings which revealed nanocrystallinity of the
particles. The diffraction lines were in close correspondence with the interplanar distances of
the spinel phases of iron oxide, Fe3O4 and γ-Fe2O3, both of which exhibit super-
paramagnetism at the nanoscale and have similar magnetic properties.
TEM results of SPIONs synthesized by thermal decomposition of (Fe(acac)3) using A) 2:1 B)
3:2 and C) 1:1 volume ratios of benzyl ether: oleylamine. The TEM micrographs in all the three
panels A, B and C show that the particles are highly monodispersed and narrowly distributed
with average size of 7 nm, 9 nm, 10 nm respectively. (size distribution shown as an inset in
micrographs) SAED patterns indicate good crystallinity with the interplanar spacing
corresponding to Fe3O4 or γ-Fe2O3,
Figure 3.17:
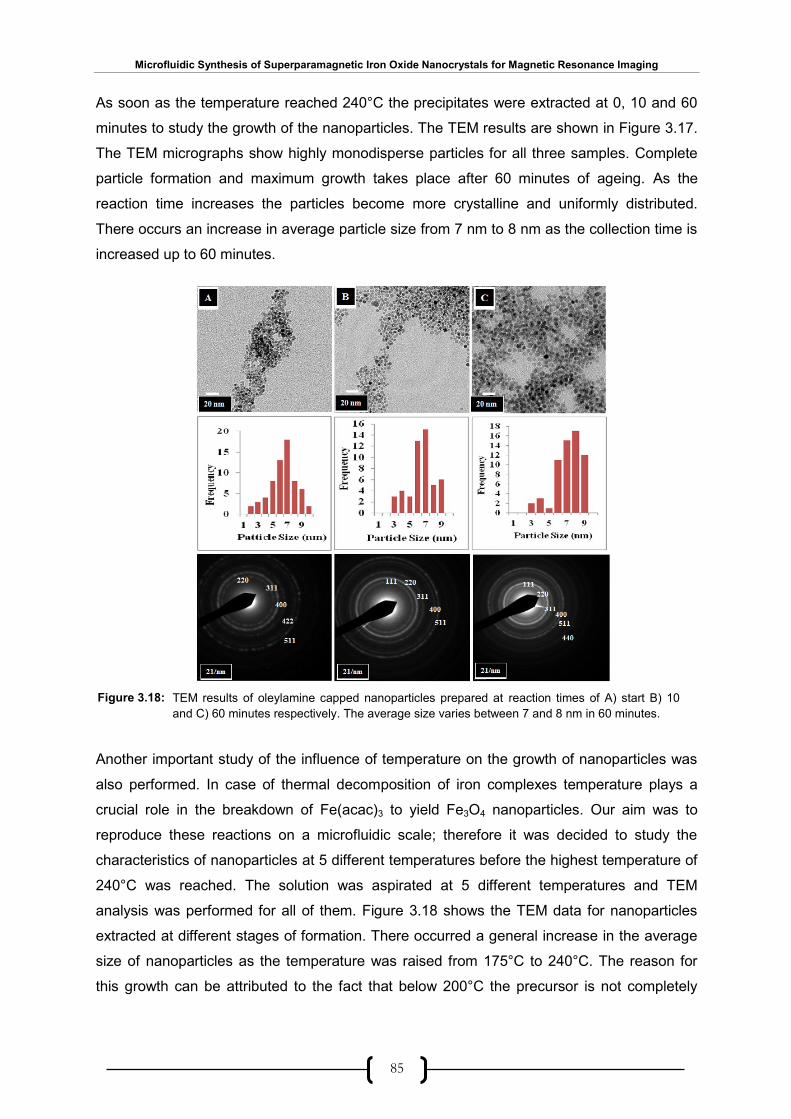
Microfluidic Synthesis of Superparamagnetic Iron Oxide Nanocrystals for Magnetic Resonance Imaging
85
As soon as the temperature reached 240°C the precipitates were extracted at 0, 10 and 60
minutes to study the growth of the nanoparticles. The TEM results are shown in Figure 3.17.
The TEM micrographs show highly monodisperse particles for all three samples. Complete
particle formation and maximum growth takes place after 60 minutes of ageing. As the
reaction time increases the particles become more crystalline and uniformly distributed.
There occurs an increase in average particle size from 7 nm to 8 nm as the collection time is
increased up to 60 minutes.
Another important study of the influence of temperature on the growth of nanoparticles was
also performed. In case of thermal decomposition of iron complexes temperature plays a
crucial role in the breakdown of Fe(acac)3 to yield Fe3O4 nanoparticles. Our aim was to
reproduce these reactions on a microfluidic scale; therefore it was decided to study the
characteristics of nanoparticles at 5 different temperatures before the highest temperature of
240°C was reached. The solution was aspirated at 5 different temperatures and TEM
analysis was performed for all of them. Figure 3.18 shows the TEM data for nanoparticles
extracted at different stages of formation. There occurred a general increase in the average
size of nanoparticles as the temperature was raised from 175°C to 240°C. The reason for
this growth can be attributed to the fact that below 200°C the precursor is not completely
TEM results of oleylamine capped nanoparticles prepared at reaction times of A) start B) 10
and C) 60 minutes respectively. The average size varies between 7 and 8 nm in 60 minutes.
Figure 3.18:
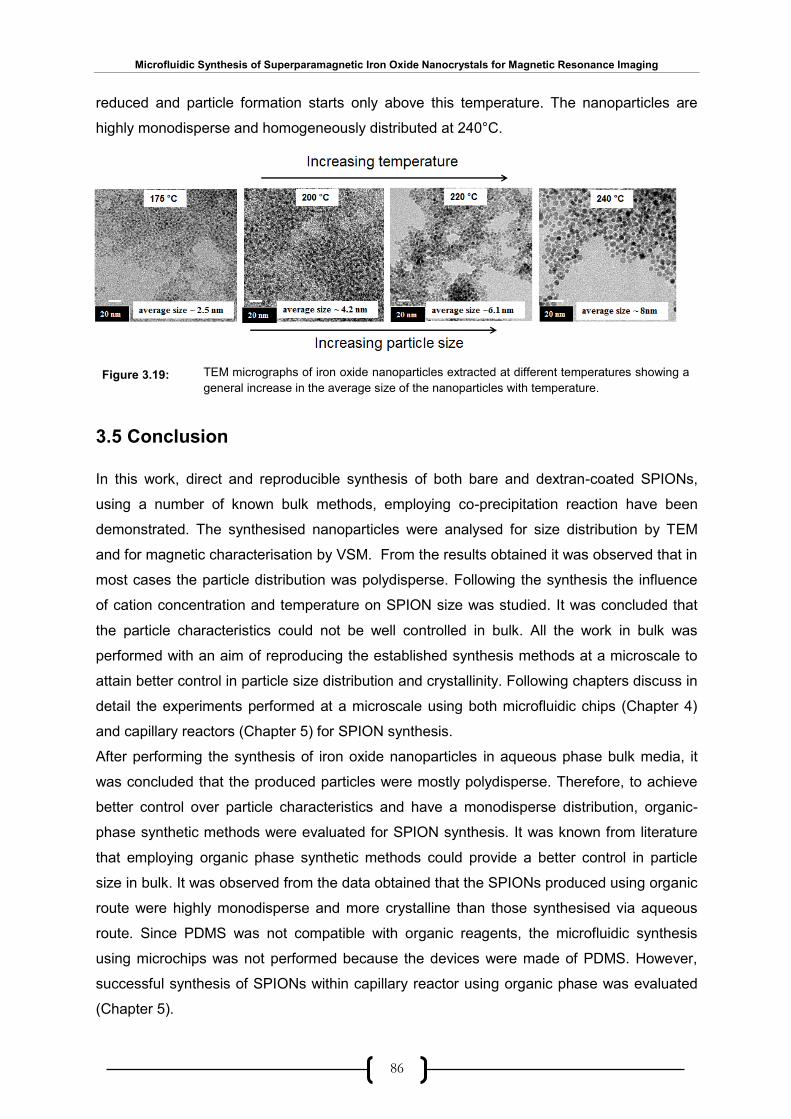
Microfluidic Synthesis of Superparamagnetic Iron Oxide Nanocrystals for Magnetic Resonance Imaging
86
reduced and particle formation starts only above this temperature. The nanoparticles are
highly monodisperse and homogeneously distributed at 240°C.
3.5 Conclusion
In this work, direct and reproducible synthesis of both bare and dextran-coated SPIONs,
using a number of known bulk methods, employing co-precipitation reaction have been
demonstrated. The synthesised nanoparticles were analysed for size distribution by TEM
and for magnetic characterisation by VSM. From the results obtained it was observed that in
most cases the particle distribution was polydisperse. Following the synthesis the influence
of cation concentration and temperature on SPION size was studied. It was concluded that
the particle characteristics could not be well controlled in bulk. All the work in bulk was
performed with an aim of reproducing the established synthesis methods at a microscale to
attain better control in particle size distribution and crystallinity. Following chapters discuss in
detail the experiments performed at a microscale using both microfluidic chips (Chapter 4)
and capillary reactors (Chapter 5) for SPION synthesis.
After performing the synthesis of iron oxide nanoparticles in aqueous phase bulk media, it
was concluded that the produced particles were mostly polydisperse. Therefore, to achieve
better control over particle characteristics and have a monodisperse distribution, organic-
phase synthetic methods were evaluated for SPION synthesis. It was known from literature
that employing organic phase synthetic methods could provide a better control in particle
size in bulk. It was observed from the data obtained that the SPIONs produced using organic
route were highly monodisperse and more crystalline than those synthesised via aqueous
route. Since PDMS was not compatible with organic reagents, the microfluidic synthesis
using microchips was not performed because the devices were made of PDMS. However,
successful synthesis of SPIONs within capillary reactor using organic phase was evaluated
(Chapter 5).
TEM micrographs of iron oxide nanoparticles extracted at different temperatures showing a
general increase in the average size of the nanoparticles with temperature. Figure 3.19:
Microfluidic Synthesis of Superparamagnetic Iron Oxide Nanocrystals for Magnetic Resonance Imaging
87
IV
Chapter 4
Microchip-Based Synthesis of
SPIONs
The synthesis of SPIONs within microfluidic devices using both continuous and segmented
flow microfluidic systems is described. The aim is to extend and improve SPION synthesis in
terms of size control and crystallinity of the formed particles by exploiting microscale flow. A
number of technical problems are encountered, but methods are developed to overcome
such difficulties, and thus generate good quality dextran-coated SPIONs.

Microfluidic Synthesis of Superparamagnetic Iron Oxide Nanocrystals for Magnetic Resonance Imaging
88
4.1 Introduction
SPIONs are typically synthesized in bulk using co-precipitation methods. Unfortunately such
synthetic methods provide only limited control over size, stoichiometry and magnetic
characteristics. In order to controllably synthesize SPIONs with well-defined physical and
chemical properties, microfluidic reactors have recently been employed as reaction vessels.
The use of microscale devices has been shown to provide improvements in size, size
distribution and crystallinity of the produced particles54, 72, 99.
Microfluidic reactors offer many potential advantages in the chemical industry due to superior
reaction control, continuous throughput and safe operation.57 The possibility of finely
manipulating and controlling reaction parameters, such as temperature, reaction time and
chemical composition via flow rate variations, offers possibilities for superior product control
compared to batch methods. In microfluidic systems it is possible to control reaction
variables such as temperature, residence times (reaction times) and reagent concentrations
precisely.54, 57 In this way reactions can be optimised in a direct fashion. As described in the
previous chapter the SPIONs synthesized in bulk by co-precipitation exhibit a high degree of
polydispersity, which limits their applicability as contrast enhancers in MR imaging. It was
expected that adapting similar reaction procedures within microfluidic formats would enable
better control over particle size and other physical and chemical properties, leading to the
production of high quality SPIONs.
4.2 Microfluidic Synthesis of SPIONs
The advantages of using microfluidic reactors for chemical synthesis have already been
discussed in the Chapter 1. In the present chapter attempts to adapt bulk synthesis
procedures to a microfluidic format are described. Most reports of nanoparticle synthesis in
microreactors have involved a continuous flow (single-phase) mode of operation, in which
laminar streams of miscible fluids are maneuvered through microscale channels where
nucleation and growth take place.57, 72 Continuous flow reactors, however, are poorly suited
to the synthesis of rapidly forming nanoparticles such as metal oxides due to their high
susceptibility to fouling and inability to precisely define the reaction time75. An alternative
approach is to use droplet-based reactors in which an immiscible liquid is injected alongside
the reaction mixture, causing the latter to spontaneously divide into a series of near identical
droplets. The immiscible phase is selected so as to preferentially wet the channel surface
and hence keep reacting species away from the walls, drastically reducing the risk of fouling.
In addition the reagent mixture is carried through the channel at a constant linear velocity,
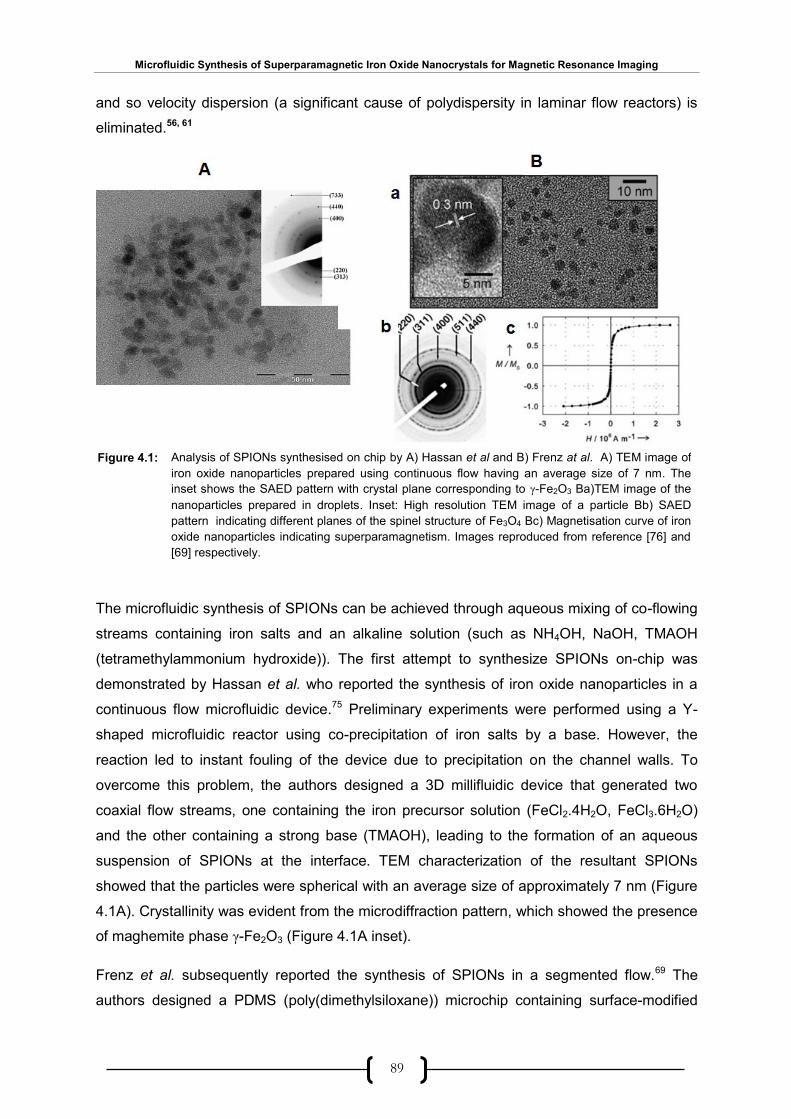
Microfluidic Synthesis of Superparamagnetic Iron Oxide Nanocrystals for Magnetic Resonance Imaging
89
and so velocity dispersion (a significant cause of polydispersity in laminar flow reactors) is
eliminated.56, 61
The microfluidic synthesis of SPIONs can be achieved through aqueous mixing of co-flowing
streams containing iron salts and an alkaline solution (such as NH4OH, NaOH, TMAOH
(tetramethylammonium hydroxide)). The first attempt to synthesize SPIONs on-chip was
demonstrated by Hassan et al. who reported the synthesis of iron oxide nanoparticles in a
continuous flow microfluidic device.75 Preliminary experiments were performed using a Y-
shaped microfluidic reactor using co-precipitation of iron salts by a base. However, the
reaction led to instant fouling of the device due to precipitation on the channel walls. To
overcome this problem, the authors designed a 3D millifluidic device that generated two
coaxial flow streams, one containing the iron precursor solution (FeCl2.4H2O, FeCl3.6H2O)
and the other containing a strong base (TMAOH), leading to the formation of an aqueous
suspension of SPIONs at the interface. TEM characterization of the resultant SPIONs
showed that the particles were spherical with an average size of approximately 7 nm (Figure
4.1A). Crystallinity was evident from the microdiffraction pattern, which showed the presence
of maghemite phase γ-Fe2O3 (Figure 4.1A inset).
Frenz et al. subsequently reported the synthesis of SPIONs in a segmented flow.69 The
authors designed a PDMS (poly(dimethylsiloxane)) microchip containing surface-modified
Analysis of SPIONs synthesised on chip by A) Hassan et al and B) Frenz at al. A) TEM image of
iron oxide nanoparticles prepared using continuous flow having an average size of 7 nm. The
inset shows the SAED pattern with crystal plane corresponding to γ-Fe2O3 Ba)TEM image of the
nanoparticles prepared in droplets. Inset: High resolution TEM image of a particle Bb) SAED
pattern indicating different planes of the spinel structure of Fe3O4 Bc) Magnetisation curve of iron
oxide nanoparticles indicating superparamagnetism. Images reproduced from reference [76] and
[69] respectively.
Figure 4.1:
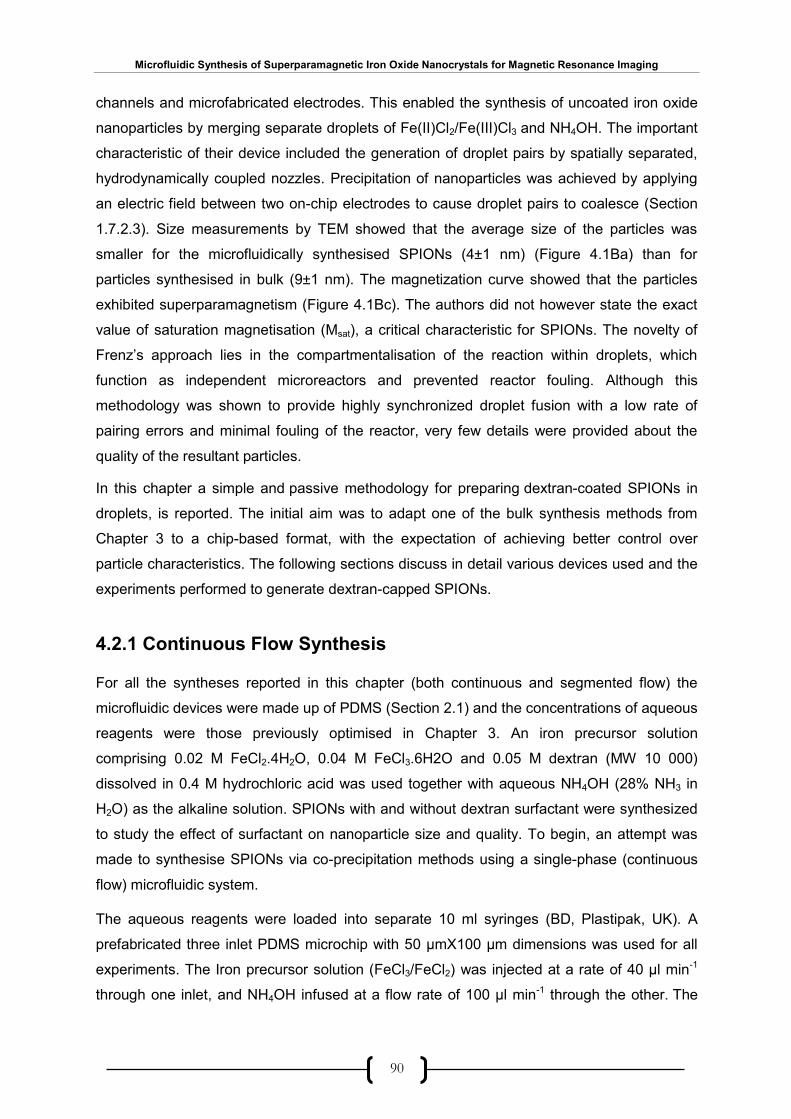
Microfluidic Synthesis of Superparamagnetic Iron Oxide Nanocrystals for Magnetic Resonance Imaging
90
channels and microfabricated electrodes. This enabled the synthesis of uncoated iron oxide
nanoparticles by merging separate droplets of Fe(II)Cl2/Fe(III)Cl3 and NH4OH. The important
characteristic of their device included the generation of droplet pairs by spatially separated,
hydrodynamically coupled nozzles. Precipitation of nanoparticles was achieved by applying
an electric field between two on-chip electrodes to cause droplet pairs to coalesce (Section
1.7.2.3). Size measurements by TEM showed that the average size of the particles was
smaller for the microfluidically synthesised SPIONs (4±1 nm) (Figure 4.1Ba) than for
particles synthesised in bulk (9±1 nm). The magnetization curve showed that the particles
exhibited superparamagnetism (Figure 4.1Bc). The authors did not however state the exact
value of saturation magnetisation (Msat), a critical characteristic for SPIONs. The novelty of
Frenz’s approach lies in the compartmentalisation of the reaction within droplets, which
function as independent microreactors and prevented reactor fouling. Although this
methodology was shown to provide highly synchronized droplet fusion with a low rate of
pairing errors and minimal fouling of the reactor, very few details were provided about the
quality of the resultant particles.
In this chapter a simple and passive methodology for preparing dextran-coated SPIONs in
droplets, is reported. The initial aim was to adapt one of the bulk synthesis methods from
Chapter 3 to a chip-based format, with the expectation of achieving better control over
particle characteristics. The following sections discuss in detail various devices used and the
experiments performed to generate dextran-capped SPIONs.
4.2.1 Continuous Flow Synthesis
For all the syntheses reported in this chapter (both continuous and segmented flow) the
microfluidic devices were made up of PDMS (Section 2.1) and the concentrations of aqueous
reagents were those previously optimised in Chapter 3. An iron precursor solution
comprising 0.02 M FeCl2.4H2O, 0.04 M FeCl3.6H2O and 0.05 M dextran (MW 10 000)
dissolved in 0.4 M hydrochloric acid was used together with aqueous NH4OH (28% NH3 in
H2O) as the alkaline solution. SPIONs with and without dextran surfactant were synthesized
to study the effect of surfactant on nanoparticle size and quality. To begin, an attempt was
made to synthesise SPIONs via co-precipitation methods using a single-phase (continuous
flow) microfluidic system.
The aqueous reagents were loaded into separate 10 ml syringes (BD, Plastipak, UK). A
prefabricated three inlet PDMS microchip with 50 µmX100 µm dimensions was used for all
experiments. The Iron precursor solution (FeCl3/FeCl2) was injected at a rate of 40 µl min-1
through one inlet, and NH4OH infused at a flow rate of 100 µl min-1 through the other. The
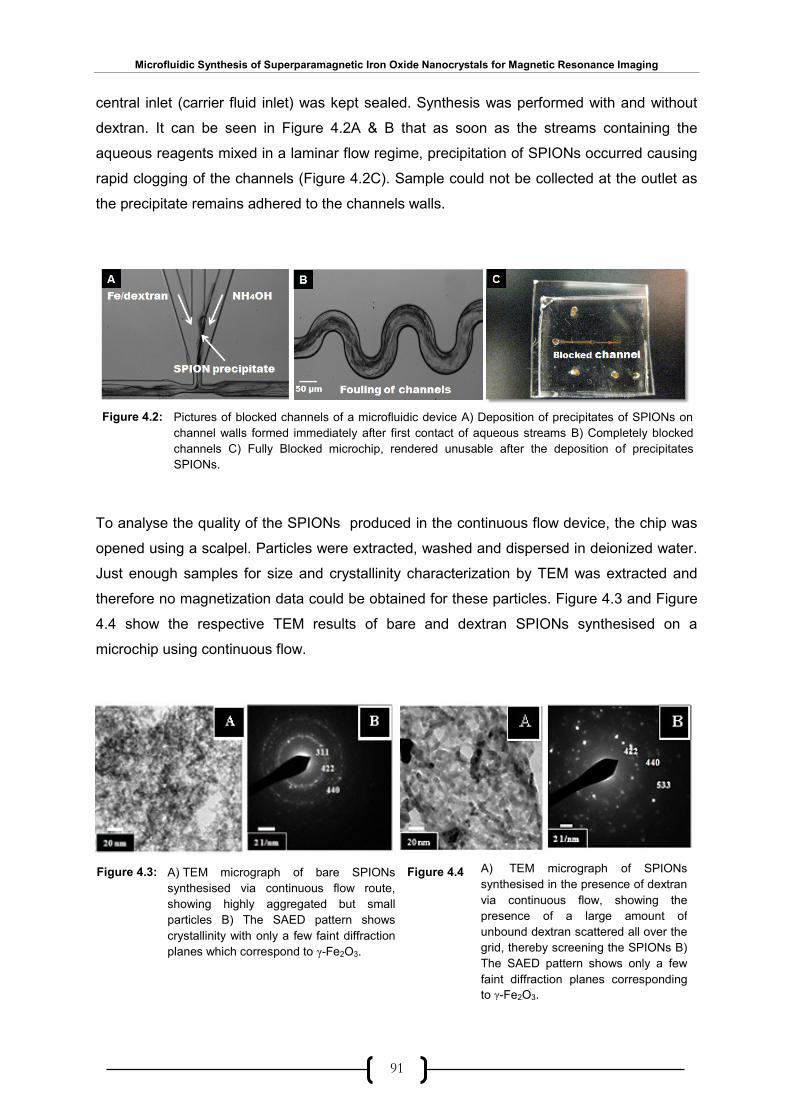
Microfluidic Synthesis of Superparamagnetic Iron Oxide Nanocrystals for Magnetic Resonance Imaging
91
central inlet (carrier fluid inlet) was kept sealed. Synthesis was performed with and without
dextran. It can be seen in Figure 4.2A & B that as soon as the streams containing the
aqueous reagents mixed in a laminar flow regime, precipitation of SPIONs occurred causing
rapid clogging of the channels (Figure 4.2C). Sample could not be collected at the outlet as
the precipitate remains adhered to the channels walls.
To analyse the quality of the SPIONs produced in the continuous flow device, the chip was
opened using a scalpel. Particles were extracted, washed and dispersed in deionized water.
Just enough samples for size and crystallinity characterization by TEM was extracted and
therefore no magnetization data could be obtained for these particles. Figure 4.3 and Figure
4.4 show the respective TEM results of bare and dextran SPIONs synthesised on a
microchip using continuous flow.
Pictures of blocked channels of a microfluidic device A) Deposition of precipitates of SPIONs on
channel walls formed immediately after first contact of aqueous streams B) Completely blocked
channels C) Fully Blocked microchip, rendered unusable after the deposition of precipitates
SPIONs.
A) TEM micrograph of bare SPIONs
synthesised via continuous flow route,
showing highly aggregated but small
particles B) The SAED pattern shows
crystallinity with only a few faint diffraction
planes which correspond to γ-Fe2O3.
A) TEM micrograph of SPIONs
synthesised in the presence of dextran
via continuous flow, showing the
presence of a large amount of
unbound dextran scattered all over the
grid, thereby screening the SPIONs B)
The SAED pattern shows only a few
faint diffraction planes corresponding
to γ-Fe2O3.
Figure 4.2:
Figure 4.3: Figure 4.4
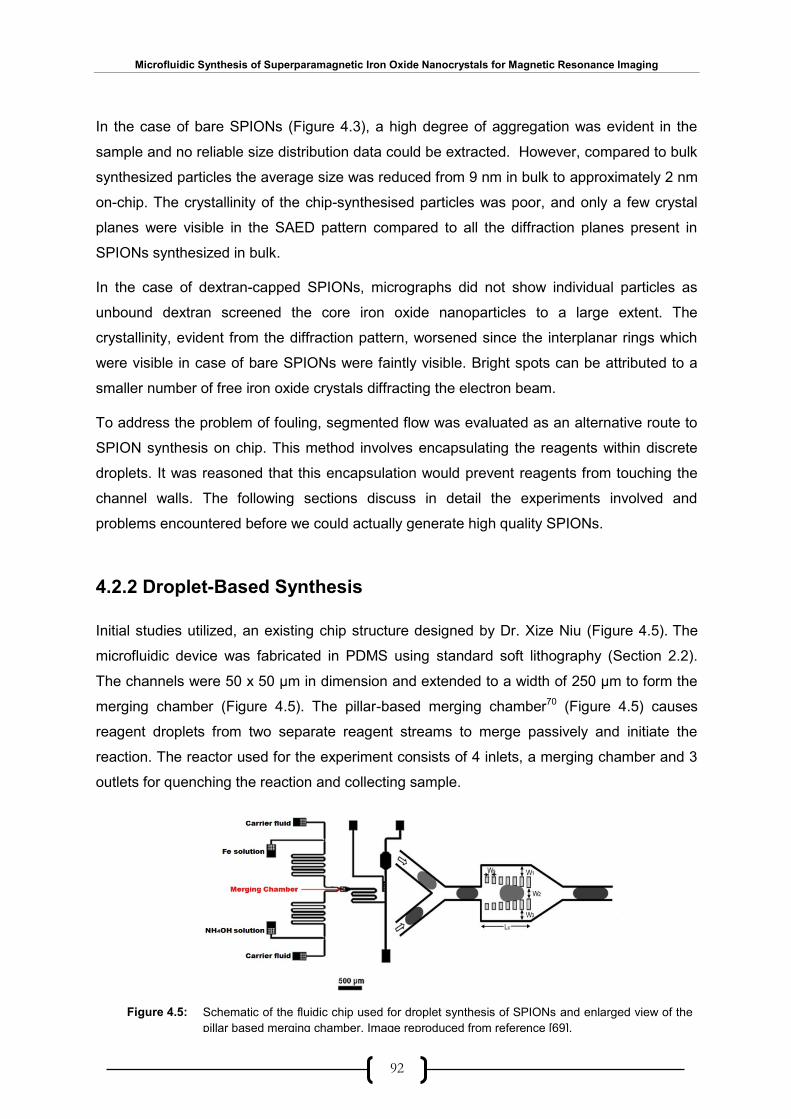
Microfluidic Synthesis of Superparamagnetic Iron Oxide Nanocrystals for Magnetic Resonance Imaging
92
In the case of bare SPIONs (Figure 4.3), a high degree of aggregation was evident in the
sample and no reliable size distribution data could be extracted. However, compared to bulk
synthesized particles the average size was reduced from 9 nm in bulk to approximately 2 nm
on-chip. The crystallinity of the chip-synthesised particles was poor, and only a few crystal
planes were visible in the SAED pattern compared to all the diffraction planes present in
SPIONs synthesized in bulk.
In the case of dextran-capped SPIONs, micrographs did not show individual particles as
unbound dextran screened the core iron oxide nanoparticles to a large extent. The
crystallinity, evident from the diffraction pattern, worsened since the interplanar rings which
were visible in case of bare SPIONs were faintly visible. Bright spots can be attributed to a
smaller number of free iron oxide crystals diffracting the electron beam.
To address the problem of fouling, segmented flow was evaluated as an alternative route to
SPION synthesis on chip. This method involves encapsulating the reagents within discrete
droplets. It was reasoned that this encapsulation would prevent reagents from touching the
channel walls. The following sections discuss in detail the experiments involved and
problems encountered before we could actually generate high quality SPIONs.
4.2.2 Droplet-Based Synthesis
Initial studies utilized, an existing chip structure designed by Dr. Xize Niu (Figure 4.5). The
microfluidic device was fabricated in PDMS using standard soft lithography (Section 2.2).
The channels were 50 x 50 µm in dimension and extended to a width of 250 µm to form the
merging chamber (Figure 4.5). The pillar-based merging chamber70 (Figure 4.5) causes
reagent droplets from two separate reagent streams to merge passively and initiate the
reaction. The reactor used for the experiment consists of 4 inlets, a merging chamber and 3
outlets for quenching the reaction and collecting sample.
Schematic of the fluidic chip used for droplet synthesis of SPIONs and enlarged view of the
pillar based merging chamber. Image reproduced from reference [69].
Figure 4.5:

Microfluidic Synthesis of Superparamagnetic Iron Oxide Nanocrystals for Magnetic Resonance Imaging
93
Segmented-flow reactors have been shown to offer clear advantages over continuous-flow
microfluidic systems, but they also require careful adjustment of parameters such as oil and
aqueous phase infusion rates and chemical composition of aqueous reagents. The
(experimentally determined) stability diagram given in Figure 4.6 shows how the ratio of the
droplet volume Vd to the merging chamber volume Vc, affects the success of droplet fusion at
different volumetric flow rates of water and the carrier fluid (FC40).
Based on the above information, the first step was to generate stable droplets and make
them merge properly. Following this, the synthesis route reported by Frenz et al.69 would be
repeated.
4.3 Droplet Experiments: Preliminary Results
All the droplet experiments used the same aqueous reagents, at the same concentrations as
for the continuous flow studies (Section 4.3). In addition, perfluorocarbon oil, FC40 (Sigma-
Aldrich, UK) along with a surfactant, 1H,1H,2H,2H-Perfluoro-1-octanol, 97%, (Sigma Aldrich,
UK) mixed at 10:1 oil to surfactant ratio, was used as the carrier fluid. The addition of
surfactant to the oil phase helps in lowering the interfacial tension between the oil and the
aqueous phases and reduces the interaction between droplets and channel walls. To
prevent fouling of channels by precipitated SPIONs it was essential to keep them
encapsulated within discrete droplets.
Figure 4.6: Stability diagram correlating the volume ratio Vd/Vc with the volumetric flow rate. In region I no
droplet merging occurs, in region II between 2 and 5 droplets will merge depending on the flow
conditions, and in region III no droplet merging occurs. Image reproduced from reference [69].
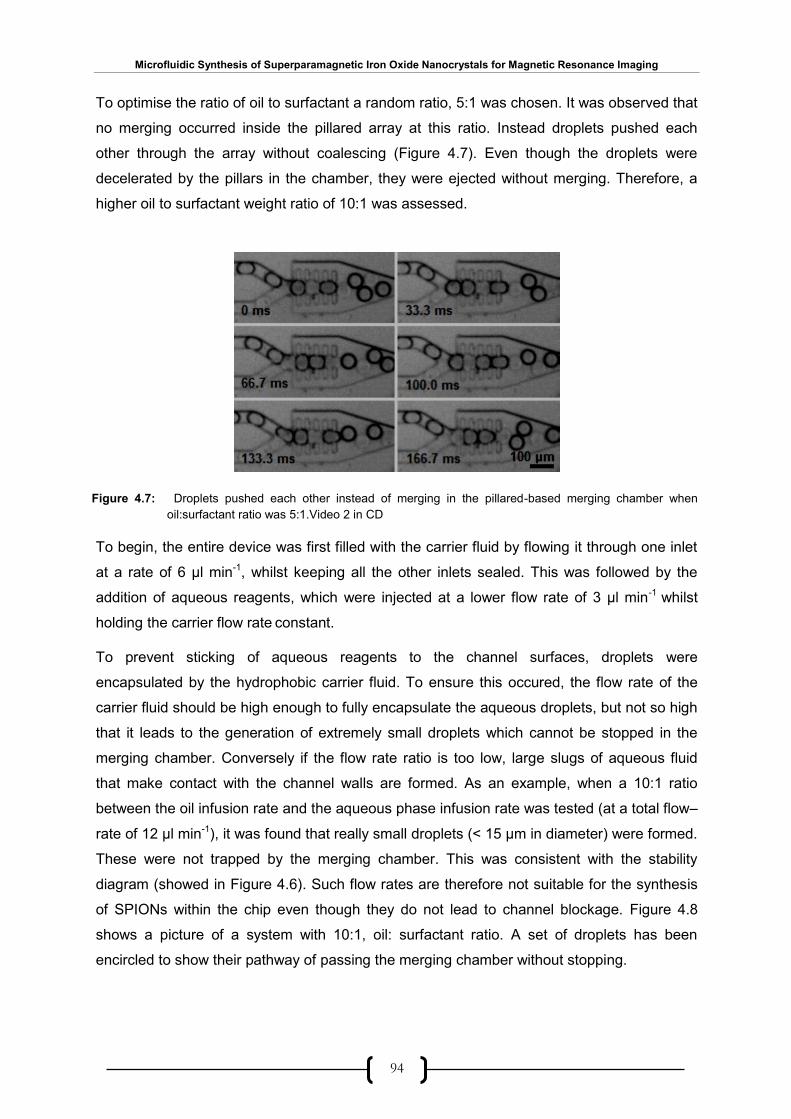
Microfluidic Synthesis of Superparamagnetic Iron Oxide Nanocrystals for Magnetic Resonance Imaging
94
To optimise the ratio of oil to surfactant a random ratio, 5:1 was chosen. It was observed that
no merging occurred inside the pillared array at this ratio. Instead droplets pushed each
other through the array without coalescing (Figure 4.7). Even though the droplets were
decelerated by the pillars in the chamber, they were ejected without merging. Therefore, a
higher oil to surfactant weight ratio of 10:1 was assessed.
To begin, the entire device was first filled with the carrier fluid by flowing it through one inlet
at a rate of 6 µl min-1, whilst keeping all the other inlets sealed. This was followed by the
addition of aqueous reagents, which were injected at a lower flow rate of 3 µl min-1 whilst
holding the carrier flow rate constant.
To prevent sticking of aqueous reagents to the channel surfaces, droplets were
encapsulated by the hydrophobic carrier fluid. To ensure this occured, the flow rate of the
carrier fluid should be high enough to fully encapsulate the aqueous droplets, but not so high
that it leads to the generation of extremely small droplets which cannot be stopped in the
merging chamber. Conversely if the flow rate ratio is too low, large slugs of aqueous fluid
that make contact with the channel walls are formed. As an example, when a 10:1 ratio
between the oil infusion rate and the aqueous phase infusion rate was tested (at a total flow–
rate of 12 µl min-1), it was found that really small droplets (< 15 µm in diameter) were formed.
These were not trapped by the merging chamber. This was consistent with the stability
diagram (showed in Figure 4.6). Such flow rates are therefore not suitable for the synthesis
of SPIONs within the chip even though they do not lead to channel blockage. Figure 4.8
shows a picture of a system with 10:1, oil: surfactant ratio. A set of droplets has been
encircled to show their pathway of passing the merging chamber without stopping.
Figure 4.7: Droplets pushed each other instead of merging in the pillared-based merging chamber when
oil:surfactant ratio was 5:1.Video 2 in CD

Microfluidic Synthesis of Superparamagnetic Iron Oxide Nanocrystals for Magnetic Resonance Imaging
95
.
In order to attain effective merging of droplet pairs within the chamber, the ratio between the
infusion rates of the aqueous and oil phases infusion rate should be within the area II
indicated in the stability diagram (Figure 4.6). The number of droplets merging in the
chamber depends upon the flow rates.
Figure 4.8: Extremely small sized droplets are formed, which do not stop in the merging chamber when oil:
surfactant ratio is 1:10.Video 3 in CD.
Detailed merging sequence of two ammonia droplets and one iron precursor solution droplet.
Droplets are trapped in the merging chamber and flow out after three droplets have merged
together with the SPIONs encapsulated within each droplet. Video 4 in CD.
Figure 4.9
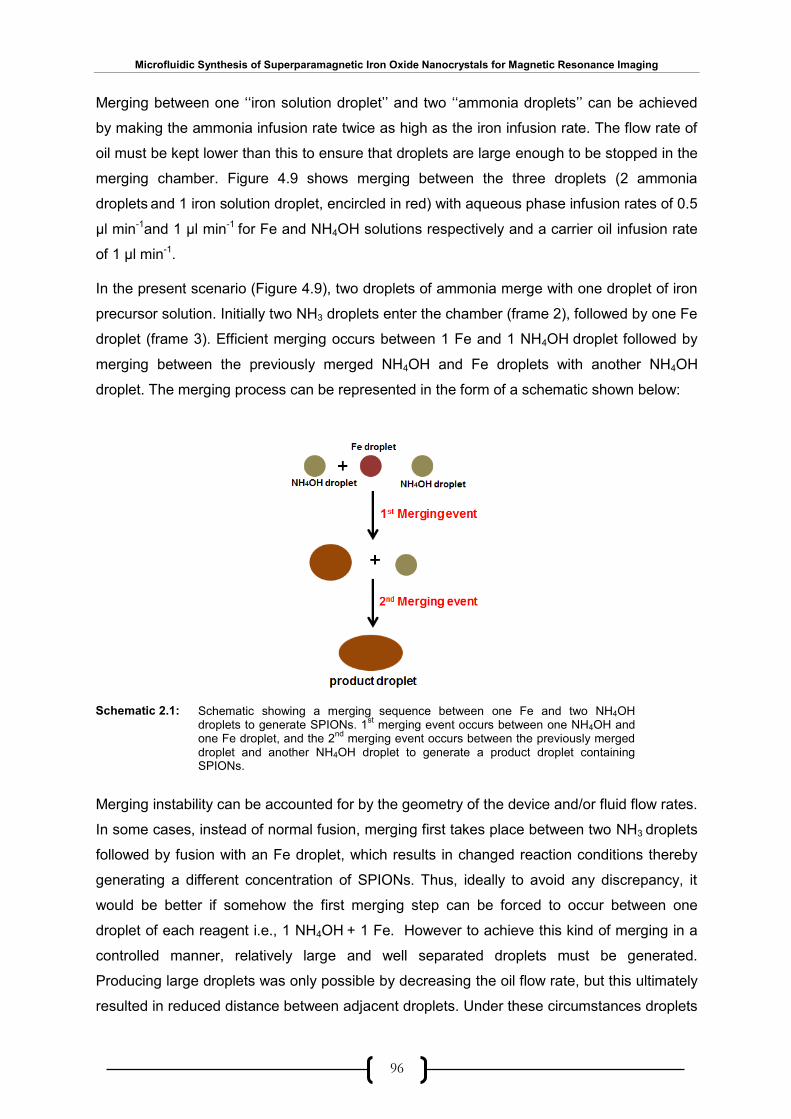
Microfluidic Synthesis of Superparamagnetic Iron Oxide Nanocrystals for Magnetic Resonance Imaging
96
Merging between one ‘‘iron solution droplet’’ and two ‘‘ammonia droplets’’ can be achieved
by making the ammonia infusion rate twice as high as the iron infusion rate. The flow rate of
oil must be kept lower than this to ensure that droplets are large enough to be stopped in the
merging chamber. Figure 4.9 shows merging between the three droplets (2 ammonia
droplets and 1 iron solution droplet, encircled in red) with aqueous phase infusion rates of 0.5
µl min-1and 1 µl min-1 for Fe and NH4OH solutions respectively and a carrier oil infusion rate
of 1 µl min-1.
In the present scenario (Figure 4.9), two droplets of ammonia merge with one droplet of iron
precursor solution. Initially two NH3 droplets enter the chamber (frame 2), followed by one Fe
droplet (frame 3). Efficient merging occurs between 1 Fe and 1 NH4OH droplet followed by
merging between the previously merged NH4OH and Fe droplets with another NH4OH
droplet. The merging process can be represented in the form of a schematic shown below:
Merging instability can be accounted for by the geometry of the device and/or fluid flow rates.
In some cases, instead of normal fusion, merging first takes place between two NH3 droplets
followed by fusion with an Fe droplet, which results in changed reaction conditions thereby
generating a different concentration of SPIONs. Thus, ideally to avoid any discrepancy, it
would be better if somehow the first merging step can be forced to occur between one
droplet of each reagent i.e., 1 NH4OH + 1 Fe. However to achieve this kind of merging in a
controlled manner, relatively large and well separated droplets must be generated.
Producing large droplets was only possible by decreasing the oil flow rate, but this ultimately
resulted in reduced distance between adjacent droplets. Under these circumstances droplets
Schematic 2.1: Schematic showing a merging sequence between one Fe and two NH4OH droplets to generate SPIONs. 1
st merging event occurs between one NH4OH and
one Fe droplet, and the 2nd
merging event occurs between the previously merged droplet and another NH4OH droplet to generate a product droplet containing SPIONs.
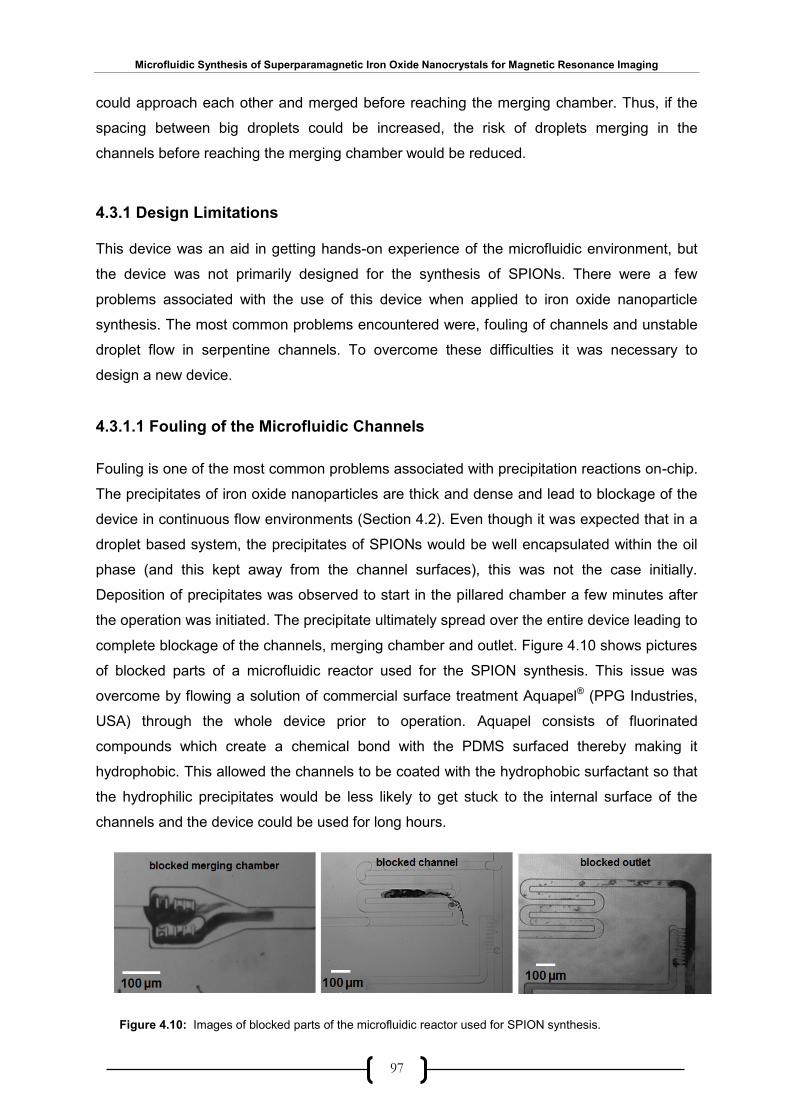
Microfluidic Synthesis of Superparamagnetic Iron Oxide Nanocrystals for Magnetic Resonance Imaging
97
could approach each other and merged before reaching the merging chamber. Thus, if the
spacing between big droplets could be increased, the risk of droplets merging in the
channels before reaching the merging chamber would be reduced.
4.3.1 Design Limitations
This device was an aid in getting hands-on experience of the microfluidic environment, but
the device was not primarily designed for the synthesis of SPIONs. There were a few
problems associated with the use of this device when applied to iron oxide nanoparticle
synthesis. The most common problems encountered were, fouling of channels and unstable
droplet flow in serpentine channels. To overcome these difficulties it was necessary to
design a new device.
4.3.1.1 Fouling of the Microfluidic Channels
Fouling is one of the most common problems associated with precipitation reactions on-chip.
The precipitates of iron oxide nanoparticles are thick and dense and lead to blockage of the
device in continuous flow environments (Section 4.2). Even though it was expected that in a
droplet based system, the precipitates of SPIONs would be well encapsulated within the oil
phase (and this kept away from the channel surfaces), this was not the case initially.
Deposition of precipitates was observed to start in the pillared chamber a few minutes after
the operation was initiated. The precipitate ultimately spread over the entire device leading to
complete blockage of the channels, merging chamber and outlet. Figure 4.10 shows pictures
of blocked parts of a microfluidic reactor used for the SPION synthesis. This issue was
overcome by flowing a solution of commercial surface treatment Aquapel® (PPG Industries,
USA) through the whole device prior to operation. Aquapel consists of fluorinated
compounds which create a chemical bond with the PDMS surfaced thereby making it
hydrophobic. This allowed the channels to be coated with the hydrophobic surfactant so that
the hydrophilic precipitates would be less likely to get stuck to the internal surface of the
channels and the device could be used for long hours.
Figure 4.10: Images of blocked parts of the microfluidic reactor used for SPION synthesis.
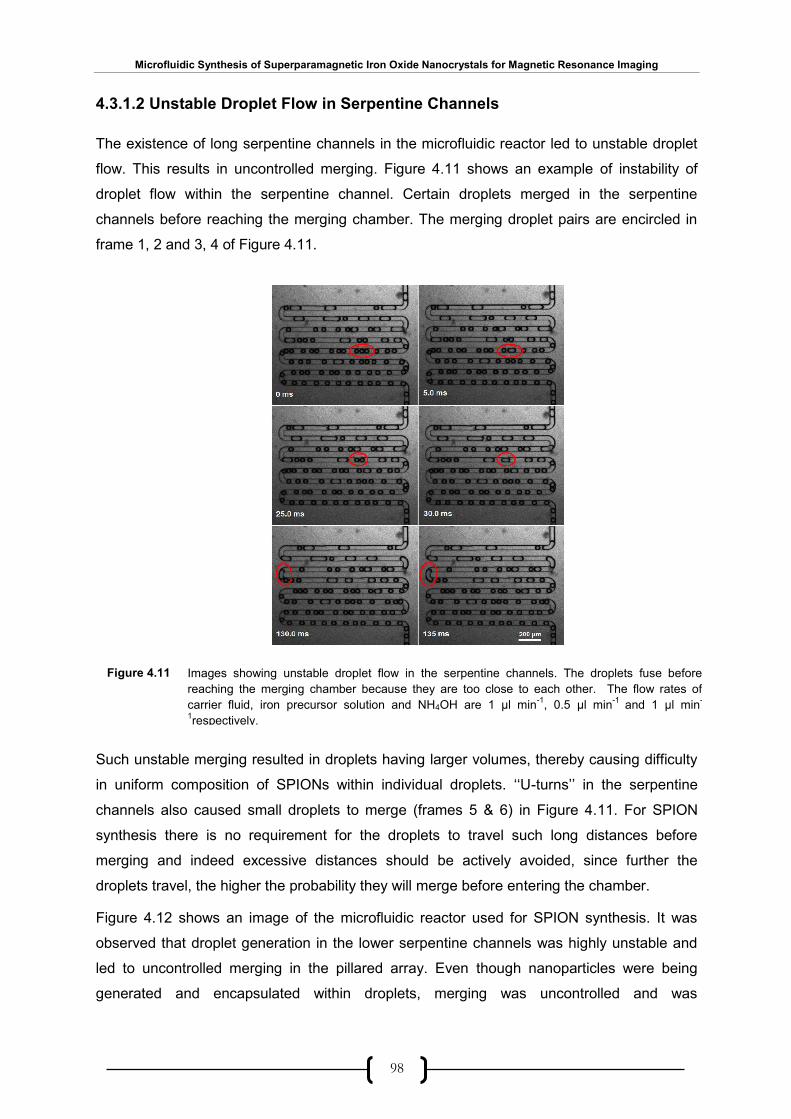
Microfluidic Synthesis of Superparamagnetic Iron Oxide Nanocrystals for Magnetic Resonance Imaging
98
4.3.1.2 Unstable Droplet Flow in Serpentine Channels
The existence of long serpentine channels in the microfluidic reactor led to unstable droplet
flow. This results in uncontrolled merging. Figure 4.11 shows an example of instability of
droplet flow within the serpentine channel. Certain droplets merged in the serpentine
channels before reaching the merging chamber. The merging droplet pairs are encircled in
frame 1, 2 and 3, 4 of Figure 4.11.
Such unstable merging resulted in droplets having larger volumes, thereby causing difficulty
in uniform composition of SPIONs within individual droplets. ‘‘U-turns’’ in the serpentine
channels also caused small droplets to merge (frames 5 & 6) in Figure 4.11. For SPION
synthesis there is no requirement for the droplets to travel such long distances before
merging and indeed excessive distances should be actively avoided, since further the
droplets travel, the higher the probability they will merge before entering the chamber.
Figure 4.12 shows an image of the microfluidic reactor used for SPION synthesis. It was
observed that droplet generation in the lower serpentine channels was highly unstable and
led to uncontrolled merging in the pillared array. Even though nanoparticles were being
generated and encapsulated within droplets, merging was uncontrolled and was
Images showing unstable droplet flow in the serpentine channels. The droplets fuse before
reaching the merging chamber because they are too close to each other. The flow rates of
carrier fluid, iron precursor solution and NH4OH are 1 µl min-1
, 0.5 µl min-1
and 1 µl min-
1respectively.
Figure 4.11
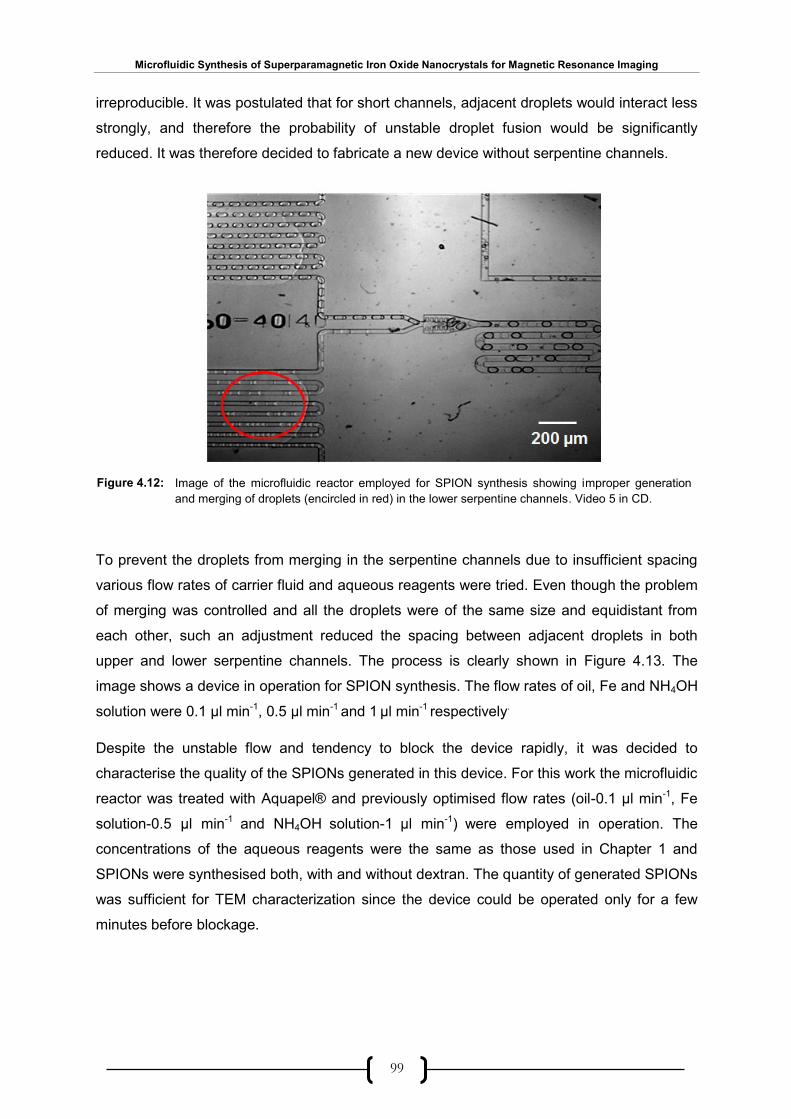
Microfluidic Synthesis of Superparamagnetic Iron Oxide Nanocrystals for Magnetic Resonance Imaging
99
irreproducible. It was postulated that for short channels, adjacent droplets would interact less
strongly, and therefore the probability of unstable droplet fusion would be significantly
reduced. It was therefore decided to fabricate a new device without serpentine channels.
To prevent the droplets from merging in the serpentine channels due to insufficient spacing
various flow rates of carrier fluid and aqueous reagents were tried. Even though the problem
of merging was controlled and all the droplets were of the same size and equidistant from
each other, such an adjustment reduced the spacing between adjacent droplets in both
upper and lower serpentine channels. The process is clearly shown in Figure 4.13. The
image shows a device in operation for SPION synthesis. The flow rates of oil, Fe and NH4OH
solution were 0.1 μl min-1, 0.5 μl min-1 and 1 μl min-1 respectively.
Despite the unstable flow and tendency to block the device rapidly, it was decided to
characterise the quality of the SPIONs generated in this device. For this work the microfluidic
reactor was treated with Aquapel® and previously optimised flow rates (oil-0.1 μl min-1, Fe
solution-0.5 μl min-1 and NH4OH solution-1 μl min-1) were employed in operation. The
concentrations of the aqueous reagents were the same as those used in Chapter 1 and
SPIONs were synthesised both, with and without dextran. The quantity of generated SPIONs
was sufficient for TEM characterization since the device could be operated only for a few
minutes before blockage.
Image of the microfluidic reactor employed for SPION synthesis showing improper generation
and merging of droplets (encircled in red) in the lower serpentine channels. Video 5 in CD.
Figure 4.12:
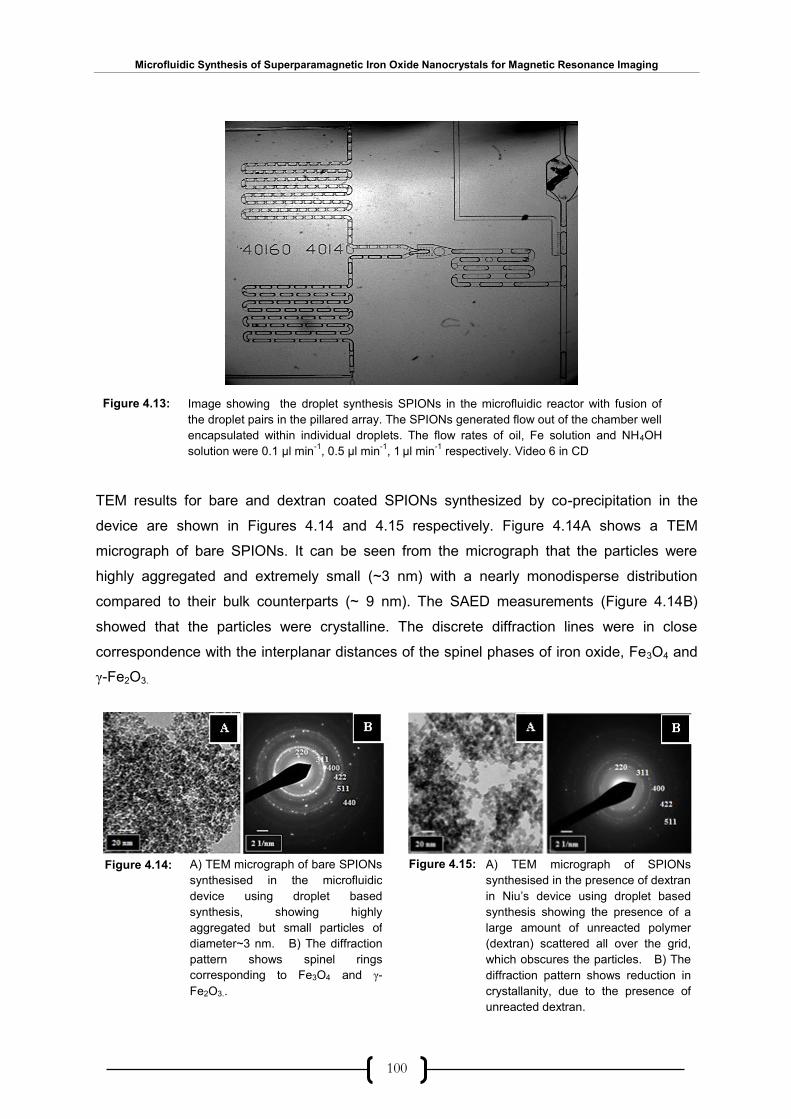
Microfluidic Synthesis of Superparamagnetic Iron Oxide Nanocrystals for Magnetic Resonance Imaging
100
TEM results for bare and dextran coated SPIONs synthesized by co-precipitation in the
device are shown in Figures 4.14 and 4.15 respectively. Figure 4.14A shows a TEM
micrograph of bare SPIONs. It can be seen from the micrograph that the particles were
highly aggregated and extremely small (~3 nm) with a nearly monodisperse distribution
compared to their bulk counterparts (~ 9 nm). The SAED measurements (Figure 4.14B)
showed that the particles were crystalline. The discrete diffraction lines were in close
correspondence with the interplanar distances of the spinel phases of iron oxide, Fe3O4 and
γ-Fe2O3.
Image showing the droplet synthesis SPIONs in the microfluidic reactor with fusion of
the droplet pairs in the pillared array. The SPIONs generated flow out of the chamber well
encapsulated within individual droplets. The flow rates of oil, Fe solution and NH4OH
solution were 0.1 μl min-1
, 0.5 μl min-1
, 1 μl min
-1 respectively. Video 6 in CD
A) TEM micrograph of bare SPIONs
synthesised in the microfluidic
device using droplet based
synthesis, showing highly
aggregated but small particles of
diameter~3 nm. B) The diffraction
pattern shows spinel rings
corresponding to Fe3O4 and γ-
Fe2O3..
A) TEM micrograph of SPIONs
synthesised in the presence of dextran
in Niu’s device using droplet based
synthesis showing the presence of a
large amount of unreacted polymer
(dextran) scattered all over the grid,
which obscures the particles. B) The
diffraction pattern shows reduction in
crystallanity, due to the presence of
unreacted dextran.
Figure 4.13:
Figure 4.14: Figure 4.15:
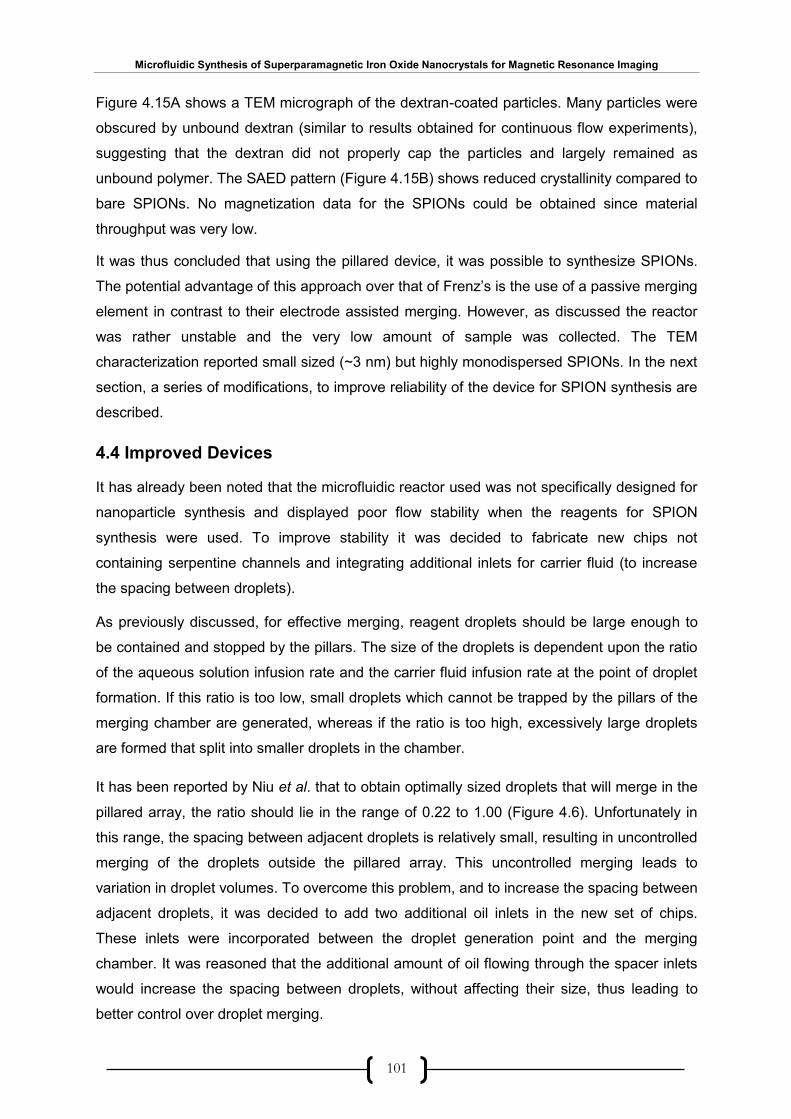
Microfluidic Synthesis of Superparamagnetic Iron Oxide Nanocrystals for Magnetic Resonance Imaging
101
Figure 4.15A shows a TEM micrograph of the dextran-coated particles. Many particles were
obscured by unbound dextran (similar to results obtained for continuous flow experiments),
suggesting that the dextran did not properly cap the particles and largely remained as
unbound polymer. The SAED pattern (Figure 4.15B) shows reduced crystallinity compared to
bare SPIONs. No magnetization data for the SPIONs could be obtained since material
throughput was very low.
It was thus concluded that using the pillared device, it was possible to synthesize SPIONs.
The potential advantage of this approach over that of Frenz’s is the use of a passive merging
element in contrast to their electrode assisted merging. However, as discussed the reactor
was rather unstable and the very low amount of sample was collected. The TEM
characterization reported small sized (~3 nm) but highly monodispersed SPIONs. In the next
section, a series of modifications, to improve reliability of the device for SPION synthesis are
described.
4.4 Improved Devices
It has already been noted that the microfluidic reactor used was not specifically designed for
nanoparticle synthesis and displayed poor flow stability when the reagents for SPION
synthesis were used. To improve stability it was decided to fabricate new chips not
containing serpentine channels and integrating additional inlets for carrier fluid (to increase
the spacing between droplets).
As previously discussed, for effective merging, reagent droplets should be large enough to
be contained and stopped by the pillars. The size of the droplets is dependent upon the ratio
of the aqueous solution infusion rate and the carrier fluid infusion rate at the point of droplet
formation. If this ratio is too low, small droplets which cannot be trapped by the pillars of the
merging chamber are generated, whereas if the ratio is too high, excessively large droplets
are formed that split into smaller droplets in the chamber.
It has been reported by Niu et al. that to obtain optimally sized droplets that will merge in the
pillared array, the ratio should lie in the range of 0.22 to 1.00 (Figure 4.6). Unfortunately in
this range, the spacing between adjacent droplets is relatively small, resulting in uncontrolled
merging of the droplets outside the pillared array. This uncontrolled merging leads to
variation in droplet volumes. To overcome this problem, and to increase the spacing between
adjacent droplets, it was decided to add two additional oil inlets in the new set of chips.
These inlets were incorporated between the droplet generation point and the merging
chamber. It was reasoned that the additional amount of oil flowing through the spacer inlets
would increase the spacing between droplets, without affecting their size, thus leading to
better control over droplet merging.

Microfluidic Synthesis of Superparamagnetic Iron Oxide Nanocrystals for Magnetic Resonance Imaging
102
4.4.1 Spacer Device
The Spacer device was closely based on Niu's design but was modified to be more suitable
for the synthesis of SPIONs. Figure 4.16 shows the schematics of Niu’s design and the new
spacer design side by side. The position of the spacer oil inlets is shown in red. The
serpentine channels are absent and additional oil inlets are incorporated between the droplet
generators and the merging chambers
The main part of this device was the additional 'spacer' oil inlet as shown in Figure 4.16. As
expected the inflowing oil increases the spacing between the droplets. In certain cases the
additional oil causes the droplets to merge together. The flowing spacer oil creates a
pressure in front of the aqueous droplets causing them to slow down. Being slowed down,
the droplets tend to merge. This results in well separated droplets, twice as big in size with
the original droplets. Figure 4.17 shows how the spacing between the incoming droplets is
increased by introducing the extra oil stream. The flow rates used in this case were an oil
infusion rate of 5 μl min-1, spacing oil infusion rate of 5 μl min-1 and a water infusion rate of 5
μl min-1.
AutoCAD drawings of Niu’s design and Spacer design. The distinguishing feature between
the two designs is the absence of serpentine channels and addition of spacer oil inlets.
Picture showing how the spacing between the aqueous droplets is increased along with an
increase in their size which leads to controlled merging within the chamber. The flow rates used
in were; oil infusion rate-5 μl min-1
, spacing oil infusion rate- 5 μl min-1
and a water infusion rate-
5 μl min-1
.Video 7 in CD.
Figure 4.16:
Figure 4.17:

Microfluidic Synthesis of Superparamagnetic Iron Oxide Nanocrystals for Magnetic Resonance Imaging
103
When the spacer device was used for SPION synthesis the space between adjacent droplets
was increased for both iron precursor and ammonia droplets. Figure 4.18 shows the use of
the spacer device for the synthesis of both bare and dextran capped SPIONs under the
same experimental conditions used for all the previous experiments. The new reactor was
able to operate for a much longer period of time without blocking, allowing both size and
magnetic analyses to be performed on the sample. The flow rates used were Fe carrier oil-
0.6 μl min-1, NH4OH carrier oil-0.6 μl min-1, Spacer oil (inlet 1)-2 μl min-1, Spacer oil (inlet 2)-2
μl min-1, Fe solution-3 μl min-1, NH4OH solution-0.8 μl min-1. The total flow rate at the merging
chamber which led to controllable merging of droplet pairs was 10 μl min-1.
The TEM and VSM data for both bare and dextran coated SPIONs synthesized in the spacer
device are shown in Figures 4.19 & 4.20 respectively. It can be clearly seen from the TEM
micrographs (Figure 4.19A & Figure 4.20A) that there was some degree of aggregation for
the bare nanoparticles, whereas the coated ones appear more separated and
monodispersed. There were only a few traces of free dextran in contrast to the large amount
of unbound dextran obtained when using the original pillar-based merging devices. The
average size of the nanoparticles was 3 nm and 3.7 nm for the uncoated and coated
nanoparticles respectively.
The SAED measurements (Figure 4.19B & Figure 4.20B) show the particles to be crystalline,
with the coated ones showing clearer diffraction lines. The discrete diffraction lines obtained
from SAED were in close correspondence with the interplanar distances of the spinel phases
Image of the droplet-based microfluidic ‘‘spacer’ ’device used for the synthesis of SPIONs. The
oil flowing through the spacer inlets increases the spacing between consecutive droplets leading
to controlled merging in the pillared array. Video 8 in CD.
Figure 4.18:
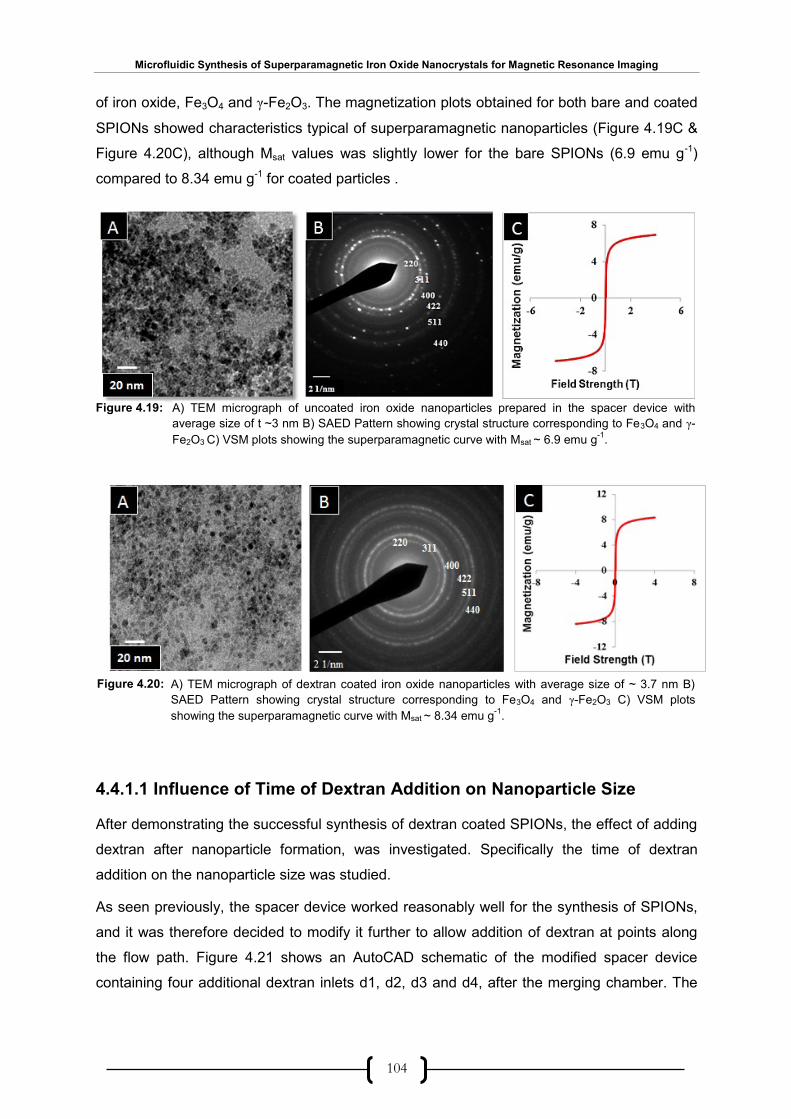
Microfluidic Synthesis of Superparamagnetic Iron Oxide Nanocrystals for Magnetic Resonance Imaging
104
of iron oxide, Fe3O4 and γ-Fe2O3. The magnetization plots obtained for both bare and coated
SPIONs showed characteristics typical of superparamagnetic nanoparticles (Figure 4.19C &
Figure 4.20C), although Msat values was slightly lower for the bare SPIONs (6.9 emu g-1)
compared to 8.34 emu g-1 for coated particles .
4.4.1.1 Influence of Time of Dextran Addition on Nanoparticle Size
After demonstrating the successful synthesis of dextran coated SPIONs, the effect of adding
dextran after nanoparticle formation, was investigated. Specifically the time of dextran
addition on the nanoparticle size was studied.
As seen previously, the spacer device worked reasonably well for the synthesis of SPIONs,
and it was therefore decided to modify it further to allow addition of dextran at points along
the flow path. Figure 4.21 shows an AutoCAD schematic of the modified spacer device
containing four additional dextran inlets d1, d2, d3 and d4, after the merging chamber. The
440
A) TEM micrograph of uncoated iron oxide nanoparticles prepared in the spacer device with
average size of t ~3 nm B) SAED Pattern showing crystal structure corresponding to Fe3O4 and γ-
Fe2O3 C) VSM plots showing the superparamagnetic curve with Msat ~ 6.9 emu g-1
.
A) TEM micrograph of dextran coated iron oxide nanoparticles with average size of ~ 3.7 nm B)
SAED Pattern showing crystal structure corresponding to Fe3O4 and γ-Fe2O3 C) VSM plots
showing the superparamagnetic curve with Msat ~ 8.34 emu g-1
.
Figure 4.19:
Figure 4.20:

Microfluidic Synthesis of Superparamagnetic Iron Oxide Nanocrystals for Magnetic Resonance Imaging
105
length of the channel between each inlet was 5900 μm and the channel cross-sectional
dimensions were 50 X 50 μm.
To study the effect of dextran addition on the growth of SPIONs, the same experimental
conditions (concentrations & flow rates) as those used in the spacer device were employed
(except no dextran was present in the iron precursor solution). In this case a bulk dextran
solution of 0.5 M was prepared separately and was injected from the dextran inlets (d1, d2,
d3, d4, shown). The flow rate of dextran was deliberately chosen to be about 10 times higher
than the oil flow rate to ensure that every droplet, after crossing the merging chamber,
merged with a stream of dextran. Due to the large difference in the flow rates of dextran and
the carrier fluid, elongated dextran droplets were generated. The aqueous droplets already
present in the oil phase merged inside the large dextran droplets. Figure 4.22 shows an
image of SPION droplets downstream of the merging chamber, meeting a dextran stream at
an infusion rate of 20 μl min-1. After fusion with the dextran stream the droplets are still
enclosed within the continuous oil phase.
AutoCAD schematic of the modified spacer device used to study effect of on chip dextran addition
on the size of SPION; 4 dextran inlets are added after the merging chamber.
Dextran addition after the merging chamber, with a dextran flow rate of 20 μl min-1
. The bare
SPIONs after crossing the merging chamber meet the inflowing dextran stream and are thereby
capped with dextran. Video 9 in CD.
Figure 4.21:
Figure 4.22:
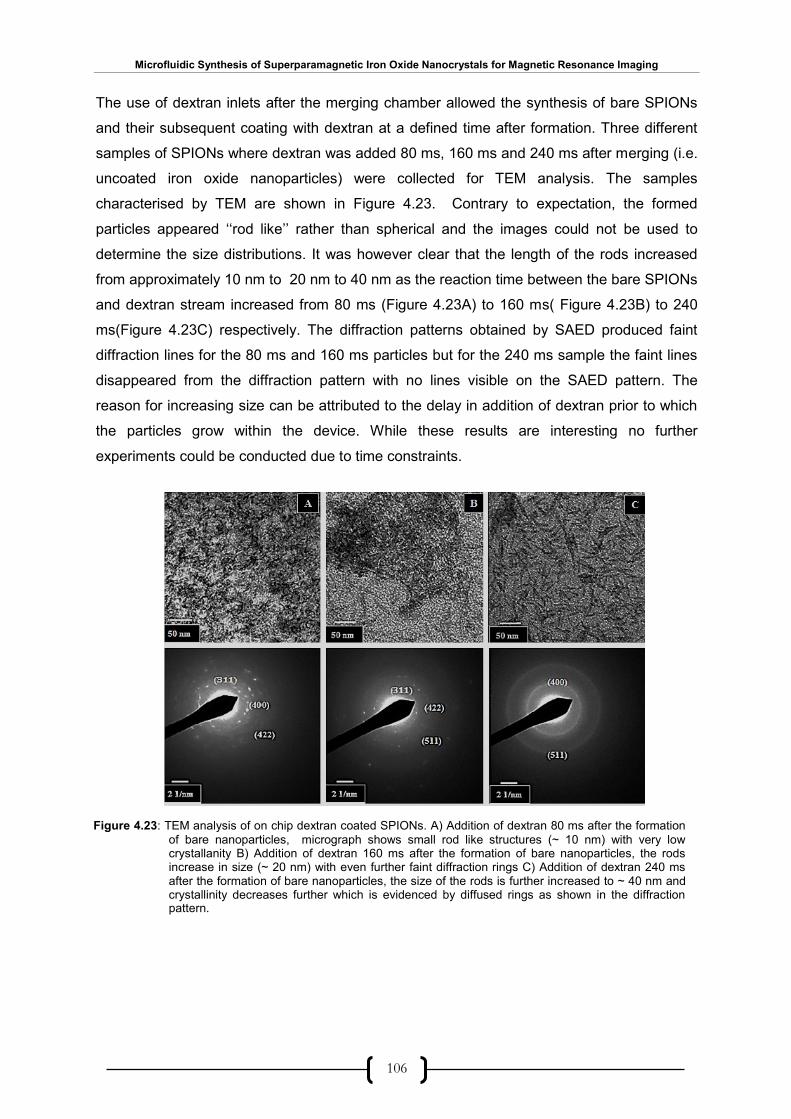
Microfluidic Synthesis of Superparamagnetic Iron Oxide Nanocrystals for Magnetic Resonance Imaging
106
The use of dextran inlets after the merging chamber allowed the synthesis of bare SPIONs
and their subsequent coating with dextran at a defined time after formation. Three different
samples of SPIONs where dextran was added 80 ms, 160 ms and 240 ms after merging (i.e.
uncoated iron oxide nanoparticles) were collected for TEM analysis. The samples
characterised by TEM are shown in Figure 4.23. Contrary to expectation, the formed
particles appeared ‘‘rod like’’ rather than spherical and the images could not be used to
determine the size distributions. It was however clear that the length of the rods increased
from approximately 10 nm to 20 nm to 40 nm as the reaction time between the bare SPIONs
and dextran stream increased from 80 ms (Figure 4.23A) to 160 ms( Figure 4.23B) to 240
ms(Figure 4.23C) respectively. The diffraction patterns obtained by SAED produced faint
diffraction lines for the 80 ms and 160 ms particles but for the 240 ms sample the faint lines
disappeared from the diffraction pattern with no lines visible on the SAED pattern. The
reason for increasing size can be attributed to the delay in addition of dextran prior to which
the particles grow within the device. While these results are interesting no further
experiments could be conducted due to time constraints.
Figure 4.23: TEM analysis of on chip dextran coated SPIONs. A) Addition of dextran 80 ms after the formation
of bare nanoparticles, micrograph shows small rod like structures (~ 10 nm) with very low crystallanity B) Addition of dextran 160 ms after the formation of bare nanoparticles, the rods increase in size (~ 20 nm) with even further faint diffraction rings C) Addition of dextran 240 ms after the formation of bare nanoparticles, the size of the rods is further increased to ~ 40 nm and crystallinity decreases further which is evidenced by diffused rings as shown in the diffraction pattern.

Microfluidic Synthesis of Superparamagnetic Iron Oxide Nanocrystals for Magnetic Resonance Imaging
107
The spacer device with dextran in the precursor solution allows the controlled synthesis of
coated SPIONs of better quality in terms of size and crystallinity, than those synthesised in
bulk using the same co-precipitation reaction. In this device controlled generation and
merging of reagent droplets was well controlled. The mixing of reagent droplets takes place
effectively allowing dextran to cap the nanoparticles rather than remaining unattached as
observed with original pillar-based device. The principal drawback of the spacer device was
that it requires 6 syringe pumps to feed the solutions into the device. Therefore, a simplified
device referred to here as the combined device was fabricated. The details and working of
this device are discussed in the following section.
4.4.2 Combined Device
As discussed previously the spacer device was discarded due to the need for a bulky set up
involving 6 syringe pumps. A new device which was much simpler than the spacer device
was therefore designed and fabricated. An AutoCAD schematic of the new device is shown
in Figure 4.24.
As discussed in Chapter 1, droplet generation and pairing have been reported by Frenz et al.
using the channel geometry shown in Figure 1.16 (Section 1.7.2.3). In their study the authors
used a synchronized merging channel to bring pairs of droplets into contact and then used
electrocoalescence to merge droplets together. The latter step could also be achieved
passively using pillar-based merging chamber (Figure 1.17, section 1.7.2.3). It was therefore
Figure 4.24: AutoCAD schematic of the combined device showing pillar based merging chamber as the
microfluidic reactor. This device consists of three inlets one each for oil, iron /dextran solution
and NH4OH solution.
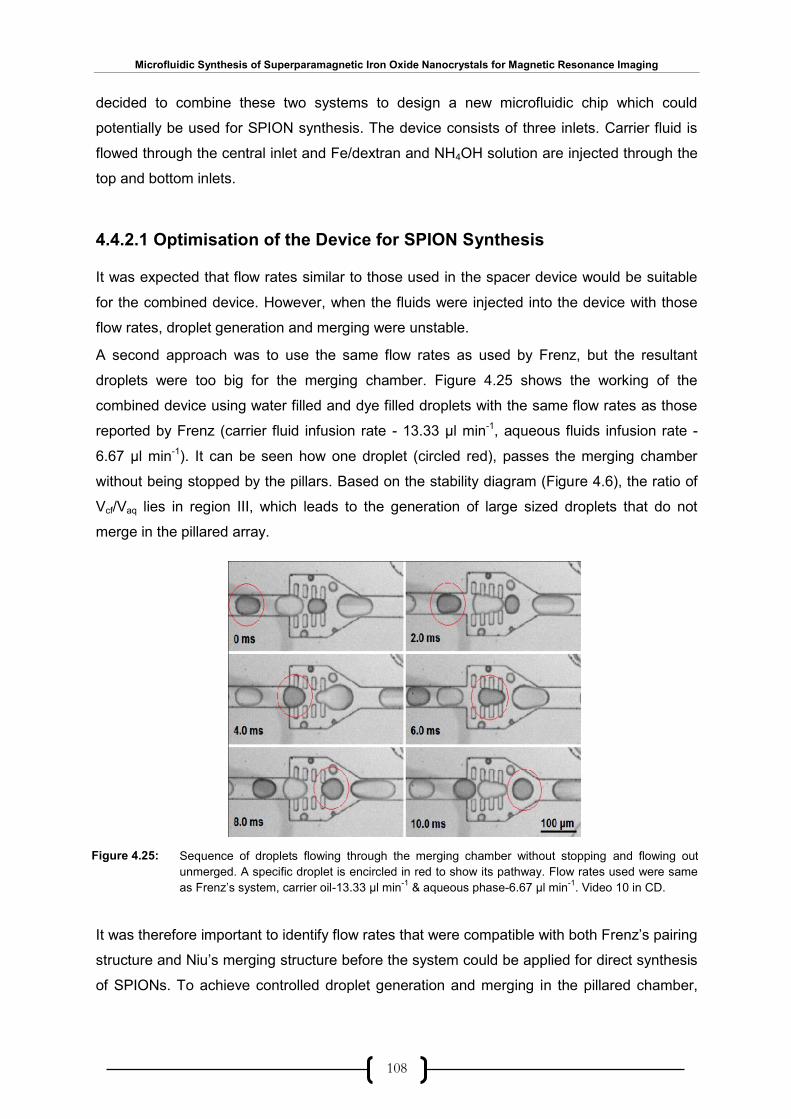
Microfluidic Synthesis of Superparamagnetic Iron Oxide Nanocrystals for Magnetic Resonance Imaging
108
decided to combine these two systems to design a new microfluidic chip which could
potentially be used for SPION synthesis. The device consists of three inlets. Carrier fluid is
flowed through the central inlet and Fe/dextran and NH4OH solution are injected through the
top and bottom inlets.
4.4.2.1 Optimisation of the Device for SPION Synthesis
It was expected that flow rates similar to those used in the spacer device would be suitable
for the combined device. However, when the fluids were injected into the device with those
flow rates, droplet generation and merging were unstable.
A second approach was to use the same flow rates as used by Frenz, but the resultant
droplets were too big for the merging chamber. Figure 4.25 shows the working of the
combined device using water filled and dye filled droplets with the same flow rates as those
reported by Frenz (carrier fluid infusion rate - 13.33 μl min-1, aqueous fluids infusion rate -
6.67 μl min-1). It can be seen how one droplet (circled red), passes the merging chamber
without being stopped by the pillars. Based on the stability diagram (Figure 4.6), the ratio of
Vcf/Vaq lies in region III, which leads to the generation of large sized droplets that do not
merge in the pillared array.
It was therefore important to identify flow rates that were compatible with both Frenz’s pairing
structure and Niu’s merging structure before the system could be applied for direct synthesis
of SPIONs. To achieve controlled droplet generation and merging in the pillared chamber,
Sequence of droplets flowing through the merging chamber without stopping and flowing out
unmerged. A specific droplet is encircled in red to show its pathway. Flow rates used were same
as Frenz’s system, carrier oil-13.33 μl min-1
& aqueous phase-6.67 μl min-1
. Video 10 in CD.
Figure 4.25:

Microfluidic Synthesis of Superparamagnetic Iron Oxide Nanocrystals for Magnetic Resonance Imaging
109
several trials of various flow rates were carried out. After trying different flow conditions,
droplet flow could be reproducibly controlled and stabilised at specific flow rates.
Case 1: Carrier fluid infusion rate: 10.0 μl min-1, Water: 5.0 μl min-1, Dye infusion rate:
5.0 μl min-1
Figure 4.26 shows a series of generation and merging events for water and dye droplets.
Based on the stability diagram, the flow rate ratio of aqueous to carrier fluid flow rates
(Vcf/Vaq = 1) belonged to region II and hence it was expected that the droplets would be of an
appropriate size to be stopped in the merging chamber prior to merging with the following
droplet.
In the present case D1 and D2 are dye filled and water filled droplets respectively. It was
observed that droplets entered the inlet (frame 1 & 2) and merged on first contact as shown
in frame 3. The situation appeared ideal since all the droplets were of the same size and
merged reproducibly. It was therefore decided to use these flow rates for SPION synthesis,
but merging could not be reproducible and so this set of flow rates was discarded.
Images showing sequential merging in a combined device, one droplet each of water and dye
merge before reaching the chamber to form the product (frame 3). All the droplets are equal
sized with similar consistency but the set of flow rates were discarded as the merging occurred
outside the pillared array. Oil infusion rate -10 μl min-1
, water infusion rate - 5 μl min-1
and dye
infusion rate - 5 μl min-1
. Video 11 in CD.
Figure 4.26:
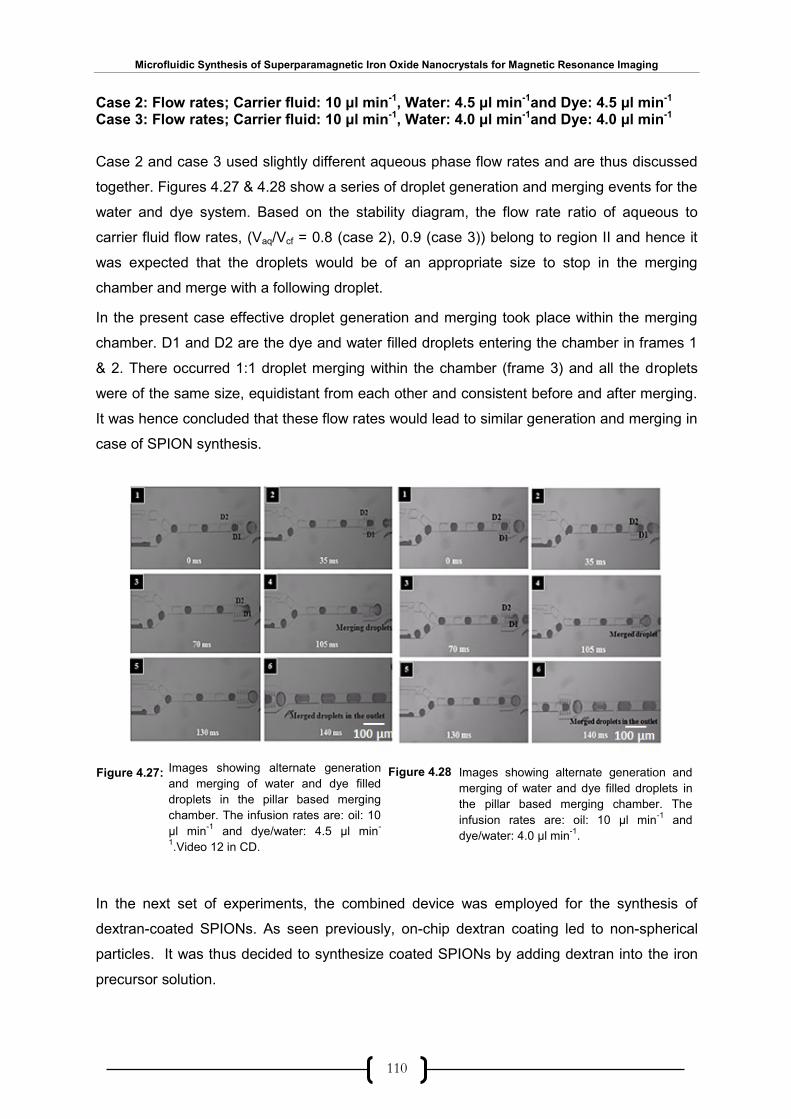
Microfluidic Synthesis of Superparamagnetic Iron Oxide Nanocrystals for Magnetic Resonance Imaging
110
Case 2: Flow rates; Carrier fluid: 10 μl min-1, Water: 4.5 μl min-1and Dye: 4.5 μl min-1 Case 3: Flow rates; Carrier fluid: 10 μl min-1, Water: 4.0 μl min-1and Dye: 4.0 μl min-1
Case 2 and case 3 used slightly different aqueous phase flow rates and are thus discussed
together. Figures 4.27 & 4.28 show a series of droplet generation and merging events for the
water and dye system. Based on the stability diagram, the flow rate ratio of aqueous to
carrier fluid flow rates, (Vaq/Vcf = 0.8 (case 2), 0.9 (case 3)) belong to region II and hence it
was expected that the droplets would be of an appropriate size to stop in the merging
chamber and merge with a following droplet.
In the present case effective droplet generation and merging took place within the merging
chamber. D1 and D2 are the dye and water filled droplets entering the chamber in frames 1
& 2. There occurred 1:1 droplet merging within the chamber (frame 3) and all the droplets
were of the same size, equidistant from each other and consistent before and after merging.
It was hence concluded that these flow rates would lead to similar generation and merging in
case of SPION synthesis.
In the next set of experiments, the combined device was employed for the synthesis of
dextran-coated SPIONs. As seen previously, on-chip dextran coating led to non-spherical
particles. It was thus decided to synthesize coated SPIONs by adding dextran into the iron
precursor solution.
Images showing alternate generation
and merging of water and dye filled
droplets in the pillar based merging
chamber. The infusion rates are: oil: 10
µl min-1
and dye/water: 4.5 µl min-
1.Video 12 in CD.
Images showing alternate generation and
merging of water and dye filled droplets in
the pillar based merging chamber. The
infusion rates are: oil: 10 µl min-1
and
dye/water: 4.0 µl min-1
.
Figure 4.27: Figure 4.28

Microfluidic Synthesis of Superparamagnetic Iron Oxide Nanocrystals for Magnetic Resonance Imaging
111
4.4.3 SPION Synthesis on the Combined Device
Dextran-coated SPIONs were synthesized in an Aquapel® coated combined device using
similar concentrations of the reagents and same set of flow rates (as optimized above) of
carrier fluid and aqueous reagents.
The device was first wetted with carrier fluid flowing at 10 μl min-1 through the middle inlet.
The iron solution containing dextran was then injected through one inlet at an infusion rate of
4.5 μl min-1 followed by injecting NH4OH through the second inlet at an infusion rate of 4.5 μl
min-1. Unfortunately, the device exhibited a few problems such as cross talk (where droplets
of one reagent cross over their channel and start flowing in the stream of other reagent) and
fouling and hence further flow optimization was necessary.
Figure 4.29 shows images of a combined device employed for SPION synthesis that
illustrates the problems of cross talk and fouling. Figure 4.29A shows cross talk. This was
probably because the SPIONs started depositing in the path of continuous oil stream. Figure
4.29B shows a picture of a device where the merging chamber is completely blocked by the
deposited SPIONs.
These difficulties were attributed to the flow rates of the reagents and the carrier fluid. It was
concluded that the flow rates used were inappropriate for SPION synthesis. It was thus
decided to reduce the aqueous flow rates, keeping the oil flow rate high so that it would wet
the channels and keep the droplets encapsulated. The flow rate of NH4OH was however
maintained at a lower level than that of the Fe precursor. If the flow rate of NH4OH was
higher, precipitation would occur immediately (due to the high flow rate of the basic solution)
and would block the chamber instantly.
After considerable experimentation it was established that the new viable infusion rates for
the controlled synthesis of dextran coated SPIONs, leading to 1:1, Fe: NH4OH droplet fusion
within the pillar-based merging chamber were; carrier fluid-10 µl min-1; Fe/dextran solution-
2.5 µl min-1 and NH4OH solution-1 µl min-1 respectively.
Figure 4.29 Pictures showing A) Cross talk and B) Fouling in the merging chamber during the synthesis of SPIONs .
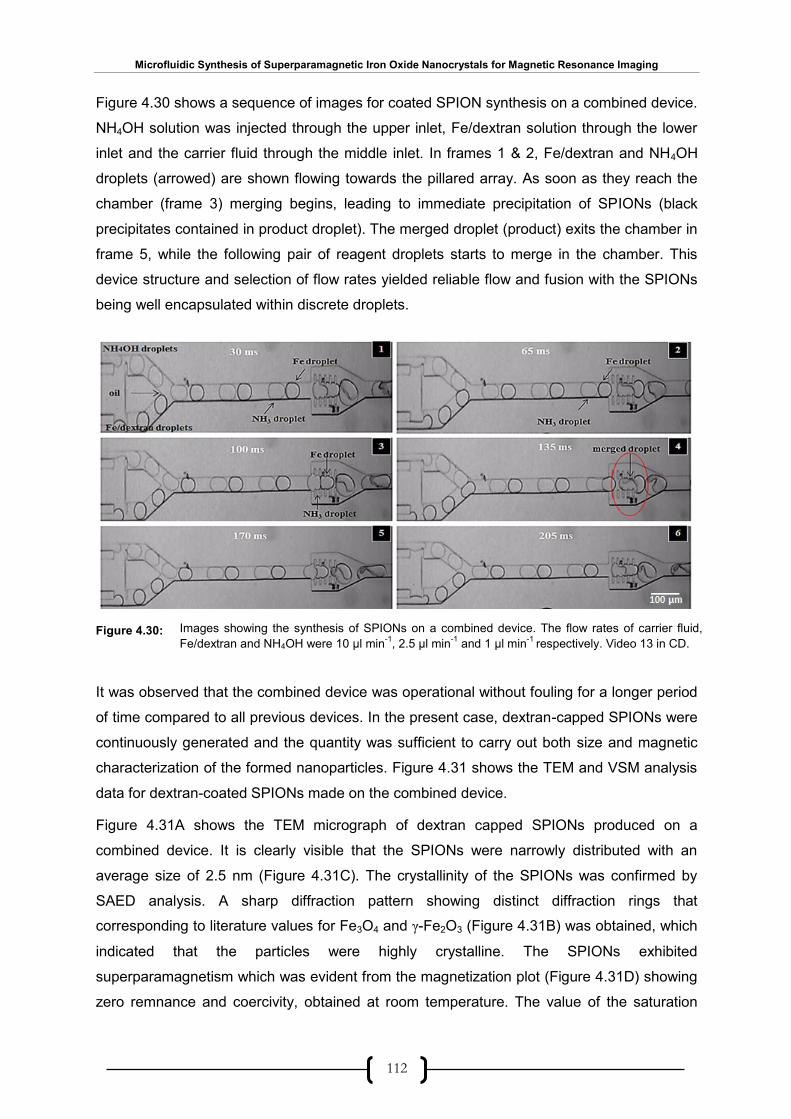
Microfluidic Synthesis of Superparamagnetic Iron Oxide Nanocrystals for Magnetic Resonance Imaging
112
Figure 4.30 shows a sequence of images for coated SPION synthesis on a combined device.
NH4OH solution was injected through the upper inlet, Fe/dextran solution through the lower
inlet and the carrier fluid through the middle inlet. In frames 1 & 2, Fe/dextran and NH4OH
droplets (arrowed) are shown flowing towards the pillared array. As soon as they reach the
chamber (frame 3) merging begins, leading to immediate precipitation of SPIONs (black
precipitates contained in product droplet). The merged droplet (product) exits the chamber in
frame 5, while the following pair of reagent droplets starts to merge in the chamber. This
device structure and selection of flow rates yielded reliable flow and fusion with the SPIONs
being well encapsulated within discrete droplets.
It was observed that the combined device was operational without fouling for a longer period
of time compared to all previous devices. In the present case, dextran-capped SPIONs were
continuously generated and the quantity was sufficient to carry out both size and magnetic
characterization of the formed nanoparticles. Figure 4.31 shows the TEM and VSM analysis
data for dextran-coated SPIONs made on the combined device.
Figure 4.31A shows the TEM micrograph of dextran capped SPIONs produced on a
combined device. It is clearly visible that the SPIONs were narrowly distributed with an
average size of 2.5 nm (Figure 4.31C). The crystallinity of the SPIONs was confirmed by
SAED analysis. A sharp diffraction pattern showing distinct diffraction rings that
corresponding to literature values for Fe3O4 and γ-Fe2O3 (Figure 4.31B) was obtained, which
indicated that the particles were highly crystalline. The SPIONs exhibited
superparamagnetism which was evident from the magnetization plot (Figure 4.31D) showing
zero remnance and coercivity, obtained at room temperature. The value of the saturation
Images showing the synthesis of SPIONs on a combined device. The flow rates of carrier fluid,
Fe/dextran and NH4OH were 10 µl min-1
, 2.5 µl min-1
and 1 µl min-1
respectively. Video 13 in CD. Figure 4.30:
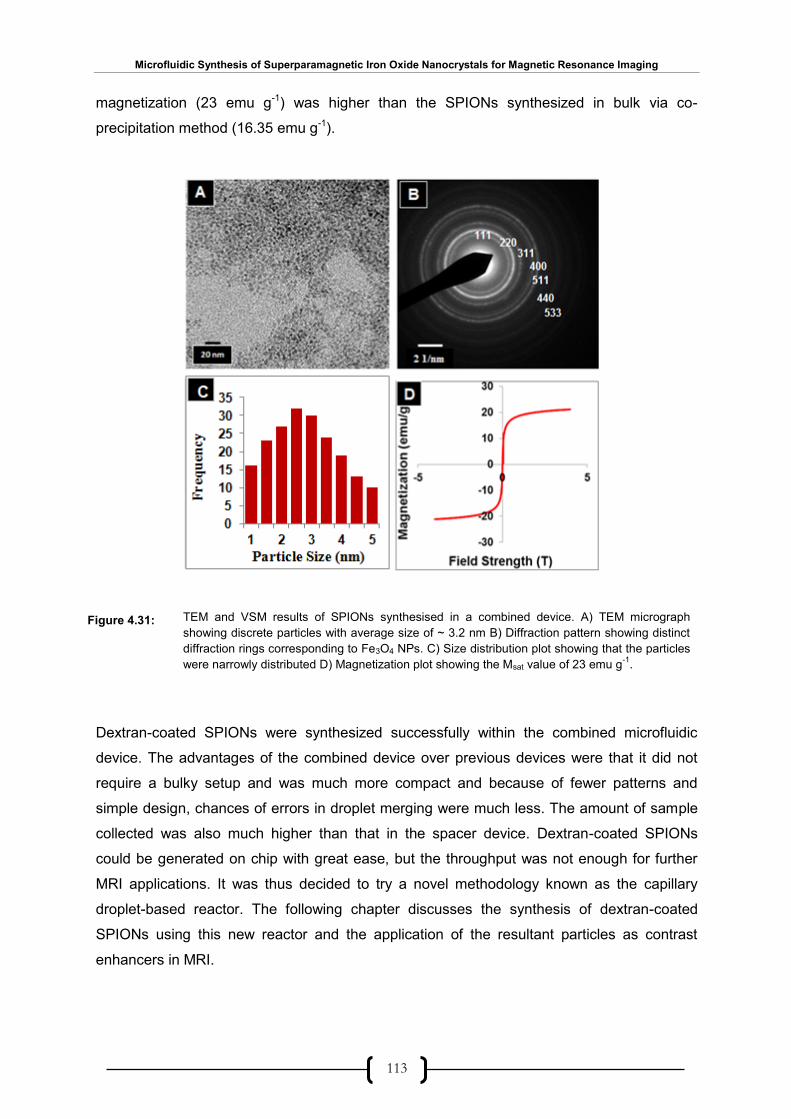
Microfluidic Synthesis of Superparamagnetic Iron Oxide Nanocrystals for Magnetic Resonance Imaging
113
magnetization (23 emu g-1) was higher than the SPIONs synthesized in bulk via co-
precipitation method (16.35 emu g-1).
Dextran-coated SPIONs were synthesized successfully within the combined microfluidic
device. The advantages of the combined device over previous devices were that it did not
require a bulky setup and was much more compact and because of fewer patterns and
simple design, chances of errors in droplet merging were much less. The amount of sample
collected was also much higher than that in the spacer device. Dextran-coated SPIONs
could be generated on chip with great ease, but the throughput was not enough for further
MRI applications. It was thus decided to try a novel methodology known as the capillary
droplet-based reactor. The following chapter discusses the synthesis of dextran-coated
SPIONs using this new reactor and the application of the resultant particles as contrast
enhancers in MRI.
TEM and VSM results of SPIONs synthesised in a combined device. A) TEM micrograph
showing discrete particles with average size of ~ 3.2 nm B) Diffraction pattern showing distinct
diffraction rings corresponding to Fe3O4 NPs. C) Size distribution plot showing that the particles
were narrowly distributed D) Magnetization plot showing the Msat value of 23 emu g-1
.
Figure 4.31:

Microfluidic Synthesis of Superparamagnetic Iron Oxide Nanocrystals for Magnetic Resonance Imaging
114
V
Chapter 5
Synthesis of SPIONs in a
Capillary-Based Droplet Reactor
In this chapter the controlled synthesis of dextran-coated iron oxide nanoparticles in a PTFE
capillary-based reactor using two separate synthetic methods is described. The first, involves
the aqueous co-precipitation method previously described and trialled in Chapters 3 and 4,
and the second uses an organic thermal decomposition method. Highly crystalline particles
with a narrow size distribution and mean diameter of 3.6 nm are obtained using aqueous co-
precipitation method. The particles are evaluated for use in MRI, and found to exhibit a large
saturation magnetisation of 58 emu g-1 and a high T2 relaxivity of 66 mM-1s-1 at 4.7 T,
confirming their suitability as contrast enhancement agents for NMR
The work described in this chapter has been published in Journal of Materials Chemistry, 2012, 22, 4704-4708100
Microfluidic Synthesis of Superparamagnetic Iron Oxide Nanocrystals for Magnetic Resonance Imaging
115
5.1 Introduction
Most reports of nanoparticle synthesis in microreactors have involved a continuous flow
(single-phase) mode of operation, in which continuous (laminar) streams of miscible fluids
are manoeuvred through microscale channels where nucleation and growth of nanoparticles
occurs54. Continuous flow reactors, however, are poorly suited to the synthesis of rapidly
formed nanoparticles such as metal oxides due to their susceptibility to fouling69, 75. An
alternative approach is to use droplet-based reactors in which an immiscible liquid is injected
alongside the reaction mixture causing the latter to spontaneously segregate into a series of
(near) identical droplets59c, 60. The immiscible phase is selected so as to preferentially wet the
channel surface and hence keep the reactants away from the walls, thereby significantly
reducing the risk of fouling. Droplet flow ensures that the reagent mixture is carried through
the channel at a constant linear velocity, thereby eliminating velocity dispersion which
causes particle polydispersity in continuous flow reactors.56
As discussed previously, there have been few reports of iron oxide synthesis in microfluidic
reactors69, 75, 101, of which only one by Frenz and co-workers has utilised droplet flow.
Following Frenz et al69, synthesis of dextran coated SPIONs in a microfluidic device using a
droplet-based microfluidic system was performed in chapter 4. The system utilized for the
present work was similar to that of Frenz but consisted of a simple passive pillar based
methodology for merging droplet pairs. There was however a drawback in using the chip-
based method for synthesising SPIONs. There occurred fouling of channels which made it
essential to coat the channels with a surface treatment (Aquapel®) every time a device was
used. In addition, the maximum operating time of the device was barely sufficient to generate
enough SPIONs for TEM and VSM analysis. The small yields prevented the performance of
MRI studies to assess the suitability of such nanoparticles as contrast enhancers in MRI. To
overcome these drawbacks a passive methodology using a capillary-based droplet reactor
was evaluated for SPION synthesis. In this chapter a simpler passive methodology for
preparing dextran-coated SPIONs in droplets is reported, and the suitability of the particles
for use as MRI contrast agents evaluated. Compared to the method of Frenz et al., and the
methods described in the previous chapter, the capillary-based approach employed for the
synthesis of SPIONs, obviated the need for lithographic fabrication steps, required no
surface modification of the channel walls, and eliminated the need for high voltage power
sources, whilst providing good quality product and high material throughput. Moreover, the
method minimized the broad size distributions typically obtained with the co-precipitation
method102, allowing for the straightforward aqueous production of low polydispersity SPIONs
having high saturation magnetisation and good MRI contrast enhancement properties.

Microfluidic Synthesis of Superparamagnetic Iron Oxide Nanocrystals for Magnetic Resonance Imaging
116
5.2 Capillary-Based Droplet Reactor for Nanocrystal Synthesis
A robust capillary based droplet reactor capable of controllably synthesizing nanoparticles
was designed and developed by Nightingale et al.59c in 2010. The reactor was developed so
that stable droplet flow could be maintained over a wide range of temperature and flow
conditions without causing reactor degradation or fouling. Figure 5.1 shows a schematic of
the system. The capillary based reactor tolerates large flow-rate differentials between
reagent streams, and allows droplet composition to be varied independently of residence
time and volume.
Figure 5.1A shows a schematic of the system for nanoparticle synthesis and
characterisation. This reactor was initially developed to ensure stable droplet flow even at
high temperatures and consisted of three components: a droplet generator, a heated oil bath
and an in-line optical detection for real time analysis for optically active products. Figure 5.1B
illustrates the operation of the droplet generation stage, showing the injection of separate
precursor streams of reagent A and reagent B, into a continuous stream of carrier fluid.
Droplets are formed close to the end of a length of silicone tubing (1 mm i.d.) at the contact
point between two auxiliary capillaries. The capillaries pierce the tubing from opposing sides
and meet at an angle of 90° at the capillary centre, with the silicone forming a tight leak-proof
seal around them. Two separate syringe pumps (PHD 2000, Harvard Instruments) feed the
auxiliary capillaries with reagents A and B, and a third syringe pump maintains a constant
flow of immiscible carrier fluid through the main capillary.
Figure 5.1: A) Schematic of complete system for nanoparticle synthesis and characterisation, comprising droplet
generator, heated oil-bath, and in-line optical detection for real-time analysis B) Close-up of droplet
generation stage. Image reproduced from reference [58c].
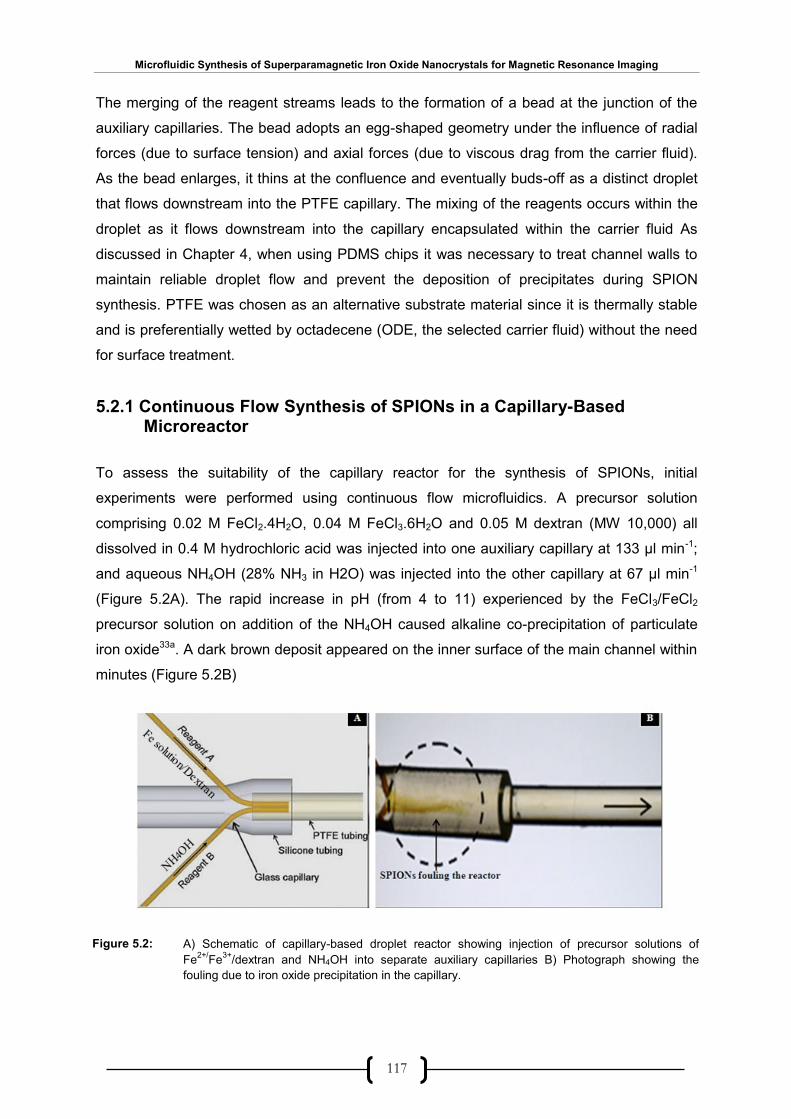
Microfluidic Synthesis of Superparamagnetic Iron Oxide Nanocrystals for Magnetic Resonance Imaging
117
The merging of the reagent streams leads to the formation of a bead at the junction of the
auxiliary capillaries. The bead adopts an egg-shaped geometry under the influence of radial
forces (due to surface tension) and axial forces (due to viscous drag from the carrier fluid).
As the bead enlarges, it thins at the confluence and eventually buds-off as a distinct droplet
that flows downstream into the PTFE capillary. The mixing of the reagents occurs within the
droplet as it flows downstream into the capillary encapsulated within the carrier fluid As
discussed in Chapter 4, when using PDMS chips it was necessary to treat channel walls to
maintain reliable droplet flow and prevent the deposition of precipitates during SPION
synthesis. PTFE was chosen as an alternative substrate material since it is thermally stable
and is preferentially wetted by octadecene (ODE, the selected carrier fluid) without the need
for surface treatment.
5.2.1 Continuous Flow Synthesis of SPIONs in a Capillary-Based Microreactor
To assess the suitability of the capillary reactor for the synthesis of SPIONs, initial
experiments were performed using continuous flow microfluidics. A precursor solution
comprising 0.02 M FeCl2.4H2O, 0.04 M FeCl3.6H2O and 0.05 M dextran (MW 10,000) all
dissolved in 0.4 M hydrochloric acid was injected into one auxiliary capillary at 133 µl min-1;
and aqueous NH4OH (28% NH3 in H2O) was injected into the other capillary at 67 µl min-1
(Figure 5.2A). The rapid increase in pH (from 4 to 11) experienced by the FeCl3/FeCl2
precursor solution on addition of the NH4OH caused alkaline co-precipitation of particulate
iron oxide33a. A dark brown deposit appeared on the inner surface of the main channel within
minutes (Figure 5.2B)
A) Schematic of capillary-based droplet reactor showing injection of precursor solutions of
Fe2+/
Fe3+
/dextran and NH4OH into separate auxiliary capillaries B) Photograph showing the
fouling due to iron oxide precipitation in the capillary.
Figure 5.2:
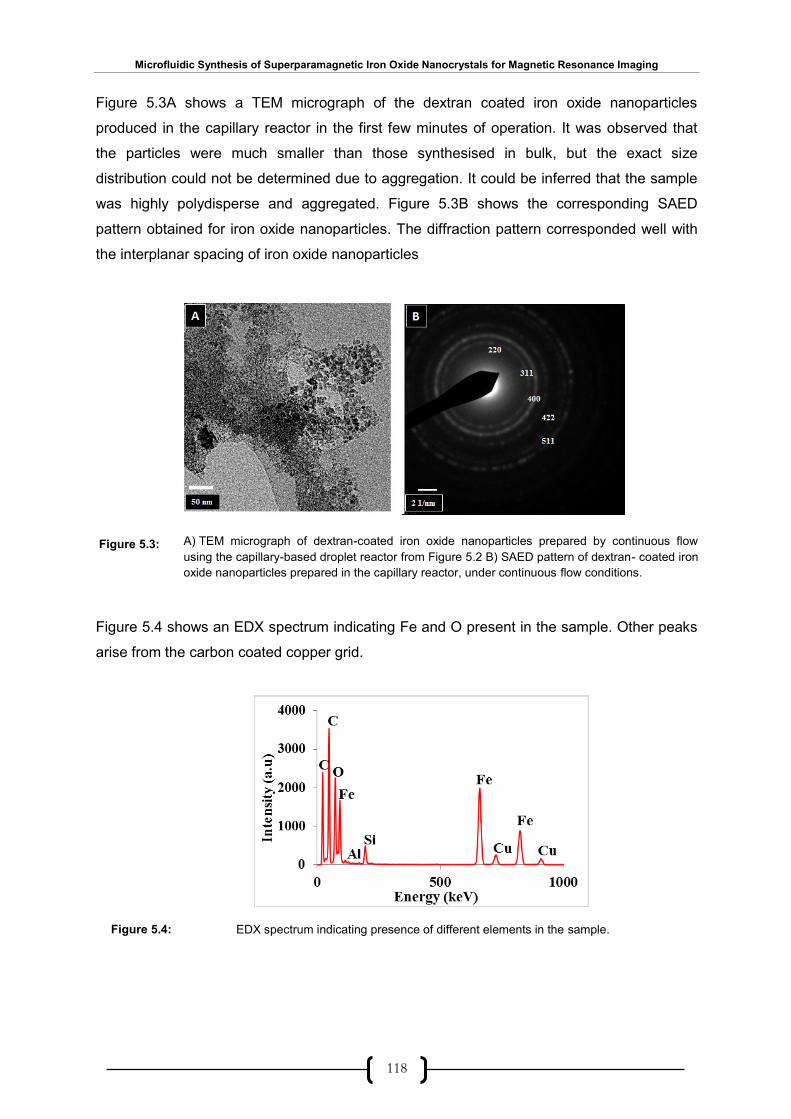
Microfluidic Synthesis of Superparamagnetic Iron Oxide Nanocrystals for Magnetic Resonance Imaging
118
Figure 5.3A shows a TEM micrograph of the dextran coated iron oxide nanoparticles
produced in the capillary reactor in the first few minutes of operation. It was observed that
the particles were much smaller than those synthesised in bulk, but the exact size
distribution could not be determined due to aggregation. It could be inferred that the sample
was highly polydisperse and aggregated. Figure 5.3B shows the corresponding SAED
pattern obtained for iron oxide nanoparticles. The diffraction pattern corresponded well with
the interplanar spacing of iron oxide nanoparticles
Figure 5.4 shows an EDX spectrum indicating Fe and O present in the sample. Other peaks
arise from the carbon coated copper grid.
A) TEM micrograph of dextran-coated iron oxide nanoparticles prepared by continuous flow
using the capillary-based droplet reactor from Figure 5.2 B) SAED pattern of dextran- coated iron
oxide nanoparticles prepared in the capillary reactor, under continuous flow conditions.
EDX spectrum indicating presence of different elements in the sample.
Figure 5.3:
Figure 5.4:
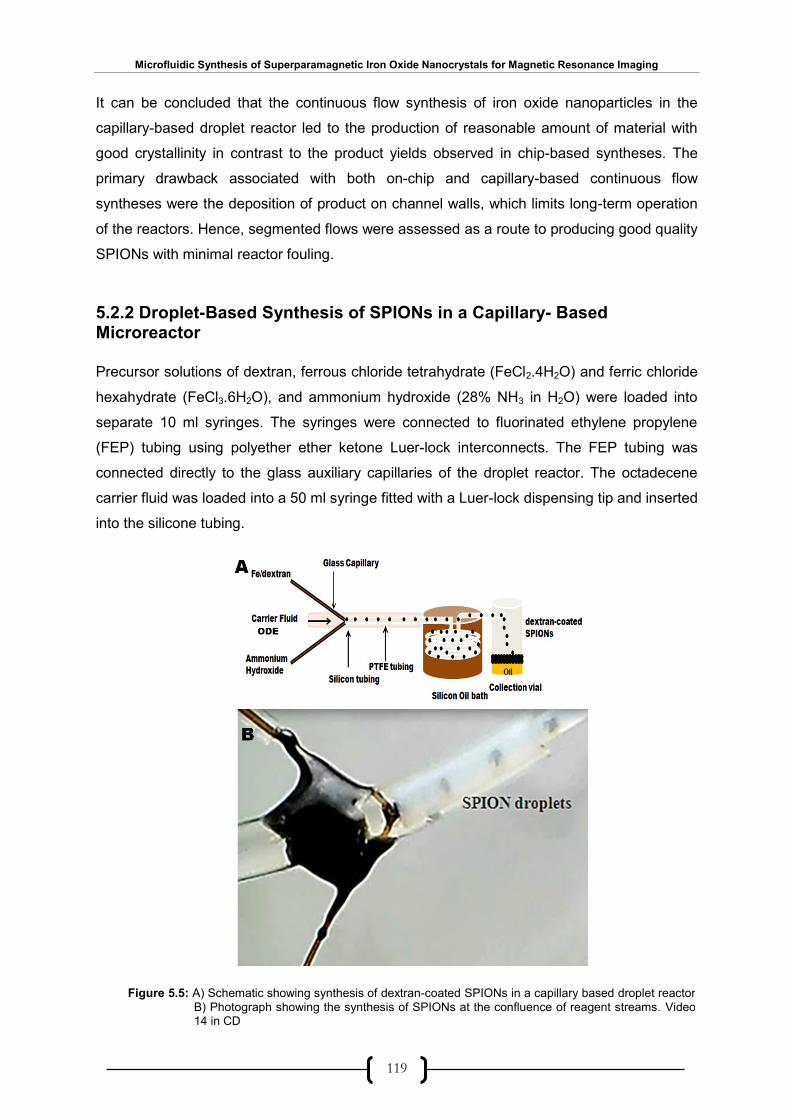
Microfluidic Synthesis of Superparamagnetic Iron Oxide Nanocrystals for Magnetic Resonance Imaging
119
It can be concluded that the continuous flow synthesis of iron oxide nanoparticles in the
capillary-based droplet reactor led to the production of reasonable amount of material with
good crystallinity in contrast to the product yields observed in chip-based syntheses. The
primary drawback associated with both on-chip and capillary-based continuous flow
syntheses were the deposition of product on channel walls, which limits long-term operation
of the reactors. Hence, segmented flows were assessed as a route to producing good quality
SPIONs with minimal reactor fouling.
5.2.2 Droplet-Based Synthesis of SPIONs in a Capillary- Based Microreactor
Precursor solutions of dextran, ferrous chloride tetrahydrate (FeCl2.4H2O) and ferric chloride
hexahydrate (FeCl3.6H2O), and ammonium hydroxide (28% NH3 in H2O) were loaded into
separate 10 ml syringes. The syringes were connected to fluorinated ethylene propylene
(FEP) tubing using polyether ether ketone Luer-lock interconnects. The FEP tubing was
connected directly to the glass auxiliary capillaries of the droplet reactor. The octadecene
carrier fluid was loaded into a 50 ml syringe fitted with a Luer-lock dispensing tip and inserted
into the silicone tubing.
Figure 5.5: A) Schematic showing synthesis of dextran-coated SPIONs in a capillary based droplet reactor
B) Photograph showing the synthesis of SPIONs at the confluence of reagent streams. Video 14 in CD

Microfluidic Synthesis of Superparamagnetic Iron Oxide Nanocrystals for Magnetic Resonance Imaging
120
From the capillary reactor, droplets were carried downstream at a velocity of 1.7 cm s-1 into a
4 m section of capillary, immersed in a 60°C oil bath to aid particle growth and
crystallisation.16a,103 Importantly the growing particles remained fully compartmentalised
within the droplets as they passed along the length of the capillary and showed no tendency
to coat the channel walls, in contrast to the single phase mode of operation described
previously. Figure 5.6 shows a photographic comparison of the two modes of operation. In
continuous flow, iron oxide particles were seen to deposit on the channel walls within 4
minutes, whereas no such deposition was observed for droplet-based operation.
For the droplet-based experiments, the effluent was collected at the capillary outlet over a
period of three hours, after which the organic carrier phase was removed by decantation and
the remaining aqueous solution purified for analysis. For comparison, non-coated particles
were also synthesised in droplet-flow by omitting the dextran from the iron precursor solution.
Figure 5.6: Photographs comparing the synthesis of iron oxide under continuous (left) and droplet (right)
modes of operation. Visible deposition of iron-oxide on the channel walls is evident after just one
minute when the reactor is operating in continuous flow. No deposition is seen in droplet flow.
Videos 15 and 16 in CD.
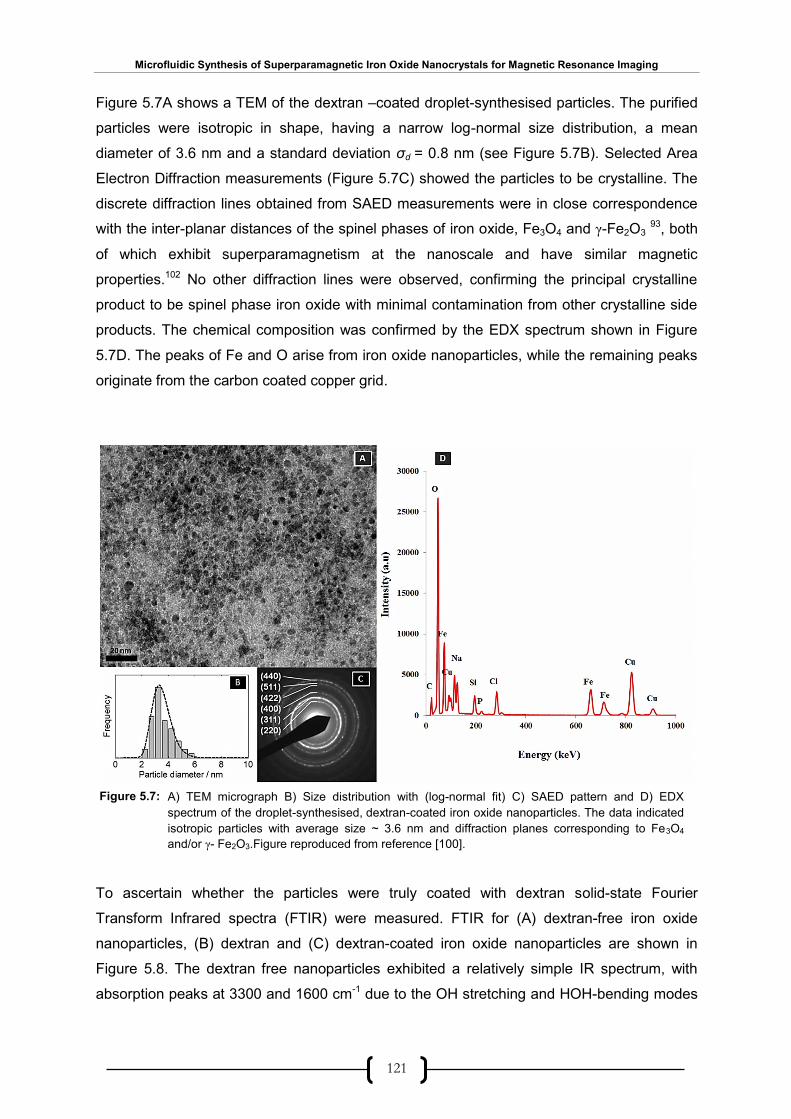
Microfluidic Synthesis of Superparamagnetic Iron Oxide Nanocrystals for Magnetic Resonance Imaging
121
Figure 5.7A shows a TEM of the dextran –coated droplet-synthesised particles. The purified
particles were isotropic in shape, having a narrow log-normal size distribution, a mean
diameter of 3.6 nm and a standard deviation σd = 0.8 nm (see Figure 5.7B). Selected Area
Electron Diffraction measurements (Figure 5.7C) showed the particles to be crystalline. The
discrete diffraction lines obtained from SAED measurements were in close correspondence
with the inter-planar distances of the spinel phases of iron oxide, Fe3O4 and γ-Fe2O3 93, both
of which exhibit superparamagnetism at the nanoscale and have similar magnetic
properties.102 No other diffraction lines were observed, confirming the principal crystalline
product to be spinel phase iron oxide with minimal contamination from other crystalline side
products. The chemical composition was confirmed by the EDX spectrum shown in Figure
5.7D. The peaks of Fe and O arise from iron oxide nanoparticles, while the remaining peaks
originate from the carbon coated copper grid.
To ascertain whether the particles were truly coated with dextran solid-state Fourier
Transform Infrared spectra (FTIR) were measured. FTIR for (A) dextran-free iron oxide
nanoparticles, (B) dextran and (C) dextran-coated iron oxide nanoparticles are shown in
Figure 5.8. The dextran free nanoparticles exhibited a relatively simple IR spectrum, with
absorption peaks at 3300 and 1600 cm-1 due to the OH stretching and HOH-bending modes
Figure 5.7: A) TEM micrograph B) Size distribution with (log-normal fit) C) SAED pattern and D) EDX
spectrum of the droplet-synthesised, dextran-coated iron oxide nanoparticles. The data indicated
isotropic particles with average size ~ 3.6 nm and diffraction planes corresponding to Fe3O4
and/or γ- Fe2O3.Figure reproduced from reference [100].
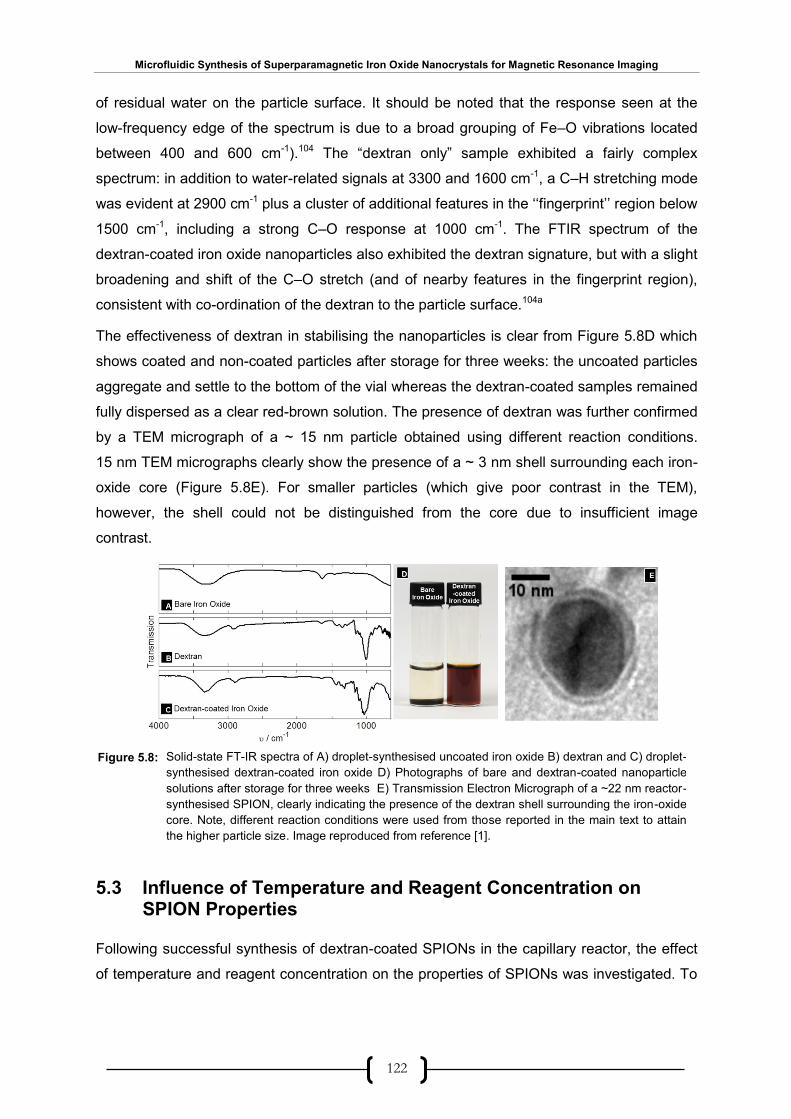
Microfluidic Synthesis of Superparamagnetic Iron Oxide Nanocrystals for Magnetic Resonance Imaging
122
of residual water on the particle surface. It should be noted that the response seen at the
low-frequency edge of the spectrum is due to a broad grouping of Fe–O vibrations located
between 400 and 600 cm-1).104 The “dextran only” sample exhibited a fairly complex
spectrum: in addition to water-related signals at 3300 and 1600 cm-1, a C–H stretching mode
was evident at 2900 cm-1 plus a cluster of additional features in the ‘‘fingerprint’’ region below
1500 cm-1, including a strong C–O response at 1000 cm-1. The FTIR spectrum of the
dextran-coated iron oxide nanoparticles also exhibited the dextran signature, but with a slight
broadening and shift of the C–O stretch (and of nearby features in the fingerprint region),
consistent with co-ordination of the dextran to the particle surface.104a
The effectiveness of dextran in stabilising the nanoparticles is clear from Figure 5.8D which
shows coated and non-coated particles after storage for three weeks: the uncoated particles
aggregate and settle to the bottom of the vial whereas the dextran-coated samples remained
fully dispersed as a clear red-brown solution. The presence of dextran was further confirmed
by a TEM micrograph of a ~ 15 nm particle obtained using different reaction conditions.
15 nm TEM micrographs clearly show the presence of a ~ 3 nm shell surrounding each iron-
oxide core (Figure 5.8E). For smaller particles (which give poor contrast in the TEM),
however, the shell could not be distinguished from the core due to insufficient image
contrast.
5.3 Influence of Temperature and Reagent Concentration on SPION Properties
Following successful synthesis of dextran-coated SPIONs in the capillary reactor, the effect
of temperature and reagent concentration on the properties of SPIONs was investigated. To
Figure 5.8:
Solid-state FT-IR spectra of A) droplet-synthesised uncoated iron oxide B) dextran and C) droplet-
synthesised dextran-coated iron oxide D) Photographs of bare and dextran-coated nanoparticle
solutions after storage for three weeks E) Transmission Electron Micrograph of a ~22 nm reactor-
synthesised SPION, clearly indicating the presence of the dextran shell surrounding the iron-oxide
core. Note, different reaction conditions were used from those reported in the main text to attain
the higher particle size. Image reproduced from reference [1].
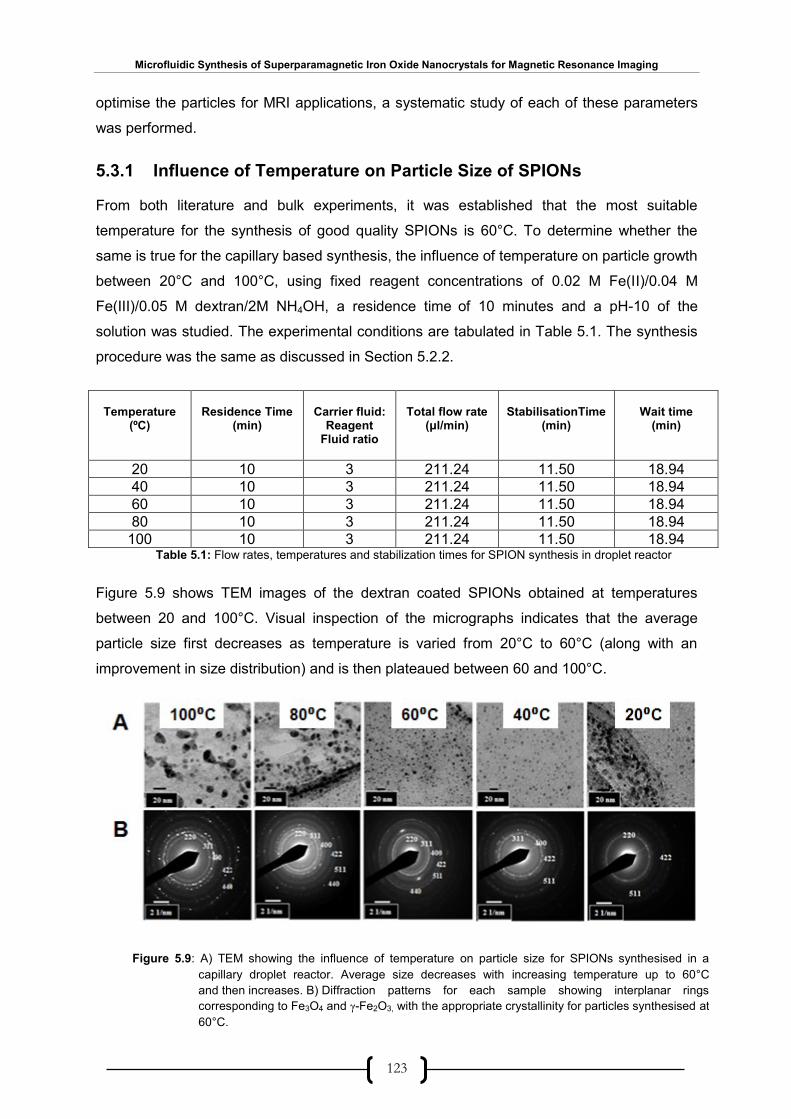
Microfluidic Synthesis of Superparamagnetic Iron Oxide Nanocrystals for Magnetic Resonance Imaging
123
optimise the particles for MRI applications, a systematic study of each of these parameters
was performed.
5.3.1 Influence of Temperature on Particle Size of SPIONs
From both literature and bulk experiments, it was established that the most suitable
temperature for the synthesis of good quality SPIONs is 60°C. To determine whether the
same is true for the capillary based synthesis, the influence of temperature on particle growth
between 20°C and 100°C, using fixed reagent concentrations of 0.02 M Fe(II)/0.04 M
Fe(III)/0.05 M dextran/2M NH4OH, a residence time of 10 minutes and a pH-10 of the
solution was studied. The experimental conditions are tabulated in Table 5.1. The synthesis
procedure was the same as discussed in Section 5.2.2.
Table 5.1: Flow rates, temperatures and stabilization times for SPION synthesis in droplet reactor
Figure 5.9 shows TEM images of the dextran coated SPIONs obtained at temperatures
between 20 and 100°C. Visual inspection of the micrographs indicates that the average
particle size first decreases as temperature is varied from 20°C to 60°C (along with an
improvement in size distribution) and is then plateaued between 60 and 100°C.
Temperature
(ºC)
Residence Time
(min)
Carrier fluid:
Reagent Fluid ratio
Total flow rate
(μl/min)
StabilisationTime
(min)
Wait time
(min)
20 10 3 211.24 11.50 18.94
40 10 3 211.24 11.50 18.94
60 10 3 211.24 11.50 18.94
80 10 3 211.24 11.50 18.94
100 10 3 211.24 11.50 18.94
Figure 5.9: A) TEM showing the influence of temperature on particle size for SPIONs synthesised in a
capillary droplet reactor. Average size decreases with increasing temperature up to 60°C
and then increases. B) Diffraction patterns for each sample showing interplanar rings
corresponding to Fe3O4 and γ-Fe2O3, with the appropriate crystallinity for particles synthesised at
60°C.
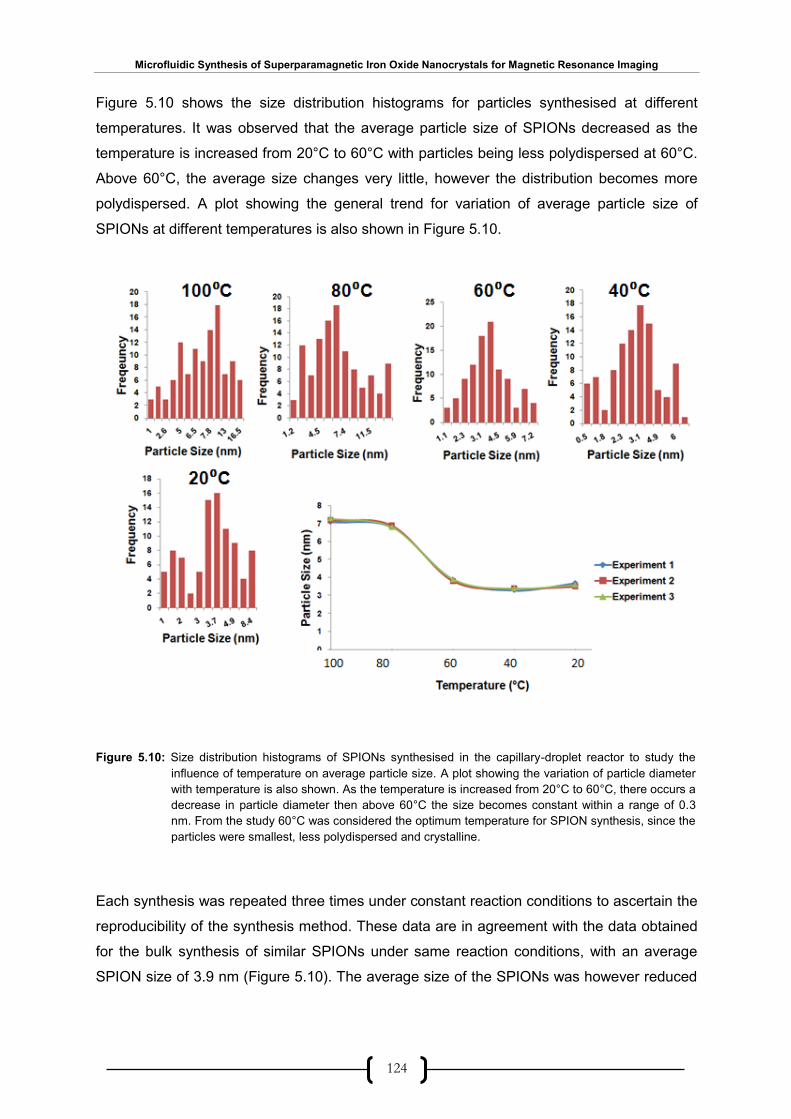
Microfluidic Synthesis of Superparamagnetic Iron Oxide Nanocrystals for Magnetic Resonance Imaging
124
Figure 5.10 shows the size distribution histograms for particles synthesised at different
temperatures. It was observed that the average particle size of SPIONs decreased as the
temperature is increased from 20°C to 60°C with particles being less polydispersed at 60°C.
Above 60°C, the average size changes very little, however the distribution becomes more
polydispersed. A plot showing the general trend for variation of average particle size of
SPIONs at different temperatures is also shown in Figure 5.10.
Each synthesis was repeated three times under constant reaction conditions to ascertain the
reproducibility of the synthesis method. These data are in agreement with the data obtained
for the bulk synthesis of similar SPIONs under same reaction conditions, with an average
SPION size of 3.9 nm (Figure 5.10). The average size of the SPIONs was however reduced
Figure 5.10: Size distribution histograms of SPIONs synthesised in the capillary-droplet reactor to study the
influence of temperature on average particle size. A plot showing the variation of particle diameter
with temperature is also shown. As the temperature is increased from 20°C to 60°C, there occurs a
decrease in particle diameter then above 60°C the size becomes constant within a range of 0.3
nm. From the study 60°C was considered the optimum temperature for SPION synthesis, since the
particles were smallest, less polydispersed and crystalline.
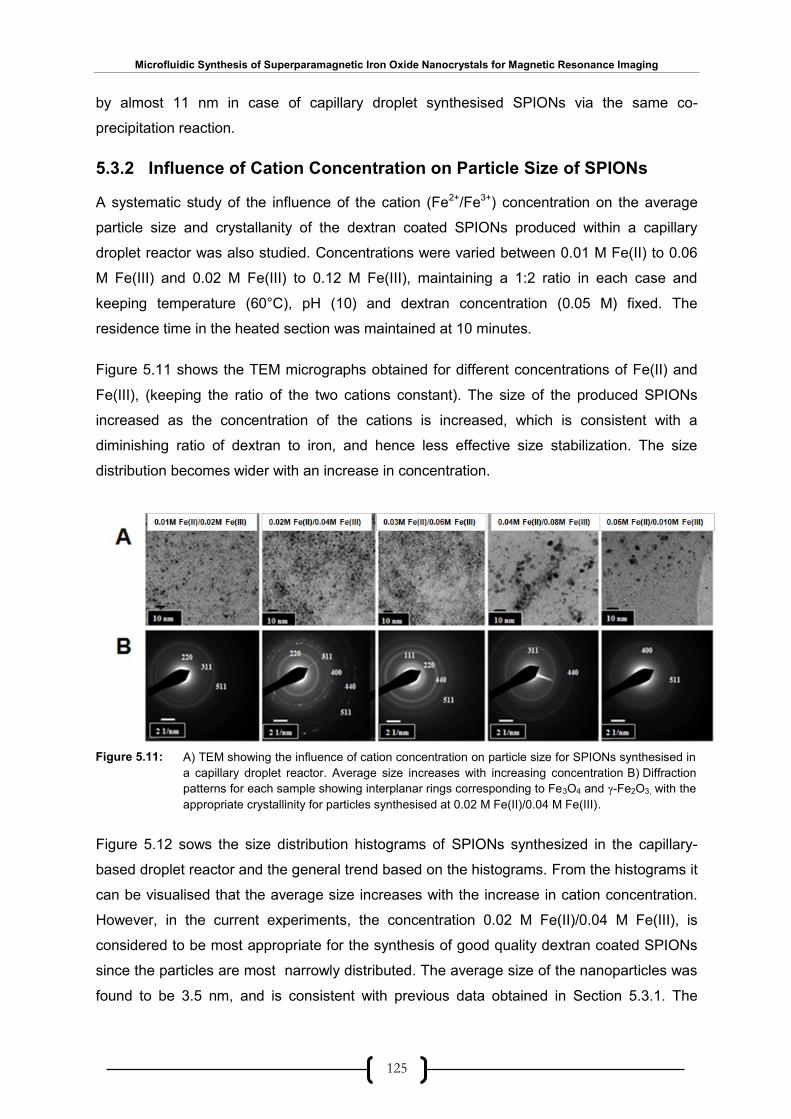
Microfluidic Synthesis of Superparamagnetic Iron Oxide Nanocrystals for Magnetic Resonance Imaging
125
by almost 11 nm in case of capillary droplet synthesised SPIONs via the same co-
precipitation reaction.
5.3.2 Influence of Cation Concentration on Particle Size of SPIONs
A systematic study of the influence of the cation (Fe2+/Fe3+) concentration on the average
particle size and crystallanity of the dextran coated SPIONs produced within a capillary
droplet reactor was also studied. Concentrations were varied between 0.01 M Fe(II) to 0.06
M Fe(III) and 0.02 M Fe(III) to 0.12 M Fe(III), maintaining a 1:2 ratio in each case and
keeping temperature (60°C), pH (10) and dextran concentration (0.05 M) fixed. The
residence time in the heated section was maintained at 10 minutes.
Figure 5.11 shows the TEM micrographs obtained for different concentrations of Fe(II) and
Fe(III), (keeping the ratio of the two cations constant). The size of the produced SPIONs
increased as the concentration of the cations is increased, which is consistent with a
diminishing ratio of dextran to iron, and hence less effective size stabilization. The size
distribution becomes wider with an increase in concentration.
Figure 5.12 sows the size distribution histograms of SPIONs synthesized in the capillary-
based droplet reactor and the general trend based on the histograms. From the histograms it
can be visualised that the average size increases with the increase in cation concentration.
However, in the current experiments, the concentration 0.02 M Fe(II)/0.04 M Fe(III), is
considered to be most appropriate for the synthesis of good quality dextran coated SPIONs
since the particles are most narrowly distributed. The average size of the nanoparticles was
found to be 3.5 nm, and is consistent with previous data obtained in Section 5.3.1. The
Figure 5.11: A) TEM showing the influence of cation concentration on particle size for SPIONs synthesised in
a capillary droplet reactor. Average size increases with increasing concentration B) Diffraction
patterns for each sample showing interplanar rings corresponding to Fe3O4 and γ-Fe2O3, with the
appropriate crystallinity for particles synthesised at 0.02 M Fe(II)/0.04 M Fe(III).
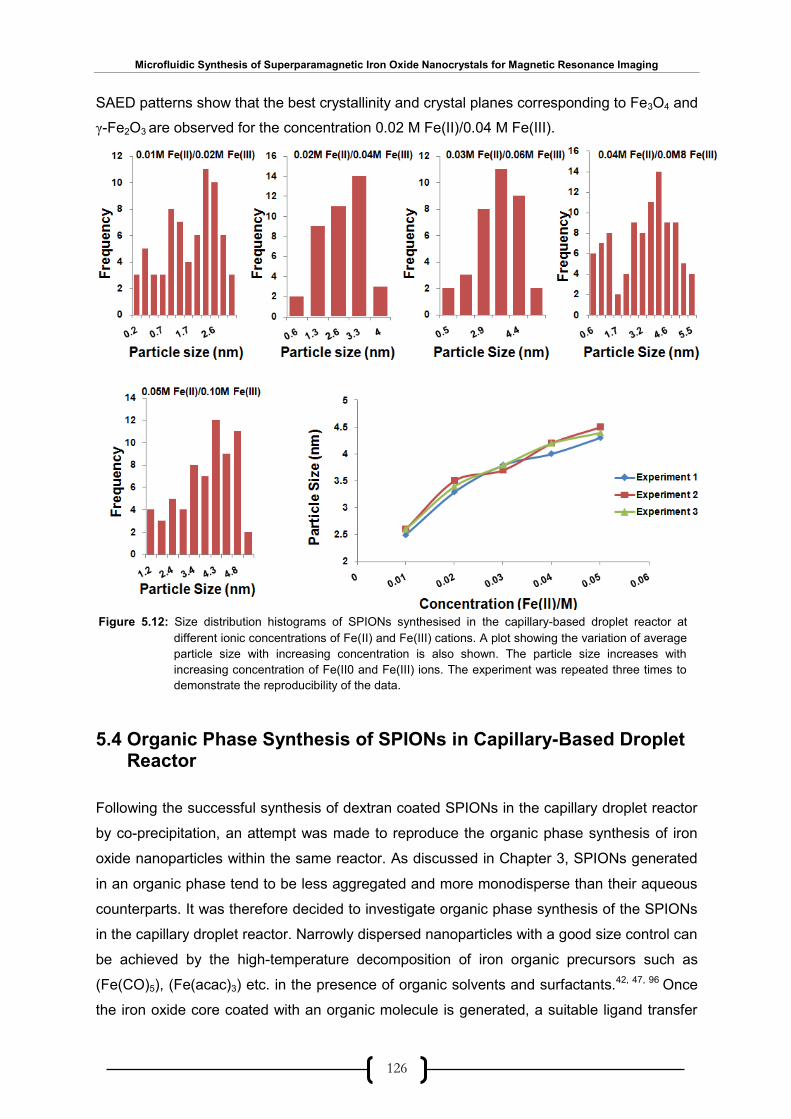
Microfluidic Synthesis of Superparamagnetic Iron Oxide Nanocrystals for Magnetic Resonance Imaging
126
SAED patterns show that the best crystallinity and crystal planes corresponding to Fe3O4 and
γ-Fe2O3 are observed for the concentration 0.02 M Fe(II)/0.04 M Fe(III).
5.4 Organic Phase Synthesis of SPIONs in Capillary-Based Droplet Reactor
Following the successful synthesis of dextran coated SPIONs in the capillary droplet reactor
by co-precipitation, an attempt was made to reproduce the organic phase synthesis of iron
oxide nanoparticles within the same reactor. As discussed in Chapter 3, SPIONs generated
in an organic phase tend to be less aggregated and more monodisperse than their aqueous
counterparts. It was therefore decided to investigate organic phase synthesis of the SPIONs
in the capillary droplet reactor. Narrowly dispersed nanoparticles with a good size control can
be achieved by the high-temperature decomposition of iron organic precursors such as
(Fe(CO)5), (Fe(acac)3) etc. in the presence of organic solvents and surfactants.42, 47, 96 Once
the iron oxide core coated with an organic molecule is generated, a suitable ligand transfer
Figure 5.12: Size distribution histograms of SPIONs synthesised in the capillary-based droplet reactor at
different ionic concentrations of Fe(II) and Fe(III) cations. A plot showing the variation of average
particle size with increasing concentration is also shown. The particle size increases with
increasing concentration of Fe(II0 and Fe(III) ions. The experiment was repeated three times to
demonstrate the reproducibility of the data.

Microfluidic Synthesis of Superparamagnetic Iron Oxide Nanocrystals for Magnetic Resonance Imaging
127
can be performed so as to replace the hydrophobic ligand with a hydrophilic biocompatible
biopolymer 42, 105.
As a first step, Xu et al.’s98 approach was followed to replicate the bulk synthesis of
oleylamine coated iron oxide nanoparticles within the capillary droplet reactor. In this
particular reaction, oleylamine performs the function of both the reducing agent and the
capping agent. Thermal decomposition of Fe (acac)3 in benzyl ether and oleylamine leads to
the production of oleylamine capped iron oxide nanoparticles. Two sets of experiments were
performed to investigate the temperature and reaction time dependence of the thermal
decomposition of Fe(acac)3 to yield iron oxide nanoparticles.
Figure 5.13 shows a schematic of the apparatus used for the organic phase synthesis of
oleylamine-coated iron oxide nanoparticles. In contrast to the precipitation method, instead of
two auxiliary glass capillaries (Figure 5.5), only one was used to inject a premixed precursor
solution containing of Fe(acac)3, oleylamine and benzyl ether. The droplets of the precursor
solution flowed through 4 m PTFE tubing which was coiled and immersed in a variable
temperature silicone oil bath.
Initially, the temperature of the oil bath was varied from 125 to 240°C while the residence
(reaction) time kept constant at 60 minutes. In a second set of experiments, the residence
time was varied from 2 to 60 minutes and the temperature was maintained at 240°C.
Precursor solution was prepared by dissolving 3 mM (0.636 g) Fe(acac)3 in a 2:1 ratio of
oleylamine (12 ml) to benzyl ether (6 ml). The solution was dehydrated by heating to 110 °C
for about 10 minutes under vacuum. This solution was then injected from a syringe pump
into the glass capillary leading into the reactor. The oil bath was set to 240°C. After the
reaction, the solution was allowed to cool down to room temperature. Fe3O4 nanoparticles
were extracted upon the addition of 50 ml of ethanol, followed by centrifugation. The Fe3O4
nanoparticles were dispersed in non-polar solvents such as hexane or toluene.
Schematic of organic-phase synthesis of oleylamine-capped SPIONs in a droplet-based capillary reactor.
Figure 5.13:
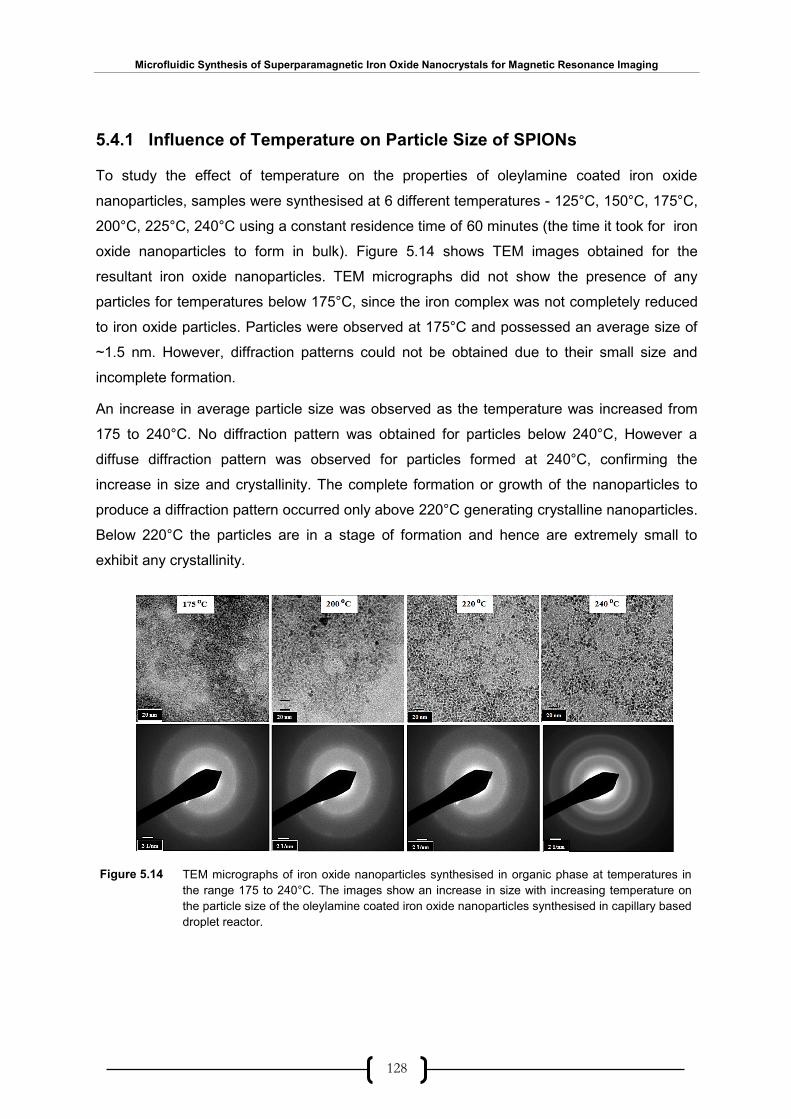
Microfluidic Synthesis of Superparamagnetic Iron Oxide Nanocrystals for Magnetic Resonance Imaging
128
5.4.1 Influence of Temperature on Particle Size of SPIONs
To study the effect of temperature on the properties of oleylamine coated iron oxide
nanoparticles, samples were synthesised at 6 different temperatures - 125°C, 150°C, 175°C,
200°C, 225°C, 240°C using a constant residence time of 60 minutes (the time it took for iron
oxide nanoparticles to form in bulk). Figure 5.14 shows TEM images obtained for the
resultant iron oxide nanoparticles. TEM micrographs did not show the presence of any
particles for temperatures below 175°C, since the iron complex was not completely reduced
to iron oxide particles. Particles were observed at 175°C and possessed an average size of
~1.5 nm. However, diffraction patterns could not be obtained due to their small size and
incomplete formation.
An increase in average particle size was observed as the temperature was increased from
175 to 240°C. No diffraction pattern was obtained for particles below 240°C, However a
diffuse diffraction pattern was observed for particles formed at 240°C, confirming the
increase in size and crystallinity. The complete formation or growth of the nanoparticles to
produce a diffraction pattern occurred only above 220°C generating crystalline nanoparticles.
Below 220°C the particles are in a stage of formation and hence are extremely small to
exhibit any crystallinity.
TEM micrographs of iron oxide nanoparticles synthesised in organic phase at temperatures in
the range 175 to 240°C. The images show an increase in size with increasing temperature on
the particle size of the oleylamine coated iron oxide nanoparticles synthesised in capillary based
droplet reactor.
Figure 5.14

Microfluidic Synthesis of Superparamagnetic Iron Oxide Nanocrystals for Magnetic Resonance Imaging
129
Using these data (measured in triplicate) it was concluded that the average size of the iron
oxide nanoparticles synthesised increased with increasing temperature. Figure 5.15
illustrates this variation graphically
It was thus concluded that, in general, the average size of iron oxide nanoparticles increases
with increasing temperature when the synthesis is carried out in organic phase. This trend is
similar to that observed previously in case of organic syntheses performed in bulk.
5.4.2 Influence of Residence Time on Particle Size of SPIONs
After establishing the dependence of particle size on reaction temperature, the effect of
residence time on the size and crystallinity of iron oxide nanoparticles was studied. In the
present scenario, the residence time defines the time the droplet spends in the heated
silicone oil bath. The same synthesis in Section 5.5.1 was carried out to at a constant
temperature of 240°C with residence times of 2, 5, 10, 20 40 and 60 minutes. Figure 5.16
shows TEM images for iron oxide nanoparticles synthesised at these different residence
times.
It can clearly be seen from the micrographs that the average particle size increases with the
residence time. For 2, 5 and 10 minute residence times, nanoparticles are only faintly visible
on the grid. For 20, 40 and 60 minutes, particles are visible and are spread homogeneously
throughout the grid. The size of typical nanoparticles was so small that they did not produce
any measurable scattering and hence reliable diffraction patterns could not obtained, except
at 60 minutes, when the average size was large enough to cause scattering. However, the
diffraction pattern obtained was diffuse and showed minimal crystallinity.
Figure 5.15: Plot showing general increase in average particle size with increasing temperature for SPIONs
synthesised in organic phase.
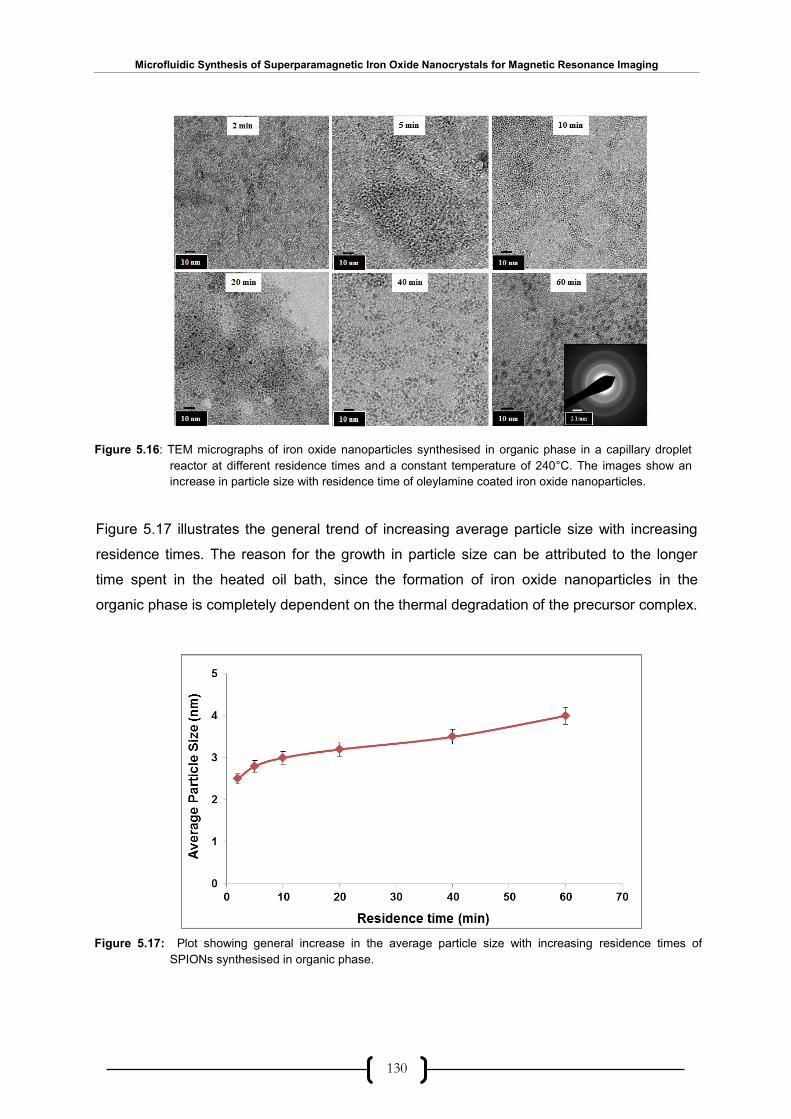
Microfluidic Synthesis of Superparamagnetic Iron Oxide Nanocrystals for Magnetic Resonance Imaging
130
Figure 5.17 illustrates the general trend of increasing average particle size with increasing
residence times. The reason for the growth in particle size can be attributed to the longer
time spent in the heated oil bath, since the formation of iron oxide nanoparticles in the
organic phase is completely dependent on the thermal degradation of the precursor complex.
Figure 5.16: TEM micrographs of iron oxide nanoparticles synthesised in organic phase in a capillary droplet
reactor at different residence times and a constant temperature of 240°C. The images show an
increase in particle size with residence time of oleylamine coated iron oxide nanoparticles.
Figure 5.17: Plot showing general increase in the average particle size with increasing residence times of
SPIONs synthesised in organic phase.

Microfluidic Synthesis of Superparamagnetic Iron Oxide Nanocrystals for Magnetic Resonance Imaging
131
5.5 MRI Study
Dextran coated SPIONs are a special class of contrast enhancers that have been used in
Magnetic Resonance Imaging (MRI) for many years. Their use in MRI requires certain
specific physico-chemical properties in terms of size and composition, which are strongly
influenced by the method of their preparation106. MRI contrast agents are designed to alter
the relaxation of the nearby water (proton signal intensity) molecules. There are basically two
types of contrast agents: T1 (positive) and T2 (negative) contrast agents. T1 contrast agents
shorten relaxation times through spin-lattice interactions and are known as positive contrast
agents since they show as bright spots on MR images. T2 contrast agents on the other hand,
shorten relaxation times through spin-spin interactions and are known as negative contrast
agents since they show as dark spots on MR images.87b SPIONs are T2 (negative contrast)
agents in the sense that proton signal intensity is reduced, and even completely suppressed
in regions of high iron content37.
MRI contrast agents increase sensitivity and facilitate better diagnosis by enhancing image
detail. Negative contrast agents exhibit greater sensitivity than their positive counterparts.
These are super paramagnetic in nature and thus able to affect a large number of water
molecules. A good negative contrast agent will relax the signal from the surrounding water
molecules quickly and thus have low T2 and high relaxivity since, relaxivity, r2 = 1/T2.
Relaxivity is defined as a measure of how fast the relaxation of bulk water protons is affected
by atomic iron concentration and is a good indication of MRI efficacy in contrast agent.
Signals are acquired at different echo times, and yield a single phase exponential decay
according to,
(5.1)
Here, S is the signal intensity at a particular echo time, TE and S0 is the initial signal intensity.
The as-produced iron oxide nanoparticles are attractive candidates for in vivo imaging
applications due to their small size, narrow size distributions, and biocompatible dextran
surface coating. To assess their potential as MRI T2 contrast enhancement agents, the
magnetic properties of the particles were characterised using vibrating sample
magnetometry (VSM) as discussed in Chapter 2. The particles yielded a magnetisation curve
with zero remnance and coercivity (see Figure 5.18), indicating the sample to be
superparamagnetic with minimal contamination from non-superparamagnetic species such
as γ-Fe2O3 (hematite). The saturation magnetisation was 58 emu g-1, which compares
favourably to typical values of 30–50 emu g-1 reported elsewhere in the literature for SPIONs
obtained by co-precipitation.11
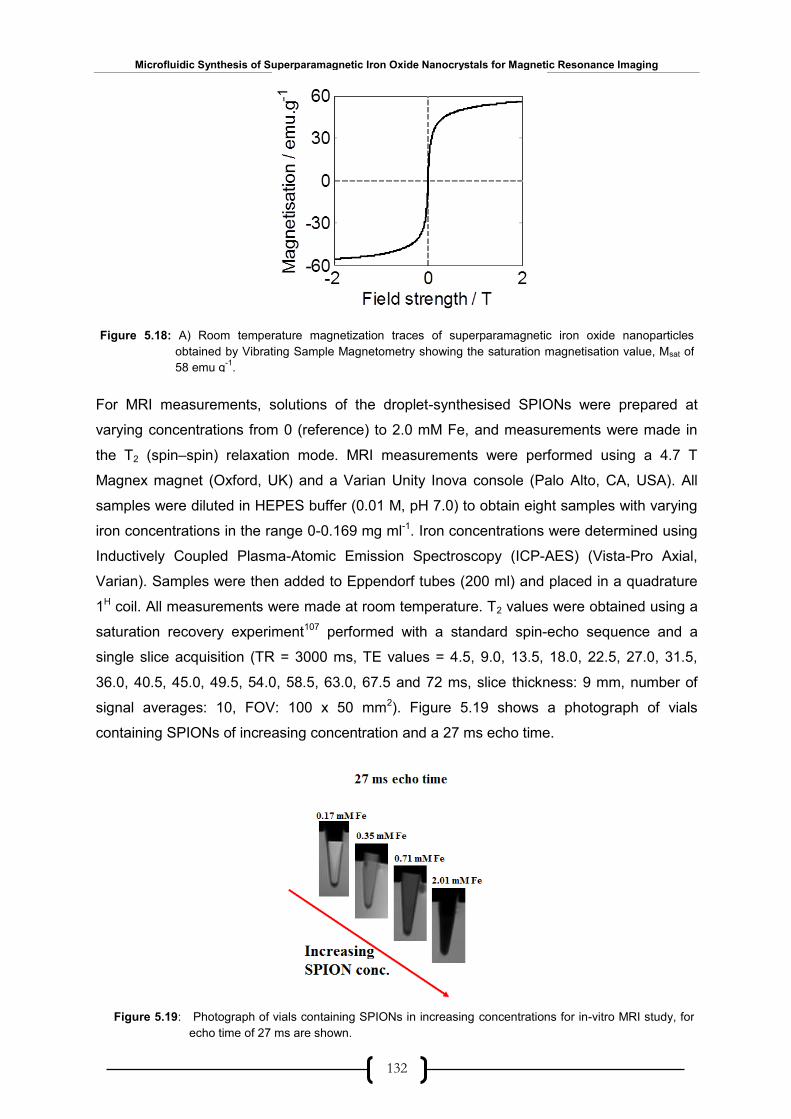
Microfluidic Synthesis of Superparamagnetic Iron Oxide Nanocrystals for Magnetic Resonance Imaging
132
For MRI measurements, solutions of the droplet-synthesised SPIONs were prepared at
varying concentrations from 0 (reference) to 2.0 mM Fe, and measurements were made in
the T2 (spin–spin) relaxation mode. MRI measurements were performed using a 4.7 T
Magnex magnet (Oxford, UK) and a Varian Unity Inova console (Palo Alto, CA, USA). All
samples were diluted in HEPES buffer (0.01 M, pH 7.0) to obtain eight samples with varying
iron concentrations in the range 0-0.169 mg ml-1. Iron concentrations were determined using
Inductively Coupled Plasma-Atomic Emission Spectroscopy (ICP-AES) (Vista-Pro Axial,
Varian). Samples were then added to Eppendorf tubes (200 ml) and placed in a quadrature
1H coil. All measurements were made at room temperature. T2 values were obtained using a
saturation recovery experiment107 performed with a standard spin-echo sequence and a
single slice acquisition (TR = 3000 ms, TE values = 4.5, 9.0, 13.5, 18.0, 22.5, 27.0, 31.5,
36.0, 40.5, 45.0, 49.5, 54.0, 58.5, 63.0, 67.5 and 72 ms, slice thickness: 9 mm, number of
signal averages: 10, FOV: 100 x 50 mm2). Figure 5.19 shows a photograph of vials
containing SPIONs of increasing concentration and a 27 ms echo time.
Figure 5.18: A) Room temperature magnetization traces of superparamagnetic iron oxide nanoparticles
obtained by Vibrating Sample Magnetometry showing the saturation magnetisation value, Msat of
58 emu g-1
.
Figure 5.19: Photograph of vials containing SPIONs in increasing concentrations for in-vitro MRI study, for
echo time of 27 ms are shown.
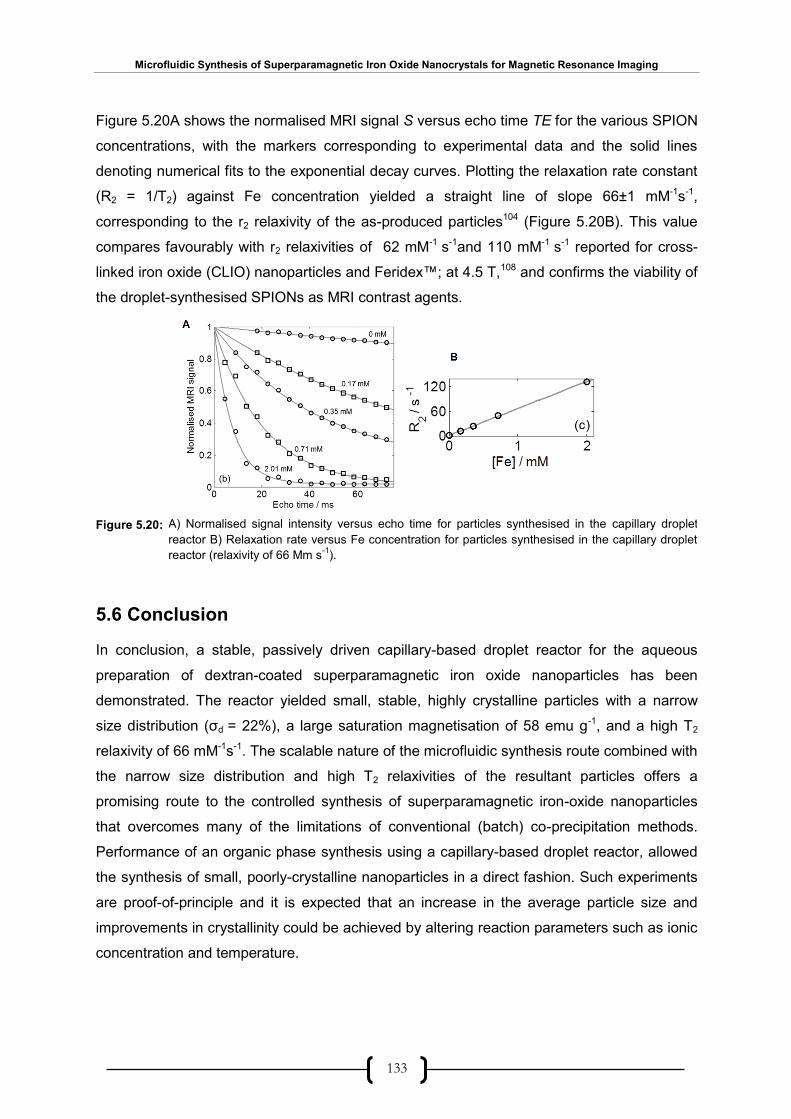
Microfluidic Synthesis of Superparamagnetic Iron Oxide Nanocrystals for Magnetic Resonance Imaging
133
Figure 5.20A shows the normalised MRI signal S versus echo time TE for the various SPION
concentrations, with the markers corresponding to experimental data and the solid lines
denoting numerical fits to the exponential decay curves. Plotting the relaxation rate constant
(R2 = 1/T2) against Fe concentration yielded a straight line of slope 66±1 mM-1s-1,
corresponding to the r2 relaxivity of the as-produced particles104 (Figure 5.20B). This value
compares favourably with r2 relaxivities of 62 mM-1 s-1and 110 mM-1 s-1 reported for cross-
linked iron oxide (CLIO) nanoparticles and Feridex™; at 4.5 T,108 and confirms the viability of
the droplet-synthesised SPIONs as MRI contrast agents.
5.6 Conclusion
In conclusion, a stable, passively driven capillary-based droplet reactor for the aqueous
preparation of dextran-coated superparamagnetic iron oxide nanoparticles has been
demonstrated. The reactor yielded small, stable, highly crystalline particles with a narrow
size distribution (σd = 22%), a large saturation magnetisation of 58 emu g-1, and a high T2
relaxivity of 66 mM-1s-1. The scalable nature of the microfluidic synthesis route combined with
the narrow size distribution and high T2 relaxivities of the resultant particles offers a
promising route to the controlled synthesis of superparamagnetic iron-oxide nanoparticles
that overcomes many of the limitations of conventional (batch) co-precipitation methods.
Performance of an organic phase synthesis using a capillary-based droplet reactor, allowed
the synthesis of small, poorly-crystalline nanoparticles in a direct fashion. Such experiments
are proof-of-principle and it is expected that an increase in the average particle size and
improvements in crystallinity could be achieved by altering reaction parameters such as ionic
concentration and temperature.
A) Normalised signal intensity versus echo time for particles synthesised in the capillary droplet
reactor B) Relaxation rate versus Fe concentration for particles synthesised in the capillary droplet
reactor (relaxivity of 66 Mm s-1
).
Figure 5.20:

Microfluidic Synthesis of Superparamagnetic Iron Oxide Nanocrystals for Magnetic Resonance Imaging
134
VI
Chapter 6
Conclusions & Future Work
This chapter summarises the work presented and discussed in this thesis with special
emphasis on key achievements for SPIOIN synthesis and subsequent magnetic resonance
applications. Suggestions for potential improvements to the adapted methodology are also
detailed.
Microfluidic Synthesis of Superparamagnetic Iron Oxide Nanocrystals for Magnetic Resonance Imaging
135
6.1 Conclusions This thesis describes the work initiated to develop microfluidic routes for the controlled
synthesis of superparamagnetic iron oxide nanoparticles (SPIONs) and their applications in
magnetic resonance imaging (MRI). In the last decade magnetic nanoparticles especially
SPIONs with size <20nm, possessing superparamagnetism and coated with a biocompatible
polymer have attracted much attention in diagnostic applications such as MRI. Physical and
chemical properties of iron oxide nanoparticles are superior compared to their bulk
counterparts due to which these can be used as contrast enhancers in MRI by altering the
proton relaxation in the tissue fluid. The size controlled synthesis of narrowly distributed
SPIONs is a challenging process owing to their colloidal nature and tendency to aggregate at
a physiological pH. Therefore, nanoparticles must be coated with a biocompatible polymer
for use in biological systems so that good dispersion in aqueous media can be attained. At
present, only dextran coated iron oxide nanoparticles are clinically approved MR contrast
agents and so it was decided to use dextran as the stabilising polymer to coat the SPIONs
generated in the lab.
Historically, the most common method for synthesising dextran-coated iron oxide
nanoparticles is chemical co-precipitation of iron salts in the presence of a base. This
method however results in a polydisperse population of the particles and mostly requires
mechanical methods such as centrifugation to separate small particles from large ones.
However, this separation results in lower yields of the sample. To overcome this difficulty and
to achieve improved control over nanoparticle characteristics, miniaturization of chemical
reactions and the development of ‘‘lab on a chip’’ (LOC) technology has gained momentum
in recent years. Compared to conventional bulk methods microfluidic systems provide better
control of reaction conditions which lead to reduction in particle size and polydispersity.
In this thesis, microfluidic routes for the controlled synthesis of dextran coated SPIONs are
envisaged and demonstrated. Although there are some results on microfluidic synthesis of
bare (uncoated) iron oxide nanoparticles, no results on microfluidic synthesis of dextran
coated SPIONs are available till date.
Two different types of microfluidic reactors namely, poly(dimethylsiloxane)(PDMS)
microfluidic devices and the Polytetrafluoroethylene (PTFE) capillary-based reactors were
investigated for SPION synthesis. Initial experiments were performed on PDMS devices
using continuous flow (single-phase) mode of operation. However a major complication,
fouling was observed within the reactor. The reason for blockage is attributed to the
instantaneous generation of thick precipitates of iron oxide nanoparticles which in no time
spread throughout the microfluidic device and render it unusable. This method was therefore
Microfluidic Synthesis of Superparamagnetic Iron Oxide Nanocrystals for Magnetic Resonance Imaging
136
discarded as a route to synthesise SPIONs due to their high susceptibility to fouling. An
alternative, droplet based approach was therefore employed for SPION synthesis. Initial
problems of channel blockage were encountered in droplet flow as well, but treating the
channels with a surfactant (Aquapel®) helped in overcoming this difficulty.
Droplet based synthesis of uncoated iron oxide nanoparticles has previously been reported
by Frenz and co-workers. They demonstrated the synthesis of uncoated iron oxide
nanoparticles in a poly(dimethylsiloxane) microchip with surface-modified channels and
micro-fabricated electrodes. Although this methodology was shown to provide highly
synchronised droplet fusion using 200 V applied AC voltage leading to the generation of iron
oxide nanoparticles, very few details were provided about the quality of the resultant
particles.
In this thesis a simpler, passive, pillar-based methodology of achieving droplet fusion instead
of high voltage sources, as used by Frenz et al. is evaluated, to generate dextran coated
SPIONs. Several experimental trials were performed on a variety of devices but ultimately
the least complex device was fabricated and selected for SPION synthesis. This device was
called the ‘‘combined device’’ since it contained features from two separate devices.
Dextran-coated SPIONs with average particle size of 3.2 nm and saturation magnetisation,
Msat of 23 emu g-1 were successfully synthesised on chip. The size and magnetisation of the
nanoparticles produced on chip were much smaller compared to their bulk counterparts
having an average particle size of 17 nm and Msat of 16.35 emu g-1. The SAED pattern
confirmed that the particles were crystalline in nature, with interplanar distances
corresponding to the spinel structure of Fe3O4 or γ-Fe2O3. It could thus be concluded that
microfluidic systems provide better control over particle characteristics compared to
traditional bulk chemistry.
Even though by employing on-chip droplet-based microfluidics small sized and crystalline
dextran coated SPIONs were produced, the amount generated during the maximum
operating time of the device was barely sufficient for TEM and VSM analysis and further
characterisation to assess their suitability as contrast enhancers in MRI could not be
demonstrated. Another difficulty associated with the chip-based synthesis was the need to
treat the surface of the channels with Aquapel® every time a device was used. To overcome
these drawbacks another passive methodology using a capillary-based droplet reactor was
evaluated for dextran coated SPION synthesis.
By employing the capillary-based system, the need for lithographic fabrication steps was
obviated, no surface modification of the channel walls was required, and the need for high
voltage power sources was also eliminated. Due to the non-fouling nature of the reactor and
to assess its suitability for SPION synthesis, continuous flow was inspected initially. As soon

Microfluidic Synthesis of Superparamagnetic Iron Oxide Nanocrystals for Magnetic Resonance Imaging
137
as the reagent streams mixed, a dark brown deposit appeared on the inner surface of the
channel walls within minutes. Unlike chip-based continuous flow synthesis, moderate amount
SPIONs could be synthesised and collected using the capillary reactor. However, clogging
was observed within 4 minutes. The collected sample was analysed using TEM which
indicated smaller size and low polydispersity compared to their bulk counterparts. The
particles were also crystalline in nature with diffraction pattern corresponding well with the
interplanar spacing of SPIONs. Therefore, contrary to the chip-based continuous flow
method, adequate amount of sample could be synthesised within the capillary reactor. The
amount was just sufficient for TEM characterisation and no magnetisation data could be
obtained.
Therefore, the principal drawback associated with both chip-based and capillary-based
continuous flow synthesis was the deposition of precipitated SPIONs on the channel walls of
the reactors thereby restricting their long-term operation.
To overcome the above mentioned drawback, segmented-flow within the capillary-reactor
was assessed as an alternative route to synthesise dextran coated SPIONs. To demonstrate
the utility of capillary droplet-based reactor for the formation of good quality SPIONs, those
that could be used as contrast enhancers in MRI, effluent was collected at the capillary outlet
over a period of three hours. The effluent was purified to extract the nanoparticles which
were analysed by TEM and VSM. The synthesised nanoparticles were all identical in shape
having a narrow size distribution in the range 2-6 nm, with the average particle size of 3.6 nm
and a standard deviation of 0.8 nm. The crystallinity of the particles was confirmed by SAED
measurement indicating interplanar distances of the spinel phase of iron oxide, Fe3O4 and
γ-Fe2O3. The particles yielded a magnetisation curve with zero remnance and coercivity
indicating superparamagnetism. The saturation magnetisation, Msat was 58 emu g-1 which is
higher than that obtained by co-precipitation.
To establish whether the synthesised nanoparticles were certainly coated with dextran, FTIR
spectra for both uncoated and dextran-coated iron oxide nanoparticles were recorded. From
the spectrum it was observed that the dextran-coated iron oxide nanoparticles exhibited both
iron oxide and dextran signature demonstrating the coordination of dextran onto the
nanoparticle surface.
The suitability of the dextran coated SPIONs synthesised in the capillary-based droplet
reactor for MRI was demonstrated by performing imaging on the samples in-vitro which
yielded the T2 relaxivity of 66 Mm-1s-1. This compared well with the T2 relaxivities of
commercially available SPIONs.
Microfluidic Synthesis of Superparamagnetic Iron Oxide Nanocrystals for Magnetic Resonance Imaging
138
It was demonstrated that the aqueous co-precipitation of dextran-coated SPIONs could be
successfully accomplished within the capillary droplet reactor. The resultant particles were
however, not completely monodispersed. It was discovered from literature survey that highly
monodispersed and crystalline SPIONs could be produced using organic phase synthesis
method. Therefore, an attempt was made to reproduce the organic phase synthesis of iron
oxide nanoparticles within the same capillary reactor. Narrowly dispersed nanoparticles with
good size control could be synthesised by high-temperature decomposition of organic
precursors of iron. It was observed that the SPIONs generated in organic phase were less
aggregated and highly monodisperse than their aqueous counterparts. The generated
SPIONs were coated with a layer of organic polymer, oleylamine. These SPIONs were
however unusable for biomedical applications, since a ligand exchange between the organic
polymer and a biocompatible polymer was necessary. However, due to time restrictions
these studies could not be performed further.
6.2 Further Work
The research described in this thesis demonstrates the utility of the droplet-based
microfluidic systems for the controlled production of dextran-coated SPIONs. The SPIONs
synthesized within the capillary-based droplet reactor are by far the most superior in terms of
crystallinity and magnetic saturation compared to their bulk counterparts, and can directly be
used as contrast enhancers in MRI without further purification. There are a number of
possible studies which can be performed to obtain further useful results from the generated
SPIONs.
6.2.1 Time of Growth Studies
As discussed in section 4.4.1.1, the device with additional inlets after the merging chamber
was designed to study the time of growth effects on nanoparticle size distribution. The data
collected could be further analysed to report useful results.
6.2.2 Scalability to Increase Throughput
The utility of the system could be enhanced further by increasing the throughput so that the
system could be applied directly for a large scale production of SPIONs whilst maintaining
high level of control. This could be achieved by a process of ‘‘scaling-out’’ (also referred to as
parallelisation). The process involves performing reactions simultaneously in parallel
channels without any alterations in the chemical reactions, to increase the throughput.
Chambers et al.109 have reported a successful use of scale-out process by developing a
gas/liquid segmented flow reactor containing 30 separate reaction channels for a single

Microfluidic Synthesis of Superparamagnetic Iron Oxide Nanocrystals for Magnetic Resonance Imaging
139
chemical reaction of direct fluorination. In their reactor all the reagents were fed into the
reactor from a common inlet producing ~ 3 kg of material per day. Therefore, if such a level
of throughput is attained for SPIONs it would be possible to suffice all the biomedical
applications and establish capillary-based droplet reactor as the most preferred method for
the mass production of good quality SPIONs.
6.2.3 Ligand Exchange Reactions
As demonstrated in chapter 5, the organic-phase synthesis of SPIONs could be successfully
performed within the capillary-droplet based reactor. However, the produced particles were
coated with oleylamine and therefore could not be used in MRI since, for any kind of
biomedical application it is required that the surface of the particle should be coated with a
suitable biocompatible polymer. It is thus necessary to replace or add a layer of
biocompatible polymer over the organic layer to make the SPIONs useful for any kind of bio-
application. This process of exchanging one surface layer with another layer is referred to as
‘‘ligand exchange’’. It would therefore be of interest to perform such complex reactions within
the droplet reactor by either combining different reactors or by adding inlets within the same
reactor for flowing additional reagents.
6.2.4 In Vivo MRI studies
It has already been discussed and demonstrated in vitro that the synthesised dextran-coated
SPIONs can be used as contrast enhancers in MRI. However it would be of great use if in
vivo studies could be performed to demonstrate the suitability of the synthesised SPIONs as
contrast enhancers in biological systems.

Microfluidic Synthesis of Superparamagnetic Iron Oxide Nanocrystals for Magnetic Resonance Imaging
140
VII
Chapter 7
Bibliography
Microfluidic Synthesis of Superparamagnetic Iron Oxide Nanocrystals for Magnetic Resonance Imaging
141
7.1 Bibliography
1. Edel, J. B.; Fortt, R.; deMello, J. C.; deMello, A. J., Microfluidic routes to the controlled production of nanoparticles. Chemical Communications 2002, (10), 1136-1137. 2. Laurent, S.; Dutz, S.; Hafeli, U. O.; Mahmoudi, M., Magnetic fluid hyperthermia: Focus on superparamagnetic iron oxide nanoparticles. Advances in Colloid and Interface Science 2011, 166 (1-2), 8-23. 3. Dobson, J., Magnetic nanoparticles for drug delivery. Drug Development Research 2006, 67 (1), 55-60. 4. (a) Pouliquen, D.; Perroud, H.; Calza, F.; Jallet, P.; Lejeune, J. J., INVESTIGATION OF THE MAGNETIC-PROPERTIES OF IRON-OXIDE NANOPARTICLES USED AS CONTRAST AGENT FOR MRI. Magnetic Resonance in Medicine 1992, 24 (1), 75-84; (b) Wang, Y. X. J.; Hussain, S. M.; Krestin, G. P., Superparamagnetic iron oxide contrast agents: physicochemical characteristics and applications in MR imaging. European Radiology 2001, 11 (11), 2319-2331. 5. Kutushov, M. V.; Kuznetsov, A. A.; Filippov, V. I.; Kuznetsov, O. A., New method of biological fluid detoxification based on magnetic adsorbents. Plenum Press Div Plenum Publishing Corp: New York, 1997; p 391-397. 6. (a) Gupta, A. K.; Gupta, M., Synthesis and surface engineering of iron oxide nanoparticles for biomedical applications. Biomaterials 2005, 26 (18), 3995-4021; (b) Qiao, R.; Yang, C.; Gao, M., Superparamagnetic iron oxide nanoparticles: from preparations to in vivo MRI applications. Journal of Materials Chemistry 2009, 19 (35), 6274-6293. 7. Horn, D.; Rieger, J., Organic nanoparticles in the aqueous phase - theory, experiment, and use. Angewandte Chemie-International Edition 2001, 40 (23), 4331-4361. 8. Schwertmann, U., IRON OXIDES IN THE LABORATORY PREPARATION AND CHARACTERIZATION
SCHWERTMANN, U. AND R. M. CORNELL. IRON OXIDES IN THE LABORATORY: PREPARATION AND CHARACTERIZATION. XIV+137P. VCH VERLAGSGESELLSCHAFT MBH: WEINHEIM, GERMANY; VCH PUBLISHERS, INC.: NEW YORK, NEW YORK, USA. ILLUS. 1991; p XIV-137P.
9. Jun, Y. W.; Seo, J. W.; Cheon, A., Nanoscaling laws of magnetic nanoparticles and their applicabilities in biomedical sciences. Accounts of Chemical Research 2008, 41 (2), 179-189. 10. (a) Murray, C. B.; Sun, S. H.; Doyle, H.; Betley, T., Monodisperse 3d transition-metal (Co, Ni, Fe) nanoparticles and their assembly into nanoparticle superlattices. Mrs Bulletin 2001, 26 (12), 985-991; (b) Jun, Y. W.; Choi, J. S.; Cheon, J., Heterostructured magnetic nanoparticles: their versatility and high performance capabilities. Chemical Communications 2007, (12), 1203-1214; (c) Park, J. I.; Kim, M. G.; Jun, Y. W.; Lee, J. S.; Lee, W. R.; Cheon, J., Characterization of superpararnagnetic "core-shell" nanoparticles and monitoring their anisotropic phase transition to ferromagnetic "solid solution" nanoalloyse. Journal of the American Chemical Society 2004, 126 (29), 9072-9078. 11. Lu, A. H.; Salabas, E. L.; Schuth, F., Magnetic nanoparticles: Synthesis, protection, functionalization, and application. Angewandte Chemie-International Edition 2007, 46 (8), 1222-1244. 12. Schmidt, H., Nanoparticles by chemical synthesis, processing to materials and innovative applications. Applied Organometallic Chemistry 2001, 15 (5), 331-343. 13. Harris, L. A.; Goff, J. D.; Carmichael, A. Y.; Riffle, J. S.; Harburn, J. J.; St. Pierre, T. G.; Saunders, M., Magnetite Nanoparticle Dispersions Stabilized with Triblock Copolymers. Chemistry of Materials 2003, 15 (6), 1367-1377. 14. Frenkel, J., Spontaneous and induced magnetisation in ferromagnetic bodies. Nature 1930, 126 (3173), 274. 15. Hong, R. Y.; Feng, B.; Chen, L. L.; Liu, G. H.; Li, H. Z.; Zheng, Y.; Wei, D. G., Synthesis, characterization and MRI application of dextran-coated Fe3O4 magnetic nanoparticles. Biochemical Engineering Journal 2008, 42 (3), 290-300. 16. (a) Laurent, S.; Forge, D.; Port, M.; Roch, A.; Robic, C.; Elst, L. V.; Muller, R. N., Magnetic iron oxide nanoparticles: Synthesis, stabilization, vectorization, physicochemical characterizations, and biological applications. Chem. Rev. 2008, 108 (6), 2064-2110; (b) J.D.G. Durán, J.L. Arias, V. Gallardo, A.V. Delgado, Magnetic colloids as drug vehicles. Journal of pharmaceutical sciences 2008, 97 (8), 2948-2983. 17. Ferrari, M., Cancer nanotechnology: Opportunities and challenges. Nature Reviews Cancer 2005, 5 (3), 161-171.
Microfluidic Synthesis of Superparamagnetic Iron Oxide Nanocrystals for Magnetic Resonance Imaging
142
18. Wickline, S., Applications of nanotechnology to atherosclerosis, thrombosis, and vascular biology. Arteriosclerosis, thrombosis, and vascular biology 2006, 26, 435-441. 19. Corot, C.; Petry, K. G.; Trivedi, R.; Saleh, A.; Jonkmanns, C.; Le Bas, J.-F.; Blezer, E.; Rausch, M.; Brochet, B.; Foster-Gareau, P.; Balériaux, D.; Gaillard, S.; Dousset, V., Macrophage Imaging in Central Nervous System and in Carotid Atherosclerotic Plaque Using Ultrasmall Superparamagnetic Iron Oxide in Magnetic Resonance Imaging. Investigative Radiology 2004, 39 (10), 619-625. 20. Cudennec, Y.; Lecerf, A., Topotactic transformations of goethite and lepidocrocite into hematite and maghemite. Solid State Sciences 2005, 7 (5), 520-529. 21. Tartaj, P.; Morales, M. D.; Veintemillas-Verdaguer, S.; Gonzalez-Carreno, T.; Serna, C. J., The preparation of magnetic nanoparticles for applications in biomedicine. J. Phys. D-Appl. Phys. 2003, 36 (13), R182-R197. 22. Jordan, A.; Scholz, R.; Maier-Hauff, K.; Johannsen, M.; Wust, P.; Nadobny, J.; Schirra, H.; Schmidt, H.; Deger, S.; Loening, S.; Lanksch, W.; Felix, R., Presentation of a new magnetic field therapy system for the treatment of human solid tumors with magnetic fluid hyperthermia. Journal of Magnetism and Magnetic Materials 2001, 225 (1–2), 118-126. 23. Kim, D. K.; Mikhaylova, M.; Zhang, Y.; Muhammed, M., Protective Coating of Superparamagnetic Iron Oxide Nanoparticles. Chemistry of Materials 2003, 15 (8), 1617-1627. 24. Tombacz E., H. M. A., Illes E., MAGNETITE IN AQUEOUS MEDIUM: COATING ITS SURFACE AND SURFACE COATED WITH IT. Romanian Reports in Physics, Vol. , , 2006, 58, No. 3, 281-286. 25. Li, Z.; Wei, L.; Gao, M. Y.; Lei, H., One-Pot Reaction to Synthesize Biocompatible Magnetite Nanoparticles. Advanced Materials 2005, 17 (8), 1001-1005. 26. Thünemann, Maghemite Nanoparticles Protectively Coated with Poly(ethylene imine) and Poly(ethylene oxide)-block-poly(glutamic acid). Langmuir 2006, 22 (5), 2351-2357. 27. Corot, C.; Robert, P.; Idée, J.-M.; Port, M., Recent advances in iron oxide nanocrystal technology for medical imaging. Advanced Drug Delivery Reviews 2006, 58 (14), 1471-1504. 28. Rishton, S. A.; Lu, Y.; Altman, R. A.; Marley, A. C.; Bian, X. P.; Jahnes, C.; Viswanathan, R.; Xiao, G.; Gallagher, W. J.; Parkin, S. S. P., Magnetic tunnel junctions fabricated at tenth-micron dimensions by electron beam lithography. Microelectronic Engineering 1997, 35 (1–4), 249-252. 29. Mathur, S.; Barth, S.; Werner, U.; Hernandez-Ramirez, F.; Romano-Rodriguez, A., Chemical Vapor Growth of One-dimensional Magnetite Nanostructures. Advanced Materials 2008, 20 (8), 1550-1554. 30. (a) Reddy, L. H.; Arias, J. L.; Nicolas, J.; Couvreur, P., Magnetic Nanoparticles: Design and Characterization, Toxicity and Biocompatibility, Pharmaceutical and Biomedical Applications. Chem. Rev. 2012, 112 (11), 5818-5878; (b) Lee, C. S.; Lee, H.; Westervelt, R. M., Microelectromagnets for the control of magnetic nanoparticles. Applied Physics Letters 2001, 79 (20), 3308-3310. 31. da Costa, G. M.; De Grave, E.; de Bakker, P. M. A.; Vandenberghe, R. E., Synthesis and Characterization of Some Iron Oxides by Sol-Gel Method. Journal of Solid State Chemistry 1994, 113 (2), 405-412. 32. (a) Amemiya, Y.; Arakaki, A.; Staniland, S. S.; Tanaka, T.; Matsunaga, T., Controlled formation of magnetite crystal by partial oxidation of ferrous hydroxide in the presence of recombinant magnetotactic bacterial protein Mms6. Biomaterials 2007, 28 (35), 5381-5389; (b) Vereda, F.; Rodriguez-Gonzalez, B.; de Vicente, J.; Hidalgo-Alvarez, R., Evidence of direct crystal growth and presence of hollow microspheres in magnetite particles prepared by oxidation of Fe(OH)(2). Journal of Colloid and Interface Science 2008, 318 (2), 520-524. 33. (a) Massart, R., PREPARATION OF AQUEOUS MAGNETIC LIQUIDS IN ALKALINE AND ACIDIC MEDIA. Ieee Transactions on Magnetics 1981, 17 (2), 1247-1248; (b) Wu, J.-H.; Ko, S. P.; Liu, H.-L.; Kim, S.; Ju, J.-S.; Keun-Kim, Y., Sub 5 nm magnetite nanoparticles: Synthesis, microstructure, and magnetic properties. Materials Letters 2007, 61 (14-15), 3124-3129. 34. Cabrera, L.; Gutierrez, S.; Menendez, N.; Morales, M. P.; Heffasti, P., Magnetite nanoparticles: Electrochemical synthesis and characterization. Electrochimica Acta 2008, 53 (8), 3436-3441. 35. (a) López-López, M. T.; Durán, J. D. G.; Delgado, A. V.; González-Caballero, F., Stability and magnetic characterization of oleate-covered magnetite ferrofluids in different nonpolar carriers. Journal of Colloid and Interface Science 2005, 291 (1), 144-151; (b) Viota, J. L.; Durán, J. D. G.; González-Caballero, F.; Delgado, A. V., Magnetic properties of extremely bimodal magnetite suspensions. Journal of Magnetism and Magnetic Materials 2007, 314 (2), 80-86. 36. Reimers GW, K. S., Preparing magneticfluids by a
Microfluidic Synthesis of Superparamagnetic Iron Oxide Nanocrystals for Magnetic Resonance Imaging
143
peptizing method. US Bureau Mines Tech Rep 1972, 59. 37. Sjogren, C., MAGNETIC CHARACTERIZATION OF IRON-OXIDES FOR MAGNETIC-RESONANCE-IMAGING. Magnetic resonance in medicine 1994, 31 (3), 268-272. 38. (a) Gupta, A. K.; Curtis, A. S. G., Lactoferrin and ceruloplasmin derivatized superparamagnetic iron oxide nanoparticles for targeting cell surface receptors. Biomaterials 2004, 25 (15), 3029-3040; (b) Kim, D. K.; Zhang, Y.; Voit, W.; Rao, K. V.; Muhammed, M., Synthesis and characterization of surfactant-coated superparamagnetic monodispersed iron oxide nanoparticles. Journal of Magnetism and Magnetic Materials 2001, 225 (1-2), 30-36. 39. Frey, N. A.; Peng, S.; Cheng, K.; Sun, S. H., Magnetic nanoparticles: synthesis, functionalization, and applications in bioimaging and magnetic energy storage. Chem. Soc. Rev. 2009, 38 (9), 2532-2542. 40. Rockenberger, J.; Scher, E. C.; Alivisatos, A. P., A new nonhydrolytic single-precursor approach to surfactant-capped nanocrystals of transition metal oxides. Journal of the American Chemical Society 1999, 121 (49), 11595-11596. 41. Hyeon, T.; Lee, S. S.; Park, J.; Chung, Y.; Bin Na, H., Synthesis of highly crystalline and monodisperse maghemite nanocrystallites without a size-selection process. Journal of the American Chemical Society 2001, 123 (51), 12798-12801. 42. Sun, S. H.; Zeng, H.; Robinson, D. B.; Raoux, S.; Rice, P. M.; Wang, S. X.; Li, G. X., Monodisperse MFe2O4 (M = Fe, Co, Mn) nanoparticles. Journal of the American Chemical Society 2004, 126 (1), 273-279. 43. Jana, N. R.; Chen, Y.; Peng, X., Size- and Shape-Controlled Magnetic (Cr, Mn, Fe, Co, Ni) Oxide Nanocrystals via a Simple and General Approach. Chemistry of Materials 2004, 16 (20), 3931-3935. 44. Cheon, J.; Kang, N.-J.; Lee, S.-M.; Lee, J.-H.; Yoon, J.-H.; Oh, S. J., Shape Evolution of Single-Crystalline Iron Oxide Nanocrystals. Journal of the American Chemical Society 2004, 126 (7), 1950-1951. 45. Lu, X.; Niu, M.; Qiao, R.; Gao, M., Superdispersible PVP-Coated Fe3O4 Nanocrystals Prepared by a “One-Pot” Reaction†. The Journal of Physical Chemistry B 2008, 112 (46), 14390-14394. 46. Qiao, R., Superparamagnetic iron oxide nanoparticles: from preparations to in vivo MRI applications. Journal of materials chemistry 2009, 19 (35), 6274. 47. Sun, S.; Zeng, H., Size-Controlled Synthesis of Magnetite Nanoparticles. Journal of the American Chemical Society 2002, 124 (28), 8204-8205. 48. Park, J., Ultra-large-scale syntheses of monodisperse nanocrystals. Nature Materials 2004, 3 (12), 891. 49. Schwertmann U, C. R., Iron oxides in the laboratory:preparation and characterization. Weinheim, Cambridge: VCH 1991. 50. LaMer, V. K.; Dinegar, R. H., Theory, Production and Mechanism of Formation of Monodispersed Hydrosols. Journal of the American Chemical Society 1950, 72 (11), 4847-4854. 51. Boistelle, R.; Astier, J. P., CRYSTALLIZATION MECHANISMS IN SOLUTION. Journal of Crystal Growth 1988, 90 (1-3), 14-30. 52. Peng, X.; Wickham, J.; Alivisatos, A. P., Kinetics of II-VI and III-V Colloidal Semiconductor
Nanocrystal Growth: “Focusing” of Size Distributions. Journal of the American Chemical Society 1998, 120 (21), 5343-5344. 53. Jensen, K. F., Microreaction engineering - is small better? Chemical Engineering Science 2001, 56 (2), 293-303. 54. DeMello, J.; DeMello, A., Microscale reactors: nanoscale products. Lab on a Chip 2004, 4 (2), 11N-15N. 55. Whitesides, G. M., The origins and the future of microfluidics. Nature 2006, 442 (7101), 368. 56. Song, H.; Tice, J. D.; Ismagilov, R. F., A microfluidic system for controlling reaction networks in time. Angewandte Chemie-International Edition 2003, 42 (7), 768-772. 57. deMello, A. J., Control and detection of chemical reactions in microfluidic systems. Nature 2006, 442 (7101), 394-402. 58. Song, H.; Chen, D. L.; Ismagilov, R. F., Reactions in droplets in microflulidic channels. Angewandte Chemie-International Edition 2006, 45 (44), 7336-7356. 59. (a) Yen, B. K. H.; Günther, A.; Schmidt, M. A.; Jensen, K. F.; Bawendi, M. G., A Microfabricated Gas–Liquid Segmented Flow Reactor for High-Temperature Synthesis: The Case of CdSe Quantum Dots. Angewandte Chemie International Edition 2005, 44 (34), 5447-5451; (b) Khan, S. A.; Günther, A.; Schmidt, M. A.; Jensen, K. F., Microfluidic Synthesis of Colloidal Silica. Langmuir 2004, 20 (20), 8604-8611; (c) Nightingale, A. M.; Krishnadasan, S. H.; Berhanu, D.; Niu, X.; Drury, C.; McIntyre, R.; Valsami-Jones, E.;
Microfluidic Synthesis of Superparamagnetic Iron Oxide Nanocrystals for Magnetic Resonance Imaging
144
deMello, J. C., A stable droplet reactor for high temperature nanocrystal synthesis. Lab on a Chip 2011, 11 (7), 1221-1227. 60. Chan, E. M.; Alivisatos, A. P.; Mathies, R. A., High-temperature microfluidic synthesis of CdSe nanocrystals in nanoliter droplets. Journal of the American Chemical Society 2005, 127 (40), 13854-13861. 61. Tice, J. D.; Song, H.; Lyon, A. D.; Ismagilov, R. F., Formation of Droplets and Mixing in Multiphase Microfluidics at Low Values of the Reynolds and the Capillary Numbers. Langmuir 2003, 19 (22), 9127-9133. 62. Lee, J. N.; Park, C.; Whitesides, G. M., Solvent Compatibility of Poly(dimethylsiloxane)-Based Microfluidic Devices. Analytical chemistry 2003, 75 (23), 6544-6554. 63. (a) Carroll, N. J.; Rathod, S. B.; Derbins, E.; Mendez, S.; Weitz, D. A.; Petsev, D. N., Droplet-based microfluidics for emulsion and solvent evaporation synthesis of monodisperse mesoporous silica microspheres. Langmuir 2008, 24 (3), 658-661; (b) Huebner, A.; Olguin, L. F.; Bratton, D.; Whyte, G.; Huck, W. T. S.; de Mello, A. J.; Edel, J. B.; Abell, C.; Hollfelder, F., Development of quantitative cell-based enzyme assays in microdroplets. Analytical Chemistry 2008, 80 (10), 3890-3896. 64. (a) Baret, J. C., Surfactants in droplet-based microfluidics. Lab on a chip 2012, 12 (3), 422-433; (b) Holtze, C.; Rowat, A. C.; Agresti, J. J.; Hutchison, J. B.; Angile, F. E.; Schmitz, C. H. J.; Koster, S.; Duan, H.; Humphry, K. J.; Scanga, R. A.; Johnson, J. S.; Pisignano, D.; Weitz, D. A., Biocompatible surfactants for water-in-fluorocarbon emulsions. Lab on a chip 2008, 8 (10), 1632-1639. 65. Huebner, A.; Sharma, S.; Srisa-Art, M.; Hollfelder, F.; Edel, J. B.; deMello, A. J., Microdroplets: A sea of applications? Lab on a chip 2008, 8 (8), 1244-1254. 66. Anna, S. L.; Bontoux, N.; Stone, H. A., Formation of dispersions using "flow focusing" in microchannels. Applied Physics Letters 2003, 82 (3), 364-366. 67. Link, D. R.; Anna, S. L.; Weitz, D. A.; Stone, H. A., Geometrically mediated breakup of drops in microfluidic devices. Physical Review Letters 2004, 92 (5). 68. Zheng, B.; Tice, J. D.; Roach, L. S.; Ismagilov, R. F., A droplet-based, composite PDMS/glass capillary microfluidic system for evaluating protein crystallization conditions by microbatch and vapor-diffusion methods with on-chip X-ray diffraction. Angewandte Chemie-International Edition 2004, 43 (19), 2508-2511. 69. Frenz, L.; El Harrak, A.; Pauly, M.; Begin-Colin, S.; Griffiths, A. D.; Baret, J. C., Droplet-based microreactors for the synthesis of magnetic iron oxide nanoparticles. Angewandte Chemie-International Edition 2008, 47 (36), 6817-6820. 70. Niu, X., Pillar-induced droplet merging in microfluidic circuits. Lab on a chip 2008, 8 (11), 1837. 71. Teh, S. Y.; Lin, R.; Hung, L. H.; Lee, A. P., Droplet microfluidics. Lab on a chip 2008, 8 (2), 198-220. 72. Krishnadasan, S.; Brown, R. J. C.; deMello, A. J.; deMello, J. C., Intelligent routes to the controlled synthesis of nanoparticles. Lab on a chip 2007, 7 (11), 1434-1441. 73. Wagner, J., Continuous synthesis of gold nanoparticles in a microreactor. Nano letters 2005, 5 (4), 685. 74. Lin, X. Z., Direct synthesis of narrowly dispersed silver nanoparticles using a single-source precursor. Langmuir 2003, 19 (24), 10081. 75. Abou Hassan, A.; Sandre, O.; Cabuil, V.; Tabeling, P., Synthesis of iron oxide nanoparticles in a microfluidic device: preliminary results in a coaxial flow millichannel. Chemical Communications 2008, (15), 1783-1785. 76. Shestopalov, I., Multi-step synthesis of nanoparticles performed on millisecond time scale in a microfluidic droplet-based system. Lab on a chip 2004, 4 (4), 316. 77. Sotowa, K. I.; Irie, K.; Fukumori, T.; Kusakabe, K.; Sugiyama, S., Droplet Formation by the Collision of Two Aqueous Solutions in a Microchannel and Application to Particle Synthesis. Chemical Engineering & Technology 2007, 30 (3), 383-388. 78. Doh, I., Trapping and collection of uniform size droplets for nanoparticle synthesis. Applied Physics Letters 2012, 100 (7), 074106-074106-3. 79. Duraiswamy, S.; Khan, S. A., Droplet-Based Microfluidic Synthesis of Anisotropic Metal Nanocrystals. Small 2009, 5 (24), 2828-2834. 80. Anna, S. L., Formation of dispersions using “flow focusing” in microchannels. Applied Physics Letters 2003, 82, 364.
Microfluidic Synthesis of Superparamagnetic Iron Oxide Nanocrystals for Magnetic Resonance Imaging
145
81. Hoang, P. H., Ultrafast and continuous synthesis of unaccommodating inorganic nanomaterials in droplet-and ionic liquid-assisted microfluidic system. Journal of the American Chemical Society 2011, 133 (37), 14765. 82. Corp., M., http://www.microchem.com/products/su_eight.htm. 83. Duffy, D. C.; Schueller, O. J. A.; McDonald, J. C.; Whitesides, G. M., Rapid Prototyping of Microfluidic Systems in Poly(dimethylsiloxane). Analytical chemistry 1998, 70 (23), 4974-84. 84. Wang, Z. L., Transmission Electron Microscopy of Shape-Controlled Nanocrystals and Their Assemblies. The Journal of Physical Chemistry B 2000, 104 (6), 1153-1175. 85. Foner, S., Vibrating sample magnetometer. Review of scientific instruments 1956, 27 (7), 548.
86. Foner, S., Versatile and Sensitive Vibrating‐Sample Magnetometer. Review of scientific instruments 1959, 30 (7), 548. 87. (a) Brown, M., MRI: basic principles and applications. Medical physics 2004, 31 (1), 170; (b) Brown M.A., S. R. C., MRI: Basic Principles and Applications. 2010, NJ: John Wiley & Sons (4th ed. Hoboken ), 161-175. 88. Fishman, R. S., Magnetic Resonance Imaging. EP Patent 1998, (0495), 287. 89. Bottrill, M.; Kwok, L.; Long, N. J., Lanthanides in magnetic resonance imaging. Chemical Society Reviews 2006, 35 (6), 557-571. 90. Pichler, B. J.; Kolb, A.; Nägele, T.; Schlemmer, H.-P., PET/MRI: Paving the Way for the Next Generation of Clinical Multimodality Imaging Applications. Journal of Nuclear Medicine 2010, 51 (3), 333-336. 91. Bonnemain, B., Superparamagnetic agents in magnetic resonance imaging: physicochemical characteristics and clinical applications. A review. Journal of drug targeting 1998, 6 (3), 167-74. 92. Hofmann Amtenbrink, M.; Hofmann, H.; Montet, X., Superparamagnetic nanoparticles - a tool for early diagnostics. Swiss medical weekly 2010, 140, 7-13. 93. Asuha, S.; Suyala, B.; Siqintana, X.; Zhao, S., Direct synthesis of Fe(3)O(4) nanopowder by thermal decomposition of Fe-urea complex and its properties. Journal of Alloys and Compounds 2011, 509 (6), 2870-2873. 94. Kang, Y. S., Synthesis and characterization of nanometer-size Fe3O4 and γ-Fe2O3 particles. Chemistry of Materials 1996, 8 (9), 2209. 95. Wang, Y.-X.; Hussain, S.; Krestin, G., Superparamagnetic iron oxide contrast agents: physicochemical characteristics and applications in MR imaging. Eur Radiol 2001, 11 (11), 2319-2331. 96. Hyeon, T.; Lee, S. S.; Park, J.; Chung, Y.; Na, H. B., Synthesis of Highly Crystalline and Monodisperse Maghemite Nanocrystallites without a Size-Selection Process. Journal of the American Chemical Society 2001, 123 (51), 12798-12801. 97. Jun, Y.-w.; Huh, Y.-M.; Choi, J.-s.; Lee, J.-H.; Song, H.-T.; KimKim; Yoon, S.; Kim, K.-S.; Shin, J.-S.; Suh, J.-S.; Cheon, J., Nanoscale Size Effect of Magnetic Nanocrystals and Their Utilization for Cancer Diagnosis via Magnetic Resonance Imaging. Journal of the American Chemical Society 2005, 127 (16), 5732-5733. 98. Xu, Z.; Shen, C.; Hou, Y.; Gao, H.; Sun, S., Oleylamine as Both Reducing Agent and Stabilizer in a Facile Synthesis of Magnetite Nanoparticles. Chemistry of Materials 2009, 21 (9), 1778-1780. 99. Nightingale, A. M.; de Mello, J. C., Microscale synthesis of quantum dots. Journal of Materials Chemistry 2010, 20 (39), 8454-8463. 100. Kumar, K.; Nightingale, A. M.; Krishnadasan, S. H.; Kamaly, N.; Wylenzinska-Arridge, M.; Zeissler, K.; Branford, W. R.; Ware, E.; deMello, A. J.; deMello, J. C., Direct synthesis of dextran-coated superparamagnetic iron oxide nanoparticles in a capillary-based droplet reactor. Journal of Materials Chemistry 2012, 22 (11), 4704-4708. 101. Lee, W. B.; Weng, C. H.; Cheng, F. Y.; Yeh, C. S.; Lei, H. Y.; Lee, G. B., Biomedical microdevices synthesis of iron oxide nanoparticles using a microfluidic system. Biomedical Microdevices 2009, 11 (1), 161-171. 102. Thorek, D. L. J.; Chen, A.; Czupryna, J.; Tsourkas, A., Superparamagnetic iron oxide nanoparticle probes for molecular imaging. Annals of Biomedical Engineering 2006, 34 (1), 23-38. 103. Gribanov, N. M.; Bibik, E. E.; Buzunov, O. V.; Naumov, V. N., PHYSICOCHEMICAL REGULARITIES OF OBTAINING HIGHLY DISPERSED MAGNETITE BY THE METHOD OF CHEMICAL CONDENSATION. Journal of Magnetism and Magnetic Materials 1990, 85 (1-3), 7-10. 104. (a) Predoi, D.; Andronescu, E.; Radu, M.; Munteanu, M. C.; Dinischiotu, A., SYNTHESIS AND CHARACTERIZATION OF BIO-COMPATIBLE MAGHEMITE NANOPARTICLES. Digest Journal

Microfluidic Synthesis of Superparamagnetic Iron Oxide Nanocrystals for Magnetic Resonance Imaging
146
VIII
of Nanomaterials and Biostructures 2010, 5 (3), 779-786; (b) Predoi, D., A study on iron oxide nanoparticles coated with dextrin obtained by coprecipitation. Digest Journal of Nanomaterials and Biostructures 2007, 2 (1), 169-173; (c) Liu, G.; Hong, R. Y.; Guo, L.; Li, Y. G.; Li, H. Z., Preparation, characterization and MRI application of carboxymethyl dextran coated magnetic nanoparticles. Applied Surface Science 2011, 257 (15), 6711-6717. 105. Xie, J.; Peng, S.; Brower, N.; Pourmand, N.; Wang, S. X.; Sun, S. H., One-pot synthesis of monodisperse iron oxide nanoparticles for potential biomedical applications. Pure and Applied Chemistry 2006, 78 (5), 1003-1014. 106. Gore, J. C.; Majumdar, S., Superparamagnetic Iron Oxide Particles. Radiology 1988, 169 (3), 657-658. 107. Morris, G. A.; Freemont, A. J., DIRECT OBSERVATION OF THE MAGNETIZATION EXCHANGE DYNAMICS RESPONSIBLE FOR MAGNETIZATION TRANSFER CONTRAST IN HUMAN CARTILAGE INVITRO. Magnetic Resonance in Medicine 1992, 28 (1), 97-104. 108. Jang, J. T.; Nah, H.; Lee, J. H.; Moon, S. H.; Kim, M. G.; Cheon, J., Critical Enhancements of MRI Contrast and Hyperthermic Effects by Dopant-Controlled Magnetic Nanoparticles. Angewandte Chemie-International Edition 2009, 48 (7), 1234-1238. 109. (a) Chambers, R. D.; Fox, M. A.; Holling, D.; Nakano, T.; Okazoe, T.; Sandford, G., Elemental fluorine Part 16. Versatile thin-film gas-liquid multi-channel microreactors for effective scale-out. Lab on a Chip 2005, 5 (2), 191-198; (b) Chambers, R. D.; Fox, M. A.; Sandford, G., Elemental fluorine Part 18. Selective direct fluorination of 1,3-ketoesters and 1,3-diketones using gas/liquid microreactor technology. Lab on a Chip 2005, 5 (10), 1132-1139.
Chapter 8
Appendix

Microfluidic Synthesis of Superparamagnetic Iron Oxide Nanocrystals for Magnetic Resonance Imaging
147
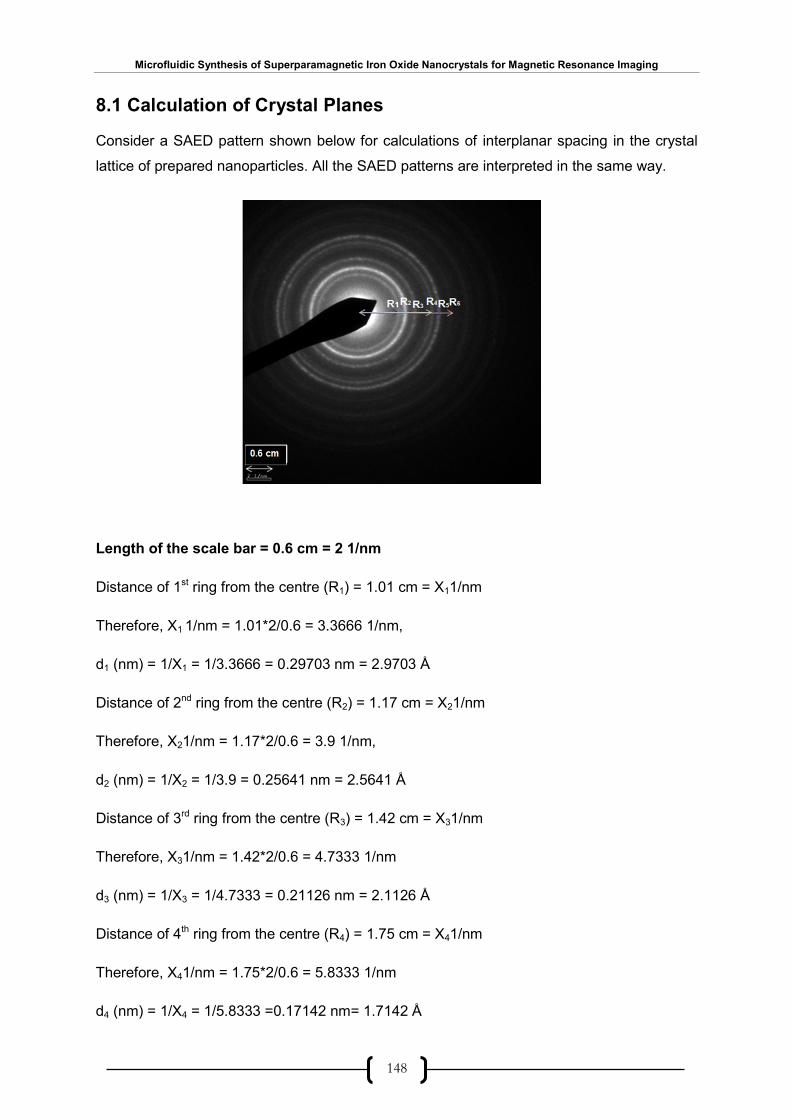
Microfluidic Synthesis of Superparamagnetic Iron Oxide Nanocrystals for Magnetic Resonance Imaging
148
8.1 Calculation of Crystal Planes
Consider a SAED pattern shown below for calculations of interplanar spacing in the crystal
lattice of prepared nanoparticles. All the SAED patterns are interpreted in the same way.
Length of the scale bar = 0.6 cm = 2 1/nm
Distance of 1st ring from the centre (R1) = 1.01 cm = X11/nm
Therefore, X1 1/nm = 1.01*2/0.6 = 3.3666 1/nm,
d1 (nm) = 1/X1 = 1/3.3666 = 0.29703 nm = 2.9703 Å
Distance of 2nd ring from the centre (R2) = 1.17 cm = X21/nm
Therefore, X21/nm = 1.17*2/0.6 = 3.9 1/nm,
d2 (nm) = 1/X2 = 1/3.9 = 0.25641 nm = 2.5641 Å
Distance of 3rd ring from the centre (R3) = 1.42 cm = X31/nm
Therefore, X31/nm = 1.42*2/0.6 = 4.7333 1/nm
d3 (nm) = 1/X3 = 1/4.7333 = 0.21126 nm = 2.1126 Å
Distance of 4th ring from the centre (R4) = 1.75 cm = X41/nm
Therefore, X41/nm = 1.75*2/0.6 = 5.8333 1/nm
d4 (nm) = 1/X4 = 1/5.8333 =0.17142 nm= 1.7142 Å
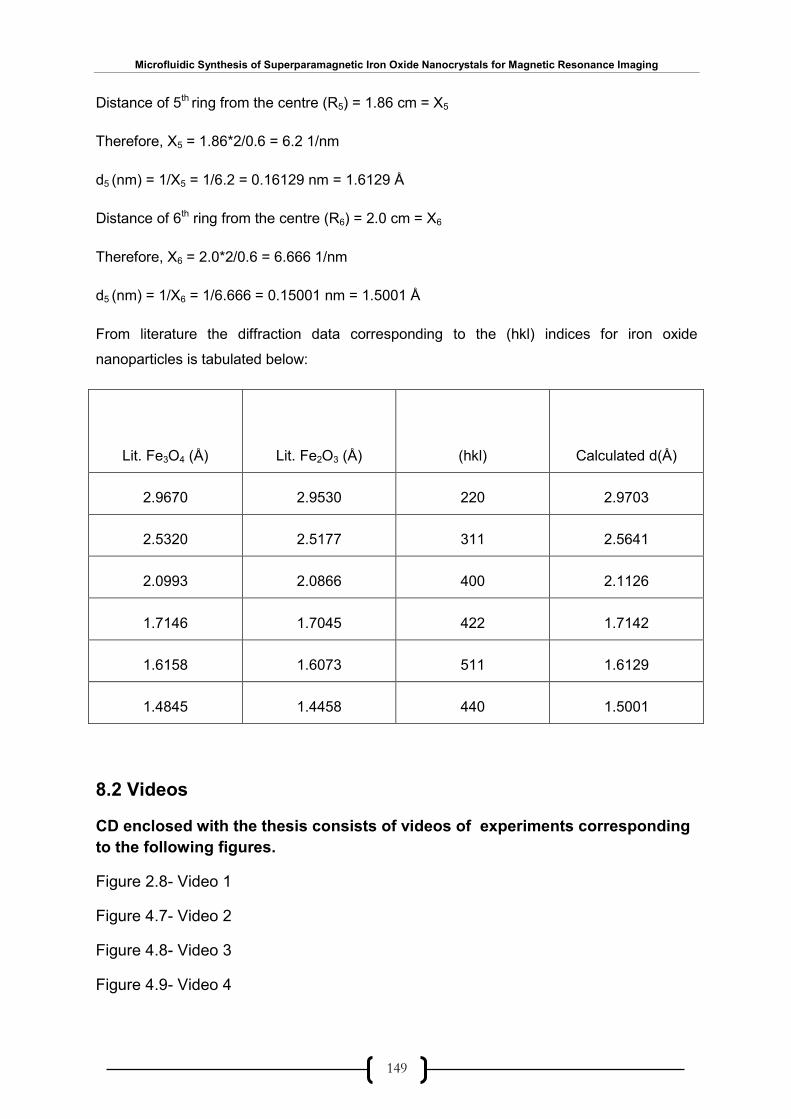
Microfluidic Synthesis of Superparamagnetic Iron Oxide Nanocrystals for Magnetic Resonance Imaging
149
Distance of 5th ring from the centre (R5) = 1.86 cm = X5
Therefore, X5 = 1.86*2/0.6 = 6.2 1/nm
d5 (nm) = 1/X5 = 1/6.2 = 0.16129 nm = 1.6129 Å
Distance of 6th ring from the centre (R6) = 2.0 cm = X6
Therefore, X6 = 2.0*2/0.6 = 6.666 1/nm
d5 (nm) = 1/X6 = 1/6.666 = 0.15001 nm = 1.5001 Å
From literature the diffraction data corresponding to the (hkl) indices for iron oxide
nanoparticles is tabulated below:
Lit. Fe3O4 (Å)
Lit. Fe2O3 (Å)
(hkl)
Calculated d(Å)
2.9670 2.9530 220 2.9703
2.5320 2.5177 311 2.5641
2.0993 2.0866 400 2.1126
1.7146 1.7045 422 1.7142
1.6158 1.6073 511 1.6129
1.4845 1.4458 440 1.5001
8.2 Videos
CD enclosed with the thesis consists of videos of experiments corresponding
to the following figures.
Figure 2.8- Video 1
Figure 4.7- Video 2
Figure 4.8- Video 3
Figure 4.9- Video 4

Microfluidic Synthesis of Superparamagnetic Iron Oxide Nanocrystals for Magnetic Resonance Imaging
150
Figure 4.12- Video 5
Figure 4.13- Video 6
Figure 4.17- Video 7
Figure 4.18- Video 8
Figure 4.22- Video 9
Figure 4.25-Video 10
Figure 4.26-Video 11
Figure 4.27-Video 12(inlet/outlet)
Figure 4.30-Video 10
Figure 5.5-Video 14
Figure 5.6-Video 15
Figure 5.6-Video 16