Microbiology of Vinegar: from Isolation, Phenetic ... · Microbiology of Vinegar: from Isolation,...
56
Microbiology of Vinegar: from Isolation, Phenetic Characterization and Detection of Acetic Acid Bacteria to Microbial Profiling of an Industrial Production João Nuno Serôdio de Melo Thesis to obtain the Master of Science Degree in Microbiology Supervisor(s): Prof. Rogério Paulo de Andrade Tenreiro Prof. Nuno Gonçalo Pereira Mira Examination Committee: Chairperson: Prof. Jorge Humberto Gomes Leitão Supervisor: Prof. Rogério Paulo de Andrade Tenreiro Member of the Committee: Prof. Rodrigo da Silva Costa December, 2016
Transcript of Microbiology of Vinegar: from Isolation, Phenetic ... · Microbiology of Vinegar: from Isolation,...
Microbiology of Vinegar: from Isolation, Phenetic Characterization and Detection of Acetic Acid Bacteria to
Microbial Profiling of an Industrial Production
João Nuno Serôdio de Melo
Thesis to obtain the Master of Science Degree in
Microbiology
Supervisor(s): Prof. Rogério Paulo de Andrade Tenreiro
Prof. Nuno Gonçalo Pereira Mira
Examination Committee:
Chairperson: Prof. Jorge Humberto Gomes Leitão
Supervisor: Prof. Rogério Paulo de Andrade Tenreiro
Member of the Committee: Prof. Rodrigo da Silva Costa
December, 2016

ii
Acknowledgements
I would like to express my sincere gratitude to my supervisor, Professor Rogério Tenreiro, for giving
me this opportunity and for all his support and guidance throughout the last year. I have truly learned
immensely working with you.
Also, I would like to show appreciation to my supervisor from IST, Professor Nuno Mira, for his support
along the development of this thesis.
I would also like to thank Professor Ana Tenreiro for all her time and help, especially with the flow
cytometry assays. Additionally, I’d like to thank Professor Lélia Chambel for her help with the
Bionumerics software.
I would like to thank Filipa Antunes, from the Lab Bugworkers | M&B-BioISI, for the remarkable
organization of the lab and for all her help.
I would like to express my gratitude to Mendes Gonçalves, S.A. for the opportunity to carry out this
thesis and for providing support during the whole course of this project. Special thanks to Cristiano
Roussado for always being available.
Also, a big thank you to my colleagues and friends, Catarina, Sofia, Tatiana, Ana, Joana, Cláudia,
Mariana, Inês and Pedro for their friendship, support and for this enjoyable year, especially to Ana
Marta Lourenço for her enthusiastic Gram stainings.
Finally, I’d like to thank my family and friends for all the help and support, especially my Dad.

iii
Abstract
Acetic acid bacteria (AAB) are strictly aerobic Alphaproteobacteria known for their ability to oxidize
ethanol into acetic acid. Currently, one of the limitations of the vinegar industry is the lack of adequate
monitoring methodologies, the use of an undefined microbial community as inoculum and the
unavailability of starter cultures. AAB were isolated from a variety of vinegars and were grouped into
five strains based on two genomic fingerprinting techniques, GTG5-REP-PCR and PH-RAPD-PCR.
Isolates belonging to all strains were selected for the amplification and sequencing of the 16S rRNA
gene. Homology search and phylogenetic reconstruction positioned all strains in the genus
Komagataeibacter, although the identification to the species level of any of the strains was not
possible. Four strains were grown in red wine in order to evaluate the suitability of the employment of
these strains as starter cultures. Strains 1 and 3 show desirable characteristics of an optimal acetic
acid bacteria starter, such as a short lag phase, high cell yield, no ethanol overoxidation and no
cellulose production. A molecular detection method for acetic acid bacteria was developed targeting
the adhA gene. This methodology proved to be fast and reliable in the distinction of acetic acid
bacteria from non-AAB isolates. Lastly, microbial community DNA was extracted from five vinegar
samples, corresponding to different stages of a red wine vinegar production cycle. Two regions of the
16S rRNA gene were amplified, sequenced by Next Generation Sequencing and identified by
homology search. The results showed that Komagataeibacter spp. clearly dominate this process.
Keywords: acetic acid bacteria (AAB); genomic fingerprinting; starter culture; adhA detection; microbial
profiling of vinegar.
iv
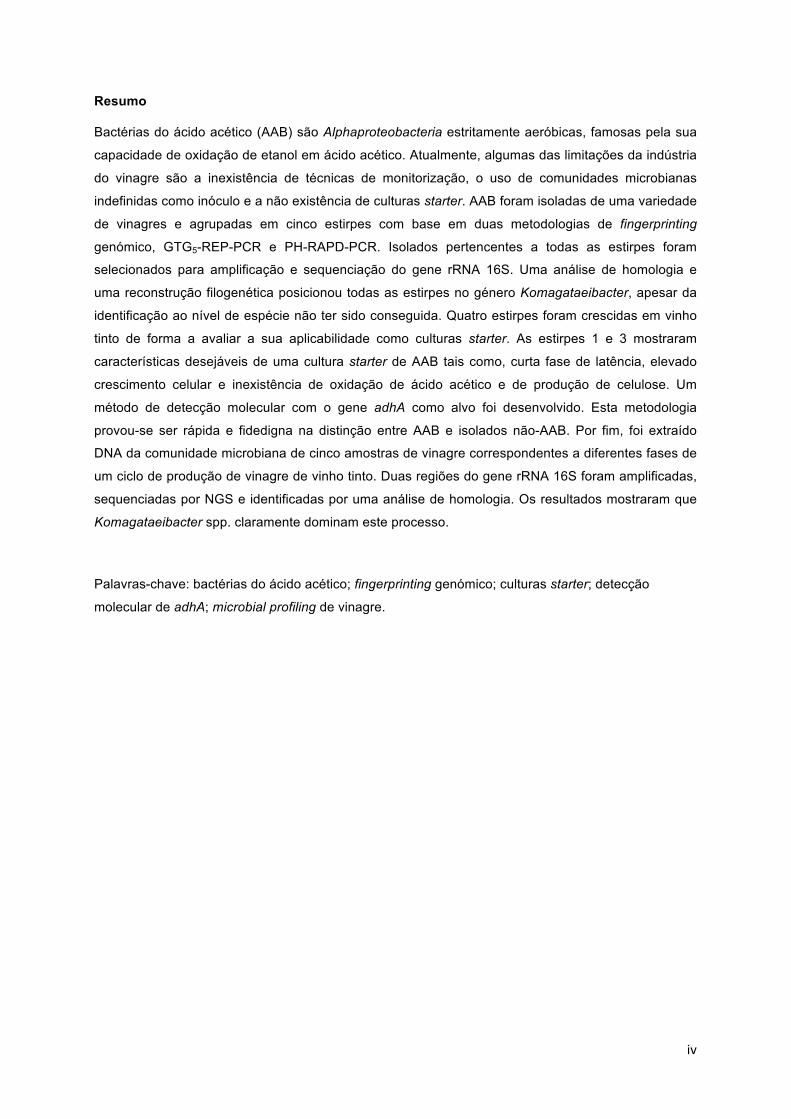
Resumo
Bactérias do ácido acético (AAB) são Alphaproteobacteria estritamente aeróbicas, famosas pela sua
capacidade de oxidação de etanol em ácido acético. Atualmente, algumas das limitações da indústria
do vinagre são a inexistência de técnicas de monitorização, o uso de comunidades microbianas
indefinidas como inóculo e a não existência de culturas starter. AAB foram isoladas de uma variedade
de vinagres e agrupadas em cinco estirpes com base em duas metodologias de fingerprinting
genómico, GTG5-REP-PCR e PH-RAPD-PCR. Isolados pertencentes a todas as estirpes foram
selecionados para amplificação e sequenciação do gene rRNA 16S. Uma análise de homologia e
uma reconstrução filogenética posicionou todas as estirpes no género Komagataeibacter, apesar da
identificação ao nível de espécie não ter sido conseguida. Quatro estirpes foram crescidas em vinho
tinto de forma a avaliar a sua aplicabilidade como culturas starter. As estirpes 1 e 3 mostraram
características desejáveis de uma cultura starter de AAB tais como, curta fase de latência, elevado
crescimento celular e inexistência de oxidação de ácido acético e de produção de celulose. Um
método de detecção molecular com o gene adhA como alvo foi desenvolvido. Esta metodologia
provou-se ser rápida e fidedigna na distinção entre AAB e isolados não-AAB. Por fim, foi extraído
DNA da comunidade microbiana de cinco amostras de vinagre correspondentes a diferentes fases de
um ciclo de produção de vinagre de vinho tinto. Duas regiões do gene rRNA 16S foram amplificadas,
sequenciadas por NGS e identificadas por uma análise de homologia. Os resultados mostraram que
Komagataeibacter spp. claramente dominam este processo.
Palavras-chave: bactérias do ácido acético; fingerprinting genómico; culturas starter; detecção
molecular de adhA; microbial profiling de vinagre.

v
Table of Contents
Acknowledgements ............................................................................................................... ii
Abstract .................................................................................................................................. iii
Resumo .................................................................................................................................. iv
List of Figures ...................................................................................................................... vii
List of Tables ....................................................................................................................... viii
List of Abbreviations ............................................................................................................ ix
1. Introduction ........................................................................................................................ 1
1.1 Acetic Acid Bacteria: an Overview ................................................................................................ 1
1.1.1 Taxonomy ............................................................................................................................... 1
1.1.2 Ecology ................................................................................................................................... 5
1.1.3 Physiology .............................................................................................................................. 6
1.1.4 Biotechnological Applications ............................................................................................... 11
1.1.4.1 Wine Vinegar ................................................................................................................ 11
1.1.4.2 Other Types of Vinegar ................................................................................................ 14
1.1.4.3 Bacterial Cellulose ........................................................................................................ 15
1.2 Thesis Scope and Goals ............................................................................................................ 17
2. Methods ............................................................................................................................ 18
2.1 Vinegar Samples and Bacterial Strains ...................................................................................... 18
2.2 Isolation of Acetic Acid Bacteria ................................................................................................. 19
2.3 Genomic Fingerprinting: RAPD-PCR, REP-PCR and ERIC-PCR .............................................. 19
2.4 Molecular Identification by 16S rRNA Gene Sequencing ........................................................... 20
2.5 Multiplex-PCR: Primer Design and PCR Conditions .................................................................. 21

vi
2.6 Growth Analysis and Quantification of Acetic Acid ..................................................................... 22
2.7 Microbial Profiling Analysis ......................................................................................................... 23
3. Results and Discussion ................................................................................................... 24
3.1 Isolation of Acetic Acid Bacteria ................................................................................................. 24
3.2 Typing and Identification of Acetic Acid Bacteria Isolates .......................................................... 26
3.3 Development of a Molecular Detection Method for Acetic Acid Bacteria ................................... 30
3.4 Growth Performance of Acetic Acid Bacteria in Red Wine ......................................................... 34
3.5 Microbial Community of a Red Wine Vinegar Production Cycle ................................................. 37
4. Final Remarks and Future Perspectives ........................................................................ 40
5. References ........................................................................................................................ 42
Annexes ................................................................................................................................ 44
vii
List of Figures
Figure 1. Neighbor-joining phylogenetic tree of acetic acid bacteria. ....................................................4
Figure 2. Simplistic representation of the respiratory chain of acetic acid bacteria. ..............................8
Figure 3. Representation of ethanol oxidation of acetic acid bacteria, both at a periplasmic level
(incomplete oxidation) and cytoplasmic level (complete oxidation). .......................................................9
Figure 4. Representation of a typical diauxic growth curve of acetic acid bacteria capable of oxidizing
acetic acid to carbon dioxide and water (complete oxidation). ...............................................................9
Figure 5. Number of different isolates obtained from each vinegar sample, with the direct and
enrichment approaches. .......................................................................................................................24
Figure 6. REP-PCR (GTG5) and RAPD-PCR (PH) fingerprinting patterns from acetic acid bacteria
isolates and four reference strains belonging to the genus Komagataeibacter. ...................................27
Figure 7. Phylogenetic relationships amongst all species of the genus Komagataeibacter and acetic
acid bacteria isolates. ...........................................................................................................................29
Figure 8. Typical Multiplex-PCR profile of acetic acid bacteria, as well as of bacterial isolates not
belonging to this group. ........................................................................................................................32
Figure 9. Growth characteristics of strains of acetic acid bacteria in diluted wine.
...............................................................................................................................................................35
Figure 10. Representation of the proportion of acetic acid bacteria in each time-point. ......................37
Figure 11. Representation of the proportion of acetic acid bacteria in each time-point. ......................38

viii
List of Tables
Table 1. List of all genera, with standing in nomenclature, where acetic acid bacteria are included, as
well as the abbreviation used in this study. ...........................................................................................2
Table 2. List of strains used in this study as reference strains. ...........................................................18
Table 3. List of the adhA directed primers. ..........................................................................................21
Table 4. List of acetic acid bacteria isolated from samples of vinegar produced and/or processed by
Mendes Gonçalves. ..............................................................................................................................25
Table 5. Sequential approach to the optimization of the amplification reaction with the designed
primers (ADH-F1, ADH-F2, ADH-R1 and ADH-R2). ...............................................................................31
Table 6. Growth characteristics of isolates AAB 023, 030, 033 and 034, equivalent to strains 3, 1, 5
and 4, respectively. ...............................................................................................................................36
ix
List of Abbreviations
AAB acetic acid bacteria
ACS acetyl-CoA synthase
ADH alcohol dehydrogenase
ALDH aldehyde dehydrogenase
BLAST Basic Local Alignment Search Tool
CECT Spanish Type Culture Collection
CIO cyanide-insensitive oxidase
DGGE Denaturing Gradient Gel Electrophoresis
DSMZ German Collection of Microorganisms and Cell Cultures
ERIC-PCR Enterobacterial Repetitive Intergenic Consensus PCR
FAD flavin adenine dinucleotide
ITS Internal Transcribed Spacer
MCD molybdenum-molybdopterin cytosine dinucleotide
MG Mendes Gonçalves S.A.
MLSA Multilocus Sequence Analysis
NAD nicotinamide adenine dinucleotide
NGS next-generation sequencing
OD optical density
PQQ pyrroloquinoline quinone
RAPD-PCR Randomly Amplified Polymorphic DNA PCR
REP-PCR Repetitive Extragenic Palindromic PCR
TBV traditional balsamic vinegar
TCA tricarboxylic acid
UQ ubiquinone
VBNC viable but not cultivable

1
1. Introduction
1.1 Acetic Acid Bacteria: an Overview
Acetic acid bacteria are Gram negative, rod-shaped, peritrichously or polarly flagellated when motile,
mesophilic and obligate aerobes. Most are catalase positive and oxidase negative. These bacteria are
capable of oxidizing sugars, sugar alcohols and alcohols to corresponding acids
[Komagata et al., 2014]. They also exhibit resistance to high acetic acid concentrations at low pH.
Acetic acid bacteria not only play a positive role in the production of a variety of foods and beverages,
such as vinegars, kombucha, cocoa and nata de coco, but they can also occur as spoilers of other
foods and beverages, such as wine, soft drinks and fruits [Raspor et al., 2008]. In recent years, acetic
acid bacteria have been the object of extensive research, resulting in a significant restructuration of
their taxonomy and advances in understanding their physiology, metabolism and molecular biology
and in methods for their isolation and identification [Raspor et al., 2008].
The famous ability of this group of bacteria to oxidize ethanol to acetic acid is due to two key
membrane-bound enzymes, alcohol dehydrogenase (ADH) and aldehyde dehydrogenase (ALDH).
Both these enzymes are bound to the cytoplasmatic membrane and face the periplasmic space
[Sievers & Swings, 2005]. This special type of metabolism differentiates them from all other bacteria.
Interestingly, although some of the biotechnological applications of acetic acid bacteria have been
practiced for many years, at an industrial scale, much of the knowledge required for a thorough
understanding of these processes is still absent. This lack of knowledge is the result of an
acknowledged difficulty in handling acetic acid bacteria in a series of routine microbiology techniques,
mainly in their isolation and cultivation on solid media [Raspor et al., 2008].
1.1.1 Taxonomy
The generic name Acetobacter was first introduced for acetic acid bacteria by Beijerinck (1898), with
the type species Acetobacter aceti. Two other species were subsequently described, Acetobacter
pasteurianus and Acetobacter peroxydans (Beijerinck and Folpmers 1916; Visser’t Hooft 1925,
respectively). Gluconobacter was proposed as a new genus of acetic acid bacteria by Asai (1934,
1935) for strains that lacked the capacity for the oxidation of acetic acid, in contrast to the strains of
the genus Acetobacter, which were capable of oxidizing acetic acid to carbon dioxide and water
[Raspor et al., 2008].
In the Approved List of Bacterial Names (Skerman et al. 1980), the family Acetobacteraceae was
introduced for the two genera of acetic acid bacteria, Acetobacter with the three species mentioned
above and Gluconobacter as a monotypic genus, with Gluconobacter oxydans as its type species
[Raspor et al., 2008]. Since then, the Acetobacteraceae family has suffered countless taxonomic
changes, where many genera and species have been newly described [Sievers & Swings, 2005].
This family is taxonomically included in the phylum Proteobacteria, the class Alphaproteobacteria and
the order Rhodospirillales, and 36 genera are currently described, with standing in nomenclature.
Acetobacter is the type genus. The genera can be divided in 2 groups, an acetous group and an

2
acidophilic group, based on phylogeny, ecology and biotechnological applications
[Komagata et al., 2014]. The acetic acid bacteria are included in the former group, the acetous group.
Currently, acetic acid bacteria are distributed in 18 genera, with standing in nomenclature. A list of all
genera where acetic acid bacteria are included is presented in Table 1.
Table 1. List of all genera, with standing in nomenclature, where acetic acid bacteria are included, as well as the abbreviation used in this study. The information shown in this table was collected from Matsushita et al. (2016), with the
exception of the information regarding the genus Bombella, which was collected from Li et al. (2015).
Genus Abbreviation Reference
Acetobacter A. Beijerinck 1898
Gluconobacter G. Asai 1935
Acidomonas Ac. Urakami et al. 1989 emend. Yamashita et al. 2004
Gluconacetobacter Ga. Yamada et al. 1998
Asaia As. Yamada et al. 2000
Kozakia K. Lisdiyanti et al. 2002
Swaminathania S. Loganathan and Nair 2004
Saccharibacter Sc. Jojima et al. 2004
Neoasaia N. Yukphan et al. 2006
Granulibacter Gr. Greenberg et al. 2006
Tanticharoenia T. Yukphan et al. 2008
Ameyamaea Am. Yukphan et al. 2010
Neokomagataea Nk. Yukphan et al. 2011
Komagataeibacter Km. Yamada et al. 2013
Endobacter E. Ramírez-Bahena et al. 2013
Nguyenibacter Ng. Vu et al. 2013
Swingsia Sw. Malimas et al. 2014
Bombella B. Li et al. 2015
Five genera retain most species of acetic acid bacteria: Acetobacter (25 species), Gluconobacter (14),
Gluconacetobacter (11), Asaia (8) and Komagataeibacter (13). The remaining 13 genera are
monotypic, with the exception of the genus Neokomagataea, which has 2 species. Two genera,
Acetobacter and Komagataeibacter, are generally responsible for the wine vinegar production
process.
Identification. Originally, the taxonomy of acetic acid bacteria was based on morphological and
physiological criteria. However, phenotypic identification of strains of this group of bacteria, particularly
on the species level, is not only inaccurate, but also time consuming. The main reason for this difficulty
is the instability of physiological traits, due to the presence of insertion elements in the genome of

3
acetic acid bacteria, as well as the difficulty in managing these bacteria in routine laboratory
techniques, due to their slow growth [Raspor et al., 2008].
Recent advances in molecular techniques, as well as the development of new culture media and
isolation procedures, have led to the noticeable restructuration of acetic acid bacteria taxonomy and
classification. Nowadays, classification of acetic acid bacteria is particularly dependent on molecular
approaches. The most common molecular techniques applied revolve around the sequencing or
restriction analysis of the 16S rRNA gene and/or of the 16S-23S rRNA Internal Transcribed Spacer
(ITS), as well as the application of these molecular targets in Denaturing Gradient Gel Electrophoresis
(DGGE). However, the 16S rRNA gene sequences of acetic acid bacteria are very similar to each
other, which may cause problems in identification when working solely with this gene
[Guillamón et al., 2009].
From a biotechnological point of view, the discrimination or typing of different strains can be significant
since strains within a species may not exhibit the same phenotypic characteristics, mainly the
productivity in terms of ethanol oxidation. Some studies have reported the applicability of molecular
techniques to this goal. Generally, PCR-based techniques are employed, such as Randomly Amplified
Polymorphic DNA (RAPD-PCR) [Chambel et al., 2007; Nanda et al., 2001], Repetitive Extragenic
Palindromic sequences (REP-PCR) [Cleenwerck et al., 2010; De Vuyst et al., 2008] and
Enterobacterial Repetitive Intergenic Consensus sequences (ERIC-PCR) [Férnandez-
Pérez et al., 2010; Vegas et al., 2010].
Phylogenetic relationships amongst acetic acid bacteria.
The relationships currently acknowledged amongst acetic acid bacteria are represented in Figure 1,
extracted from Matsushita et al. (2016) with the exception of the genus Bombella. Nevertheless, the
approximate phylogenetic position of this genus is indicated, based on the information provided by the
study describing this new genus [Li et al., 2015]. Acidocella facilis ATCC 35904T, a member of the
acidophilic group of the Acetobacteraceae family, was used as an outgroup.
The major taxonomic rearrangements that occurred in the acetous group of this family of bacteria are
clearly depicted in the presented phylogeny, namely the elevation to the genus level of the sub-genus
Gluconacetobacter and of Acetobacter methanolica, with the type species Gluconacetobacter
liquefaciens and Acidomonas methanolica, respectively, and the separation of the two subclusters of
the genus Gluconacetobacter with the proposal of Komagataeibacter as a new genus, being
Komagataeibacter xylinus the type species. The type strain of Gluconacetobacter entanii was not
available in any culture collection and so, the species could not be listed as a new combination,
according to Rule 27 of the Bacteriological Code [Yamada et al., 2012]. It is interesting to note that
most species of the genera Gluconacetobacter, Komagataeibacter and Acidomonas once belonged to
the genus Acetobacter.
Since Acetobacter and Komagataeibacter, as already referred, are mostly implicated in wine vinegar
production, a short taxonomic description of each genus is presented.

4
Figure 1. Neighbor-joining phylogenetic tree of acetic acid bacteria. The phylogenetic tree was constructed with Mega
5.05, based on 16S rRNA gene sequences (1213 bases). Numbers at branch nodes represent bootstrap values (%) derived
from 1000 replications. Acidocella facilis ATCC 35904T was used as an outgroup. Extracted from Matsushita et al. (2016). The
(*) indicates the approximate position of the genus Bombella, according to Li et al. (2015).
Acetobacter ghanensis 430AT (EF030713)Acetobacter syzygii 9H-2T (AB052712)Acetobacter lambici LMG 27439T (HF969863)Acetobacter okinawensis 1-35T (AB665068)
Acetobacter fabarum R-36330T (AM905849)Acetobacter lovaniensis LMG 1617T (AJ419837)
Acetobacter pomorum LMG 18848T (AJ419835)Acetobacter pasteurianus LMD 22.1T (X71863)
Acetobacter peroxydans NBRC 13755T (AB032352)Acetobacter papayae 1-25T (AB665066)
Acetobacter sicerae LMG 1531T (AJ419840)Acetobacter aceti NBRC 14818T (X74066)Acetobacter nitrogenifigens RG1T (AY669513)Acetobacter oeni B13T (AY829472)
Acetobacter estunensis LMG 1626T (AJ419838)Acetobacter malorum LMG 1746T (AJ419844)
Acetobacter cerevisiae LMG 1625T (AJ419843)Acetobacter orleanensis LMG 1583T (AJ419845)Acetobacter farinalis G360-1T (AB602333)
Acetobacter persici T-120T (AB665070)Acetobacter indonesiens NRIC 0313T (AB032356)Acetobacter orientalis 21F-2T (AB052706)
Acetobacter cibinongensis 4H-1T (AB052710)Acetobacter tropicalis NRIC 0312T (AB032354)
Acetobacter senegalensis CWBI-B418T (AY883036)Gluconobacter albidus NBRC 3250T (AB178392)Gluconobacter cerevisiae LMG 27748T (HG329624)Gluconobacter kondonii NBRC 3266T (AB178405)Gluconobacter sphaericus NBRC 12467T (AB178431)Gluconobacter kanchanaburiensis BCC 15889T (AB459530)Gluconobacter roseus NBRC 3990T (AB178429)Gluconobacter oxydans NBRC 14819T (X73820)
Gluconobacter uchimurae ZW160-2T (AB193244)Gluconobacter cerinus NBRC 3267T (AB063286)
Gluconobacter nephelii RBY-1T (AB540148)Gluconobacter wancherniae NBRC 103581T (AB511060)Gluconobacter thailandicus F149-1T (AB128050)Gluconobacter frateurii NBRC 3264T (X82290)
Gluconobacter japonicus NBRC 3271T (AB253435)Swingsia samuiensis AH83T (AB786666)
Neokomagataea thailandica BCC 25710T (AB513363)Neokomagataea tanensis BCC 25711T (AB513364)
Saccharibacter floricola S-877T (AB110421)Ameyamaea chiangmaiensis BCC 15744T (AB303366)
Tanticharoenia sakaeratensis NBRC 103193T (AB304087)Kozakia baliensis Yo-3T (AB056321)
Neoasaia chiangmaiensis AC28T (AB524503)Swaminathania salitolerans PA51T (AF459454)
Asaia krungthepensis AA08T (AB102953)Asaia bogorensis 71T (AB025928)
Asaia lannensis BCC 15733T (AB286050)Asaia prunellae T-153T (AB485741)Asaia astilbis T-6133T (AB485740)Asaia platycodi T-683T (AB485739)
Asaia spathodeae GB23-2T (AB511277)Asaia siamensis S60-1T (AB035416)
Acidomonas methanolica LMG 1668T (X77468)Gluconacetobacter tumulisoli T611xx-1-4aT (AB778530)Gluconacetobacter johannae CFN-Cf55T (AF111841)Gluconacetobacter azotocaptans CFN-Ca54T (AF192761)
Gluconacetobacter diazotrophicus PAl 5T (CP001189)Gluconacetobacter asukensis K8617-1-1bT (AB627120)Gluconacetobacter aggeris T6203-4-1aT (AB778526)Gluconacetobacter tumulicola K5929-2-1bT (AB627116)
Gluconacetobacter sacchari SRI 1794T (AF127407)Gluconacetobacter liquefaciens IFO 12388T (X75617)
Gluconacetobacter takamatsuzukensis T61213-20-1aT (AB778531)Nguyenibacter vanlangensis TN01LGIT (AB739062)
Komagataeibacter intermedius TF2T (Y14694)Komagataeibacter oboediens DSM 11826T (AB205221)Komagataeibacter medellinensis LMG 1693T (JX013852)Komagataeibacter swingsii DST GL01T (AY180960)Komagataeibacter europaeus DSM 6160T (Z21936)Komagataeibacter nataicola LMG 1536T (AB166743)
Komagataeibacter xylinus NCIMB 11664T (X75619)Komagataeibacter sucrofermentans LMG 18788T (AJ007698)
Komagataeibacter rhaeticus DST GL02T (AY180961)Komagataeibacter kakiaceti G5-1T (AB607833)
Komagataeibacter saccharivorans LMG 1582T (AB166740)Gluconacetobacter entanii LTH4560T (AJ251110)Komagataeitobacter maltaceti LMG 1529T (HE866758)
Komagataeibacter hansenii NCIMB 8746T (X75620)Endobacter medicaginis M1MS02T (JQ436923)
Granulibacter bethesdensis CGDNIH1T (AY788950)Acidocella facilis ATCC 35904T (D30774)
100
100
100
85
99
65
99
62
55
42
99
5043
78
6851
40
28
99
6741
31
25
32
20
45
98
92
72
52
32
96
94
5093
92
5765
91
90
89
6788
41
51
83
72
71
87
85
4682
33
48
77
57
61
60
54
46
42
51
41
47
69
64
52
37
28
31
61
50
44
33
26
15
12
25
41
0.01
Knuc
Fig. 1.1 A neighbor-joining phylogenetic tree of acetic acid bacteria. The phylogenetic tree basedon 16S rRNA gene sequences of 1213 bases was constructed by using MEGA 5.05 (Tamuraet al. 2011). Numerals at the nodes of respective branches indicate bootstrap values (%) derivedfrom 1000 replications
4 Y. Yamada
*

5
Acetobacter Beijerinck 1898
This genus was named after the Latin word for vinegar, acetum. Acetobacter is the oldest genus in the
classification of acetic acid bacteria and is the type genus of the family Acetobacteraceae.
Cells are Gram negative rods, ellipsoidal to rod shaped, occurring singly, in pairs or in chains. Most
are peritrichously flagellated when motile. Colonies are generally circular, smooth, entire, cream to
beige color and opaque. Strictly aerobic, catalase positive (except for A. peroxydans) and oxidase
negative. A minority of strains produce a water-soluble brown pigment. Acetic acid is produced from
ethanol and acetate and lactate are oxidized to carbon dioxide and water. In the type strain of A. aceti,
acid is produced from L-arabinose, D-xylose, D-glucose, D-galactose, D-mannose, or ethanol. Most
species are not able to grow on 30% D-glucose (w/v). Optimal growth temperature is around 30ºC.
Growth generally occurs at 37ºC and pH 3.5. The major quinone is Q-9. The mol% G+C of the DNA
ranges from 53.5 to 60.7 [Matsushita et al., 2016, Sievers & Swings, 2005].
Komagataeibacter Yamada et al. 2013
This genus was named in honor of Dr. Kazuo Komagata, a Japanese microbiologist, Professor of The
University of Tokyo, Japan, who contributed to bacterial systematics, particularly of acetic acid
bacteria. The genus Gluconacetobacter was divided into two genera, the genus Gluconacetobacter
Yamada et al. 1998 and the genus Komagataeibacter Yamada et al. 2013, on the basis of 16S rRNA
gene and morphological, physiological and ecological characterizations. Ten species of the genus
Gluconacetobacter were transferred to the genus Komagataeibacter as new combinations, with
Komagataeibacter xylinus as the type species. Recently, three new combinations were described, also
transferred from the genus Gluconacetobacter, on the basis of phylogenetic relationships
[Matsushita et al., 2016].
Cells of this genus are Gram negative rods, occurring singly, in pairs or in chains. Most are non-motile.
Colonies are described as circular, smooth or rough and white-creamy to beige. Strictly aerobic,
catalase positive and oxidase negative. Acetic acid is produced from ethanol and acetate and lactate
are oxidized to carbon dioxide and water. Acid is produced from L-arabinose, D-xylose, D-glucose, D-
galactose, and ethanol. Cellulosic materials are produced by some strains, particularly of Km. xylinus
and Km. nataicola. A water-soluble brown pigment is not produced on GYC medium. Growth generally
occurs in the presence of 0.35% acetic acid (v/v), as well as at pH 3.0. Some species require acetic
acid for growth. The major quinone is Q-10. The mol% G+C of the DNA ranges from 58 to 64
[Komagata et al., 2014; Matsushita et al., 2016].
1.1.2 Ecology
Acetic acid bacteria have been isolated from both natural and artificial environments. Naturally they
occur in fruits, flowers, palm sap, garden soil, and various insects, like honeybees, mosquitoes, flies
and leafhoppers [Komagata et al., 2014; Raspor et al., 2008]. Some species have been described as
6
nitrogen fixers and can be found inhabiting the roots and stems of plants [Raspor et al., 2008]. Acetic
acid bacteria are also able to grow in artificial and man-made environments, that include vinegar,
grape wine, palm wine, soft drinks, cider, beer, kefir, sugar cane juice and canal water
[Raspor et al., 2008].
Acetobacter strains prefer alcohol-enriched and acidic environments like vinegar, wine, beer and other
alcoholic beverages, in contrast to Gluconobacter strains, which prefer sugar-enriched environments
like fruits and flowers. The genus Komagataeibacter has niches in acetous materials such as a variety
of vinegars and fruit juices. Gluconacetobacter strains have been isolated from vinegar, fruits, dried
fruits and the rhizosphere of plants. Asaia strains are commonly found in a large variety of flowers.
Acidomonas methanolica strains were amply isolated from activated sludge samples, but were not
found in vegetables or fruits. Strains of the genera Ameyamaea, Neoasaia, Neokomagataea, Swingsia
and Bombella were isolated from a variety of flowers. Swaminathania and Nguyenibacter were
isolated from the rhizosphere of rice. Kozakia strains were isolated from palm brown sugar and
Endobacter strains were isolated from alfalfa. Granulibacter strains were isolated from three patients
with chronic granulomatous disease. Lastly, a Tanticharoenia sakaeratensis strain was isolated from a
soil sample and strains from Saccharibacter floricola were isolated from pollens in Japan
[Komagata et al., 2014; Li et al., 2015; Matsushita et al., 2016].
Pathogenicity. Due to the ecology and the common sources of isolation of acetic acid bacteria, the
pathogenicity of this group of bacteria has been entirely ignored until recently. Acetic acid bacteria are
clearly different from generally known bacteria of clinical importance when it comes to their growth
responses, general phenotype and phylogenetic relationships. Additionally, acetic acid bacteria have
shown resistance to a wide variety of antibiotics and, for this reason, have drawn attention from
clinicians as newly emerging opportunistic pathogens [Komagata et al., 2014].
Almost all of the medical records related to acetic acid bacteria report the isolation of a Gram negative
rod unidentifiable by conventional commercial identification systems. These organisms were isolated
either from lesions of patients with Chronic Granulomatous Disease, sputum of patients with Cystic
Fibrosis or blood of patients with a history of drug use and/or patients undergoing hemo-dialysis for
end-stage renal failure. In all cases, identification was only possible by sequencing of the 16S rRNA
gene, resulting in identification either to the genus-level or species-level. These isolates include
Gr. bethesdensis, As. bogorensis, As. lannensis, A. cibinogensis, A. indonesiensis, Ac. methanolica
and Gluconobacter spp.. The sources and routes of infection of acetic acid bacteria are still unknown
[Komagata et al., 2014].
1.1.3 Physiology
As mentioned before, acetic acid bacteria are biochemically quite unique since they are specialized in
the incomplete oxidation of sugars, sugar alcohols and ethanol that leads to an uncommon growth
behavior and response to extreme culture conditions [Deppenmeier et al., 2002]. Because these

7
oxidative bacteria do not oxidize sugars or alcohols completely to CO2 and H2O, or at least not in their
early growth phase, they accumulate the corresponding incomplete oxidation products in the growth
medium, in large quantities [Matsushita, 2004]. Interestingly, the complete genome sequence of a
Gluconobacter oxydans strain revealed 75 open reading frames for putative
dehydrogenases/oxidoreductases of unknown function [Prust et al., 2005].
Gluconobacter species display highly active oxidation reactions on sugars and sugar alcohols, while
Acetobacter and Komagataeibacter species have a highly active ethanol-oxidizing activity but fewer
sugar- and sugar alcohol-oxidizing activity [Matsushita, 2004].
In addition to energy generation for cell growth, the oxidative respiration of acetic acid bacteria is
critical in the accumulation of oxidative products in their environment. Most of these acidic oxidation
products, such as acetic acid, are detrimental to other microorganisms and thus contribute to the
fitness of acetic acid bacteria in highly competitive environments, such as fruits and flowers.
Furthermore, the rapid oxidation of sugars and sugar alcohols in the media leads to the depletion of
available carbon sources, further disrupting competitive microorganisms. Thus, acetic acid bacteria
seem to be well adapted to specific environments where high concentration of sugars and sugar
alcohols occur, in highly aerobic conditions [Matsushita et al., 2016; Prust et al., 2005].
Bioenergetics. The respiratory chain of acetic acid bacteria is rather simple with respect to their
arrangements of the respiratory components [Matsushita, 2004]. Oxidation reactions of sugars, sugar
alcohols and alcohols are essentially carried out by specific membrane-bound dehydrogenases,
directly linked to the respiratory chain, anchored in the periplasmic side of the cytoplasmic membrane
of the bacteria [Komagata et al., 2014]. These membrane-bound dehydrogenases have been
classified as quinoproteins and quinoproteins-cytochrome complex (having pyrroloquinoline quinone,
PQQ, as a covalently-bound prosthetic group), flavoproteins-cytochrome complex (having flavin
adenine dinucleotide, FAD, as a covalently-bound prosthetic group) and molybdoprotein-cytochrome
complex (having molybdenum-molybdopterin cytosine dinucleotide, MCD, as a covalently-bound
prosthetic group), as illustrated in Figure 2. These organisms lack a proton-translocating
NADH:ubiquinone oxidoreductase (complex I) and a cytochrome c oxidase (complex IV), which means
that they have a limited ability to translocate protons in the course of redox reactions
[Prust et al., 2005].
The core system is composed of many primary membrane-bound dehydrogenases and terminal
ubiquinol oxidase(s), both connected by a ubiquinone (UQ). The UQ present in the respiratory chain of
Acetobacter species is mainly ubiquinone-9, whereas ubiquinone-10 is mostly present in the
remaining genera of acetic acid bacteria [Matsushita, 2004]. Generally, acetic acid bacteria seem to
express at least two different types of terminal ubiquinol oxidases, ba3 (G. oxydans seems to express
bo3 type) and cyanide-insensitive oxidase (CIO). The ba3 type is described as having a proton
translocating ability, while CIO type does not. The CIO seems to be more expressed in lower pH
conditions, although its physiological function is not yet clear [Matsushita et al., 2016;
Prust et al., 2005]. Oxygen is the final electron acceptor, resulting in the formation of H2O and proton
8
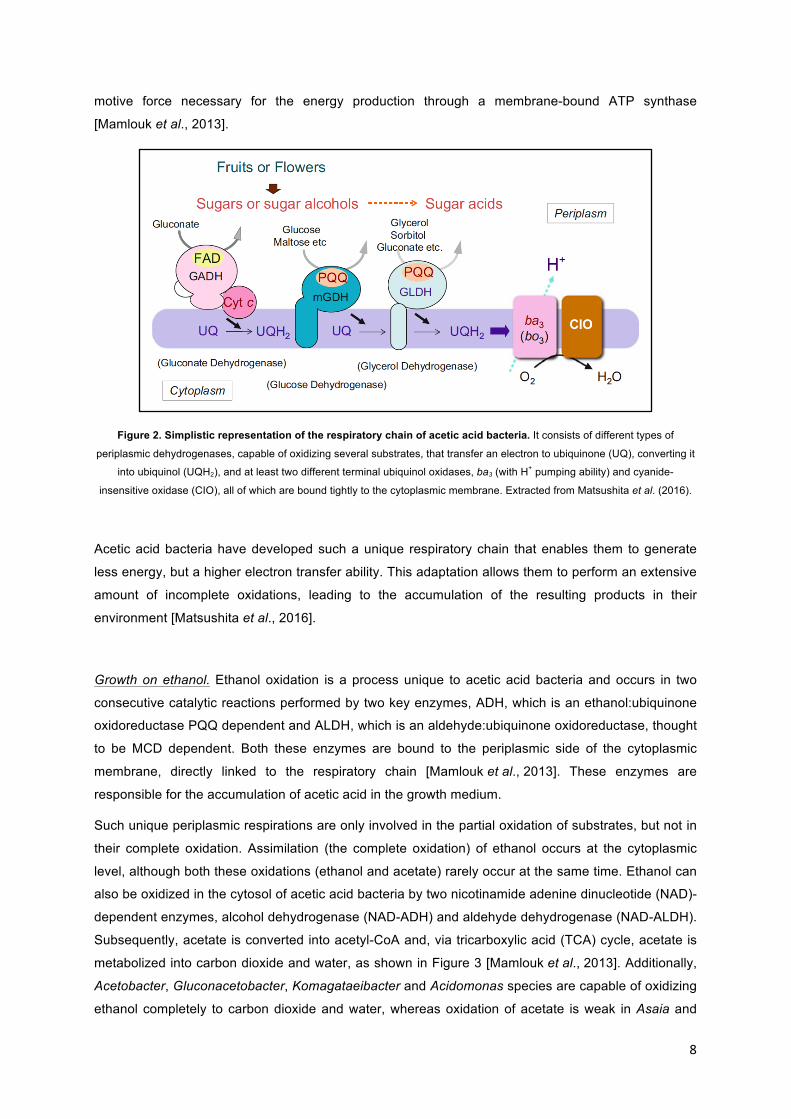
motive force necessary for the energy production through a membrane-bound ATP synthase
[Mamlouk et al., 2013].
Figure 2. Simplistic representation of the respiratory chain of acetic acid bacteria. It consists of different types of
periplasmic dehydrogenases, capable of oxidizing several substrates, that transfer an electron to ubiquinone (UQ), converting it
into ubiquinol (UQH2), and at least two different terminal ubiquinol oxidases, ba3 (with H+ pumping ability) and cyanide-
insensitive oxidase (CIO), all of which are bound tightly to the cytoplasmic membrane. Extracted from Matsushita et al. (2016).
Acetic acid bacteria have developed such a unique respiratory chain that enables them to generate
less energy, but a higher electron transfer ability. This adaptation allows them to perform an extensive
amount of incomplete oxidations, leading to the accumulation of the resulting products in their
environment [Matsushita et al., 2016].
Growth on ethanol. Ethanol oxidation is a process unique to acetic acid bacteria and occurs in two
consecutive catalytic reactions performed by two key enzymes, ADH, which is an ethanol:ubiquinone
oxidoreductase PQQ dependent and ALDH, which is an aldehyde:ubiquinone oxidoreductase, thought
to be MCD dependent. Both these enzymes are bound to the periplasmic side of the cytoplasmic
membrane, directly linked to the respiratory chain [Mamlouk et al., 2013]. These enzymes are
responsible for the accumulation of acetic acid in the growth medium.
Such unique periplasmic respirations are only involved in the partial oxidation of substrates, but not in
their complete oxidation. Assimilation (the complete oxidation) of ethanol occurs at the cytoplasmic
level, although both these oxidations (ethanol and acetate) rarely occur at the same time. Ethanol can
also be oxidized in the cytosol of acetic acid bacteria by two nicotinamide adenine dinucleotide (NAD)-
dependent enzymes, alcohol dehydrogenase (NAD-ADH) and aldehyde dehydrogenase (NAD-ALDH).
Subsequently, acetate is converted into acetyl-CoA and, via tricarboxylic acid (TCA) cycle, acetate is
metabolized into carbon dioxide and water, as shown in Figure 3 [Mamlouk et al., 2013]. Additionally,
Acetobacter, Gluconacetobacter, Komagataeibacter and Acidomonas species are capable of oxidizing
ethanol completely to carbon dioxide and water, whereas oxidation of acetate is weak in Asaia and

9
Kozakia species and absent in Gluconobacter strains, due to a lack of activity of two enzymes of the
TCA cycle, α-ketoglutarate-dehydrogenase and succinate dehydrogenase.
Figure 3. Representation of ethanol oxidation of acetic acid bacteria, both at a periplasmic level (incomplete oxidation) and cytoplasmic level (complete oxidation). A: Ethanol and acetate oxidations in acetic acid bacteria, coupled with ATP
generation. B: Tricarboxylic acid (TCA) of acetic acid bacteria, showing how acetic acid is assimilated. Both figures were
adapted from Matsushita et al. (2016).
The sequential oxidations of ethanol and acetate leads to a diauxic growth nature, characterized by
the accumulation of acetic acid in the first exponential growth phase, a transition phase and lastly, the
second exponential growth phase, where acetic acid is oxidized into carbon dioxide and water, as
demonstrated in Figure 4.
Figure 4. Representation of a typical diauxic growth curve of acetic acid bacteria capable of oxidizing acetic acid to
carbon dioxide and water (complete oxidation). The full line (u) represents the optical density (OD) measured at 660 nm
and the dotted line (n) represents the concentration of acetic acid in the culture medium. Extracted from
Matsushita et al. (2016).
TCA Cycle
Glyoxylate
PQQ MCD
Acetate Ethanol Acetaldehyde
NAD-ADH NAD-ALDH
NAD+ NADH NAD+ NADH
Acetic Acid Acetaldehyde Ethanol
Acetyl-CoA
ACS
TCA
Periplasm
Cytoplasm
p
A B
Overoxidation phase
Transition phase
Log phase
10

10
Most of these metabolic features of acetic acid bacteria are still poorly characterized. Recent studies
of whole genome sequencing and transcriptome analysis have shed some light on this matter, at least
in Acetobacter aceti [Matsushita et al., 2016; Sakurai et al., 2012]. Carbon flow through the TCA cycle
of acetic acid bacteria is generally reduced during the incomplete oxidation of ethanol. The low flux
rate of the TCA cycle in the presence of ethanol causes cytoplasmic accumulation of acetate and/or
acetyl-CoA. It seems that A. aceti has at least two different mechanisms to convert acetate into acetyl-
CoA, namely i) conversion of acetate into acetyl-CoA by acetyl-CoA synthase (ACS); ii) conversion of
succinyl-CoA to succinate and simultaneously transfer of CoA to acetic acid. In the absence of
ethanol, acetyl-CoA can be incorporated into the TCA cycle by either its conversion into citrate or into
malate (though the glyoxylate pathway, although not all strains exhibit an active glyoxylate pathway).
Thus, it seems that these bacteria may have a particularly efficient system to consume intracellular
acetate. The consumption of acetate through the TCA cycle generates reducing power in the form of
NADH, which is reoxidized to NAD+ by membrane NADH dehydrogenases (with or without proton
translocating ability) [Sakurai et al., 2012].
Ethanol is nearly stoichiometrically converted to acetic acid. During the oxidation of ethanol into acetic
acid, the TCA cycle functions only to meet the demands for synthesis of biomass and ethanol is used
exclusively as an energy source [Sakurai et al., 2012]. The glyoxylate pathway functions as an
anaplerotic shunt and allows the conversion of acetate into biomass through the synthesis of
precursors, such as oxaloacetate, pyruvate and phosphoenolpyruvate [Adler et al., 2014]. However,
the glyoxylate pathway is not a requirement for the growth of acetic acid bacteria. Strains which do not
exhibit an active glyoxylate shunt can synthetize oxaloacetate from amino acids and other compounds
contained in organic substrates, present in wine mostly due to the autolysis of yeast cells
[Matsushita et al., 2016]. Glycerol is a major byproduct of alcoholic fermentation. Although most of the
glycerol is oxidized to dihydroxyacetone, some may be used as a carbon source for the production of
biomass [Guillámon et al., 2011]. Interestingly, acetic acid bacteria isolated from cocoa beans
fermentation have been shown to strictly utilize ethanol for the generation of metabolic energy through
acetate production, while lactate is mainly used for the generation of biomass through
gluconeogenesis and pentose phosphate pathways [Adler et al., 2014]. When grown in (red) wine,
acetic acid bacteria may use glycerol, lactate and other organic compounds as carbon sources for the
generation of biomass.
Acetic acid resistance. Acetic acid resistance is a crucial factor in the production of large amounts of
acetic acid, a weak acid well known for its ability to inhibit growth of most microorganisms at very low
concentrations (0.5%). Acetic acid is a lipophilic molecule that can easily diffuse through the
cytoplasmic membrane, where the toxic effect is caused by its dissociation in the higher pH of the
cytoplasm. The released protons lower the pH of the cytoplasm, resulting in the denaturation of
various proteins and the disruption of the membrane electro-chemical gradient
[Matsushita et al., 2016].

11
The mechanisms of acetic acid bacteria that confer resistance or adaptation to acetic acid are not
completely understood yet. Although some resistance mechanisms have been reported in recent
years, much of the knowledge necessary for an extensive understanding of the acetic acid resistance
demonstrated by this group of bacteria is still nonexistent. Acetic acid resistance is species and strain
dependent, with strains rapidly losing their resistance to high concentrations of acetic acid on synthetic
media under laboratory conditions. This seems to indicate that the molecular mechanisms involved in
acetic acid resistance are inducible and transient [Raspor et al., 2008]. Nevertheless, at least four
methods of resisting acetic acid have been reported for acetic acid bacteria, namely i) prevention of
acetic acid influx into the cell by alteration of components of the lipid membrane and the establishment
of polysaccharides on the cell surface; ii) efficient acetic acid assimilation through the TCA cycle;
iii) acetic acid efflux by expression of a putative ATP-binding cassette transporter; and iv) protection of
cytosolic proteins against denaturation by expression of chaperones [Matsushita et al., 2016;
Raspor et al., 2008]. The complete understanding of the metabolic pathways that confer resistance to
acetic acid can lead to the selection of bacteria with unique physiological properties, enabling an
improvement of wine vinegar production, as well as other natural “fermentation” processes.
Nitrogen fixation. Nitrogen fixation, or diazotrophy, is the capacity to fix free molecular nitrogen (N2)
into cell material by its reduction to ammonium. Among acetic acid bacteria, different genera and
species are capable of fixating molecular nitrogen, namely, Gluconacetobacter diazotrophicus,
Ga. johannae, Ga. azotocaptans, Swaminathania salitolerans, Acetobacter peroxydans, and
A. nitrogenifigens [Matsushita et al., 2016; Sievers & Swings, 2005]. Since optimal nitrogen fixation by
Ga. diazotrophicus demands high aerobic conditions for efficient energy production, a capable
protection mechanism is necessary to protect nitrogenase activity from the damaging action of
oxygen. It is suggested that this organism uses a respiratory protection mechanism to maintain its
nitrogenase activity in the presence of oxygen [Raspor et al., 2008].
1.1.4 Biotechnological Applications
People have taken advantage of the unique metabolism of acetic acid bacteria long before they were
acknowledged as the causative agent of the “acetic acid fermentation”. Recently, their physiology has
been extensively studied due to the innumerous possibilities of exploitation of their oxidation
machinery [Mamlouk et al., 2013]. Currently, their biotechnological applications have been widely
increased beyond their role in the vinegar industry. Despite the occurrence of acetic acid bacteria
being detrimental in some cases, they mostly perform a positive role in many bioprocesses.
1.1.4.1 Wine Vinegar
The word “vinegar” is originated from the French words “vin” and “aigre”, which literally mean “sour
wine”. Wine and vinegar production have always been linked and there are reports of its utilization as
early as 4000 B.C. Vinegar can be defined as a solution of acetic acid and a product of “acetic acid

12
fermentation” from alcoholic solutions (ranging from 10% to 15% of ethanol). The most common raw
materials for its production are wine, beer, cider and products from alcoholic fermentations of
numerous cereals and fruits [Komagata et al., 2014]. Despite its starting raw material, vinegar is
produced by a two-step process: firstly, ethanol is produced by yeasts from a carbohydrate, such as
sugars or starch (firstly, starch should be broken down into glucose or maltose), and then the oxidation
of ethanol into acetic acid is performed by acetic acid bacteria, mainly from the genera Acetobacter,
Gluconobacter and Komagataeibacter [Matsushita et al., 2016].
Traditionally, vinegar is produced by a process called surface fermentation, which consists of a static
culture of acetic acid bacteria at the air-liquid interface. It is usually performed in wooden barrels
(different types of wood can be used) filled to 2/3 of their capacity to create an air chamber, connected
to the outside air by various types of openings. The acetic acid bacteria form a biofilm on the liquid
surface, generally called “mother of vinegar”, composed of cellulose and possibly of other
exopolysaccharides. Because it floats, this cellulosic matrix allows acetic acid bacteria to position at
the air-liquid interface, giving them access to the atmospheric oxygen in the air phase and the
nutrients required for growth in the liquid phase. It is thought that this biofilm also confers protection
against harmful chemicals (may also protect against high acetic acid and ethanol concentrations) and
dehydration and supports cell-to-cell contact [Matsushita et al., 2016].
Vinegars produced by this process are considered to be of high quality due to their organoleptic
complexity. Along with the oxidation of ethanol to acetic acid, the secondary metabolism of acetic acid
bacteria results in addition of flavor and aroma to the final product, mostly through oxidation reactions,
but also through esterification reactions. Because of this, the microorganisms producing the vinegar
have a high impact on the quality of the vinegar. Additionally, the intrinsic properties of the raw
material and the interaction with the wood from the barrels generates vinegars with a variety of odor,
taste, color and other properties [Mas et al., 2014]. This production method can take as long as 2
years [Matsushita et al., 2016].
In the early 50’s, submerged culture processes were introduced, mainly for the production of
antibiotics. These processes were carried out in stainless steel bioreactors that were promptly applied
to the vinegar industry. The bioreactors are equipped with devices that ensure a continuous and
homogeneous airflow, thermometers and cooling systems for monitoring and maintaining liquid
temperature at 30ºC, an automatic device to measure the alcohol content and a mechanical defoamer
[Gullo et al., 2014].
One of the most important aspects of submerged fermentation is the oxygenation of the liquid. It is
described that an interruption of aeration of only a few minutes can lead to a complete arrest of
acetification that cannot be recovered on its own when aeration is restarted. Under industrial
conditions, acetic acid bacteria undergo considerable stress from both high ethanol content
(acetification usually starts with concentrations of 7% to 15%) and high acetic acid content (at the end
of acetification, concentrations of 10% to 12% are reached). In order to survive under these stressful
conditions, the bacteria need a constant supply of energy from respiration [Gullo et al., 2014;
Raspor et al., 2008].

13
Submerged fermentation at an industrial scale is commonly operated in semi-continuous mode. This
production process is advantageous because it reduces the risk of substrate inhibition and allows the
reuse of the microbial culture in the subsequent production cycle [Gullo et al., 2014]. Each cycle takes
24 to 48 hours. When alcohol concentration reaches a minimum residual level, a portion of the vinegar
is removed, normally around 2/3 of the bioreactor, and is replaced with fresh mash (wine). It is
particularly important to monitor ethanol levels because in case of ethanol depletion, Acetobacter and
Komagataeibacter strains begin to oxidize acetic acid to carbon dioxide and water. Since ethanol
represses this change in metabolism, a residual level of ethanol is always maintained
[Raspor et al., 2008]. The highest reported production yields in submerged fermentation were obtained
with this operation mode [Gullo et al., 2014]. The downstream processing of vinegar production is
composed of several steps, such as cell separation, sedimentation, clarification, pasteurization,
filtration, and dilution [Gullo et al., 2014].
The submerged fermentation, in comparison with the surface fermentation, results in higher
productivity, faster conversion of ethanol to acetic acid and lower capital investment per product
amount [Raspor et al., 2008]. Remarkably, it is still state of the art, in both operating methods, to start
the acetification process with a microbiological undefined culture [Sokollek et al., 1998].
Acetic acid bacteria as starters. In industrial vinegar production, there are several circumstances that
can lead to a complete arrest of acetification, such as abrupt temperature changes when loading or
unloading the acetator, interruption of aeration and infection with bacteriophages. This breakdown of
the acetification process can take up to several days or weeks to restart. Therefore, the availability of
acetic acid bacteria starter cultures is extremely desirable for the vinegar industry to improve the
process control [Sokollek et al., 1997].
The utilization of an undefined microbial community as a starter culture by this industry is a reflection
of the problems with acetic acid bacteria isolation, culture maintenance, cultivation outside the
acetator, transfer from liquid to solid media, determination of viable counts, strain preservation and
loss of phenotype over multiple cultivation cycles [Gullo et al., 2014; Sokollek et al., 1997].
Although some studies have tried to evaluate and develop optimized acetic acid bacteria as starter
cultures, these efforts have not met the industrial demand for stable and robust strains. The
characteristics described for an optimal starter strain include high acetic acid production yield, high
tolerance to ethanol and acetic acid, low nutrient requirements, low pH resistance, thermotolerance,
no cellulose production, resistance to bacteriophages and addition of enhanced organoleptic attributes
[Gullo et al., 2014; Matsushita et al., 2016].
Therefore, typification, identification and determination of phenotypic traits of indigenous acetic acid
bacteria isolates is a basis for the search of functional starters that serve as a means of increasing the
productive capacity of this industry, by accelerating the start of the acetification process, enabling
culture rotation as a way for controlling phage complications and enhancing the quality and
standardization of the final product.
14
1.1.4.2 Other Types of Vinegar
Additionally to wine vinegar, acetic acid bacteria are used to produce a notable variety of vinegars,
depending on the raw material used. The common types of vinegar within a region habitually reflect
the local alcoholic beverage [Raspor et al., 2008].
Cider vinegar. Traditionally, cider vinegar was produced with apple juice or concentrated apple juice
through a co-fermentation by indigenous yeasts and acetic acid bacteria, with the co-production of
ethanol and acetic acid. Nowadays, cider vinegar is mostly produced by submerged fermentation and
is mainly used in western countries as a table vinegar and as a preservative. Studies show that
Km. europaeus is the dominant species in submerged fermentation. However, cider vinegars usually
show a higher species diversity within acetic acid bacteria than wine or spirit vinegars, probably due to
its higher content in sugars (4%) and lower content in ethanol (6%), while wine vinegar (12% ethanol)
and spirit vinegar (14% ethanol) exert more stressing conditions for bacterial growth [Férnandez-
Pérez et al., 2010; Matsushita et al., 2016; Raspor et al., 2008].
Balsamic vinegar. Traditional balsamic vinegar (TBV), a highly prized vinegar, has been produced in
Northern Italy for centuries, in the regions of Modena and Reggio Emilia. The grape must is gently
boiled for several hours, until it has reduced to about one-half or one-third of its initial volume, resulting
in a liquor with a high sugar concentration (around 30%), where both alcoholic fermentation and
acetification take place. This liquor is transferred to a series of barrels, with decreasing volumes
arranged in succession, composed of different woods (ash, cherry, oak, juniper, mulberry and
chestnut), with each wood influencing the vinegar in a unique way. Traditionally, part of the contents of
the smallest barrel are collected each year (the finalized TBV) and are replaced with the same volume
from the preceding barrel, and so on up the line, until the biggest barrel is filled with the cooked must
of that season. This method takes at least twelve years and its not uncommon to find TBV with fifty or
more years. Although this process has a very low yield, the resulting vinegar is of exceptionally high
quality, with a dark brown color, a dense consistency, both sweet and sour and very complex in taste
[Matsushita et al., 2016; Raspor et al., 2008].
Acetic acid bacteria inhabiting TBV are not well known, with only a few ecological studies reported.
Nevertheless, some strains have been isolated from TBV and identified, particularly strains belonging
to the following species: Km. europaeus, Km. xylinus, Km. hansenii, A. pasteurianus, A. aceti and A.
malorum [Gullo et al., 2008].
Spirit vinegar. This type of vinegar, sometimes referred to as white, distilled or alcohol vinegar, is
characterized by a high acetic acid content (up to 15%) and is not very aromatic. Its raw material is
diluted purified ethanol or, in countries where it is permitted by law, it can be produced from synthetic
ethanol. It has a low cost production and is widely spread throughout the world. It is commonly sold
completely colorless or with a yellowish color obtained by the addition of caramel or other food
colorants. Strains of two acetic acid bacteria species have been isolated from this type of vinegar, Km.

15
intermedius and Km. oboediens. However, no growth was observed in any culture media when
samples of high-acidic vinegar (> 10%) were plated, suggesting that the main acetic acid producer is
yet to be disclosed [Matsushita et al., 2016; Raspor et al., 2008].
Rice vinegar. In the Far East, mostly in China, Taiwan and Japan, vinegar has been produced from
polished rice (komesu) and unpolished rice (kurosu) for several centuries. Komesu is colorless and
has a plain taste, traditionally used for sushi cooking, while kurosu is black, containing more amino
acids and vitamins than komesu and is usually used as a healthy drink. The final acidity of these
vinegars is typically less than 10%. Both these vinegars were traditionally produced by surface
fermentation but this technique has been largely replaced by submerged fermentation methods. The
acetic acid bacteria community of a traditional surface fermentation process was investigated. Almost
all strains isolated from four different phases of production corresponded to A. pasteurianus and the
authors concluded that over 100 years of vinegar production, an almost pure culture of acetic acid
bacteria was maintained [Matsushita et al., 2016; Nanda et al., 2001].
1.1.4.3 Bacterial Cellulose
Some acetic acid bacteria have the ability to produce cellulose, a polymer of β-1,4-linked glucose
units. Km. xylinus is world widely regarded as the model organism for studying bacterial cellulose
biosynthesis. Although the chemical structure of bacterial and plant cellulose is identical, the physical
structure of bacterial cellulose is quite unique, since it is formed by ultrafine fibers that form an
ultrafine network. This results in excellent properties, such as enormous mechanical strength,
hydrophilicity (can hold a large amount of water, 200 times its dry mass), great elasticity and
conformability (can be molded into any shape and size during its synthesis), high purity and it’s
biocompatible and biodegradable [Matsushita et al., 2016; Raspor et al., 2008].
From an industrial point of view, bacterial cellulose has a huge biotechnological potential, with many
patent applications submitted all over the world, but only a few commercial applications currently
available. One of the first applications of bacterial cellulose is its use as an acoustic transducer
diaphragm and has been commercialized in various types of speaker units and headsets. Another
commercialized application of this biopolymer is in the medical biotechnology field, where cellulose is
used as temporary wound dressing or artificial skin for patients with burns, chronic skin ulcers or other
extensive loss of tissue. The biocompatibility and high water retention demonstrated by bacterial
cellulose seems to stimulate growth of the skin tissue, resulting in a faster healing rate with a lower
risk of infection and reduced treatment time and cost. Two other potential applications for bacterial
cellulose in this field are being explored, namely, using cellulose as artificial blood vessels, since it
carries a low risk for blood clot development and has great shape retention and tear resistance; and
as a scaffold for tissue engineering, since bacterial cellulose supports the growth of mammalian cells
and can assume any shape for the new growing tissue.
16
However, current methodologies for bacterial cellulose synthesis are still far from a large-scale
production, resulting in a high production cost with a low yield [Matsushita et al., 2016;
Raspor et al., 2008].
In addition to vinegar and cellulose production, acetic acid bacteria have been extended to a number
of industries like food production (nata de coco and cocoa), pharmaceutics (L-ascorbic acid),
biotransformations and fine chemicals production (D-tagatose and shikimate), and their fields of
application are only expected to increase [Raspor et al., 2008].
17
1.2 Thesis Scope and Goals
This thesis was planned in association with the project BIOPEPPERtec (ANI Proposal 3321), in a
partnership with Mendes Gonçalves S.A., a major Portuguese vinegar producing company, among
other products, located in Golegã. Although the project was approved, no financing was attributed for
the Lisbon located partner (FCUL) and so it was withdrawn. Nevertheless, the research partnership
between Mendes Gonçalves and Lab Bugworkers | M&B-BioISI was maintained and thus this thesis
could be carried out.
One of the limitations of the vinegar industry is the loss of viability and/or productivity of acetic acid
bacteria when an alteration of the raw material is made. Also, the undefined microbial community used
as inoculum necessarily undergoes variations, in terms of species diversity and proportion, due to the
cyclic nature of the process. The inexistence of fine monitoring methodologies and the unavailability of
starter cultures at Mendes Gonçalves result in a limitation in the application of prophylactic or
corrective measures in the acetification process. In light of these difficulties associated with the
industrial production of vinegar, several objectives were proposed for this thesis:
i) creation of a collection of acetic acid bacteria isolated from vinegars produced at Mendes
Gonçalves;
ii) molecular characterization and identification to the species level of the isolated strains;
iii) physiological characterization of the identified strains;
iv) development of molecular methodologies to be applied in the monitoring of industrial
biotechnological processes at Mendes Gonçalves.
18
2. Methods
2.1 Vinegar Samples and Bacterial Strains
Forty-one samples of vinegars produced/processed by Mendes Gonçalves (MG) were brought to the
Lab Bugworkers | M&B-BioISI. These samples consisted of different vinegars, such as red and white
wine, balsamic, cider, cereal, spirit, rice, vinegars aromatized with several fruits and vinegars aged in
oak barrels, with acidity levels ranging from 5% to 8%. These vinegar samples were screened for
acetic acid bacteria using two culture-based methods. Five additional red wine vinegar samples were
obtained from MG. These five samples were collected from the same acetator, throughout 36 hours,
corresponding to different stages of a red wine vinegar production cycle.
A total of 31 acetic acid bacteria strains were used in this study, belonging to different genera and
corresponding to 22 wild strains and 9 strains obtained from culture collections. The wild strains were
isolated both in the MG microbiology laboratory (16 isolates) and in the Lab Bugworkers | M&B-BioISI
(6 isolates), from different types of vinegar.
The type strains of 7 acetic acid bacteria species were obtained from the German Collection of
Microorganisms and Cell Cultures (DSMZ). These strains were reactivated according to the DSMZ
recommendations. Two additional strains were acquired from the Spanish Type Culture Collection
(CECT) and were reactivated according to the CECT recommendations. These 9 strains acquired
from culture collections were used in this study as reference strains (Table 2). All strains (wild and
reference) were cultivated on GYC plates (with the exception of Km. europaeus DSMZ 6160T that was
cultivated on Sabouraud plates, supplemented with 0.32% acetic acid, according to DSMZ
recommendations). Acetic acid bacteria isolates and reference strains were stored at -80ºC, in a
solution of RAE medium and glycerol as a cryoprotectant (at a final concentration of 20%).
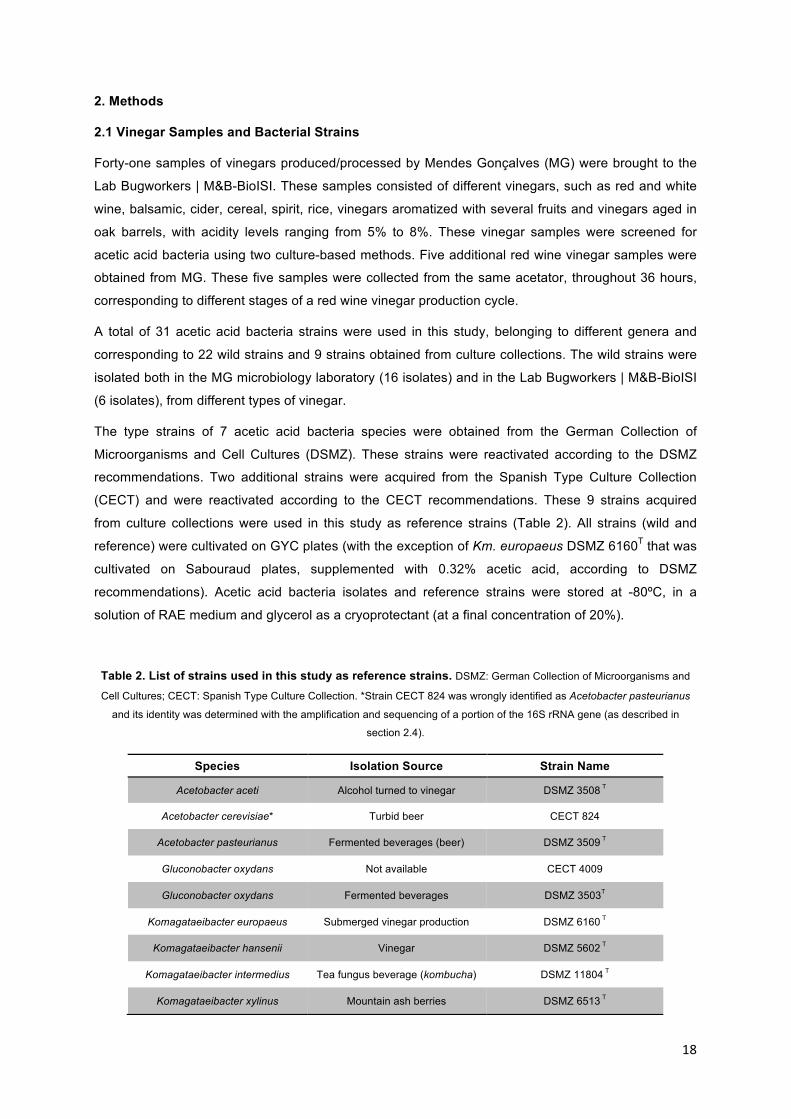
Table 2. List of strains used in this study as reference strains. DSMZ: German Collection of Microorganisms and
Cell Cultures; CECT: Spanish Type Culture Collection. *Strain CECT 824 was wrongly identified as Acetobacter pasteurianus
and its identity was determined with the amplification and sequencing of a portion of the 16S rRNA gene (as described in
section 2.4).
Species Isolation Source Strain Name
Acetobacter aceti Alcohol turned to vinegar DSMZ 3508 T
Acetobacter cerevisiae* Turbid beer CECT 824
Acetobacter pasteurianus Fermented beverages (beer) DSMZ 3509 T
Gluconobacter oxydans Not available CECT 4009
Gluconobacter oxydans Fermented beverages DSMZ 3503T
Komagataeibacter europaeus Submerged vinegar production DSMZ 6160 T
Komagataeibacter hansenii Vinegar DSMZ 5602 T
Komagataeibacter intermedius Tea fungus beverage (kombucha) DSMZ 11804 T
Komagataeibacter xylinus Mountain ash berries DSMZ 6513 T
19
2.2 Isolation of Acetic Acid Bacteria
The vinegar samples were analyzed for acetic acid bacteria using two culture methods, a direct
approach and/or an enrichment approach. The compositions of the culture media used in this study
are presented in annex A1.
The direct approach consisted in directly plating 100 µl of each vinegar sample on GYC plates. For the
enrichment approach, 15 ml of each sample was centrifuged at 3220xg for 15 minutes in a Centrifuge
5810 R (Eppendorf, Germany) and the cellular pellet was inoculated in 20 ml of GYP medium,
supplemented with 3% ethanol (v/v). The liquid cultures were incubated at 28ºC and 160 rpm for 5
days. Then, the total volume of each culture was centrifuged in the same conditions described above
and the cellular pellet was plated on GYC plates.
All plates were incubated at 28ºC and were checked for colony growth at day 3, 5 and 7. Every acid-
producing colony and every colony showing different morphological characteristics were purified by
streak-plating and subjected to further characterization (Gram, KOH, catalase and oxidase tests).
2.3 Genomic Fingerprinting: RAPD-PCR, REP-PCR and ERIC-PCR
Genomic DNA was extracted from bacterial cells in a pure culture using an adapted Guanidium
Thiocyanate method described by Pitcher et al. (1989). These modifications were made primarily in
the first steps of the method. Bacterial cells collected from an agar plate were ressuspended in 250 µl
of lysis buffer (50 mM Tris; 250 mM NaCl; 50 mM EDTA; 0.3% SDS; pH 8.0) and 100 µl of
microspheres. After 2 minutes of homogenization in a vortex, the cells were incubated in 65ºC for 30
minutes, followed by another 2 minutes of homogenization. Afterwards, the GES reagent (5 M
guanidium thiocyanate; 10 mM EDTA; 0.5% Sarkosyl; pH 8,0) was added and the original method was
followed but using an equal volume of isopropanol.
The extracted DNA was visualized by electrophoresis in 0.8% (w/v) agarose gels using a 1kb Plus
DNA ladder (Invitrogen). The electrophoresis was performed in 0.5x TBE buffer with a constant
voltage of 4.5 V/cm. Afterwards, the gel was stained in an ethidium bromide solution and
photographed in an Alliance 4.7 UV transiluminador (UVItec, Cambridge) using the Alliance software
(version 15.15, UVItec, Cambridge).
Genomic DNA, extracted from bacterial isolates in pure cultures, was used as template to obtain
genomic fingerprints. Three different PCR fingerprinting methods were applied: i) Randomly Amplified
Polymorphic DNA (RAPD-PCR); ii) Repetitive Extragenic Palindromic sequences (REP-PCR) and iii)
Enterobacterial Repetitive Intergenic Consensus sequences (ERIC-PCR). The RAPD-PCR was
performed using the PH primer (5’ AAGGAGGTGATCCAGCCGCA ‘3) [Massol-Deva et al., 1995] and
the REP-PCR was performed using the GTG5 primer (5’ GTGGTGGTGGTGGTG ‘3) [De
Vuyst et al., 2008]. Both amplification reactions were carried out in a total volume of 25 µl, containing
1x PCR reaction buffer, 3 mM of MgCl2, 25 pmol of primer, 0.2 mM of each of the four dNTP’s, 1 U of

20
Taq polymerase and 1 µl of template DNA per reaction. All reagents used were acquired from
Invitrogen (Massachusetts, USA). This assay was performed in a UNO II thermal cycler (Biometra,
Germany), with the following PCR conditions: 5 min of initial denaturation at 95ºC, followed by 40
cycles of denaturation at 95ºC for 1 min, annealing at 50ºC for 2 min and extension at 72ºC for 2 min,
and a final extension at 72ºC for 5 min.
The ERIC-PCR was performed using the pair of primers ERIC-1 (5’ ATGTAAGCTCCTGGGGATTCAC
‘3) and ERIC-2 (5’ AAGTAAGTGACTGGGGTGAGCG ‘3) [Versalvoice et al., 1991]. The amplification
reaction was carried out in a total volume of 25 µl, containing 1x PCR reaction buffer, 3 mM of MgCl2,
25 pmol of each of the ERIC primers, 0.2 mM of each of the four dNTP’s, 1 U of Taq polymerase and
1 µl of template DNA per reaction. All reagents used were acquired from Invitrogen (Massachusetts,
USA). This assay was performed in a UNO II thermal cycler (Biometra, Germany), with the following
PCR conditions: 5 min of initial denaturation at 95ºC, followed by 35 cycles of denaturation at 95ºC for
1 min, annealing at 57ºC for 1 min and extension at 72ºC for 2 min, and a final extension at 72ºC for 5
min. The products of the amplification reactions described above were visualized by electrophoresis in
a 1.2% (w/v) agarose gel using a 1kb Plus DNA ladder (Invitrogen). The electrophoresis was
performed in 0.5x TBE buffer with a constant voltage of 2.5 V/cm. The gel was stained in an ethidium
bromide solution and photographed in an Alliance 4.7 UV transiluminador (UVItec, Cambridge) with
Alliance software (version 15.15, UVItec, Cambridge).
The banding patterns were analyzed with Bionumerics software (version 6.6, Applied Maths) and a
composite dendrogram was created based on the genomic profiles obtained with the primers GTG5
and PH. This dendrogram was constructed using the Pearson correlation coefficient as a similarity
measure and the unweighted pair group method with the arithmetic average clustering algorithm
(UPGMA). A reproducibility assay was performed to determine the percentage of similarity necessary
for strain discrimination. For each type of genomic fingerprinting, 10% of the isolates (3) were
randomly chosen and the amplification reaction was performed in duplicate. A dendrogram was built
for these three isolates and their repeats and the optimization parameters were adjusted until each
isolate was grouped with its repeat. The reproducibility of each type of genomic fingerprinting was
determined as the average of the levels of similarity observed between repeats. The reproducibility of
the composite dendrogram was defined as the average of the reproducibilities determined for each
type of genomic fingerprinting.
2.4 Molecular Identification by 16S rRNA Gene Sequencing
DNA from bacterial isolates (DNA extraction described in section 2.3) was used as a template for the
amplification of a portion of the 16S rRNA gene, using the universal primers PA (27f)
(5’ AGAGTTTGATCCTGGCTCAG 3’) [Massol-Deva et al., 1995] and 907r
(5’ CCGTCAATTCMTTTRAGTTT 3’) [Muyzer et al., 1998].
The amplification reaction was carried out in a total volume of 50 µl, containing 1x PCR reaction
buffer, 2 mM of MgCl2, 25 pmol of each primer, 0.2 mM of each of the four dNTP’s, 1 U of Taq

21
polymerase and 1 µl of template DNA per reaction. All reagents used were acquired from Invitrogen
(Massachusetts, USA). This assay was performed in a UNO II thermal cycler (Biometra, Germany),
with the following PCR conditions: 5 min of initial denaturation at 95ºC, followed by 35 cycles of
denaturation at 95ºC for 1 min, annealing at 55ºC for 1 min and extension at 72ºC for 2 min, and a
final extension at 72ºC for 5 min.
The products of the amplification reaction described above were visualized by electrophoresis in a
1.2% (w/v) agarose gel using a 1kb Plus DNA ladder (Invitrogen). The electrophoresis was performed
in 0.5x TBE buffer with a constant voltage of 4.5 V/cm. The gel was stained in an ethidium bromide
solution and photographed in an Alliance 4.7 UV transiluminador (UVItec, Cambridge) with Alliance
software (version 15.15). Only 5 µl of the reaction were loaded in the agarose gel, while the remaining
volume was purified using the kit Jet Quick PCR Product Purification Spin Kit (Genomed, USA),
following the manufacturer’s recommendations. The purified PCR products were sequenced by
Biopremier (Lisbon, Portugal) and the algorithm BLAST (Basic Local Alignment Search Tool) was
used to determine the closest known relative(s) of the partial 16S rRNA sequence obtained.
Additionally, a phylogenetic reconstruction was generated using the MEGA software (version 7.0.20).
The 16S rRNA gene sequences obtained were aligned (ClustalW 1.6) with the sequences of the same
gene of the type strains of all species of the genus Komagataeibacter and were clustered with the
neighbor-joining algorithm.
2.5 Multiplex-PCR: Primer Design and PCR Conditions
Four different degenerate primers were designed based on DNA sequences available in GenBank for
the subunit I of the PQQ-dependent ADH gene, adhA. The multiple alignment was done using the
algorithm ClustalW (version 1.6) and the primers were designed based on the conserved regions
shown by the alignment. Degenerate bases were chosen in positions where all of the DNA sequences
did not align and bases with the lowest degree of the degeneracy were preferred. All primers are
composed of 20 nucleotides, consisting in two forward primers (ADH-F1 and ADH-F2) and two
reverse primers (ADH-R1 and ADH-R2) (Table 3). Therefore, there are four possible combinations of
primers, resulting in four different fragments with sizes of 240 bp (primers ADH-F2 and ADH-R2),
336 bp (primers ADH-F1 and ADH-R2), 388 bp (primers ADH-F2 and ADH-R1) and 484 bp (primers
ADH-F1 and ADH-R1).
Table 3. List of the adhA directed primers.
Name Position Sequence
ADH-F1 5-24 5’ ACMGCNACATACTGCTTGCC 3’
ADH-R1 470-489 5’ TGGTACGGCATKCCSGGKGA 3’
ADH-F2 101-120 5’ GCGTCRTARGCRTGGAATTC 3’
ADH-R2 322-341 5’ TKGGYCTSGACATGAACAAG 3’

22
Different conditions were tested in order to optimize the PCR amplification. A PCR assay was planned
where two concentrations of MgCl2 (1.5 mM and 2.5 mM) and primers (25 pmol and 50 pmol) and a
range of annealing temperatures (46.5ºC to 57.5ºC) were tested for the four possible primer
combinations.
The final amplification reaction was performed in a total volume of 25 µl, containing 1x PCR reaction
buffer, 1.5 mM of MgCl2, 25 pmol of each of the adhA directed primers (ADH-F1, ADH-F2 and ADH-
R2), 6.25 pmol of each of the 16S rRNA gene directed primers (PA and 907r), 0.2 mM of each of the
four dNTP’s, 1 U of Taq polymerase and 1 µl of template DNA per reaction. All reagents used were
acquired from Invitrogen (Massachusetts, USA). This assay was performed in a T Gradient thermal
cycler (Biometra, Germany), with the following PCR conditions: 5 min of initial denaturation at 95ºC,
followed by 30 cycles of denaturation at 95ºC for 1 min, annealing at 57ºC for 1 min and extension at
72ºC for 1 min, and a final extension at 72ºC for 5 min.
The amplification products were visualized by electrophoresis in a 1.2% (w/v) agarose gel using a 1kb
Plus DNA ladder (Invitrogen, Massachusetts, USA). The electrophoresis was performed in 0.5x TBE
buffer with a constant voltage of 4.5 V/cm. The gel was stained in an ethidium bromide solution and
photographed in an Alliance 4.7 UV transiluminador (UVItec, Cambridge) using the Alliance software
(version 15.15).
2.6 Growth Analysis and Quantification of Acetic Acid
Acetic acid bacteria strains were grown in red wine (14.4% ethanol) supplied by Mendes Gonçalves,
where the ethanol content of the wine was determined. The wine was centrifuged at 15000xg for 10
minutes in a J2-21 centrifuge (Beckman, USA) and the supernatant was sterilized by filtration with a
0.45 µm filter. The wine was diluted in autoclaved ultrapure water in a proportion of 1:2, respectively
(the final ethanol concentration was expected to be around 4.8%). Pre-cultures were grown (28ºC, 160
rpm) during four days, in 100 ml Erlenmeyers with 50 ml of GYP medium, supplemented with 2%
ethanol and inoculated with a loopfull (10 µl) from frozen (-80ºC) preparations of the strains. After four
days, each pre-culture was centrifuged at 3220xg for 15 minutes in a Centrifuge 5810 R (Eppendorf,
Germany) and the cellular pellet was ressuspended in 300 µl of GYP medium. For each strain, three
250 ml Erlenmeyers with 100 ml of the diluted wine were inoculated with 100 µl of the pre-culture
ressuspended pellet. The cultures were incubated for several days at 28ºC and 160 rpm and samples
were collected at several time-points. At each time-point, 1 ml of the culture was collected to a cuvette
to measure the optical density (OD). Additionally, another culture sample of 1 ml was collected and
centrifuged at 17968xg for 10 minutes in a 1-15P centrifuge (Sigma, USA). Subsequently, 900 µl were
collected to another tube and frozen at -20ºC until they were used to measure the pH and the acetic
acid concentration.

23
Analytical Methods. OD was measured using a UV1101 Biotech Photometer (WPA, UK) with a 600
nm filter and the pH was measured using a BioTrode lab pH microelectrode (Hamilton, Switzerland)
coupled with a model 15 pH meter (Denver Instruments, USA). Acetic acid concentration was
determined enzymatically, using the Acetic Acid Assay Kit (Acetate Kinase Manual Format) from
Megazyme (Ireland). All reactions were performed in microplate assay and serial dilutions of the
samples were prepared when necessary. A calibration curve was constructed within the linearity
reported by the manufacturer (0.1-2.5 µg of acetic acid per well) and is presented in annex A3.
Data analysis. The specific growth rate (µ) was calculated based on a regression the logarithm of the
OD values during exponential growth phase. The acetic acid production rate was calculated based on
a regression of the acetic acid concentrations from the start of acetic acid production until the
maximum concentration was obtained. Linearity of all regressions was assessed by the determination
coefficient values (R2).
Additionally, the maximal bioconversion efficiency of acetic acid was calculated as described by
[Mounir et al., 2016]. For this calculation, it was assumed that the initial concentration of ethanol was
4.8% (v/v) [equivalent to 3.7% (w/v)] and the final concentration of ethanol was 0.0% (v/v). The
productivity (gl-1day-1) of acetic acid production was calculated according to the following equation:
𝑃 = 𝐴𝑐𝐻 𝑚𝑎𝑥 − [𝐴𝑐𝐻]𝑖
𝑡
where [AcH]max is the maximum concentration (gl-1) of acetic acid obtained, [AcH]i is the initial
concentration (gl-1) of acetic acid and t corresponds to the time (days) at which the maximum
concentration of acetic acid was obtained.
2.7 Microbial Profiling Analysis
Community DNA was extracted from the five red wine vinegar samples using the DNA Isolation Kit
PowerMax™Soil (MO BIO Laboratories, USA). About 250 ml of each vinegar sample was centrifuged
at 15000xg for 10 minutes in a J2-21 centrifuge (Beckman, USA) and the supernatant was discarded.
The cellular pellet was transferred directly to the DNA extraction kit and manufacturer’s
recommendations were followed.
The DNA extracts were provided to Biopremier (Lisbon, Portugal) where the Microbial Profiling
analysis was performed. Using the community DNA extracts as a template, two different regions of the
16S rRNA gene were amplified by PCR (region 1 and region 2). Region 1 corresponds to a fragment
of around 300 nucleotides, situated in the 5’ end of the gene and region 2 corresponds a fragment of
around 200 nucleotides, situated in the 3’ end of the gene. Primers with different tags were used for
the different regions and for the different time-points. Afterwards, the amplified fragments were pooled
together and sequenced by NGS technology (Ion Torrent) and the resulting DNA sequences were
identified by a BLAST analysis.

24
3. Results and Discussion
3.1 Isolation of Acetic Acid Bacteria
In this study, forty-one samples of vinegars produced and/or processed at Mendes Gonçalves were
analyzed using two culture-based methods, a direct approach and/or an enrichment approach, with
the objective of isolating acetic acid bacteria. Figure 5 shows the results obtained with both culture
methods.
Figure 5. Number of different isolates obtained from each vinegar sample, with the direct and enrichment approaches. The dark blue represents acetic acid bacteria isolates while the light blue represents bacterial isolates not belonging to the
acetic acid bacteria group. The pie charts show the total number of isolates for each approach. Only the direct approach was
performed for vinegar sample 41.
The direct approach, which consisted in directly plating each vinegar sample in solid medium (GYC),
led to the isolation of bacteria from eight of the forty-one vinegars analyzed, totaling twelve different
isolates. Of these twelve bacterial isolates, three belonged to the acetic acid bacteria group (confirmed
by 16S rRNA sequencing), isolated from vinegars samples 31 and 41. The enrichment approach,
which included an incubation step of five days in liquid medium (GYP) supplemented with 3% (v/v)
ethanol, led to the isolation of bacteria from thirteen of the forty vinegars analyzed, totaling nineteen
different isolates. Of these nineteen bacterial isolates, four belonged to the acetic acid bacteria group
(confirmed by 16S rRNA sequencing), isolated from vinegars samples 14, 22, 31 and 32. Additionally,
0
1
2
3
1 2 3 4 5 6 7 8 9 10 11 12 13 14 15 16 17 18 19 20 21 22 23 24 25 26 27 28 29 30 31 32 33 34 35 36 37 38 39 40 41 Num
ber o
f diff
eren
t iso
late
s
Vinegar Samples
Direct Approach AAB Not AAB
3
9
0
1
2
3
1 2 3 4 5 6 7 8 9 10 11 12 13 14 15 16 17 18 19 20 21 22 23 24 25 26 27 28 29 30 31 32 33 34 35 36 37 38 39 40 Num
ber o
f diff
eren
t iso
late
s
Vinegar Samples
Enrichment Approach AAB Not AAB
4
115

25
vinegar samples 1, 5, 8, 9, 18, 27, 34 and 37 showed growth in the liquid medium during the
enrichment phase, although no growth was observed when the liquid medium was centrifuged and
plated in solid medium.
Table 4 summarizes information about the acetic acid bacteria isolates used in this study, regarding
their local and source of isolation as well as their identification (detailed information described in
section 2.4 and 3.2). In total, six isolates were isolated in the M&B BioISI Lab and sixteen isolates
were isolated in the MG lab.
All bacterial isolates were subjected to Gram, KOH, catalase and oxidase tests. Every acetic acid
bacteria was Gram negative, KOH positive, catalase positive and oxidase negative. Additionally, under
the microscope cells appeared as small bacilli and occurred preferentially in pairs or in chains. Based
on this characterization, both acetic acid bacteria isolated from the sample 31 were considered
identical.
Table 4. List of acetic acid bacteria isolated from samples of vinegar produced and/or processed by MG. The isolates
are organized by their source and local of isolation. The identification refers to the results of the 16S rRNA gene sequencing
(described in section 2.4 and 3.2). MG: Mendes Gonçalves.
Source Local of isolation Isolate Name Identification
Pear vinegar
MG Lab
AAB 001; 002; 003; 004 AAB 010; 011; 012; 017 AAB 028; 029; 030 Km. swingsii
or Km. europaeus
Pepper vinegar AAB 015; 016; 025; 026 AAB 027
Cider vinegar
M&B BioISI Lab
AAB 023; 024
Km. swingsii or
Km. europaeus Cereal vinegar AAB 031
Fig vinegar AAB 032
Balsamic vinegar AAB 033; 034 Km. nataicola or
Km. sucrofermentans
The isolation and cultivation of acetic acid bacteria has always been described as problematic,
resulting in an underestimation of acetic acid bacteria diversity when culture dependent methods are
applied. This is especially true in the isolation from a high acetic acid level source
[Raspor et al., 2008]. Additionally, a viable but not cultivable (VBNC) state has been described for
acetic acid bacteria, mainly in oxygen privation conditions [Mamlouk et al., 2013].
When comparing the forty vinegar samples used in both approaches, it is possible to state that the
enrichment approach was more effective in the isolation of acetic acid bacteria than the direct
approach, since it led to the isolation of four acetic acid bacteria isolates in comparison to one. It is
possible that the aeration from the shaking culture helped the acetic acid bacteria recover from the

26
VBNC state. It is also possible that the availability of ethanol as a carbon source (the same carbon
source as in wine/vinegar) may help the bacteria to adapt to the use of glucose as a carbon source.
Another way to improve their growth in the solid medium could be its supplementation with ethanol.
Also, the enrichment approach seems to have not been specific to acetic acid bacteria, as it was
intended, since the number of non-AAB isolates also increased. A possible way to overcome this
could be the removal of glucose from the liquid medium, with ethanol as the only carbon source.
As can be seen in Table 4, a higher number of acetic acid bacteria were isolated in the MG lab. A
possible explanation could be the reduced time between sample collection and its processing in the
lab that can be achieved in the MG lab. This could reduce the interruption of the aeration and induce
less stress to the bacteria.
Overall, the enrichment approach was fairly successful, since it led to the isolation of three acetic acid
bacteria isolates that otherwise wouldn’t be isolated (samples 14, 22 and 32). Still, the analysis of
such a high number and diversity of samples was expected to yield a higher number of acetic acid
bacteria isolates.
3.2 Typing and Identification of Acetic Acid Bacteria Isolates
A dendrogram-based identification using type strains was applied to twenty-two acetic acid bacteria
isolates, purified from vinegar samples, and four reference strains belonging to the genus
Komagataeibacter. These strains were grouped based on REP-PCR and RAPD-PCR genomic
profiles. Figure 6 shows the dendrogram constructed with the Pearson correlation coefficient as a
similarity measure and the unweighted pair group method with the arithmetic average clustering
algorithm (UPGMA). The reproducibility analysis established a discrimination threshold (97%) below
which patterns were deemed different, indicated by the red dotted line. The dendrograms used to
determine the reproducibility cutoff are shown in annex A2.
The ERIC-PCR fingerprinting profiles were not used in the construction of the dendrogram because
the gel electrophoresis showed substantial differences in the intensity of the amplified bands,
especially in the genomic profiles of the reference strains. Therefore, it was decided to exclude this
type of genomic fingerprint from the construction of the dendrogram since it was thought that it would
introduce distortion. Nevertheless, these fingerprinting profiles are shown here for most acetic acid
bacteria isolates as another confirmation of their similarity.
The dendrogram divided the twenty-two acetic acid bacteria isolates into five distinct strains, with
strain 1 having the isolates AAB 001, 002, 003, 004, 010, 011, 012, 015, 016, 017, 025, 026, 029 and
030; strain 2 having the isolates AAB 027 and 028; strain 3 having the isolates AAB 023, 024, 031 and
032; and lastly, strains 4 and 5, having the isolates AAB 034 and 033, respectively. Strains 1 and 2
seem to be very closely related to each other, since the only difference observed in the three genomic
profiling types is the absence of one band in RAPD-PCR fingerprint. Even though the isolates of strain
3 may seem divided into two different strains of the same species, the differences seen when looking
at the banding patterns are mostly resulting from differential amplification of the same bands,

27
especially in the RAPD-PCR fingerprints. Additionally, the ERIC-PCR profiles also confirm the
resemblance of these four isolates. Therefore, the isolates AAB 023, 024, 031 and 032 are considered
to be the same strain.
Figure 6. REP-PCR (GTG5) and RAPD-PCR (PH) fingerprinting patterns from acetic acid bacteria isolates and four
reference strains belonging to the genus Komagataeibacter. The dendrogram was constructed using the Pearson
correlation coefficient as a similarity measure and the unweighted pair group method with the arithmetic average clustering
algorithm (UPGMA). The red dotted line represents the cutoff level (97%) determined by the reproducibility analysis and the
grey bar shows the cutoff level for species separation. The ERIC-PCR fingerprinting patterns were not used in the construction
of the dendrogram. DSMZ 5602: Km. hansenii; DSMZ 6160: Km. europaeus; DSMZ 6513: Km. xylinus; DSMZ 11804: Km.
intermedius.
The grey bar shown in the dendrogram represents the cutoff level for species separation. The range of
similarity between the two different species more closely related (strain 3 and 5) determines this
delimitation. Thus, depending on the level of similarity chosen for the cutoff level for species
separation, strains 1 and 2 may or may not belong to Km. europaeus. Still, these strains show a high
level of similarity (93% similarity) with this species. Concerning the isolates of strain 3, they do not
show any meaningful similarity with any of the reference strains. The same happens with isolates AAB
033 and 034 (strains 5 and 4, respectively). Therefore, this analysis is not capable of identifying these
strains.
28
Isolates belonging to strains 1 and 2 were all isolated in the MG laboratory. It is interesting to note that
they cluster very closely together (95% similarity). Indeed, these isolates were all collected from a 6-
liter experimental acetator that is constantly working with different raw materials. This suggests that
these isolates may in fact represent two variants of an original resident strain in this experimental
acetator, with a notable metabolic plasticity being capable of producing vinegar from at least
fermented pear and pepper mashes. Regarding the isolates of strain 3, it is notable to find them
grouping together, since they were isolated from cider, cereal and fig vinegar. This could also mean
the existence of a resident strain, in an industrial acetator, where these vinegars were produced.
Highly conserved repetitive DNA motifs are distributed throughout the genomes of various bacterial
groups, such as Repetitive Extragenic Palindromic (REP) elements or Enterobacterial Repetitive
Intragenic Consensus (ERIC) elements. The amplification of the DNA segments between these
repetitive sequences has been used to generate fingerprints in several bacterial groups. Additionally,
GTG5-REP-PCR was reported to be a useful fingerprinting technique for identification and
classification of acetic acid bacteria to the species level [De Vuyst et al., 2008]. Since then, this
methodology as been successfully applied in the typification of isolates of this group of bacteria
several times [Cleenwerck et al., 2010; Vegas et al., 2010; Yetiman et al., 2015]. The RAPD-PCR
methodology with the primer PH has been reported as providing suitable fingerprints, with well defined
amplification patterns, appropriate for the identification of Listeria spp. [Chambel et al., 2007]. As far
as we know, it was never applied to acetic acid bacteria. What is interesting about this technique is the
primer choice, since it is a universal 16S rRNA gene oriented primer. The amplification reaction is
performed with a relatively low annealing temperature and a high concentration of MgCl2 to promote
unspecific primer hybridizations, but the primer should always hybridize at its original target. However,
to truly unveil the discriminatory power of the RAPD-PCR with the primer PH when applied to acetic
acid bacteria, several other type strains would have to be tested, along with a larger collection of
isolates. Still, this methodology seems to be promising for the discrimination and classification of this
group of bacteria, since it is able to distinguish strain 1 from strain 2 and strain 4 from strain 5,
contrarily to GTG5-REP-PCR.
The sequences obtained with the amplification and sequencing of a portion of the 16S rRNA gene of
bacterial isolates were used in a BLAST analysis in search of their closest known relative. However,
this analysis was inconclusive since the identification to the species level was not possible, for any of
the isolates. Indeed, all of the sequences showed coverage and identity percentages of 99% or more
with database sequences belonging to several species of Komagataeibacter, the most common being
Km. europaeus, Km. xylinus, Km. nataicola and Km. swingsii (data not shown). In the light of this
result, the sequences obtained with the 16S rRNA gene amplification and sequencing were used in a
phylogeny reconstruction (neighbor-joining algorithm), along with the 16S rRNA gene sequences of
the type strains of all the species of the genus Komagataeibacter, collected from the GenBank
database (Figure 7).
The phylogenetic tree shown in Figure 7 cannot distinguish between the isolates AAB 016, 025, 026
and 030 (representatives of strain 1), AAB 027 and 028 (strain 2), AAB 023, 024 and 032 (strain 3)

29
and the type strains of Km. europaeusT and Km. swingsiiT. This result is in agreement with the results
obtained with the genomic fingerprints, where isolates from strains 1 and 2 were shown to be closely
related to each other and with Km. europaeusT. However, the type strain of Km. swingsiiT was not
used in this study, since it is usually isolated from fruits and fruit juices, resulting in its absence from
the genomic fingerprinting analysis. Additionally, on the contrary to the BLAST analysis, the phylogeny
shows the distinction between these isolates and Km. xylinusT and Km. nataicolaT.
Figure 7. Phylogenetic relationships amongst all species of the genus Komagataeibacter and acetic acid bacteria isolates. The phylogenetic tree is based on the sequences of the 16S rRNA gene. Sequences of this gene belonging to the
type strains were collected from the GenBank database while the sequences belonging to bacterial isolates were amplified and
sequenced, as described in section 2.4. The tree was constructed with neighbor-joining algorithm and numbers at the nodes
indicate bootstrap values (%) derived from 1000 replications. Acetobacter aceti was used as an outgroup.
Regarding the isolates of strain 3, it was surprising to see how they align with the isolates from strains
1 and 2. This result is in clear contradiction with the difference demonstrated by the analysis of the
genomic fingerprints (Figure 6), where all three genomic fingerprinting types noticeably distinguish
isolates of strain 3 from those of strains 1 and 2. Additionally, the isolates AAB 033 (strain 5), AAB 034
(strain 4) also align with each other and with the type strains of Km. nataicolaT and
Km. sucrofermentansT. Again, this result does not correspond to the interpretation of the dendrogram
in Figure 6, where strain 4 and 5 are clearly separated from each other, belonging to different species.
Km. europaeusT
Km. swingsiiT
Km. intermediusT
Km. nataicolaT
Km. sucrofermentansT
Km. oboediensT
Km. xylinusT
Km. medellinensisT
Km. saccharivoransT
Km. rhaeticusT
Km. hanseniiT
Km. kombuchaeT
Km. maltacetiT
Km. kakiacetiT
A. acetiT

30
However, the type strains of Km. nataicolaT and Km. sucrofermentansT were not used in the
construction of the dendrogram and, since they did not cluster with any of the type strains used, the
identification to the species level of the strains 4 and 5 is not possible by this analysis. A possible
explanation for this finding is the fact that acetic acid bacteria exhibit highly conserved 16S rRNA gene
sequences, which regularly results in an unreliable identification when this marker is used alone
[Chakravorty et al., 2005]. For this reason, other molecular markers have been explored when working
with acetic acid bacteria, such as 16S-23S rRNA ITS or protein-encoding genes (for instance, rpoB
and/or dnaK) [Cleenwerck et al., 2010; Trček et al., 2005; Trček et al., 2002].
The differentiation shown here for the isolate AAB 003 was not expected. Upon further examination of
the sequence of the 16S rRNA gene obtained for this isolate, four insertions of adenine were found
throughout the sequence. These insertions were not detected in any other sequence belonging to the
remaining bacterial isolates. Additionally, none of the results above suggest a reason to differentiate
AAB 003 from the remaining isolates of strain 1. Therefore, there is a strong possibility that these
insertions are mistakes either in the amplification reaction or in the sequencing process.
Overall, there is a strong suggestion that strains 1 and 2 belong to Km. europaeus. Still, the possibility
of them belonging to Km. swingsii cannot be discarded. Interestingly, the two strains show phenotypic
traits both agreeing and disagreeing with those described for these species. Strains belonging to Km.
europaeus are described as having an absolute requirement of acetic acid for growth
[Sievers et al., 1992]. However, strains 1 and 2 were always grown on GYC plates, where no acetic
acid is added. In fact, such characteristic has already been described for the type strain of
Km. europaeus, which showed delayed growth in solid RAE medium without acetic acid
[Sokollek et al., 1998]. With respect to Km. swingsii strains, they are commonly isolated from fruits and
fruit juices, but not vinegars [Dellaglio et al., 2005]. Indeed, strains 1 and 2 were isolated from
fermented pear mashes. Another characteristic associated with Km. swingsii is cellulose production
[Dellaglio et al., 2005], although none of these isolates have shown this trait. Regarding strains 4 and
5, they both show cellulose production, which is a characteristic shared with Km. nataicola and
Km. sucrofermentans. Phenotypically, Km. nataicola and Km. sucrofermentans can be distinguished
from each other based on growth on sucrose, where the former is not capable of this and the latter is.
Concerning strain 3, the results of both analyses are incoherent since the dendrogram clearly
separates this strain from strains 1 and 2 and the phylogeny reconstruction does not distinguish these
three strains. Thus, the identification to the species level of any of the strains remains to be confirmed.
3.3 Development of a Molecular Detection Method for Acetic Acid Bacteria
Different amplification conditions and primer combinations were tested in order to optimize the PCR
amplification with the designed primers. Table 5 shows the sequential approach to the optimization of
the amplification reaction, resulting in the PCR described in section 2.5.

31
The Multiplex-PCR approach was chosen as a way of increasing the specificity of the methodology,
since none of the four possible combinations of primers showed flawless results with the inclusivity
and exclusivity controls.
Table 5. Sequential approach to the optimization of the amplification reaction with the designed primers (ADH-F1, ADH-F2, ADH-R1 and ADH-R2). Inclusivity control refers to strains where amplification is expected to occur. Exclusivity control refers
to strains where amplification is not expected to occur. Negative control was performed without adding DNA to the reaction mix.
Tested Conditions Primers Tested Strains Results
Singleplex-PCR
§ 2 concentrations of MgCl2 (1.5 mM and 2.5 mM)
§ 2 concentrations of primer (25 pmol and 50 pmol)
§ a range of 12 annealing temperatures (46.5ºC to 57.5ºC)
F1R1 F1R2
F2R2
F2R1
§ Inclusivity control: Km. europaeus DSMZ 6160T
§ Exclusivity control: E. coli ATCC 29522
§ Amplification of the expected fragment in all conditions;
§ Amplification in all exclusivity controls with highest MgCl2 concentration;
§ Selected conditions: 1.5 mM of MgCl2, 25 pmol of primer and annealing temperature at 57ºC;
Singleplex-PCR
Amplification in 8 additional inclusivity
controls, 1 additional exclusivity control
and addition of a negative control
F1R1 F1R2
F2R2
F2R1
§ Inclusivity control: all reference strains
§ Negative control: no DNA added
§ Exclusivity control: E. coli ATCC 29522 and a wild strain of Morganella morganii
§ Amplification of the expected fragment for most inclusivity controls;
§ Amplification of unspecific bands, mainly for Acetobacter strains, when primer R1 was used;
§ M. morganii showed amplification when primer R1 was present;
§ Negative control showed no amplification;
Multiplex-PCR Amplification with the four primers in
the same reaction F1F2R1R2
§ Inclusivity control: all reference strains
§ Negative control: no DNA added
§ Exclusivity control: E. coli ATCC 29522 and a wild strain of M. morganii
§ Amplification of the expected fragment for most inclusivity controls;
§ Amplification of unspecific bands for all inclusivity controls, as well as for both exclusivity controls;
§ Negative control showed no amplification;
Multiplex-PCR
Elimination of primer R1 and addition of
2 AAB isolates as inclusivity controls
and 7 non-AAB strains isolated from
vinegar samples as exclusivity controls
F1F2R2
§ Inclusivity control: all reference strains and 2 AAB isolates
§ Negative control: no DNA added
§ Exclusivity control: E. coli ATCC 29522 and 8 non-AAB wild strains
§ Amplification of the expected fragment for most inclusivity controls, although there is still amplification of one unspecific fragment;
§ Acetobacter cerevisiae CECT 824 shows no amplification;
§ All exclusivity controls show no amplification;
Multiplex-PCR
Addition of an internal (+) control
F1F2R2 and 16S rRNA
gene oriented
primers
(PA and 907r)
§ Inclusivity control: all reference strains and 2 AAB isolates
§ Negative control: no DNA added
§ Exclusivity control: E. coli ATCC 29522 and 8 non-AAB wild strains
§ Inclusivity controls show amplification of the internal (+) control, in addition of the expected fragments;
§ Acetobacter cerevisiae CECT 824 only shows amplification of the internal control;
§ Exclusivity controls show only amplification of the internal control;

32
Figure 8 shows the Multiplex-PCR profile of an acetic acid bacterium, as well as of bacterial isolates
not belonging to this group. The amplification reaction was performed with the optimized conditions.
The PCR with the primers ADH-F1, ADH-F2 and ADH-R2 results in the amplification of two fragments
in acetic acid bacteria, 240 bp (primers ADH-F2 and ADH-R2), 336 bp (primers ADH-F1 and ADH-
R2). Sometimes, the unspecific amplification of a third fragment occurs.
Figure 8. Typical Multiplex-PCR profile of acetic acid bacteria, as well as of bacterial isolates not belonging to this
group. The black arrow shows the expected amplification bands for an acetic acid bacteria isolate. The white arrow shows the
band corresponding to the internal control (primers PA and 907r). M. morganii and E. coli ATCC 25922 were used as exclusivity
controls, where amplification with the adhA directed primers was not expected to occur. The (—) indicates the negative control,
where no DNA was added to the mix. The (M) refers to 1kb Plus DNA ladder (Invitrogen).
Here, the Multiplex-PCR amplification reaction is shown, in an electrophoretic separation in agarose
gel (1.2%), for all the reference strains used in this study and for two isolates already confirmed to be
acetic acid bacteria (AAB 003, 016; Komagataeibacter sp.) by 16S rRNA sequencing (chapters 2.4
and 3.2). Additionally, seventeen isolates brought to Lab Bugworkers | M&B-BioISI from the MG lab as
potential acetic acid bacteria were also screened. Lastly, M. morganii and E. coli ATCC 25922 are
shown here as exclusivity controls, where amplification with the adhA primers was not expected to
occur and a negative control (—) where no DNA was added to the PCR mix and no amplification was
expected to occur with any of the five primers.
Regarding the reference acetic acid bacteria, two of the eleven strains do not show the expected
amplification profile. In Km. xylinus DSMZ 6513T, only the smallest fragment can be seen,
corresponding to the 240 bp fragment (primers ADH-F2 and ADH-R2). Also, A. cerevisiae CECT 824,
showed a negative result. Concerning the seventeen unidentified bacterial isolates, four show the
profile corresponding to acetic acid bacteria, nine exclusively show the amplification of the internal
control (negative result) and four do not show any band at all (possibly a problem in the DNA
extraction). Finally, the exclusivity controls demonstrate the negative result of the amplification
Multiplex-PCR
62 A16
57 A16
63 A16
A
67 A16
64 A16
65 A16
66 A16
68 A16
71 A16
74 A16
75 A16
77 A16
78 A16
83 A16
85 A16
86 A16
63 A16
B
DSMZ 3503
T
DSMZ 3508
T
DSMZ 3509
T
DSMZ 5602
T
DSMZ 6513
T
DSMZ 1180
4 T
CECT 824
CECT 4009
DSMZ 6160
T
M. morg
anii
E. coli (
ATCC 2592
2)
AAB 003
AAB 016
M M

33
reaction. Thus, Figure 8 shows how clearly acetic acid bacteria can be distinguished from of non-AAB
isolates.
In any industrial process, the identification and quantification of different strains and species is
extremely important. Since acetic acid bacteria are involved not only in the production, but also in the
spoilage of foods and beverages, the monitoring of their presence is essential in the different stages of
an industrial bioprocess, especially in the final product, after the manufacturing process
[Raspor et al., 2008]. Since identification methodologies based on phenotypic characteristics of acetic
acid bacteria are not only unreliable, but also time-consuming, the application of molecular detection
and/or identification methods could provide a fast and accurate solution [Trček et al., 2005].
Additionally, molecular methods are the only option when working with microorganisms of difficult
isolation or in a VBNC state.
The discrimination power of a molecular detection method is extremely dependent on its molecular
target. The 16S rRNA gene of acetic acid bacteria is very conserved and as been shown to have
different hypervariable regions than those normally described for other bacterial groups
[Chakravorty et al., 2005]. Therefore, this gene was initially assessed as a possible target for the
development of a molecular detection method specific for acetic acid bacteria. However, since it is
present in all bacteria, a gene with a more conserved function was thought to be more indicated for
the desired methodology. The unique ability of this group of bacteria to oxidize ethanol to acetic acid is
due to two periplasmic proteins, PQQ-dependent ADH and ALDH [Matsushita et al., 2016]. Therefore,
the gene adhA, which encodes for the subunit I of the PQQ-ADH was evaluated as a potential
molecular target. A multiple alignment of sequences of this gene belonging to different acetic acid
bacteria species showed the presence of variable and conserved segments, ideal for the design of
oligonucleotide primers.
The gene adhA has already been studied and was shown to be more and less discriminatory for acetic
acid bacteria when compared with the 16S rRNA gene and the 16S-23S rRNA ITS, respectively. Also,
A. aceti specific primers were designed and the gene adhA was reported to be a promising target for
the construction of species-specific oligonucleotides for quick molecular identification of acetic acid
bacteria [Trček et al., 2005].
In the present study, the designed primers were shown to be specific for acetic acid bacteria, since all
the non-AAB isolates tested were negative (only showed amplification of the internal control). Besides,
all these non-AAB strains were isolated from vinegar samples. The 16S rRNA gene was amplified and
sequenced (as described in section 2.4) and these isolates were identified as Staphylococcus spp.,
Bacillus spp. and Paenibacillus spp.. Still, one of the reference strains, A. cerevisiae CECT 824,
showed a negative result, meaning that the primer ADH-R2 does not hybridize in the adhA sequence
of this strain and that the designed primers were not 100% inclusive in the tested conditions.
Additionally, Km. xylinus DSMZ 6513T shows amplification of only one band, instead of the expected
two, suggesting that ADH-F1 does not hybridize in the adhA sequence of this strain. During the
development of the amplification reaction (Table 5), problems were also detected with the primer
ADH-R1 in the strains A. aceti DSMZ 3508T and A. pasteurianus DSMZ 3509T. However, these

34
complications can also be seen as opportunities. If the primer does not hybridize in a certain type
strain, sequence differences may exist to open the road for the use of adhA gene to build species-
specific probes.
Taking everything into account, these results show that the designed primers, and the optimized
amplification reaction, are effective in the molecular detection of acetic acid bacteria and that once
again, the gene adhA has been successfully used for this purpose, even though different regions were
explored. This methodology was applied as a routine detection method to several unidentified
bacterial isolates (additional form those shown in Figure 8) brought to the Lab Bugworkers | M&B-
BioISI from the MG lab and it proved to be a fast and reliable methodology in the distinction of acetic
acid bacteria from non-AAB isolates.
3.4 Growth Performance of Acetic Acid Bacteria in Red Wine
Acetic acid bacteria isolates AAB 023, 030, 033 and 034, corresponding to strains 3, 1, 5 and 4,
respectively, were inoculated in diluted wine (around 4.8% ethanol concentration) and their growth
was followed for several days. Figure 9 shows the growth characteristics of these four strains, as well
as the pH of the medium and the concentration of acetic acid throughout several days. All strains were
grown in triplicates and all optical density (OD), pH and acetic acid concentration measurements were
obtained for each triplicate.
Table 6 shows the main growth characteristics of these four strains. The isolate that showed the
shortest lag phase was AAB 030, around one day, while isolates AAB 023 and 033 showed a lag
phase of around two days and AAB 034 showed lag phase of almost four days. Regarding the cell
yield, isolates AAB 023 and 030 showed the highest values, reaching OD values of 0.9 and 0.75,
respectively, and the highest growth rates, 0.28 day-1 and 0.34 day-1, respectively, while isolates AAB
033 and 034 showed very low cell yield values and growth rates. With the exception of isolate AAB
033, all isolates showed an abrupt decrease in cell number after the highest acetic acid concentration
was reached. The highest acetic acid concentration, around 4% (w/v), was obtained with isolate AAB
023, while around 3.2% (w/v) acetic acid was obtained with isolates AAB 030 and 033 and around
2.8% (w/v) acetic acid was obtained with isolate AAB 034. Interestingly, isolates AAB 033 and 034
showed the highest acetic acid production rates, 0.37 %day-1 and 0.38 %day-1, respectively.
In general, these four isolates show two distinct growth types that seem to be associated to the
production of cellulose. Isolates AAB 033 and 034 are cellulose producers. This is quite possibly the
explanation for the low cell yield measured, since cells of these strains grow primarily on the cellulose
matrix. When a sample of the culture was collected to measure the OD, agglomerates of cellulose
were either too big and did not enter the pipette tip or small enough to enter the pipette tip but
interfered with the absorbance reading. Interestingly, these strains showed different behaviors in terms
of cellulose production. At the time of the collection of the last time-point (day 28), all triplicates of
AAB 033 showed turbidity in the medium, along with several chunks of cellulose, while all triplicates of
AAB 034 showed only one big mass of cellulose and the medium was completely clear (as evidenced

35
by the OD reading). Strains that produce cellulose are not indicated in the production of vinegar
through the submerged fermentation process since the cellulose produced may clog the tubing.
Figure 9. Growth characteristics of strains of acetic acid bacteria in diluted wine. A: non-cellulose producing isolates AAB
023, 030, corresponding to strains 3, 1, respectively. B: cellulose producing isolates AAB 033 and 034, corresponding to strains
5 and 4, respectively. All strains were grown in triplicates, at 28ºC and shaking conditions. Error bars represent the standard
deviation at each time-point. OD: optical density measured at 600 nm (u); pH (n); % AcH: acetic acid concentration (w/v) (p).
The maximal bioconversion efficiency was calculated with the assumption that the initial ethanol
concentration was 4.8% (v/v) and that it was completely consumed by all strains. Isolate AAB 023
showed the highest bioconversion efficiency, 78.3%, and, as expected, isolates AAB 033 and 034
showed lower values, 64.2% and 55.2%, respectively, since they must redirect carbon and energy for
the production of cellulose. The low bioconversion efficiency shown by isolate AAB 030 was not
expected since there is no carbon draining for cellulose production. It is possible that this strain has a
low resistance to acetic acid. That would explain the low maximum acetic acid concentration reached
and the low bioconversion efficiency (if not all ethanol was consumed). Regarding productivity, this
0.0 0.1 0.2 0.3 0.4 0.5 0.6 0.7 0.8 0.9 1.0
0.0 0.5 1.0 1.5 2.0 2.5 3.0 3.5 4.0 4.5
0 2 4 6 8 10 12 14 16 18 20 22 24
OD pH % AcH
Time (days)
AAB 023 (strain 3)
% AcH pH OD
0.0 0.1 0.2 0.3 0.4 0.5 0.6 0.7 0.8 0.9 1.0
0.0 0.5 1.0 1.5 2.0 2.5 3.0 3.5 4.0 4.5
0 2 4 6 8 10 12 14 16 18 20 22 24
OD pH % AcH
Time (days)
AAB 030 (strain 1)
% AcH pH OD
0.0 0.1 0.2 0.3 0.4 0.5 0.6 0.7 0.8 0.9 1.0
0.0 0.5 1.0 1.5 2.0 2.5 3.0 3.5 4.0 4.5
0 2 4 6 8 10 12 14 16 18 20 22 24 26 28
OD pH % AcH
Time (days)
AAB 033 (strain 5)
% AcH pH OD
0.0 0.1 0.2 0.3 0.4 0.5 0.6 0.7 0.8 0.9 1.0
0.0 0.5 1.0 1.5 2.0 2.5 3.0 3.5 4.0 4.5
0 2 4 6 8 10 12 14 16 18 20 22 24 26 28
OD pH % AcH
Time (days)
AAB 034 (strain 4)
AcH % pH OD
A
B

36
parameter differs from acetic acid production rate because it takes in account the time necessary to
reach the maximum acetic acid concentration. As expected, isolate AAB 023 shows a high
productivity, 2.96 gl-1day-1. Still, isolate AAB 033 achieved the highest productivity, 3.11 gl-1day-1. This
could be explained by the fact that isolate AAB 033 reached the maximum acetic acid concentration in
10 days while isolate AAB 023 reached the maximum acetic acid concentration in 13 days.
Table 6. Growth parameters of isolates AAB 023, 030, 033 and 034, equivalent to strains 3, 1, 5 and 4, respectively.
AAB 023 AAB 030 AAB 033 AAB 034
Lag phase (hours) 41 24 48 89
Growth rate 1st exponential (day-1) a 0.28 0.34 0.10 0.02
Growth rate 2nd exponential (day-1) a 0.03 0.03 0.01 not applicable
Maximum OD 0.90 0.75 0.39 0.32
Acetic acid production rate (%day-1) b 0.34 0.29 0.37 0.38
Maximum acetic acid obtained % (w/v) 3.95 3.18 3.23 2.79
Maximal bioconversion Efficiency (%) 78.3 62.9 64.2 55.2
Productivity (gl-1day-1) 2.96 2.73 3.11 2.66
Cellulose production - - + + a Determination coefficient (R2) varied between 0.888 and 0.998; b Determination coefficient (R2) varied between 0.991 and 0.997.
It is interesting to see that although isolates AAB 023 and 030 show a diauxic growth curve, the
second exponential growth phase does not correspond to the assimilation of acetic acid, as is
described for Komagataeibacter strains. Indeed, these isolates did not seem to consume acetic acid. It
has been previously described that overoxidation only occurs in Km. europaeus strains when the
acetic acid concentration is below a strain-specific limit, varying between 5% and 9%, at the time of
ethanol depletion [Sokollek et al., 1998]. However, acetic acid concentration did not reach these
values with either isolate.
Overall, strains 1 and 3, represented by isolates AAB 030 and 023, respectively, appear to be
indicated to be employed as starter cultures since they show absence of ethanol overoxidation and
cellulose production. Strain 1 showed a shorter lag phase and higher growth rate, while strain 3
showed high cell yield, acetic acid production rate and final concentration, bioconversion efficiency
and productivity. An interesting approach to an arrest of an industrial acetification process would be
the employment of a mixed inoculum of these two strains. Strain 1 would be responsible for a fast
restart of the acetification, giving time for strain 3 to thrive and take over the vinegar production. Also,
strain 5 could be indicated for the production of static culture or balsamic vinegars, since it is a

37
cellulose producer but, at the same time, this strain shows acceptable values of lag phase, acetic acid
production rate and maximum concentration, bioconversion efficiency and the highest productivity.
However, additional characterization of these strains is needed to truly determine their suitability as
starters.
3.5 Microbial Community of a Red Wine Vinegar Production Cycle
Community DNA was extracted from five red wine vinegar samples collected from the same acetator,
throughout 36 hours, corresponding to different stages of a red wine vinegar production cycle. Figures
10 and 11 show the proportion of acetic acid bacteria at each time-point of the vinegar production
cycle. These figures refer to the results of the amplification, sequencing and identification of regions 1
and 2 of the 16S rRNA gene, respectively. Here is presented the evolution of the acetic acid bacteria
population throughout the conversion of red wine into vinegar.
Figure 10. Representation of the proportion of acetic acid bacteria in each time-point. The pie charts show the relative
abundance of non-AAB in each time-point. Data is relative to the analysis of the region 1 of the 16S rRNA gene. Percentages
were calculated from a total of 39 093 reads.
Detailed information about this analysis is shown in annex A4. Additionally, the presence of fungi was
investigated with ITS directed primers, although the results were negative for all samples.
As can be observed in both figures, the production process starts with an elevated proportion of acetic
acid bacteria, of around 90% (t1, 0 h). This value progressively increases throughout 29 hours until a
total absence of non acetic acid bacteria is reached (t4, 29 h). In time-point 5, a decrease of the
proportion of acetic acid bacteria can be seen, corresponding to the end of the cycle, when the
acetator is partially emptied and refilled with fresh mash (wine).
91.1% 97.5%
83.9%
100.0%
84.7%
8.9% 2.6%
16.2%
0.0%
15.3%
Microbial Profiling - Region 1
Komagataeibacter sp. Other bacteria spp.
t1 (0 h) t2 (19 h) t3 (23 h) t4 (29 h) t5 (36 h)

38
Figure 11. Representation of the proportion of acetic acid bacteria in each time-point. The pie charts show the relative
abundance of non-AAB in each time-point. Data is relative to the analysis of the region 2 of the 16S rRNA gene. Percentages
were calculated from a total of 45 997 reads.
In time-point 3, a clear disruption of the increase of the proportion of acetic acid bacteria can be seen,
in both figures. Since this disturbance seems deranged from the general tendency demonstrated by
this analysis, the possibility of contamination with external microorganisms can’t be excluded, either at
the moment of collection of the sample or in any of its downstream processing. Additionally, no
problems with this production cycle were reported by MG. Thus, it is assumed that the data presented
in this time-point does not represent the true microbial community in the acetator at that time.
These results show that this process is clearly dominated by acetic acid bacteria, particularly those
belonging to the genus Komagataeibacter. Here is evidenced how well adapted these organisms are,
thriving in such a harsh environment. Additionally, this result is in agreement with other studies that
confirm that Komagataeibacter strains are indeed the most resistant to acetic acid, within the acetic
acid bacteria, and thus are generally responsible for acetification in submerged fermentations, with a
high yield of acetic acid production [Sievers et al., 1992; Trček et al., 2016].
The fact that two different regions of the 16S rRNA gene demonstrate results with such a high level of
similarity increases the confidence in the analysis. However, the taxonomic resolution with this type of
technique is extremely dependent on the molecular target selected. The rRNA operon has been widely
used for studying prokaryotic communities, especially the 16S subunit, as it contains highly conserved
regions (ideal for universal primer locations) intercalated by highly heterogenic regions (ideal for
taxonomic discrimination) [Bokulich et al., 2012]. Still, not all taxa are equally heterogeneous at a
given region. As discussed above, acetic acid bacteria are known to have highly conserved 16S rRNA
gene sequences [Raspor et al., 2008; Trček et al., 2016]. Another problem often associated with this
molecular marker is its copy number variation and how this variation can distort the results, with
bacterial groups being misrepresented. Consequently, protein-encoding genes have been
investigated, such as rpoB (encoding the β-subunit of the RNA polymerase), though these targets are
89.9% 97.8%
87.8% 100.0%
93.9%
10.1% 2.1%
12.2% 0.0%
5.9%
Microbial Profiling - Region 2
Komagataeibacter sp. Other bacteria spp.
t1 (0 h) t2 (19 h) t3 (23 h) t4 (29 h) t5 (36 h)

39
less studied across all bacterial taxa [Bokulich et al., 2012]. Thus, the 16S rRNA gene remains the
most prevalent molecular target as it is the most represented prokaryotic gene in public databases.
Earlier this year, NGS (Ilumina) of vinegar samples collected form an industrial acetator was applied
for the first time, both in wine and cider vinegar production, targeting the variable region V3-V4 of the
16S rRNA gene [Trček et al., 2016]. The authors reported Komagataeibacter sp. as the dominant
microorganism in red wine vinegar production, with a lowest relative abundance of 84% and a highest
of 99%, throughout several time-points of three different production batches. These results are in full
agreement with those presented here. However, this is still a pseudo-quantitative method, showing
only relative abundance of the detected microorganisms and only one production cycle was analyzed,
from an acetator constantly running.
40
4. Final Remarks and Future Perspectives
In this work, acetic acid bacteria were isolated from a large variety of vinegars and were grouped
based on two genomic fingerprinting techniques, GTG5-REP-PCR and PH-RAPD-PCR, along with
reference strains obtained from culture collections. These genomic profiles were used to define 5
different strains and isolates belonging to all strains were randomly selected for the amplification and
sequencing of the 16S rRNA gene. A BLAST analysis and a phylogenetic reconstruction positioned all
strains in the genus Komagataeibacter. However, due to the high level of conservation of this gene in
this group of bacteria, the identification to the species level of any of the strains was not possible. Four
acetic acid bacteria isolates, belonging to four different strains, were grown in diluted red wine in order
to evaluate the suitability of the employment of these strains as starter cultures. Strains 1 and 3
showed desirable characteristics of an optimal acetic acid bacteria starter, such as a short lag phase,
high cell yield, high bioconversion efficiency and productivity, no ethanol overoxidation and no
cellulose production. Additionally, a molecular detection method for acetic acid bacteria was
developed targeting the adhA gene. Primers were designed based on a multiple alignment of
sequences of this gene belonging to different acetic acid bacteria species and genera. The PCR was
optimized and tested on 9 reference strains and a variety of bacterial isolates not belonging to the
acetic acid bacteria group. This methodology proved to be fast and reliable in the distinction of acetic
acid bacteria from non-AAB isolates. Finally, community DNA was extracted from five vinegar
samples, corresponding to different stages of a red wine vinegar production cycle. Two regions of the
16S rRNA gene were amplified, sequenced by NGS and identified by a BLAST analysis. The results
showed that the vinegar production through the submerged fermentation process is clearly dominated
by acetic acid bacteria, particularly those belonging to the genus Komagataeibacter.
In the last years, several media specific for the growth of acetic acid bacteria have been described. It
would be interesting to revisit the isolation approaches with the employment of different solid and
liquid media for the isolation of acetic acid bacteria, namely the use of RAE solid medium, that has
acetic acid and ethanol in the medium composition and a double-layer agar [Sokollek et al., 1997].
The double layer is made using a lower layer of medium with 0.5% agar and a top layer of medium
with 1% agar. The semi-solid lower layer provides the colonies growing on the top layer a constant
supply of moisture, simulating the environment in the acetification tanks. Other possibility is the usage
of a liquid medium with ethanol as the only carbon source in the enrichment approach.
Regarding the acetic acid bacteria isolated in this study, it would be interesting to identify them to the
species level. Ideally, a molecular methodology targeting other genes than the 16S rRNA gene should
be applied. A multilocus sequence analysis (MLSA) with the genes dnaK (encoding a heat-shock
protein), rpoB (encoding the β-subunit of the RNA polymerase) and groEL (encoding a chaperone
protein) proved to be suitable for acetic acid bacteria species differentiation and also led to the
reclassification of a strain of Komagataeibacter xylinus [Cleenwerck et al., 2010].
Strains 1 and 3 were shown to be promising candidates to be employed as starter cultures. However,
further tests are necessary to determine their suitability as starters regarding cell viability after frozen
and lyophilized preparations, genomic stability and maintenance of phenotype, organoleptic
41
characteristics and acetic acid production yield and productivity in a vinegar “fermentation” at an
industrial scale.
Regarding the multiplex-PCR, the sequence of the adhA gene showed to be promising for the design
of species-specific probes, since it presented conserved and variable regions. Indeed, this gene was
indicated as having higher variability among different species of acetic acid bacteria than the 16S
rRNA gene [Trček et al., 2005]. In this study, we found differential amplification in different species
with the four designed primers. These primer hybridization regions should be further explored since
they are promising for the construction of species-specific probes.

42
5. References
Adler, P., Frey, L.J., Antje Berger, Bolten, C.J., Hansen, C.E., Wittmanna, C., 2014. The Key to Acetate: Metabolic Fluxes of Acetic Acid Bacteria under Cocoa Pulp Fermentation-Simulating Conditions. Applied and Environmental Microbiology, 80, 4702–4716.
Bokulich, N., Mills, D., 2012. Next-generation approaches to the microbial ecology of food fermentations. BMB reports, 45(7): 377-389.
Chakravorty, S., Sarkar, S., Gachhui, R., 2005. Identification of New Conserved and Variable Regions in the 16S rRNA Gene of Acetic Acid Bacteria and Acetobacteraceae Family. Molecular Biology, Vol. 49, No. 5, pp. 668–677.
Chambel, L., Sol M., Fernandes, I., Barbosa, M., Zilhão, I., Barata, B., Jordan, S., Perni, S., Shama, G., Adrião, A., Faleiro, L., Requena, T., Peláez, C., Andrew, P.W., Tenreiro, R., 2007. Occurrence and persistence of Lysteria spp. in the environment of ewe and cow’s milk dairies in Portugal unveiled by an integrated analysis of identification, typing and spatial-temporal mapping along production cycle. International Journal of Food Microbiology, 116, 52-63.
Cleenwerck, I., De Vos, P., De Vuyst, L., 2010. Phylogeny and differentiation of species of the genus Gluconacetobacter and related taxa based on multilocus sequence analyses of housekeeping genes and reclassification of Acetobacter xylinus subsp. sucrofermentans as Gluconacetobacter sucrofermentans (Toyosaki et al. 1996) sp. nov., comb. nov. International Journal of Systematic and Evolutionary Microbiology, 60, 2277–2283.
De Vuyst, L., Camu, N., De Winter, T., Vandemeulebroecke, K., Van de Perre, V., Vancanneyt, M., De Vos, P., Cleenwerck, I., 2008. Validation of the (GTG)5-rep-PCR fingerprinting technique for rapid classification and identification of acetic acid bacteria, with a focus on isolates from Ghanaian fermented cocoa beans. International Journal of Food Microbiology 125, 79–90.
Dellaglio, F., Cleenwerck, I., Felis, G.E., Engelbeen, K., Janssens, D., Marzotto, M., 2005. Description of Gluconacetobacter swingsii sp. nov. and Gluconacetobacter rhaeticus sp. nov., isolated from Italian apple fruit. International Journal of Systematic and Evolutionary Microbiology, 55, 2365–2370.
Deppenmeier, U., Hoffmeister, M., Prust, C., 2002. Biochemistry and Biotechnological Applications of Gluconobacter strains. Applied Microbiology Biotechnology, 60:233–242.
Fernández-Pérez, R., Torres, C., Sanz, S., Ruiz-Larrea, F., 2010. Strain typing of acetic acid bacteria responsible for vinegar production by the submerged elaboration method. Food Microbiology 27, 973-978.
Guillamón, J.M., Mas, A., 2009. Acetic Acid Bacteria. In Biology of Microorganisms on Grapes, in Must and in Wine (pp. 31-46). König, H., Unden, G., Fröhlich, J. (Eds.) Springer, Heidelberg.
Guillámon, J.M., Mas, A., 2011. Acetic Acid Bactria. In Molecular Wine Microbiology (pp. 227-255). Carrascosa, A.V., Muñoz, R., González, R. (Eds.) Elsevier, UK.
Gullo, M., Giudici, P., 2008. Acetic acid bacteria in traditional balsamic vinegar: Phenotypic traits relevant for starter cultures selection. International Journal of Food Microbiology 125, 46–53.
Gullo, M., Verzelloni, E., Canonico, M., 2014. Aerobic submerged fermentation by acetic acid bacteria for vinegar production: Process and biotechnological aspects. Process Biochemistry 49, 1571-1579.
Komagata, K., Iino, T., Yamada, Y., 2014. The Family Acetobacteraceae. In The Prokaryotes, (pp. 3-78) Rosenberg, E., et al. (Eds.) Springer, New York.
Li, L., Praet, J., Borremans, W., Nunes, O.C., Manaia, C.M., Cleenwerck, I., Meeus, I., Smagghe, G., De Vuyst, L., Vandamme, P., 2015. Bombella intestini gen. nov., sp. nov., an acetic acid bacterium isolated from bumble bee crop. International Journal of Systematic and Evolutionary Microbiology, 65, 267–273.
Mamlouk, D., Gullo, M., 2013. Acetic Acid Bacteria: Physiology and Carbon Sources Oxidation. Indian Journal of Microbiology, 53:377–384.
Mas, A., Torija, M.J., García-Parrilla, M.C., Troncoso, A.M., 2014. Acetic Acid Bacteria and the Production and Quality of Wine Vinegar. The Scientific World Journal, Article ID 394671, 6 pages.
Massol-Deya, A.A., Odelson, D.A., Hickey, R.F., Tiedje, J.M., 1995. Bacterial community fingerprinting of amplified 16S and 16-23 ribossomal DNA gene sequences and restriction endonuclease analysis (ARDRA). Molecular Microbial Ecology Manual, 3.3.2: 1-8.
43
Matsushita, K., Toyama, H., Adachi, O., 2004. Diversity of Prokaryotic Respiratory Systems. In Respiration in Archaea and Bacteria. (pp. 81-99). Davide Zannoni, (Ed.) Springer, The Netherlands.
Matsushita, K., Toyama, H., Tonouchi, N., Okamoto-Kainuma, A., 2016. Acetic Acid Bacteria, Ecology and Physiology. Springer, Japan.
Mounir, M., Shafiei, R., Zarmehrkhorshid, R., Hamouda, A., Thonart, P., Delvigne, F., Alaoui, M.I., 2016. Optimization of biomass production of Acetobacter pasteurianus KU710511 as a potential starter for fruit vinegar production. African Journal of Biotechnology, Vol. 15(27), pp. 1429-1441.
Muyzer, G., Brinkhoff, T., Nübel, U., Santegoeds, C., Schäfer, H., Wawer, C., 1998. Denaturating gradient gel electrophoresis (DGGE) in microbial ecology. Molecular Microbial Ecology Manual, 3.4.4: 1-27.
Nanda, K., Taniguchi, M., Ujike, S., Ishihara, N., Mori, H., Ono, H., Murooka, Y., 2001. Characterization of Acetic Acid Bacteria in Traditional Acetic Acid Fermentation of Rice Vinegar (Komesu) and Unpolished Rice Vinegar (Kurosu) Produced in Japan. Applied And Environmental Microbiology, p. 986–990.
Prust, C., Hoffmeister, M., Liesegang, H., Wiezer. A., Fricke, W.F., Ehrenreich, A., Gottschalk, G., Deppenmeier, U., 2005. Complete Genome Sequence of the Acetic Acid Bacterium Gluconobacter oxydans. Nature Biotechnology, volume 3, number 2. Raspor, P., Goranovič, D., 2008. Biotechnological Applications of Acetic Acid Bacteria. Critical Reviews in Biotechnology, 28:101-124.
Sakurai K., Arai H., Ishii, M., Igarashi, Y., 2012. Changes in the gene expression profile of Acetobacter aceti during growth on ethanol. Journal of Bioscience and Bioengineering, Vol. 113 No. 3, 343–348.
Sievers, M., Swings, J., 2005. Family II. Acetobacteraceae. In Bergey's Manual of Systematic Bacteriology, 2nd Edition, Volume II, Part C (pp. 41-95). Brenner, D.J., Krieg, N.R., Staley, J.T. (Eds.) Springer, New York.
Sievers, M., Sellmer, S., Teuber, M., 1992. Acetobacter europaeus sp. nov., a Main Component of Industrial Vinegar Fermenters in Central Europe. Systematic and Applied Microbiology, 15, 386-392.
Sokollek, S.J., Hammes, W.P., 1997. Description of a Starter Culture Preparation for Vinegar Fermentation. Systematic and Applied Microbiology, 20: 481–491.
Sokollek, S.J., Hertel, C., Hammes, W.P., 1998. Cultivation and Preservation of Vinegar Bacteria. Journal of Biotechnology, 60, 195-206.
Trček, J., 2005. Quick identification of acetic acid bacteria based on nucleotide sequences of the 16S–23S rDNA internal transcribed spacer region and of the PQQ-dependent alcohol dehydrogenase gene. Systematic and Applied Microbiology 28, 735–745.
Trček, J., Mahnič, A., Rupnik, M., 2016. Diversity of the microbiota involved in wine and organic apple cider submerged vinegar production as revealed by DHPLC analysis and next-generation sequencing. International Journal of Food Microbiology, 223, 57–62.
Trček, J., Teuber, M., 2002. Genetic and restriction analysis of the 16S-23S rDNA internal transcribed spacer regions of the acetic acid bacteria. FEMS Microbiology Letters, 208, 69-75.
Vegas, C., Mateo, E., González, Á., Jara, C., Guillamón, J.M., Poblet, M., Torija, M.J., Mas, A., 2010. Population dynamics of acetic acid bacteria during traditional wine vinegar production. International Journal of Food Microbiology 138, 130–136.
Versalvoice, J., Kouetch, T., Lupski, J.R., 1991. Distribution of repetitive DNA sequences in eubacteria and application to fingerprinting of bacterial genome. Nucleic Acids Research, 19: 6823– 6831.
Yamada, Y., Yukphan, P., Vu, H.T.L., Muramatsu, Y., Ochaikul, D., Tanasupawat, S., and Nakagawa, Y., 2012. Description of Komagataeibacter gen. nov., with proposals of new combinations (Acetobacteraceae). Journal of General and Applied Microbiology, 58, 397‒404.
Yetiman, A.E., Kesmen, Z., 2015. Identification of acetic acid bacteria in traditionally produced vinegar and mother of vinegar by using different molecular techniques. International Journal of Food Microbiology, 204, 9–16.

44
Annexes
A1. Composition of culture media
A medium that allows the success isolation of acetic acid bacteria from different niches is Glucose
Yeast-extract Calcium Carbonate Agar (GYC), composed by glucose (5%), yeast extract (0.5%),
peptone (0.3%), calcium carbonate (CaCO3) (2%) and agar (1.5%). After incubation, the colonies of
acetic acid bacteria are recognized by the surrounding zones of calcium carbonate clearing. The
calcium carbonate reacts with the produced acid, neutralizing it and preventing physiological stress
and cell death [Mamlouk et al., 2013]. Glucose Yeast-extract Peptone (GYP) has the same
composition of as the GYC medium, with the exception of calcium carbonate and the agar.
Reinforced Acetic Acid-Ethanol (RAE) medium is composed of glucose (4%), yeast extract (1%),
peptone (1%), disodium hydrogen phosphate dihydrate (Na2HPO.2H2O) (0.338%) and citric acid
(0.15%) (w/v). The solid medium has a double-layer agar [Sokollek et al., 1997]. The double layer is
made using a lower layer of medium with 0.5% agar and a top layer of medium with 1% agar. The
semi-solid lower layer provides the colonies growing on the top layer a constant supply of moisture,
simulating the environment in the acetification tanks. Acetic acid and ethanol are added to the medium
composition and their final concentrations are indicated as follows: RAE (1a/2e) means that 1 ml of
glacial acetic acid and 2 ml of absolute ethanol are added per 100 ml of medium.
A2. Dendrograms used to determine the reproducibility cutoff
Optimization: 0%
Curve Smoothing: 8.5%
Optimization: 0%
Curve Smoothing: 5%

45
A3. Calibration curve estimated for the enzymatic quantification of acetic acid. The data is relative to
three replications.
A4. NGS results. 16S rRNA gene region 1:
Sample Species Results in
(%) (nº seqs) % coverage % identity
A1 (t0, 0h)
Komagataeibacter spp. 91.14 751 95 100
Acinetobacter spp. 4.00 33 99 100
Pseudomonas spp. 0.85 7 99 98
Sphingomonas spp. 0.73 6 99 99
Oenococcus oeni 0.73 6 99 100
Undibacterium oligocarboniphilum 0.73 6 99 99
Reichenbachiella agariperforans 0.61 5 99 92
Bradyrhizobium spp. 0.61 5 99 100
Paenibacillus spp. 0.61 5 99 99
Total 824
Sample Species Results in
(%) (nº seqs) % coverage % identity
A2 (t1, 19h)
Komagataeibacter spp. 97.45 1391 99 99
Pelomonas puraquae 1.19 17 100 99
Halomonas spp. 0.77 11 99 100
Undibacterium oligocarboniphilum 0.63 9 99 100
Total 1428
Sample Species Results in
(%) (nº seqs) % coverage % identity
A3 (t3, 23h)
Komagataeibacter spp. 83.9 6818 99 100
Pantoea spp. 3.92 320 100 99
Paenibacillus spp. 5.93 516 100 99
Pseudomonas aeruginosa 3.20 261 100 100
Acinetobacter spp. 3.10 251 95 99
y = 0.2736x + 0.0724 R² = 0.99935
0.0
0.1
0.2
0.3
0.4
0.5
0.6
0.7
0.8
0.9
0.0 0.5 1.0 1.5 2.0 2.5
Abs
(340
nm)
µg acetic acid

46
Total 8166
Sample Species Results in
(%) (nº seqs) % coverage % identity
A4 (t4, 29h)
Komagataeibacter spp. 100.0 26869 99 100
Total 26869
Sample Species Results in
(%) (nº seqs) % coverage % identity
A5 (t5, 36h)
Komagataeibacter spp. 84.72 1524 100 99
Malvídeas, cloroplasto 2.55 47 100 99
Enterobacteriaceae 2.82 52 100 99
Caulobacter spp. 1.41 26 100 99
Desulfobulbus spp. 1.35 25 100 100
Staphylococcus spp. 1.95 36 100 99
Bradyrhizobium spp. 1.08 20 100 100
Campylobacter gracilis 1.03 19 100 100
Fusobacterium nucleatum 0.92 17 100 100
Corynebacterium vitaeruminis 0.81 15 100 99
Acinetobacter spp. 0.70 13 95 100
Pseudomonas spp. 0.65 12 95 99
Total 1806
16S rRNA gene region 2:
Sample Species Results in
(%) (nº seqs) % coverage % identity
A1 (t0, 0h)
Komagataeibacter spp. 89.93 3536 100 100
Staphylococcus spp. 2.67 105 100 100
Acinetobacter spp. 1.7 67 100 100
Uncultured spirochete 1.4 55 100 97
Burkholderiales 1.22 48 100 100
Ralstonia spp. 0.79 31 100 100
Oenococcus oeni 0.79 31 100 99
Propionibacterium acnes 0.76 30 99 100
Pseudomonas spp. 0.73 29 100 100
Total 3932
Sample Species Results in
(%) (nº seqs) % coverage % identity
A2 (t1, 19h)
Komagataeibacter spp. 97.88 9079 100 100
Oenococcus oeni 0.86 80 100 100
Propionibacterium acnes 0.62 58 100 99
Staphylococcus spp. 0.62 58 100 100
Total 9275
Sample Species Results in
(%) (nº seqs) % coverage % identity
A3 (t3, 23h)
Komagataeibacter spp. 87.79 8770 100 100
Paenibacillus spp. 7.32 732 100 100
Enterobacteriaceae 2.45 245 100 100

47
Pseudomonas spp. 1.68 168 98 100
Bacillus spp. 0.75 75 100 100
Total 9990
Sample Species Results in
(%) (nº seqs) % coverage % identity
A4 (t4, 29h)
Komagataeibacter spp. 100 19819 99 100
Total 19819
Sample Species Results in
(%) (nº seqs) % coverage % identity
A5 (t5, 36h)
Komagataeibacter spp. 93.93 2800 100 100
Paenibacillus spp. 1.81 54 100 100
Fusobacterium nucleatum 1.64 49 100 99
Enterobacteriaceae 0.97 29 100 99
Propionibacterium acnes 0.72 26 100 99
Staphylococcus spp. 0.77 23 100 100
Total 2981