Microbiological quality of Australian beef and …...count of 2 cfu/cm2 for both striploins and...
32
2011 Microbiological quality of Australian beef and sheepmeat Results of the industry’s fourth national abattoir study
Transcript of Microbiological quality of Australian beef and …...count of 2 cfu/cm2 for both striploins and...

2011
Microbiological quality of Australian beef and sheepmeat
Results of the industry’s fourth national abattoir study

Intentionally blank page

2011
Microbiological quality of Australian beef and sheepmeat
Results of the industry’s fourth national abattoir study
Published by Meat & Livestock Australia Ltd February 2012©Meat & Livestock Australia, 2012
This publication is published by Meat & Livestock Australia Limited ABN 39 081 678 364 (MLA). While endeavouring to ensure that the information contained in this publication is correct, MLA makes no representation as to, and accepts no liability for, the accuracy of such information or advice contained in this publication and excludes all liability, whether in contract, tort (including negligence or breach of statutory duty) or otherwise as a result of reliance by any person on such information or advice. Reproduction in whole or in part of this publication is prohibited without the prior written consent of MLA.
Drafting Group:D. Phillips- Symbio AllianceJ. Sumner- Meat & Livestock AustraliaI. Jenson- Meat & Livestock AustraliaJ. Balan – Meat and Livestock Australia
Steering Group:C. Blaney- Australian Meat Industry CouncilP. Vanderlinde- Australian Quarantine Inspection ServiceC. Sheridan - Australian Quarantine Inspection ServiceM. Ward – The University Of SydneyT. Desmarchelier – Food Safety PrinciplesD. Jordan – NSW Department of Industry & InvestmentA.Pointon – South Australian Research & Development Institute T. Ross – University of TasmaniaJ. Sumner- Meat & Livestock AustraliaI. Jenson- Meat & Livestock Australia

ContentsExecutive Summary ...................................................................1How the survey was conducted .............................................................................................. 1
Results of Beef Testing ............................................................................................................ 1
Results of Sheepmeat Testing ................................................................................................. 1
What do these results tell us? ................................................................................................. 1
Introduction .............................................................................. 2
Background – the industry’s previous national baselines studies ............2
How the study was done .......................................................... 3Microbiological analysis .......................................................................................................... 3
How we are reporting results .................................................. 4
Results – microbiology of frozen boneless beef and beef primals ............4Primal cuts ................................................................................................................................ 4
Boneless beef ........................................................................................................................... 4
Pathogens ................................................................................................................................. 4
Establishment TVCs ................................................................................................................. 5
Results – microbiology of frozen boneless sheep meat and sheep primals ....................................................................................................6Primal cuts ................................................................................................................................ 6
Boneless sheepmeat ................................................................................................................ 6
Pathogens ................................................................................................................................. 6
Establishment TVCs ................................................................................................................. 6
Comparison with previous baseline surveys ............................ 8Higher levels in 2010-11 survey ............................................................................................. 10
How does the present survey compare with others? ............12Beef Primals ........................................................................................................................... 12
Boneless Beef ......................................................................................................................... 13
References ..............................................................................14
Appendix 1: Testing Methods ..................................................15Study design ........................................................................................................................... 15
Sampling of beef and sheep primals ..................................................................................... 15
Sampling of frozen boneless beef and sheep meat trim ...................................................... 15
Transport of samples to the laboratory ................................................................................. 15
Summary of microbiological tests conducted ...................................................................... 16
Microbiological analysis of sponge samples ........................................................................ 16
Detection of E. coli O157:H7 .................................................................................................. 16
Detection of Salmonella and Listeria..................................................................................... 16
Determination of Total Viable Count (TVC), Coliforms, E. coli biotype I, coagulase positive staphylococci and Campylobacter........................................................ 17
Microbiological analysis of frozen boneless meat trimmings .............................................. 17
Appendix 2: Microbiological data of beef primals ..................18
Appendix 3: Microbiological profile of boneless frozen beef ..20
Appendix 4: Microbiological data for sheep ...........................22
Appendix 5: Microbiological profile of frozen boneless sheepmeat .............................................................................24
Notes ......................................................................................26

Microbiological quality of Australian beef and sheepmeat - results of the industry’s forth national abattoir study
1
Executive Summary
The fourth national baseline microbiological survey
of Australian beef and sheep meat quality was
conducted in 2011.
How the survey was conducted
Samples of frozen boxed beef and sheep meat
and beef and sheep primals were collected during
January-March and June-August, 2011 from meat
processing establishments (MPEs) selected on the
basis that they collectively accounted for at least 80%
of either beef or sheep meat processed in Australia.
In all, samples were taken from 29 beef and 12 sheep
MPEs, all under the jurisdiction of the Australian
Quarantine and Inspection Service (AQIS) (now DAFF
Biosecurity). The number of samples taken at each
MPE reflected its share of processing capacity with
an upper limit of 30 samples of any one type (eg:
frozen trim, primal cuts) taken on any one day. Where
samples were taken from a single MPE on more than
one day, the duration between visits was at least 5
weeks.
Testing was conducted in an ISO 17025-accredited
laboratory following internationally acceptable
methods.
Results of Beef Testing
Beef primals were found to have an average Total
Viable Count (TVC, 25°C) of 18 and 32 cfu/ cm2
respectively for striploins and outsides. E. coli
was isolated from 10.7 and 25.2% respectively for
striploins and outsides with average counts of 0.3
and 0.5 cfu/cm2 on positive samples. The average
TVC for boneless beef was 166 cfu/g and the average
count for the 2.1% of samples with detectable E. coli
was 21 cfu/g. E. coli O157:H7 and Campylobacter
were not detected in any of the primal samples.
Salmonella was not detected in any of the primal or
boneless product samples. Listeria spp. were not
detected in any of the boneless product or outsides
but was detected in one striploin (1 cfu/cm2) sample
during Winter. Coagulase positive staphylococci were
isolated from 7.7 and 8.4% of striploin and outside
samples respectively, and, 3.4% of boneless beef
samples with positive samples having an average
count of 2 cfu/cm2 for both striploins and outsides
and 85 cfu/g for boneless product.
Results of Sheepmeat Testing
Sheep primals were found to have an average total
viable count (TVC, 25°C) of 105 and 195 cfu/cm2
respectively for legs and shoulders. E. coli was
isolated from 42.9 and 34.6% respectively for legs
and shoulders with average counts of 0.4 and 0.2 cfu/
cm2 respectively on positive samples. The average
TVC for frozen boneless sheep meat was 231 cfu/g.
The average E. coli count for the 12.5% of positive
samples was 32 cfu/g. E. coli O157:H7 was isolated
from 0.3 and 0.1% respectively of leg and shoulder
samples. Salmonella was isolated from 2.8% of
leg and 0.8% of shoulder samples and from 3.1%
samples of boneless product. Campylobacter spp.
were isolated from one (0.2%) of shoulder sample.
Listeria spp. were not detected in any of the boneless
sheep meat samples, but were detected in one (0.2%)
leg sample. Coagulase positive staphylococci were
isolated from 4.2% and 5.2% of leg and shoulder
samples respectively, and, from 1.8% of boneless
samples. Positive samples had average counts of
0.6 cfu/cm2 and 2 cfu/cm2 respectively for legs and
shoulders, and, 46 cfu/g for boneless sheep meat.
What do these results tell us?
The latest baseline study provides benchmark data
of the microbiological quality of beef and sheep meat
from Australian meat processing establishments
during the Summer and Winter periods of 2011.
Together with data collected from similar surveys
conducted in 1993/94, 1998 and 2003/04 it provides
valuable reference material demonstrating the
hygienic quality of meat processed in Australia.
In the present baseline study, pathogens such as
Salmonella, E. coli O157, Listeria and Campylobacter
were either not detected or were at extremely low
levels. However, levels of indicator bacteria such
as TVC and generic E. coli were higher than in the
previous (2004) survey. The most likely explanation
involves gross anomalies in rainfall in the eastern
states in early 2011 when transport and processing
of both cattle and sheep were disrupted by extreme
flooding events.

Microbiological quality of Australian beef and sheepmeat - results of the industry’s forth national abattoir study
2
Introduction
This report provides summary data from a survey
of the microbiological quality of beef and sheep
meat conducted at Australian meat processing
establishments during January-March, and, June-
August 2011.
For the Australian meat industry, data generated
in this and previous baseline studies can be used
to provide confidence in the state and federal
regulatory systems. It also provides a valuable
scientific reference for comparison to be made to the
respective industries of our global trading partners
and competitors.
The Australian red meat industry has supported three
previous surveys of the microbiological quality of red
meat through MRC’s/MLA’s Food Safety Research
and Development Program. The ‘baseline’ surveys
were conducted in 1993/1994, 1998 and 2003/2004.
The results have been published in the scientific
literature and reported to industry.
Unlike earlier baseline surveys, this survey has
assessed the microbiological quality of chilled
primals. There is a shortage of information on these
products and the data reported here comprise a
‘starting point’ for shelf-life models being developed
in other projects. As in previous studies the
microbiological qualities of frozen boxed meat (beef
and sheep meat) was also assessed.
Background – the industry’s previous national baselines studies
The industry’s three previous baselines studies
focused on the microbiological status of beef and
sheep carcases, plus manufacturing meat taken from
them. The results are reported in Vanderlinde et al.,
(1998, 1999); Phillips et al. (2001a, 2001b, 2006a,
2006b).
Carcases were not surveyed in the present survey
because:
• CarcasesaretestedviatheE. coli Salmonella Monitoring (ESAM) program
• Monthlyupdatesofcarcasemicrobiologyareprovided both at the individual plant and the national level by the South Australian research and Development Institute (SARDI)
Accordingly, the present baseline study examined the
microbiological status of beef and sheep primal just
prior to vacuum packing, plus frozen manufacturing
beef and sheep meat.

Microbiological quality of Australian beef and sheepmeat - results of the industry’s forth national abattoir study
3
How the study was done
The overall aim of this study was to define the
microbiological attributes of red meats at specified
stages of processing or storage within medium and
large production facilities.
Sampling was done at two times of the year: a
Summer sampling in January-March, 2011 and a
Winter sampling June-August, 2011. Meat processing
establishments (MPEs) were distributed throughout
each of the five mainland states of Australia were
selected on the basis that they collectively accounted
for at least 80% of either beef or sheep meat
production in Australia. All establishments in the
survey were under the jurisdiction of the Australian
Quarantine and Inspection Service (AQIS) (now DAFF
Biosecurity).
Samples were taken from 29 MPEs processing
beef and 12 processing sheep meat and each was
sampled at least once in each of the Summer and
Winter periods. The number of samples taken at each
MPE reflected its share of processing volume with
an upper limit of 30 samples of any one type (e.g.
frozen trim, primal cuts) taken on any one day. Where
samples were taken from a single MPE on more than
one day, the duration between visits was at least 5
weeks.
Samples were collected by a team of trained
technicians. A polyurethane sponge (Whirlpak, USA)
moistened with buffered peptone water (10mL) was
used to sample primal cuts by sponging a 300cm2
area. The primal cuts selected for sampling were
beef striploins and outsides, and sheep bone-in legs
and shoulders; at some sheep MPEs only boneless
primals were available and these were sampled.
At each establishment primals were sampled just
prior to final packaging and were taken during the
course of normal production typically over a period of
approximately one hour.
Samples of boneless meat trim were collected from
frozen cartons which had been in the freezer store
usually no longer than one month, but typically less
than one week. Approximately 300g of meat drilled
from 8-9 different locations in each carton using a
sterile drill bit were transferred into sterile plastic bags
by a technician wearing sterile gloves.
Wherever possible samples were taken from cartons
that covered a range of production dates and/or
chemical lean (CL) contents. The range of product
presented for sampling was constrained by the
degree of access to cartons within the freezer store at
each participating establishment.
All samples were packed in insulated containers
with chiller packs for transportation to an ISO
17025-accredited laboratory for testing. Upon arrival
at the laboratory, samples were held at 2-4°C until
examination. To standardise the time between sample
collection and analysis samples were analysed at
least 18 hours after collection. In most cases this was
on the day of arrival at the laboratory. All samples
were <10°C upon receipt at the laboratory.
Microbiological analysis
Three sponge samples were collected from each
primal one of which was used for detection of
E. coli 0157:H7, one for Salmonella and Listeria
enumeration and one for all other analyses (TVC, E.
coli, coliforms, coagulase positive staphylococci and
Campylobacter). Results for TVC, E. coli, coliforms
and coagulase positive staphylococci were reported
with a limit of detection of 0.08 cfu/cm2.
For frozen boneless meat, 25g was examined for
Salmonella spp. and Listeria monocytogenes and
reported as detected/not detected in 25g. Aliquots
(1mL) of a 10g subsample of the boneless meat
sample were plated for TVC, Coliforms/E. coli and
coagulase-positive staphylococci. The limit of
detection was 10 cfu/g.
Tests were conducted in an ISO 17025-accredited
laboratory. Test methods were usually Australian
Standard methods, which are aligned to
internationally accepted methods. More detail on
the tests performed, how to interpret them and their
significance is provided in Appendix 1.

Microbiological quality of Australian beef and sheepmeat - results of the industry’s forth national abattoir study
4
How we are reporting results
Some tests yielded qualitative (detected/not detected)
results and others yielded quantitative (numerical)
results, which were treated in different ways.
Tests for Salmonella, Campylobacter, and E. coli
O157:H7 provided qualitative results for individual
samples. We refer to these types of results as
prevalence of detection, as a percentage. Some
tests estimate the numbers of a specific bacterium
or group of bacteria present in the sample e.g.
generic E. coli, coliforms, and coagulase positive
staphylococci. In this case we report the prevalence
of the organism and the concentration in which it was
found in positive samples.
For each test there is a Limit of Detection (LOD). For
tests where areas were sponged the LOD is 0.83 cfu/
cm2 (colony-forming units/cm2) and for tests where
we took pieces of meat the LOD is 10 cfu/g.
It is common practice for microbiologists to convert
actual counts to a log count, which is easier to
work with and to interpret. These transformed data
are referred to as ‘log10’’. The results for log10 data
can be represented as a ‘box-plot’. Box-plots are a
convenient graphical device for summarizing data for
each establishment or other subgroup. The box-plots
used here have the features illustrated in Figure 1.
Results – microbiology of frozen boneless beef and beef primals
Primal cuts
A total of 572 striploins and 572 outsides were
sampled at 29 abattoirs (see Appendix 2 for detailed
results). The mean log10 TVC was 1.25 cfu/cm2
(equivalent to 18 cfu/cm2) for striploins and mean
log10 TVC 1.51 cfu/cm2 (32 cfu/cm2) for outsides.
E. coli was detected on 10.7% of striploins and
25.2% of outsides with positive samples having
a mean log10 count of -0.49 cfu/cm2 (0.3 cfu/cm2)
and mean log10 count of -0.26 cfu/cm2 (0.5 cfu/cm2)
respectively.
Coagulase positive staphylococci were isolated from
7.7% and 8.4% respectively of striploin and outside
samples with positive samples having a mean log10
count of 0.19 cfu/cm2 (2 cfu/cm2) and mean log10
count of 0.18 cfu/cm2 (2 cfu/cm2) respectively.
Boneless beef
For frozen boneless beef 1165 cartons were tested
from 29 boning rooms (see Appendix 3 for detailed
results). The mean log10 TVC/g was 2.22 cfu/g (166
cfu/g).
E. coli was detected on 2.1% of samples with
positive samples having an average count of log10
1.32 cfu/g (21 cfu/g).
Coagulase positive staphylococci were isolated from
3.4% of samples with positive samples having an
average count of log10 1.93 cfu/g (85 cfu/g).
Pathogens
Salmonella was not detected on any of the beef
samples. Listeria spp. were detected on one beef
striploin (1 cfu/cm2). There were no detections of
Campylobacter or E. coli O157:H7 on beef primal
samples; these pathogens were not tested in
boneless beef trim because there is a substantial
industry testing program for 0157 and Campylobacter
is sensitive to freezing.
�����������������
����������������������� ���������
����������������������
��������������������������������������������������������
� ����������������������
����������������������������������������������������
����������������������
�������������������������������
������������������
��������������
Figure 1. Explanation of the features of box-plots used
for describing the bacterial counts in the baseline survey.

Microbiological quality of Australian beef and sheepmeat - results of the industry’s forth national abattoir study
5
Establishment TVCs
Figures 2 and 3 show the variation observed within
and between plants sampled in this study for TVCs of
beef primals and boneless beef respectively. Although
there are differences in the median count between
Figure 2: Variation in Total Viable Count (log TVC/cm2) of beef primals within and between establishments
(arranged from the lowest to the highest median)
����
����
����
���
�����
������
������ �� � � �� � �� � �� � �� �� � �� �� �� �� �� � �� � �� �� �� �� �� �� �� ��
plants, the size of the differences are small and, for
most comparisons, not significant. The box plots
help us to understand the process control at various
plants. Shorter boxes and lines indicate that process
control is more consistent, while a longer box and line
indicates less uniformity in process control.
������
����� �� �� �� �� � � �� �� � �� �� �� � �� � �� � �� �� �� �� � �� �� �� �� �� ��
����
����
����
����
����
���
����
Figure 3: Variation in Total Viable Count (log TVC/g) of boneless beef within and between establishments (arranged
from the lowest to the highest median)

Microbiological quality of Australian beef and sheepmeat - results of the industry’s forth national abattoir study
6
Results – microbiology of frozen boneless sheep meat and sheep primals
Primal cuts
A total of 1226 sheep primals processed at 12
abattoirs were tested (for detailed results see
Appendix 4). The mean TVC was log10 2.02 cfu/cm2
(equivalent to 105 cfu/cm2) for legs, and log10 2.29
cfu/cm2 (195 cfu/cm2) for shoulders.
E. coli was detected on 42.3% of legs and 34.6% of
shoulders with positive samples having an average
count of log10 -0.44 cfu/cm2 (0.4 cfu/cm2) for legs and
-0.63 log10 cfu/cm2 (0.2 cfu/cm2) for shoulders.
Coagulase positive staphylococci were isolated from
4.2% of legs and 5.2% of shoulders with positive
samples having an average count of -0.21 log10 cfu/
cm2 (0.6 cfu/cm2) for legs and log10 0.34 cfu/cm2 (2
cfu/cm2) for shoulders.
Boneless sheepmeat
For frozen boneless sheepmeat, 551 samples from
11 boning rooms were tested (for detailed results see
Appendix 5). The mean TVC was log10 2.80 cfu/g (631
cfu/g).
E. coli was detected on 12.5% of samples with
positive samples having an average count of 1.51
log10 cfu/g (32 cfu/g).
Coagulase positive staphylococci were isolated from
1.8% of samples with positive samples having an
average count of log10 1.66 cfu/g (equivalent to 46
cfu/g).
Pathogens
Salmonella was detected on 2.8% of legs, 0.8%
of shoulders and 3.1% of boneless sheep meat
samples.
Listeria spp. were not detected in any boneless sheep
meat samples but was detected on one leg sample (2
cfu/cm2).
E. coli O157:H7 was recovered from 2/613 (0.3%)
leg samples and 1/613 (0.2%) shoulder samples.
Campylobacter was detected from 1/613 (0.2%)
shoulder samples.
Establishment TVCs
Figures 4 and 5 show the variation observed within
and between plants sampled in this study for TVCs of
sheep primals and boneless sheepmeat, respectively.
Although there are differences in the median count
between plants, these are not considered significant.
Box plots help us to understand the process control
at various plants. Shorter boxes and lines indicate
uniform process control, while longer boxes and lines
indicates less uniformity in process control.

Microbiological quality of Australian beef and sheepmeat - results of the industry’s forth national abattoir study
7
Figure 4: Variation in Total Viable Count (log10 TVC/cm2) of sheep primals within and between establishments
(arranged from the lowest to the highest median)
Figure 5: Variation in Total Viable Count (log10 TVC/g) of boneless sheep meat within and between establishments
(arranged from the lowest to the highest median)
������
����
����
����
���
����
�� �� �� �� �� �� �� �� �� �� �� ��
������
����
����
����
���
����
�� �� �� �� �� �� �� �� �� �� ��
����
����
����

Microbiological quality of Australian beef and sheepmeat - results of the industry’s forth national abattoir study
8
Comparison with previous baseline surveys
There were differences in counts for indicator
organisms (TVC, Coliforms and E. coli) between the
Summer and Winter samplings but the differences
were not great. For beef, mean counts and prevalence
were generally slightly higher in Summer than Winter,
while for sheep samples the opposite applied.
Because there were similarities in methodology
of all four surveys it is possible to compare the
microbiological status of boneless product over time.
Comparison between the mean log10 TVC between
surveys is shown in Figures 6 and 7 for beef and
sheep meat frozen boneless trim, respectively.
Figure 6: Historical comparison of the mean log10 TVC/g of frozen boneless beef
Figure 7: Historical comparison of the mean log10 TVC/g of frozen boneless sheepmeat
Comparison between the prevalence of E. coli
between surveys is shown in Figures 8 and 9 for beef
and sheep meat frozen boneless trim, respectively.
�
�
�
��������
����
��
��
�����
�
������� ���� ���� �����
����
����
����
����
�
�
�
��������
��� �
��
��
�����
�
������� ���� ���� �����
��������
����
����

Microbiological quality of Australian beef and sheepmeat - results of the industry’s forth national abattoir study
9
Figure 8: Historical comparison of the prevalence of E. coli detections on frozen boneless beef
Figure 9: Historical comparison of the prevalence of E. coli detections on frozen sheepmeat
��
��
�
���
����
�����
������
��
������� ���� ���� �����
���
���
������
��
��
�
���
����
�����
������
��
������� ���� ���� �����
���
����
���
����

Microbiological quality of Australian beef and sheepmeat - results of the industry’s forth national abattoir study
10
As can be seen from Figure 12, in 2009-10 much
of Australia had either “normal” rainfall, or was in
drought, while in Figure 13 the early part of 2011 was
characterised by unusual rain patterns in much of the
eastern states of Australia; by contrast, in Western
Australia drought conditions continued.
Higher levels in 2010-11 survey
The Summer sampling took place in January-March
2011 and, as seen in Figures 6-9, resulted in counts
of indicator organisms (TVC, E. coli) being higher than
in the last baseline study (2004) for beef and sheep
frozen meat.
However, levels of S. aureus were lower in this
baseline than in previous baselines studies, probably
reflecting the almost universal use of gloves by
operators on slaughter floors and boning rooms.
The baseline study represents a series of snapshots
of product at establishments and contrasts with data
generated under the E. coli Salmonella Monitoring
(ESAM) program, which provides a continuous
microbiological record from all export plants.
When the ESAM database was interrogated it was
found that, while the national microbiological profile
had been stable over the previous two years, in
early-2011 counts on beef and sheep carcases began
to rise and, as shown in Figures 10 and 11, this was
so for both TVC and E. coli.
���
���
���
���
���
���
�����
���
��������
�����
���
�����
��
�����
��
�������
�����
��
�����
���
�����
���
��������
�����
���
�����
���
�����
���
��������
�����
���
�����
���
�����
���
��������
����
��
�����
��
��
��
��
��
��
��
�
�����
���
��������
�����
���
�� ��
���
�����
���
��������
�����
���
�� ��
���
�����
���
��������
�����
���
�� ��
���
�����
���
��������
�����
���
�� ��
���
�����
���
�����
������
����
���
���
���
���
���
���
�����
���
��������
�����
���
�����
��
�����
��
�������
�����
��
�����
���
�����
���
��������
�����
���
�����
���
�����
���
��������
�����
���
�����
���
�����
���
��������
����
��
�����
��
��
��
��
�
�
�����
���
��������
�����
���
�����
���
�����
���
��������
�����
���
�����
��
�����
��
�������
�����
��
�����
���
�����
���
��������
�����
���
�����
���
�����
���
�����
������
����
���
Figure 10: ESAM national data for TVC (left) and E. coli (right) on sheep carcases
Figure 11: ESAM national data for TVC (left) and E. coli (right) on beef carcases

Microbiological quality of Australian beef and sheepmeat - results of the industry’s forth national abattoir study
11
Figure 12: Rainfall anomalies (mm) for the period 1 July 2009 – 30 June 2010
(Bureau of Meteorology, available at http://www.bom.gov.au/jsp/awap/rain/index.jsp)
Figure 13: Rainfall anomalies (mm) for the period 1 July 2010 – 30 June 2011
(Bureau of Meteorology, available at http://www.bom.gov.au/jsp/awap/rain/index.jsp)
�����������������������
������
������
�����
�����
�����
�����
���
������
������
������
������
�������
�������
�����������������������
������
������
�����
�����
�����
�����
���
������
������
������
������
�������
�������

Microbiological quality of Australian beef and sheepmeat - results of the industry’s forth national abattoir study
12
The South Australian Research and Development
Institute (SARDI) compared trend counts on sheep
and on steer/heifer carcases in WA against those
in the rest of Australia. There were clear differences
between trend lines. For carcases in WA the trend
line was either flat or declined slightly over the period,
while in the rest of Australia there was an abrupt
upward trend beginning in mid-2010, as seen in the
graphs above (Figures 10 and 11).
The SARDI analysis provides evidence of an
alignment between microbiological counts on
carcases (ovine and bovine) and extreme rainfall
events which occurred in eastern Australia during
2010-2011. Studies in Australia have shown that the
condition of fleece and hide of animals presented
for slaughter can present an “incoming problem”
which exceeds the capacity of slaughter and dressing
operations to maintain the usual hygienic status of
the carcase (Kiermeier et al. 2006, 2009).
The SARDI work provides circumstantial evidence
that the unusually high rainfalls in eastern Australia
were the source of higher than usual counts of
indicator organisms on carcases. At slaughter
establishments the negative effects of rainfall may
have been due to a combination of:
• Stockbeingreceivedwithunusuallevelsofmud/faeces on wet pelts and hides, and this continuing over a long period of time
• Morelushpastureresultinginloosestoolsandgreater spread over the fleece and hide
• Stockbeingdeniedfeedforprotractedperiodsby floods
• Increasedlivestocktransporttimes
• Processingschedulesbeingdisrupted
How does the present survey compare with others?
In the present survey primal cuts were chosen
mainly because there is little known about their
microbiological status. Not surprisingly then, there
are not many studies published either nationally or
internationally with which to compare the present one.
This was the case specifically with sheepmeat and
sheep primals; hence comparisons were only made
with beef.
Beef Primals
There have been four international studies where
methods used were similar to those used in the fourth
baseline study, and which may be compared.
In New Zealand two studies were undertaken as
part of a larger study on how hot boned primals
performed at the retail level. Bell et al. (1996) found
that hot boned striploins had a mean TVC of log10
2.5 cfu/cm2 as did Penney et al. (1998), who also
found that conventionally boned striploins were log10
3.0 cfu/cm2.
In the USA, Ware et al. (2001) sponged fat and lean
surfaces of two primals: Clod (shoulder) and Top butt
(Striploin) for mean TVCs of log10 2.25 cfu/cm2 and
2.27 cfu/cm2, respectively.
Also in the USA Stopforth et al. (2006) carried
out a six-month study on beef primals from two
establishments in which 1022 samples were taken
from 10 primal cuts. TVCs ranged from log10 4.0
cfu/g for butts and rib eye rolls to log10 6.2 cfu/g on
club ends; on striploins the mean log10 TVC was 5.9
cfu/g. The researchers also isolated E. coli O157 from
3/1022 (0.3%) and Salmonella from 22/1022 (2.2%) of
samples; E. coli O157 was not isolated from striploins
but 5/52 (9.6%) of striploins yielded Salmonella.
In the present baseline study the mean TVC for
striploins was log10 1.25 cfu/cm2 and for outsides
log10 1.51 cfu/cm2, significantly lower than levels
estimated in other studies; as well, E. coli and
Salmonella were not isolated in any of the 1,144
samples tested.

Microbiological quality of Australian beef and sheepmeat - results of the industry’s forth national abattoir study
13
Boneless Beef
Comparisons are difficult to make because most
countries do not publish the profile of boneless beef,
or because of differences in methodology. However,
a comparison using identical methodology was
carried out by researchers at the US Department of
Agriculture, who compared the microbiology of beef
destined for grinding from Australia, New Zealand
and Uruguay with that of domestic product (Bosilevac
et al. 2007) The researchers analysed indicator
organisms such as Total count, Enterobacteriaceae,
coliforms/E. coli, Staphylococcus aureus and
pathogens: Campylobacter, Listeria, Salmonella and
non-O157 STEC.
Summary data of the survey are presented in Tables
1 and 2 and show levels of indicator organisms
and pathogens were invariably lower in Australian
beef trimmings compared with other countries. This
was especially so when isolations of Shiga toxin-
producing E. coli, in general, and HUS serotypes, in
particular, are compared.
The USDA researchers commented: “Overall the
results provide objective evidence that standards of
hygiene during the slaughter and processing of beef
in Australia continue to be very high.”
Table 1: Microbiological profile of indicator organisms in beef trimmings destined for ground beef
Mean log cfu/g Prevalence (%)
TVC Enterobacteriaceae E. coli S. aureus
Australia 1.6 8.2 1.0 4.0
New Zealand 2.2 9.0 0.5 8.2
Uruguay 2.8 31.3 9.5 29.5
USA 2.5 37.8 7.2 4.2
Table 2: Prevalence of pathogens in beef trimmings destined for ground beef
Prevalence (%) Number of isolations
Salmonella Campylobacter L. monocytogenes STECHUS
serotypes
Australia 0 0 2.0 9 0
New Zealand 0.4 0.5 2.3 4 2
Uruguay 0.4 0.4 24 40 6
USA 0.8 1.3 5.0 28 5

Microbiological quality of Australian beef and sheepmeat - results of the industry’s forth national abattoir study
14
References
Bell, R., Penney, N., Gilbert, K., Moorhead, S. and
Scott, S. 1996. The chilled storage life and retail
display performance of vacuum and carbon dioxide
packed hot deboned beef striploins. Meat Science,
42:271-386.
Bosilevac, J.,Guerini, M., Brichta-Harhay, D.,
Arthur, T. and Koohmarie, M. 2007. Microbiological
characterization of imported and domestic boneless
beef trim used for ground beef. Journal of Food
Protection, 70:440-449.
Kiermeier, A., Jenson, I. and Sumner, J. 2009. Tool
to assist understanding of routine microbiological
monitoring results of sheep carcasses. Food
Protection Trends, 29:428-434.
Kiermeier, A., Bobbitt, J., Vanderlinde, P., Higgs,
G., Pointon, A. and Sumner, J. 2006. Use of routine
beef carcase Escherichia coli monitoring data
to investigate the relationship between hygiene
status of incoming stock and processing efficiency.
International Journal of Food Microbiology,
111:263-269.
Penney, N., Bell, R. and Moorhead, S. 1998.
Performance during retail display of hot and cold
boned beef striploins after chilled storage in vacuum
or carbon dioxide packaging. Food Research
International, 31:521-527.
Phillips, D., Sumner, J., Alexander. J. and Dutton,
K. 2001a. Microbiological quality of Australian beef.
Journal of Food Protection, 64:692-696.
Phillips, D., Sumner, J., Alexander, J. and Dutton
K. 2001b. Microbiological quality of Australian
sheepmeat. Journal of Food Protection, 64:697-700.
Phillips, D., Jordan, D., Morris, S., Jenson, I.
and Sumner, J. 2006a. A national survey of the
microbiological quality of beef carcasses and
frozen boneless beef in Australia. Journal of Food
Protection, 69, 1113-1117.
Phillips, D., Jordan, D., Morris, S., Jenson, I.
and Sumner, J. 2006b. Microbiological quality of
Australian sheep meat in 2004. Meat Science, 74:
261-266.
Stopforth, J., Lopes, M., Schultz, J., Miksch, R. and
Samadpour, M. 2006. Microbiological status of fresh
beef cuts. Journal of Food Protection, 69:1456-1459.
Vanderlinde P., Shay B., and Murray J. 1998.
Microbiological quality of Australian beef carcass
meat and frozen bulk packed beef. Journal of Food
Protection, 61:437-443.
Vanderlinde P., Shay B., and Murray J. 1999.
Microbiological status of Australian sheepmeat.
Journal of Food Protection, 62:380-385.
Ware, L., Kain, M., Sofos, J., Belk, K., Reagan, J. and
Smith, G. 2001. Influence of sampling procedure,
handling and storage on the microbiological status of
fresh beef. Dairy, Food and Environmental Sanitation,
21: 14-19.

Microbiological quality of Australian beef and sheepmeat - results of the industry’s forth national abattoir study
15
Appendix 1: Testing Methods
Study design
Samples were collected during January-March
and June-August, 2011 from meat processing
establishments (MPEs) selected on the basis that they
collectively accounted for at least 80% of either beef
or sheep meat processing volume in Australia. In all,
samples were taken from 29 MPEs processing beef
and 12 processing sheep meat. All establishments in
the survey were under the jurisdiction of the Australian
Quarantine and Inspection Service (AQIS) (now DAFF
Biosecurity). The number of samples taken at each
MPE reflected its volume of processing with an upper
limit of 30 samples of any one type (eg frozen trim,
primal cuts) taken on any one day. Where samples
were taken from a single MPE on more than one day,
the duration between visits was at least 5 weeks.
Sampling of beef and sheep primals
Samples were collected by a team of trained
technicians. A polyurethane sponge (Whirlpak, USA)
moistened with buffered peptone water (10ml) was
used to sample primal cuts by sponging a 300cm2
area. To provide for all testing required, three sponges
were used for each sample. Where the total area
of 900cm2 was unavailable on a single primal, a
second primal was used. The primal cuts selected for
sampling were for beef, striploins and outsides, and
for sheep, bone-in legs and shoulders. At some sheep
MPEs only bone-out primals were available and these
were therefore sampled. At each establishment every
attempt was made to sample the respective primals
as close as possible to final packaging. Samples were
taken during the course of normal production at each
establishment typically over a period of approximately
one hour.
Sampling of frozen boneless beef and sheep meat trim
Samples of boneless meat trim were collected from
frozen cartons which had been in the freezer store
usually no longer than one month but typically within
one week. Approximately 300g of meat drilled from
8-9 different locations in each carton using a sterile
drill bit were transferred into sterile plastic bags by a
technician wearing sterile gloves. Wherever possible
samples were taken from cartons that covered a
range of production dates and/or chemical lean
(CL) contents. The range of product presented for
sampling was constrained by the degree of access
to cartons within a freezer store at each participating
establishment.
Transport of samples to the laboratory
All samples were packed in insulated containers
with chiller packs for transportation to an ISO
17025-accredited laboratory for testing. Upon arrival
at the laboratory, samples were held at 2-4°C until
examination. To standardise the time between sample
collection and analysis, samples were analysed at
least 18 hours after collection. In most cases this was
on the day of arrival at the laboratory. All samples
were less than 10°C upon receipt at the laboratory.

Microbiological quality of Australian beef and sheepmeat - results of the industry’s forth national abattoir study
16
Summary of microbiological tests conducted
Test Method referenceLimit of detection
Primals Frozen trim
Total count (TVC) Petrifilm AS5013.1-2004 (25°C, 4d) 0.08 cfu/cm2 10 cfu/g
Coliforms/E. coliPetrifilm AOAC method 991.14
(35°C, 48hr)0.08 cfu/cm2 10 cfu/g
Salmonella AS5013.10-2009 = ISO 6579:2002 present/300cm2 present/25g
Coagulase positive Staphylococci
AS5013.12.1-2004 = ISO 6888-1: 1999/Amd 1:2003
0.08 cfu/cm2 10 cfu/g
Listeria sp AS 5013.24.2 = ISO 11290-2:1998 0.08 cfu/cm2 10 cfu/g
Campylobacter AS 5013.6-2004 present/250cm2 not tested
E. coli O157:H7 Bax - AOAC Certificate No. 050501 present/300cm2 not tested
Microbiological analysis of sponge samples
Three sponge samples were collected from each
primal, one of which was used for detection of E. coli
0157:H7, one for Salmonella and Listeria detection
with the remainder for all other analyses (TVC, E.
coli, coliforms, coagulase positive staphylococci and
Campylobacter).
Detection of E. coli O157:H7
A 225 ml volume of E. coli O157:H7 MP enrichment
broth (Dupont Qualicon Bax®, Sydney, Australia) was
added to one of the sponge bags and squeezed by
hand 10 times prior to incubation at 42°C overnight
and tested according to AOAC Certificate No.
050501. The following day, presumptive positives
were tested using the Dynalbeads anti O157 method
of immunomagnetic separation (Dynal Australia,
Melbourne, Australia) as per the manufacturer’s
instructions using Rainbow Agar. Positive samples
were subcultured onto blood agar and isolates
selected for the detection of genes encoding for
Shiga toxins. E. coli strains positive for the O157
antigen and containing a gene for shiga toxin (Stx1 or
Stx2) were reported as E. coli O157:H7 detected in
300 cm2.
Detection of Salmonella and Listeria
Buffered peptone water (225 ml) was added to the
second sponge bag and squeezed by hand 10 times
prior to incubation for 1 h at room temperature.
For Listeria detection, the resuscitated culture was
inoculated onto Palcam agar plates (Oxoid, Adelaide,
Australia) for incubation at 37°C for 48 hours. Typical
Listeria species colonies on the Palcam agar plates
were transferred to TSYE agar (Oxoid, Adelaide,
Australia) and confirmed by the catalase test and Gram
stain. Listeria monocytogenes confirmation was by
haemolysis on blood agar plates, xylose and rhamose
fermentation tests and the CAMP test (AS 5013.24.2).
For Salmonella detection, the BPW culture was further
incubated for 16-20 h at 37°C to allow resuscitation of
damaged cells. Aliquots of resuscitated cultures were
inoculated into the selective enrichment broths Muller-
Kauffmann Tetrathionate Novobiocin broth (Oxoid,
Adelaide, Australia) for incubation at 37°C for 24 hours
and Rappaport-Vassiliadis medium (Oxoid, Adelaide,
Australia) for incubation at 42°C for 24 hours according
to Australian Standard method AS5013.10-2009. Each
enriched culture was inoculated onto brilliant green
agar and xylose lysine desoxycholate agar (Oxoid,
Adelaide, Australia) and incubated at 37°C for 24 h.
Biochemical confirmation of typical colonies was by
the use of the oxidase test and Microbact 12A strips
(Oxoid, Adelaide, Australia) and agglutination tests
with Salmonella O and H antisera. Positive samples
were subcultured onto nutrient agar slopes and sent
to the Queensland Public Health laboratory, Brisbane,
Australia for serotyping. Results were reported as
detected/not detected per 300 cm2.

Microbiological quality of Australian beef and sheepmeat - results of the industry’s forth national abattoir study
17
Determination of Total Viable Count (TVC), Coliforms, E. coli biotype I, coagulase positive staphylococci and Campylobacter
Buffered peptone water (40 ml) was added to the
third sponge bag, which was squeezed by hand 10
times. Serial dilutions were prepared in 0.1% peptone
water using 1 ml aliquots. For TVC, PetrifilmTM
plates (3MTM, Sydney, Australia) were prepared
and incubated at 25°C for 4 days at which time the
colonies were counted and the TVC result in cfu/
cm2 calculated. The limit of detection was 0.08 cfu/
cm2. E. coli were estimated by placing 1ml aliquots
of both the initial solution and appropriate dilutions
onto E. coli PetrifilmTM (3MTM, Sydney, Australia)
and incubating at 35°C for 48 h. Colonies were
counted as per the manufacturer’s instructions and
AOAC method 991.14. The limit of detection was
0.08 cfu/cm2. Coagulase positive staphylococci
were determined using Australian Standard method
AS5013.12.1-2004 where 0.33 ml aliquots were
spread onto six dried plates of Baird Parker agar
(Merck, Melbourne, Australia) and incubated at 37°C
for 48 h. Colonies with typical morphology (grey-
black, shiny, convex colony with a narrow entire
margin surrounded by a zone of clearing) were picked
off the plate for coagulase testing using rabbit blood
plasma. The limit of detection for coagulase-positive
staphylococci was 0.08 cfu/cm2. Campylobacter
was determined according to Australian Standard
method AS 5013.6-2004 in which 100 ml Preston
medium (Oxoid, Adelaide, Australia) was added to
approximately 21 ml of the initial carcass sponge
solution and incubated at 42°C for 48 h. Sixteen
streak plates were prepared on Preston agar and
on Skirrow agar (Oxoid, Adelaide, Australia). Plates
were incubated at 42°C for 48 h. Typical colonies
were streaked onto blood agar plates and incubated
under micro-aerobic conditions at 42°C for 24 hours.
Suspect colonies were confirmed using a classical
oxidase test, gram stain, motility test, sensitivity to
nalidixic acid and cephalothin and growth under
aerobic and micro-aerobic conditions. The result was
expressed as detected/not detected in 250cm2.
Microbiological analysis of frozen boneless meat trimmings
From each sample of approximately 300g a
subsample of 25g were examined for Salmonella spp.
and Listeria monocytogenes as described above
and reported as detected/not detected in 25g. A
10g subsample of the boneless meat sample was
added to peptone salt solution (90mL) and macerated
in a Seward Stomacher BA 7021 (Seward, United
Kingdom). Aliquots (1 ml) were plated for TVC and
Coliforms/E. coli and 0.33 ml aliquots for coagulase
positive staphylococci as described above. The limit
of detection was 10 cfu/g.

Microbiological quality of Australian beef and sheepmeat - results of the industry’s forth national abattoir study
18
Appendix 2: Microbiological data of beef primals
Table 2.1: Mean Total Viable Count (log10 TVC at 25°C) of Australian beef primals
Overall Summer Winter
Striploin Outside Striploin Outside Striploin Outside
Samples 572 572 272 272 300 300
Mean(a) 1.25 1.51 1.39 1.38 1.12 1.62
Median log10 1.11 1.32 1.26 1.31 1.03 1.36
Standard deviation
1.00 0.98 1.15 1.07 0.81 0.88
90th percentile 2.59 2.88 2.93 2.81 2.11 2.92
95th percentile 3.11 3.24 3.52 3.22 2.77 3.26
99th percentile 4.30 4.01 4.30 4.02 3.63 4.03
Maximum 5.26 4.22 5.15 4.22 5.26 4.22
a Limit of detection 0.08 cfu/cm2
Table 2.2: Prevalence of generic E. coli on sponges from Australian beef primals and descriptive statistics for log10
counts from positive sponges.
Overall Summer Winter
Striploin Outside Striploin Outside Striploin Outside
Samples 572 572 272 272 300 300
Prevalence (% detection)
10.7 25.2 12.9 27.2 8.7 23.3
Mean(a, b) -0.49 -0.26 -0.36 -0.18 -0.65 -0.34
Median -0.60 -0.54 -0.48 -0.30 -0.69 -0.77
Standard deviation
0.69 0.88 0.81 0.77 0.44 0.98
90th percentile 0.09 1.08 0.92 0.90 -0.01 1.31
95th percentile 1.19 1.50 1.22 1.40 0.10 2.33
99th percentile 1.88 2.38 1.88 1.52 0.12 2.36
Maximum 2.30 2.40 2.30 2.11 0.12 2.40
a Limit of detection 0.08 cfu/cm2 b log10 counts of positive samples
Microbiological quality of Australian beef and sheepmeat - results of the industry’s forth national abattoir study
19
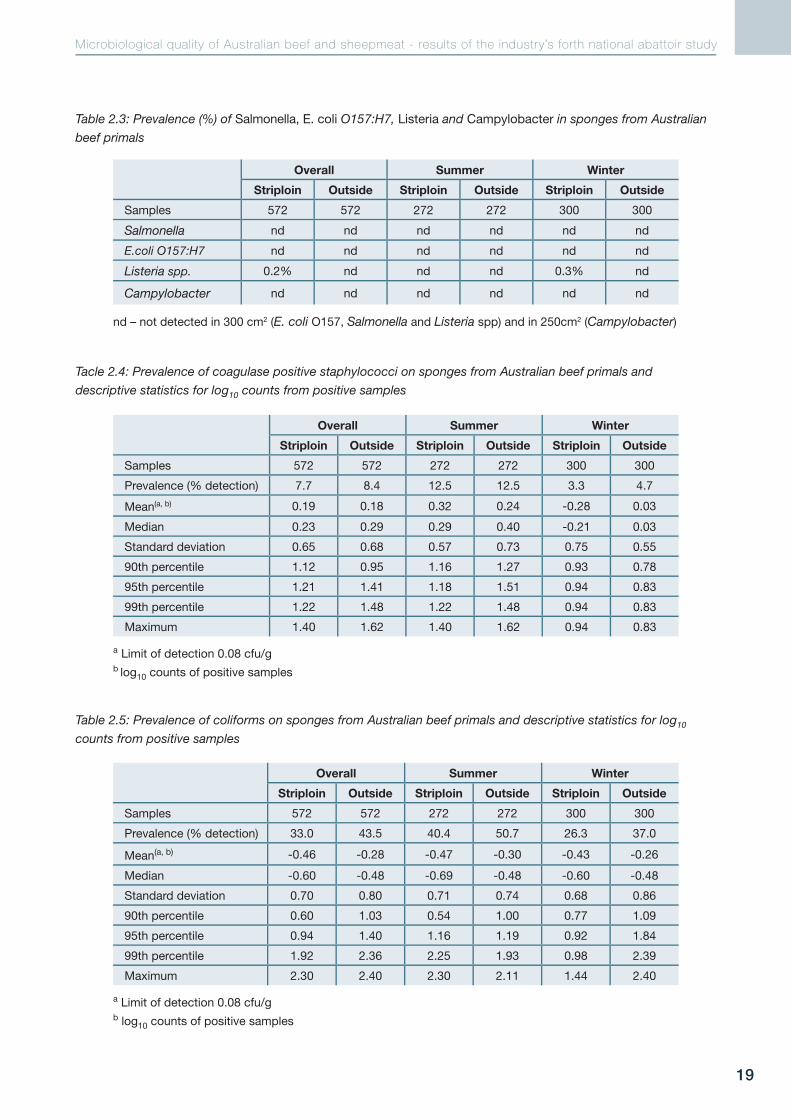
Table 2.3: Prevalence (%) of Salmonella, E. coli O157:H7, Listeria and Campylobacter in sponges from Australian
beef primals
Overall Summer Winter
Striploin Outside Striploin Outside Striploin Outside
Samples 572 572 272 272 300 300
Salmonella nd nd nd nd nd nd
E.coli O157:H7 nd nd nd nd nd nd
Listeria spp. 0.2% nd nd nd 0.3% nd
Campylobacter nd nd nd nd nd nd
nd – not detected in 300 cm2 (E. coli O157, Salmonella and Listeria spp) and in 250cm2 (Campylobacter)
Tacle 2.4: Prevalence of coagulase positive staphylococci on sponges from Australian beef primals and
descriptive statistics for log10 counts from positive samples
Overall Summer Winter
Striploin Outside Striploin Outside Striploin Outside
Samples 572 572 272 272 300 300
Prevalence (% detection) 7.7 8.4 12.5 12.5 3.3 4.7
Mean(a, b) 0.19 0.18 0.32 0.24 -0.28 0.03
Median 0.23 0.29 0.29 0.40 -0.21 0.03
Standard deviation 0.65 0.68 0.57 0.73 0.75 0.55
90th percentile 1.12 0.95 1.16 1.27 0.93 0.78
95th percentile 1.21 1.41 1.18 1.51 0.94 0.83
99th percentile 1.22 1.48 1.22 1.48 0.94 0.83
Maximum 1.40 1.62 1.40 1.62 0.94 0.83
a Limit of detection 0.08 cfu/g b log10 counts of positive samples
Table 2.5: Prevalence of coliforms on sponges from Australian beef primals and descriptive statistics for log10
counts from positive samples
Overall Summer Winter
Striploin Outside Striploin Outside Striploin Outside
Samples 572 572 272 272 300 300
Prevalence (% detection) 33.0 43.5 40.4 50.7 26.3 37.0
Mean(a, b) -0.46 -0.28 -0.47 -0.30 -0.43 -0.26
Median -0.60 -0.48 -0.69 -0.48 -0.60 -0.48
Standard deviation 0.70 0.80 0.71 0.74 0.68 0.86
90th percentile 0.60 1.03 0.54 1.00 0.77 1.09
95th percentile 0.94 1.40 1.16 1.19 0.92 1.84
99th percentile 1.92 2.36 2.25 1.93 0.98 2.39
Maximum 2.30 2.40 2.30 2.11 1.44 2.40
a Limit of detection 0.08 cfu/g b log10 counts of positive samples

Microbiological quality of Australian beef and sheepmeat - results of the industry’s forth national abattoir study
20
Appendix 3: Microbiological profile of boneless frozen beef
Table 3.1: Total Viable Count (log10 TVC at 25°C) of Australian frozen boneless beef
Overall Summer Winter
Samples 1165 565 600
Mean(a) 2.22 2.31 2.13
Median 2.11 2.23 2.00
Standard deviation 0.81 0.78 0.84
90th percentile 3.28 3.35 3.19
95th percentile 3.85 3.85 3.90
99th percentile 4.61 4.60 4.66
Maximum 5.53 5.18 5.53
a Limit of detection 10 cfu/g
Table 3.2: Prevalence of generic E. coli in core samples of Australian frozen boneless beef and descriptive
statistics for log10 counts from positive samples
Overall Summer Winter
Samples 1165 565 600
Prevalence (% detection) 2.1 4.4 0
Mean(a,b) 1.32 1.32 -
Median 1.30 1.30 -
Standard deviation 0.39 0.39 -
90th percentile 1.99 1.99 -
95th percentile 2.41 2.41 -
99th percentile 2.51 2.51 -
Maximum 2.51 2.51 -
a Limit of detection 10cfu/g b log10 counts of positive samples only

Microbiological quality of Australian beef and sheepmeat - results of the industry’s forth national abattoir study
21
Table 3.4: Prevalence of coliforms in core samples of Australian frozen boneless beef and descriptive statistics for
log10 counts from positive samples
Table 3.3: Prevalence of coagulase positive staphylococci in core samples of Australian frozen boneless beef and
descriptive statistics for log counts from positive samples
Overall Summer Winter
Samples 1165 565 600
Prevalence (% detection) 3.4 6.0 1.0
Mean(a,b) 1.93 2.09 1.00
Median 1.62 1.78 1.00
Standard deviation 1.04 1.05 0
90th percentile 3.50 3.52 1.00
95th percentile 4.26 4.26 1.00
99th percentile 4.30 4.30 1.00
Maximum 4.76 4.76 1.00
a Limit of detection 10 cfu/g b log10 counts of positive samples only
Overall Summer Winter
Samples 1165 565 600
Prevalence (% detection) 7.8 13.3 2.7
Mean(a,b) 1.42 1.46 1.23
Median 1.30 1.30 1.00
Standard deviation 0.53 0.53 0.47
90th percentile 2.26 2.30 1.48
95th percentile 2.78 2.79 1.60
99th percentile 2.88 2.88 2.79
Maximum b 2.92 2.92 2.79
a Limit of detection 10 cfu/g b log10 counts of positive samples only

Microbiological quality of Australian beef and sheepmeat - results of the industry’s forth national abattoir study
22
Appendix 4: Microbiological data for sheep
Table 4.1: Total Viable Count (log10 at 25°C) from sponges of Australian chilled sheep primals
Overall Summer Winter
Legs Shoulders Legs Shoulders Legs Shoulders
Samples 613 613 310 310 303 303
Mean(a) 2.02 2.29 1.95 2.23 2.09 2.35
Median 2.00 2.15 1.92 2.10 2.03 2.22
Standard deviation 0.81 0.96 0.78 0.87 0.84 1.05
90th percentile 3.09 3.54 3.06 3.33 3.19 3.82
95th percentile 3.46 4.23 3.22 3.92 3.82 4.72
99th percentile 4.15 4.97 3.69 4.40 4.42 5.28
Maximum 4.64 6.21 3.96 6.21 4.64 5.33
a limit of detection 0.08/cm2
Table 4.2: Prevalence of generic E. coli in sponges from Australian sheep primals descriptive statistics for log10
counts from positive sponges.
Overall Summer Winter
Legs Shoulders Legs Shoulders Legs Shoulders
Samples 613 613 310 310 303 303
Prevalence (%) 42.9 34.6 27.7 33.5 58.4 35.6
Mean(a,b) -0.44 -0.63 -0.68 -0.51 -0.33 -0.74
Median -0.60 -0.77 -0.78 -0.69 -0.38 -0.77
Standard deviation 0.69 0.56 0.61 0.67 0.71 0.40
90th percentile 0.44 0 0.33 0.31 0.55 -0.08
95th percentile 0.98 0.33 0.66 1.15 1.23 -0.04
99th percentile 1.77 1.78 1.23 1.82 1.88 0.29
Maximum 2.36 1.82 1.83 1.82 2.36 0.30
a Limit of detection 0.08 cfu/cm2 b log10 counts of positive samples

Microbiological quality of Australian beef and sheepmeat - results of the industry’s forth national abattoir study
23
Table 4.3: Prevalence of Salmonella, E. coli O157:H7, Listeria and Campylobacter, in sponges from Australian
chilled sheep primals (2011)
Overall Summer Winter
Legs Shoulders Legs Shoulders Legs Shoulders
Samples 613 613 310 310 303 303
Salmonella 2.8% 0.8% 1.6% 1.3% 4.0% 0.3%
E.coli O157:H7 0.3% 0.2% nd 0.3% 0.7% nd
Listeria spp. 0.2% nd 0.3% nd nd nd
Campylobacter nd 0.2% nd nd nd 0.3%
nd – not detected in 300 cm2 (E. coli O157, Salmonella and Listeria spp.) and in 250cm2 (Campylobacter)
Table 4.4: Prevalence of coagulase positive staphylococci on sponges from Australian sheep primals and
descriptive statistics for log10 counts from positive samples
Overall Summer Winter
Legs Shoulders Legs Shoulders Legs Shoulders
Samples 613 613 310 310 303 303
Prevalence (%) 4.2 5.2 2.6 3.5 5.9 6.9
Mean(a,b) -0.21 0.34 0.03 0.90 -0.32 0.04
Median -0.09 0.21 -0.09 0.92 -0.28 0
Standard deviation 0.60 0.93 0.70 1.10 0.54 0.68
90th percentile 0.50 1.49 0.62 2.78 0.26 0.58
95th percentile 0.97 1.52 1.15 2.96 0.28 1.23
99th percentile 1.15 2.07 1.15 2.96 0.45 1.52
Maximum 1.15 2.96 1.15 2.96 0.45 1.52
a Limit of detection 0.08 cfu/cm2 b log10 counts of positive samples
Table 4.5: Prevalence of coliforms on sponges from Australian sheep primals and descriptive statistics for log
counts from positive samples
Overall Summer Winter
Legs Shoulders Legs Shoulders Legs Shoulders
Samples 613 613 310 310 303 303
Prevalence (%) 52.0 46.2 39.7 43.5 64.7 48.8
Mean(a,b) -0.36 -0.54 -0.50 -0.39 -0.27 0.68
Median -0.48 -0.77 -0.77 -0.48 -0.34 0.77
Standard deviation 0.72 0.63 0.69 0.76 0.71 0.44
90th percentile 0.57 0.12 0.41 0.39 0.73 0.08
95th percentile 1.00 0.55 1.00 1.54 1.03 0.18
99th percentile 2.02 2.02 2.03 2.74 2.08 0.81
Maximum 2.36 3.10 2.10 3.10 2.36 1.52
a Limit of detection 0.08 cfu/cm2 b log10 counts of positive samples only

Microbiological quality of Australian beef and sheepmeat - results of the industry’s forth national abattoir study
24
Appendix 5: Microbiological profile of frozen boneless sheepmeat
Table 5.1: Total Viable Count (log10 TVC at 25°C) of frozen, boneless sheepmeat
Table 5.2: Prevalence of generic E. coli in core samples of Australian boneless sheepmeat and descriptive
statistics for log10 counts from positive samples.
Overall Summer Winter
Samples 551 251 300
Mean(a) 2.80 2.97 2.65
Median 2.76 2.90 2.63
Standard deviation 0.70 0.64 0.72
90th percentile 3.61 3.85 3.38
95th percentile 4.02 4.11 4.00
99th percentile 4.94 4.94 5.09
Maximum 5.51 5.09 5.51
a Limit of detection 10 cfu/g
Overall Summer Winter
Samples 551 251 300
Prevalence (%) a 12.5 14.7 10.7
Mean(b) 1.51 1.43 1.61
Median 1.30 1.30 1.30
Standard deviation 0.67 0.57 0.77
90th percentile 2.81 2.00 2.95
95th percentile 2.95 2.46 3.00
99th percentile 3.00 3.00 3.00
Maximum 3.30 3.30 3.00
a Limit of detection 10 cfu/g b log10 counts of positive samples
Table 5.3: Prevalence of Salmonella and Listeria in samples of frozen, boneless sheepmeat (2011)
Overall Summer Winter
Samples 551 251 300
Salmonella 3.1% 1.2% 4.7%
Listeria nd nd nd
nd – not detected in 25g sample

Microbiological quality of Australian beef and sheepmeat - results of the industry’s forth national abattoir study
25
Table 5.4: Prevalence of coagulase positive staphylococci in core samples of Australian frozen boneless
sheepmeat and descriptive statistics for log10 counts from positive samples
Overall Summer Winter
Samples 551 251 300
Prevalence (% detection) 1.8 0.4 3.0
Mean(a,b) 1.66 1.85 1.64
Median 1.70 1.85 1.70
Standard deviation 0.40 - 0.42
90th percentile 2.20 1.85 2.20
95th percentile 2.32 1.85 2.32
99th percentile 2.32 1.85 2.32
Maximum 2.32 1.85 2.32
a Limit of detection 10 cfu/g b log10 counts of positive samples
Table 5.5: Prevalence coliforms in core samples of Australian frozen boneless sheep meat and descriptive
statistics for log10 counts from positive samples
Overall Summer Winter
Samples 551 251 300
Prevalence (% detection) 19.4 25.5 14.3
Mean(a,b) 1.54 1.52 1.59
Median 1.30 1.30 1.30
Standard deviation 0.68 0.63 0.76
90th percentile 2.78 2.48 3.23
95th percentile 3.23 2.79 3.26
99th percentile 3.85 3.00 3.30
Maximum 3.90 3.90 3.30
a Limit of detection 10 cfu/g b log10 counts of positive samples

Microbiological quality of Australian beef and sheepmeat - results of the industry’s forth national abattoir study
26
Notes

Intentionally blank page

Meat & Livestock AustraliaLevel 1, 165 Walker StreetNorth Sydney, NSWAustralia 2060www.mla.com.au Ph: +61 2 9463 9333 Fax: +61 2 9463 9393 www.mla.com.au