Compositional and lexical semantics • Compositional semantics: the ...
MICROBIOLOGICAL AND COMPOSITIONAL QUALITY OF RAW MILK
DELIVERED BY SMALL SCALE DAIRY FARMERS TO THE MILK
COLLECTION CENTRES IN HAI DISTRICT, TANZANIA
By
Mboya Neema John
(BSc. Animal Science, SUA, Morogoro, Tanzania)
A dissertation submitted in partial fulfilment of the requirements for the degree of
Master of Science in Dairy Science and Technology
Department of Animal Science
Faculty of Agriculture
University of Zimbabwe
2016
i
DECLARATION
BY THE CANDIDATE
I hereby declare to the University of Zimbabwe that this thesis MICROBIOLOGICAL AND
COMPOSITIONAL QUALITY OF RAW MILK DELIVERED BY SMALL SCALE
DAIRY FARMERS TO THE MILK COLLECTION CENTRES IN HAI DISTRICT
TANZANIA submitted for the Master of Science degree at the University of Zimbabwe is my
original work and has not been previously submitted to any other institution of higher
education. All sources of cited literature are acknowledged and referenced.
Neema John Mboya June 2016
.
ii
BY SUPERVISORS
This work has been submitted for examination with our approval as University supervisors.
Dr. P.T Banda (Co-Supervisor)
Department of Animal Science
Faculty of Agriculture
University of Zimbabwe
Prof. Lusato Kurwijila (Associate-Supervisor)
Department of Animal Science
Faculty of Agriculture
Sokoine University of Agriculture
iii
ABSTRACT
Microbiological and physical-chemical quality of raw milk delivered at milk collection
centres in Hai District, Tanzania
By
Neema John Mboya
A total of 310 milk samples were collected from 180 small scale dairy farmers who brought
their milk to Milk Collection Centres and 30 vendors in the study area. The bacteriological
quality, physicochemical parameters and milk adulteration with Sulphonamides and
Tetracycline drug residues were assessed. Microbiological quality evaluation was done based
on Total Bacterial Count, Total Coliform Count, E.coli and pathogenic E.coli (O157: H7).
For sake of comparisons milk 60 samples from Turiani and Mlandiz were added for
antimicrobial residues analysis. In addition, a survey with the use of semi-structured
questionnaires was conducted to assess the knowledge of farmers on clean milk production in
the study area. Microbiological analyses were carried out using standard cultures,
physicochemical properties by use of Automatic Milk Analyser and antibiotic residues using
Charm EZ technique. Interviews revealed that 91% of respondents dried cows’ udders after
washing, 75% cleaned milk containers with hot water and 86.7% used plastic containers to
transport milk. The mean bacterial counts were within acceptable limits as per East African
Community standards. About 54% of E.coli was detected, but none for the pathogenic strain.
Physicochemical properties of milk were within acceptable ranges for processing. Up to 25%
of milk samples from farmers were positive for Tetracycline and Sulphonamides drug
residues whilst the vendor samples were negative. More quality tests such as iodine and
alcohol tests are recommended to ensure freedom of milk from adulteration with other
materials apart from water.
iv
DEDICATION
To my beloved family for their moral support throughout this study and commitment they
have made in my academic life.
v
ACKNOWLEDGEMENTS
Foremost is to Almighty God for giving the grace and helping me in progressing further with
my education. Without your help Lord I could not have been who I am today.
I am so grateful to my supervisors Dr. P.T Banda-Saidi and Prof. L. R Kurwijila for their
excellent supervision, constructive ideas and patience for the entire period of this study. You
are wonderful supervisors, thank you for making this study successful. I sincerely
appreciated your very useful contribution for the accomplishment of this work.
This study would not have materialised were it not for the financial assistance from iAGRI
through RUFORUM. I also appreciate for the offer of the drug residue kit provided by ILRI
which made it possible for this study objective of assessing drug residues in milk to be
accomplished.
My heartfelt thanks should also go to Dr. N. Madalla Head of Department of Animal Science
at SUA for allowing me to carry out sample analysis at the department’s laboratory. Mr.
George Makingi and Ms. Rita Mwashitete for their help during laboratory work. Thank you
for your contribution to make this work complete. Dr. V.I Chikosi, Mr. Athuman Nguluma,
Zabron Nziku and statisticians’ team from SUALISA for their assistance in statistical
analysis issues.
Further appreciation goes to Hai District DALDO office and extension officers in the selected
villages for their cooperation during milk sample collection. Sincere gratitude is extended to
my family, friends and all MSc students for the valuable support throughout the study period
which contributed to completion of this work.
Thank you all.
vi
SYMBOLS AND ABBREVIATIONS
COMESA Common Market for Eastern and Southern Africa
DALDO District Agriculture and Livestock Development Officer
EAC East African Community
EAS East African Community Standard
HACCP Hazard Analysis and Critical Control Points
iAGRI Innovative Agriculture Research Initiative
MCC’s Milk Collection Centres
RUFORUM Regional Universities Forum for Capacity Building in Agriculture
SMAC Sorbitol Mac Conkey Agar
SUA Sokoine University of Agriculture
SUALISA Sokoine University of Agriculture Laboratory for Interdisciplinary Statistical
Analysis
TBC Total Bacteria Count
TCC Total Coliform Count
TBS Tanzania Bureau of Standards
TDB Tanzania Dairy Board
TFDA Tanzania Food and Drugs Authority
UHT Ultra-High Temperature
vii
CONTENTS
LIST OF TABLES ................................................................................................................... xii
LIST OF FIGURES ............................................................................................................... xiii
CHAPTER ONE ........................................................................................................................ 1
1 INTRODUCTION .............................................................................................................. 1
1.1 Problem Statement ...................................................................................................... 3
1.2 Justification ................................................................................................................. 3
1.3 Objectives .................................................................................................................... 3
1.3.1 Specific objectives ............................................................................................... 3
1.4 Hypotheses .................................................................................................................. 3
CHAPTER TWO ....................................................................................................................... 5
2 LITERATURE REVIEW ................................................................................................... 5
2.1 Introduction ................................................................................................................. 5
2.2 Contribution of Small Scale Dairy Farmers in Tanzania ............................................ 5
2.2.1 Improved Nutrition .............................................................................................. 5
2.2.2 Improved Livelihood ........................................................................................... 6
2.2.3 Employment ......................................................................................................... 6
2.3 Constraints Faced by Small Scale Dairy Farmers ....................................................... 6
2.3.1 Seasonal and Low Quality Feeds ......................................................................... 6
2.3.2 Unreliable Milk Marketing .................................................................................. 7
2.3.3 Lack of Incentive ................................................................................................. 7
2.3.4 Poor Infrastructure ............................................................................................... 7
2.4 Opportunities for Small Scale Dairy Farmers ............................................................. 8
2.4.1 Availability of Internal Market ............................................................................ 8
2.4.2 Increased Supply of Milk to Large Processors .................................................... 8
2.4.3 Value Addition ..................................................................................................... 8
2.5 The Dairy Sector in Tanzania...................................................................................... 9
viii
2.5.1 Input Suppliers ................................................................................................... 10
2.5.2 Producers............................................................................................................ 10
2.5.3 Processors .......................................................................................................... 10
2.5.4 Distributors ........................................................................................................ 11
2.5.5 Consumers.......................................................................................................... 11
2.6 Informal Milk Marketing in Tanzania ....................................................................... 12
2.6.1 Producers............................................................................................................ 12
2.6.2 Vendors .............................................................................................................. 13
2.6.3 Consumers.......................................................................................................... 13
2.7 Factors Affecting the Quality of Raw Milk .............................................................. 13
2.7.1 Physical-chemical Properties of Milk ................................................................ 13
2.7.2 Type of Feed and Cattle Breed .......................................................................... 13
2.7.3 Intentional and Accidental Adulteration of Milk ............................................... 14
2.7.4 Antibiotic Residues in Milk ............................................................................... 15
2.8 Effects of Antibiotic Residues in Milk ...................................................................... 16
2.8.1 Health Effects..................................................................................................... 16
2.8.2 Economic Effects ............................................................................................... 17
2.8.3 The Microbiological Quality of Milk ................................................................ 17
2.9 Food-borne Pathogens in Milk and Public Health Implications ............................... 19
2.9.1 Milk Borne Pathogens........................................................................................ 19
2.9.2 Escherichia Coli ................................................................................................. 19
2.10 Sources of Contamination of Milk .......................................................................... 20
2.10.1 The Cow ............................................................................................................. 22
2.10.2 The Milker ......................................................................................................... 22
2.10.3 The Milking Environment.................................................................................. 22
2.10.4 Milk containers .................................................................................................. 22
2.11 The Regulatory Framework for Dairy Products in Tanzania .................................... 22
ix
2.12 Informal milk marketing in India .............................................................................. 23
3 KNOWLEDGE OF SMALL SCALE DAIRY FARMERS ON CLEAN MILK
PRODUCTION AND MANAGEMENT IN SELECTED VILLAGES OF HAI DISTRICT,
TANZANIA. ............................................................................................................................ 24
3.1 INTRODUCTION ..................................................................................................... 25
3.2 MATERIALS AND METHODS .............................................................................. 26
3.2.1 Study Site ........................................................................................................... 26
3.2.2 Study Design ...................................................................................................... 27
3.2.3 Secondary Data and Other Documents .............................................................. 27
3.2.4 Key Informant Interviews .................................................................................. 27
3.2.5 Focus Group Discussions ................................................................................... 27
3.2.6 Sampling Strategy .............................................................................................. 27
3.2.7 Data Collection .................................................................................................. 28
3.2.8 Data Management and Analysis ........................................................................ 28
3.3 RESULTS.................................................................................................................. 28
3.3.1 Focus Groups and Key Informants Discussions Results ................................... 28
3.3.2 Farmers .............................................................................................................. 28
3.3.3 Types of Livestock and the Management System Used by Respondents .......... 29
3.3.4 Milking Practices ............................................................................................... 29
3.3.5 Use of Antibiotics and Clean Milk Production by Farmers ............................... 29
3.3.6 Quality of Milk from Vendors ........................................................................... 36
3.4 DISCUSSION ........................................................................................................... 38
3.5 CONCLUSION ......................................................................................................... 39
4 EVALUATION OF MICROBIOLOGICAL QUALITY OF MILK COLLECTED
FROM SMALL SCALE DAIRY FARMERS AND VENDORS IN THE HAI DISTRICT IN
TANZANIA ............................................................................................................................. 40
4.1 INTRODUCTION ..................................................................................................... 41
4.2 MATERIALS AND METHODS .............................................................................. 42

x
4.2.1 Study Site ........................................................................................................... 42
4.2.2 Sample Collection .............................................................................................. 42
4.2.3 Determination of Total Bacterial and Coliform Counts .................................... 42
Preparation of Diluent ...................................................................................................... 42
Determination of Bacterial Counts in Milk Samples ........................................................ 42
4.2.4 Plating ................................................................................................................ 43
4.2.5 Plate Counting .................................................................................................... 43
4.2.6 Determination of E.coli ...................................................................................... 43
4.2.7 Determination of pathogenic E.coli (O157: H7) ................................................ 44
4.2.8 Confirmation of E.coli and E.coli pathogenic (O157:H7) ................................. 44
4.2.9 Statistical Analysis ............................................................................................. 45
4.2.10 Statistical Model ................................................................................................ 46
4.3 RESULTS.................................................................................................................. 46
4.3.1 Descriptive Statistics .......................................................................................... 46
4.4 DISCUSSION ........................................................................................................... 50
4.5 CONCLUSION ......................................................................................................... 52
5 AN ASSESSMENT OF MILK COMPOSITION, WHOLESOMENESS AND
FREEDOM FROM SULPHONAMIDES AS WELL AS TETRACYCLINE DRUG
RESIDUES IN MILK SAMPLES COLLECTED FROM FARMERS AND VENDORS IN
THE HAI DISTRICT TANZANIA. ........................................................................................ 53
5.1 INTRODUCTION ..................................................................................................... 54
5.2 MATERIALS AND METHODS .............................................................................. 55
5.2.1 Study site ............................................................................................................ 55
5.2.2 Data collection ................................................................................................... 55
5.2.3 Milk Composition Analysis ............................................................................... 55
5.3 RESULTS.................................................................................................................. 56
5.3.1 Physicochemical Properties of Milk .................................................................. 56
5.3.2 Antimicrobial Residues ...................................................................................... 57
xi
5.4 DISCUSSION ........................................................................................................... 58
5.5 CONCLUSION ......................................................................................................... 59
6 GENERAL DISCUSSION CONCLUSION AND RECOMMENDATIONS ................. 60
6.1 General Discussion .................................................................................................... 60
6.2 General Conclusion ................................................................................................... 61
6.3 Recommendations ..................................................................................................... 61
7 Appendix .......................................................................................................................... 72

xii
LIST OF TABLES
Table 2.1 Standard Physical Composition for Raw Milk From the Cow ................................ 14
Table 2.3 Examples of Diseases Caused by Consumption of Contaminated Milk .................. 21
Table 3.1 Summary of the Information that was Collected by Use of Questionnaire ............. 30
Table 3.2 Socio-Demographic Characteristics of Respondents ............................................... 31
Table 3.3 Milking Practices by Farmers in the Hai District .................................................... 32
Table 3.4 Types of Livestock and Management System Used by Respondents ..................... 33
Table 3.5 Milking Practices by Small Scale Dairy Farmers in Hai District in Tanzania ........ 34
Table 3.6 Use of Antibiotics and Milk Hygiene Practices by Small Scale Farmers at Hai
District in Tanzania .................................................................................................................. 35
Table 3.7 Summary of Responses by Vendors to How they Handle Milk ............................. 37
Table 4.1 Proposed Raw Milk Grading System for EAC Based on Microbiological Quality
.................................................................................................. Error! Bookmark not defined.
Table 4.2 Classification of Microbiological Quality of Raw Milk Samples Collected from
Farmers and Vendors in Hai District ....................................................................................... 47
Table 4.3 LSM ± SE of Total Coliform Count and Total Bacterial Count for Farmers and
Vendors .................................................................................................................................... 47
Table 4.4 LSM ± SE of Total Bacterial Count and Total Coliform Count for Milk Collected
from Farmers from Participating Villages in Hai District ....................................................... 48
Table 4.5 LSM ± SE of Total Bacterial Count and Total Coliform Count for Milk Collected
from Vendors from Participating Villages in Hai District ....................................................... 48
Table 4.6 Proportions of Samples with E.coli in Milk Samples Collected from Farmers and
Vendors in the Hai District ...................................................................................................... 49
Table 5.1 Comparison of Physicochemical Properties of Milk Samples Collected From
Selected Villages in the Hai District in Tanzania. ................................................................... 56
Table 5.2 Comparison of Physicochemical Properties of Milk From Farmers and Vendors .. 56
xiii
LIST OF FIGURES
Figure 1 Informal milk marketing sector in Tanzania. Source: Msuya (2012) ......................... 9
Figure 3 Location of dairy processing plants in Tanzania. Source Kurwijila et al (2012) ...... 12
Figure 4 Map of Tanzania showing the location of Hai district .............................................. 26
Figure 5 Drug Residues in Milk Samples Collected from Hai, Turiani and Mlandizi Areas in
Tanzania. .................................................................................................................................. 57
1
CHAPTER ONE
1 INTRODUCTION
Small-scale dairying has a significant role in poverty alleviation and nutrition improvement in
Tanzania (Mdegela et al, 2009). The sector provides employment to rural society and also is
an important mean of life improvement. The employment can be in a form of milk selling,
input supply and others are employed to attend dairy animals.
Small-scale dairy farmers are the major suppliers of milk in the informal milk market in
Tanzania (Msuya, 2012). Of all the milk produced from small-scale dairy farmers about 90%
of the milk is marketed informally (Mwakalinga, 2010). In spite of the significant
contribution of informally marketed milk to the total milk supply little is known about the
quality of the milk.
The bulky nature of milk and its nutritious characteristics attract microbes which contribute
largely to the perishability of milk (Orregård, 2013) This creates a need to ensure clean milk
production by small-scale farmers. Clean milk production depends on milking environment,
the milker hygiene, cleanliness of udder, teats and containers that are used to store the milk.
Contamination of milk after leaving the farm gate is largely due to poor milk handling
practices and milk adulteration (Street and Bogor, 2013).
Milk produced in the informal sector is poorly handled (Omore et al, 2005). Unclean milk
containers that are commonly used by milk vendors in informal milk marketing contribute a
lot to milk contamination along the value chain. This is because milk vendors, as well as
farmers use plastic jerry cans with narrow openings in handling milk hence making it very
difficult for thorough cleaning (Swai et al, 2010). There is a need to make sure that milk is
kept clean by avoiding all sources of contamination. This can be achieved by maintaining a
high level of hygiene on milk handling (Debela, 2015).
Microbiological quality of milk plays an important role in ensuring safety to the consumer
and profit to producers (Rejeev et al, 2012). Milk microbiological quality is of public health
concern due to zoonotic diseases which are milk-brne such as tuberculosis, brucellosis,
shigellosis and salmonellosis. There are also emerging pathogens of public health importance
2
such as E. coli O157: H7, Campylobacter jejuni, Yersinia enterolitica, Listeria
monocytogenes and Salmonella sp (Swai and Schoonman, 2011). Due to the fact that milk-
borne diseases are of public health importance, there is a need to screen the milk in informal
market for the sake of consumer health protection.
Antibiotic residues in the milk predispose consumers to health hazards such as allergies and
bacterial resistance (Jones, 2009). The major cause for this problem is prolonged treatment of
the lactating animals and failure to comply with the recommended withdrawal period of the
drug. Due to poor record keeping, farmers may unknowingly sell the milk from the animal on
treatment, further contributing to the problem. Apart from health hazards milk with antibiotic
residues cannot be used in making fermented milk products because the starter culture used
in making these products cannot survive in milk with antibiotic residues (Adetunji, 2011).
This study aimed at assessing the microbiological quality, physicochemical and adulteration
status of milk from small-scale farmers and vendors in Hai District to trace the possible
sources of milk contamination. The results from the study will be used to generate
information showing the factors that influence the quality of milk in the study area. Such
information is useful to farmers when looking for more profitable markets for their milk and
also informing the stake holders in the dairy sector.
3
1.1 Problem Statement
There is little published information on the quality of milk produced by small-scale farmers
in Tanzania. While studies were done in Arusha, Morogoro and Njombe ( Mdegela et al,
2009;Karimuribo et al, 2015; Ngasala et al, 2015) in which the animal kept is of indigenous
breeds, little is known about the milk quality produced by crosses of improved dairy breeds
that are kept by most farmers in Hai District, Kilimanjaro region.
1.2 Justification
Microbiological, chemical and physical composition qualities of milk are among the
important public health issues for milk consumers (Mansouri-Najandi and Sharifi, 2013).
Apart from health issues, it helps to persuade processors to buy from small-scale farmers. For
this reason, it is essential to make sure that milk consumers are paying for the safe dairy
products. The assurance can only be guaranteed after research studies have been conducted.
This study intends to provide information on the safety and quality of milk in the study site
and hence helps stakeholders when formulating the policy concerning dairy industry. The
study also will provide information to the extension agents in the study area on the important
practice to be taught to farmers to ensure clean and high -quality milk production by small-
scale dairy farmers.
1.3 Objectives
The main objective of this study was to assess the factors influencing the milk quality from
small-scale dairy farmers in the Hai District in Tanzania.
1.3.1 Specific objectives
The specific objectives of the study were to:
a) Assess the knowledge of farmers on quality milk production and dairy animal management
practices under small-scale dairy production conditions.
b) Evaluate microbiological quality of milk from farmers and vendors.
c) Assess the milk composition wholesomeness and freedom from drug residues from farmers
and vendors.
1.4 Hypotheses
H0: There is no difference in the milk microbiological quality from farmers and vendors in
Hai District.

4
H0: There is no difference in milk composition, wholesomeness and amount of drug residues
in milk from farmers and vendors in the study area.
5
CHAPTER TWO
2 LITERATURE REVIEW
2.1 Introduction
The dairy sector is one of the important livestock components in Tanzania. It contributes
about 3.8% of Gross Domestic Products from the livestock sector which is one-third of the
4.6% contributed by livestock sector (Njombe, 2011). The sector is dominated by small-scale
dairy farmers. The scenario is also the same with Sub-Saharan countries (Uddin et al, 2012)
with the exception of Zimbabwe, South Africa and Namibia. In this chapter, the work that has
been done on the contribution of smallholder dairy farmers in the Sub-Saharan Africa and
Tanzania to national milk production is reviewed. Production, marketing and policy issues
that influence milk composition as well as hygienic quality were assessed. Lastly, the
problem of antibiotic residues in milk was reviewed.
2.2 Contribution of Small-Scale Dairy Farmers in Tanzania
2.2.1 Improved Nutrition
Milk production in Tanzania is estimated to be 2.5 billion litres per year with a population of
45 million the per capita consumption is therefore about 50 litres per person per year (Kaush
et al, 2015). This amount is less than the per capita consumption in Kenya which is 100
litres per person per year (Muriuki, 2011) and the world average which is 108 litres per
person per year and the amount recommended by FAO of 200 litres per person per year (Kim
et al, 2009). The low milk production is due to low milk yield due to few improved dairy
cattle estimated to be about 680 000 cattle against the desired number of 3 000 000
improved dairy cattle (Njombe, 2011). In addition, more than 90% of milk from small-scale
dairy farmers is marketed informally (Njombe, 2011).
Due to the high nutritive value of milk, it is essential to increase the consumption level so as
to improve the nutrition status especially for children and infants less than 5 years of age.
Since infants are vulnerable to protein-energy malnutrition this requires that milk provided to
this group must comply with the standard nutritive value for milk to form an important
6
component of their diet (Nwankwo et al, 2015). Milk supplies high-quality protein, minerals
and vitamins (Achchuthan and Kajananthan, 2012).
2.2.2 Improved Livelihood
Small-scale dairying can be a viable tool in poverty and malnutrition alleviation in low-
income societies (Uddin et al, 2012). Sales obtained through selling milk help farmers to earn
money that is used to pay for other important services. Small-scale farmers combine crops
and livestock. Manure from the animals is used to fertilise their farms and contribute to crops
productivity. Dairy production acts as an extra source of income to rural populations which
depend only on crops (Amarja, 2013).
2.2.3 Employment
Dairy production has been considered as a potential means of alleviating large scale
unemployment, especially in rural areas (Marichamy et al, 2014). There is employment
creation along the milk value chain. People are in dairy input supply business, production of
milk, marketing of milk and processors. Dairy helps people in increasing the income through
selling raw milk and processing of dairy products in small-scale basis which is commonly run
by women groups.
2.3 Constraints Faced by Small Scale Dairy Farmers
2.3.1 Seasonal and Low-Quality Feeds
There are plenty of feeds during the rainy season and are in deficit in the dry season. This
causes milk productivity to fluctuate depending on the feed availability. A study by (Kivaria,
2006) in Dar-es-Salaam Tanzania showed that during the rainy season the distance to forage
source was half a kilometre but during the dry season the average distance travelled was over
20 kilometres.
The additional milk produced during the rainy season when feed is in abundance can be
processed into high-value products which have longer shelf life and are of high
microbiological as well as nutritional quality. Examples of such products include sterilised
milk, UHT milk and milk powders. Products with long shelf life are available to consumers
during the dry season when feed is scarce and milk yields are low.
7
2.3.2 Unreliable Milk Marketing
The milk produced by small-scale farmers is not formally marketed in most developing
countries including Tanzania. It is possible to formalise the sector provided that there is a
good policy concerning dairy production. A study done in Kenya by (Muriuki, 2011) on the
performance of informal milk marketing sector, shows the advancement of the sector by
tripling the amount of milk the informal dairy sector was handling from 144 million litres in
2002 to 423 million litres in 2007. The increased production was supported by the presence
of conducive policy environment for the dairy sector as well as a large number of dairy cattle
i.e 3 000 000 improved cattle from improved breeds (Muriuki, 2011). Formalising the milk
marketing will help in providing the correct figures on milk productivity in small-scale dairy
farmers. The formalisation success supported by a number of on-going milk projects, one of
them is Irish project under “MilkIt” programme which is establishing a modern milk
marketing of milk for small-scale dairy farmers as explained by (Muchichu, 2014). Also,
there is support from Bill and Melinda Gates Foundation that is supporting small-scale dairy
farmers in the southern highlands regions (Iringa and Mbeya) to increase milk production and
access better market for their milk (EADD, 2010).
2.3.3 Lack of Incentive
The price for milk in Tanzania is done on a flat rate basis and not on a quality basis. This
discourages the small scale farmers from producing clean and high-quality milk. The
introduction of bonuses for clean milk and penalties for poor quality milk will motivate
farmers to produce clean milk. The price incentive system is practised in countries like
Zimbabwe and Zambia (Alemayehu et al, 2012). The introduction of this system will attract
processors into buying milk from small-scale farmers because the milk quality will be
ensured.
2.3.4 Poor Infrastructure
In Tanzania, infrastructure especially roads are very poor (Opiyo and Wambugu, 2011). Most
roads are not all weather roads hence make it difficult to access milk producing areas during
the rainy season. This makes it difficult during the rainy season to transport milk to the
market. The travelling time of a farmer to a collection centre is between 30 minutes and
3hours (Scanagri, 2005). The time taken depends on the mode of transport i.e on foot,
bicycle, motorcycle, oxcart or motor vehicle depending on the condition of the road. The
source of energy to many small-scale dairy farmers is another obstacle which makes it
difficult for them to cool milk soon after milking (Nell et al, 2013). Dairy farming in
8
Tanzania is done in the cooler part of the country i.e Northern and Western Zones. These
areas are characterised by enough rainfall annually hence make it easy for adequate water
availability all the year round for animals to drink and cleaning purposes.
2.4 Opportunities for Small Scale Dairy Farmers
2.4.1 Availability of Internal Market
In Tanzania, the population is growing at a rate of 3% annually (Amanor et al, 2013). This
translates to growth in food demand in the country. There is an emerging segment of middle
income earning people which have more purchasing power and is demanding quality milk for
the money paid. This increases the market opportunity for milk production and processing in
the country (Msuya, 2012a). Success in controlling milk quality will allow small-scale
farmers to sell their milk to this market.
2.4.2 Increased Supply of Milk to Large Processors
There is underutilization of most of the milk processing plants in Tanzania. A study done by
(Kurwijila, 2012) shows that processing plants utilisation in the country is only at 30%
which is equivalent to 167 000 litres per day (Kaush, 2015). The underutilization is partly due
to low supply of raw milk to these processing plants. The milk supply to the processing plants
can be increased through allowing milk from small-scale dairy farmers to be collected and
sent to the processing plants. The barrier to this is that the quality of milk produced by small-
scale dairy farmers is not well known. There are few studies done in other parts of Tanzania
on milk quality. One of the studies on milk quality produced by small-scale dairy farmers
done by (Mdegela et al, 2009) in Njombe District, found that the microbiological quality of
milk from the small scale dairy farmers was in the acceptable ranges as per East Africa
Community Standards.
2.4.3 Value Addition
Milk production in Tanzania is constrained by seasonal fluctuation with high production
during the rainy season and low production in the dry season. Processing milk into various
milk products helps in improving livelihoods of farmers as well as increasing the availability
of milk products in the developing countries (Hahlani and Garwi, 2014). The Tanzania
government is encouraging this small-scale dairy farmers into engaging in value addition to
their milk so as to get more income. Most of the processing groups are found in the Northern
part of the country i.e Arusha and Kilimanjaro (Pim et al, 2009). These groups act as a
market for milk produced by small-scale farmers found around their area because they
9
process the products at a small volume compared to large scale processing (Pim et al, 2009).
Small-scale processors create jobs to more people than when milk is sold in its raw form.
2.5 The Dairy Sector in Tanzania
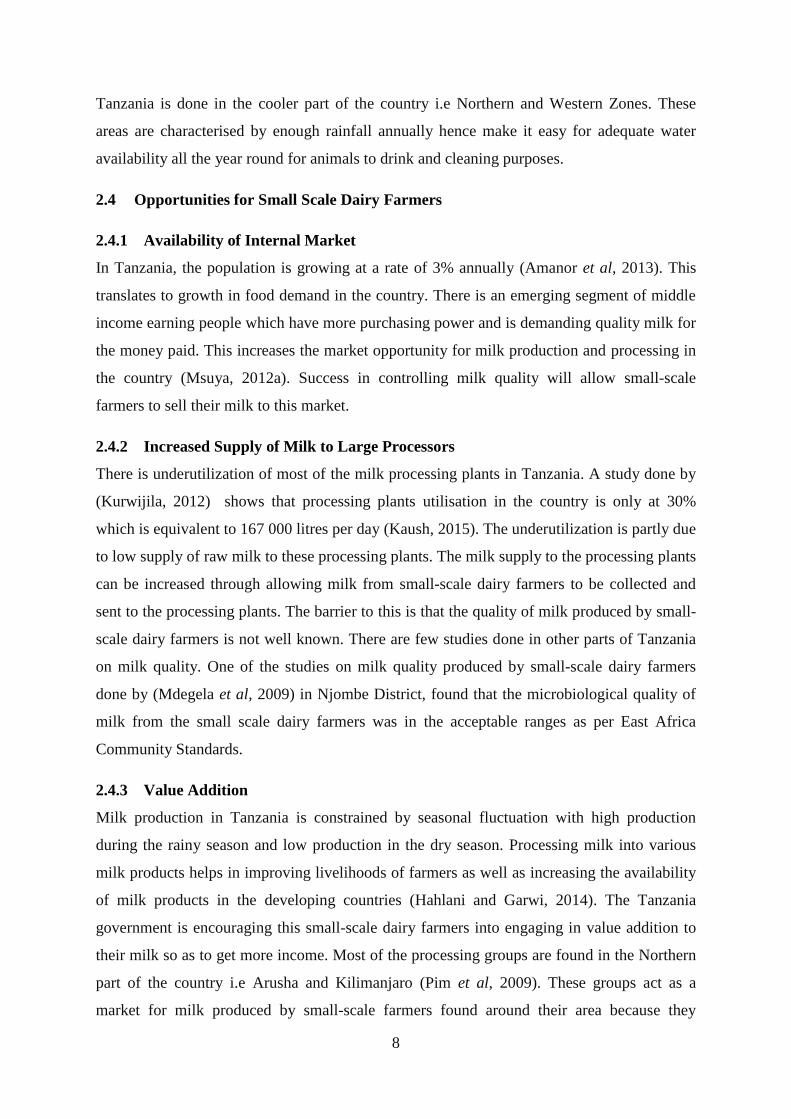
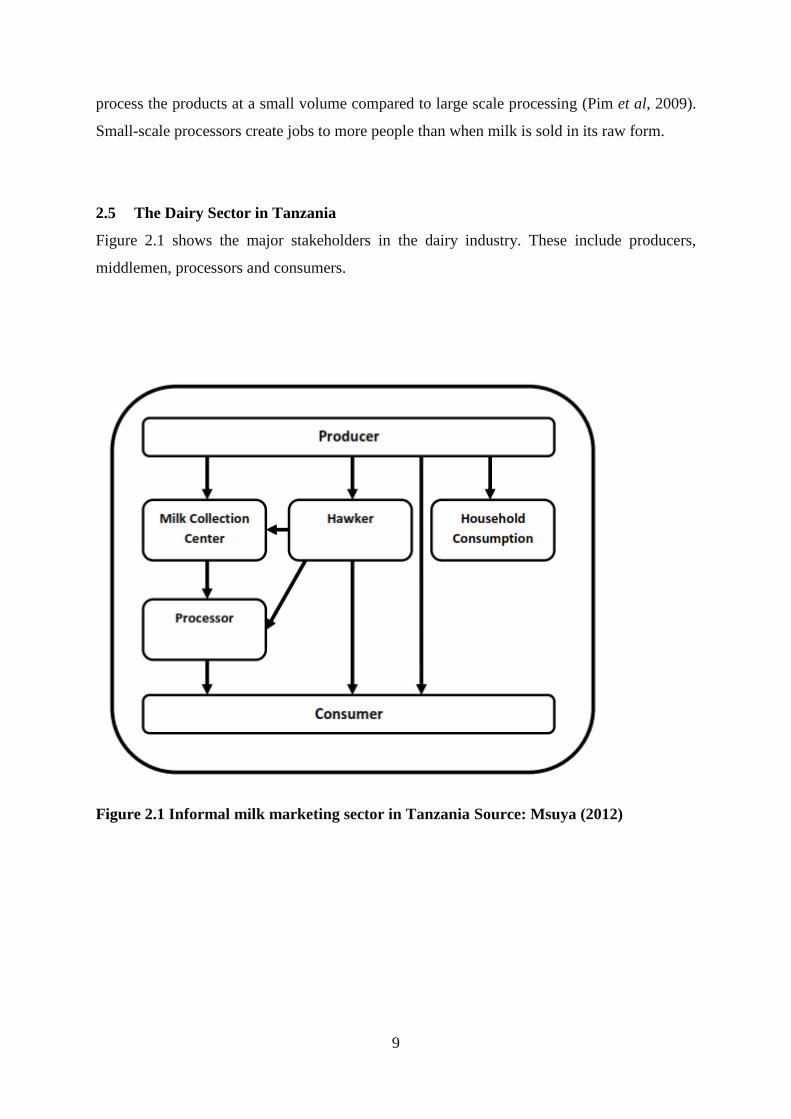
Figure 2.1 shows the major stakeholders in the dairy industry. These include producers,
middlemen, processors and consumers.
Figure 2.1 Informal milk marketing sector in Tanzania Source: Msuya (2012)
10
2.5.1 Input Suppliers
They are veterinary shops which are privately owned. They supply drugs and animal feed
especially concentrates and mineral lick. There are also extension workers which specializes
in animal health and production. Extension staffs are employed by the Government under the
Ministry of Livestock Development and Fisheries. These extension officers are assigned to
perform all livestock services needed by the farmers. They usually provide farmers with the
required knowledge on the proper keeping of their animals. In Tanzania, there are no
subsidies provided for small-scale dairy farmers. The government contribution to dairy sector
development is through employing extension workers who are responsible for attending to
matters regarding dairy cattle management.
2.5.2 Producers
The dairy sector is comprised of small and large scale dairy farmers, with small-scale dairy
farmers dominating the sector. There are about 680,000 improved dairy cattle in Tanzania
(Njombe, 2011). The small scale dairy farmers are concentrated in the cooler part of the
country (Arusha, Kilimanjaro, Mbeya, Iringa and Kagera Regions ) (Njombe, 2011).
These farmers own an average of 1-5 dairy cattle per farmer. Average productivity is 7-10
litres of milk per cow per day (Swai et al, 2005). Animals are kept under zero grazing
system. About 90% of the produced milk by small-scale dairy farmers is marketed in a raw
form in informal milk markets (Mwakalinga and Leif, 2010).
2.5.3 Processors
This group comprises of both large scale and small scale processors. Large scale processors
include Tanga Fresh, ASAS in Iringa, Musoma Dairies, Azam in Dar-es-Salaam and Mara
milk processors. These processing plants source their milk from their own farm and from the
surrounding livestock keepers that are on contract. For Tanga Fresh, the processing plant
collects the milk from dairy farmer cooperatives in Tanga and Chalinze areas.
The report by (Kaush et al, 2015) shows that about 180 million litres of milk is annually
processed in the country into pasteurised milk, UHT milk, cultured products, ghee, butter,
cheese and cream. These are sold in the domestic market (Njombe, 2011). The most common
processed milk products in Tanzania are UHT milk, Ice cream, pasteurised milk, fermented
milk (mtindi), yoghurt and others. The proportion of these processed products are as follows:
11
UHT milk 30%, Ice cream 7%, pasteurised milk 31%, fermented milk 16%, yoghurt 8% and
others is 7% (TechnoServe, 2012). These dairy products are consumed in the country.
The amounts of imported milk in 2010 were 30-40million litres per year. The imported milk
products include UHT milk, infant formula, milk powder, ice-cream and cheese. At present,
the quantity of processed local milk is more or less the same as the quantity of imports (Nell
et al, 2013). This large amount is contributed by a decline in the amount of locally processed
dairy and dairy products in the market due to lack of enough raw milk supply into home
processing plants.
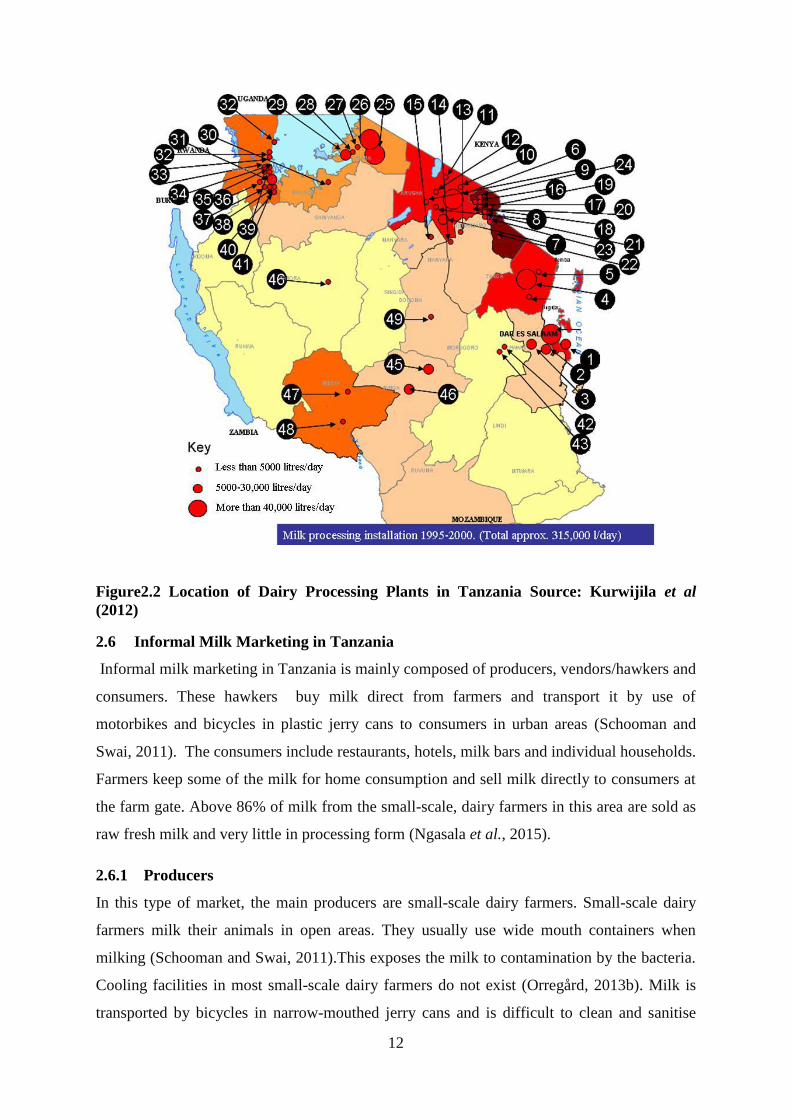
Figure 2.2 shows the location of processing plants in Tanzania. Most of these processing
plants are located in Arusha, Tanga, Kilimanjaro, Mara and Kagera regions. The reason is
because these areas are suitable for dairying because the temperature is low. Also, there is a
market for the processed dairy products due to the presence of big cities that is Dar es Salaam
and Mwanza. Arusha is amongst the big cities so it serves as a market for the dairy products
processed in the Region.
2.5.4 Distributors
This group is made up of wholesalers and retailers. The wholesalers group is made up of
large processors. The large processors in Tanzania are Tanga Fresh, Azam milk, Musoma
Dairies and ASAS Dairies. The processed milk products from these large processors are
usually sold in urban and peri-urban areas especially in big cities like Arusha, Dar es Salaam
and Mwanza. The major market for the Tanga Fresh, ASAS and Azam milk products is in
Dar es Salaam while for Musoma Dairies is the Lake Zone Regions. Retailers are
supermarkets, retail shops, restaurants and milk kiosks.
2.5.5 Consumers
This is the last and ultimate player in the chain. Consumers may be households in the urban
area, or an institution such as schools, universities, colleges and hospitals.
12
Figure2.2 Location of Dairy Processing Plants in Tanzania Source: Kurwijila et al
(2012)
2.6 Informal Milk Marketing in Tanzania
Informal milk marketing in Tanzania is mainly composed of producers, vendors/hawkers and
consumers. These hawkers buy milk direct from farmers and transport it by use of
motorbikes and bicycles in plastic jerry cans to consumers in urban areas (Schooman and
Swai, 2011). The consumers include restaurants, hotels, milk bars and individual households.
Farmers keep some of the milk for home consumption and sell milk directly to consumers at
the farm gate. Above 86% of milk from the small-scale, dairy farmers in this area are sold as
raw fresh milk and very little in processing form (Ngasala et al., 2015).
2.6.1 Producers
In this type of market, the main producers are small-scale dairy farmers. Small-scale dairy
farmers milk their animals in open areas. They usually use wide mouth containers when
milking (Schooman and Swai, 2011).This exposes the milk to contamination by the bacteria.
Cooling facilities in most small-scale dairy farmers do not exist (Orregård, 2013b). Milk is
transported by bicycles in narrow-mouthed jerry cans and is difficult to clean and sanitise
13
(Omore et al, 2004). There is no literature showing how farmers prepare their animals before
milking them in Tanzania and it is not officially known if farmers follow any standardised
milking procedures to ensure clean milk production.
2.6.2 Vendors
Most of the time vendors buy milk directly from the producer or milk collection centres in
their areas. They are the middlemen between the producer and the consumer (Ngasala et al,
2015). The commonly used mode of transport of milk by vendors are motorbikes. Milk is
transported in plastic containers rather than stainless cans (Omore et al, 2004). This poor milk
handling subjects the consumer to health risks due to the high possibility of contamination
(Lubote et al, 2014). Little is known about the reasons for small-scale farmers selling their
milk to vendors instead of established processors.
2.6.3 Consumers
Consumers include hotels, restaurants and households in urban areas. A study that was done
in Arusha by (Ngasala et al, 2015) shows that consumers are aware of the quality of milk
they want and the risk associated with consumption of contaminated milk.
2.7 Factors Affecting the Quality of Raw Milk
2.7.1 Physical-chemical Properties of Milk
Milk and milk products are excellent high-quality foods providing both nutritional and
culinary values (Anderson et al, 2011). This is due to the fact that milk does have distinct
physical, chemical and biological characteristics and its colour, odour, taste, consistency,
freezing point (- 0.55°C), pH (6.6) and specific gravity (1,032) and these characteristics
remain particularly constant (Lues et al, 2010). The addition of any foreign material will
disturb the milk content hence causing loss to processors and it is cheating to consumers of
milk and their products because the consumer needs a quality product for the paid price.
2.7.2 Type of Feed and Cattle Breed
The type of feed given to animals as well as the breed of cattle, they have an effect on both
milk composition and milk yield. It is well known that Holstein breeds have the highest milk
yield than other breeds but this milk has the lowest fat content (3.64%), and Jersey has the
highest fat content (4.64%). This is contributed by interests shown by the breeders with some
on the yield and others on milk composition. Nutrition has been reported to affect the milk
yield and composition (Agena et al, 2003) with the increased dry matter intake contributing
14
to increased milk yield and composition of the animal. Milk fat and protein is easily affected
by the nutrition because it is greatly influenced by the diet of the animal. It is recommended
to feed animals at 40:60 concentrate to roughage ratio in order to improve the level of milk
composition percentage and yield as the food provides precursors for milk synthesis
(Salamon, 2006). The dry matter content of the feed is the determinant for the nutrient supply
so they must be fed to the ratio of 3-4% of the animals’ body weight. For the aim of
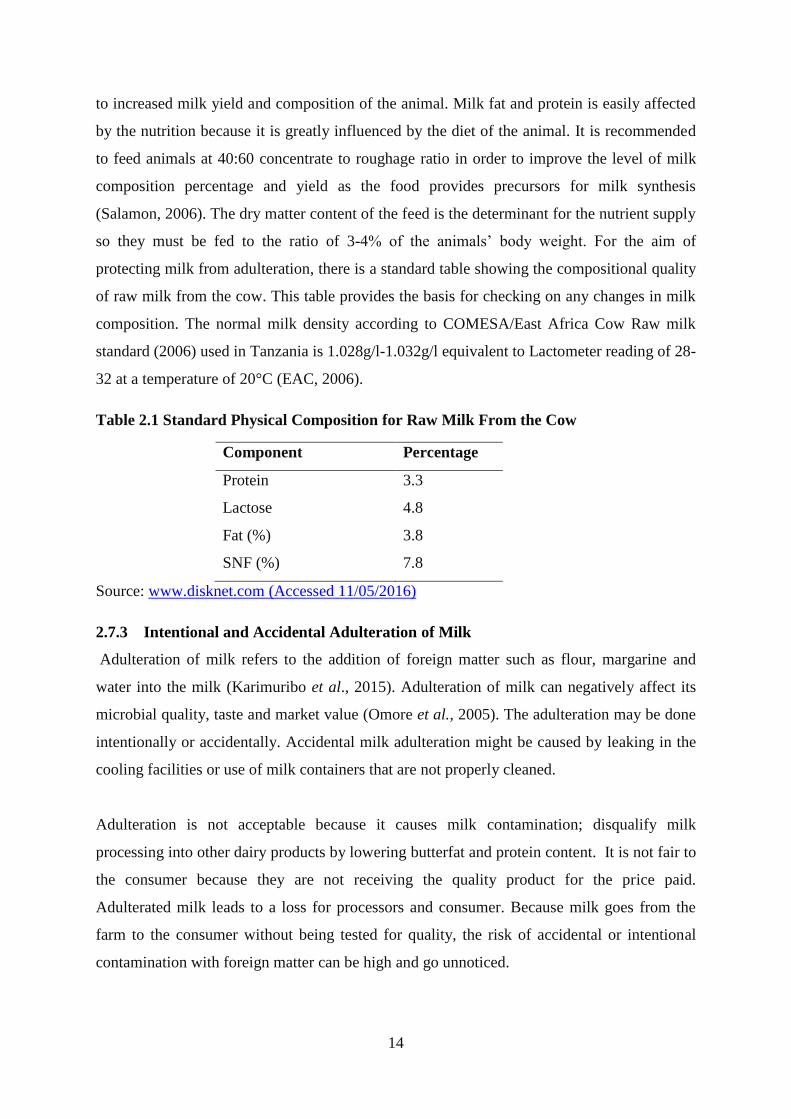
protecting milk from adulteration, there is a standard table showing the compositional quality
of raw milk from the cow. This table provides the basis for checking on any changes in milk
composition. The normal milk density according to COMESA/East Africa Cow Raw milk
standard (2006) used in Tanzania is 1.028g/l-1.032g/l equivalent to Lactometer reading of 28-
32 at a temperature of 20°C (EAC, 2006).
Table 2.1 Standard Physical Composition for Raw Milk From the Cow
Component Percentage
Protein 3.3
Lactose 4.8
Fat (%) 3.8
SNF (%) 7.8
Source: www.disknet.com (Accessed 11/05/2016)
2.7.3 Intentional and Accidental Adulteration of Milk
Adulteration of milk refers to the addition of foreign matter such as flour, margarine and
water into the milk (Karimuribo et al., 2015). Adulteration of milk can negatively affect its
microbial quality, taste and market value (Omore et al., 2005). The adulteration may be done
intentionally or accidentally. Accidental milk adulteration might be caused by leaking in the
cooling facilities or use of milk containers that are not properly cleaned.
Adulteration is not acceptable because it causes milk contamination; disqualify milk
processing into other dairy products by lowering butterfat and protein content. It is not fair to
the consumer because they are not receiving the quality product for the price paid.
Adulterated milk leads to a loss for processors and consumer. Because milk goes from the
farm to the consumer without being tested for quality, the risk of accidental or intentional
contamination with foreign matter can be high and go unnoticed.
15
Intentional adulteration with water and starch can be done to increase the volume or alter the
properties of milk. The most common milk adulteration is the addition of water. Adulteration
can also be done by adding other substances such as starch, flour and margarine. Water is
added with the intention of increasing the volume of the milk (Karimuribo et al, 2015).
Starch, flour and margarine are added so as to increase the density and butterfat content of the
milk (Karimuribo et al, 2015).
There is little information on the quality of milk consumed in most parts of Tanzania. In a
study done by (Orregård, 2013b) in Kenya, results showed increased levels of adulteration as
the milk was moved from the farmer to the consumer. This creates a need to find out the
extent of milk adulteration problem in Hai District Tanzania.
2.7.4 Antibiotic Residues in Milk
Although milk is such an important source of nutrition to people in different age categories,
it sometimes contains an unacceptable high level of antibiotic residues so causes problems to
consumers of such milk and its products (Muhammad, 2014). Antibiotic residues in milk
originate from various sources namely residue of herbicides on feedstuffs, drugs given to cow
orally, by injection or as an intramammary infusion for the treatment of mastitis (Jahed,
2007). This problem has led to the development of various techniques to check the level of
antibiotic residues in milk to name few DelvoTest and CharmEZ methods. Drug residues in
milk apart from other hazardous effects it also affects negatively the health of the consumer
of milk with high level of antibiotic residues. These effects include allergic reactions and
bacterial resistance in the body of humans (Muhammad, 2014).
There are ongoing studies aiming at developing the baseline information to help in Hazard
Analysis and Critical Control Point implementation to ensure the improvement of the milk
quality produced in the developing countries (Grimaud et al., 2009). The HACCP approach
has an important role in preventing and controlling of chemical contamination in milk and
dairy products especially antibiotics in raw milk transported from the producer (Jahed, 2007).
The HACCP concept is dealing with hazard and risk identification, process decomposition,
designation of critical control points, documentation and verification of the programme, is an
alternative to the ISO system (Noordhuizen, 2005) so as to ensure standardised qualified
products. This programme starts at the very early stage of production for dairy products all
16
the way to when the product reaches consumer’s hands. The critical control points are
defined by the producers depending on the structure of their production units.
The use of drugs in dairy cattle farms is common, being used for treatment as well as feed
additives (Navrátilová, 2006a; Karimuribo et al, 2015). The frequent use of antibiotics may
result in drug residues that can be found at different concentration levels in products from
animal origin, such as milk or meat (Khaskheli et al, 2008). In lactating cows, antimicrobial
agents are used mostly for the therapy of mastitis but also of other diseases (e.g. laminitis,
respiratory diseases, metritis) (Navrátilová, 2006b). Also on other farms they use antibiotics
as prophylaxis i.e giving animals’ low dosage of the drug so as to prevent animals from
falling sick (Abebew, 2008).
Mastitis is also the problem for dairy cattle in Tanzania. This forces dairy farmers in
Tanzania to use antibiotics to treat their animals against this disease as well as other diseases
(Mdegela et al, 2009). The common drugs used in dairy farming are β-Lactams such as
penicillin, Tetracyclines such as Oxytetracycline and Sulphonamides such as Sulfamethazine
(Jahed, 2007). A study done by (Navrátilová et al, 2009) in the Czech Republic finds a low
level of Tetracycline residues in milk. Residues of these drugs in milk may be caused by
overdosing the animal or changing the route of administration. An example is giving Fluxinin
intramuscularly instead of intravenously and lack of adherence to the withdrawal period
(NMPF, 2011). In most developing countries record keeping for animals is not well practised
(Orregård, 2013b). This creates a need for rapid methods for testing the presence of
antibiotics in raw milk to guarantee its quality (Kivirand et al, 2015).
The legislative framework for monitoring drug residues in milk is not strong enough in
Tanzania. There is a lack of expertise and equipment for the tests (Kifaro, 2011). This
subjects consumers to high risks through milk consumption which may contain drug residues.
A study done by (Karimuribo et al, 2015) showed the presence of antibiotic residues in milk
sold in Kilosa District.
2.8 Effects of Antibiotic Residues in Milk
2.8.1 Health Effects
The frequent presence of antibiotic residues in food and feed can cause allergy problems to
consumers. It can lead to the development and spread of antibiotic-resistant strains of human
pathogens such as Salmonella typhimurium which has been documented in transferring the
17
resistance from animals to people (Clau et al, 2013). The resistance renders antibiotics
ineffective in the treatment of disease once a person falls sick. In countries that are silent
about drug residues in milk, exposes consumers for products with antibiotics into the great
risk of adverse health effects (AbdulSamad et al 2014). In America, the problem of drug
residues in milk was very minimal. Among the 357 milk samples analysed for drug residues,
only one sample had β-Lactam violative residues. This was contributed by immediate and
severe penalties at milk collection centres (FDA 1999). Consumers need to be protected from
eating food with an unaccepted level of antibiotic residues in developing countries. In order
to protect consumers of milk and milk products, research work needs to be done to assess the
level of antibiotic residues on the food especially those of animal’s origin including milk.
2.8.2 Economic Effects
The resulting decrease in milk quality and supply negatively impacts processors and
consumers along the dairy value chain (Doyle et al, 2015). Processors dealing with the
production of fermented products are the most affected. Antibiotics are known to interfere
with the manufacture of these dairy products through inadequate curdling of milk and partial
or total inhibition of starter culture growth in making fermented dairy products (Jones et al,
2009) These products require use of starter cultures which are living bacteria and the
presence of antibiotics in the milk will negatively affect flavour of the product. Milk that
contains antibiotic residues causes problems of acidification and ripening of cheese which
leads to loss to the processor. A study by (Adetunji, 2011) in Nigeria proves the failure of
cheese making by the processors due to the presence of microbial inhibition by antibiotics in
the milk used as raw materials in cheese making. The residues cause the production of poor
products that were discarded and hence were a loss to the processor.
2.8.3 The Microbiological Quality of Milk
Microbial quality of milk refers to the cleanness of milk. This is defined by a number of
bacteria present in milk. The high bacterial count as well as the presence of pathogenic
bacteria in milk not only degrades the milk quality and shelf-life of milk or milk related
products but also poses a serious health threat to consumers (Yuen et al, 2012). Milk being a
wholesome food with high nutritive value is often prone to early contamination and spoilage
if not handled properly (Minj and Behera, 2012). The fewer the number of micro-organisms
in milk the higher the quality of milk. The microorganism may originate from the cow or the
environment. Examples of these are lactic acid bacteria and mastitis causing bacteria. The
lactic acid bacteria convert milk sugar i.e lactose into lactic acid. The common spoilage
18
bacteria in milk multiply at the temperature range of 20°C - 25°C. The rate of multiplication
for microorganisms can be slowed down through cooling the milk and keeping it at the
temperature of 4°C and below.
The microbiological quality of milk is affected by storage temperatures and time taken in
milk transporting. The longer the time taken to transport the milk, the more likely the milk is
going to spoil. The rate of cooling and milk handling procedures during and after milking are
also important in determining the quality of milk. Tanzania uses the standards as described by
the Tanzania Bureau of Standards and by the East African Standards and COMESA (EAC,
2006). These state that quality of raw milk is poor if it has a coliform count of more than 50
000 CFU/ml and a total bacterial count of more than 2 million CFUs/ml.
In ensuring adherence to clean milk production and consumption, there are set standards of
legal limits of bacteria in milk for each country. In Tanzania standards used for grading milk
are as per East Africa Community Standards (EAS 2007). The legal limits are very important
to be observed as it provides protection to the health of consumers for milk and other dairy
products. The standards are universal with the difference in legal limits. In setting these
standards technological level and economic constraints of the region is taken into
consideration (Jensen et al, 2010). The EU countries are the leading with the highest
microbiology quality standard of (<100,000 CFU/ml) for TBC in raw milk (Bytyqi et al,
2011 ; Berry, 2004) of which this is contributed by the presence of all the required resources
for clean milk production when compared to the developing countries.
Many types of bacteria live harmlessly in the digestive systems of people and animals. For
example, E.coli is one of them, but some strains of E.coli such as E.coli O157:H7, produce
toxins that can cause serious illness (Pennington, 2005). Studies on milk quality have been
conducted in several parts of Tanzania: Arusha (Ngasala et al, 2015), Njombe (Mdegela et al,
2009), Morogoro (Karimuribo et al, 2015) and Tanga( Swai and Schoonman, 2011). This
study aimed to add to the available information so as to establish the status of milk quality all
over the country hence allow stake holders in developing the strategies for improvement in
the dairy sector.
In a study by ( Mdegela et al, 2009) in Tanzania, milk microbiological quality i.e coliforms
and lactic acid bacteria from small-scale farmers in Mvomero and Njombe Districts was
19
found to be between 1.1 million and 2 million CFUs/ml which was within acceptable levels.
In another study by (Omore et al, 2004) levels of contamination were found to be high in
milk samples collected in Mwanza and Dar es Salaam Regions. The reason for this was a
high level of milk contamination due to milk adulteration in Mwanza and Dar-es-Salaam
Regions.
2.9 Foodborne Pathogens in Milk and Public Health Implications
2.9.1 Milk-Borne Pathogens
As milk is among the most valuable and nutritious food commodities for humans and young
mammals, it also provides an excellent growing medium for bacteria, which once they get
access to milk will multiply rapidly and spoil the milk or render it unsafe for human
consumption or unfit for further processing (Welearegay et al, 2012). The presence of the
micro-organisms in milk is contributed by unhygienic handling of milk and milk products.
Microbial contamination of milk not only causes spoilage but can lead to illness as a result of
foodborne pathogens (Ngasala et al, 2015). A study by (Mdegela et al, 2009) showed the
presence of Campylobacter jejuni in milk samples collected from small-scale dairy farmers
in Njombe and Mvomero District in Tanzania. Campylobacter jejuni causes gastroenteritis in
humans.
There are a number of other microorganisms that are of public importance to the human
health. They are summarised in table 2.2 with their public significance to the consumer’s
health. These health risk micro-organisms can be prevented through milk pasteurisation so as
to protect the health of consumers. Coliforms enter milk through faecal and environmental
contamination. Some like E.coli can be pathogenic.
2.9.2 Escherichia Coli
This bacterium is classified under the family Enterobacteriaceae. They are normal flora in the
guts of human, cattle and sheep where it produces vitamin K and protects the host animal
from digestive infection by suppressing and preventing growth and colonisation of the gut by
pathogenic bacteria. E.coli is able to live with or without Oxygen and can use different
sources for food requirements (Theodor, 1982). Contamination of the milk and other food is
done through faecal-oral route. A study was done in Indonesia by (Street and Bogor, 2013)
and in Khartoum by (Yuen et al, 2012) shows a high load of contamination of milk and milk
products by E. coli. This imposes high health risk to the consumers of milk since there is an
20
evidence of the presence of pathogenic E coli strain. Another study by (Kumar and Prasad,
2010) in India found the highest level of contamination of milk samples collected from
vendors (26%) followed by the dairy farm (20%) and lastly house milk (6.6%), this may be
due to unhygienic handling of milk along the value chain.
Studies have proved that not all types of E coli are good anymore, there is the presence of a
pathogenic strain of E.coli that is (E. coli 0157:H7) with a worldwide spread in almost all
continents and is of public health importance (Mertz, 2003). This pathogenic strain was
identified in 1975 and seven years later i.e in 1982 was found to cause bloody diarrhoea
infection in human (Theodor, 1982). The disease caused by this strain has the incubation
period ranging from 1-16 days and is common in young, elderly and immune-compromised
people (University, 2009). The disease is associated with the consumption of contaminated
and unpasteurised milk. In Washington it was found that 44% of identified cases were
laboratory confirmed to be associated with E. coli 0157:H7 infection due to consumption of
raw milk (CDC, 2007). Also, the study done in Pakistan by (Hussaina et al, 2014) shows the
E. coli counts of Dahi (yoghurt) were amazingly higher counted up to 212.16±17.54×10³ and
189.35±3.42×10³ for the poor and better sanitation areas, respectively. This creates the need
for the further studies in Tanzania to establish the status of milk contamination levels as milk
is commonly consumed by young and people who are immune-compromised.
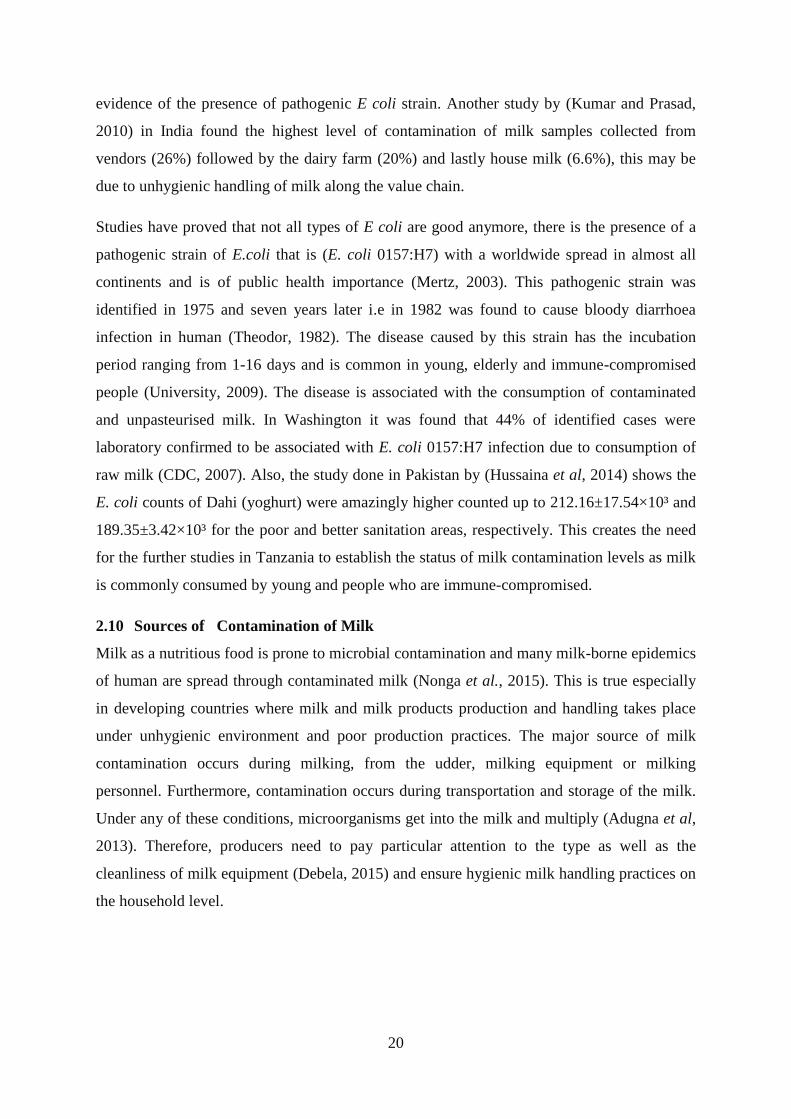
2.10 Sources of Contamination of Milk
Milk as a nutritious food is prone to microbial contamination and many milk-borne epidemics
of human are spread through contaminated milk (Nonga et al., 2015). This is true especially
in developing countries where milk and milk products production and handling takes place
under unhygienic environment and poor production practices. The major source of milk
contamination occurs during milking, from the udder, milking equipment or milking
personnel. Furthermore, contamination occurs during transportation and storage of the milk.
Under any of these conditions, microorganisms get into the milk and multiply (Adugna et al,
2013). Therefore, producers need to pay particular attention to the type as well as the
cleanliness of milk equipment (Debela, 2015) and ensure hygienic milk handling practices on
the household level.
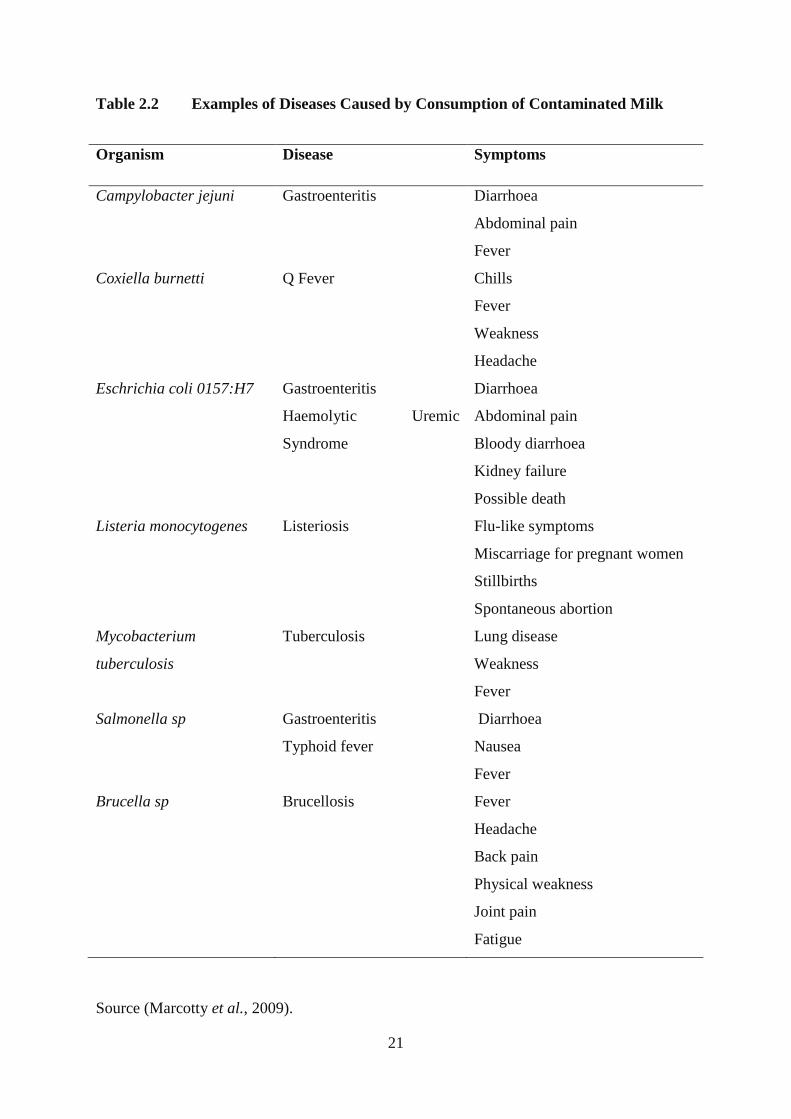
21
Table 2.2 Examples of Diseases Caused by Consumption of Contaminated Milk
Organism Disease Symptoms
Campylobacter jejuni Gastroenteritis Diarrhoea
Abdominal pain
Fever
Coxiella burnetti Q Fever Chills
Fever
Weakness
Headache
Eschrichia coli 0157:H7 Gastroenteritis
Haemolytic Uremic
Syndrome
Diarrhoea
Abdominal pain
Bloody diarrhoea
Kidney failure
Possible death
Listeria monocytogenes Listeriosis Flu-like symptoms
Miscarriage for pregnant women
Stillbirths
Spontaneous abortion
Mycobacterium
tuberculosis
Tuberculosis Lung disease
Weakness
Fever
Salmonella sp Gastroenteritis
Typhoid fever
Diarrhoea
Nausea
Fever
Brucella sp Brucellosis Fever
Headache
Back pain
Physical weakness
Joint pain
Fatigue
Source (Marcotty et al., 2009).

22
2.10.1 The Cow
Milk from a healthy cow has a low bacterial count. A cow sheds microorganisms into milk
when it is sick. Examples of microorganisms include Streptococcus agalactiae and
Staphylococcus aureus which are found in the infected udder of mastitic cows. Milk from a
sick cow should not be mixed with the one from healthy cows and sick cows should be
milked last to avoid contamination of the clean milk.
2.10.2 The Milker
Milkers can transmit contagious diseases such as Tuberculosis and Brucellosis. They can
transmit these diseases through their hands, hair, clothing and aerosols from sneezing or
coughing. To avoid contamination through contact with hands milkers should wash their
hands with detergent and dip them in disinfectant after milking each animal.
2.10.3 The Milking Environment
This includes the skin of the animal, feeds, containers and water facilities. It is important to
keep the environment around the dairy animals as clean as possible. Also, bedding materials
must be kept dry and clean at all times (Maunsell and Donovan, 2008).
2.10.4 Milk containers
When containers used to store milk after milking are not thoroughly cleaned they harbour
pathogens and spoilage microorganisms which will contaminate the milk.
2.11 The Regulatory Framework for Dairy Products in Tanzania
These are Tanzania Bureau of Standards (TBS), Tanzania Dairy Board (TDB) and Tanzania
Food and Drugs Authority (TFDA) (Goodluck .C Mchau, 2011)and these authorities work
together in inspecting the imported dairy products in the country. The Tanzania Bureau of
Standards (TBS) and Tanzania Food and Drugs Authority (TFDA), ensures alignment with
the quality and laws set for imported dairy products ( Msuya, 2012).The products are
inspected for wholesomeness by three authorities. The law states that imported products must
be free from pathogenic microorganisms. There is no reported disease outbreak in Tanzania
caused by consumption of contaminated milk.
The law prohibits informal milk marketing, but due to weak institutional support, people are
not adhering to this law (Kim et al, 2009 ; Kifaro, 2011). Milk in Tanzania is commonly sold
in raw and in an unpasteurised form (Kurwijila and Mtenga, 2011). There are both
pasteurised and unpasteurized milk products in the milk market. Unpasteurized milk products
are commonly sold in street kiosks. Pasteurised milk is sold in supermarkets and big shops.
23
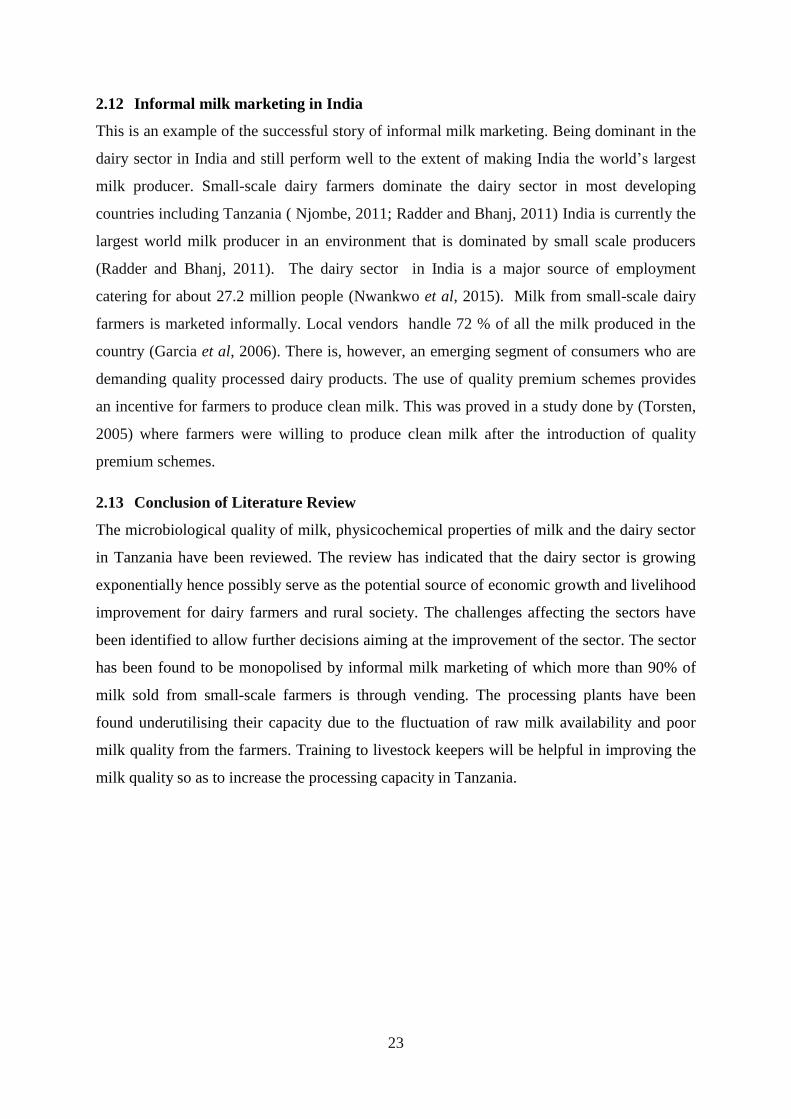
2.12 Informal milk marketing in India
This is an example of the successful story of informal milk marketing. Being dominant in the
dairy sector in India and still perform well to the extent of making India the world’s largest
milk producer. Small-scale dairy farmers dominate the dairy sector in most developing
countries including Tanzania ( Njombe, 2011; Radder and Bhanj, 2011) India is currently the
largest world milk producer in an environment that is dominated by small scale producers
(Radder and Bhanj, 2011). The dairy sector in India is a major source of employment
catering for about 27.2 million people (Nwankwo et al, 2015). Milk from small-scale dairy
farmers is marketed informally. Local vendors handle 72 % of all the milk produced in the
country (Garcia et al, 2006). There is, however, an emerging segment of consumers who are
demanding quality processed dairy products. The use of quality premium schemes provides
an incentive for farmers to produce clean milk. This was proved in a study done by (Torsten,
2005) where farmers were willing to produce clean milk after the introduction of quality
premium schemes.
2.13 Conclusion of Literature Review
The microbiological quality of milk, physicochemical properties of milk and the dairy sector
in Tanzania have been reviewed. The review has indicated that the dairy sector is growing
exponentially hence possibly serve as the potential source of economic growth and livelihood
improvement for dairy farmers and rural society. The challenges affecting the sectors have
been identified to allow further decisions aiming at the improvement of the sector. The sector
has been found to be monopolised by informal milk marketing of which more than 90% of
milk sold from small-scale farmers is through vending. The processing plants have been
found underutilising their capacity due to the fluctuation of raw milk availability and poor
milk quality from the farmers. Training to livestock keepers will be helpful in improving the
milk quality so as to increase the processing capacity in Tanzania.
24
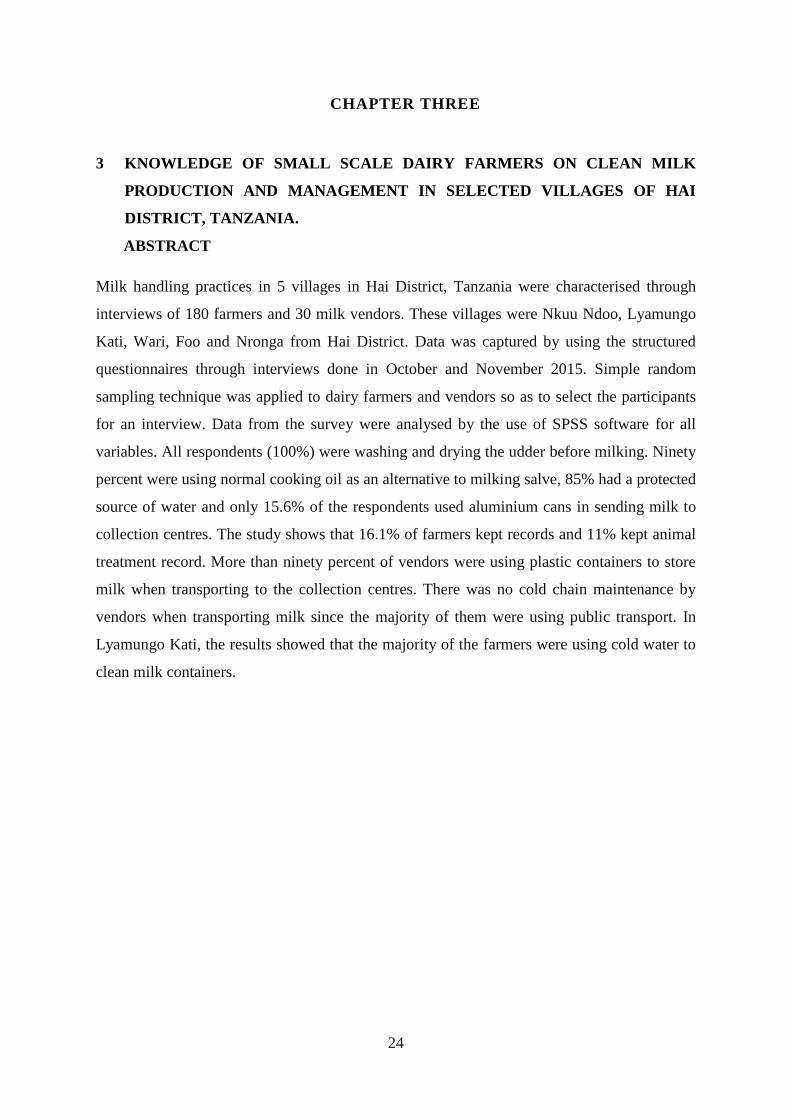
CHAPTER THREE
3 KNOWLEDGE OF SMALL SCALE DAIRY FARMERS ON CLEAN MILK
PRODUCTION AND MANAGEMENT IN SELECTED VILLAGES OF HAI
DISTRICT, TANZANIA.
ABSTRACT
Milk handling practices in 5 villages in Hai District, Tanzania were characterised through
interviews of 180 farmers and 30 milk vendors. These villages were Nkuu Ndoo, Lyamungo
Kati, Wari, Foo and Nronga from Hai District. Data was captured by using the structured
questionnaires through interviews done in October and November 2015. Simple random
sampling technique was applied to dairy farmers and vendors so as to select the participants
for an interview. Data from the survey were analysed by the use of SPSS software for all
variables. All respondents (100%) were washing and drying the udder before milking. Ninety
percent were using normal cooking oil as an alternative to milking salve, 85% had a protected
source of water and only 15.6% of the respondents used aluminium cans in sending milk to
collection centres. The study shows that 16.1% of farmers kept records and 11% kept animal
treatment record. More than ninety percent of vendors were using plastic containers to store
milk when transporting to the collection centres. There was no cold chain maintenance by
vendors when transporting milk since the majority of them were using public transport. In
Lyamungo Kati, the results showed that the majority of the farmers were using cold water to
clean milk containers.
25
3.1 INTRODUCTION
Studies have shown that below standard hygienic practices in milking by small-scale dairy
farmers together with ineffective farm management lead to spoilage and cause great
economic loss to the industry (Yuen et al, 2012). Since small-scale dairy farmers are primary
sources of milk production in most developing countries (Kurwijila, 2012), there is a need to
prevent or minimise the entry and subsequent growth of microorganisms in milk (Welearegay
et al, 2012). The prevention measures should start from the very first point of production.
Prevention and minimisation of milk contamination with the bacteria can be attained through
observing the provided standard management procedures for dairy animals as well as proper
milking and milk handling practices.
In Tanzania the recommended practices are udder cleaning with clean warm water, drying of
the udder with clean dry disposable towel, foremilk stripping for mastitis testing and removal
of bacteria that were inside the teat canal, application of milk salve, milking and post-milking
teat dipping to protect the teats from infection as the teat canals remains open soon after
milking.
Interviews conducted show that most farmers do not follow these standard procedures. In
pastoralists society as reported (Brown, 2015) farmers were not cleaning the udder because
of lack of knowledge. This resulted in high levels of bacteria in their milk. In a similar study
in Tanga (Hyera, 2014), small-scale dairy farmers were cleaning the udder before milking but
they were not following the instructed standard procedures for milking such as fore striping,
mastitis testing and post teat dipping after milking the animals. Farmers in the study area
were cleaning the udder with clean water as the water supply was not a problem all year
round and none of them reported that they carry out mastitis testing and post-milking teat
dipping.
Proper milk production and handling are important so as to maintain nutritional quality and
safety (Keskin and Gulsunoglu, 2012). Since milk requires extra care in handling at all points
along the value chain, this study was carried out to establish the status on the milk production
and handling knowledge from small-scale dairy farmers so as to create a platform for
improvements and so ensure that milk produced is of highest hygienic quality.
26
3.2 MATERIALS AND METHODS
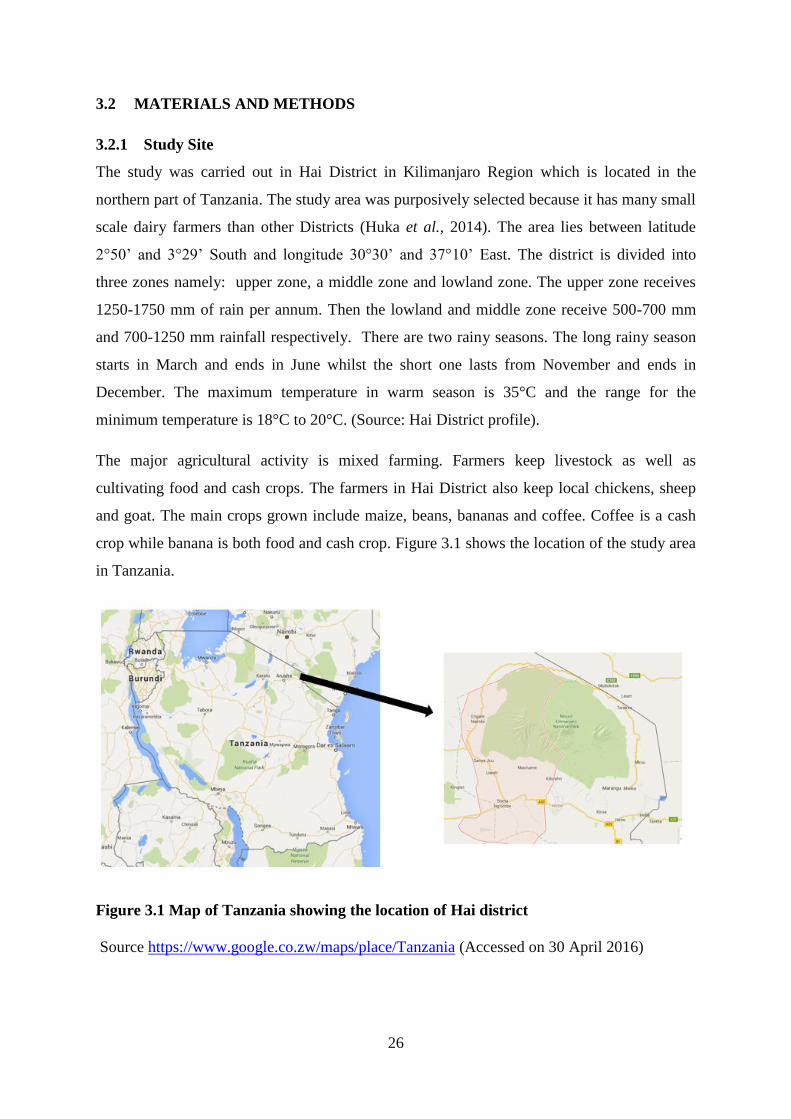
3.2.1 Study Site
The study was carried out in Hai District in Kilimanjaro Region which is located in the
northern part of Tanzania. The study area was purposively selected because it has many small
scale dairy farmers than other Districts (Huka et al., 2014). The area lies between latitude
2°50’ and 3°29’ South and longitude 30°30’ and 37°10’ East. The district is divided into
three zones namely: upper zone, a middle zone and lowland zone. The upper zone receives
1250-1750 mm of rain per annum. Then the lowland and middle zone receive 500-700 mm
and 700-1250 mm rainfall respectively. There are two rainy seasons. The long rainy season
starts in March and ends in June whilst the short one lasts from November and ends in
December. The maximum temperature in warm season is 35°C and the range for the
minimum temperature is 18°C to 20°C. (Source: Hai District profile).
The major agricultural activity is mixed farming. Farmers keep livestock as well as
cultivating food and cash crops. The farmers in Hai District also keep local chickens, sheep
and goat. The main crops grown include maize, beans, bananas and coffee. Coffee is a cash
crop while banana is both food and cash crop. Figure 3.1 shows the location of the study area
in Tanzania.
Figure 3.1 Map of Tanzania showing the location of Hai district
Source https://www.google.co.zw/maps/place/Tanzania (Accessed on 30 April 2016)
27
3.2.2 Study Design
Five villages included in this study were Nkuu Ndoo, Lyamungo Kati, Wari, Foo and
Nronga. A total of 180 farmers and 30 vendors were interviewed and data were collected
from the participants included the study. Simple random sampling was carried out to select
farmers and for the vendors, the available ones were included in the study.
3.2.3 Secondary Data and Other Documents
Secondary data concerning a number of dairy cattle per ward was collected from the
Livestock Office at District Headquarters. For the prevalence of diseases, the data was
extracted from the monthly report submitted to the office of the District Veterinary Officer at
District Headquarters in 2014/2015 year period. Data from the Department of Health was
reviewed to assess the prevalence of milk-borne diseases in the District. This was helpful in
providing important information that farmers might lack and also in cross checking the
validity of collected data. Due to the fact that most people in the study area understand
Kiswahili language, then the questionnaires was translated into Kiswahili for effective data
collection.
3.2.4 Key Informant Interviews
Key informants involved in the study were extension officers at the District, ward and village
levels, dairy input suppliers, village leaders and milk products processors so as to help in
generating overview information concerning the title of the study in the study area.
3.2.5 Focus Group Discussions
Successful dairy farmers in the selected villages were interviewed. The identification of these
farmers was successfully done with the help from extension staff employed by the Ministry
of Fisheries and Livestock Development in the selected villages. Only those participants who
were willing to provide the required information were interviewed.
3.2.6 Sampling Strategy
Purposive random sampling was used to select wards with highest milk production.
Thereafter villages with milk collection centres were selected. Milk vendors and selling point
that buy milk from the interviewed farmers were included in the study. Sample size
determination was adopted from http://www.raosoft.com/samplesize.html. With the
assumption of 5% margin error, 95% confidence interval, 3654population size and 85%
response of distribution, a sample size of 180 farmers was arrived at. Vendors have selected
28
according to their availability in the study area and 30 of them participated. The total sample
size for the study was therefore 210.
3.2.7 Data Collection
Table 3.1 summarises the questions that were posed to the farmers. A semi-structured
questionnaire was used to extract the required information from the participants. Information
collected includes milking procedures preparations, milking facilities availability, use of
drugs and hygienic milk handling practices. The questionnaire used is attached at appendix
section.
3.2.8 Data Management and Analysis
Quantitative data from questionnaires were analysed by using SPSS Version 16.0.
Descriptive statistics especially frequencies and percentages were used to determine the
magnitude and distributions of variables. Data cleaning, checking and capturing in the
questionnaires was done by use of SPSS 16.
3.3 RESULTS
3.3.1 Focus Groups and Key Informants Discussions Results
Discussion with the two groups of people indicates that majority of farmers in Hai District
were knowledgeable on clean milk production and proper management of dairy animals. The
supply of concentrates, extension and veterinary services were ensured because there were
extension officers at all villages who provide veterinary and other services were easily
available to farmers whenever in need. Treatment administration was done by extension
officers and farmers were instructed to adhere to the withdrawal period before start selling
milk from animals on treatment. Milk processing units were checking milk quality through
the use of lactometer to check for adulteration with water, they were not doing any other test
on milk like alcohol, Resaruzin and Clot-On Boiling tests.
3.3.2 Farmers
3.3.2.1 Social Demographic Characteristics of Respondents Farmers
The study involved 210 respondents of which 180 were farmers and 30 were vendors.
Farmers interviewed were those that sell their milk in the milk collection centres available in
the respective villages. Results from questionnaires showed that majority of the participants
were female (77.8%), married (86.1%) with primary school level of education (65.0%). Their
age was between 31-40 years (34.4%) and they were staying at their own houses (88.9%).
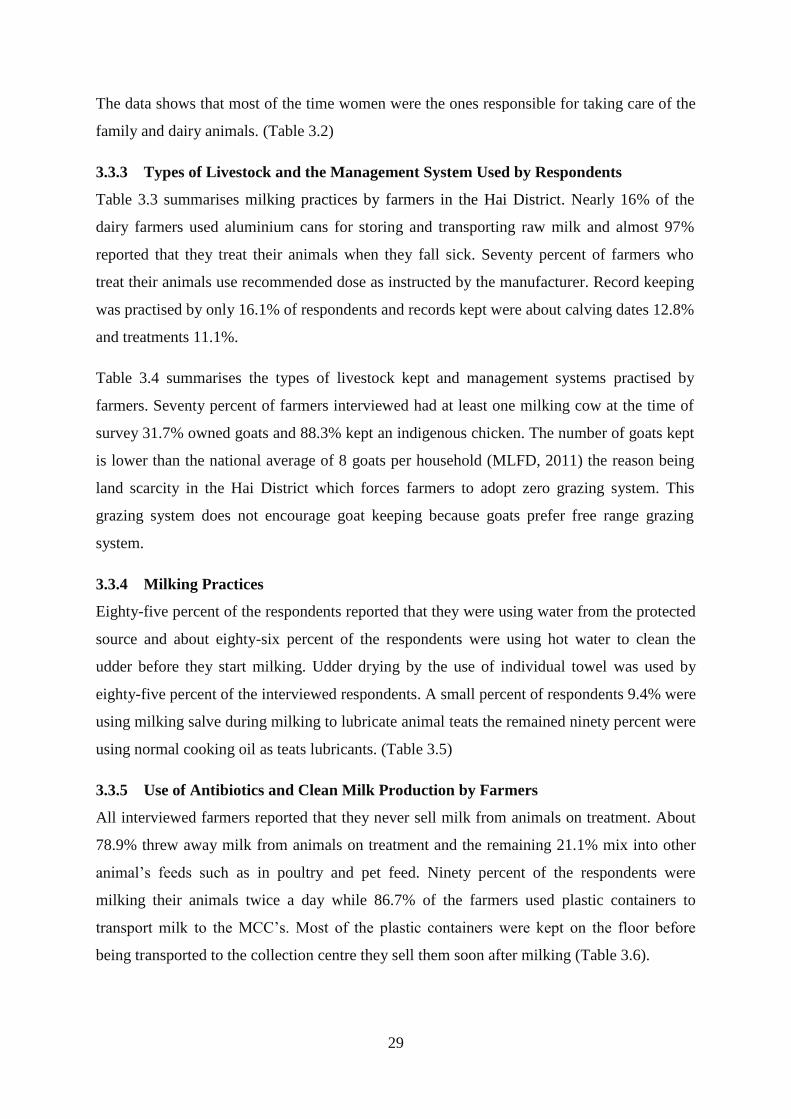
29
The data shows that most of the time women were the ones responsible for taking care of the
family and dairy animals. (Table 3.2)
3.3.3 Types of Livestock and the Management System Used by Respondents
Table 3.3 summarises milking practices by farmers in the Hai District. Nearly 16% of the
dairy farmers used aluminium cans for storing and transporting raw milk and almost 97%
reported that they treat their animals when they fall sick. Seventy percent of farmers who
treat their animals use recommended dose as instructed by the manufacturer. Record keeping
was practised by only 16.1% of respondents and records kept were about calving dates 12.8%
and treatments 11.1%.
Table 3.4 summarises the types of livestock kept and management systems practised by
farmers. Seventy percent of farmers interviewed had at least one milking cow at the time of
survey 31.7% owned goats and 88.3% kept an indigenous chicken. The number of goats kept
is lower than the national average of 8 goats per household (MLFD, 2011) the reason being
land scarcity in the Hai District which forces farmers to adopt zero grazing system. This
grazing system does not encourage goat keeping because goats prefer free range grazing
system.
3.3.4 Milking Practices
Eighty-five percent of the respondents reported that they were using water from the protected
source and about eighty-six percent of the respondents were using hot water to clean the
udder before they start milking. Udder drying by the use of individual towel was used by
eighty-five percent of the interviewed respondents. A small percent of respondents 9.4% were
using milking salve during milking to lubricate animal teats the remained ninety percent were
using normal cooking oil as teats lubricants. (Table 3.5)
3.3.5 Use of Antibiotics and Clean Milk Production by Farmers
All interviewed farmers reported that they never sell milk from animals on treatment. About
78.9% threw away milk from animals on treatment and the remaining 21.1% mix into other
animal’s feeds such as in poultry and pet feed. Ninety percent of the respondents were
milking their animals twice a day while 86.7% of the farmers used plastic containers to
transport milk to the MCC’s. Most of the plastic containers were kept on the floor before
being transported to the collection centre they sell them soon after milking (Table 3.6).
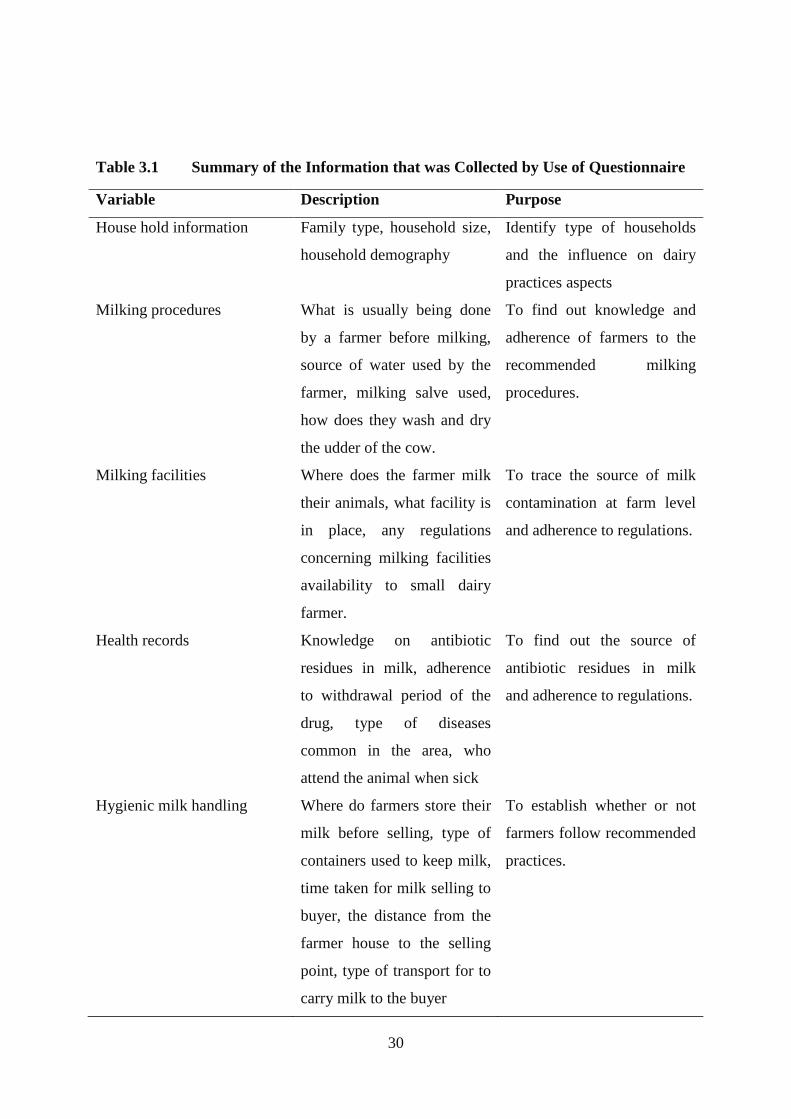
30
Table 3.1 Summary of the Information that was Collected by Use of Questionnaire
Variable Description Purpose
House hold information Family type, household size,
household demography
Identify type of households
and the influence on dairy
practices aspects
Milking procedures What is usually being done
by a farmer before milking,
source of water used by the
farmer, milking salve used,
how does they wash and dry
the udder of the cow.
To find out knowledge and
adherence of farmers to the
recommended milking
procedures.
Milking facilities Where does the farmer milk
their animals, what facility is
in place, any regulations
concerning milking facilities
availability to small dairy
farmer.
To trace the source of milk
contamination at farm level
and adherence to regulations.
Health records Knowledge on antibiotic
residues in milk, adherence
to withdrawal period of the
drug, type of diseases
common in the area, who
attend the animal when sick
To find out the source of
antibiotic residues in milk
and adherence to regulations.
Hygienic milk handling Where do farmers store their
milk before selling, type of
containers used to keep milk,
time taken for milk selling to
buyer, the distance from the
farmer house to the selling
point, type of transport for to
carry milk to the buyer
To establish whether or not
farmers follow recommended
practices.
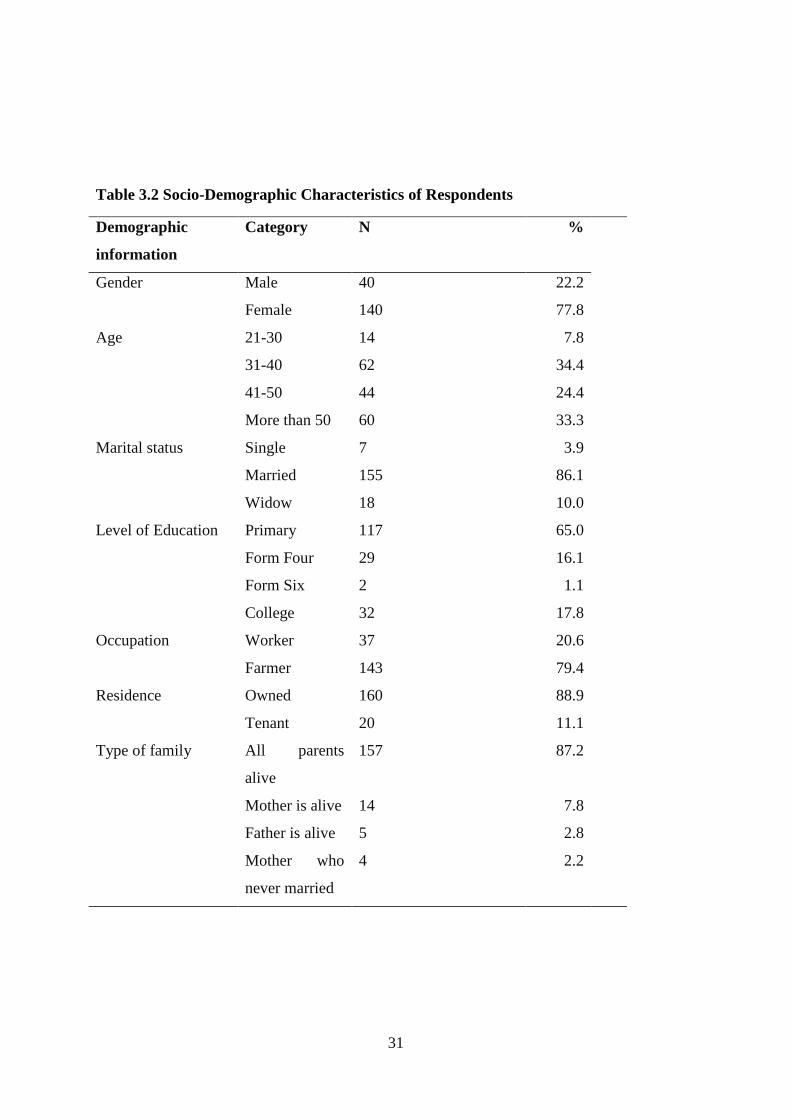
31
Table 3.2 Socio-Demographic Characteristics of Respondents
Demographic
information
Category N %
Gender Male 40 22.2
Female 140 77.8
Age 21-30 14 7.8
31-40 62 34.4
41-50 44 24.4
More than 50 60 33.3
Marital status Single 7 3.9
Married 155 86.1
Widow 18 10.0
Level of Education Primary 117 65.0
Form Four 29 16.1
Form Six 2 1.1
College 32 17.8
Occupation Worker 37 20.6
Farmer 143 79.4
Residence Owned 160 88.9
Tenant 20 11.1
Type of family All parents
alive
157 87.2
Mother is alive 14 7.8
Father is alive 5 2.8
Mother who
never married
4 2.2

32
Table 3.3 Milking Practices by Farmers in the Hai District
Parameter Category N %
Using aluminium
cans
Yes
No
28
152
15.6
84.4
Record keeping Yes
No
29
151
16.1
83.9
Amount of milk
produced
Yes
No
1
179
0.6
99.4
Heat period Yes
No
15
165
8.3
91.7
Calving dates Yes
No
23
157
12.8
87.2
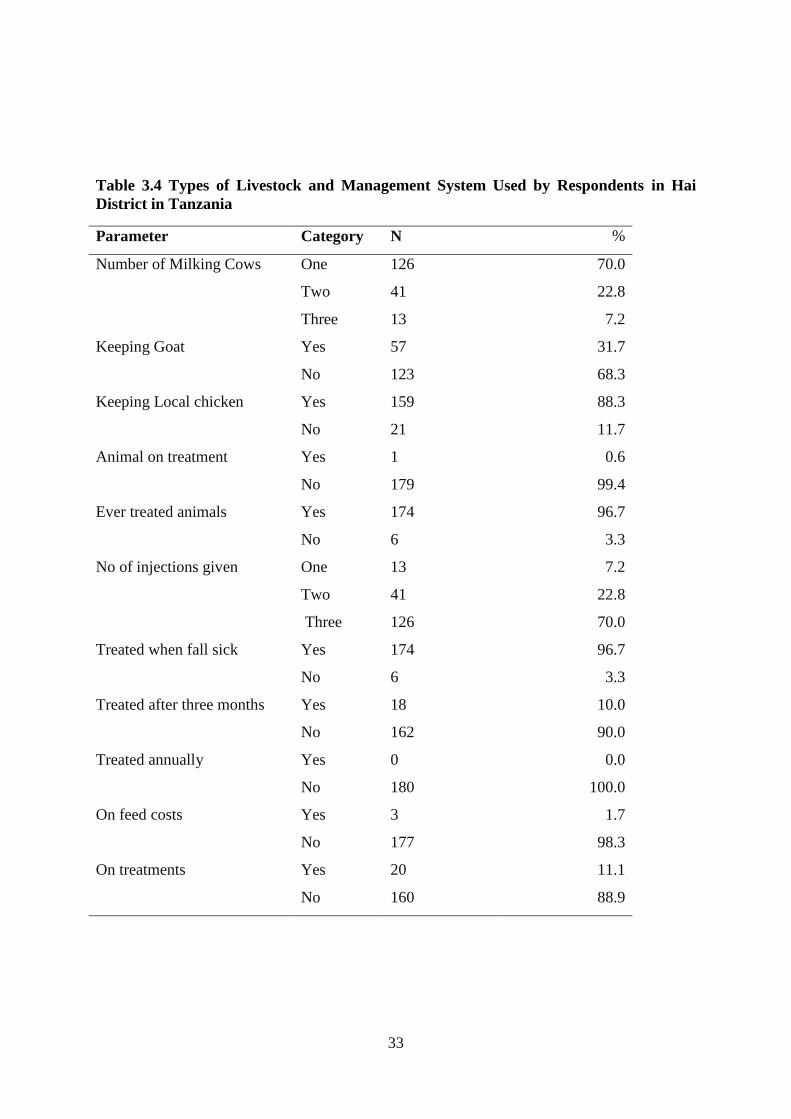
33
Table 3.4 Types of Livestock and Management System Used by Respondents in Hai
District in Tanzania
Parameter Category N %
Number of Milking Cows
One 126 70.0
Two 41 22.8
Three 13 7.2
Keeping Goat Yes 57 31.7
No 123 68.3
Keeping Local chicken Yes 159 88.3
No 21 11.7
Animal on treatment Yes 1 0.6
No 179 99.4
Ever treated animals
Yes 174 96.7
No 6 3.3
No of injections given One 13 7.2
Two 41 22.8
Three 126 70.0
Treated when fall sick Yes 174 96.7
No 6 3.3
Treated after three months Yes 18 10.0
No 162 90.0
Treated annually Yes 0 0.0
No 180 100.0
On feed costs Yes 3 1.7
No 177 98.3
On treatments Yes 20 11.1
No 160 88.9
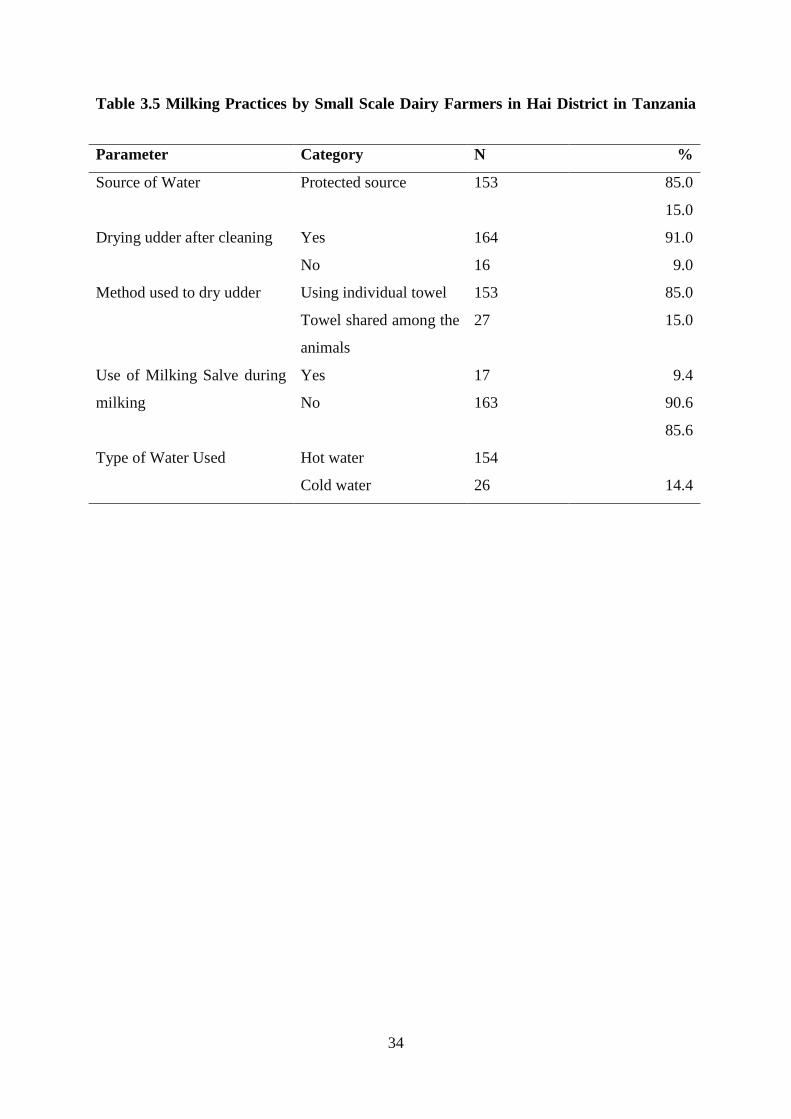
34
Table 3.5 Milking Practices by Small Scale Dairy Farmers in Hai District in Tanzania
Parameter Category N %
Source of Water Protected source 153 85.0
15.0
Drying udder after cleaning Yes 164 91.0
No 16 9.0
Method used to dry udder Using individual towel 153 85.0
Towel shared among the
animals
27 15.0
Use of Milking Salve during
milking
Yes 17 9.4
No 163 90.6
Type of Water Used
Hot water
154
85.6
Cold water 26 14.4

35
Table 3.6 Use of Antibiotics and Milk Hygiene Practices by Small Scale Farmers at Hai
District in Tanzania
Parameter Category N %
What do you do with milk from
treated animals
Throw away 142 78.9
Mix in other animal feeds 38 21.1
Milk mixing from different cows Yes 54 30.0
No 126 70.0
Milking frequency Twice 178 98.9
Thrice 2 1.1
Containers used for milk storage Plastic container 156 86.7
Aluminium cans 24 13.3
Cleaning of containers Cold water 44 34.4
Hot water 136 75.6
Milk storage In the fridge 18 10.0
On the floor 162 90.0
Milk selling time Soon after milking 157 87.2
12 hours after milking 23 12.8
Attendance to any course on clean
milk production
Yes 10 5.6
94.4
Do farmers know the source of
contamination to milk
Yes 156 86.7
13.3

36
3.3.6 Quality of Milk from Vendors
A total of 30 vendors were interviewed in the study. Eighty percent of vendors got their milk
from farmers and the rest from milk collection centres. In transporting milk 53.3% used jerry
cans, 40% bucket and 6.7% Aluminium cans. In ensuring containers cleanness 76.7% of
vendors used hot water and the rest used cold water to clean their containers. Ninety percent
of vendors were using public transport to carry their milk to the consumers hence, there was
no cold chain maintenance. Use of plastic buckets and plastic jerries containers on
transporting milk to the selling points was the common practise to the vendors in the study
area. (Table 3.7)

37
Table 3.7 Summary of Responses by Vendors to How they Handle Milk
Parameter Category N %
Source of milk you sell Farmers brought milk to
vendors
26 86.7
Bought from milk
collection centre
4 13.3
Number of farmers
supplying milk to vendors
1-10 9 30.0
11-20 15 50.0
21-30 2 20.0
Milk storage containers Plastic buckets 12 40.0
Plastic jerries 16 53.3
Aluminium cans 2 6.7
Milk containers cleanness Washing milk containers
with hot water
23 76.7
Washing milk containers
with cold water
7 23.3
Type of transport used Public 27 90.0
Private 3 10.0
Time taken to finish
selling the milk
One hour 14 46.7
Two hours 11 36.7
Three hours 5 16.7
Litres sold per day Less than fifty litres 7 23.3
Fifty litres 8 26.7
More than fifty litres 15 50.0
Measures for adulterated
milk
Warning the farmer 26 86.7
Reporting to collection
centres
4 13.3
38
3.4 DISCUSSION
The results of the current study show that the majority of the farmers were aware of the
requirements for clean milk production. Dairy farming in this area has been practised for
more than hundred years and also clean water supplies were not a limiting factor to dairy
production. Clean water is a major requirement for clean milk production (Perkins et al.,
2009). Water is required for different operations in dairying including for animal to drink,
cleaning of animal houses, cleaning of the udder and cleaning of milk containers. The
knowledge of dairy cattle management has been passed from one generation to the next with
little input from extension services from the government. A source of support for the
extension services could be the milk collection centres and mini-processing centres for
different dairy products that have an interest in providing knowledge to farmers on how clean
milk is produced. These collection centres are farmer’s owned and they process different
dairy products such as cheese, butter, yoghurt and fermented milk.
The use of plastic containers for milk storage by farmers and vendors can compromise milk
quality since plastic can easily crack and these cracks harbour spoilage bacteria and are
difficult to clean. Stainless steel and aluminium cans are advised in milk storage as they are
easily cleaned. The large proportion of farmers who were in the active working age group is
a good sign of effective industry since dairying has high labour requirements for feeding
animals, calf/heifer management, milking and marketing.
Udder washing with warm water from protected source and then drying the udder with
disposable paper towels ensures clean milk production. Since farmers are not paid on the
basis of mastitis, they were not practising fore milking mastitis testing and post teat dipping
practices. There are no regulations concerning special milking facilities such as holding
structures that would be compulsory to the farmer as a regulatory requirement. Farmers had
no milking facilities like separated milking parlour to milk their animals from and instead
they were milking their animal in barns where animals are kept. Lack of milking facilities
exposes milk into contamination with manure and other dirties that might be in animal barns
during the milking time. The feeding system used is zero grazing.
The use of plastic containers to store milk without cooling it and the use of public transport
means that the cold chain is not maintained by vendors. This increases the rate of microbes
multiplying in the milk because the temperature higher than 4°C is favourable for
multiplication of the bacteria in milk. This lowers the milk quality, keeping quality and
39
increase the rate of spoilage counts. The collected milk must be kept in a cold chain at a
temperature of 4°C from the point of production to the consumer so as to keep it’s nutritional
and bacteriological quality (Keskin and Gulsunoglu, 2012).
Proper cleaning of utensils and equipment used in the dairy requires scrubbing in a hot water
with a detergent solution, followed by rinsing with clean hot water and sterilisation using wet
heat in a steam cabinet. Since farmers and vendors clean their utensils but do not sterilise
them, there is a risk of bacterial build up and the contamination of subsequent consignments
of milk. Efficient cleaning by using the right detergent at the recommended strength is
essential for keeping microbial contamination of the products to a minimum (Welearegay et
al., 2012).
3.5 CONCLUSION
Generally, farmers were aware of important milk handling procedures such as availability of
clean water supplies, cleaning the udder before milking, drying the udder, washing of utensils
and separating milk from sick animals. They were practising these important procedures. The
risks to clean milk production that were identified includes the use of plastic containers to
store and transport milk, lack of cooling facilities after milking and during transportation and
lack of sterilisation facilities for utensils on the farm. Milk was not tested for mastitis on the
farm. Farmers were not dipping teats in an iodine based tincture post-milking to protect
animal udder from bacterial infection since the teats canals are open soon after milking.
These issues are of concern since they are sources of milk contamination in the study area
and if improved can lead to significant increases in milk quality.

40
CHAPTER FOUR
4 EVALUATION OF MICROBIOLOGICAL QUALITY OF MILK COLLECTED
FROM SMALL SCALE DAIRY FARMERS AND VENDORS IN THE HAI
DISTRICT IN TANZANIA
ABSTRACT
A study was carried out to determine the Total Bacteria Counts, Total Coliform Counts,
E.coli and E.coli the O157:H7 content of milk samples from 180 farmers and 30 vendors in
the Hai District in Tanzania. Total bacterial count, Total Coliform Count E Coli and E.coli
(O157:H7) were estimated by the use of standard agar methods. There was a significant
difference (P<0.05) of the mean TBC and TCC from vendors and farmers with vendors
having the higher counts compared to farmers. The milk samples tested were positive for
E.coli but not E.coli (O157:H7). In all the samples analysed about 66% was found to be in
grade I, 24.9% was in grade II and 9.1% was grade III milk. The milk was observed to be in
the acceptable ranges of grade II for both vendors and farmers based on East African
Standards for Milk and Dairy Products (EAS 2007). The higher bacterial counts in milk
samples from vendors can be explained by the lack of cold chain use by vendors when
transport milk to the selling points since temperature above 4°C increases the rate of
microbial multiplication in milk. The presence of E.coli in some of the samples is an
indicator of possible contamination with faecal materials.
41
4.1 INTRODUCTION
Milk, a major constituent of the diet, is a highly perishable commodity, vulnerable to spoilage
and consequently health risk to consumers if is not properly handled from production to the
consumer in the value chain (Schooman and Swai, 2011). It is an important source of Ca, P,
riboflavin, vitamin B12, and high-quality proteins even though not containing all the nutrition
requirements needed in human nutrition (Tekinsen et al, 2007). Since milk forms an
important part of the diet for children and expectant mothers then its quality is considered
important for the welfare of the community (Sudhasaravanan and Binukumari, 2015). In
order to protect health of consumers, microbiological quality tests are performed for TBC,
TCC, E.coli and pathogenic E.coli (0157:H7) (Shojaei, and Yadollahi, 2008)
Microbial contamination of milk is the major cause of milk spoilage as well as exposing
consumers of such milk to health hazards (Ngasala et al., 2015). The presence of high a
bacteria load in raw milk reduces the keeping quality of the milk as well as the products that
will be made from such milk (Minj and Behera, 2012). There are undesirable microbes that
can cause spoilage of dairy products and these include Gram-negative psychrotrophs,
coliforms, lactic acid bacteria, yeasts, and moulds (Varga, 2007). The microbial spoilage of
milk reduces the market value and freshness of the milk hence lower incomes earned by
producers and milk vendors (Kaindi et al., 2011). Bacteria such as coliforms are responsible
for reducing the diacetyl content of buttermilk, causing the formation of gases in cheese
making so lowering the quality of the product (Sperber, 2009) This indicates a loss to
processors of dairy products since the quality of the dairy products will be negatively affected
(Swai and Schoonman, 2011). The quality of milk determine the keeping quality and the
shelf life of the dairy products made from milk and hence disqualifying milk with a high load
of bacteria from further processing.
This study was carried out to establish the status of milk quality in selected dairy farmers and
vendors in the Hai District in Tanzania. The information generated will be useful in
informing stakeholders involved in the dairy sector and public officers in developing the
strategies for improvement in small-scale dairy production.
42
4.2 MATERIALS AND METHODS
4.2.1 Study Site
Details on the study site are provided in section 3.2.1
4.2.2 Sample Collection
Five villages were involved in the study namely Nkuu Ndoo, Foo, Wari, Nronga and
Lyamungo Kati. Milk samples were collected from small-scale dairy farmers who brought
their milk to collection centres and milk vendors in respective villages. Labelled pre-sterile
30mls bottles were used to collect the milk sample. Milk samples were collected directly
from farmers’ containers at the milk collection centres. The samples were immediately
cooled and transported in cool boxes filled with ice packs to the laboratory for analysis.
4.2.3 Determination of Total Bacterial and Coliform Counts
Standard procedures described by (USDA, 2011) was used for Total Bacterial Count and
Coliform Count of the collected milk samples.
Preparation of Diluent
Peptone water was used as the diluent. This was prepared by diluting 15.23 grams of peptone
water powder into 1000ml of the distilled water. Then 9mls of this solution was added into
clean test tubes. The tubes were stoppered by the use of cotton wools and sterilised at 121°C
for 15minutes in an autoclave. After sterilisation the tubes were cooled to room temperature
and then stored in the refrigerator ready for use in the next day.
Determination of Bacterial Counts in Milk Samples
For Total Bacteria Count, the media used was Plate Count Agar (HIMEDIA REF M091).
Standard Plate Count Agar was prepared by dissolving 23.5grams and in 1000mls of distilled
water. The solution was heated on a gas cooker to dissolve the media. Thereafter it was
sterilised in an autoclave at 121°C for 15minutes. After sterilisation bottles with Agar were
cooled to 45°C in water bath ready for inoculation. For Total Coliform Count, the media used
was Violet Red Bile Agar (HIMEDIA REF M049). Red Violet Bile Agar was made by
dissolving 41.53grams in 1000mls of distilled water. The solution was then heated to dissolve
the agar then cooled in a water bath to 45°C.
43
4.2.4 Plating
For each milk sample tenfold serial dilution (10-1 to 10-6) were made in sterilised test tubes
with peptone water. One millilitre each of 10-2 to 10-4 was used for Total Bacterial count and
10-3 to 10-5 for Total Coliform Count as well as E. coli. Plating was done in triplicate in
sterilised petri dishes. Twenty millilitres of agar and the diluted milk sample were mixed
thoroughly. Plates were allowed to cool and solidify then they were incubated in an inverted
position at 37°C. The incubation time for Total Bacterial Count was 48hours and for Total
Coliform Count and 24 hours for E.coli.
4.2.5 Plate Counting
4.2.5.1 Total Bacteria Count
Only plates with colonies between 25 and 250 colonies were counted after incubation. After
counting, the number of colonies was multiplied by the reciprocal of the dilution factor to
give the count per ml of original milk sample, e.g a count of 37 colonies on a petri dish of 10-
3 means a count of 37 x 103 or 37 000cfu/ml. Lastly, the average of the dilution series was
calculated to get CFU/ml number in the milk sample before dilution.
4.2.5.2 Total Coliform Count
After incubation only petri dishes with counts of 15 to 150 colonies were counted as above.
The colonies that were considered for Total Coliform Count were only those that were dark
red in colour.
4.2.6 Determination of E.coli
This was carried out according to the procedures described by ISO 7251:2005(E). For E.coli
MacConkey Agar HIMEDIA REF M081-500G was used. Agar was prepared by dissolving
51.53grams of the Agar in 1litre of distilled water. The solution was pre-heated to allow
dissolving later was autoclaved at 121°C for 15 minutes. It was cooled to 45°C in water bath
ready for inoculation.
Milk sample in a collecting bottle was carefully shaken. The sample bottle was aseptically
opened then sample dilution series was carried out from 10-1 to 10-6 while holding the test
tubes and sample bottle near a Bunsen burner to avoid contamination. The sterilised pipettes
were used in sample taking to avoid contamination. The single sterile pipette was used per
each dilution transfer. One ml of each dilution was pipetted into separate, labelled empty petri
dishes, opening dish only enough to let the pipette in. This was done near the Bunsen burner.
44
The plating was done in triplicate. The inoculated dishes were added with 15-20mls of the
MacConkeyAgar. The petri dishes were gently moved at figure eight movements to mix the
inoculum with the Agar then they were allowed to solidify. The petri dishes were inverted
and incubated at 37±1°C for 24 hours. A blank was prepared using the Agar but without the
sample. After incubation, all dishes with colonies 15 and 150 were counted. Only colonies
that had reddish ring were counted.
4.2.7 Determination of pathogenic E.coli (O157: H7)
Standard procedures used were as described by ISO 7251:2005(E). Sorbitol MacConkey
Agar (SMAC) HIMEDIA REF M298-500G was the Agar of choice used to check for the
presence of pathogenic E.coli (O157:H7). It was prepared by suspending 50.03grams of the
Agar in 1litre of distilled water. The solution was vigorously shaken and pre heated to allow
thorough mixing of particles. Thereafter it was autoclaved at 121°C for 15minutes and later
was cooled to 45°C ready to be used for incubation. The milk was diluted as before and
transferred aseptically to petri dishes.
Milk sample in a collecting bottle was carefully shaken to mix the sample. One millilitre of
milk sample was serially diluted to give dilutions between 10-1 and 10-6 while holding the
test tubes and sample bottle near a Bunsen burner to avoid contamination. The sterilised
pipettes were used in sample taking to avoid contamination. The single sterile pipette was
used per each dilution transfer. One ml of each dilution was pipetted into a separate, labelled
empty petri dishes, opening dish only enough to let the pipette in this was done near the
Bunsen burner. The inoculation was done in triplicate. Petri dishes for inoculation were
added with 20mls of the Agar gently moved at figure eight movement for thorough mixing,
then allowed to solidify. The solidified petri dishes were incubated at inversion position in
the oven at 37°C for 24hours. The developed colonies were counted, for the colonies to be
counted as E.coli pathogenic they were supposed to be colourless and not reddish, purplish or
pinkish.
4.2.8 Confirmation of E.coli and E.coli pathogenic (O157:H7)
The biochemical tests for confirmation were done to confirm the presence of E.coli in the
milk samples which the organism grows.
4.2.8.1 Gram Staining Test
This test was done on the sterile glass slides and a drop of normal saline was firstly added on
a slide then well-isolated colonies were spread on the prepared slides to make smears. These
45
smears were dried on air and then followed by gentle fixing and flaming. Fixed smears were
soaked in a crystal violet stain for two minutes then washed with a running tap water. Slides
were then soaked in Lugol’s iodine for two minutes and then washed with a running tap
water. Thereafter these slides were decolorised by using acetone alcohol and washed on
running tap water followed by covering of these fixed smears with neutral red for two
minutes and then washed on running water. These slides were then dried on a draining rack
after drying a drop of oil immersion was added to these slides then examined under a light
microscope with 100X objective to examine the morphology of the bacteria. Gram-positive
were cocci with pale to dark purple colour while Gram-negative are rod-shaped with pale to
dark red colour.
4.2.8.2 Indole Test
Peptone water solution was prepared by diluting 15.23 grams of peptone water powder into
1000ml of the distilled water and then 3mls of this solution was added in a bijou tubes by
using a sterile plastic disposable pipete. Fresh sterile plastic loop was used to inoculate the
colonies to bijou tubes then these tubes were incubated at 37°C for 48 hours. After incubation
0.5mls of Kovac’s reagent (Loba Chemie Pvt. Ltd, Lot LM 01131303) were added to the
incubated tubes. Tubes were then gently shaken and examined for red coloured ring
formation on the surface of the tube. Formation of this red ring is an indication of positive
Indole reaction.
4.2.9 Statistical Analysis
Results of laboratory counts for Total Bacterial Count, Total Coliform Counts, E. coli and
pathogenic E. coli were firstly entered into Ms Excel data sheet. The TBC and TCC in milk
samples were compared with (EAC, 2006) specifications. The data were transformed into
log10 then the means for Total Bacterial Count, and Total Coliforms Counts and E.coli
counts for vendors and farmers were analysed by the use of SAS at the 95% confidence
interval and 5% level of significance.
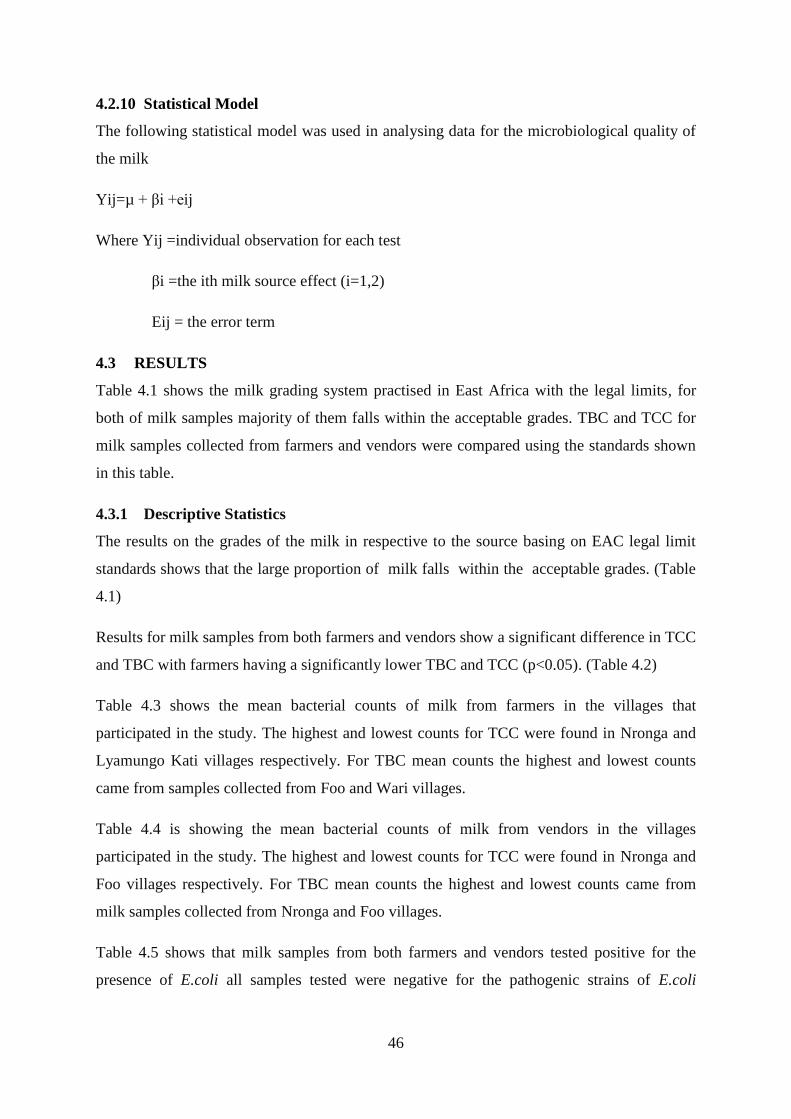
46
4.2.10 Statistical Model
The following statistical model was used in analysing data for the microbiological quality of
the milk
Yij=µ + βi +eij
Where Yij =individual observation for each test
βi =the ith milk source effect (i=1,2)
Eij = the error term
4.3 RESULTS
Table 4.1 shows the milk grading system practised in East Africa with the legal limits, for
both of milk samples majority of them falls within the acceptable grades. TBC and TCC for
milk samples collected from farmers and vendors were compared using the standards shown
in this table.
4.3.1 Descriptive Statistics
The results on the grades of the milk in respective to the source basing on EAC legal limit
standards shows that the large proportion of milk falls within the acceptable grades. (Table
4.1)
Results for milk samples from both farmers and vendors show a significant difference in TCC
and TBC with farmers having a significantly lower TBC and TCC (p<0.05). (Table 4.2)
Table 4.3 shows the mean bacterial counts of milk from farmers in the villages that
participated in the study. The highest and lowest counts for TCC were found in Nronga and
Lyamungo Kati villages respectively. For TBC mean counts the highest and lowest counts
came from samples collected from Foo and Wari villages.
Table 4.4 is showing the mean bacterial counts of milk from vendors in the villages
participated in the study. The highest and lowest counts for TCC were found in Nronga and
Foo villages respectively. For TBC mean counts the highest and lowest counts came from
milk samples collected from Nronga and Foo villages.
Table 4.5 shows that milk samples from both farmers and vendors tested positive for the
presence of E.coli all samples tested were negative for the pathogenic strains of E.coli
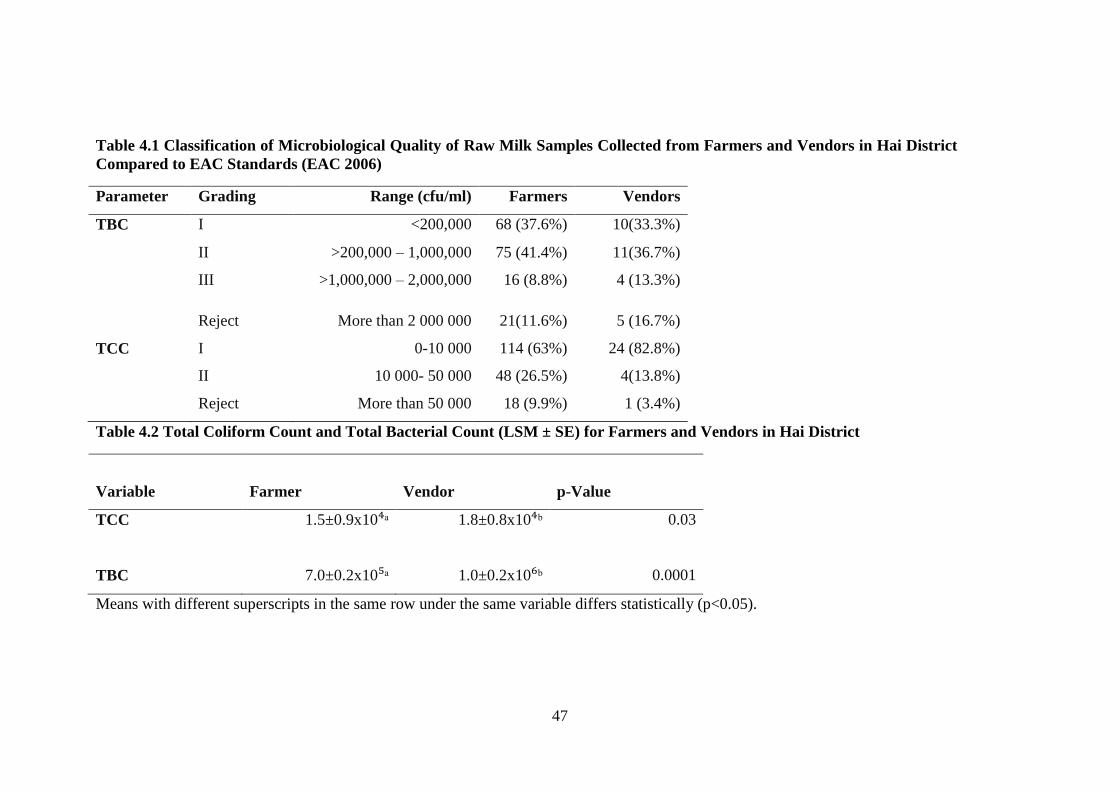
47
Table 4.1 Classification of Microbiological Quality of Raw Milk Samples Collected from Farmers and Vendors in Hai District
Compared to EAC Standards (EAC 2006)
Parameter Grading Range (cfu/ml) Farmers Vendors
TBC I <200,000 68 (37.6%) 10(33.3%)
II >200,000 – 1,000,000 75 (41.4%) 11(36.7%)
III >1,000,000 – 2,000,000 16 (8.8%) 4 (13.3%)
Reject More than 2 000 000 21(11.6%) 5 (16.7%)
TCC I 0-10 000 114 (63%) 24 (82.8%)
II 10 000- 50 000 48 (26.5%) 4(13.8%)
Reject More than 50 000 18 (9.9%) 1 (3.4%)
Table 4.2 Total Coliform Count and Total Bacterial Count (LSM ± SE) for Farmers and Vendors in Hai District
Variable
Farmer Vendor p-Value
TCC 1.5±0.9x10⁴ᵃ 1.8±0.8x10⁴ᵇ 0.03
TBC 7.0±0.2x10⁵ᵃ 1.0±0.2x10⁶ᵇ 0.0001
Means with different superscripts in the same row under the same variable differs statistically (p<0.05).
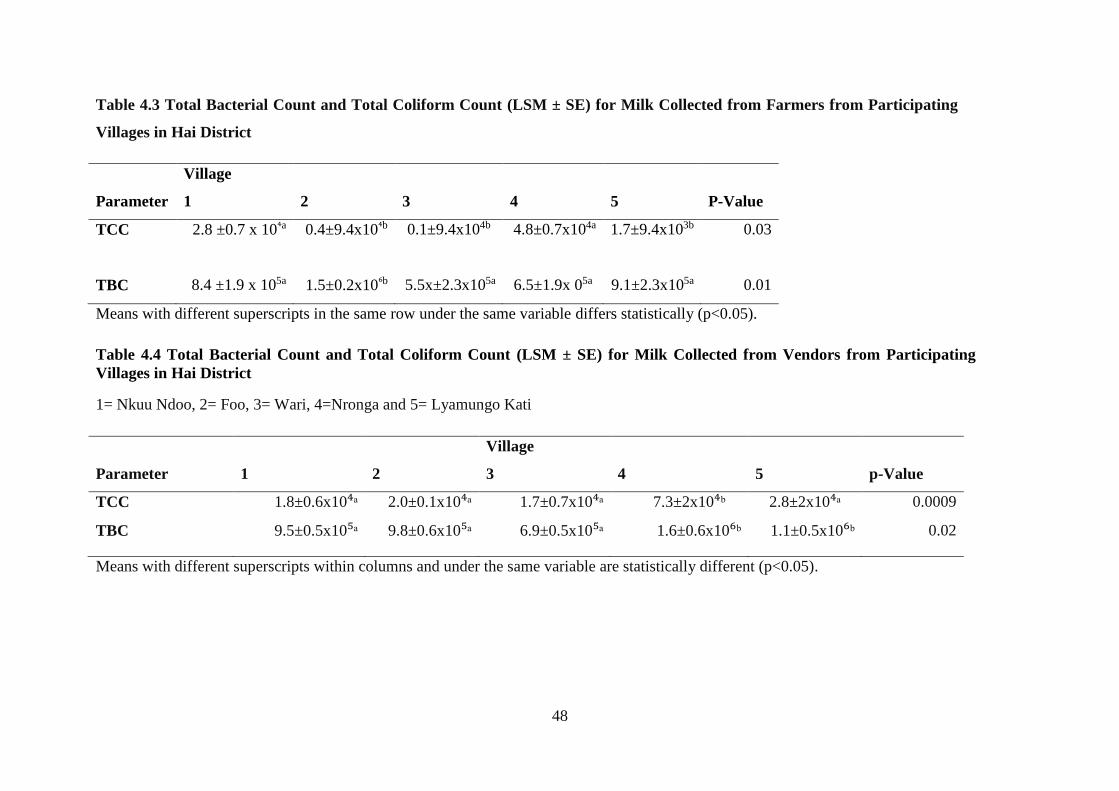
48
Table 4.3 Total Bacterial Count and Total Coliform Count (LSM ± SE) for Milk Collected from Farmers from Participating
Villages in Hai District
Village
Parameter 1 2 3 4 5 P-Value
TCC 2.8 ±0.7 x 10⁴a 0.4±9.4x10⁴b 0.1±9.4x10⁴b 4.8±0.7x10⁴a 1.7±9.4x10³b 0.03
TBC
8.4 ±1.9 x 10⁵a
1.5±0.2x10⁶b
5.5x±2.3x10⁵a
6.5±1.9x 05a
9.1±2.3x10⁵a
0.01
Means with different superscripts in the same row under the same variable differs statistically (p<0.05).
Table 4.4 Total Bacterial Count and Total Coliform Count (LSM ± SE) for Milk Collected from Vendors from Participating
Villages in Hai District
1= Nkuu Ndoo, 2= Foo, 3= Wari, 4=Nronga and 5= Lyamungo Kati
Village
Parameter 1 2 3 4 5 p-Value
TCC 1.8±0.6x10⁴ᵃ 2.0±0.1x10⁴ᵃ 1.7±0.7x10⁴ᵃ 7.3±2x10⁴ᵇ 2.8±2x10⁴ᵃ 0.0009
TBC 9.5±0.5x10⁵ᵃ 9.8±0.6x10⁵ᵃ 6.9±0.5x10⁵ᵃ 1.6±0.6x10⁶ᵇ 1.1±0.5x10⁶ᵇ 0.02
Means with different superscripts within columns and under the same variable are statistically different (p<0.05).
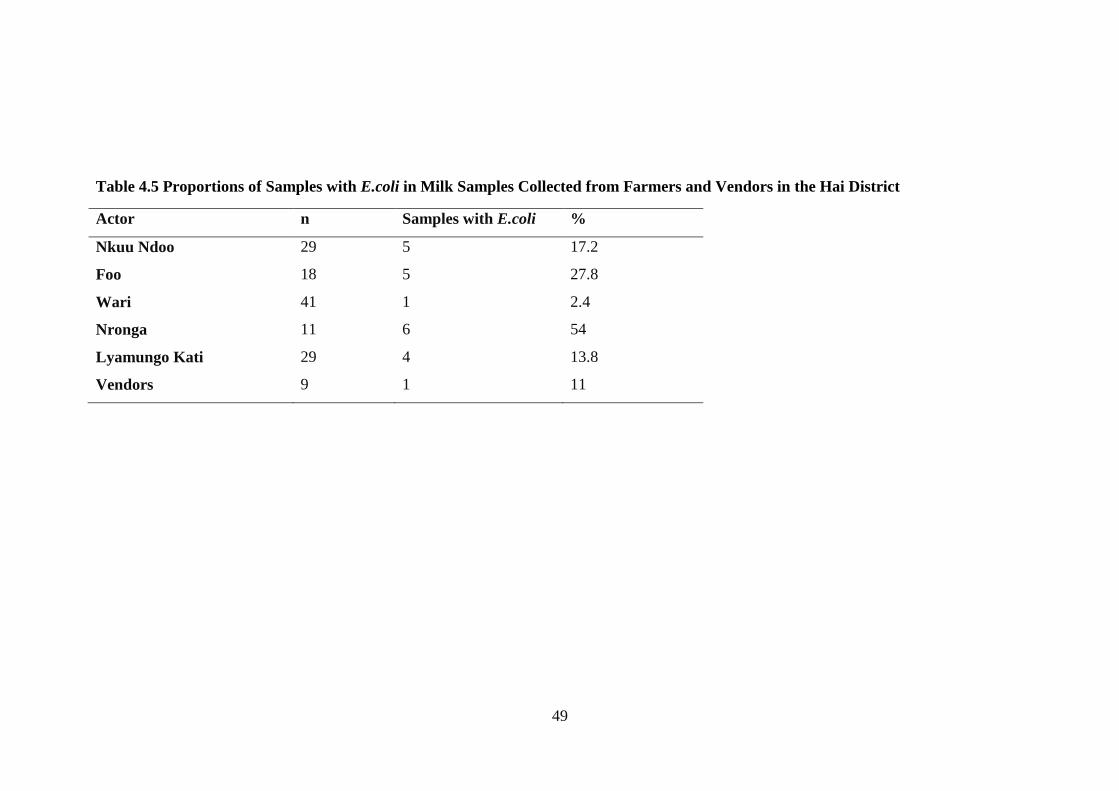
49
Table 4.5 Proportions of Samples with E.coli in Milk Samples Collected from Farmers and Vendors in the Hai District
Actor n Samples with E.coli %
Nkuu Ndoo 29 5 17.2
Foo 18 5 27.8
Wari 41 1 2.4
Nronga 11 6 54
Lyamungo Kati 29 4 13.8
Vendors 9 1 11
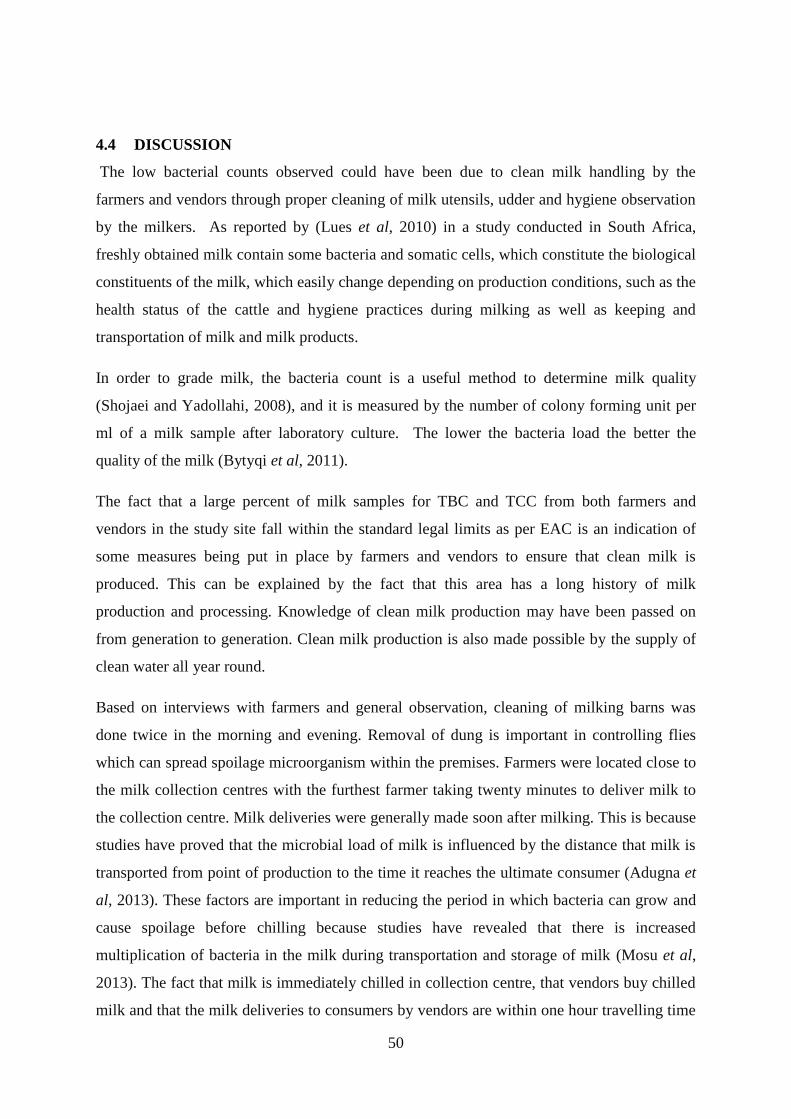
50
4.4 DISCUSSION
The low bacterial counts observed could have been due to clean milk handling by the
farmers and vendors through proper cleaning of milk utensils, udder and hygiene observation
by the milkers. As reported by (Lues et al, 2010) in a study conducted in South Africa,
freshly obtained milk contain some bacteria and somatic cells, which constitute the biological
constituents of the milk, which easily change depending on production conditions, such as the
health status of the cattle and hygiene practices during milking as well as keeping and
transportation of milk and milk products.
In order to grade milk, the bacteria count is a useful method to determine milk quality
(Shojaei and Yadollahi, 2008), and it is measured by the number of colony forming unit per
ml of a milk sample after laboratory culture. The lower the bacteria load the better the
quality of the milk (Bytyqi et al, 2011).
The fact that a large percent of milk samples for TBC and TCC from both farmers and
vendors in the study site fall within the standard legal limits as per EAC is an indication of
some measures being put in place by farmers and vendors to ensure that clean milk is
produced. This can be explained by the fact that this area has a long history of milk
production and processing. Knowledge of clean milk production may have been passed on
from generation to generation. Clean milk production is also made possible by the supply of
clean water all year round.
Based on interviews with farmers and general observation, cleaning of milking barns was
done twice in the morning and evening. Removal of dung is important in controlling flies
which can spread spoilage microorganism within the premises. Farmers were located close to
the milk collection centres with the furthest farmer taking twenty minutes to deliver milk to
the collection centre. Milk deliveries were generally made soon after milking. This is because
studies have proved that the microbial load of milk is influenced by the distance that milk is
transported from point of production to the time it reaches the ultimate consumer (Adugna et
al, 2013). These factors are important in reducing the period in which bacteria can grow and
cause spoilage before chilling because studies have revealed that there is increased
multiplication of bacteria in the milk during transportation and storage of milk (Mosu et al,
2013). The fact that milk is immediately chilled in collection centre, that vendors buy chilled
milk and that the milk deliveries to consumers by vendors are within one hour travelling time
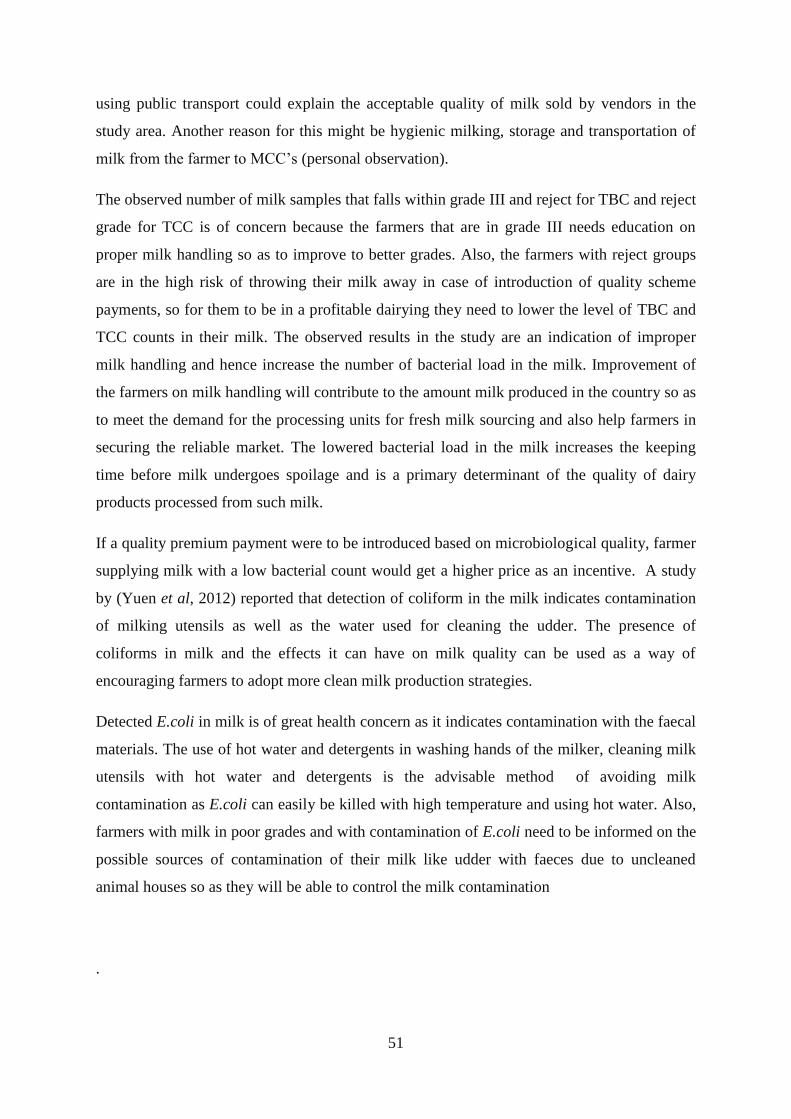
51
using public transport could explain the acceptable quality of milk sold by vendors in the
study area. Another reason for this might be hygienic milking, storage and transportation of
milk from the farmer to MCC’s (personal observation).
The observed number of milk samples that falls within grade III and reject for TBC and reject
grade for TCC is of concern because the farmers that are in grade III needs education on
proper milk handling so as to improve to better grades. Also, the farmers with reject groups
are in the high risk of throwing their milk away in case of introduction of quality scheme
payments, so for them to be in a profitable dairying they need to lower the level of TBC and
TCC counts in their milk. The observed results in the study are an indication of improper
milk handling and hence increase the number of bacterial load in the milk. Improvement of
the farmers on milk handling will contribute to the amount milk produced in the country so as
to meet the demand for the processing units for fresh milk sourcing and also help farmers in
securing the reliable market. The lowered bacterial load in the milk increases the keeping
time before milk undergoes spoilage and is a primary determinant of the quality of dairy
products processed from such milk.
If a quality premium payment were to be introduced based on microbiological quality, farmer
supplying milk with a low bacterial count would get a higher price as an incentive. A study
by (Yuen et al, 2012) reported that detection of coliform in the milk indicates contamination
of milking utensils as well as the water used for cleaning the udder. The presence of
coliforms in milk and the effects it can have on milk quality can be used as a way of
encouraging farmers to adopt more clean milk production strategies.
Detected E.coli in milk is of great health concern as it indicates contamination with the faecal
materials. The use of hot water and detergents in washing hands of the milker, cleaning milk
utensils with hot water and detergents is the advisable method of avoiding milk
contamination as E.coli can easily be killed with high temperature and using hot water. Also,
farmers with milk in poor grades and with contamination of E.coli need to be informed on the
possible sources of contamination of their milk like udder with faeces due to uncleaned
animal houses so as they will be able to control the milk contamination
.
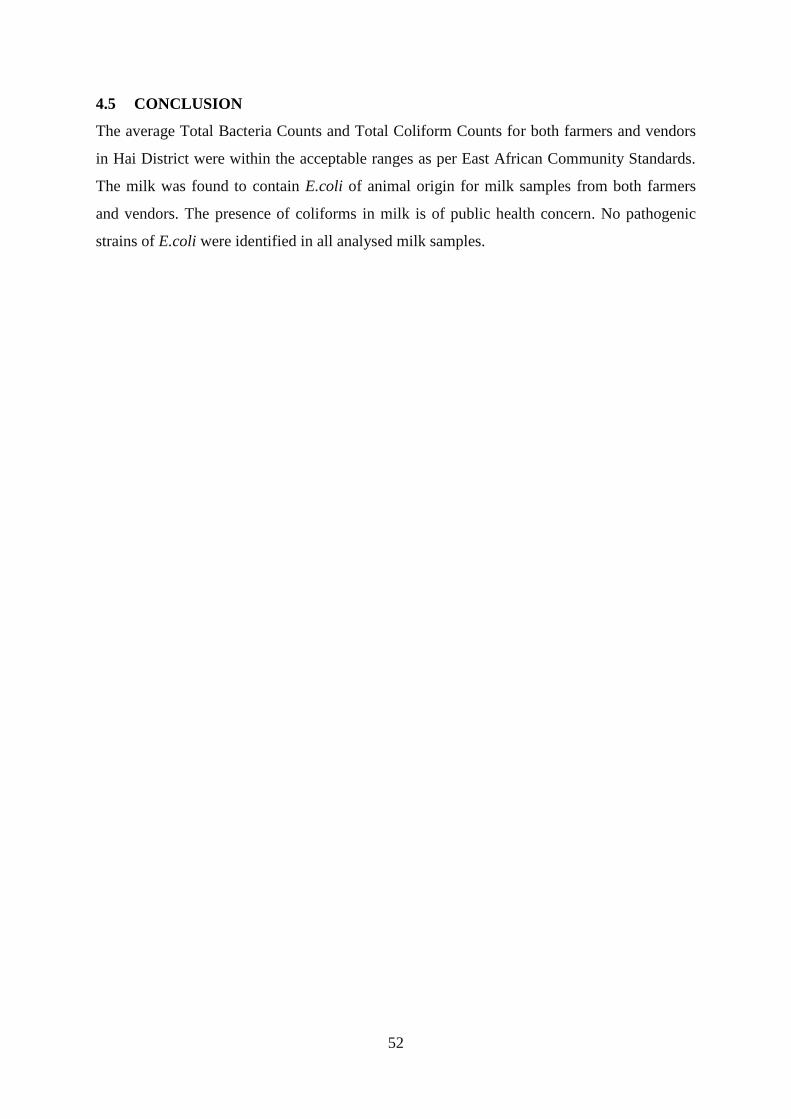
52
4.5 CONCLUSION
The average Total Bacteria Counts and Total Coliform Counts for both farmers and vendors
in Hai District were within the acceptable ranges as per East African Community Standards.
The milk was found to contain E.coli of animal origin for milk samples from both farmers
and vendors. The presence of coliforms in milk is of public health concern. No pathogenic
strains of E.coli were identified in all analysed milk samples.
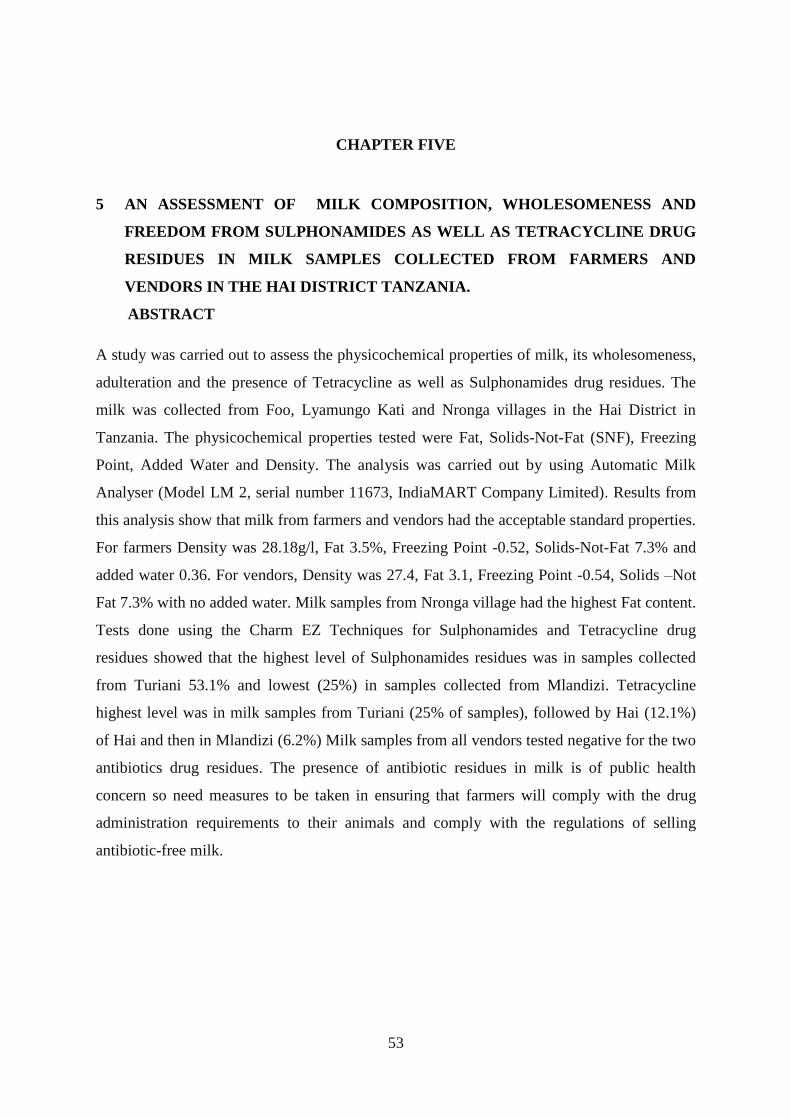
53
CHAPTER FIVE
5 AN ASSESSMENT OF MILK COMPOSITION, WHOLESOMENESS AND
FREEDOM FROM SULPHONAMIDES AS WELL AS TETRACYCLINE DRUG
RESIDUES IN MILK SAMPLES COLLECTED FROM FARMERS AND
VENDORS IN THE HAI DISTRICT TANZANIA.
ABSTRACT
A study was carried out to assess the physicochemical properties of milk, its wholesomeness,
adulteration and the presence of Tetracycline as well as Sulphonamides drug residues. The
milk was collected from Foo, Lyamungo Kati and Nronga villages in the Hai District in
Tanzania. The physicochemical properties tested were Fat, Solids-Not-Fat (SNF), Freezing
Point, Added Water and Density. The analysis was carried out by using Automatic Milk
Analyser (Model LM 2, serial number 11673, IndiaMART Company Limited). Results from
this analysis show that milk from farmers and vendors had the acceptable standard properties.
For farmers Density was 28.18g/l, Fat 3.5%, Freezing Point -0.52, Solids-Not-Fat 7.3% and
added water 0.36. For vendors, Density was 27.4, Fat 3.1, Freezing Point -0.54, Solids –Not
Fat 7.3% with no added water. Milk samples from Nronga village had the highest Fat content.
Tests done using the Charm EZ Techniques for Sulphonamides and Tetracycline drug
residues showed that the highest level of Sulphonamides residues was in samples collected
from Turiani 53.1% and lowest (25%) in samples collected from Mlandizi. Tetracycline
highest level was in milk samples from Turiani (25% of samples), followed by Hai (12.1%)
of Hai and then in Mlandizi (6.2%) Milk samples from all vendors tested negative for the two
antibiotics drug residues. The presence of antibiotic residues in milk is of public health
concern so need measures to be taken in ensuring that farmers will comply with the drug
administration requirements to their animals and comply with the regulations of selling
antibiotic-free milk.
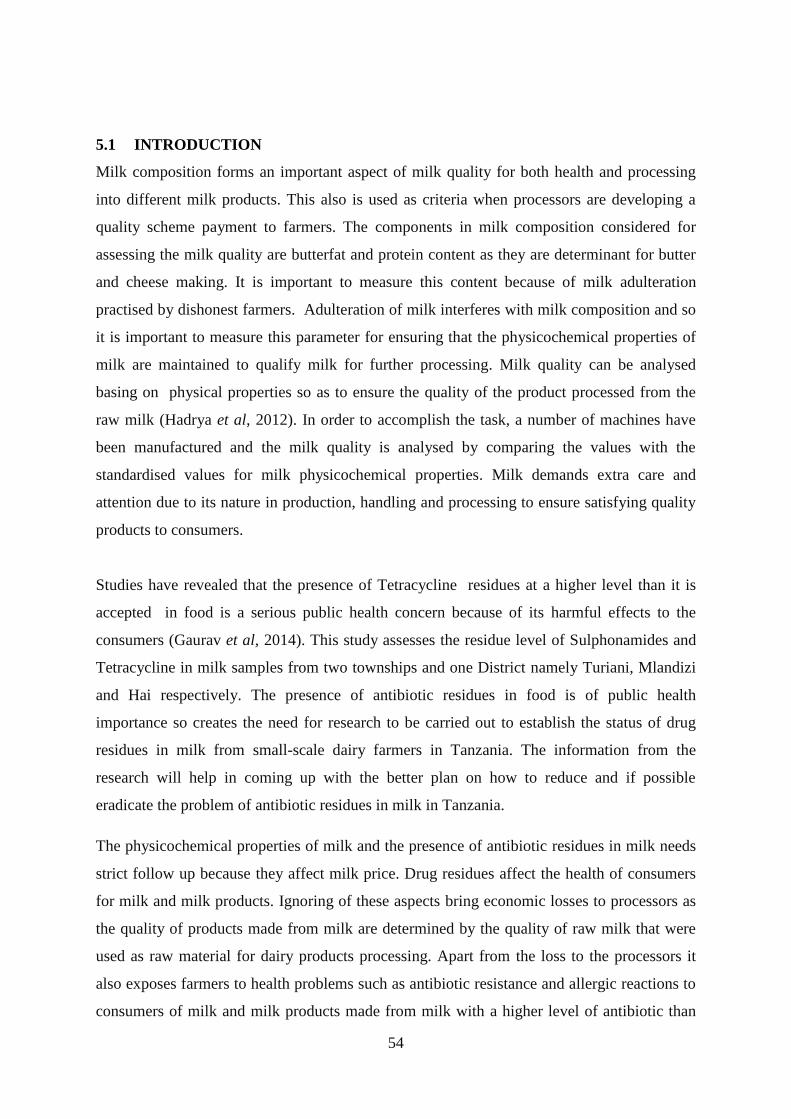
54
5.1 INTRODUCTION
Milk composition forms an important aspect of milk quality for both health and processing
into different milk products. This also is used as criteria when processors are developing a
quality scheme payment to farmers. The components in milk composition considered for
assessing the milk quality are butterfat and protein content as they are determinant for butter
and cheese making. It is important to measure this content because of milk adulteration
practised by dishonest farmers. Adulteration of milk interferes with milk composition and so
it is important to measure this parameter for ensuring that the physicochemical properties of
milk are maintained to qualify milk for further processing. Milk quality can be analysed
basing on physical properties so as to ensure the quality of the product processed from the
raw milk (Hadrya et al, 2012). In order to accomplish the task, a number of machines have
been manufactured and the milk quality is analysed by comparing the values with the
standardised values for milk physicochemical properties. Milk demands extra care and
attention due to its nature in production, handling and processing to ensure satisfying quality
products to consumers.
Studies have revealed that the presence of Tetracycline residues at a higher level than it is
accepted in food is a serious public health concern because of its harmful effects to the
consumers (Gaurav et al, 2014). This study assesses the residue level of Sulphonamides and
Tetracycline in milk samples from two townships and one District namely Turiani, Mlandizi
and Hai respectively. The presence of antibiotic residues in food is of public health
importance so creates the need for research to be carried out to establish the status of drug
residues in milk from small-scale dairy farmers in Tanzania. The information from the
research will help in coming up with the better plan on how to reduce and if possible
eradicate the problem of antibiotic residues in milk in Tanzania.
The physicochemical properties of milk and the presence of antibiotic residues in milk needs
strict follow up because they affect milk price. Drug residues affect the health of consumers
for milk and milk products. Ignoring of these aspects bring economic losses to processors as
the quality of products made from milk are determined by the quality of raw milk that were
used as raw material for dairy products processing. Apart from the loss to the processors it
also exposes farmers to health problems such as antibiotic resistance and allergic reactions to
consumers of milk and milk products made from milk with a higher level of antibiotic than
55
the acceptable. The involved areas for drug residue analysis were selected aiming at
comparing drug residue level in two groups of farmers. In Hai District, the participants were
dairy cattle keepers and in Mlandizi and Turiani it was pastoralists who had been trained on
proper use of antibiotic to lactating animals. The study aimed at establishing the difference in
drug residue level in animals from dairy farmers and from trained pastoralists.
5.2 MATERIALS AND METHODS
5.2.1 Study site
The study site and sample collection procedures are described in section 3.2.1.
5.2.2 Data collection
Data collected were physical-chemical properties of milk and analysis for the presence of
Tetracyclines and Sulphonamides in milk samples from vendors and farmers in the Hai
District as well as Turiani and Mlandizi townships.
5.2.3 Milk Composition Analysis
Milk composition analysis was carried out at Milk Collection Centre using an Ultrasonic
Milk Analyser Model LM 2, serial number 11673 IndiaMART Company Limited. The milk
constituents measured were butterfat content and solids not fat. The same equipment was also
used to measure milk density and freezing point.
Sulphonamide and Tetracycline drug residues in milk were analysed using quantitative
Charm EZ technique according to manufacturers’ instruction. Tetracycline and
Sulphonamides are the most commonly used antibiotics in Tanzania. For Tetracycline, the
incubation time was 8 minutes while for Sulphonamides was 4 minutes.
Calibration of the machine was done. The negative control tests were then carried out using
milk from animals that had not been treated with antibiotics for at least one month before the
day of taking a sample. 30µl of milk was added into the strips and the test was run in the
Charm EZ machine and results were recorded. The positive control was done by dissolving a
Tetracycline or Sulphonamide antibiotic tablet that was included in the kit. The tablet was
dissolved in 1ml of the milk free from antibiotic residues. Then 30µl of this sample was
squeezed in a respective strip.
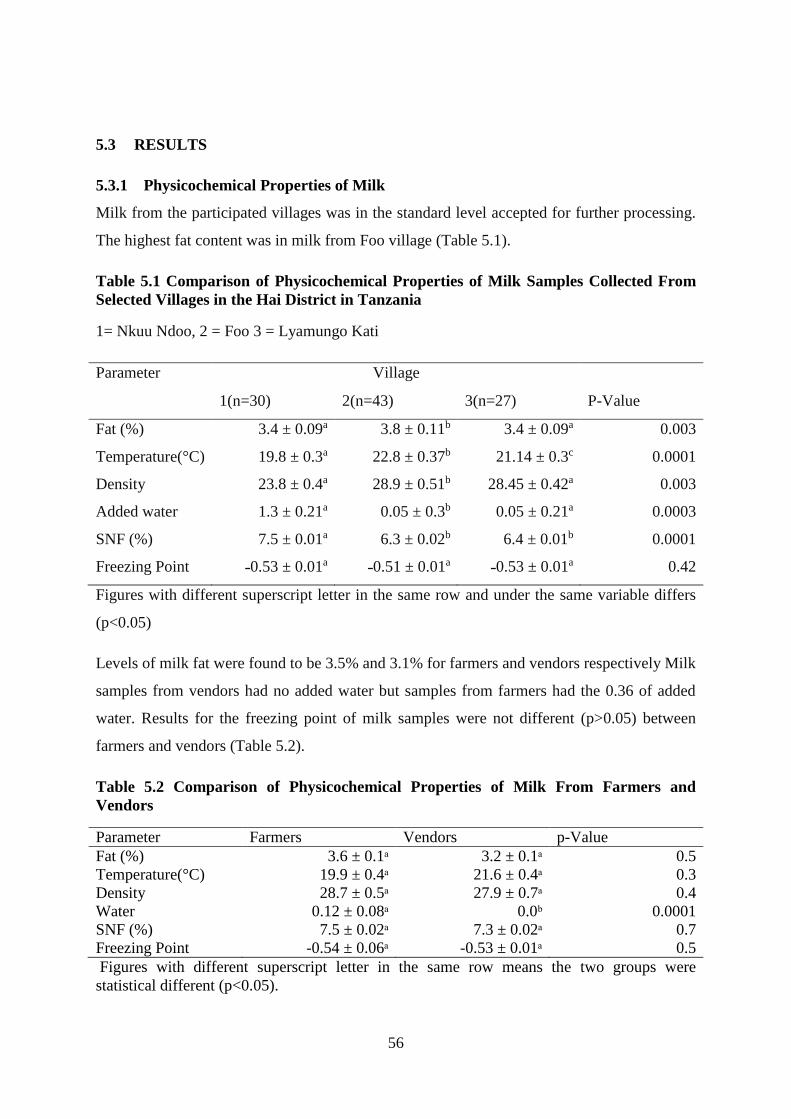
56
5.3 RESULTS
5.3.1 Physicochemical Properties of Milk
Milk from the participated villages was in the standard level accepted for further processing.
The highest fat content was in milk from Foo village (Table 5.1).
Table 5.1 Comparison of Physicochemical Properties of Milk Samples Collected From
Selected Villages in the Hai District in Tanzania
1= Nkuu Ndoo, 2 = Foo 3 = Lyamungo Kati
Parameter Village
1(n=30) 2(n=43) 3(n=27) P-Value
Fat (%) 3.4 ± 0.09a 3.8 ± 0.11b 3.4 ± 0.09a 0.003
Temperature(°C) 19.8 ± 0.3a 22.8 ± 0.37b 21.14 ± 0.3c 0.0001
Density 23.8 ± 0.4a 28.9 ± 0.51b 28.45 ± 0.42a 0.003
Added water 1.3 ± 0.21a 0.05 ± 0.3b 0.05 ± 0.21a 0.0003
SNF (%) 7.5 ± 0.01a 6.3 ± 0.02b 6.4 ± 0.01b 0.0001
Freezing Point ˗0.53 ± 0.01a ˗0.51 ± 0.01a ˗0.53 ± 0.01a 0.42
Figures with different superscript letter in the same row and under the same variable differs
(p<0.05)
Levels of milk fat were found to be 3.5% and 3.1% for farmers and vendors respectively Milk
samples from vendors had no added water but samples from farmers had the 0.36 of added
water. Results for the freezing point of milk samples were not different (p>0.05) between
farmers and vendors (Table 5.2).
Table 5.2 Comparison of Physicochemical Properties of Milk From Farmers and
Vendors
Parameter Farmers Vendors p-Value
Fat (%) 3.6 ± 0.1ᵃ 3.2 ± 0.1ᵃ 0.5
Temperature(°C) 19.9 ± 0.4ᵃ 21.6 ± 0.4ᵃ 0.3
Density 28.7 ± 0.5ᵃ 27.9 ± 0.7ᵃ 0.4
Water 0.12 ± 0.08ᵃ 0.0ᵇ 0.0001
SNF (%) 7.5 ± 0.02ᵃ 7.3 ± 0.02ᵃ 0.7
Freezing Point -0.54 ± 0.06ᵃ -0.53 ± 0.01ᵃ 0.5
Figures with different superscript letter in the same row means the two groups were
statistical different (p<0.05).
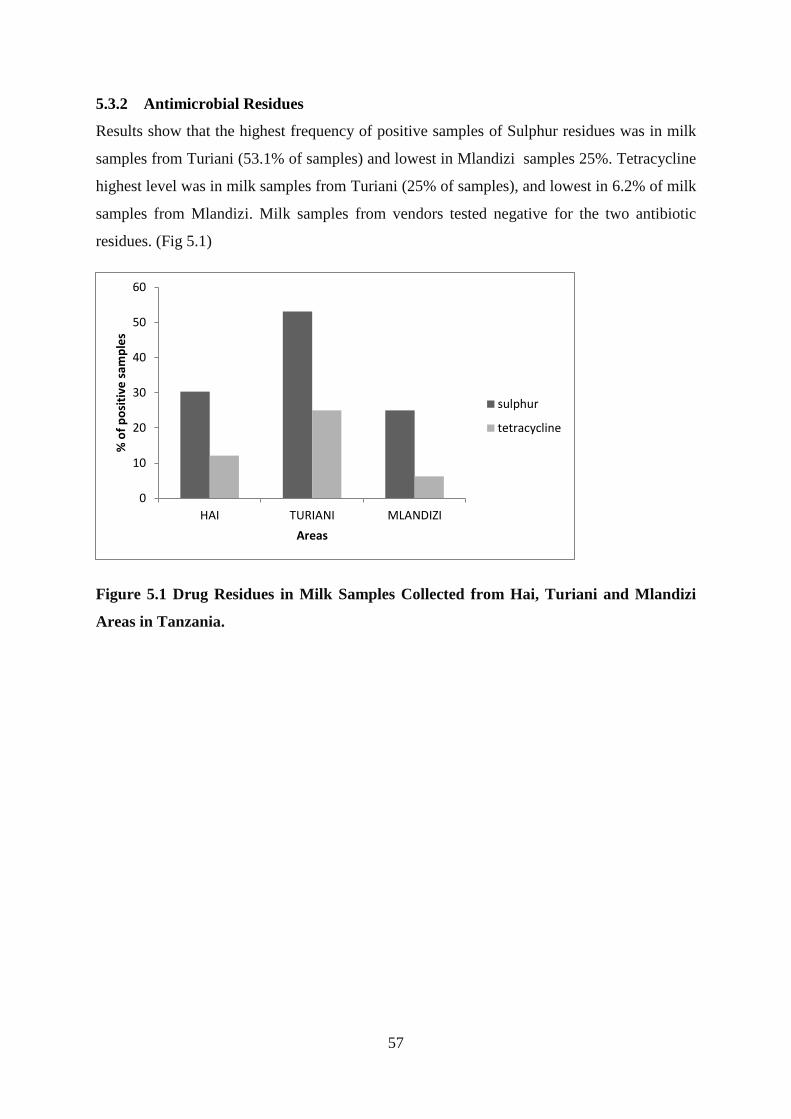
57
5.3.2 Antimicrobial Residues
Results show that the highest frequency of positive samples of Sulphur residues was in milk
samples from Turiani (53.1% of samples) and lowest in Mlandizi samples 25%. Tetracycline
highest level was in milk samples from Turiani (25% of samples), and lowest in 6.2% of milk
samples from Mlandizi. Milk samples from vendors tested negative for the two antibiotic
residues. (Fig 5.1)
Figure 5.1 Drug Residues in Milk Samples Collected from Hai, Turiani and Mlandizi
Areas in Tanzania.
0
10
20
30
40
50
60
HAI TURIANI MLANDIZI
% o
f p
osi
tive
sam
ple
s
Areas
sulphur
tetracycline

58
5.4 DISCUSSION
The presence of Sulphonamide and Tetracycline antibiotic residue is of concern in Tanzania.
There is risk associated with consumption of milk based products due to the presence of drug
residues given that 50% of the tested milk samples contained drug residue. The introduction
of a penalty scheme which fines producers who submit milk that tests positive or withdrawal
of dairy licences where they are required can act as deterrents. In Europe, the production of
organic milk is an incentive for farmers to produce milk that fetches a higher price per litre
and is free from antibiotics (Gegner, 2001). With the exception of South Africa, Zimbabwe
and Kenya in Sub-Saharan Africa (where payment schemes screen for antibiotic residues),
antibiotic residues may be high, exposing milk consumers to undesirable health effects
associated with drinking milk with residues of antibiotics.
Some farmers were selling milk from treated animals to collection centres so their milk tested
positive for drug residues contrary to their responses in the interviews where they indicated
that they observed the withdrawal period. Milk samples from vendors tested negative for drug
residues.
The absence of residues in milk from vendors can be explained by the fact that vendors mix
the milk from different farmers so there is dilution effect in milk samples from the vendors. If
milk containing drug residues is with milk from farmers who are not using antibiotics the test
may no longer be sensitive enough to pick up the lower concentration of antibiotic residues as
the sensitivity for this test is 0.050ppb at the European Union maximum residue limit.
Physical-chemical properties of milk are important components since they determine both
health and processing aspects of milk. They are affected by breed with local breeds having
higher fat content of up to 6.3% but in exotic dairy breeds that usually ranges from 3.5-4.8%
(Singh and Pratap, 2014). Results from this study show that milk from the farmers and
vendors meets the composition standards, this was in agreement with (Séverin, 2013) who
found milk with normal physical chemical properties in his study at Côte D’ivoire. The Fat
content of the milk in the Hai District was found to be within the range of fat content for Bos
indicus and Bos Taurus cows and is above the minimum of 3% which is required for
processing milk (Lues et al, 2010). In almost all aspects were the same for both actors and
these results can be caused by the milk vending system in Hai District. The vendors had their
permanent buyers who were Regional Hospitals, schools and hotel owners in Moshi Town, so
they don’t adulterate their milk to keep their customers. This different from the study by
59
(Lubote et al., 2014) in Arusha in which vendors moved to households to sell the milk and
they had no permanent customers for their milk. Also from the survey, all respondents said
that they were spending only two hours to finish up selling their milk so milk was preserved
from deterioration in quality.
5.5 CONCLUSION
The study confirms the presence of Tetracyclines and Sulphur in the milk samples from the
study area as well as the two added areas for this aspect. Milk samples from vendors were all
negative for the two drugs. This can be caused by dilution effect since these vendors were
buying the milk from the bulk tank in the MCC’s with milk mixed from all farmers. The
presence of drug residues in milk poses threats to consumers’ health so this creates the need
for the regulatory agencies in the country to enforce farmers comply with the set regulations
through improving the policy on milk quality and act according to the laws in place. The milk
composition of milk from both farmers and vendors was found to be at acceptable levels for
further processing. This gives farmers from Hai District an opportunity to look for a better
paying market for their milk because the compositional quality of their milk is assured as it
was proved by this study.
60
CHAPTER SIX
6 GENERAL DISCUSSION CONCLUSION AND RECOMMENDATIONS
6.1 General Discussion
The observed levels of bacteria load for both TBC and TCC in milk from the study area were
in the acceptable limits according to EAC Standards because they were below 2x10⁶cfu/ml
indicating the improved milk handling by the participants in the study area. There were some
few farmers in the study area with mean bacterial count above two million in their milk, the
high count in milk samples for these groups of farmers can be explained as the failure of
adherence to clean milking and milk production storage and handling as many farmers were
using plastic jerry cans to transport their milk to collection centres. The types of containers
used were difficult to clean thoroughly. Although the majority of milk samples was within
grade II of the milk quality there is need to educate farmers so that quality use of approved
milking structures like milking parlours would help in lowering the bacterial counts in milk
from farmers in the study area and so the proportion of farmers with high-quality milk
increases.
High levels of the total bacterial count of milk from vendors compared to the samples from
the farmers can be explained by the lack of cold chain for vendors when transporting milk so
increases bacterial multiplication in their milk.
The presence of E.coli in some milk samples for both farmers and vendors reflects the
contamination of milk with faecal materials. It poses a risk to the health of consumers of raw
milk and milk products from such milk. Milk and dairy products should be free from E.coli
(EAC, 2006). Recovery of E.coli from fresh raw milk is an indicator of the possible presence
of other pathogenic microorganisms such as Salmonella which are also of faecal origin.
The presence of Sulphonamides and Tetracyclines in milk samples Hai, Turiani and Mlandizi
is an indication of lack of adherence to the drug withdrawal period after administration of
antibiotics to sick milking animals. This is an indication of dishonesty since from the
interviews, farmers admitted that they should not be selling such milk and indicated that they

61
do not sell the milk from animals on treatment. Lack of adherence to the practice can be due
to fear of financial losses a farmer will incur due to throwing away the milk.
The fat and total solids content meet the minimum standards required for processing of dairy
products. The low levels of adulteration with water could be due to fear of financial loss since
most MCC’s use the lactometer as the basis for accepting milk from farmers.
In conclusion, information generated from this study on milk quality in this study can be used
in the development of strategies to boost the small-scale dairy sector in Tanzania. The
information will also be useful to all stakeholders in the dairy sector in Tanzania.
6.2 General Conclusion
The Total Bacterial Count and Total Coliform Count observed results indicate that there is
some level of use of hygienic practices among some farmers. While the Coliform Counts in
the analysed milk samples were in the acceptable level of raw milk qualities as per EAC. The
use of proper containers made of stainless and seamless aluminium cans will reduce this
figure even further.
The presence of E.coli reflects milk contamination of faecal origin. Even though no
pathogenic strains of E.coli were identified, the coliforms are of public health concern and
there is a need for the small-scale dairy farmers to introduce additional measures such as
cleaning their hands before start milking, avoid contamination of the milk utensils and milk
to ensure proper milking and milk handling hence reduce milk contamination. The physical-
chemical properties of milk for all the participated villages were in the acceptable quality for
processing.
The study confirmed the presence of Tetracycline and Sulphonamide antibiotics residues in
milk from farmers but not from vendors in the study area. The source of these drugs is mostly
due to lack of compliance to withdrawal period after administering drugs to the sick milking
animals. The presence of antibiotic residues in milk is of public health concern.
6.3 Recommendations
Extension of education in all aspects of clean milk production is important in developing
awareness among small-scale dairy farmers to follow the set standards procedures for milking
and proper milk storage.

62
The available laws and regulations need to be revised and developed where they are not
available to take care of possible sources of spoilage for example replacement of plastic milk
storage containers with the use of stainless steel cans for milk storage. These can be easily
cleaned and removes the bacteria that build up in milk storage containers and lowers the
bacterial counts in milk from the Hai District.
Establishing a system in which milk will be graded and priced according to the quality will
involve introducing a quality-based payment system. This will have financial rewards for
milk which are clean and penalties for low-quality milk. Such a scheme can screen for
antibiotic residues and adulteration with other materials such as flour and butter at MCC’s.
Other milk tests apart from the use of lactometer at MCC’s such as alcohol test, Resazurin
test and Clot -On Boiling test can be included as platform tests.
Educational programmes and awareness campaigns should be conducted by all dairy
stakeholders to enlighten dairy producers and consumers on dangers posed by drug residues
in milk to public health and the dairy processing industry. The existing food regulations and
Acts should be reinforced to take care of drug residues in milk and other dairy products. A
weak regulatory structure such as the one currently exists allows farmers to sell milk
containing drug residues due to fear of financial losses that occur due to the discarding of the
milk with antibiotic residues.
63
REFERENCES
AbdulSamad, M., Muhammad, K., Khaskhul, A and Hussain, S. 2014 Detection of Anti-
microbial drug residues in milk marketed at different areas of Sindh Province
Pakistan. JAVS 7: 65-69. Available from www.edu.com visited on 22 December
2015.
A.P. Njombe, D. Y. M. N. M. and M. N. M. 2011. United Republic of Tanzania Ministry of
Livestock and Fisheries Development the Tanzania Dairy Industry : Status.
Abebew, D. 2008. Detection and determination of Oxytetracycline and Penicillin antibiotic
residue levels in bovine bulk milk from Debrezeit and Nazareth Dairy Farms. Anal.
Chim. Acta 432:325–346.
Achchuthan, S., and R. Kajananthan. 2012. A Study on Value Chain Analysis in Dairy Sector
Kilinochchi District, Sri Lanka. Glob. J. Manag. Bus. Res. 12:1–15.
Adetunji, V. O. 2011. Effects of processing on antibiotic residues (streptomycin, Penicillin-G
and tetracycline) in soft cheese and yoghurt processing lines. Pakistan J. Nutr.
10:792–795.
Adugna, M., E. Seifu, A. Kebeded, and R. Doluschitz. 2013. Quality and Safety of Camel
Milk along the Value Chain in Eastern Ethiopia. Int. J. Food Stud. 2:150–157.
Agena, S., E. Burstedt, and K. Holtenius. 2003. Effects of Feeding Intensity During the Dry
Period . 1 . Feed Intake , Body Weight , and Milk Production. Am. Dairy Sci. Assoc.
86:870–882.
Alemayehu, N., D. Hoekstra, and A. Tegegne. 2012. Smallholder dairy value chain
development : The case of Ada ’ a woreda , Oromia Region , Ethiopia. Available
from:
http://cgspace.cgiar.org/bitstream/handle/10568/25118/AdaDairy_CaseStudy.pdf?seq
uence=1
Amanor Dodoo, Jacob Gatheca, Shelley Alberts, K. M. 2013. Africa’s Consumer Story.
Amarja Satish. 2013. Role Of Dairy Industry In Rural Development. IJARET 4:8–16.
Anderson, M., P. Hinds, S. Hurditt, P. Miller, D. McGrowder, and R. Alexander-Lindo. 2011.
The microbial content of unexpired pasteurized milk from selected supermarkets in a
developing country. Asian Pac. J. Trop. Biomed. 1:205–211.
64
Berry, H. and. 2004. Quality of the milk supply : European regulations versus practice. In: p.
1–9.
Brown, H. 2015. Assessment of Microbiological Quality of Raw Milk and Antimicrobial
Susceptibility of Selected Milk-Borne Bacterial in Kilosa and Mvomero Districts
Tanzania. Masters Thesis. Sokoine University of Agriculture.
Bytyqi, H., S. Bigler, S. Muji, A. Jahja, and U. Zaugg. 2011. Survey on Raw Milk Quality in
Kosovo. Food Nutr. Sci. 2:414–421.
Clau, M., D. Bahmann, and S. Schmidt. 2013. Detection of antibiotic residues in food –
pitfalls and optimization of agar diffusion tests in comparison with commercial test
kits. :359–366.
Debela, G. T. 2015. Microbiological quality and impact of hygienic practices on raw cow ’ s
milk obtained from pastoralists and market . The case of Yabello District , Borana
zone ,. Glob. J. Food Sci. Technol. 3:153–158.
Doyle, M. M., S. Garcia, E. Bahati, D. Karamuzi, and J. S. Cullor. 2015. Microbiological
analysis of raw milk in Rwanda. African J. Food Sci. Technol. 6:141–143.
EAC. 2006. East African Standard Pasteurized milk — Specification. :1–5.
EADD. 2010. EAST AFRICA DAIRY Unlocking the Potential of. 6:1–12.
Garcia, O., A. Saha, K. Mahmood, A. Ndambi, and T. Hemme. 2006. Dairy Development
Programs in Andhra Pradesh, India : Impacts and Risks for Small-scale Dairy Farms.
Available from: ttp://www.fao.org/ag/againfo/programmes/en/pplpi/docarc/wp38.pdf
Gaurav, A., J. P. S. Gill, R. S. Aulakh, and J. S. Bedi. 2014. ELISA based monitoring and
analysis of tetracycline residues in cattle milk in various districts of Punjab. Vet.
World 7:5–8.
Gegner, L. E. 2001. Appropriate Technology Transfer for Rural Areas Value - Added Dairy
Options. :1–6. Available from: www.attra.ncart.org
Goodluck .C Mchau. 2011. Tanzania Milk Processing Association Tampa Improving
Competitiveness of the Diary Sector Through Rationalization of the Regulatory
Framework. :1–57.
Grimaud, P., M. Sserunjogi, M. Wesuta, N. Grillet, M. Kato, and B. Faye. 2009. Effects of
season and agro-ecological zone on the microbial quality of raw milk along the
various levels of the value chain in Uganda. Trop. Anim. Health Prod. 41:883–890.
65
Hadrya, F., A. Elouardi, D. Benali, and H. Hami. 2012. Bacterial Quality of Informally
Marketed Raw Milk in Kenitra City , Morocco. Pakistan J. Nutr. 11:760–767.
Hahlani, C. D., and J. Garwi. 2014. Operational Challenges to Smallholder Dairy Farming :
The Case of Mayfield Dairy Settlement Scheme in Chipinge District of Zimbabwe.
IOSR J. Humanit. Soc. Sci. 19:87–94.
Hillerton, J. E., and E. A. Berry. 2004. Q m s : e r v p. :207–214.
Huka, H., C. Ruoja, and A. Mchopa. 2014. Price Fluctuation of Agricultural Products and its
Impact on Small Scale Farmers Development : Case Analysis from Kilimanjaro
Tanzania. Eur. J. Bus. Manag. 6:155–161.
Hussaina, A., * S. A., H. A. Shakira, J. I. Qazia, K. Alic, and N. Ullahb. 2014. Prevalence of
Escherichia coli in milk and different milk products sold under market conditions at
Lahore. Sci. J. Anim. Sci. 3(1) 22-26 3:22–26.
Hyera, E. 2014. Evaluation of Microbial Contamination Along the Milk Value Chain in Two
Districts of Tanzania Masters Thesis of Sokoine University of Agriculture.
Jahed, K. and. 2007. Chemical Contaminants in Milk and Public Health Concerns : A
Review. Int. J. Dairy Sci. 2:104–115.
Jensen, M. F., J. Keyser, and N. Strychacz. 2010. Non-Tariff Barriers and Regional Standards
in the EAC Dairy Sector. :1–7.
Jones, G. M. 2009. On-farm Tests for Drug Residues in Milk. Department of Dairy Science
Virginia Tech University.
K. Marichamy, N. A. and S. L. 2014. Constraints Faced By Rural Women Dairy Farmers In
Virudhunagar District. Aygrt.Isrj.Net 3. Available from:
http://aygrt.isrj.net/UploadedData/1896.pdf
Kaindi, D. W. M., E. Schelling, J. Wangoh, J. K. Imungi, Z. Farah, L. Meile, and N.
Benkeblia. 2011. Microbiological quality of raw camel milk across the Kenyan
market chain. Food 5:79–83. Available from:
http://www.cabdirect.org/abstracts/20113322053.html?resultNumber=6&q=Market+milk+Ke
nya
Karimuribo, E. D., P. L. Gallet, N. H. Ng, M. K. Matiko, and L. B. Massawe. 2015. Status
and factors affecting milk quality along the milk value chain : a case of Kilosa district
, Tanzania. Livest. Res. Rural Dev. 27(3) 2015 27:1–8.

66
Kaush Arha, Sarah Cleaveland, R. K., and and N. M. Maria Mashingo, Amos Omore, Hamza
Mehehe. 2015. Tanzania Livestock Modernisation Initiative.
Keskin, O. Y., and Z. Gulsunoglu. 2012. Quality Management Systems in Dairy Industry. In:
Proceedings of the 2012 International Conference on Industrial Engineering and
Operations Management Istanbul, Turkey, July 3 – 6, 2012. p. 523–531.
Khaskheli, M., R. S. Malik, M. A. Arain, A. H. Soomro, and H. H. Arain. 2008. Detection of
ß - Lactam Antibiotic Residues in Market Milk. Pakistan J. Nutr. 7:682–685.
Kifaro, G. C. 2011. A Review of National and Local Government Policies, Rules,
Regulations Standards and Codes of Practices Influencing the Milk Value Chain in
Tanzania.
Kim, V. Van Der Linden, and D. De Boer. 2009. An analysis of milk collection centers in
Tanzania.
Kivaria, F. M. 2006. Prospects and Constraints of Smallholder Dairy Husbandry in Dar es
Salaam Region, Tanzania. 35:209–215.
Kivirand, K., M. Kagan, and T. Rinken. 2015. Biosensors for the Detection of Antibiotic
Residues in Milk. In: Biosensors. p. 1–32.
Kumar, R., and A. Prasad. 2010. Detection of E . coli and Staphylococcus in Milk and Milk
Products in and around Pantnagar. Vet. World, 2010, Vol.3(11)495-496 3:495–496.
Kurwijila, L. R., and L. A. Mtenga. 2011. Value chain analysis of livestock production in
Tanzania : the example of the beef and dairy industry 1.
Kurwijila, L. R. 2012. Optimal Exploitation of the Dairy Potentials of East Africa ’ s Lake
Victoria Basin : A Case Study of Mara Region of Tanzania. In: Trading-Up Through
Regional Intergration: Can a Productive capacity-driven strategy provide the answer
for the EAC economies? p. 1–28.
Lubote, R., F. Shahada, and A. Matemu. 2014. Prevalence of Salmonella spp . and
Escherichia coli in raw milk value chain in Arusha, Tanzania. Am. J. Res. Commun.
2:1–13.
Lues, J. F. R., H. De Beer, A. Jacoby, K. E. Jansen, and K. Shale. 2010. Microbial quality of
milk , produced by small scale farmers in a peri-urban area in South Africa. 4:1823–
1830.

67
Mansouri-Najandi, L, Sharifi, H. R. 2013. Quality of raw milk in Kerman province. IVJM
7:293–297.
Marcotty, T., F. Matthys, J. Godfroid, L. Rigouts, G. Ameni, N. Gey van Pittius, R. Kazwala,
J. Muma, P. van Helden, K. Walravens, L. M. de Klerk, C. Geoghegan, D. Mbotha,
M. Otte, K. Amenu, N. Abu Samra, C. Botha, M. Ekron, a Jenkins, F. Jori, N. Kriek,
C. McCrindle, a Michel, D. Morar, F. Roger, E. Thys, and P. van den Bossche. 2009.
Zoonotic tuberculosis and brucellosis in Africa: neglected zoonoses or minor public-
health issues? The outcomes of a multi-disciplinary workshop. Ann. Trop. Med.
Parasitol. 103:401–411.
Maunsell, F., and G. A. Donovan. 2008. Biosecurity and Risk Management for Dairy
Replacements. Vet. Clin. North Am. - Food Anim. Pract. 24:155–190.
Mdegela, R. H., R. Ryoba, E. D. Karimuribo, E. J. Phiri, T. Løken, O. Reksen, E. Mtengeti,
and N. a Urio. 2009. Prevalence of clinical and subclinical mastitis and quality of
milk on smallholder dairy farms in Tanzania. J. S. Afr. Vet. Assoc. 80:163–168.
Minj, A. K., and N. Behera. 2012. Full Length Research Paper A comparative
microbiological quality assessment of rural and urban milk samples. African J. Food
Sci. Available online http//www.academicjournals.org/AJFS 6:519–523.
MLFD. 2011. United Republic of Tanzania Ministry of Livestock and Fisheries
Development.
Mosu, S., M. Megersa, Y. Muhie, and D. Gebremedin. 2013. Bacteriological quality of
bovine raw milk at selected dairy farms in Debre Zeit town , Ethiopia. Compr. J. Food
Sci. Technol. Res. 1:1–8.
Msuya, B. 2012a. Dairy Value Chain and Markets Analysis for the Sothern Highlands of
Tanzania Milk Shed.
Msuya, B. 2012b. Dairy Value Chain and Markets Analysis for the Sothern Highlands of
Tanzania Milk Shed.
Msuya, E. E. 2012. A Dairy Value Chain and Market Eastern Milk Sheds : Contributing to
Development Process.
Muchichu, R. N. 2014. The sustainability of dairy development in Tanzania : adoption of a
Participatory Market Chain Approach System.
68
Muhammad, Muhammad Rizwan, S. ullah and N. B. 2014. Screening of Fresh , Boiled and
Pasteurized Milk for. World J. Dairy Food Sci. 9:51–56.
Muriuki, H. . 2011. FAO, Dairy development in Kenya.
Mwakalinga H.A, Leif, E. 2010. Rural Livelihood Development Company Consulting
Services for carrying out a Survey on Dairy Products Market in Tanzania. Final Draft
Report.
Navrátilová, P., I. Borkovcová, M. Dračková, B. Janštová, and V. Lenka. 2009. Occurrence
of tetracycline, chlortetracyclin, and oxytetracycline residues in raw cow’s milk.
Czech J. Food Sci. 27:379–385.
Navrátilová, P. 2006a. Screening Methods Used for the Detection of Veterinary Drug
Residues in Raw Cow Milk – A Review. Czech J. Food Sci. 26:393–401.
Navrátilová, P. 2006b. Screening Methods Used for the Detection of Veterinary Drug
Residues in Raw Cow Milk – A Review. Czech J. Food Sci. 26:393–401.
Nell, A. J., H. Schiere, and S. Bol. 2013. Quick Scan Dairy Sector Tanzania.
Ngasala, J. U. B., H. E. Nonga, and M. M. A. Mtambo. 2015. Assessment of raw milk quality
and stakeholders’ awareness on milk-borne health risks in Arusha City and Meru
District, Tanzania. Trop. Anim. Health Prod. 47:927–932. Available from:
http://link.springer.com/10.1007/s11250-015-0810-y
NMPF. 2011. Milk and Dairy Beef Drug Residue Prevention Producer Manual of Best
Management Practices.
Nonga, H. E., H. A. Ngowi, R. H. Mdegela, E. Mutakyawa, G. B. Nyahinga, R. William, and
M. M. Mwadini. 2015. Survey of physicochemical characteristics and microbial
contamination in selected food locally vended in Morogoro Municipality , Tanzania.
BMC Res. Notes:1–10. Available from: "http://dx.doi.org/10.1186/s13104-015-1716-
5
Noordhuizen. 2005. Quality control on dairy farms FAO. In: Quality Control on Dairy Farms
with Emphasis on Public Health, Food Safety, Animal Health and Welfare. p. 39–55.
Nwankwo, Amaechi, I. U., N. Adiele, and A. and Winnie. 2015. Microbial Evaluation of
Raw Milk from Dairy Farms in Udi. J. Agric. Vet. Sci. 8:60–65.
69
Omore, a., T. Lore, S. Staal, J. Kutwa, R. Ouma, S. Arimi, and E. Kang’ethe. 2005
. Addressing the public health and quality concerns towards marketed milk in Kenya.
Available from: http://mahider.ilri.org/handle/10568/2177
Omore, a., S. J. Staal, E. L. K. Osafo, L. Kurwijilla, D. Barton, N. Mdoe, G. Nurah, and G.
Aning. 2004. Market mechanisms, efficiency, processing and public health Risks in
peri-urban dairy product markets: Synthesis of Findings for Ghana and Tanzania.
Opiyo and Wambugu. 2011. Policy And Development Productivity Trends And Performance
Of Dairy Farming In Kenya.
Orregård, M. 2013a. Quality analysis of raw milk along the value chain of the informal milk
market in Kiambu County , Kenya. Swedish. Masters Thesis University of
Agricultural sciences.
Orregård, M. 2013b. Quality analysis of raw milk along the value chain of the informal milk
market in Kiambu County , Kenya.
Pennington. 2005. The Public Inquiry into the September 2005 Outbreak of E . coli O157 in
South Wales Summary.
Perkins, N. R., D. F. Kelton, K. J. Hand, G. MacNaughton, O. Berke, and K. E. Leslie. 2009.
An analysis of the relationship between bulk tank milk quality and wash water quality
on dairy farms in Ontario, Canada. J. Dairy Sci. 92:3714–3722. Available from:
http://dx.doi.org/10.3168/jds.2009-2030
Pim, V. Van Der Linden, and D. De Boer. 2009. An analysis of milk collection centers in
Tanzania.
R.Sudhasaravanan, and and S. Binukumari. 2015. Microbial Quality of Raw and Pasteurized
Milk Samples Collected From Different Regions of Madurai District, (T.N.) India\n.
IOSR J. Environ. Sci. Toxicol. Food Technol. 9:71–73. Available from:
http://www.iosrjournals.org/iosr-jestft/papers/vol9-issue1/Version-1/L09117173.pdf
Radder, S. K., and S. K. Bhanj. 2011. Perceptions of dairy farmers of Gadag district in
northwestern part of Karnataka state, India regarding clean milk production. Vet.
World 4:79–81.
Rejeev, B., W. Nadiah, and M. Suguna. 2012. Microbiological quality evaluation of goat
milk collected from small- scale dairy farms in Penang Island , Malaysia. Int. Food
Res. J. 19:1241–1245Accessed on 26 May 2015.
70
Salamon, R. 2006. R. Salamon, É. Varga-Visi, P. Sára, Zs. Csapó-Kiss, J. Csapó.
Scanagri. 2005. Value-Chain Analysis and Socio-economic Assessment of the Dairy Industry
in Tanzania.
Schooman, L., and E. S. Swai. 2011. Marketing, handling and physical quality of raw
marketed milk in Tanga region of Tanzania. Livest. Res. Rural Dev. 23:1–8.
Séverin, K. K. 2013. Evaluation of Physico-Chemical, Nutritional and Microbiological
Quality of Raw Cow’s Milk Usually Consumed in the Central Part OF CÔTE
D'IVOIRE. African J. Food Agric. Nutr. Dev. 13:7888–7904.
Shojaei, Z.A and Yadollahi, A. 2008. Physical Chemical and Microbiological Quality of Raw
Pasteurized and UHT Milk in Shops. Asian J. Sci. Res. 1:532–538.
Singh, A., and A. Pratap. 2014. Comparison of Physicochemical Properties of Raw Milk
from Indigenous and Exotic Cows at Allahabad. Int. J. Sci. Res. 3:2012–2014.
Sperber, W. H. 2009. Introduction to the Microbiological Spoilage of Foods and Beverages
. In: Food Microbiology. p. 1–40.
Street, A., and D. Bogor. 2013. Prevalence and Sources of Contamination of Escherichia coli
and Salmonella spp . In Cow Milk Dangke , Indonesian Fresh Soft Cheese Faculty of
Veterinary Medicine , Bogor Agriculture University ,. Glob. Vet. 11:352–356.
Swai, E. S., M. J. Bryant, E. D. Karimuribo, N. P. French, N. H. Ogden, J. L. Fitzpatrick, and
D. M. Kamarage. 2005. A cross-sectional study of reproductive performance of
smallholder dairy cows in coastal Tanzania. Trop. Anim. Health Prod. 37:513–525.
Available from: http://centaur.reading.ac.uk/9228/
Swai, E. S., E. D. Karimuribo, and D. M. Kambarage. 2010. Risk factors for smallholder
dairy cattle mortality in Tanzania. J. S. Afr. Vet. Assoc. 81:241–246.
Swai, E. S., and L. Schoonman. 2011. Microbial quality and associated health risks of raw
milk marketed in the Tanga region of Tanzania. Asian Pac. J. Trop. Biomed. 1:217–
222.
TechnoServe. 2012. Value Chain Analysis.
Tekinsen, K. K., M. Elmali, and Z. Ulukanli. 2007. Microbiological Quality of UHT Milk
Consumed in Turkey. Internet J. Food Saf. 7:45–48.
Theodor. 1982. Detailed Information for Escherichia coli.
71
Torsten Hemme, O. G. and A. S. 2005. The Economics of Milk Production in Orissa , India ,
with Particular Emphasis on Small-scale Producers.
Uddin, M. N., M. B. Uddin, A. M. M, M. M. Hassan, M. M. H. Khan, and J. A. S. Adv. 2012.
Small scale dairy Farming for livelihoods of rural farmers: Constraint and prospect in
Bangladesh. J Anim Sci Adv 2:543–550. Available from:
http://www.grjournals.com/portals/grjournals/JASA/Vol2 Issue6/JASA-2012-06-543-
550.pdf
University, I. S. 2009. Enterohemorrhagic Escherichia coli Infections Enterohemorrhagic
Escherichia coli Infections.
USDA. 2011. Quantitative Analysis of Bacteria in Foods as Sanitary Indicators.
Varga, L. 2007. Microbiological quality of commercial dairy products. Department of Dairy
Science, Institute of Food Sciences, University of West Hungary. In: Formatex. p.
487–494.
Welearegay, H., Z. Yilma, and Y. Tekle-giorgis. 2012. Hygienic practices and
microbiological quality of raw milk produced under different farm size in Hawassa ,
southern Ethiopia. Agric. Res. Rev. 1:132–142.
Yuen, S. K., C. F. Yee, and F. H. Yin. 2012. ISSN 2249-8516 Original Article
Microbiological Quality and the Impact of Hygienic Practices on the Raw Milk
Obtained from the Small-scale Dairy Farmers in Sabah , Malaysia. Int. J. Agric.
Food Sci. 2:55–59.
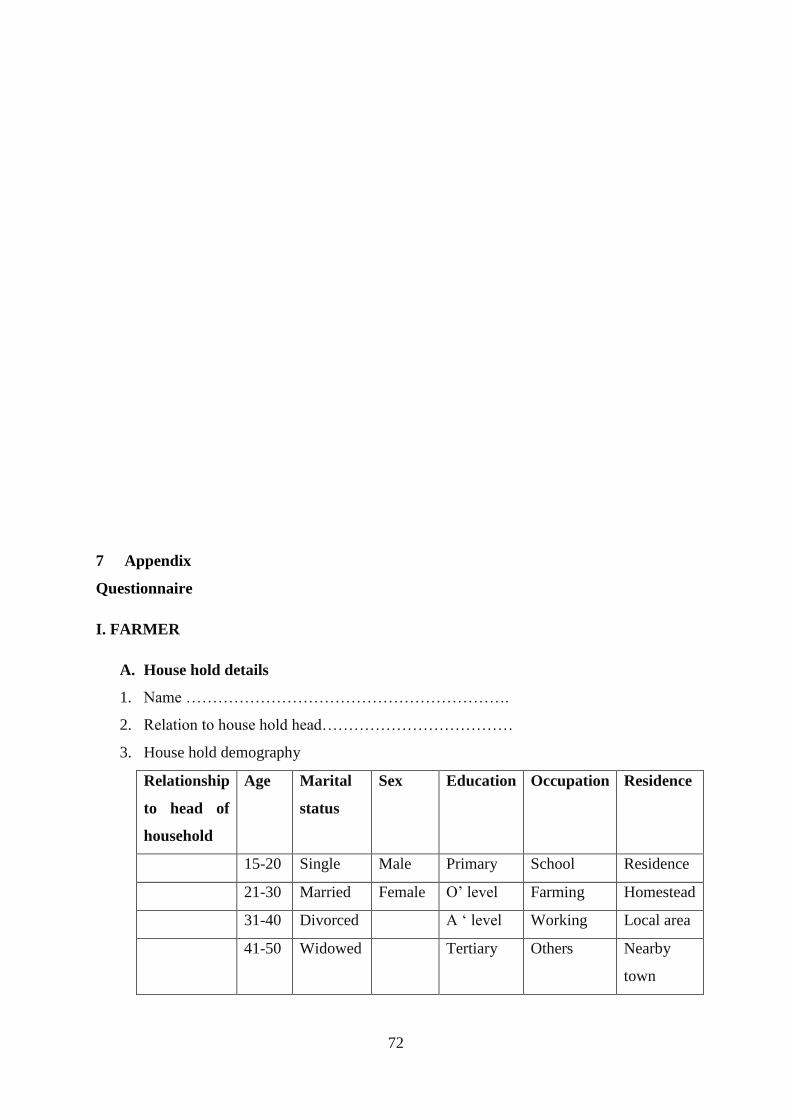
72
7 Appendix
Questionnaire
I. FARMER
A. House hold details
1. Name …………………………………………………….
2. Relation to house hold head………………………………
3. House hold demography
Relationship
to head of
household
Age Marital
status
Sex Education Occupation Residence
15-20 Single Male Primary School Residence
21-30 Married Female O’ level Farming Homestead
31-40 Divorced A ‘ level Working Local area
41-50 Widowed Tertiary Others Nearby
town
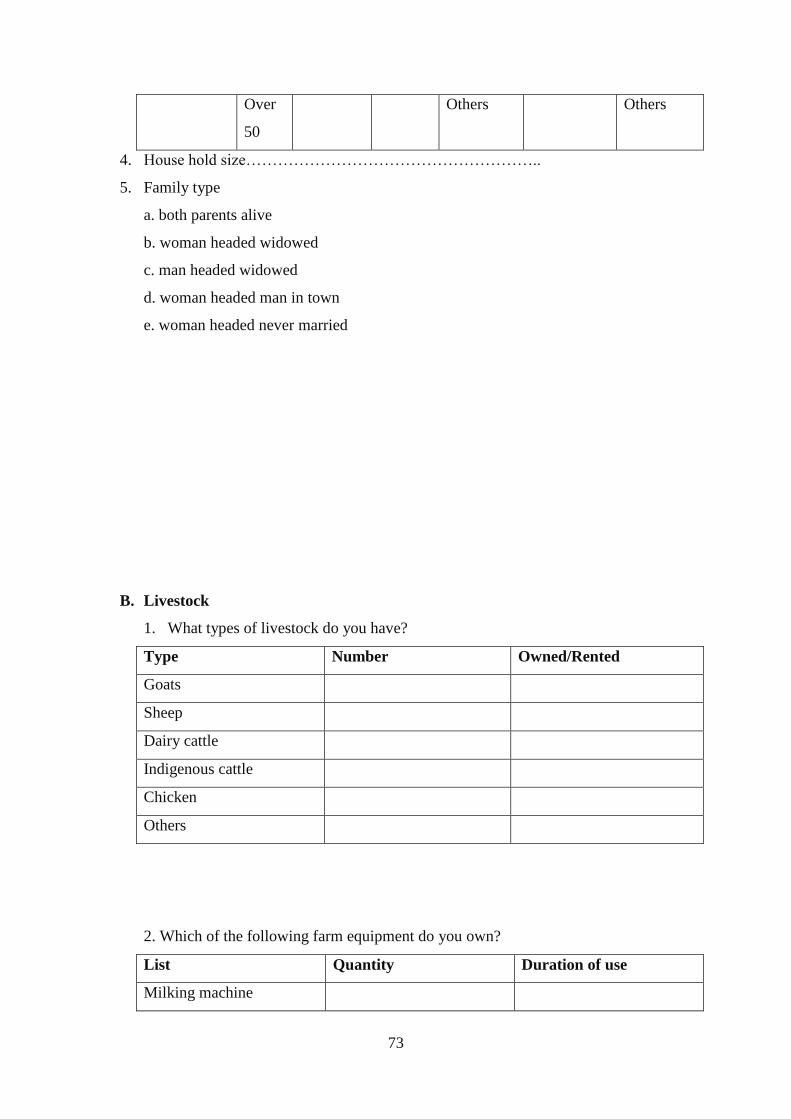
73
Over
50
Others Others
4. House hold size………………………………………………..
5. Family type
a. both parents alive
b. woman headed widowed
c. man headed widowed
d. woman headed man in town
e. woman headed never married
B. Livestock
1. What types of livestock do you have?
Type Number Owned/Rented
Goats
Sheep
Dairy cattle
Indigenous cattle
Chicken
Others
2. Which of the following farm equipment do you own?
List Quantity Duration of use
Milking machine
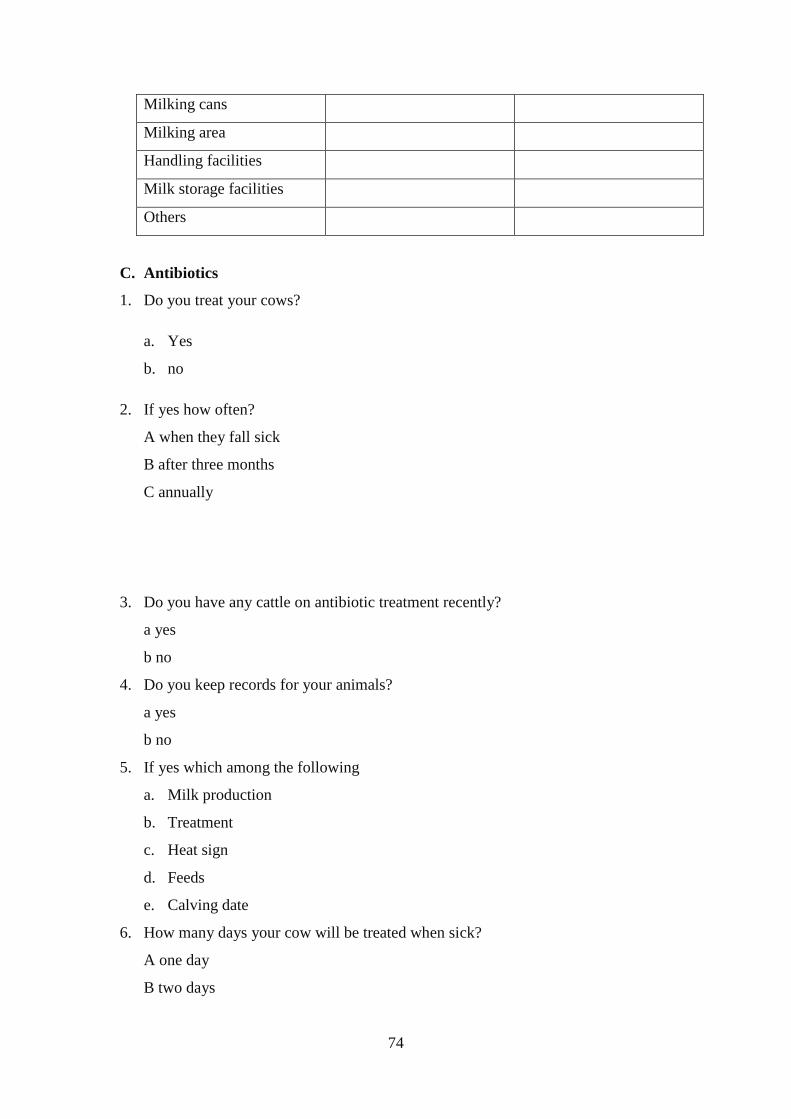
74
Milking cans
Milking area
Handling facilities
Milk storage facilities
Others
C. Antibiotics
1. Do you treat your cows?
a. Yes
b. no
2. If yes how often?
A when they fall sick
B after three months
C annually
3. Do you have any cattle on antibiotic treatment recently?
a yes
b no
4. Do you keep records for your animals?
a yes
b no
5. If yes which among the following
a. Milk production
b. Treatment
c. Heat sign
d. Feeds
e. Calving date
6. How many days your cow will be treated when sick?
A one day
B two days

75
C three days
7. Do you sell milk from cow on treatment?
A no
B yes
8. If not how long do you wait?
A one day
B two days
C three days
9. If you don’t sell the milk what do you do with the milk?..........................................
10. Do you mix the milk from all the milked animals?
A yes
B no
D. Milk handling.
1. What do usually do before milking?....................................................
2. How many times do you milk your animal per day?
a. Twice
b. Thrice
3. If you wash your hands and udder of the animal what do you use?
A hot water
B cold water
4. What is the source of water you use comes from?
A protected source
B open source
5. Do you dry your animal before milking?
A yes
B no
6. What do you use to dry them?
a. Individual towel
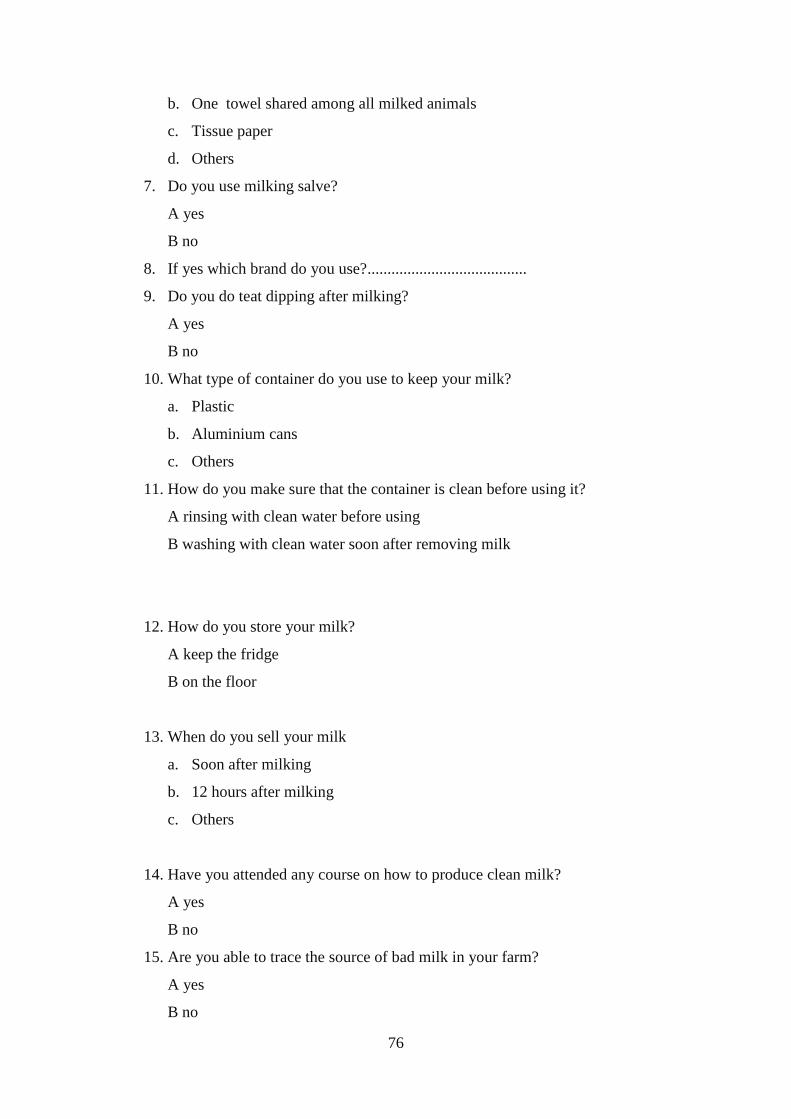
76
b. One towel shared among all milked animals
c. Tissue paper
d. Others
7. Do you use milking salve?
A yes
B no
8. If yes which brand do you use?........................................
9. Do you do teat dipping after milking?
A yes
B no
10. What type of container do you use to keep your milk?
a. Plastic
b. Aluminium cans
c. Others
11. How do you make sure that the container is clean before using it?
A rinsing with clean water before using
B washing with clean water soon after removing milk
12. How do you store your milk?
A keep the fridge
B on the floor
13. When do you sell your milk
a. Soon after milking
b. 12 hours after milking
c. Others
14. Have you attended any course on how to produce clean milk?
A yes
B no
15. Are you able to trace the source of bad milk in your farm?
A yes
B no
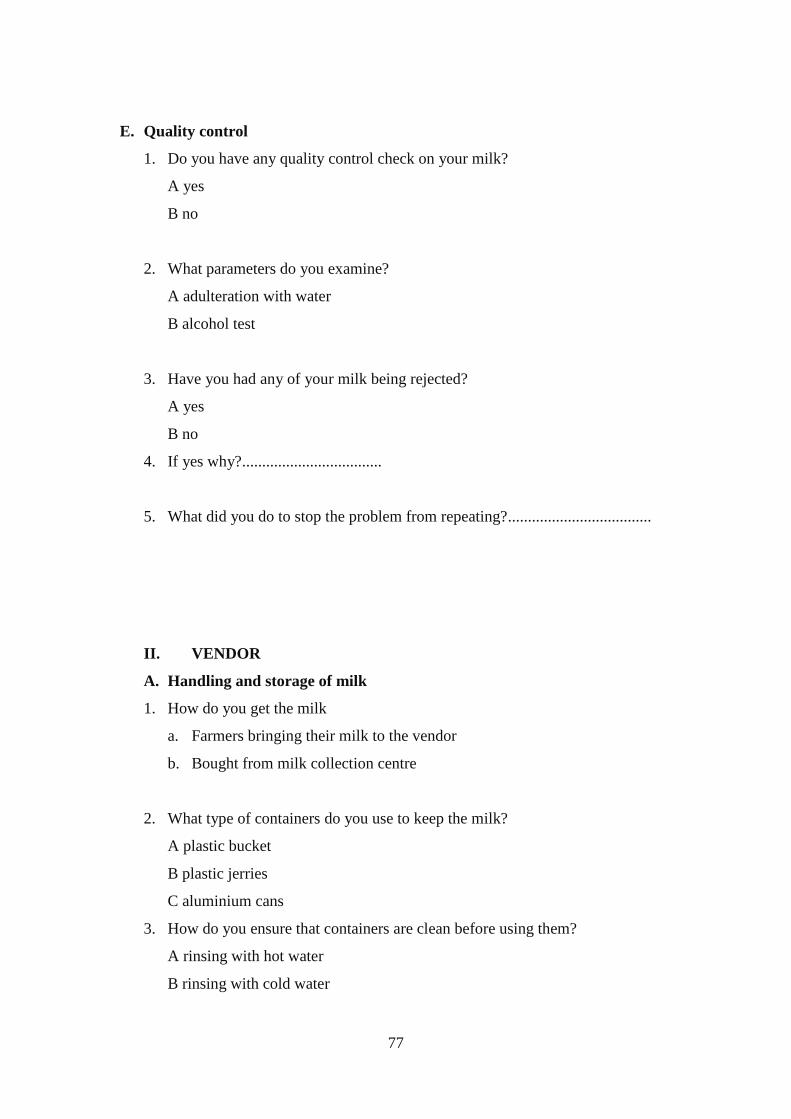
77
E. Quality control
1. Do you have any quality control check on your milk?
A yes
B no
2. What parameters do you examine?
A adulteration with water
B alcohol test
3. Have you had any of your milk being rejected?
A yes
B no
4. If yes why?...................................
5. What did you do to stop the problem from repeating?....................................
II. VENDOR
A. Handling and storage of milk
1. How do you get the milk
a. Farmers bringing their milk to the vendor
b. Bought from milk collection centre
2. What type of containers do you use to keep the milk?
A plastic bucket
B plastic jerries
C aluminium cans
3. How do you ensure that containers are clean before using them?
A rinsing with hot water
B rinsing with cold water

78
4. How long does it take from point of collection to the selling point?
A 1 hour
B 2 hours
5. What type of transport do you use to carry your milk to selling centre?
A public transport
B private car
C motorcycle
6. What is the time taken to finish selling your milk?
A 2 hours
B 3 hours
C 4 hours
7. How many litres do you sell per day?
A Zaidi ya lita 50
B lita 50
C chini ya lita 50
B. Quality control
1. Do you have any milk quality checks in place?
A yes
B no
2. What are they?
A milk adulteration with water
B alcohol test
3. How do you handle the detected defects?
A warning to the farmer
B penalizing the farmer
C rejecting the milk
4. Did u have any complaints about quality of the milk you sell from your customers?
A yes
B no

79
5. What was it about?
A watery milk
B dirty milk
6. How did you handle the situation?............................
7. Are you able to trace the source of bad milk brought to you by farmers?
A yes
B no