2 New Approaches to the Detection of Microbial Plant Pathogens
MICROBIAL RISKS IN WASTEWATER: PATHOGENS AND
ANTIBIOTIC RESISTANCE
Ian Pepper, Brandon Iker, Stefan Walston, Channah Rock
18th European Biosolids and Organic Resources Conference November 19, 2013
Seasonal Occurrence and Reduction
of Viruses and Protozoa in Two
Wastewater Reclamation Facilities in
Southern Arizona
Masaaki Kitajima, Brandon C. Iker, Ian L. Pepper,
Eiji Haramoto, and Charles P. Gerba

• Evaluate wastewater treatment efficacy for virus and protozoa removal
• Look at seasonal effects
• Look for potential model virus indicator
OBJECTIVES

Which will be most abundant:
• Virus that affects small segment of populations e.g. adenovirus
• Or virus excreted by all members of community?
MODEL VIRUS INDICATOR
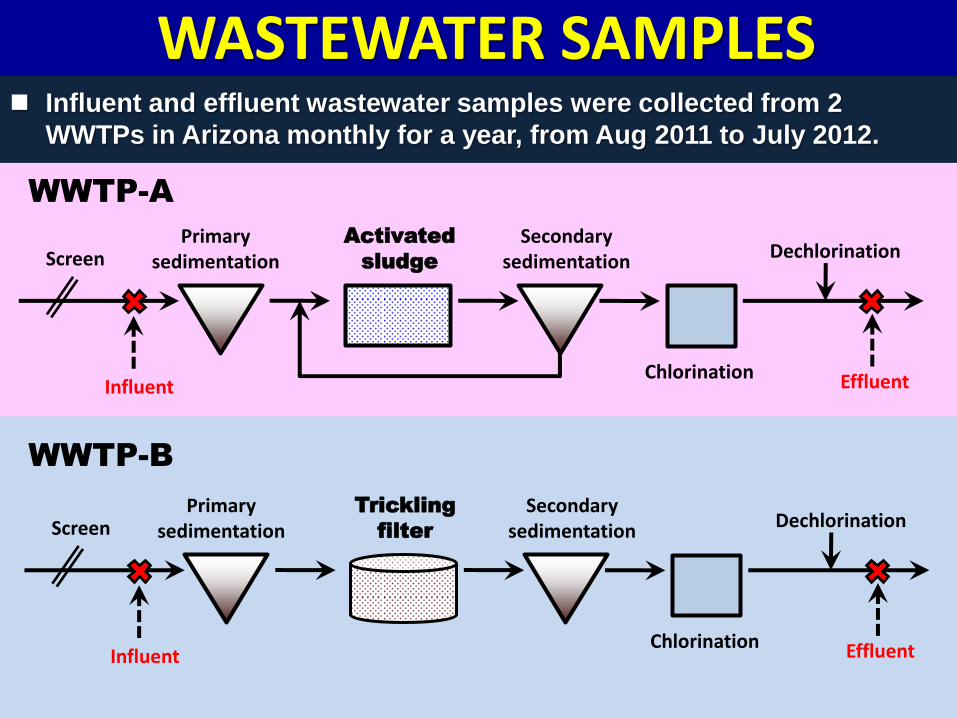
Influent and effluent wastewater samples were collected from 2
WWTPs in Arizona monthly for a year, from Aug 2011 to July 2012.
Influent
Primary sedimentation
Activated
sludge
Secondary sedimentation
Effluent
Dechlorination Screen
Chlorination
WWTP-A
WWTP-B
Influent
Primary sedimentation
Trickling
filter
Secondary sedimentation
Effluent
Dechlorination Screen
Chlorination
WASTEWATER SAMPLES

Simultaneous Recovery of Virus and Protozoa
Negatively charged filter method: simple, rapid, and inexpensive
and can simultaneously recover virus, protozoa, and bacteria.
(RT-)qPCR
Bacteria PCR
Protozoa elution
$3 / sample
$11 / sample
Immunomagnetic separation (IMS)
Microscopic count
Protozoa
Bacteria
Virus
PCR-sequencing
Process control

WWTP-A WWTP-B
ENTEROVIRUS
0
1
2
3
4
5
6
7
8
Aug Sep Oct Nov Dec Jan Feb Mar Apr May Jun Jul
2011 2012
Lo
g1
0 c
op
ies/L
Influent Effluent
(−) 0
1
2
3
4
5
6
7
8
Aug Sep Oct Nov Dec Jan Feb Mar Apr May Jun Jul
2011 2012
Lo
g1
0 c
op
ies/L
Influent Effluent
(−)
Traditional viral target, easily culturable
Well studied RNA virus
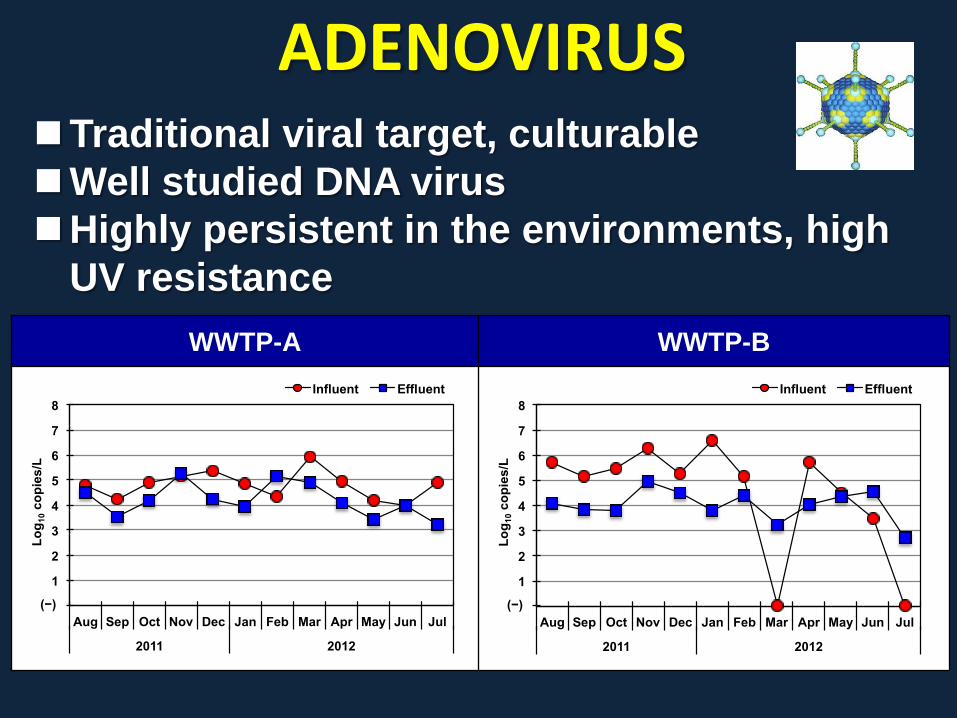
WWTP-A WWTP-B
ADENOVIRUS
0
1
2
3
4
5
6
7
8
Aug Sep Oct Nov Dec Jan Feb Mar Apr May Jun Jul
2011 2012
Lo
g1
0 c
op
ies/L
Influent Effluent
(−) 0
1
2
3
4
5
6
7
8
Aug Sep Oct Nov Dec Jan Feb Mar Apr May Jun Jul
2011 2012
Lo
g1
0 c
op
ies/L
Influent Effluent
(−)
Traditional viral target, culturable
Well studied DNA virus
Highly persistent in the environments, high
UV resistance

GI NOROVIRUS
WWTP-A WWTP-B
0
1
2
3
4
5
6
7
8
Aug Sep Oct Nov Dec Jan Feb Mar Apr May Jun Jul
2011 2012
Lo
g1
0 c
op
ies/L
Influent Effluent
(−) 0
1
2
3
4
5
6
7
8
Aug Sep Oct Nov Dec Jan Feb Mar Apr May Jun Jul
2011 2012
Lo
g1
0 c
op
ies/L
Influent Effluent
(−)
Noroviruses: major cause of viral
gastroenteritis. Five genogroups: GI, GII, GIV
infect humans.

AICHI VIRUS
First data on the occurrence of Aichi virus in
the environments in the US.
WWTP-A WWTP-B
0
1
2
3
4
5
6
7
8
Aug Sep Oct Nov Dec Jan Feb Mar Apr May Jun Jul
2011 2012
Lo
g1
0 c
op
ies/L
Influent Effluent
(−) 0
1
2
3
4
5
6
7
8
Aug Sep Oct Nov Dec Jan Feb Mar Apr May Jun Jul
2011 2012
Lo
g1
0 c
op
ies/L
Influent Effluent
(−)
May cause gastroenteritis in humans.
Emerging waterborne virus.

Pepper Mild Mottle Virus
WWTP-A WWTP-B
0
1
2
3
4
5
6
7
8
Aug Sep Oct Nov Dec Jan Feb Mar Apr May Jun Jul
2011 2012
Lo
g1
0 c
op
ies/L
Influent Effluent
(−) 0
1
2
3
4
5
6
7
8
Aug Sep Oct Nov Dec Jan Feb Mar Apr May Jun Jul
2011 2012
Lo
g1
0 c
op
ies/L
Influent Effluent
(−)
Plant virus that infects chili and bell peppers.
Dietary origin (e.g., up to 107 virus/ml in
Tabasco)
Extremely stable, pass through the human gut.
Highly abundant in influent and effluent throughout the year
(up to 107 copies/L)

0
1
2
3
4
5
6
7
8
Aug Sep Oct Nov Dec Jan Feb Mar Apr May Jun Jul
2011 2012
Lo
g1
0 c
op
ies/L
Influent Effluent
(−)
WWTP-A
0
1
2
3
4
5
6
7
8
Aug Sep Oct Nov Dec Jan Feb Mar Apr May Jun Jul
2011 2012
Lo
g1
0 c
op
ies/L
Influent Effluent
(−)
WWTP-B
SUMMARY 1. Novel viruses
First quantitative data on the seasonal occurrence of
GIV norovirus, sapovirus, Aichi virus, and Pepper Mild
Mottle virus in wastewater in the US.
2. Novel “viral tracers”
Aichi virus and Pepper Mild Mottle virus were
highly abundant in wastewater: conservative viral
indicators in wastewater reclamation systems.
0
1
2
3
4
5
6
7
8
Aug Sep Oct Nov Dec Jan Feb Mar Apr May Jun Jul
2011 2012
Lo
g1
0 c
op
ies/L
Influent Effluent
(−)
0
1
2
3
4
5
6
7
8
Aug Sep Oct Nov Dec Jan Feb Mar Apr May Jun Jul
2011 2012 L
og
10 c
op
ies/L
Influent Effluent
(−)
WWTP-A
WWTP-B
Aichi virus Pepper Mild
Mottle virus

MODEL VIRUS INDICATOR: Pepper Mild Mottle Virus
Based on: • Abdundance • Lack of seasonality • Not removed during treatment
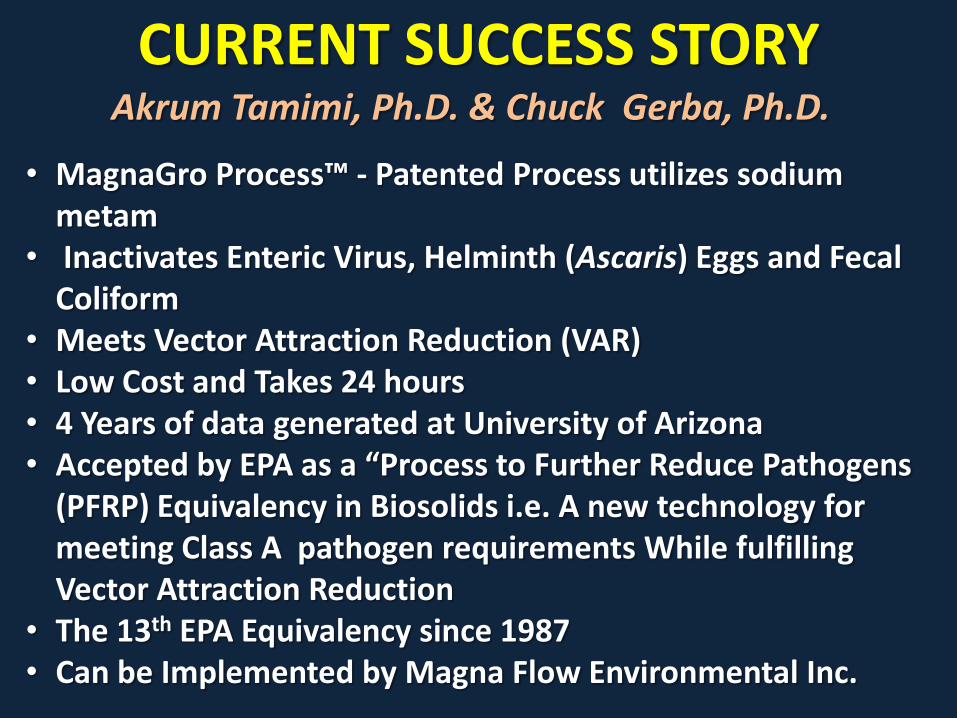
CURRENT SUCCESS STORY
• MagnaGro Process™ - Patented Process utilizes sodium metam
• Inactivates Enteric Virus, Helminth (Ascaris) Eggs and Fecal Coliform
• Meets Vector Attraction Reduction (VAR) • Low Cost and Takes 24 hours • 4 Years of data generated at University of Arizona • Accepted by EPA as a “Process to Further Reduce Pathogens
(PFRP) Equivalency in Biosolids i.e. A new technology for meeting Class A pathogen requirements While fulfilling Vector Attraction Reduction
• The 13th EPA Equivalency since 1987 • Can be Implemented by Magna Flow Environmental Inc.
Akrum Tamimi, Ph.D. & Chuck Gerba, Ph.D.

ANTIBIOTICS AND WASTEWATER TREATMENT
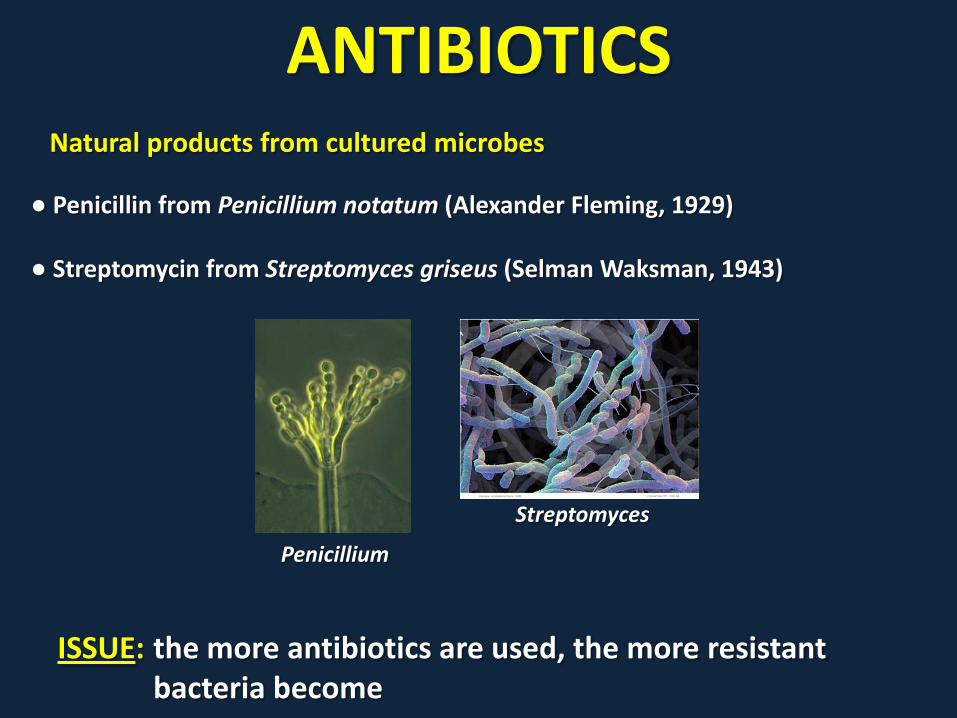
ANTIBIOTICS
● Penicillin from Penicillium notatum (Alexander Fleming, 1929) ● Streptomycin from Streptomyces griseus (Selman Waksman, 1943)
Natural products from cultured microbes
Penicillium
Streptomyces
ISSUE: the more antibiotics are used, the more resistant bacteria become
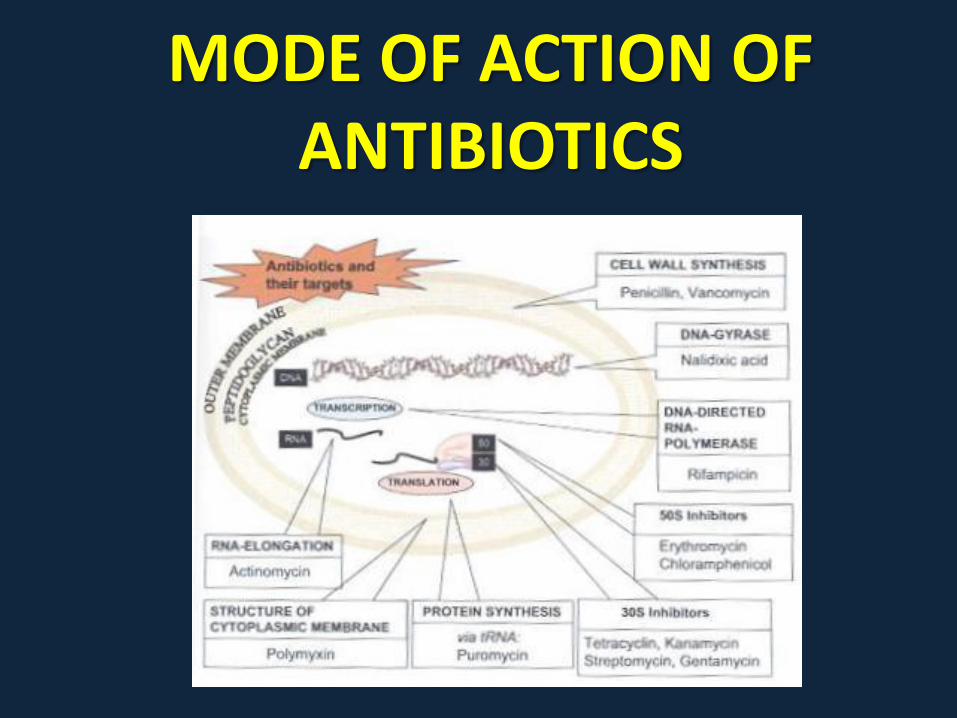
MODE OF ACTION OF ANTIBIOTICS

Does Increasing Solids Retention Time in the Wastewater Treatment Process
Affect the Persistence of Antibiotic Resistance Genes?
Stefan Walston M.S. Graduate Student
DEGRADATION OF TRACE ORGANICS (ANTIBIOTICS)
DURING TREATMENT
Question: Does increased SRT lead to reduced levels of antibiotics?
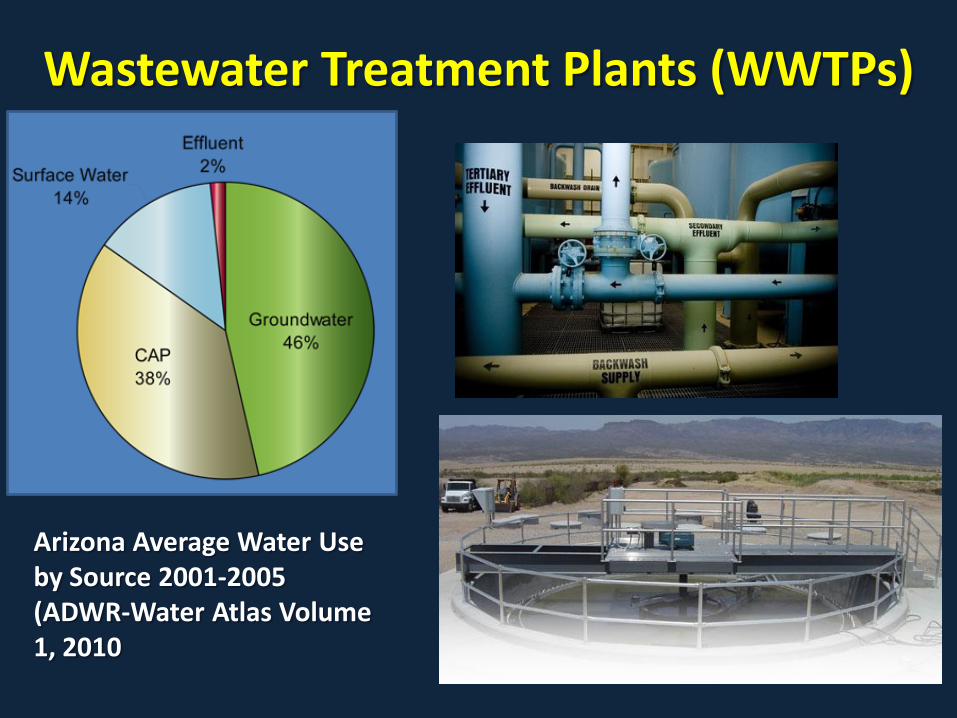
Arizona Average Water Use by Source 2001-2005 (ADWR-Water Atlas Volume 1, 2010
Wastewater Treatment Plants (WWTPs)
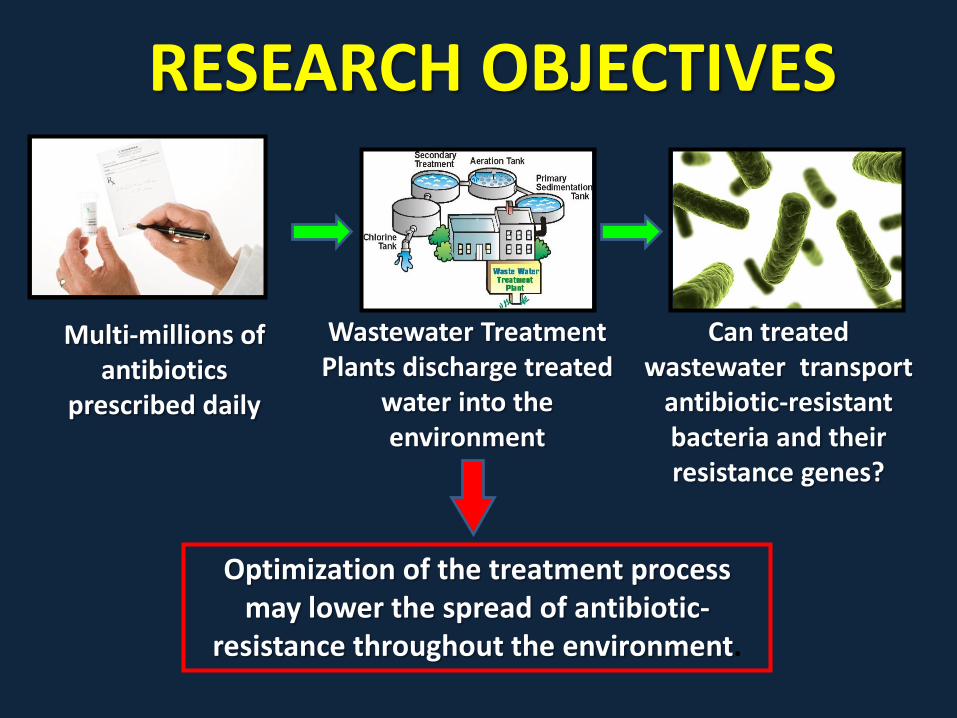
RESEARCH OBJECTIVES
Optimization of the treatment process may lower the spread of antibiotic-
resistance throughout the environment.
Wastewater Treatment Plants discharge treated
water into the environment
Multi-millions of antibiotics
prescribed daily
Can treated wastewater transport
antibiotic-resistant bacteria and their resistance genes?
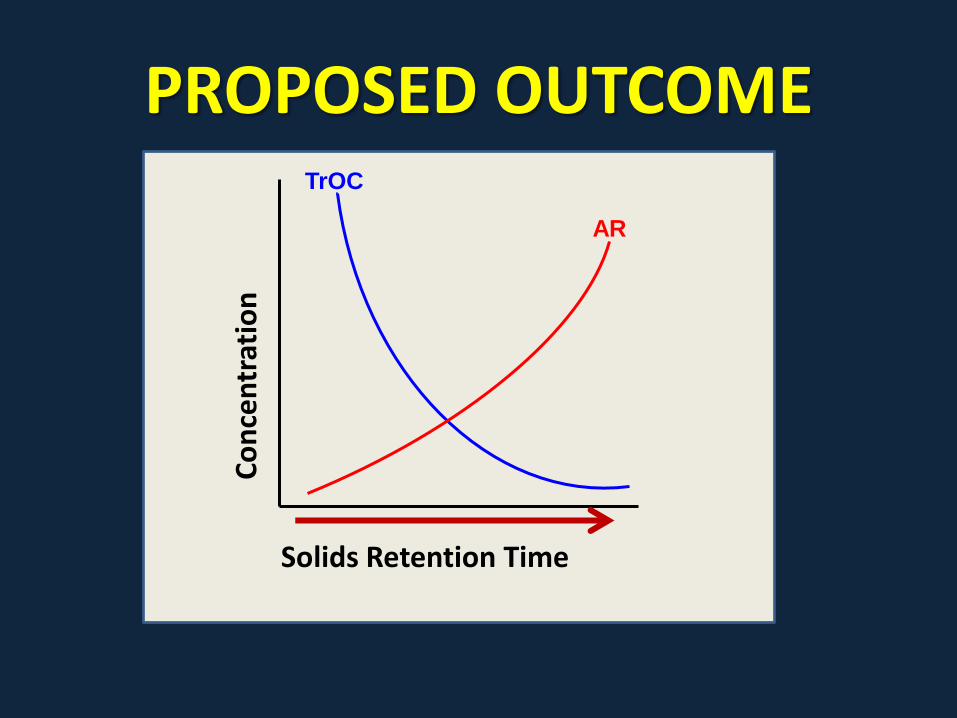
PROPOSED OUTCOME
Co
nce
ntr
atio
n
Solids Retention Time
TrOC
AR

METHODS
Molecular & Cultural Analysis Chemical Analysis
Bacterial Isolates (MIC) Quantitative PCR
Solids Retention Time
LC-MS/MS SPE
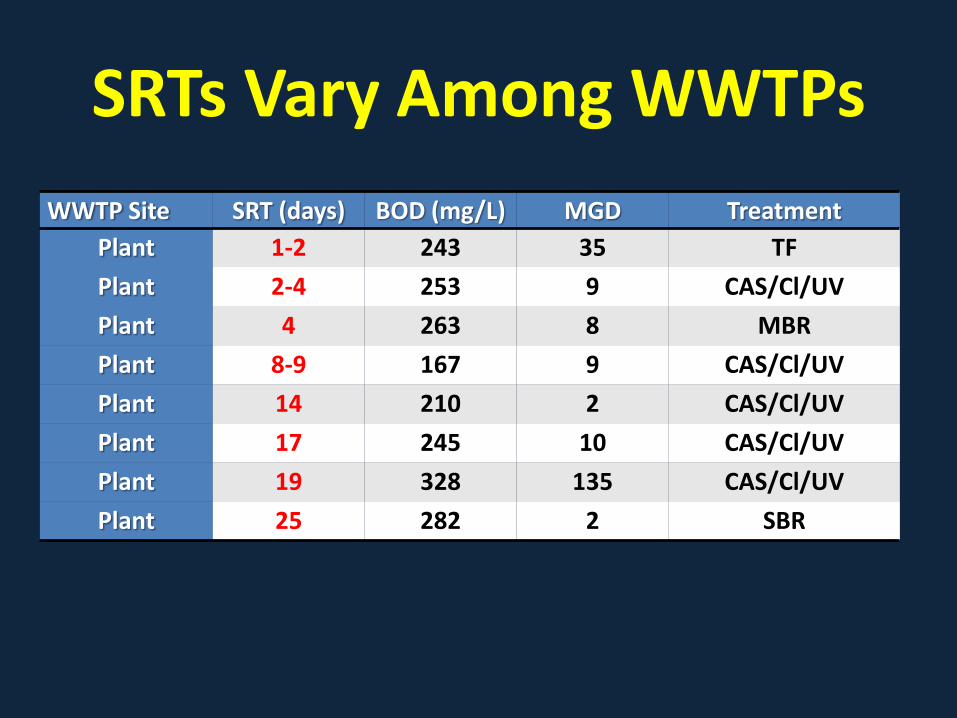
SRTs Vary Among WWTPs
WWTP Site SRT (days) BOD (mg/L) MGD Treatment
Plant 1-2 243 35 TF
Plant 2-4 253 9 CAS/Cl/UV
Plant 4 263 8 MBR
Plant 8-9 167 9 CAS/Cl/UV
Plant 14 210 2 CAS/Cl/UV
Plant 17 245 10 CAS/Cl/UV
Plant 19 328 135 CAS/Cl/UV
Plant 25 282 2 SBR

CLINICALLY RELEVANT ANTIBIOTICS
Target Antibiotic Resistance Genes
sul(l) & sul(ll) dfr1A ampC tetW vanA
trimethoprim tetracycline sulfamethoxazole ampicillin vancomycin

CULTURAL ANALYSIS • Approximately 72 samples were collected from 8
WWTPs
• 288 pure isolates were selected from media plate
• Each isolate were screened against varying antibiotic concentrations according to clinical standards

Resistance to Vancomycin (≥4 µg/ml)
0 µg/ml 0.5 µg/ml 1 µg/ml 2 µg/ml 4 µg/ml 8 µg/ml 16 µg/ml 32 µg/ml
Increase in Antibiotic Concentration
Growth above this conc. is resistant
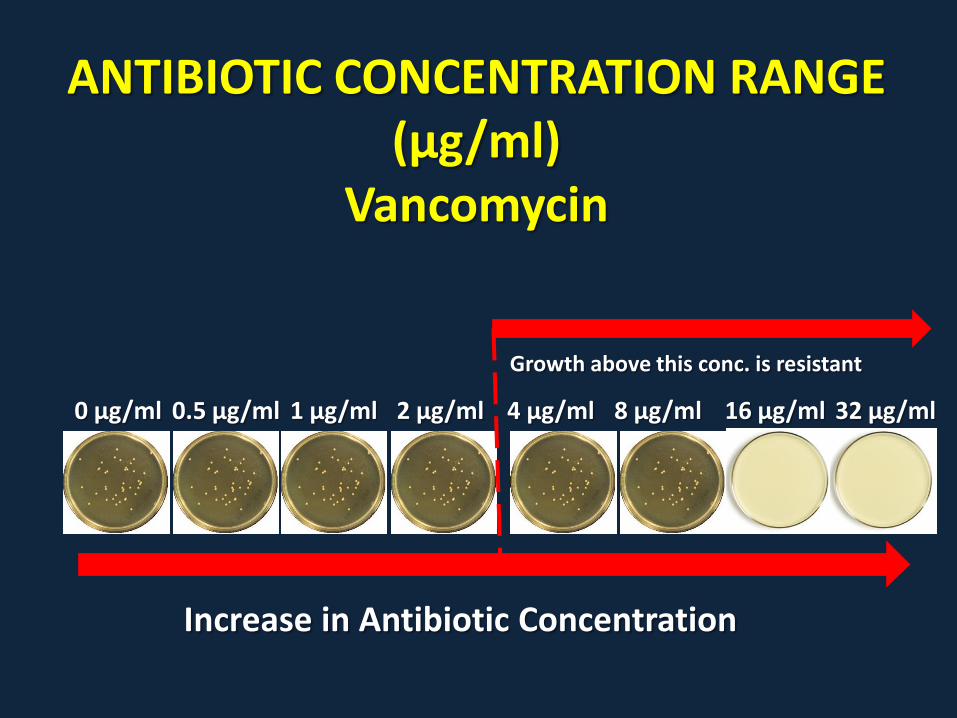
ANTIBIOTIC CONCENTRATION RANGE (µg/ml)
Vancomycin
0 µg/ml 0.5 µg/ml 1 µg/ml 2 µg/ml 4 µg/ml 8 µg/ml 16 µg/ml 32 µg/ml
Increase in Antibiotic Concentration
Growth above this conc. is resistant
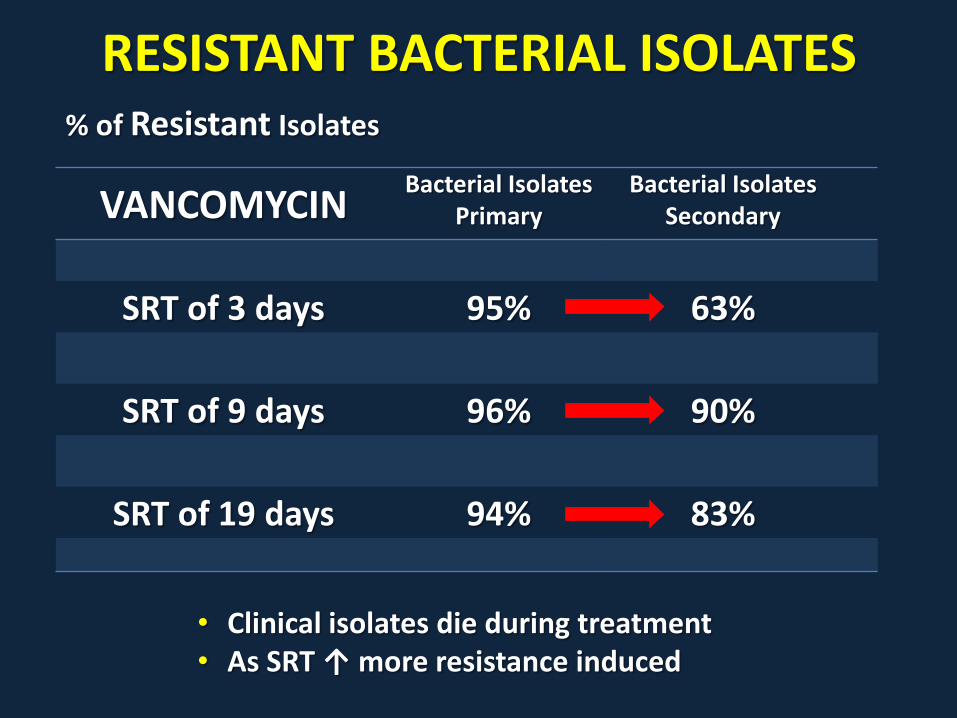
RESISTANT BACTERIAL ISOLATES % of Resistant Isolates
VANCOMYCIN Bacterial Isolates
Primary Bacterial Isolates
Secondary
SRT of 3 days 95% 63%
SRT of 9 days 96% 90%
SRT of 19 days 94% 83%
• Clinical isolates die during treatment • As SRT ↑ more resistance induced
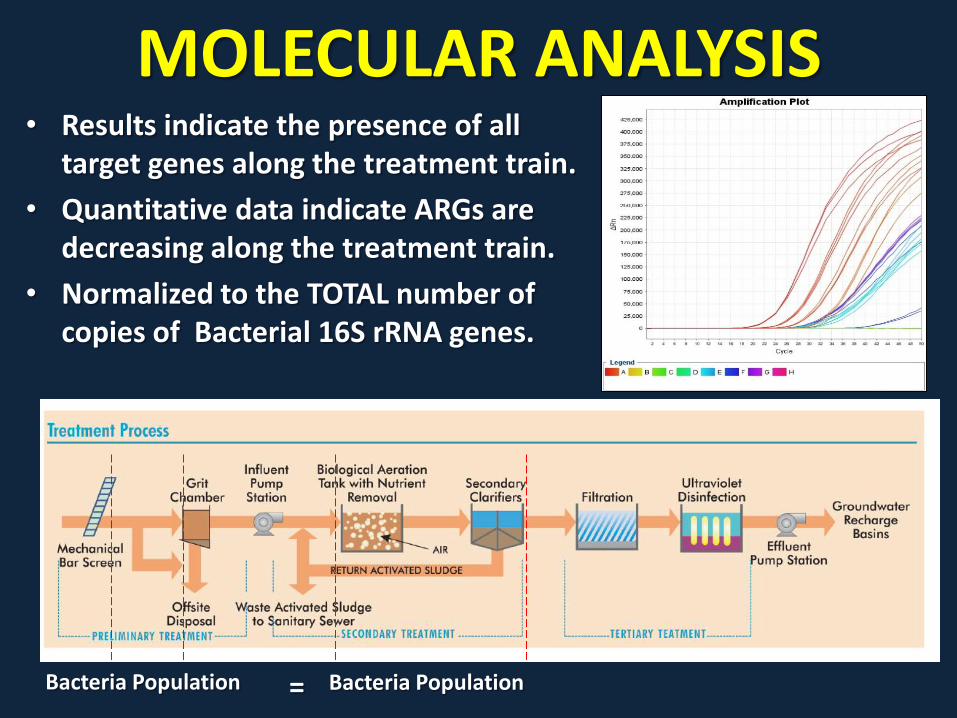
MOLECULAR ANALYSIS • Results indicate the presence of all
target genes along the treatment train.
• Quantitative data indicate ARGs are decreasing along the treatment train.
• Normalized to the TOTAL number of copies of Bacterial 16S rRNA genes.
Bacteria Population Bacteria Population =
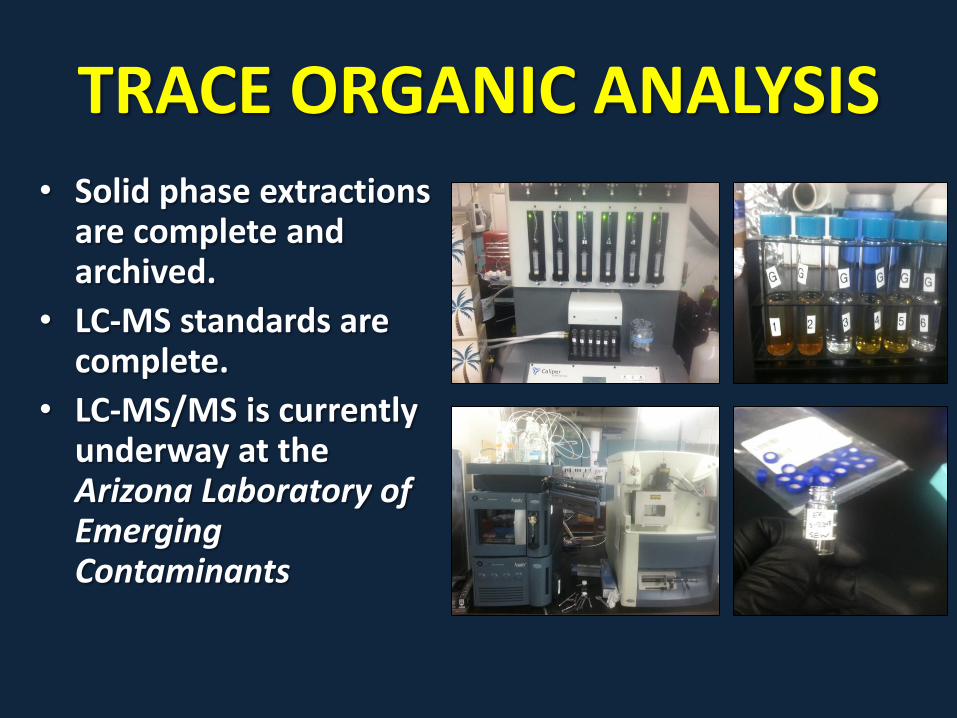
TRACE ORGANIC ANALYSIS • Solid phase extractions
are complete and archived.
• LC-MS standards are complete.
• LC-MS/MS is currently underway at the Arizona Laboratory of Emerging Contaminants
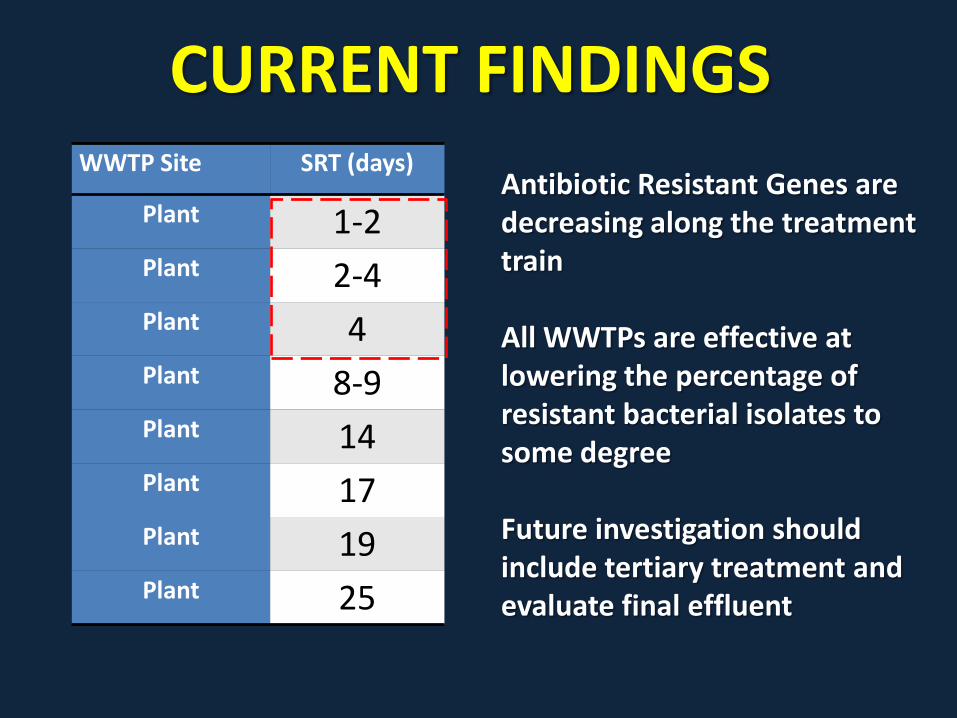
CURRENT FINDINGS WWTP Site SRT (days)
Plant 1-2 Plant 2-4 Plant 4 Plant 8-9 Plant 14 Plant 17 Plant 19 Plant 25
Antibiotic Resistant Genes are decreasing along the treatment train All WWTPs are effective at lowering the percentage of resistant bacterial isolates to some degree Future investigation should include tertiary treatment and evaluate final effluent
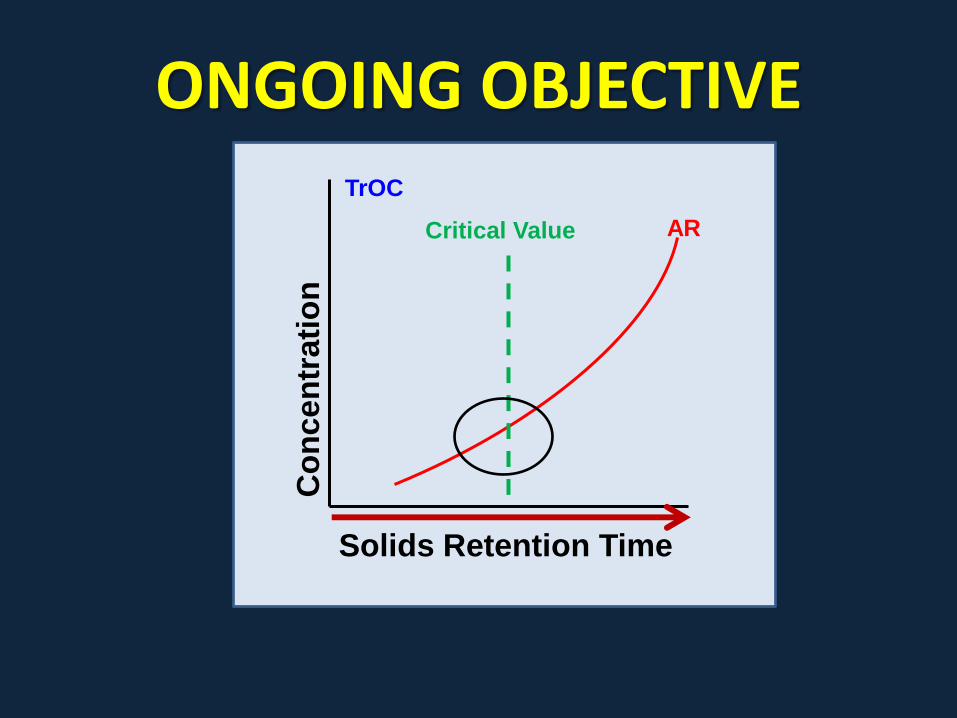
ONGOING OBJECTIVE
AR
Co
ncen
trati
on
Solids Retention Time
Critical Value
TrOC

INFLUENCE OF BIOSOLIDS ON SOIL ANTIBIOTIC RESISTANT
BACTERIA

Antibiotic-resistant bacteria in environmental samples and foods.
Antibiotic Numbers CFU/gm. or ml
Sample Tetracycline Ciprofloxacin Cephalothin Ampicillin Heterotrophic Plate Count ---- CFU/G or ml ----
Environmental Samples
Tap water 101 101 102
101 103
Irrigation well water 10 10 101 101 101
Soil 105 106 106 106 107
Biosolids 107 107 108 107 109
Manure 105 106 106 105 108
Compost 106 106 108 107 109
Dust 106 106 106 105 107
Food
Lettuce 105 104 106 106 107
Tomatoes 101 101 103 102 106
Chicken 102 103 107 107 108
Ground beef 104 104 105 105 106

SUMMARY: Antibiotic Resistant Bacteria
Land applied biosolids did not influence ARB concentrations
Soil is the original source of antibiotics
Exposures more common from handling foods
Ready to eat lettuce—greatest relative concentrations of ARB
Hospitals more important
Concentrated animal feedlot operations also critical
THE WATER AND ENERGY SUSTAINABLE TECHNOLOGY CENTER
(WEST)
WHAT IS WEST? • A partnership between the University of Arizona and Pima
County Wastewater to promote research and business development of:
- Water treatment technologies - Contaminant minimization and production - Innovative education and training
• Goal is to solve challenging water and energy sustainability issues locally, nationally and internationally

NEW WEST COMPLEX
• Pima County will fund and construct a new 22000 square foot building and lease to University of Arizona for cost of utilities
• Groundbreaking in Dec. 2013; move-in Aug. 2014
• Founders/Directors: Ian Pepper and Shane Snyder

• Administrative Offices, Conference Rooms, Student
Study Areas
• Molecular Microbiology Lab
• Real-Time Sensor Lab
• Aquatic Toxicology Lab
• Water Treatment Lab
• Energy Lab
• Hi-Bay area for Demonstration Laboratory Water
Treatment Technologies
THE NEW WEST BUILDING

• New state-of-the-art water reclamation facility • Adjacent to Tucson Water constructed wetlands and
infiltration basins • Pima County included “tie-ins” to full-scale plant to
allow for demonstration scale technologies • Large solar energy field in place • Ideal location for growing algae for biofuels • Ideal location for other solar-thermal evaluations
- such as biosolid disinfection
THE NEW WEST CAMPUS

• Currently consists of 20 members • Public Sector, Private Sector, Regional organizations and
Universities • All members have already given cash or
equipment/technology donations to WEST • Members without offices in Tucson are being encouraged
to move staff to the region as part of the WEST mission for economic development in the region
• Members are aiding in the development of short-courses for training certificates in various methods and technologies
WEST MEMBERSHIP

WEST WATER MEMBERS: Public Sector • City of Peoria
• City of Tucson Water • County Sanitation Districts of Los Angeles • Pima County Regional Wastewater Reclamation • Singapore Public Utilities Bureau – pending confirm. • KAUST Saudi Arabia – pending confirm. • Technical University of Munich – verbally confirmed
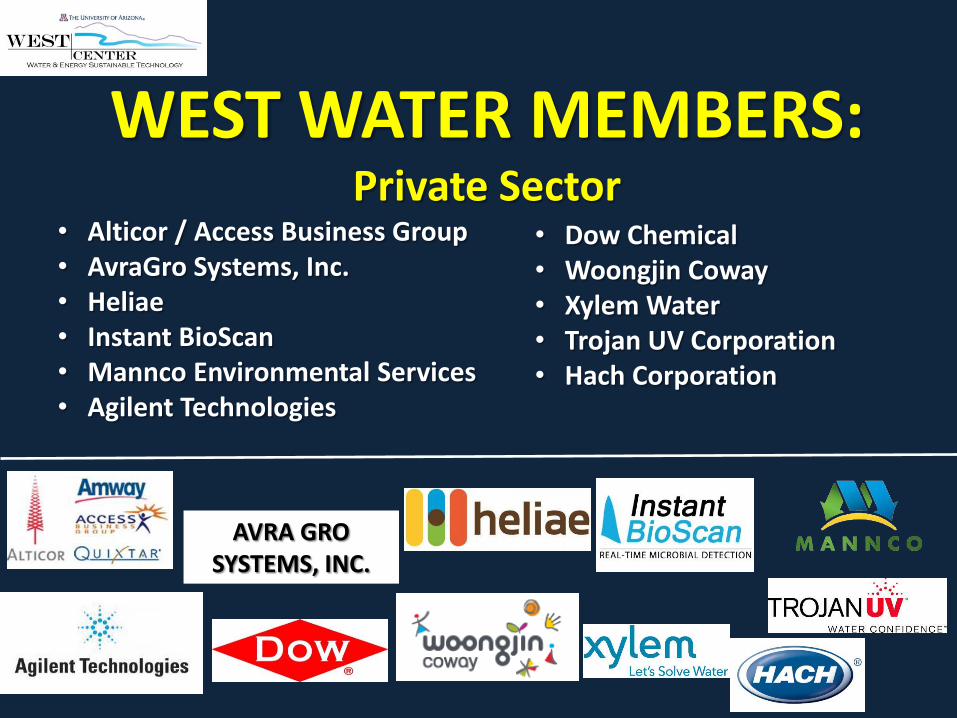
WEST WATER MEMBERS: Private Sector
• Alticor / Access Business Group • AvraGro Systems, Inc. • Heliae • Instant BioScan • Mannco Environmental Services • Agilent Technologies
AVRA GRO SYSTEMS, INC.
• Dow Chemical • Woongjin Coway • Xylem Water • Trojan UV Corporation • Hach Corporation

• Arizona Department of Environmental Quality
• King Abdullah University of Science & Technology (KAUST)
• California Association of Sanitation Agencies
• Northwest Biosolids Management Association
WEST WATER MEMBERS

WEST FUNDING
• Research support via extramural grants • UA support (CALS & ENG) • Industrial Advisory Board (IAB) Membership • Income from UA summer classes • Personnel training • State-certified routine lab analyses • Philanthropy from community

WEST: Current Major Initiatives
Agency Amount Status Faculty
NSF $4.1m Submitted Lansey, Snyder, Pepper, Gerba
NSF $0.9m Submitted Pepper
AID $18m Pre-proposal accepted Tamimi, Gerba, Pepper
NIH $4m Submitted Burgess, Snyder, others
NSF STC $25m Denied, but to be resubmitted
Snyder, Pepper, Gerba, Lansey, Arnold, etc.
WRRF $1.7m Successful Pepper & Snyder
RELEVANT FUNDED PROJECTS
• Evaluation of Class A Pelletized Biosolids for the Growth of Cotton
• Evaluation of Ascaris Egg Viability in Biosolid Amended Soil
• Evaluation of Pathogen Removal at a New Wastewater Treatment Plant that Utilizes Dissolved Air Flotation and a 5-Stage Bardenpho Process
• Risk Assessment of Legionella in Reclaimed Water
WEST IMPACT: International Collaborations
• Australia - University of Adelaide - Commonwealth Scientific and Industrial
Research Organization(CSIRO) • Singapore - National University of Singapore and
Singapore PUB • Saudi Arabia – King Abdullah U. of Science &
Technology and King Abdulaziz University • Europe – Anglian Water, Suez Environment, PWN
Technologies, U. of Catania, TU Munich
WEST IMPACT: Training Component
• Utility operators and technicians trained on advanced water treatment technologies i.e., RO, UF, UV, Ozone, others
• Technology evaluation and testing i.e., sensors, energy efficient pumps, oxidation, membranes, etc.
• Energy projects – thermo-solar, biofuels, biogas (methane/hydrogen) from digestors

"The WEST Center will target the water-energy nexus by ensuring a supply of safe drinking water to meet community needs for the foreseeable future, while meeting sustainable energy requirements.“ Ian Pepper, Feb. 2013
"In addition, the WEST Center aspires to not only become a global leader in new water and energy technologies, but also focus on creating additional jobs and economic development in the region, while simultaneously providing advanced educational and training opportunities.“ Shane Snyder, Feb. 2013
WEST IMPACTS

Existing Pima County Lab Facility
New WEST Center