Ex vivo microbial leakage after using different fiQDO LUULJDWLRQ ...

Page 1/34
Application of 3-nitrooxypropanol and canola oil tomitigate enteric methane emissions of beef cattleresults in distinctly different effects on the rumenmicrobial communityRobert J Gruninger ( [email protected] )
Agriculture and Agri-Food Canada https://orcid.org/0000-0001-8693-6990Xiu Min Zhang
Chinese Academy of SciencesMegan L. Smith
University of DelawareLimin Kung
University of DelawareDiwakar Vyas
University of FloridaSean M. McGinn
Agriculture and Agri-Food Canada Lethbridge Research and Development CentreMaik Kindermann
DSM Nutritional Products IncMin Wang
Chinese Academy of SciencesZhi Liang Tan
Chinese Academy of SciencesKaren A. Beauchemin
Agriculture and Agri-Food Canada Lethbridge Research and Development Centre
Research Article
Keywords: 3-nitrooxypropanol, canola oil, enteric methane emissions, beef cattle, rumen microbialcommunity
Posted Date: April 9th, 2021
DOI: https://doi.org/10.21203/rs.3.rs-391068/v1

Page 2/34
License: This work is licensed under a Creative Commons Attribution 4.0 International License. Read Full License
Page 3/34
AbstractBackground: The major GHG from ruminants is enteric methane (CH4) which in 2010, was estimated at2.1 Gt of CO2 equivalent, accounting for 4.3% of global GHG emissions. There re extensive efforts beingmade around the world to develop methane mitigating inhibitors that speci�cally target rumenmethanogens with the ultimate goal of reducing the environmental footprint of ruminant livestockproduction. This study examined the individual and combined effects of supplementing a high-foragediet (90% barley silage) fed to beef cattle with the investigational methane (CH4) inhibitor 3-nitrooxypropanol (3-NOP) and canola oil (OIL) on the rumen microbial community in relation to entericCH4 emissions and ruminal fermentation.
Results: 3-NOP and OIL individually reduced enteric CH4 emission (-28.2% and -24.0%, respectively), andthe effects were additive when used in combination (-51.3%). 3-NOP increased H2 emissions 37 fold,while co-administering 3-NOP and OIL increased H2 in the rumen 20-fold relative to the control diet. Theinclusion of 3-NOP or OIL reduced the diversity of the rumen microbiome. 3-NOP resulted in targetedchanges in the microbiome decreasing the relative abundance of Methanobrevibacter and increasing therelative abundance of Bacteroidetes. The inclusion of OIL resulted in large scale changes to the microbialcommunity that were associated with changes in ruminal volatile fatty acid concentration and gasproduction. OIL signi�cantly reduced the abundance of protozoa and �ber-degrading microbes in therumen but it did not selectively alter the abundance of rumen methanogens.
Conclusions: Our data provide a mechanistic understanding of CH4 inhibition by 3-NOP and OIL when fedalone and in combination to cattle. 3-NOP speci�cally targeted rumen methanogens inhibiting thehydrogenotrophic methanogenesis pathway and resulting in increased H2 emissions and propionateproduction. In contrast, OIL caused large scale changes in the rumen microbial community byindiscriminately altering the abundance of a range of rumen microbes, reducing the abundance of�brolytic bacteria and altering rumen fermentation. Importantly, our data suggests that co-administeringCH4 inhibitors with distinct mechanisms of action can both enhance CH4 inhibition and providealternative sinks to prevent excessive accumulation of ruminal H2.
BackgroundRuminant production systems need to embrace the challenge of reducing greenhouse gas emissions(GHG) to be in sync with other sectors of society that are adopting net-zero emission goals. The majorGHG from ruminants is enteric methane (CH4), which in 2010, was estimated at 2.1 Gt of CO2 equivalent,accounting for 4.3% of global GHG emissions [1]. Enteric CH4 is a potent GHG with a 28-times greaterglobal warming potential than carbon dioxide (CO2) when compared on an equivalent basis (CO2e) over100-years. Enteric CH4 emissions also represent a loss of 2–12% of the gross energy consumed byruminants [2]. Developing effective mitigation strategies to reduce enteric CH4 from ruminants therefore
Page 4/34
has the potential to increase production e�ciency and reduce the environmental impact of ruminantlivestock.
Dietary supplements and feed additives have been extensively investigated for their potential to decreaseenteric CH4 emissions from ruminants [3, 4]. Of the mitigation options available, synthesized inhibitorshave been found to be highly effective in inhibiting methanogenesis in the rumen when supplemented tothe diet as feed additives [4]. However, many of these compounds (e.g., bromochloromethane,chloroform) are highly toxic, cause undesirable side-effects, or decrease methanogenesis only transiently.One exception is 3-nitrooxypropanol (3-NOP; DSM Nutritional Products, Basel, Switzerland), aninvestigational compound that has been shown to consistently decrease enteric CH4 emissions by 20 to80% with no signs of animal toxicity [5–8]. Hristov et al (2015) reported a 25 to 32% decrease in CH4
production in lactating dairy cows that persisted over a 12-week study when 3-NOP was included in theration at 40 to 80 mg/kg dry matter (DM) [9]. A dose response study identi�ed a quadratic decrease inenteric CH4 emissions in dairy cattle with maximum reduction of CH4 yield with 3-NOP included at 100 to200 mg/kg DM [10]. In a study with growing beef cattle, a 37 to 42% decrease in enteric CH4 emissionsoccurred over 238-days when 3-NOP was supplemented at 125 to 200 mg/kg DM [11]. Similarly, Martinez-Fernandez et al. (2019) reported that CH4 emissions were decreased by 38% in steers fed 3-NOP (2.5g/day). Furthermore, studies that have examined the impact of 3-NOP on �ber digestion in the rumen ortotal-tract have reported no negative effects [6, 12, 13].
3-Nitrooxypropanol is a structural analogue of methyl coenzyme M and acts as a competitive inhibitorthat selectively binds to methyl coenzyme M reductase (MCR)[14]. Binding of 3-NOP oxidizes the catalyticnickel ion from Ni+ to Ni2+ temporarily inactivating the MCR enzyme and inhibiting the last step ofmethanogenesis [14]. In vitro assays with pure cultures of key rumen microbes revealed that 3-NOP veryspeci�cally inhibited the growth of rumen methanogens at low doses and had limited effect on thegrowth characteristics of the rumen bacteria tested [14]. There have been few studies that have examinedthe impact of 3-NOP on the composition of the rumen microbial community. Haisan et al. (2016) usedqPCR to show that 3-NOP signi�cantly decreased 16S rRNA gene copy numbers for methanogens, andtended to decrease the total number of bacteria in rumen contents of dairy cows [15]. Another study usingnext-generation sequencing found that 3-NOP decreased microbial alpha diversity in the rumen andresulted in a decrease in the relative abundance of hydrogenotrophic methanogens but had limitedeffects on rumen bacteria [16]. Most recently, it was shown that 3-NOP reduced the alpha diversity of themicrobial community colonizing the surface of feed in the rumen of beef heifers and speci�cally reducedthe abundance of methanogens without causing large changes to the overall composition of themicrobial community [13]. Other studies have reported that 3-NOP supplementation did not change theabundance of methanogens or total bacteria in beef cattle [17] or sheep [6]. Further research is needed tounderstand the effects that 3-NOP has on the rumen microbial community in terms of composition andfunction.
Page 5/34
The addition of lipids to the diet of ruminants is another effective method of decreasing enteric CH4
emissions, and has the added bene�t of enhancing digestible energy content of the feed [18]. Theinclusion of lipids can also modify the fatty acid composition of milk and meat in a manner thatenhances the health bene�ts associated with consuming these products [19]. The effectiveness withwhich lipid supplementation decreases enteric CH4 emissions varies and is dependent on dietcomposition, lipid composition (chain length and degree of saturation), inclusion level in the diet, andlipid source (oilseed vs. oil) [20]. In addition to reducing CH4 emissions, high fat diets are known todecrease �ber digestibility and may affect DM intake (DMI). Therefore, the maximum recommended totaldietary lipid concentration is typically 60 to 80 g/kg DM (30 to 50 g/kg DM of added lipid) [20, 21].Several meta-analyses of the literature found that 10 g/kg DM addition of lipid to the diet reduces CH4
yield (g/kg DMI) by up to 5.6% [20, 22–24]. The microbial basis with which dietary lipids decreasemethanogenesis is not fully understood but is thought to be due to: 1) a decrease in the amount oforganic matter fermented in the rumen; 2) a decrease in the abundance of rumen methanogens andprotozoa; and 3) provision of alternative H2 sinks through biohydrogenation of unsaturated fatty acids[20]. Previous studies examining the impact of dietary lipids on the rumen microbial community did notobserve a reduction in the abundance of rumen methanogens; however, the rumen microbial communitywas altered by speci�cally reducing the abundance of �brolytic bacteria and protozoa [21, 25, 26].
The present study examines the impact of 3-NOP and canola oil supplementation alone, and incombination, on the rumen microbial community. An in depth analysis of the impacts of these treatmentson rumen metabolism and enteric gas emissions has been published in a complementary manuscript[27]. We examine how the observed alternations in the rumen microbiome are in�uenced by enteric gasemissions and rumen fermentation in beef cattle consuming a high forage diet. Rumen samples werecollected over a 12 h period and the treatment effects were examined using a meta-taxonomic approachtargeting the 16s rRNA gene. We hypothesized that 3-NOP has a highly targeted effect on rumenmethanogens and that the inclusion of canola oil causes large, non-speci�c changes in the compositionand function of the rumen microbial community. The aim of the study was to provide information thatcould be used to develop effective CH4 mitigation strategies.
ResultsSequencing of rumen samples
A total of 192 samples of rumen �uid and digesta were sequenced, resulting in 11,657,704 non-chimericsequences after quality control and the identi�cation of 6,217 unique ASVs from all samples. Theminimum number of sequences per sample was 36,270 and the maximum was 95,904. Rarefactionanalysis show that sequencing depth was su�cient to capture most of the microbial diversity in thesamples with rarefaction curves for all samples approaching an asymptote.
Addition of 3-NOP and OIL reduced microbial diversity
Page 6/34
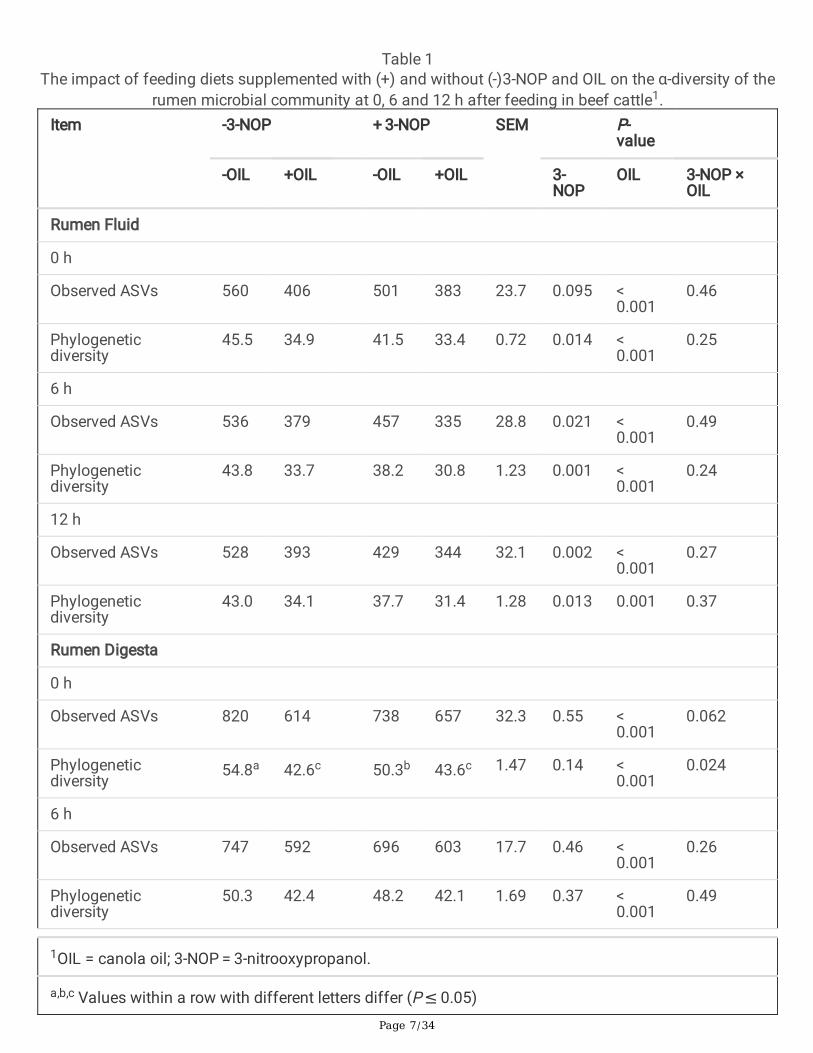
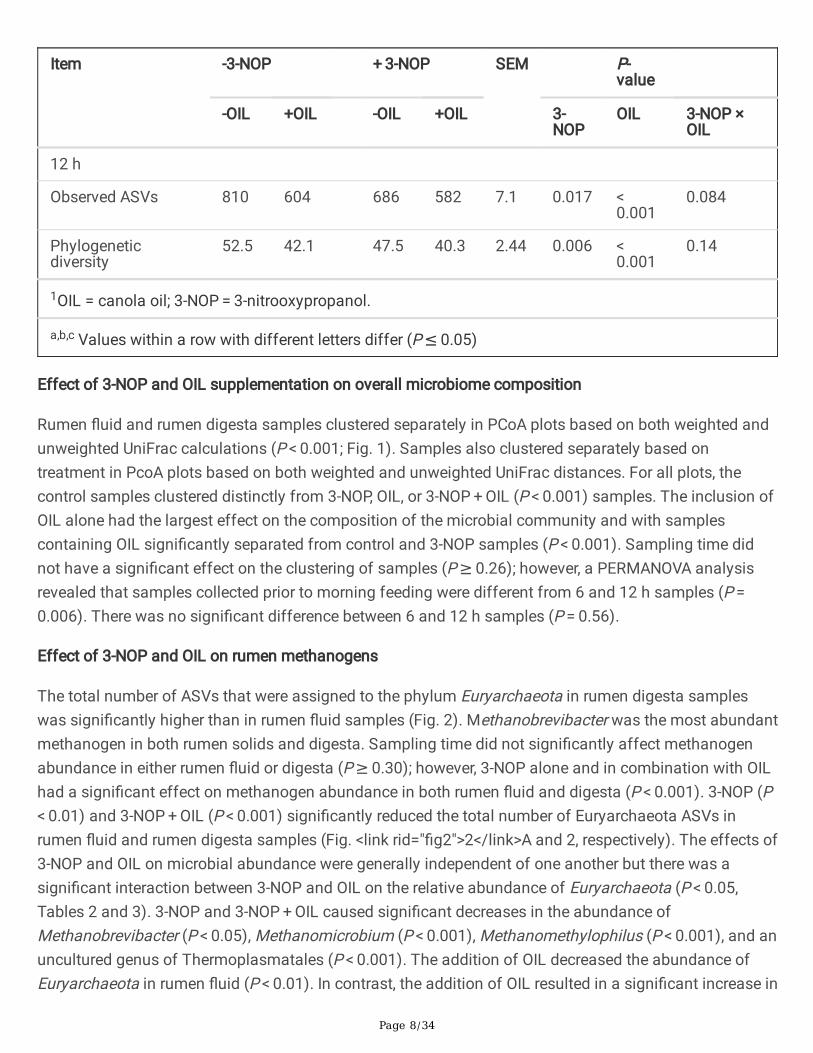
The effect of 3-NOP, OIL and 3-NOP + OIL as a function of time on the alpha diversity of the rumensamples is shown in Table 1. Supplementing diets with 3-NOP resulted in a numerical reduction inobserved ASVs at 0 h (P = 0.095), and a signi�cant decrease in ASVs 6 and 12 h after feeding (P ≤ 0.05).3-NOP decreased the phylogenetic diversity of rumen �uid at all of the sampling time points (P ≤ 0.05).The inclusion of OIL signi�cantly decreased the number of ASVs and phylogenetic diversity of rumen�uid at all of the time points (P ≤ 0.001). No interactions between 3-NOP and OIL were found on thealpha diversity of rumen �uid. 3-NOP decreased alpha diversity of rumen digesta at 12 h (P ≤ 0.05) butthere was no signi�cant effect at 0 and 6 h (P > 0.05). The addition of OIL decreased the observed ASVsand phylogenetic diversity of rumen digest at all of the time points (P < 0.001). There was an interactionbetween 3-NOP and OIL on the phylogenetic diversity in rumen digesta at 0 h (P = 0.024) but not at 6 and12 h.
Page 7/34
Table 1The impact of feeding diets supplemented with (+) and without (-)3-NOP and OIL on the α-diversity of the
rumen microbial community at 0, 6 and 12 h after feeding in beef cattle1.Item -3-NOP + 3-NOP SEM P-
value
-OIL +OIL -OIL +OIL 3-NOP
OIL 3-NOP ×OIL
Rumen Fluid
0 h
Observed ASVs 560 406 501 383 23.7 0.095 < 0.001
0.46
Phylogeneticdiversity
45.5 34.9 41.5 33.4 0.72 0.014 < 0.001
0.25
6 h
Observed ASVs 536 379 457 335 28.8 0.021 < 0.001
0.49
Phylogeneticdiversity
43.8 33.7 38.2 30.8 1.23 0.001 < 0.001
0.24
12 h
Observed ASVs 528 393 429 344 32.1 0.002 < 0.001
0.27
Phylogeneticdiversity
43.0 34.1 37.7 31.4 1.28 0.013 0.001 0.37
Rumen Digesta
0 h
Observed ASVs 820 614 738 657 32.3 0.55 < 0.001
0.062
Phylogeneticdiversity
54.8a 42.6c 50.3b 43.6c 1.47 0.14 < 0.001
0.024
6 h
Observed ASVs 747 592 696 603 17.7 0.46 < 0.001
0.26
Phylogeneticdiversity
50.3 42.4 48.2 42.1 1.69 0.37 < 0.001
0.49
1OIL = canola oil; 3-NOP = 3-nitrooxypropanol.
a,b,c Values within a row with different letters differ (P ≤ 0.05)
Page 8/34
Item -3-NOP + 3-NOP SEM P-value
-OIL +OIL -OIL +OIL 3-NOP
OIL 3-NOP ×OIL
12 h
Observed ASVs 810 604 686 582 7.1 0.017 < 0.001
0.084
Phylogeneticdiversity
52.5 42.1 47.5 40.3 2.44 0.006 < 0.001
0.14
1OIL = canola oil; 3-NOP = 3-nitrooxypropanol.
a,b,c Values within a row with different letters differ (P ≤ 0.05)
Effect of 3-NOP and OIL supplementation on overall microbiome composition
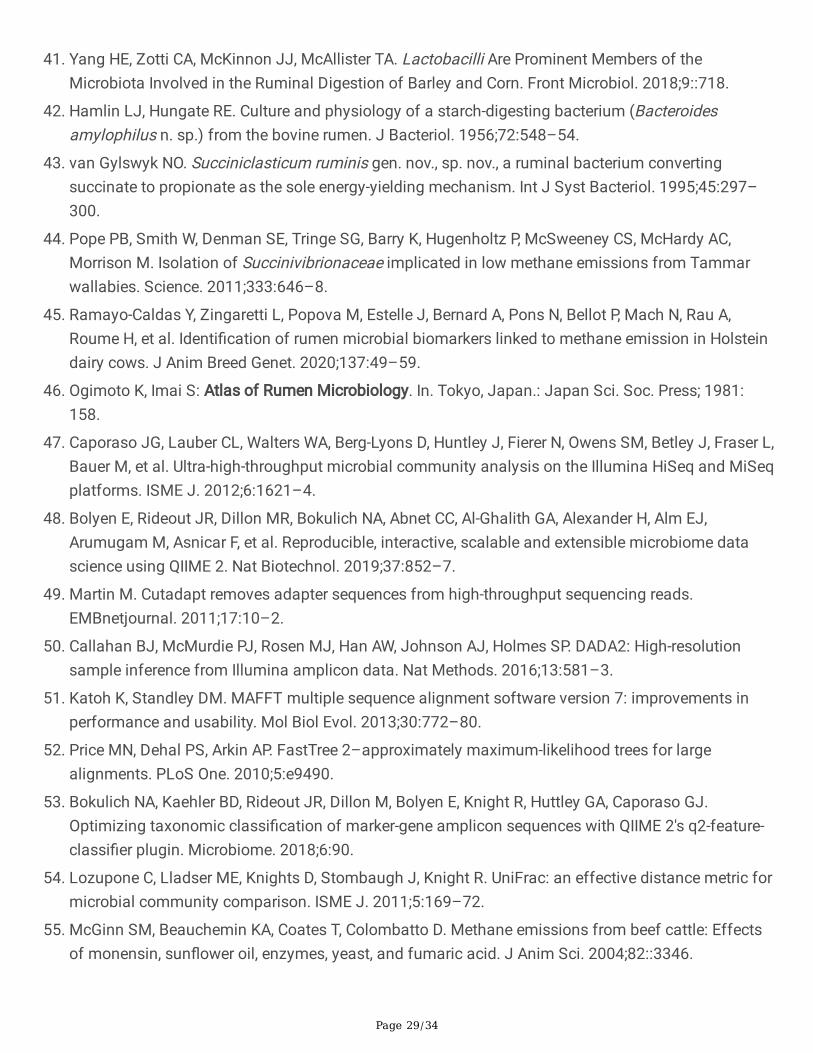
Rumen �uid and rumen digesta samples clustered separately in PCoA plots based on both weighted andunweighted UniFrac calculations (P < 0.001; Fig. 1). Samples also clustered separately based ontreatment in PcoA plots based on both weighted and unweighted UniFrac distances. For all plots, thecontrol samples clustered distinctly from 3-NOP, OIL, or 3-NOP + OIL (P < 0.001) samples. The inclusion ofOIL alone had the largest effect on the composition of the microbial community and with samplescontaining OIL signi�cantly separated from control and 3-NOP samples (P < 0.001). Sampling time didnot have a signi�cant effect on the clustering of samples (P ≥ 0.26); however, a PERMANOVA analysisrevealed that samples collected prior to morning feeding were different from 6 and 12 h samples (P = 0.006). There was no signi�cant difference between 6 and 12 h samples (P = 0.56).
Effect of 3-NOP and OIL on rumen methanogens
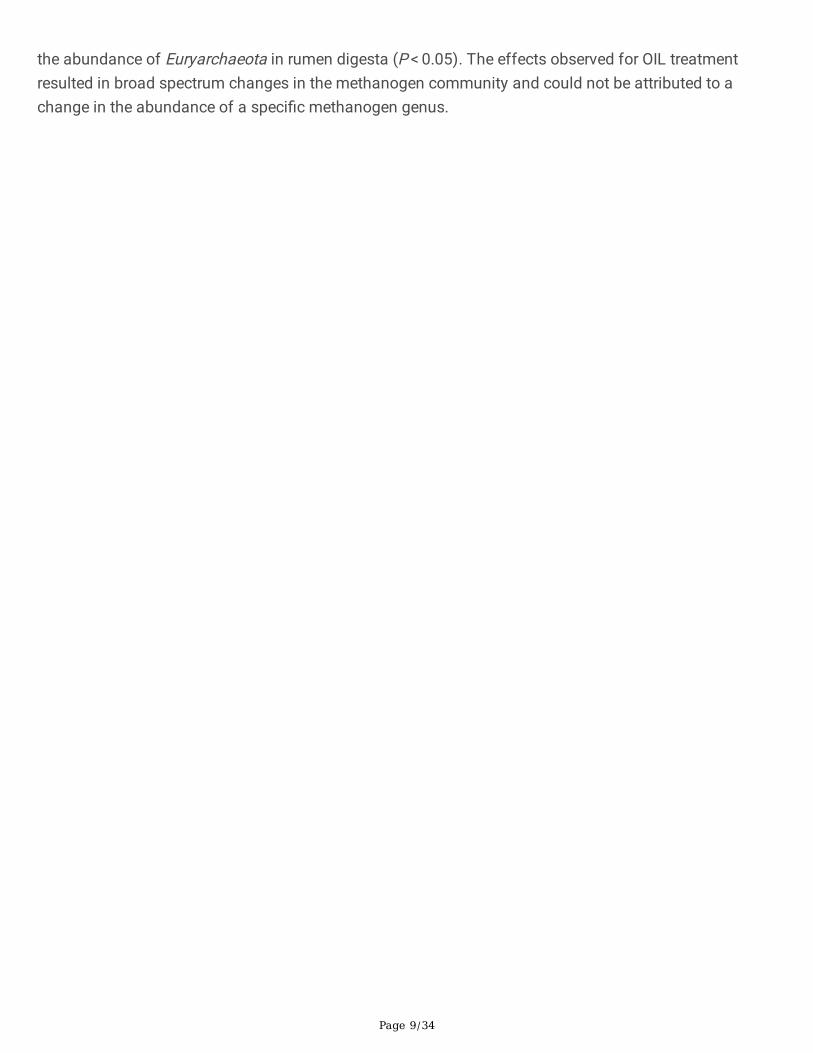
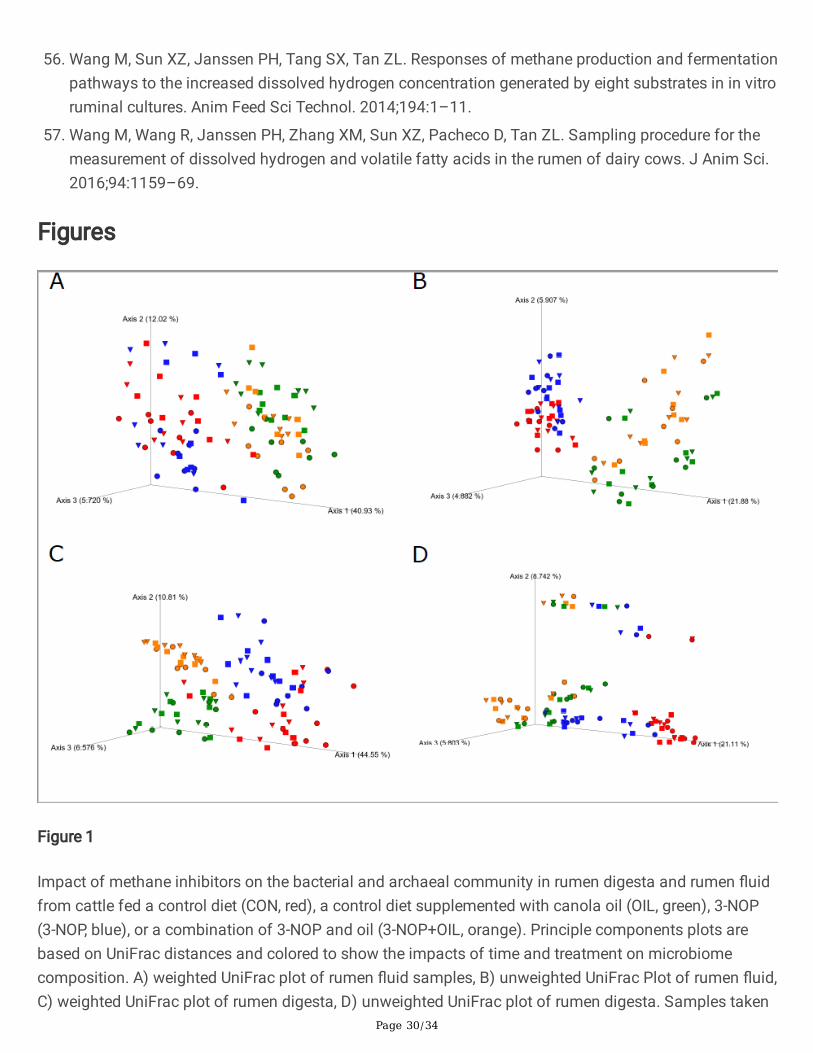
The total number of ASVs that were assigned to the phylum Euryarchaeota in rumen digesta sampleswas signi�cantly higher than in rumen �uid samples (Fig. 2). Methanobrevibacter was the most abundantmethanogen in both rumen solids and digesta. Sampling time did not signi�cantly affect methanogenabundance in either rumen �uid or digesta (P ≥ 0.30); however, 3-NOP alone and in combination with OILhad a signi�cant effect on methanogen abundance in both rumen �uid and digesta (P < 0.001). 3-NOP (P < 0.01) and 3-NOP + OIL (P < 0.001) signi�cantly reduced the total number of Euryarchaeota ASVs inrumen �uid and rumen digesta samples (Fig. <link rid="�g2">2</link>A and 2, respectively). The effects of3-NOP and OIL on microbial abundance were generally independent of one another but there was asigni�cant interaction between 3-NOP and OIL on the relative abundance of Euryarchaeota (P < 0.05,Tables 2 and 3). 3-NOP and 3-NOP + OIL caused signi�cant decreases in the abundance ofMethanobrevibacter (P < 0.05), Methanomicrobium (P < 0.001), Methanomethylophilus (P < 0.001), and anuncultured genus of Thermoplasmatales (P < 0.001). The addition of OIL decreased the abundance ofEuryarchaeota in rumen �uid (P < 0.01). In contrast, the addition of OIL resulted in a signi�cant increase in
Page 9/34
the abundance of Euryarchaeota in rumen digesta (P < 0.05). The effects observed for OIL treatmentresulted in broad spectrum changes in the methanogen community and could not be attributed to achange in the abundance of a speci�c methanogen genus.
Page 10/34
Table 2Impact of feeding diets supplemented with (+) and without (-) 3-NOP and OIL on the relative abundance
of phyla identi�ed in rumen �uid in beef cattle1
Item -3-NOP + 3-NOP SEM P-value
-OIL +OIL -OIL +OIL 3-NOP
OIL 3-NOP × OIL
0 h
Euryarchaeota 1.18 0.71 0.62 0.21 0.165 < 0.001
0.002 0.80
Bacteroidetes 54.9b 59.7ab 57.4ab 62.7a 2.75 0.11 0.007 0.023
Firmicutes 19.3 21.8 18.6 21.2 3.03 0.60 0.052 0.93
Fibrobacteres 10.6 0.26 10.2 0.14 1.16 0.81 < 0.001
0.89
Actinobacteria 0.40 0.15 0.54 0.14 0.158 0.67 0.038 0.62
Proteobacteria 4.18 12.0 3.48 12.0 1.55 0.81 < 0.001
0.84
Spirochaetae 1.97 2.36 3.48 1.89 0.532 0.31 0.24 0.061
Verrucomicrobia 4.10 1.24 3.65 0.82 0.586 0.30 < 0.001
0.97
Others (< 0.5%) 3.31 1.79 2.09 0.94 0.341 < 0.001
< 0.001
0.43
F: B 0.32 0.34 0.29 0.31 0.009 0.17 0.43 0.95
6 h
Euryarchaeota 0.89a 0.54b 0.17c 0.11c 0.072 < 0.001
0.002 0.016
Bacteroidetes 45.0 49.5 53.1 49.9 2.77 0.042 0.75 0.059
Firmicutes 25.5 24.6 18.3 25.1 2.92 0.21 0.27 0.15
Fibrobacteres 7.68 0.06 6.04 0.02 1.018 0.39 < 0.001
0.42
Actinobacteria 2.15 0.22 0.98 0.39 0.553 0.34 0.022 0.20
1 OIL = canola oil; 3-NOP = 3-nitrooxypropanol.
a,b,c Values within a row with different letters differ (P ≤ 0.05)
F: B = Firmicutes: Bacteroidetes

Page 11/34
Item -3-NOP + 3-NOP SEM P-value
-OIL +OIL -OIL +OIL 3-NOP
OIL 3-NOP × OIL
Proteobacteria 12.5 22.1 15.2 23.1 3.79 0.58 0.016 0.79
Spirochaetae 2.36 1.25 3.66 0.81 0.538 0.43 0.001 0.12
Verrucomicrobia 2.22 0.66 1.64 0.27 0.237 0.019 < 0.001
0.64
Others (< 0.5%) 1.72 1.02 0.89 0.34 0.192 < 0.001
< 0.001
0.54
F: B 0.50 0.44 0.28 0.43 0.040 0.076 0.28 0.086
12 h
Euryarchaeota 0.85 0.63 0.26 0.12 0.086 < 0.001
0.003 0.47
Bacteroidetes 50.8 49.3 52.0 55.6 2.24 0.070 0.60 0.20
Firmicutes 17.3 20.4 13.6 19.5 2.20 0.21 0.023 0.46
Fibrobacteres 11.7 0.16 11.3 0.06 1.37 0.87 < 0.001
0.93
Actinobacteria 0.86 0.28 0.63 0.32 0.252 0.66 0.053 0.55
Proteobacteria 11.2 25.8 15.4 22.3 3.06 0.92 0.002 0.21
Spirochaetae 2.40 1.31 3.75 1.19 0.564 0.21 0.001 0.14
Verrucomicrobia 2.61 0.83 1.96 0.44 0.286 0.041 < 0.001
0.59
Others (< 0.5%) 2.26 1.19 1.08 0.50 0.188 < 0.001
< 0.001
0.21
F: B 0.32 0.38 0.23 0.31 0.026 0.037 0.042 0.39
1 OIL = canola oil; 3-NOP = 3-nitrooxypropanol.
a,b,c Values within a row with different letters differ (P ≤ 0.05)
F: B = Firmicutes: Bacteroidetes
Page 12/34
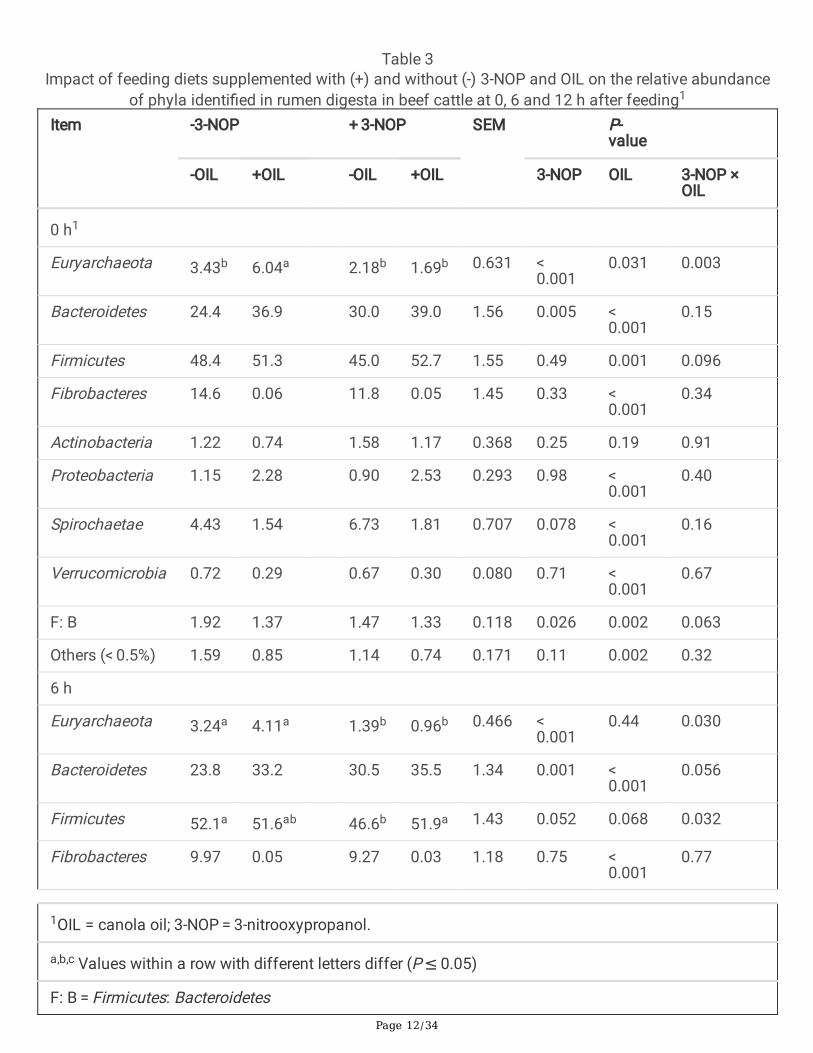
Table 3Impact of feeding diets supplemented with (+) and without (-) 3-NOP and OIL on the relative abundance
of phyla identi�ed in rumen digesta in beef cattle at 0, 6 and 12 h after feeding1
Item -3-NOP + 3-NOP SEM P-value
-OIL +OIL -OIL +OIL 3-NOP OIL 3-NOP ×OIL
0 h1
Euryarchaeota 3.43b 6.04a 2.18b 1.69b 0.631 < 0.001
0.031 0.003
Bacteroidetes 24.4 36.9 30.0 39.0 1.56 0.005 < 0.001
0.15
Firmicutes 48.4 51.3 45.0 52.7 1.55 0.49 0.001 0.096
Fibrobacteres 14.6 0.06 11.8 0.05 1.45 0.33 < 0.001
0.34
Actinobacteria 1.22 0.74 1.58 1.17 0.368 0.25 0.19 0.91
Proteobacteria 1.15 2.28 0.90 2.53 0.293 0.98 < 0.001
0.40
Spirochaetae 4.43 1.54 6.73 1.81 0.707 0.078 < 0.001
0.16
Verrucomicrobia 0.72 0.29 0.67 0.30 0.080 0.71 < 0.001
0.67
F: B 1.92 1.37 1.47 1.33 0.118 0.026 0.002 0.063
Others (< 0.5%) 1.59 0.85 1.14 0.74 0.171 0.11 0.002 0.32
6 h
Euryarchaeota 3.24a 4.11a 1.39b 0.96b 0.466 < 0.001
0.44 0.030
Bacteroidetes 23.8 33.2 30.5 35.5 1.34 0.001 < 0.001
0.056
Firmicutes 52.1a 51.6ab 46.6b 51.9a 1.43 0.052 0.068 0.032
Fibrobacteres 9.97 0.05 9.27 0.03 1.18 0.75 < 0.001
0.77
1OIL = canola oil; 3-NOP = 3-nitrooxypropanol.
a,b,c Values within a row with different letters differ (P ≤ 0.05)
F: B = Firmicutes: Bacteroidetes
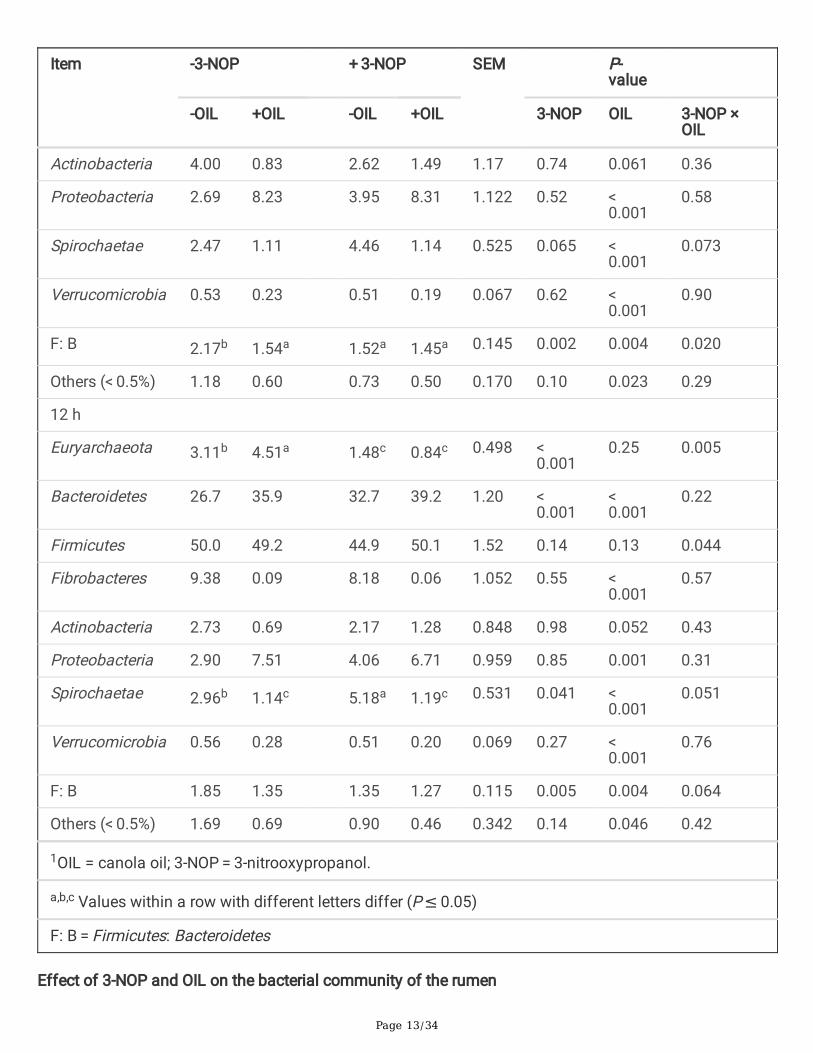
Page 13/34
Item -3-NOP + 3-NOP SEM P-value
-OIL +OIL -OIL +OIL 3-NOP OIL 3-NOP ×OIL
Actinobacteria 4.00 0.83 2.62 1.49 1.17 0.74 0.061 0.36
Proteobacteria 2.69 8.23 3.95 8.31 1.122 0.52 < 0.001
0.58
Spirochaetae 2.47 1.11 4.46 1.14 0.525 0.065 < 0.001
0.073
Verrucomicrobia 0.53 0.23 0.51 0.19 0.067 0.62 < 0.001
0.90
F: B 2.17b 1.54a 1.52a 1.45a 0.145 0.002 0.004 0.020
Others (< 0.5%) 1.18 0.60 0.73 0.50 0.170 0.10 0.023 0.29
12 h
Euryarchaeota 3.11b 4.51a 1.48c 0.84c 0.498 < 0.001
0.25 0.005
Bacteroidetes 26.7 35.9 32.7 39.2 1.20 < 0.001
< 0.001
0.22
Firmicutes 50.0 49.2 44.9 50.1 1.52 0.14 0.13 0.044
Fibrobacteres 9.38 0.09 8.18 0.06 1.052 0.55 < 0.001
0.57
Actinobacteria 2.73 0.69 2.17 1.28 0.848 0.98 0.052 0.43
Proteobacteria 2.90 7.51 4.06 6.71 0.959 0.85 0.001 0.31
Spirochaetae 2.96b 1.14c 5.18a 1.19c 0.531 0.041 < 0.001
0.051
Verrucomicrobia 0.56 0.28 0.51 0.20 0.069 0.27 < 0.001
0.76
F: B 1.85 1.35 1.35 1.27 0.115 0.005 0.004 0.064
Others (< 0.5%) 1.69 0.69 0.90 0.46 0.342 0.14 0.046 0.42
1OIL = canola oil; 3-NOP = 3-nitrooxypropanol.
a,b,c Values within a row with different letters differ (P ≤ 0.05)
F: B = Firmicutes: Bacteroidetes
Effect of 3-NOP and OIL on the bacterial community of the rumen
Page 14/34
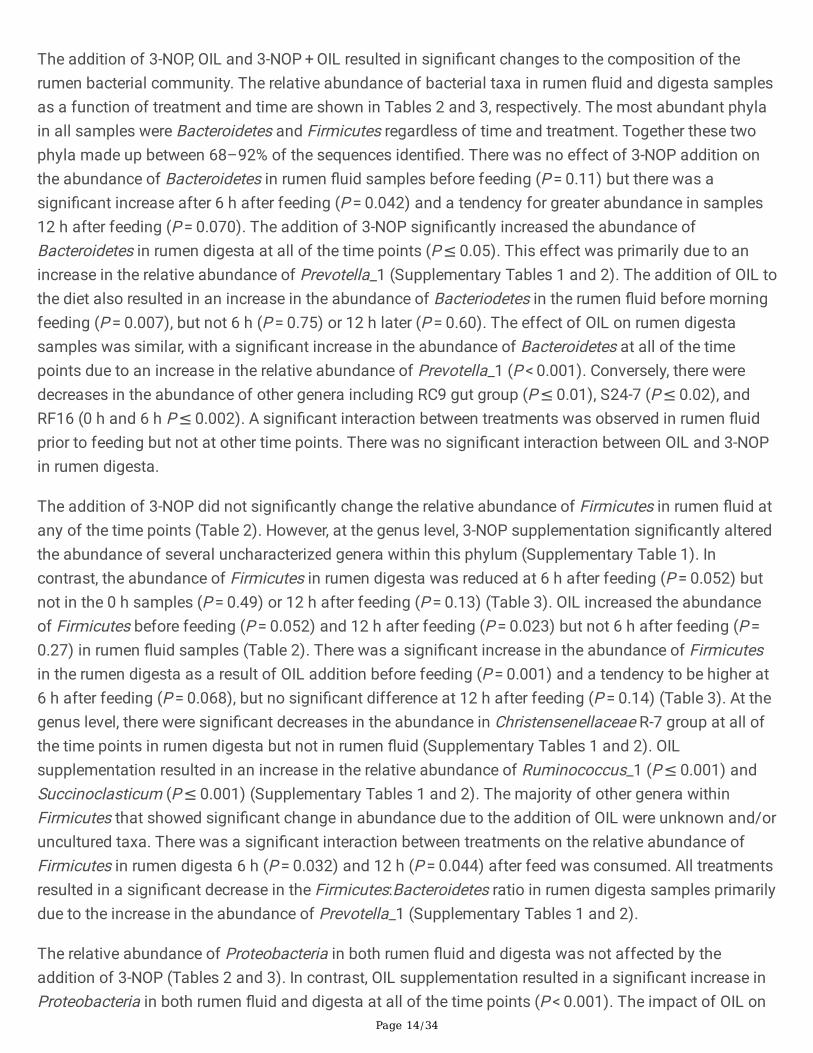
The addition of 3-NOP, OIL and 3-NOP + OIL resulted in signi�cant changes to the composition of therumen bacterial community. The relative abundance of bacterial taxa in rumen �uid and digesta samplesas a function of treatment and time are shown in Tables 2 and 3, respectively. The most abundant phylain all samples were Bacteroidetes and Firmicutes regardless of time and treatment. Together these twophyla made up between 68–92% of the sequences identi�ed. There was no effect of 3-NOP addition onthe abundance of Bacteroidetes in rumen �uid samples before feeding (P = 0.11) but there was asigni�cant increase after 6 h after feeding (P = 0.042) and a tendency for greater abundance in samples12 h after feeding (P = 0.070). The addition of 3-NOP signi�cantly increased the abundance ofBacteroidetes in rumen digesta at all of the time points (P ≤ 0.05). This effect was primarily due to anincrease in the relative abundance of Prevotella_1 (Supplementary Tables 1 and 2). The addition of OIL tothe diet also resulted in an increase in the abundance of Bacteriodetes in the rumen �uid before morningfeeding (P = 0.007), but not 6 h (P = 0.75) or 12 h later (P = 0.60). The effect of OIL on rumen digestasamples was similar, with a signi�cant increase in the abundance of Bacteroidetes at all of the timepoints due to an increase in the relative abundance of Prevotella_1 (P < 0.001). Conversely, there weredecreases in the abundance of other genera including RC9 gut group (P ≤ 0.01), S24-7 (P ≤ 0.02), andRF16 (0 h and 6 h P ≤ 0.002). A signi�cant interaction between treatments was observed in rumen �uidprior to feeding but not at other time points. There was no signi�cant interaction between OIL and 3-NOPin rumen digesta.
The addition of 3-NOP did not signi�cantly change the relative abundance of Firmicutes in rumen �uid atany of the time points (Table 2). However, at the genus level, 3-NOP supplementation signi�cantly alteredthe abundance of several uncharacterized genera within this phylum (Supplementary Table 1). Incontrast, the abundance of Firmicutes in rumen digesta was reduced at 6 h after feeding (P = 0.052) butnot in the 0 h samples (P = 0.49) or 12 h after feeding (P = 0.13) (Table 3). OIL increased the abundanceof Firmicutes before feeding (P = 0.052) and 12 h after feeding (P = 0.023) but not 6 h after feeding (P = 0.27) in rumen �uid samples (Table 2). There was a signi�cant increase in the abundance of Firmicutesin the rumen digesta as a result of OIL addition before feeding (P = 0.001) and a tendency to be higher at6 h after feeding (P = 0.068), but no signi�cant difference at 12 h after feeding (P = 0.14) (Table 3). At thegenus level, there were signi�cant decreases in the abundance in Christensenellaceae R-7 group at all ofthe time points in rumen digesta but not in rumen �uid (Supplementary Tables 1 and 2). OILsupplementation resulted in an increase in the relative abundance of Ruminococcus_1 (P ≤ 0.001) andSuccinoclasticum (P ≤ 0.001) (Supplementary Tables 1 and 2). The majority of other genera withinFirmicutes that showed signi�cant change in abundance due to the addition of OIL were unknown and/oruncultured taxa. There was a signi�cant interaction between treatments on the relative abundance ofFirmicutes in rumen digesta 6 h (P = 0.032) and 12 h (P = 0.044) after feed was consumed. All treatmentsresulted in a signi�cant decrease in the Firmicutes:Bacteroidetes ratio in rumen digesta samples primarilydue to the increase in the abundance of Prevotella_1 (Supplementary Tables 1 and 2).
The relative abundance of Proteobacteria in both rumen �uid and digesta was not affected by theaddition of 3-NOP (Tables 2 and 3). In contrast, OIL supplementation resulted in a signi�cant increase inProteobacteria in both rumen �uid and digesta at all of the time points (P < 0.001). The impact of OIL on
Page 15/34
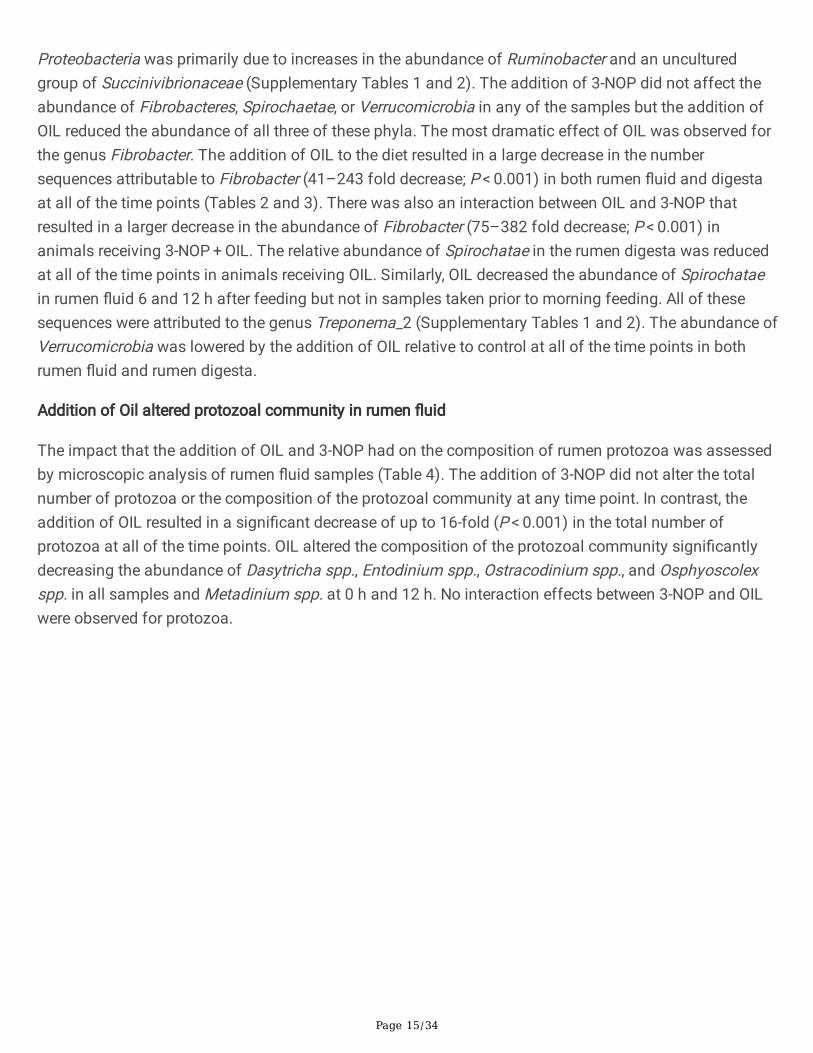
Proteobacteria was primarily due to increases in the abundance of Ruminobacter and an unculturedgroup of Succinivibrionaceae (Supplementary Tables 1 and 2). The addition of 3-NOP did not affect theabundance of Fibrobacteres, Spirochaetae, or Verrucomicrobia in any of the samples but the addition ofOIL reduced the abundance of all three of these phyla. The most dramatic effect of OIL was observed forthe genus Fibrobacter. The addition of OIL to the diet resulted in a large decrease in the numbersequences attributable to Fibrobacter (41–243 fold decrease; P < 0.001) in both rumen �uid and digestaat all of the time points (Tables 2 and 3). There was also an interaction between OIL and 3-NOP thatresulted in a larger decrease in the abundance of Fibrobacter (75–382 fold decrease; P < 0.001) inanimals receiving 3-NOP + OIL. The relative abundance of Spirochatae in the rumen digesta was reducedat all of the time points in animals receiving OIL. Similarly, OIL decreased the abundance of Spirochataein rumen �uid 6 and 12 h after feeding but not in samples taken prior to morning feeding. All of thesesequences were attributed to the genus Treponema_2 (Supplementary Tables 1 and 2). The abundance ofVerrucomicrobia was lowered by the addition of OIL relative to control at all of the time points in bothrumen �uid and rumen digesta.
Addition of Oil altered protozoal community in rumen �uid
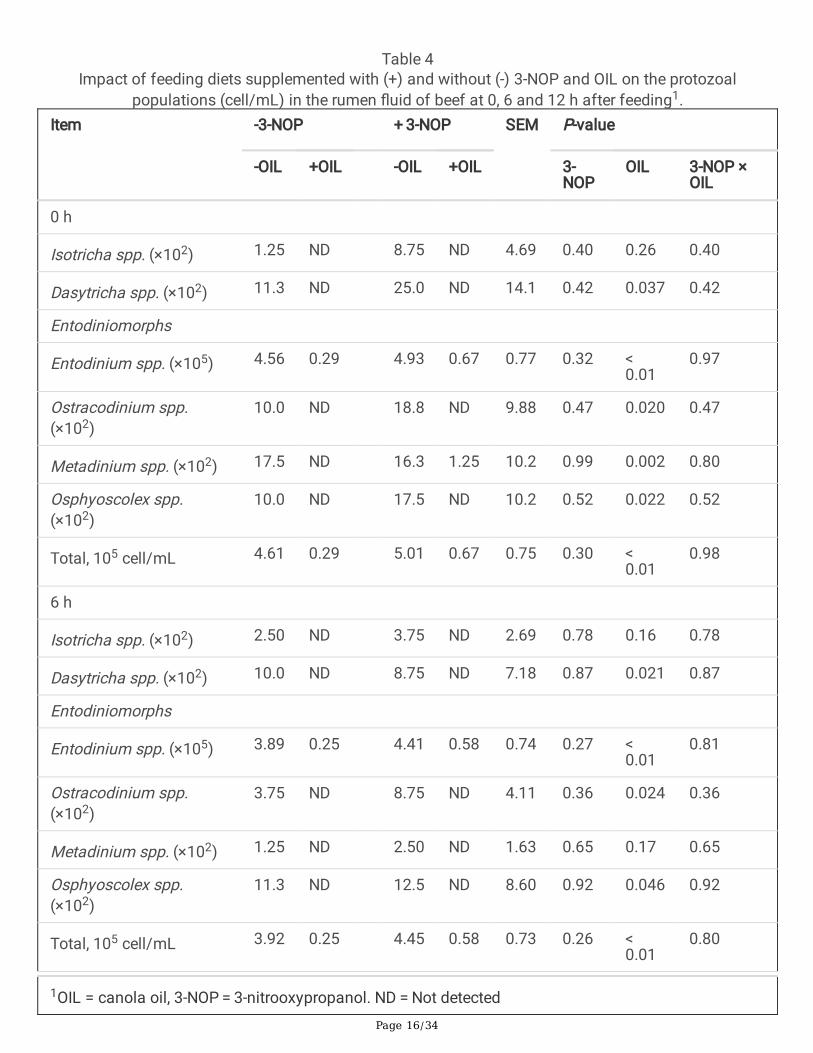
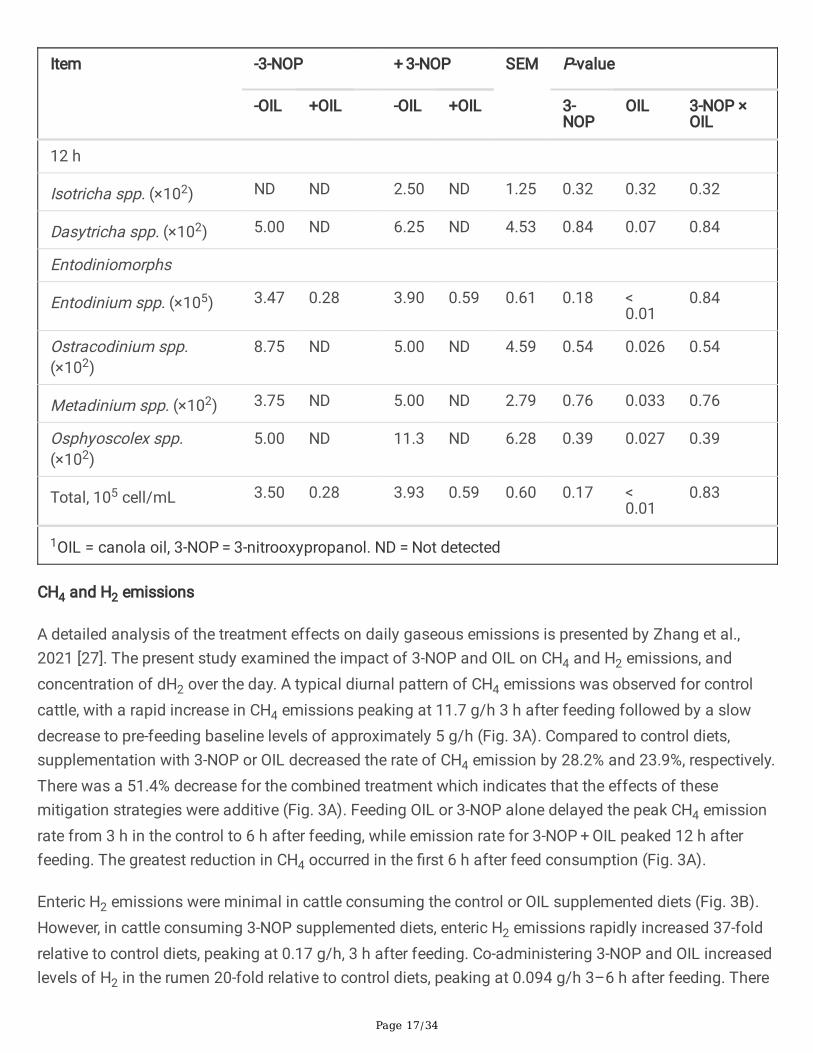
The impact that the addition of OIL and 3-NOP had on the composition of rumen protozoa was assessedby microscopic analysis of rumen �uid samples (Table 4). The addition of 3-NOP did not alter the totalnumber of protozoa or the composition of the protozoal community at any time point. In contrast, theaddition of OIL resulted in a signi�cant decrease of up to 16-fold (P < 0.001) in the total number ofprotozoa at all of the time points. OIL altered the composition of the protozoal community signi�cantlydecreasing the abundance of Dasytricha spp., Entodinium spp., Ostracodinium spp., and Osphyoscolexspp. in all samples and Metadinium spp. at 0 h and 12 h. No interaction effects between 3-NOP and OILwere observed for protozoa.
Page 16/34
Table 4Impact of feeding diets supplemented with (+) and without (-) 3-NOP and OIL on the protozoal
populations (cell/mL) in the rumen �uid of beef at 0, 6 and 12 h after feeding1.Item -3-NOP + 3-NOP SEM P-value
-OIL +OIL -OIL +OIL 3-NOP
OIL 3-NOP ×OIL
0 h
Isotricha spp. (×102) 1.25 ND 8.75 ND 4.69 0.40 0.26 0.40
Dasytricha spp. (×102) 11.3 ND 25.0 ND 14.1 0.42 0.037 0.42
Entodiniomorphs
Entodinium spp. (×105) 4.56 0.29 4.93 0.67 0.77 0.32 < 0.01
0.97
Ostracodinium spp.(×102)
10.0 ND 18.8 ND 9.88 0.47 0.020 0.47
Metadinium spp. (×102) 17.5 ND 16.3 1.25 10.2 0.99 0.002 0.80
Osphyoscolex spp.(×102)
10.0 ND 17.5 ND 10.2 0.52 0.022 0.52
Total, 105 cell/mL 4.61 0.29 5.01 0.67 0.75 0.30 < 0.01
0.98
6 h
Isotricha spp. (×102) 2.50 ND 3.75 ND 2.69 0.78 0.16 0.78
Dasytricha spp. (×102) 10.0 ND 8.75 ND 7.18 0.87 0.021 0.87
Entodiniomorphs
Entodinium spp. (×105) 3.89 0.25 4.41 0.58 0.74 0.27 < 0.01
0.81
Ostracodinium spp.(×102)
3.75 ND 8.75 ND 4.11 0.36 0.024 0.36
Metadinium spp. (×102) 1.25 ND 2.50 ND 1.63 0.65 0.17 0.65
Osphyoscolex spp.(×102)
11.3 ND 12.5 ND 8.60 0.92 0.046 0.92
Total, 105 cell/mL 3.92 0.25 4.45 0.58 0.73 0.26 < 0.01
0.80
1OIL = canola oil, 3-NOP = 3-nitrooxypropanol. ND = Not detected
Page 17/34
Item -3-NOP + 3-NOP SEM P-value
-OIL +OIL -OIL +OIL 3-NOP
OIL 3-NOP ×OIL
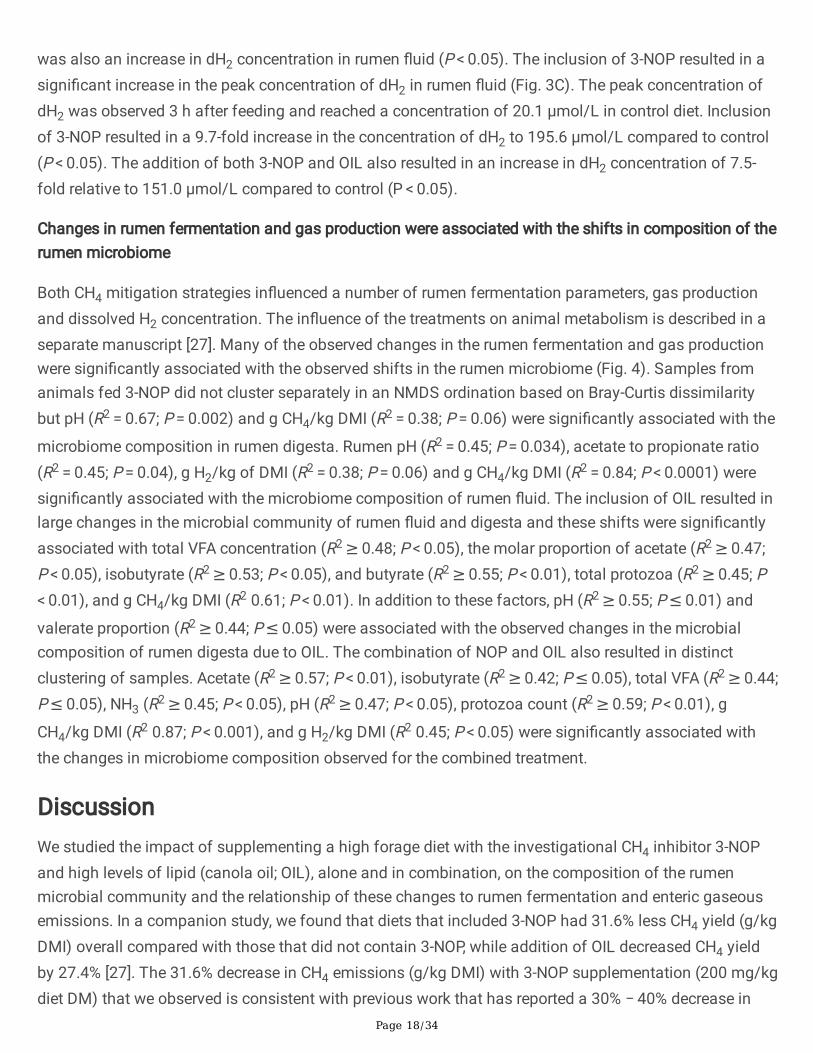
12 h
Isotricha spp. (×102) ND ND 2.50 ND 1.25 0.32 0.32 0.32
Dasytricha spp. (×102) 5.00 ND 6.25 ND 4.53 0.84 0.07 0.84
Entodiniomorphs
Entodinium spp. (×105) 3.47 0.28 3.90 0.59 0.61 0.18 < 0.01
0.84
Ostracodinium spp.(×102)
8.75 ND 5.00 ND 4.59 0.54 0.026 0.54
Metadinium spp. (×102) 3.75 ND 5.00 ND 2.79 0.76 0.033 0.76
Osphyoscolex spp.(×102)
5.00 ND 11.3 ND 6.28 0.39 0.027 0.39
Total, 105 cell/mL 3.50 0.28 3.93 0.59 0.60 0.17 < 0.01
0.83
1OIL = canola oil, 3-NOP = 3-nitrooxypropanol. ND = Not detected
CH4 and H2 emissions
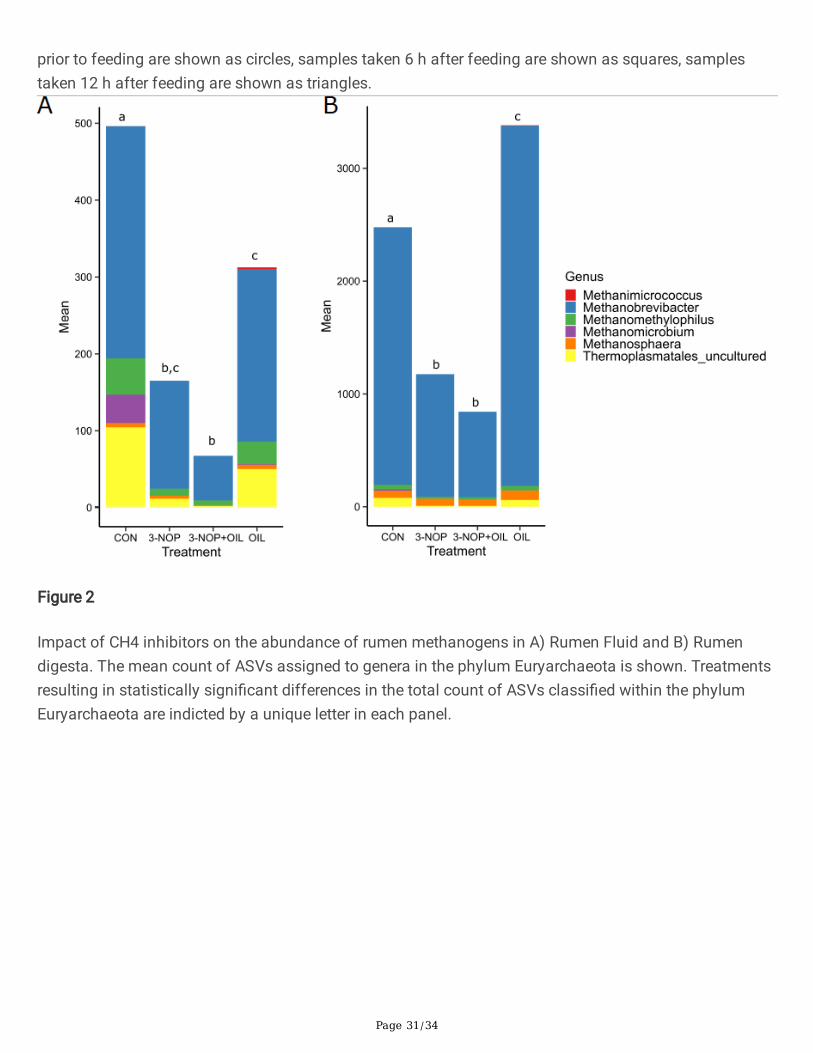
A detailed analysis of the treatment effects on daily gaseous emissions is presented by Zhang et al.,2021 [27]. The present study examined the impact of 3-NOP and OIL on CH4 and H2 emissions, andconcentration of dH2 over the day. A typical diurnal pattern of CH4 emissions was observed for controlcattle, with a rapid increase in CH4 emissions peaking at 11.7 g/h 3 h after feeding followed by a slowdecrease to pre-feeding baseline levels of approximately 5 g/h (Fig. 3A). Compared to control diets,supplementation with 3-NOP or OIL decreased the rate of CH4 emission by 28.2% and 23.9%, respectively.There was a 51.4% decrease for the combined treatment which indicates that the effects of thesemitigation strategies were additive (Fig. 3A). Feeding OIL or 3-NOP alone delayed the peak CH4 emissionrate from 3 h in the control to 6 h after feeding, while emission rate for 3-NOP + OIL peaked 12 h afterfeeding. The greatest reduction in CH4 occurred in the �rst 6 h after feed consumption (Fig. 3A).
Enteric H2 emissions were minimal in cattle consuming the control or OIL supplemented diets (Fig. 3B).However, in cattle consuming 3-NOP supplemented diets, enteric H2 emissions rapidly increased 37-foldrelative to control diets, peaking at 0.17 g/h, 3 h after feeding. Co-administering 3-NOP and OIL increasedlevels of H2 in the rumen 20-fold relative to control diets, peaking at 0.094 g/h 3–6 h after feeding. There
Page 18/34
was also an increase in dH2 concentration in rumen �uid (P < 0.05). The inclusion of 3-NOP resulted in asigni�cant increase in the peak concentration of dH2 in rumen �uid (Fig. 3C). The peak concentration ofdH2 was observed 3 h after feeding and reached a concentration of 20.1 µmol/L in control diet. Inclusionof 3-NOP resulted in a 9.7-fold increase in the concentration of dH2 to 195.6 µmol/L compared to control(P < 0.05). The addition of both 3-NOP and OIL also resulted in an increase in dH2 concentration of 7.5-fold relative to 151.0 µmol/L compared to control (P < 0.05).
Changes in rumen fermentation and gas production were associated with the shifts in composition of therumen microbiome
Both CH4 mitigation strategies in�uenced a number of rumen fermentation parameters, gas productionand dissolved H2 concentration. The in�uence of the treatments on animal metabolism is described in aseparate manuscript [27]. Many of the observed changes in the rumen fermentation and gas productionwere signi�cantly associated with the observed shifts in the rumen microbiome (Fig. 4). Samples fromanimals fed 3-NOP did not cluster separately in an NMDS ordination based on Bray-Curtis dissimilaritybut pH (R2 = 0.67; P = 0.002) and g CH4/kg DMI (R2 = 0.38; P = 0.06) were signi�cantly associated with the
microbiome composition in rumen digesta. Rumen pH (R2 = 0.45; P = 0.034), acetate to propionate ratio(R2 = 0.45; P = 0.04), g H2/kg of DMI (R2 = 0.38; P = 0.06) and g CH4/kg DMI (R2 = 0.84; P < 0.0001) weresigni�cantly associated with the microbiome composition of rumen �uid. The inclusion of OIL resulted inlarge changes in the microbial community of rumen �uid and digesta and these shifts were signi�cantlyassociated with total VFA concentration (R2 ≥ 0.48; P < 0.05), the molar proportion of acetate (R2 ≥ 0.47;P < 0.05), isobutyrate (R2 ≥ 0.53; P < 0.05), and butyrate (R2 ≥ 0.55; P < 0.01), total protozoa (R2 ≥ 0.45; P < 0.01), and g CH4/kg DMI (R2 0.61; P < 0.01). In addition to these factors, pH (R2 ≥ 0.55; P ≤ 0.01) and
valerate proportion (R2 ≥ 0.44; P ≤ 0.05) were associated with the observed changes in the microbialcomposition of rumen digesta due to OIL. The combination of NOP and OIL also resulted in distinctclustering of samples. Acetate (R2 ≥ 0.57; P < 0.01), isobutyrate (R2 ≥ 0.42; P ≤ 0.05), total VFA (R2 ≥ 0.44;P ≤ 0.05), NH3 (R2 ≥ 0.45; P < 0.05), pH (R2 ≥ 0.47; P < 0.05), protozoa count (R2 ≥ 0.59; P < 0.01), g
CH4/kg DMI (R2 0.87; P < 0.001), and g H2/kg DMI (R2 0.45; P < 0.05) were signi�cantly associated withthe changes in microbiome composition observed for the combined treatment.
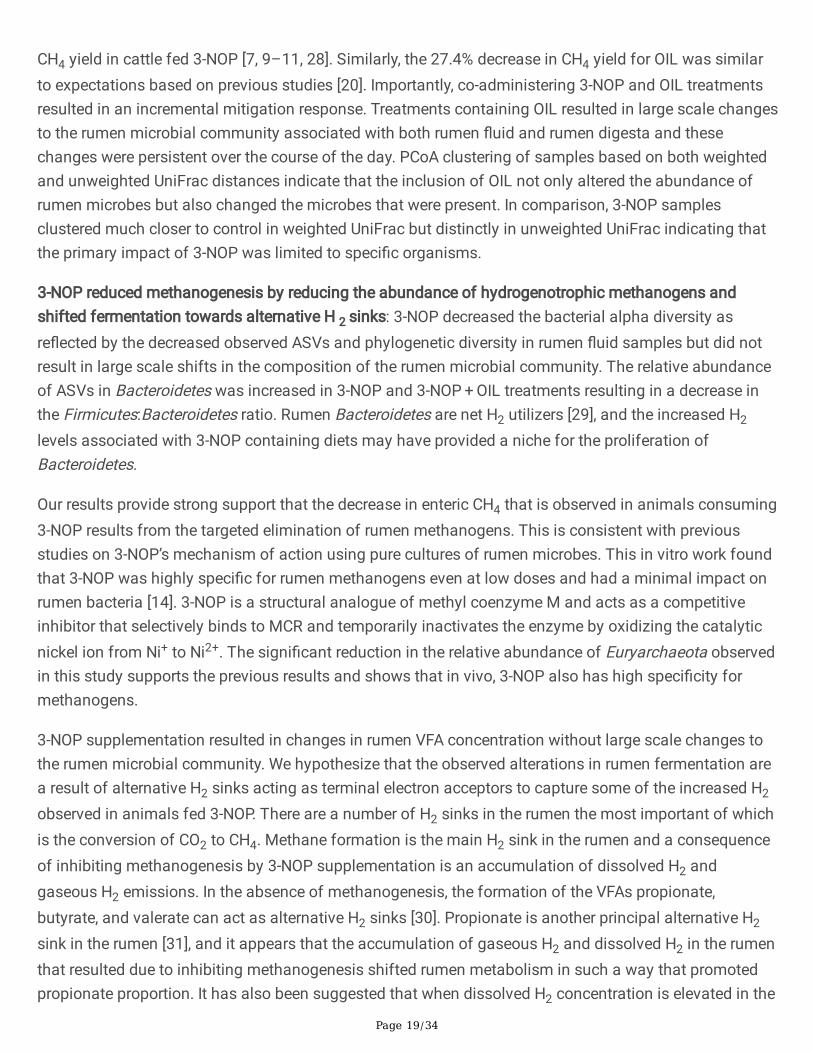
DiscussionWe studied the impact of supplementing a high forage diet with the investigational CH4 inhibitor 3-NOPand high levels of lipid (canola oil; OIL), alone and in combination, on the composition of the rumenmicrobial community and the relationship of these changes to rumen fermentation and enteric gaseousemissions. In a companion study, we found that diets that included 3-NOP had 31.6% less CH4 yield (g/kgDMI) overall compared with those that did not contain 3-NOP, while addition of OIL decreased CH4 yieldby 27.4% [27]. The 31.6% decrease in CH4 emissions (g/kg DMI) with 3-NOP supplementation (200 mg/kgdiet DM) that we observed is consistent with previous work that has reported a 30% − 40% decrease in
Page 19/34
CH4 yield in cattle fed 3-NOP [7, 9–11, 28]. Similarly, the 27.4% decrease in CH4 yield for OIL was similarto expectations based on previous studies [20]. Importantly, co-administering 3-NOP and OIL treatmentsresulted in an incremental mitigation response. Treatments containing OIL resulted in large scale changesto the rumen microbial community associated with both rumen �uid and rumen digesta and thesechanges were persistent over the course of the day. PCoA clustering of samples based on both weightedand unweighted UniFrac distances indicate that the inclusion of OIL not only altered the abundance ofrumen microbes but also changed the microbes that were present. In comparison, 3-NOP samplesclustered much closer to control in weighted UniFrac but distinctly in unweighted UniFrac indicating thatthe primary impact of 3-NOP was limited to speci�c organisms.
3-NOP reduced methanogenesis by reducing the abundance of hydrogenotrophic methanogens andshifted fermentation towards alternative H 2 sinks: 3-NOP decreased the bacterial alpha diversity asre�ected by the decreased observed ASVs and phylogenetic diversity in rumen �uid samples but did notresult in large scale shifts in the composition of the rumen microbial community. The relative abundanceof ASVs in Bacteroidetes was increased in 3-NOP and 3-NOP + OIL treatments resulting in a decrease inthe Firmicutes:Bacteroidetes ratio. Rumen Bacteroidetes are net H2 utilizers [29], and the increased H2
levels associated with 3-NOP containing diets may have provided a niche for the proliferation ofBacteroidetes.
Our results provide strong support that the decrease in enteric CH4 that is observed in animals consuming3-NOP results from the targeted elimination of rumen methanogens. This is consistent with previousstudies on 3-NOP’s mechanism of action using pure cultures of rumen microbes. This in vitro work foundthat 3-NOP was highly speci�c for rumen methanogens even at low doses and had a minimal impact onrumen bacteria [14]. 3-NOP is a structural analogue of methyl coenzyme M and acts as a competitiveinhibitor that selectively binds to MCR and temporarily inactivates the enzyme by oxidizing the catalyticnickel ion from Ni+ to Ni2+. The signi�cant reduction in the relative abundance of Euryarchaeota observedin this study supports the previous results and shows that in vivo, 3-NOP also has high speci�city formethanogens.
3-NOP supplementation resulted in changes in rumen VFA concentration without large scale changes tothe rumen microbial community. We hypothesize that the observed alterations in rumen fermentation area result of alternative H2 sinks acting as terminal electron acceptors to capture some of the increased H2
observed in animals fed 3-NOP. There are a number of H2 sinks in the rumen the most important of whichis the conversion of CO2 to CH4. Methane formation is the main H2 sink in the rumen and a consequenceof inhibiting methanogenesis by 3-NOP supplementation is an accumulation of dissolved H2 andgaseous H2 emissions. In the absence of methanogenesis, the formation of the VFAs propionate,butyrate, and valerate can act as alternative H2 sinks [30]. Propionate is another principal alternative H2
sink in the rumen [31], and it appears that the accumulation of gaseous H2 and dissolved H2 in the rumenthat resulted due to inhibiting methanogenesis shifted rumen metabolism in such a way that promotedpropionate proportion. It has also been suggested that when dissolved H2 concentration is elevated in the
Page 20/34
rumen, fermentation pathways that are net generators of H2 such as acetate production are unfavorable[32]. The observed increase in dissolved H2 concentration, accompanied by decreased acetate andincreased propionate percentages with 3-NOP (alone and in combination with OIL) supplementationobserved in this study, are consistent with this observation [27]. The increased production of propionatedoes not incorporate all of the excess H2 when methanogenesis is inhibited and this can lead to anincrease in gaseous H2 emissions as we observed in the present study [12]. The increase in propionatemolar percentage and decrease in acetate molar percentage that we observed with 3-NOP (alone and incombination with oil) is consistent with previous studies [6, 27, 33].
Oil supplementation caused large scale changes in the composition of the rumen microbiome and alteredrumen fermentation
OIL (alone and in combination with 3-NOP) had a large impact on the rumen microbial community andrumen fermentation. We observed reductions in the relative abundance of methanogens, large scalechanges in the composition of the rumen bacterial population, elimination of rumen protozoa andkeystone �brolytic bacteria, and changes in VFA concentration and proportions. The inclusion of OILshifted rumen fermentation pathways and resulted in increased propionate and decreased acetateproportions. OIL supplementation (≥ 4.0% of DMI) has previously been reported to increase propionateand decrease acetate percentages for beef and dairy cattle [23, 34].
Although we did not directly measure ruminal �ber digestion we observed signi�cant decreases in anumber of important �ber degrading rumen microbes including Fibrobacter, Bacteroidales BS11, andBacteroidales RF16 when OIL was included in the diet. Fibrobacter was decreased at all of the time pointsin both rumen �uid and rumen digesta by up to 382-fold. Eliminating this keystone member of the rumenmicrobial community would undoubtedly reduce the e�ciency of cellulose degradation. An in vitro studyexamining the CH4 inhibition potential of Tucumã oil observed a 25% reduction in DM disappearance inthe rumen, signi�cantly reduced microbial richness, with a 16-fold reduction in the abundance ofFibrobacter but no speci�c effect on methanogens [25]. Interestingly, we also observed a signi�cantincrease in the abundance of Ruminococcus_1 in OIL samples. Ruminococcus_1 is known to contain thekeystone �ber degrading bacteria Ruminococcus �avifaciens and Ruminococcus albus [35]. Wespeculate that the elimination of Fibrobacter from the rumen of these animals may have provided anopportunity for other �ber degrading bacteria that are less sensitive to fatty acids to occupy the nichepreviously �lled by Fibrobacter. Several Bacteroidetes were also signi�cantly less abundant and are alsowell known to play important roles in carbohydrate metabolism. Bacteroidales BS11 gut group utilizehemicellulose monomeric sugars (e.g., xylose, fucose, mannose and rhamnose) and are involved inconverting these to VFA [36]. Bacteroidales RF16 group are abundant in a range of ruminants when highforage diets are consumed suggesting a role in plant cell wall degradation [37–39]. The shift in VFApro�le and the changes to the microbiome composition that accompanied the oil supplementation isconsistent with a reduction in ruminal �ber degradation and suggests that �ber digestion was impaired inthe animals consuming the OIL treatment [40]. This supposition is supported by the observed 18.0% and
Page 21/34
23.3% decrease in total-tract digestibility of neutral detergent �ber when OIL was added to diets withoutand with 3-NOP, respectively [27].
A reduction in �ber digestion can favor a shift towards increased starch utilization in the rumen. Weobserved a signi�cant increase in the abundance of the genera Succinivibrio and Ruminobacter within thephylum Proteobacteria in the OIL treatments both of which are known to play a role in starch metabolism[41, 42]. Succinivibriaceae are known to metabolize starch and generate succinate which is anintermediate in the propionate pathway. Succiniclasticum was also signi�cantly more abundant in OILdiets and can convert succinate into propionate [43]. This metabolic shift in the rumen would alsocontribute to the increased proportions of propionate and the low H2 emissions we observed in thistreatment. Interestingly, several studies have found that Succinivibrionaceae is associated with reducedCH4 emissions, increased feed e�ciency and higher propionate concentration [44, 45].
3-NOP and OIL have distinct mechanisms for reducing CH 4 emissions: Combining mitigation strategieshas the potential to further reduce enteric CH4 emissions from ruminant livestock and increase animale�ciency by increasing metabolizable energy availability. To date there has been little researchconducted to identify effective combinations of inhibitors that have distinct modes of action and actsynergistically or independently to reduce enteric CH4 production [4]. In the present study we observedvery few interactions between 3-NOP and OIL, which is consistent with the unique mechanisms withwhich these compounds reduce enteric CH4 emissions. Notable exceptions where signi�cant interactionswere observed are: 1) acetate and propionate production, and 2) methanogen abundance. Compared to 3-NOP treatment alone, co-administering 3-NOP and OIL resulted in an increase in propionate proportionwith a concomitant decrease in acetate proportion as well as alterations in the lipid composition of therumen �uid [27]. This can be interpreted as excess H2 being consumed through increased propionateproduction and biohydrogenation as intended. This is also consistent with the low H2 emissions thatwere observed when 3-NOP and OIL were fed together. The effect of 3-NOP and OIL on decreasingmethanogen abundance is a signi�cant result and shows that combinations of CH4 inhibitors can resultin substantial reductions in methanogens. One explanation for the interaction between these inhibitors isthat the impact of lipid on the protozoal community effectively reduced the abundance of methanogensassociated with rumen protozoa and 3-NOP reduced the abundance of free-living methanogens. Althoughthe inclusion of both 3-NOP and OIL had incremental effects on enteric CH4 emissions, the high lipidcontent of these diets impacted the abundance of �ber degrading bacteria in the rumen and this mayhave had a negative effect on feed digestibility in these animals. The reduction in �ber degradationresulting from the inclusion of high concentrations of lipids may outweigh the CH4 mitigating effectsthese lipids have in high performing animals. Additional research is needed to identify optimal inclusionlevels that will maximize CH4 mitigation without sacri�cing animal performance.
Conclusions
Page 22/34
This study examined the impact of 3-NOP and canola oil supplementation as potential interventions toreduce enteric CH4 emissions associated with beef production. Our study found that these compoundsare both effective treatments for reducing CH4 emissions; however, they have unique impacts on therumen microbial community. 3-NOP is a highly targeted inhibitor that speci�cally reduces the activity ofthe dominant rumen methanogens and has minimal effects on other rumen microbes. In contrast, canolaoil resulted in large scale shifts to the bacterial community and eliminated the majority of rumenprotozoa. This caused a dramatic decrease in abundance of key �ber degrading rumen microbes, inparticular Fibrobacter. Importantly, co-administering CH4 inhibitors with distinct mechanisms of actioncan both enhance CH4 inhibition and provide alternative H2 sinks to prevent excessive accumulation ofruminal H2.
MethodsThe experiment was conducted at Agriculture and Agri-Food Canada’s Research and Development Centrein Lethbridge, AB, Canada. Animals were cared for in accordance with the guidelines of the CanadianCouncil on Animal Care (2009). Full details of the animal metabolism trial are given in Zhang et al. 2021[27].
Experimental Design and Dietary Treatments: Eight ruminally cannulated beef heifers (Angus cross, 732 ± 43 kg) were used in a double 4 × 4 Latin square design with four 28-d periods and 4 dietary treatmentsarranged as a 2 (3-NOP, with and without) × 2 (oil, with and without) factorial. All animals were adapted totheir respective diets from day 1–13 of each period and the remaining 15 days were used formeasurements and sample collection. The dietary treatments were: 1) control (basal diet, CON); 2) 3-NOPalone (200 mg/kg of diet DM; 3-NOP, DSM Nutritional Products Ltd., Kaiseraugst, Switzerland); 3) canolaoil alone (50g/kg DM, OIL; Loveland Industries, Inc., Loveland, CO, USA); and 4) 3-NOP (200 mg/kg of dietDM) and canola oil (50 g/kg DM) combined (3-NOP + OIL). Animals were blocked according to bodyweight and then randomly assigned to one of the 4 treatments. The animals were fed a high forage dietthat consisted of (DM basis) 900 g/kg barley silage, 41.2 g/kg dry rolled barley grain, 50 g/kg supplementmix and 8.8 g/kg treatment mix (control or treatment). Both treatment mixes were prepared weekly andrefrigerated, before being fully mixed with the diet. Total mixed rations (TMR) were mixed daily andanimals were fed at 10:00 h.
Rumen Sampling: Rumen content samples were obtained on day 14 of each period at 3 time points: priorto feeding (0 h), 6 h and 12 h after feeding. A representative 1 L sample of rumen contents (solid andliquid) was obtained from four different locations in the rumen (cranial, caudal, right and left sides of therumen). The rumen content sample was �ltered through 2 layers of polyester mono�lament fabric (355µm mesh opening) to separate the liquid and solid fractions. A 5 mL of rumen �uid was obtained andpreserved with methylgreen-formalin-saline solution, inverted ten times, and stored in the dark at roomtemperature (23 ± 2°C) until protozoa were identi�ed and counted as described previously [46]. Samples
Page 23/34
of �ltered rumen �uid and samples of rumen digesta were snap frozen in liquid nitrogen and stored at-80°C until DNA extraction.
DNA Extraction and 16s rRNA Gene Ampli�cation
Frozen rumen samples were freeze dried and ground using a coffee grinder. Microbial DNA was extractedfrom ~ 0.1 g of the freeze dried, ground material using the Zymobiomics DNA extraction kit as per themanufacturer’s instructions (Zymo Research, Irvine CA). Concentration and purity of the extractedmetagenomic DNA was determined by measuring the ratios of absorbance at 260/280 and 260/230using a NanoDrop spectrophotometer (Thermo Fisher Scienti�c, Mississauga, ON, Canada).
Sequencing was performed at Genome Quebec Innovation Center (Montreal, Canada) using the IlluminaMiSeq Reagent Kit v2 (500 cycle) following the manufacturer’s guidelines. The primers 515F (5′ -GTGCCAGCMGCCGCGGTAA- 3′) and 806R (5′ -GGACTACHVGGGTWTCTAAT- 3′) targeting the V4 region ofthe 16s rRNA gene were used to examine both bacterial and archaeal diversity [47]. A 33 cycle PCR using1 µL of a 1 in 10 dilution of genomic DNA and the Fast Start High Fidelity PCR System (Roche, Montreal,PQ) was conducted with the following conditions: 94°C for 2 min, followed by 33 cycles of 94°C for 30 s,58°C for 30 s, and 72°C for 30 s, with a �nal elongation step at 72°C for 7 min. Fluidigm Corporation (SanFrancisco, CA) barcodes were incorporated in a second PCR reaction using the FastStart High FidelityPCR System under the following conditions: 95°C for 10 min, followed by 15 cycles of 95°C for 15 s, 60°Cfor 30 s, and 72°C for 1 min, followed by a �nal elongation step at 72°C for 3 min. After ampli�cation,PCR products were assessed in a 2% agarose gel to con�rm adequate ampli�cation. All samples werequanti�ed using the Quant-iT PicoGreen dsDNA Assay Kit (Life Technologies, Carlsbad, CA) and werepooled in equal proportions. Pooled samples were then puri�ed using calibrated Ampure XP beads(Beckman Coulter, Mississauga, ON). The pooled samples (library) were quanti�ed using the Quant-iTPicoGreen dsDNA Assay Kit (Life Technologies, Carlsbad, CA) and the Kapa Illumina GA with RevisedPrimers-SYBR Fast Universal kit (Kapa Biosystems, Wilmington, MA). Average fragment size wasdetermined using a LabChip GX (PerkinElmer, Waltham, MA, USA) instrument.
Raw fastq �les were imported into Qiime2 for sequence analysis [48]. Primer and adapter sequences wereremoved from sequence �les with the plugin ‘cutadapt’ [49]. Following removal of primer and adaptersequences, the program DADA2 [50] was used for quality control, �ltering of any phiX reads present in thesequencing data, and removal of chimeric sequences. Amplicon Sequence variants (ASVs) at strain levelresolution (> 99.9 % id) were generated using DADA2 [50]. The Mafft program [51] was used to perform amultiple sequence alignment and to mask highly variable regions. A phylogenetic tree was generated withFastTree [52] and taxonomy was assigned to sequences using a Naïve-Bayes classi�er trained with theSilva 128 reference database and the ‘feature-classi�er’ plugin [53]. Sequences were subsampled to thelowest number of sequences found in all of the samples to ensure that α- and β-diversity analysis usedthe same number of sequences per sample. The plugin, ‘core-diversity-metrics’ was used to assessmicrobial diversity within (α-diversity) and between samples (β-diversity). The α-diversity indices: numberof ASVs, and Faith’s Phylogenetic Diversity were evaluated for treatment effects. β-Diversity analysis was
Page 24/34
carried out using weighted and unweighted UniFrac [54]. Environmental variables that had a signi�cantimpact on microbiome composition were identi�ed in R using the envplot function. Sequences weredeposited to the Small Reads Archive (NCBI) with accession number PRJNA680383.
Enteric gas emissions and dissolved hydrogen
Enteric gas production (CH4 and H2) was measured in open-circuit calorimetry chambers from day 18 to21 of every period according to the methods of Beauchemin and McGinn (2006) and McGinn et al. (2004)[24, 36]. All chambers were calibrated before and after the study by sequentially releasing 0, 0.2, and 0.4L/min of CH4 into each chamber using a mass-�ow meter (Omega Engineering, Stamford, CT). Slopes ofthe best �t calibration regressions were generated to correct emissions for each gas as detailed byMcGinn et al. (2004) [55]. Variability in slopes across chambers was less than 5% and recovery ratesranged from 97–107%. Details of the chamber design and the calculation of CH4 emissions werereported by McGinn et al. (2004) [36]. Hydrogen (H2) production was measured at 30-min intervals every 3h by collecting air samples from intake air ducts of each chamber. Hydrogen concentration wasdetermined via a H2 breath tester (BreathTracker Digital Microlyzer, QuinTron Instrument Company, Inc.,Milwaukee, WI, USA). Dissolved hydrogen (dH2) was measured in ruminal �uid samples collected on d 28via the �stula at 0, 3, 6, 9 and 12 hours after feeding. The dH2 concentration was measured usingprocedures described by Wang et al. (2014) [56]. Brie�y, each ruminal �uid sample (35 mL) was quicklytransferred into a 50-mL plastic syringe connected to a 20-mL syringe pre�lled with 10 mL N2 gas. The N2
gas was then injected into the 50-mL syringe, and the syringe was vigorously shaken for 5 min to extractthe gases dissolved in the ruminal �uid into the N2 gas phase. The extracted H2 concentration wasdetermined by gas chromatography (Agilent 7890A, Agilent Inc., Palo Alto, CA, USA). The dH2
concentrations in the original ruminal �uid was calculated according to the equation given by Wang et al.(2016) [57].
Calculations and Statistical Analysis
The daily CH4 �ux was determined for each animal and expressed relative to DMI on the day ofmeasurement. Alpha diversity, relative abundance, protozoal counts, rumen fermentation and gas datawere analyzed by SAS (SAS Institute, Inc., 2015) using a mixed model procedure that included �xedeffects of treatment (3-NOP, OIL and their interaction), random effects of animal, period and group. Thetreatment effect was examined as a 2 × 2 factorial arrangement to determine the main effect of 3-NOP(control and OIL vs. 3-NOP and 3-NOP + OIL), OIL (control and 3-NOP vs OIL and 3-NOP + OIL) and theirinteraction.
A PERMANOVA based statistical test was used to examine the in�uence of treatment, rumen phase(liquid vs. solid), or time of sampling on the composition of the microbial community. A Kruskal-Wallistest was used to examine the signi�cance of treatment on Archaea. Independent pairwise comparisonswith a Nemenyi test and a Chi-squared approximation was used to identify signi�cant differences
Page 25/34
between treatments. P values were corrected for false discovery rates (FDR). Statistical signi�cance wasdeclared at P ≤ 0.05 and tendencies were declared at 0.05 < P ≤ 0.10.
DeclarationsAcknowledgements: Sequencing was conducted by the staff with the McGill University and GénomeQuébec Innovation Centre. We thank B. Farr and K. Andrews for their technical assistance and the staff ofthe Beef Cattle Metabolism Facility for animal care and handling.
Ethics approval and consent to participate: This study was reviewed and approved by the Animal CareCommittee at the Lethbridge Research and Development Centre (Protocol#: KB1607).
Consent for publication: Not applicable
Availability of data and material: Sequence data has been submitted to the Sequence Read Archive withaccession numbers PRJNA680383.
Competing interests: The authors declare no con�ict of interest. M. Kindermann is an employee of DSMNutritional Products.
Funding: funding was provided by Agriculture and Agri-Food Canada. DSM Nutritional Products suppliedthe 3-Nitrooxypropanol. XMZ was supported by National Natural Science Foundation of China grants(31922080 and 32002204).
Authors’ Contributions: RJG conceived of research, performed bioinformatics analysis, analyzed andinterpreted data and wrote manuscript. XMZ processed samples, conducted statistical analysis of dataand contributed to manuscript preparation, MLS collected samples during animal trial, DV collectedsamples during animal trial, LKJ involved in design of Animal trial and provided advice on analysis ofdata SMG contributed to measurement of enteric gas emission, MK contributed to data analysis andmanuscript preparation, MW contributed resources, ZLT provided guidance & involved in interpretation ofresults, KAB conceived of research, designed animal trial, contributed resources, was involved withinterpretation of results and writing of manuscript.
References1. Smith P, Bustamante M, Ahammad H, Clark H, Dong H: Agriculture, forestry and other land use
(AFOLU). In Climate Change 2014: Mitigation of Climate Change Contribution of Working Group III tothe Fifth Assessment Report of the Intergovernmental Panel on Climate Change (Edenhofer O, Pichs-Madruga R, Sokona Y, Minx JC, Farahani E, Kadner S, Seyboth K, Adler A, Baum I, Brunner S, et aleds.). United Kingdom and New York, NY, USA.; 2014.
2. Johnson KA, Johnson DE. Methane emissions from cattle. J Anim Sci. 1995;73:2483–92.
Page 26/34
3. Martin C, Morgavi DP, Doreau M. Methane mitigation in ruminants: from microbe to the farm scale.Animal. 2010;4:351–65.
4. Beauchemin KA, Ungerfeld EM, Eckard RJ, Wang M. Review. Fifty years of research on rumenmethanogenesis: lessons learned and future challenges for mitigation. Animal. 2020;14:s2–16.
5. Lopes JC, de Matos LF, Harper MT, Giallongo F, Oh J, Gruen D, Ono S, Kindermann M, Duval S, HristovAN. Effect of 3-nitrooxypropanol on methane and hydrogen emissions, methane isotopic signature,and ruminal fermentation in dairy cows. J Dairy Sci. 2016;99:5335–44.
�. Martinez-Fernandez G, Abecia L, Arco A, Cantalapiedra-Hijar G, Martin-Garcia AI, Molina-Alcaide E,Kindermann M, Duval S, Yanez-Ruiz DR. Effects of ethyl-3-nitrooxy propionate and 3-nitrooxypropanol on ruminal fermentation, microbial abundance, and methane emissions in sheep. JDairy Sci. 2014;97:3790–9.
7. Vyas D, McGinn SM, Duval SM, Kindermann MK, Beauchemin KA. Optimal dose of 3-nitrooxypropanol for decreasing enteric methane emissions from beef cattle fed high-forage andhigh-grain diets. Anim Prod Sci. 2016;58:1049–55.
�. McGinn SM, Flesch TK, Beauchemin KA, Shreck A, Kindermann M. Micrometeorological Methods forMeasuring Methane Emission Reduction at Beef Cattle Feedlots: Evaluation of 3-nitrooxypropanolFeed Additive. J Environ Qual. 2019;48:1454–61.
9. Hristov AN, Oh J, Giallongo F, Frederick TW, Harper MT, Weeks HL, Branco AF, Moate PJ, Deighton MH,Williams SR, et al. An inhibitor persistently decreased enteric methane emission from dairy cows withno negative effect on milk production. Proc Natl Acad Sci U S A. 2015;112:10663–8.
10. Melgar A, Welter KC, Nedelkov K, Martins C, Harper MT, Oh J, Raisanen SE, Chen X, Cueva SF, Duval S,Hristov AN. Dose-response effect of 3-nitrooxypropanol on enteric methane emissions in dairy cows.J Dairy Sci. 2020;103:6145–56.
11. Vyas D, Alemu AW, McGinn SM, Duval SM, Kindermann M, Beauchemin KA. The combined effects ofsupplementing monensin and 3-nitrooxypropanol on methane emissions, growth rate, and feedconversion e�ciency in beef cattle fed high-forage and high-grain diets. J Anim Sci. 2018;96:2923–38.
12. Guyader J, Ungerfeld EM, Beauchemin KA. Redirection of Metabolic Hydrogen by InhibitingMethanogenesis in the Rumen Simulation Technique (RUSITEC). Front Microbiol. 2017;8:393.
13. Zhang XM, Gruninger RJ, Alemu AW, Wang M, Tan ZL, Kindermann M, Beauchemin KA. 3-Nitrooxypropanol supplementation had little effect on �ber degradation and microbial colonizationof forage particles when evaluated using the in situ ruminal incubation technique. J Dairy Sci.2020;103:8986–97.
14. Duin EC, Wagner T, Shima S, Prakash D, Cronin B, Yáñez-Ruiz DR, Duval S, Rümbeli R, Stemmler RT,Thauer RK, Kindermann M. Mode of action uncovered for the speci�c reduction of methaneemissions from ruminants by the small molecule 3-nitrooxypropanol. Proc Natl Acad Sci U S A.2016;113::E3185.
Page 27/34
15. Haisan J, Sun y, Guan LL, Beauchemin KA, Iwaasa A, Duval S, Kindermann M, Barreda DR, Oba M.The effects of feeding 3-nitrooxypropanol at two doses on milk production, rumen fermentation,plasma metabolites, nutrient digestibility, and methane emissions in lactating Holstein cows. AnimProd Sci. 2016;57:282–9.
1�. Martinez-Fernandez G, Duval S, Kindermann M, Schirra HJ, Denman SE, McSweeney CS. 3-NOP vs.Halogenated Compound: Methane Production, Ruminal Fermentation and Microbial CommunityResponse in Forage Fed Cattle. Front Microbiol. 2018;9:1582.
17. Romero-Perez A, Okine EK, McGinn SM, Guan LL, Oba M, Duval SM, Kindermann M, Beauchemin KA.The potential of 3-nitrooxypropanol to lower enteric methane emissions from beef cattle. J Anim Sci.2014;92:4682–93.
1�. Beauchemin KA. Dietary mitigation of enteric methane from cattle. CAB Reviews: Perspectives inAgriculture, Veterinary Science, Nutrition and Natural Resources 2009;4.
19. Adeyemi KD, Sazili AQ, Ebrahimi M, Samsudin AA, Alimon AR, Karim R, Karsani SA, Sabow AB.Effects of blend of canola oil and palm oil on nutrient intake and digestibility, growth performance,rumen fermentation and fatty acids in goats. Anim Sci J. 2016;87:1137–47.
20. Patra AK. The effect of dietary fats on methane emissions, and its other effects on digestibility,rumen fermentation and lactation performance in cattle: A meta-analysis. Livest Sci. 2013;155:244–54.
21. Beauchemin KA, McGinn SM, Benchaar C, Holtshausen L. Crushed sun�ower, �ax, or canola seeds inlactating dairy cow diets: effects on methane production, rumen fermentation, and milk production. JDairy Sci. 2009;92:2118–27.
22. Pinares-Patiño CS, Franco FE, Molano G, Kjestrup H, Sandoval E, MacLean S, Battistotti M, KoolaardJ, Laubach J. Feed intake and methane emissions from cattle grazing pasture sprayed with canolaoil. Livest Sci. 2016;184:7–12.
23. Beauchemin KA, McGinn SM. Methane emissions from beef cattle: Effects of fumaric acid, essentialoil, and canola oil. J Anim Sci. 2006;84:1489.
24. Beauchemin KA, Kreuzer M, O'Mara F, McAllister TA. Nutritional management for enteric methaneabatement: a review. Aust J Exp Agric. 2008;48:21–7.
25. Ramos AFO, Terry SA, Holman DB, Breves G, Pereira LGR, Silva AGM, Chaves AV. Tucuma Oil ShiftedRuminal Fermentation, Reducing Methane Production and Altering the Microbiome but DecreasedSubstrate Digestibility Within a RUSITEC Fed a Mixed Hay - Concentrate Diet. Front Microbiol.2018;9:1647.
2�. Yanza YR, Szumacher-Strabel M, Jayanegara A, Kasenta AM, Gao M, Huang H, Patra AK, Warzych E,Cieslak A. The effects of dietary medium-chain fatty acids on ruminal methanogenesis andfermentation in vitro and in vivo: A meta-analysis. J Anim Physiol Anim Nutr (Berl). 2020.doi:10.1111/jpn.13367.
27. Zhang XM, Smith ML, Gruninger RJ, Kung L Jr, Vyas D, McGinn SM, Kindermann M, Wang M, Tan ZL,Beauchemin KA. Combined effects of 3-nitrooxypropanol and canola oil supplementation on

Page 28/34
methane emissions, rumen fermentation and biohydrogenation, and total-tract digestibility in beefcattle. J Anim Sci 2021:doi: 10.1093/jas/skab1081.
2�. Vyas D, McGinn SM, Duval SM, Kindermann M, Beauchemin KA. Effects of sustained reduction ofenteric methane emissions with dietary supplementation of 3-nitrooxypropanol on growthperformance of growing and �nishing beef cattle. J Anim Sci. 2016;94:2024–34.
29. Stewart C, Flint H, Bryant M. The rumen bacteria. London: Blackie; 1997.
30. Ungerfeld EM. Metabolic Hydrogen Flows in Rumen Fermentation: Principles and Possibilities ofInterventions. Front Microbiol. 2020;11:589.
31. McAllister TA, Newbold CJ. Redirecting rumen fermentation to reduce methanogenesis. Aust J ExpAgric 2008;48.
32. Janssen PH. In�uence of hydrogen on rumen methane formation and fermentation balances throughmicrobial growth kinetics and fermentation thermodynamics. Anim Feed Sci Technol. 2010;160:1–22.
33. Romero-Perez A, Okine EK, McGinn SM, Guan LL, Oba M, Duval SM, Kindermann M, Beauchemin KA.Sustained reduction in methane production from long-term addition of 3-nitrooxypropanol to a beefcattle diet. J Anim Sci. 2015;93:1780–91.
34. Guyader J, Eugène M, Meunier B, Doreau M, Morgavi DP, Silberberg M, Rochette Y, Gerard C, Loncke C,Martin C. Additive methane-mitigating effect between linseed oil and nitrate fed to cattle. J Anim Sci.2015;93:3564–77.
35. Henderson G, Yilmaz P, Kumar S, Forster RJ, Kelly WJ, Leahy SC, Guan LL, Janssen PH. Improvedtaxonomic assignment of rumen bacterial 16S rRNA sequences using a revised SILVA taxonomicframework. PeerJ. 2019;7:e6496.
3�. Solden LM, Hoyt DW, Collins WB, Plank JE, Daly RA, Hildebrand E, Beavers TJ, Wolfe R, Nicora CD,Purvine SO, et al. New roles in hemicellulosic sugar fermentation for the uncultivated Bacteroidetesfamily BS11. ISME J. 2017;11:691–703.
37. Xue D, Chen H, Chen F, He Y, Zhao C, Zhu D, Zeng L, Li W. Analysis of the rumen bacteria andmethanogenic archaea of yak (Bos grunniens) steers grazing on the Qinghai-Tibetan Plateau. JLivestock Science. 2016;188:61–71.
3�. Popova M, McGovern E, McCabe MS, Martin C, Doreau M, Arbre M, Meale SJ, Morgavi DP, Waters SM.The Structural and Functional Capacity of Ruminal and Cecal Microbiota in Growing Cattle WasUnaffected by Dietary Supplementation of Linseed Oil and Nitrate. Front Microbiol. 2017;8:937.
39. Scharen M, Frahm J, Kersten S, Meyer U, Hummel J, Breves G, Danicke S. Interrelations between therumen microbiota and production, behavioral, rumen fermentation, metabolic, and immunologicalattributes of dairy cows. J Dairy Sci. 2018;101:4615–37.
40. Benchaar C, Hassanat F, Martineau R, Gervais R. Linseed oil supplementation to dairy cows fed dietsbased on red clover silage or corn silage: Effects on methane production, rumen fermentation,nutrient digestibility, N balance, and milk production. J Dairy Sci. 2015;98:7993–8008.
Page 29/34
41. Yang HE, Zotti CA, McKinnon JJ, McAllister TA. Lactobacilli Are Prominent Members of theMicrobiota Involved in the Ruminal Digestion of Barley and Corn. Front Microbiol. 2018;9::718.
42. Hamlin LJ, Hungate RE. Culture and physiology of a starch-digesting bacterium (Bacteroidesamylophilus n. sp.) from the bovine rumen. J Bacteriol. 1956;72:548–54.
43. van Gylswyk NO. Succiniclasticum ruminis gen. nov., sp. nov., a ruminal bacterium convertingsuccinate to propionate as the sole energy-yielding mechanism. Int J Syst Bacteriol. 1995;45:297–300.
44. Pope PB, Smith W, Denman SE, Tringe SG, Barry K, Hugenholtz P, McSweeney CS, McHardy AC,Morrison M. Isolation of Succinivibrionaceae implicated in low methane emissions from Tammarwallabies. Science. 2011;333:646–8.
45. Ramayo-Caldas Y, Zingaretti L, Popova M, Estelle J, Bernard A, Pons N, Bellot P, Mach N, Rau A,Roume H, et al. Identi�cation of rumen microbial biomarkers linked to methane emission in Holsteindairy cows. J Anim Breed Genet. 2020;137:49–59.
4�. Ogimoto K, Imai S: Atlas of Rumen Microbiology. In. Tokyo, Japan.: Japan Sci. Soc. Press; 1981:158.
47. Caporaso JG, Lauber CL, Walters WA, Berg-Lyons D, Huntley J, Fierer N, Owens SM, Betley J, Fraser L,Bauer M, et al. Ultra-high-throughput microbial community analysis on the Illumina HiSeq and MiSeqplatforms. ISME J. 2012;6:1621–4.
4�. Bolyen E, Rideout JR, Dillon MR, Bokulich NA, Abnet CC, Al-Ghalith GA, Alexander H, Alm EJ,Arumugam M, Asnicar F, et al. Reproducible, interactive, scalable and extensible microbiome datascience using QIIME 2. Nat Biotechnol. 2019;37:852–7.
49. Martin M. Cutadapt removes adapter sequences from high-throughput sequencing reads.EMBnetjournal. 2011;17:10–2.
50. Callahan BJ, McMurdie PJ, Rosen MJ, Han AW, Johnson AJ, Holmes SP. DADA2: High-resolutionsample inference from Illumina amplicon data. Nat Methods. 2016;13:581–3.
51. Katoh K, Standley DM. MAFFT multiple sequence alignment software version 7: improvements inperformance and usability. Mol Biol Evol. 2013;30:772–80.
52. Price MN, Dehal PS, Arkin AP. FastTree 2–approximately maximum-likelihood trees for largealignments. PLoS One. 2010;5:e9490.
53. Bokulich NA, Kaehler BD, Rideout JR, Dillon M, Bolyen E, Knight R, Huttley GA, Caporaso GJ.Optimizing taxonomic classi�cation of marker-gene amplicon sequences with QIIME 2's q2-feature-classi�er plugin. Microbiome. 2018;6:90.
54. Lozupone C, Lladser ME, Knights D, Stombaugh J, Knight R. UniFrac: an effective distance metric formicrobial community comparison. ISME J. 2011;5:169–72.
55. McGinn SM, Beauchemin KA, Coates T, Colombatto D. Methane emissions from beef cattle: Effectsof monensin, sun�ower oil, enzymes, yeast, and fumaric acid. J Anim Sci. 2004;82::3346.
Page 30/34
5�. Wang M, Sun XZ, Janssen PH, Tang SX, Tan ZL. Responses of methane production and fermentationpathways to the increased dissolved hydrogen concentration generated by eight substrates in in vitroruminal cultures. Anim Feed Sci Technol. 2014;194:1–11.
57. Wang M, Wang R, Janssen PH, Zhang XM, Sun XZ, Pacheco D, Tan ZL. Sampling procedure for themeasurement of dissolved hydrogen and volatile fatty acids in the rumen of dairy cows. J Anim Sci.2016;94:1159–69.
Figures
Figure 1
Impact of methane inhibitors on the bacterial and archaeal community in rumen digesta and rumen �uidfrom cattle fed a control diet (CON, red), a control diet supplemented with canola oil (OIL, green), 3-NOP(3-NOP, blue), or a combination of 3-NOP and oil (3-NOP+OIL, orange). Principle components plots arebased on UniFrac distances and colored to show the impacts of time and treatment on microbiomecomposition. A) weighted UniFrac plot of rumen �uid samples, B) unweighted UniFrac Plot of rumen �uid,C) weighted UniFrac plot of rumen digesta, D) unweighted UniFrac plot of rumen digesta. Samples taken
Page 31/34
prior to feeding are shown as circles, samples taken 6 h after feeding are shown as squares, samplestaken 12 h after feeding are shown as triangles.
Figure 2
Impact of CH4 inhibitors on the abundance of rumen methanogens in A) Rumen Fluid and B) Rumendigesta. The mean count of ASVs assigned to genera in the phylum Euryarchaeota is shown. Treatmentsresulting in statistically signi�cant differences in the total count of ASVs classi�ed within the phylumEuryarchaeota are indicted by a unique letter in each panel.
Page 32/34
Figure 3
Enteric CH4 (A) and H2 (B) emissions, and dissolved H2 in rumen �uid for animals fed the CON, OIL, 3-NOP and 3-NOP+OIL dietary treatments over 24 h after feeding. Dissolved H2 levels were only measuredover the �rst 12 hours after feeding. Error bars indicate the SD. Asterisks (*) and different lowercaseletters indicate time points in which the main effect of treatment is signi�cant (P < 0.05), NS indicates no

Page 33/34
signi�cant difference. CON = control, OIL = canola oil, 3-NOP = 3-nitrooxypropanol, 3-NOP+OIL = 3-nitrooxypropanol and canola oil.
Figure 4
Impact of 3-NOP, OIL, and 3-NOP+OIL on the bacterial and archaeal community in rumen digesta andrumen �uid. Non-metric multidimensional scaling (NMDS) of the Bray–Curtis dissimilarity is shown tocompare the samples as a function treatment and time. Vectors having a statistically signi�cantassociation (P < 0.05) with the ordinations are included. Vector length is proportional to the degree ofcorrelation between the environmental parameter and the ordination. Vector abbreviations: H2 CO2, CH4
Page 34/34
emissions adjusted for dry matter intake. dH2: dissolved hydrogen, ISOBUTY: isobutyric acid, ISOVAL:isovaleric acid, VFA: total VFA concentration.
Supplementary Files
This is a list of supplementary �les associated with this preprint. Click to download.
SupplementaryTables.docx