Microbial Biogeography of the Arctic Cryosphere - DTU...
125
General rights Copyright and moral rights for the publications made accessible in the public portal are retained by the authors and/or other copyright owners and it is a condition of accessing publications that users recognise and abide by the legal requirements associated with these rights. Users may download and print one copy of any publication from the public portal for the purpose of private study or research. You may not further distribute the material or use it for any profit-making activity or commercial gain You may freely distribute the URL identifying the publication in the public portal If you believe that this document breaches copyright please contact us providing details, and we will remove access to the work immediately and investigate your claim. Downloaded from orbit.dtu.dk on: Mar 02, 2019 Microbial Biogeography of the Arctic Cryosphere Hauptmann, Aviaja Zenia Edna Lyberth Publication date: 2017 Document Version Publisher's PDF, also known as Version of record Link back to DTU Orbit Citation (APA): Hauptmann, A. Z. E. L. (2017). Microbial Biogeography of the Arctic Cryosphere. Technical University of Denmark (DTU).
Transcript of Microbial Biogeography of the Arctic Cryosphere - DTU...
General rights Copyright and moral rights for the publications made accessible in the public portal are retained by the authors and/or other copyright owners and it is a condition of accessing publications that users recognise and abide by the legal requirements associated with these rights.
Users may download and print one copy of any publication from the public portal for the purpose of private study or research.
You may not further distribute the material or use it for any profit-making activity or commercial gain
You may freely distribute the URL identifying the publication in the public portal If you believe that this document breaches copyright please contact us providing details, and we will remove access to the work immediately and investigate your claim.
Downloaded from orbit.dtu.dk on: Mar 02, 2019
Microbial Biogeography of the Arctic Cryosphere
Hauptmann, Aviaja Zenia Edna Lyberth
Publication date:2017
Document VersionPublisher's PDF, also known as Version of record
Link back to DTU Orbit
Citation (APA):Hauptmann, A. Z. E. L. (2017). Microbial Biogeography of the Arctic Cryosphere. Technical University ofDenmark (DTU).
" " iii"" " "
"" " "
Microbial Biogeography of the Arctic Cryosphere
Ph.D. thesis submitted 13th of January 2017 to the Ph.D. school of
Department of Bio and Health Informatics, The Technical University of Denmark
by Aviaja Lyberth Hauptmann
Academic Supervisor:
Professor Thomas Sicheritz-Pontén
Department of Bio and Health Informatics, The Technical University of Denmark
Affiliations:
Novo Nordisk Foundation Center for Biosustainability
The Technical University of Denmark
DTU Bioinformatics
Department of Bio and Health Informatics
The Technical University of Denmark
Center for Permafrost
Department of Geosciences and Natural Resource Management
The University of Copenhagen

iv"
""
" " v"" " "
"" " "
To me, it is a lovely sensation to have confirmed that even the tiniest creatures in
our land have an important place in the large living community. It is these little
creatures that in the middle of March make the ice of the Disko Bay dirty on the
underside. After a week or so, the hunters who set their yarns in the Uummannaq
Fjord find that the there has grown dirt under the ice and under the icebergs that
are frozen into the ice. In the coming days you hear, that the same has been seen
by Upernavik and finally all the way up in Thule, and by then everyone will know
that the winter is ending and spring is on its way.
H. C. Petersen, The Cunning Raven and other tales of the living in my country

vi"
""
"
" " vii"" " "
"" " "
Preface
I have had the great privilege of coming from a background in microbial ecology into a
world of bioinformatics. The overwhelming options for analysis and data to obtain for
any study initially put some insecurity in me. Through the time spent working on this
thesis and the three projects that comprise it I have gained experience with some of these
methods and data types and eventually I am learning how to make choices in
bioinformatics for microbial ecology.
In part I as an Introduction I would like to make the argument that in the world of Big
Data less can be more. Knowing what you are interested in figuring out, making
hypotheses and selecting the right kind and amount of data to assess these hypotheses
makes for clearer results. Clear results are of better use to the colleagues in our fields of
research, in this case microbial biogeography of the Arctic cryosphere.
The three studies that comprise this thesis presented in part II utilize a range of
sequencing technologies and bioinformatical tools. From an explorative study of a remote
environment, to a study that assesses a clear hypothesis and lastly to a study which
enabled the generation of novel hypotheses.
The first study explores the microbial diversity and community composition of snow on
North Pole ice floes (Paper I). In this study, I was responsible for conducting all the
bioinformatical analyses, the initial writing of the manuscript and the submission and
revision of the manuscript in the Extremophiles journal.
The second study investigates the link between glaciers and the ocean through a
freshwater network on the West coast of Greenland (Paper II). I had the pleasure of
partaking in some of the sampling. I was responsible for all of the bioinformatical
analyses as well as the statistical analyses. I wrote the initial manuscript and was
responsible for submitting and revising the manuscript through an extensive and fruitful
reviewing process in Frontiers in Microbiology.
The final study deals with microbial communities on the Greenland ice sheet. In this
study I was co-responsible for getting the samples sequenced. Besides primary quality
check of binned genomes I did all the bioinformatical analyses, as well as the statistical

viii"
""
analyses and wrote the initial manuscript. I submitted the manuscript, which is now
undergoing revision.
In part III as a conclusion on this thesis I would like to tie the methodological review and
discussion in part I to the results presented in part II.
Finally, as a perspective it is important for me as a researcher and a Greenlander to give
perspectives on how the research field of this thesis has importance not just to us as
researchers but also to the inhabitants of the Arctic.
Copenhagen, Denmark, January 2017
Aviaja Lyberth Hauptmann

" " ix"" " "
"" " "
CONTENTS
PREFACE ……………………………………………...……………………………. vii
ABSTRACT IN ENGLISH…..………………………………………………………. xi
ABSTRACT IN DANISH (Sammenfatning) …………………….…………………. xii
ABSTRACT IN KALAALLISUT (Eqikkaaneq) ....................................................... xiii
ACKNOWLEDGEMENTS ......................................................................................... xv
RESEARCH INCLUDED IN THIS THESIS ............................................................ xvii
LIST OF ABBREVIATIONS AND TERMS ........................................................... xviii
PART I
1 Introduction .............................................................................................................. 3
1.1 The Cryosphere .............................................................................................................. 4
1.2 Microbial Biogeography ................................................................................................ 4
1.3 Cryosphere Biogeography through Next-generation Sequencing ...............................,. 9
1.3.1 Is Data-intensive research less Hypothesis-driven? .............................................. 10
1.3.2 Amplicon Sequencing versus Shotgun Metagenomics ......................................... 15
1.3.3 What Next-generation Sequencing taught us about Microbial Biogeography of the
Cryosphere ............................................................................................................. 20
1.3.3.1 Biodiversity in the era of Next-generation Sequencing ................................... 20
PART II
2 Cryosphere Microbial Biogeography .................................................................... 27
2.1 Snow ............................................................................................................................ 28
PAPER I ............................................................................................................................ 28
2.2 Freshwater Networks and the Cryosphere .................................................................. 37
PAPER II ........................................................................................................................... 38
2.3 Cryoconite ................................................................................................................... 56
PAPER III ......................................................................................................................... 57
PART III
3.1 Conclusions ................................................................................................................... 83
3.2 Perspectives ................................................................................................................... 89
References .................................................................................................................. 91
Appendices ................................................................................................................101

x"
""
" " xi"" " "
"" " "
Abstract
Microbial biogeography has become a recognized field of research within the science of
microbial ecology. Technological advances such as the high throughput sequencing of
genetic information with next-generation sequencing (NGS) technologies have made us
able to “see” the diversity of microbial communities. This has considerably improved our
understanding that even harsh and seemingly barren environments such as the
cryosphere, the frozen parts of our planet, is inhabited by diverse life.
This thesis presents three studies in microbial biogeography of the Arctic
cryosphere utilizing a range of NGS approaches.
The first study of this thesis explores microbial diversity and community
composition in snow on North Pole ice floes. It was the first example of 16S rRNA gene
amplicon sequencing of North Pole snow. The results of this study showed that snow in
different sites on the North Pole can harbor different microbial communities, but these
communities are more similar to each other than they are to the surrounding ice and the
ocean. The second study confirmed the hypothesis that freshwater networks connected to
the cryosphere are inoculated with cryosphere-specific microbial communities. It showed
also, that these communities represented about a quarter of the diversity of the microbial
community in the estuary. Lastly, this study illustrates the advantages that amplicon
sequencing can have over shotgun metagenomics in certain well-defined studies. The
final study included in this thesis utilizes the full potential of shotgun metagenomics,
which enabled the binning of microbial genomes from metagenomes. Putative genomes
showed signs of adaptation to and origin from contaminated habitats. This lead to the
hypothesis that the Greenland ice sheet might be a contaminated habitat to a previously
unacknowledged degree.
The overall aim of this thesis is to illustrate the advantages that NGS has given in
the field of microbial biogeography with the Arctic cryosphere as an example. The most
important point in the following is that in order to utilize these advantages to their full
potential, we need to put emphasis on hypothesis-driven research and acknowledge the
caveats that come with NGS in microbial ecology. If we can do this, cryosphere
microbial biogeography can be of value not only to us as microbial ecology researchers
but also to researchers in other fields and finally to the inhabitants of the Arctic.
xii"
""
Sammenfatning
Mikrobiel biogeografi er blevet et anerkendt forskningsfelt indenfor mikrobiel økologi.
Teknologiske fremskridt som eksempelvis moderne høj-kapacitets metoder til
fremskaffelsen af genetisk information har gjort os i stand til at ”se” diversiteten af
mikrobielle samfund. Dette har ledt til anerkendelsen af, at selv barske og tilsyneladende
golde miljøer såsom de frosne dele af vores planet, kryosfæren, er beboet af
forskelligartet liv. Denne afhandling præsenterer tre studier indenfor mikrobiel
biogeografi i den Arktiske kryosfære. Studierne benytter et spektrum af moderne metoder
til fremskaffelse af genetiske informationer. Det første studie udforsker den mikrobielle
diversitet og sammensætning i sne fra Nordpolen. Dette studie var det første eksempel på
benyttelsen af metoden amplicon-sekventering af genet for 16S rRNA i Nordpol sne.
Resultaterne fra studiet viste, at sne fra forskellige steder på Nordpolen har forskellige
mikrobielle samfund. Samtidig viste studiet, at disse samfund ligner hinanden mere end
de ligner de mikrobielle samfund i de underliggende miljøer af is og hav. Det andet studie
i denne afhandling bekræfter hypotesen, at en elv, der er i forbindelse med kryosfæren,
får tilført mikrobielle samfund, som kommer fra de frosne omgivelser. Studiet viste også,
at disse mikrobielle samfund fra elven udgør op mod en fjerdedel af det mikrobielle
samfund i fjorden udfor elvens udløb. Endelig illustrerede dette studie, at metoden
amplicon-sekventering kan have fordele i forhold til metoden shotgun metagenomics i
specifikke vel-definerede studier. Det sidste studie i denne afhandling benytter det fulde
potentiale, som metoden shotgun metagenomics har. Brugen af denne data-intensive
metode gjorde det muligt at isolere mikrobielle genomer fra metagenomer. Dette
resulterede i konklusionen, at indlandsisen på Grønland er et forurenet miljø i forhold til
det mikrobielle samfund i en hidtil ukendt grad.
Det overordnede formål med denne afhandling er at illustrere fordele ved brugen af
moderne metoder til opnåelsen af genetiske informationer indenfor forskningsfeltet
mikrobiel biogeografi med Arktisk mikrobiologi som eksempel. Den vigtigste pointe i det
følgende er, at for at kunne udnytte disse fordele må vi lægge fokus på hypotese-drevet
forskning og anerkende de forbehold man må have, når man benytter disse metoder til
mikrobiel økologi. Hvis vi er i stand til det, så vil mikrobiel biogeografi kunne have
værdi ikke bare for os som forskere men også for befolkningen i Arktis.
" " xiii"" " "
"" " "
Eqikkaaneq
Bakterissat sumiittarneri massakkut ilisimatusuunut soqutiginarsinikuuvoq. Teknologiit
nutaat atorlugit sorlu annertusuumik aamma sukkassumik DNA-minngaaniik
paasissutissat angusinnaangornikuullugit takusinnaangulerparput qanoq bakterissat
assigiinngitsigisut. Taamatut paasivarput avatangiisiup qerisortai toqusimarpasittigalutik
aamma uumasoqartartut assigiinngitsunik.
Una ilisimatuutut allaatigisaq ilisimasassarsiornerit pingasut saqqummerpai tamaasa
nunat issittut avannaarliiniit. Ilisimasassiaq siulleq mississorpaa bakterissat suut
nordpoliup aputaaniittut. Taanna ilisimasassiaavoq siullerpaaq teknologii amplicon
sekventering atornikuusaa nordpoliup aputaanut. Taassumingaanniik inernerit takutippaat
aput assigiinngitsumeertut bakterissat assigiinngitsut. Kisianni aamma takutippaa
bakterissat apummiittut assigiinngitsumingaaneersut imminnut assiginnerusut siku-
minngaaniik aamma imarminngaaniik. Ilisimasassiaq aappaa takutippaa Qeqertarsuarmi
Kuussuup imaaniittut bakterissat sermerminngaaneertut. Imarmi Kuussuup ataani
bakterissat sisamararterutaat kuumminngaaneerput. Taanna ilisimasassiaq aamma
takutippaa teknologii amplicon sekventering ilaannikkut pitsaanerusinnaasoq teknologiit
nutaanerningaanniik. Ilisimasassiaq kingulleq atorpaa teknologiit nutaanerpaat DNA-
mingaaniik ilisimasat anguniarneraanni. Teknologiit nutaanerpaat atorlugit bakterissat
genomii immikkortinneqarsinnaanngorput. Taamatut paasivarput Kalaallit Nunaanni
sermersuaq bakterissaanut mingutsitsisoq. Imaassinnavoq siunissami bakterissat atorlugit
paasilluarsinnaangussagipput pinngortitaq sumi mingutsinneqarnikuusoq taavalu taanna
nalunngisaq atorlugu Kalaallit Nunanni uumasut inuillu nerisassai mingutsinneqarnissai
pinaveersaarsinnaagipput.
Una ilisimatuutut allaatigisami anguniagaq pinngaarnerpaavoq takutillugu qanoq
teknologiit nutaat DNA-minngaaniik ilisimasat angunissaanut pitsaasumik
atorneqarsinnaasut paasiniaraanni bakterissat suut sumiittartut nunat issittut
avannaarliinni. Taavalu aamma pikkunarpoq takutillugu teknologiit nutaat atussagaanni
isummiussaagallartut paaseqqaartarlugit ilisimatuutut misissuissasugut. Iluamik suut
paaseerusunnerlugit nalunngikkutsigut taava teknologiit nutaat atorluarlugit bakterissat
sumiittarneri inunnut tamanut atorneqarsinnangorsinnaavoq.

xiv"
""
" " xv"" " "
"" " "
Acknowledgements
First and foremost I want to thank my initial supervisor Nikolaj Blom for having the
courage to hire me for this Ph.D. project. Your courage creates opportunities all around
you and for me it created a unique chance to change my setting from my training in
microbial ecology to a world of bioinformatics. Because of that I was able to learn more
in these past years than I could have ever hoped for. Second to Nikolaj but primary as a
role of a supervisor I want to thank Jacob Bælum. Thank you Jacob for your time, your
patience, your great advice and for knowing to teach me things in all fields of science
whether that be how to log in to the CBS servers or how to review a paper and write a
grant application. I could not have asked for a better supervisor. When my dream-team of
supervisors decided to leave the Technical University of Denmark I was fortunate that
professor Thomas Sicheritz-Pontén was willing to take on my project. Thomas, you were
able to fill in for Nikolaj and Jacob and enable me to continue my project as efficiently as
before. I am very grateful for the effort you have put into the project despite the
circumstances and I have been very pleased with our synergy as a supervisor-student
team.
I want to thank all current and previous members of the Metagenomics group,
particularly TNP, Simon, Josef, Damian, Bjørn, Henrik, Ida, Asli, Agnieszka, Bent and
Kosai. You have all been amazing colleagues and given me help many many many times.
You are all greatly appreciated.
Also thank you to all of DTU Bioinformatics and especially Peter Wad Sackett, who
taught me the one skill that I appreciate the highest among the ones acquired at DTU,
namely Perl. Thank you also to Dorthe Kjærsgaard, the Computerome team, Marlene
Dalgaard and to John Damm Sørensen, for his ability to be so skilled and at the same
time able to kindly and thoughtfully help someone who was far from that level of skill
and who probably asked too many stupid questions.
While wonderful colleagues, lots of help and great lessons were gained from DTU
Bioinformatics my project would not have existed was it not for the Center for
Permafrost (CENPERM) at the University of Copenhagen and particularly Professor
Carsten Suhr Jacobsen and Marek Stibal. Carsten, I cannot thank you enough for all the
opportunities that you have given me, which eventually resulted in this thesis. I am very
xvi"
""
grateful for all the things that you have included me in and I will do my best to live up to
the responsibilities that come with these amazing opportunities. Marek, thank you for all
the time you have put into our collaborative work, for your honest advice, for your
friendship and for everything that you have taught me about microbial ecology and about
writing a scientific paper. I have been very lucky to have the opportunity to learn from
you. A great thanks to Bo Elberling for allowing me to become an integrated part of the
fantastic group at CENPERM. Thank you Karen Bjerre for making me feel at home at
CENPERM and to everyone else at CENPERM, you truly are fantastic colleagues and I
have valued my space at CENPERM very highly.
The most exciting time of the project was enabled by Professor Janet Jansson. Thank you
Janet for welcoming me first to the Lawrence Berkeley National Laboratory and then to
the Pacific Northwest National Laboratory and for giving me the opportunity to work
with your group and the exciting data that you create. I have gained invaluable
experience from working with permafrost data and I have enjoyed every minute of my
time with you at PNNL. Thank you also to Lee Ann McCue and Neslihan Tas Baas for
supervising me during my external stay in the USA. Thank you Monica Moffett for your
helpfulness, kindness, your friendship and for showing me some fantastic American
culture. In this context I also want to thank the funding, which enabled this thesis and the
travels. Thanks in particular to the Novo Nordisk Center for Biosustainability. Thanks
also to Otto Mønsted Fonden, to the Oticon Foundation, to Dudo and Povl Brandt’s
Foundation, to the Niels Bohr Foundation, to Jordbrugsakademikerne, to Lektor Bent
Lantows Mindelegat and to Jens Peter Jensens Mindelegat.
Finally, and very importantly, thank you Nils for being a fantastic partner and the most
amazing father any mother could wish for her son. You have made it possible for me to
dedicate myself to this thesis.

" " xvii"" " "
"" " "
Research included in this thesis
Paper I: Bacterial diversity in snow on North Pole ice floes
Hauptmann, Aviaja L.; Stibal, Marek; Bælum, Jacob; Sicheritz-Pontén, Thomas;
Brunak, Søren; Bowman, Jeff S.; Hansen, Lars H.; Jacobsen, Carsten S.; and Blom,
Nikolaj (2014). Bacterial diversity in snow on North Pole ice floes.
Extremophiles 18(6): 945-951 doi: 10.1007/s00792-014-0660-y
Paper II: Upstream Freshwater and Terrestrial Sources Are Differentially Reflected in the
Bacterial Community Structure along a Small Arctic River and Its Estuary
Hauptmann, Aviaja L.; Markussen, Thor N.; Stibal, Marek; Olsen, Nikoline S.;
Elberling, Bo; Bælum, Jacob; Sicheritz-Pontén, Thomas; and Jacobsen, Carsten S. (2016)
Upstream Freshwater and Terrestrial Sources Are Differentially Reflected in the Bacterial
Community Structure along a Small Arctic River and Its Estuary.
Front. Microbiol. 7:1474 doi: 10.3389/fmicb.2016.01474
Paper III: Contamination of the Arctic reflected in microbial metagenomes from the
Greenland ice sheet
Hauptmann, Aviaja L.; Sicheritz-Pontén, Thomas; Cameron, Karen A.; Bælum, Jacob;
Plichta, Damian R.; Dalgaard, Marlene; and Stibal, Marek (2017). Contamination of the
Arctic reflected in microbial metagenomes from the Greenland ice sheet.
Submitted
xviii"
""
List of Abbreviations
"16S rRNA 16S ribosomal RNA. S is the unit Svedberg for
sedimentation rate describing particle size
ATP Adenosine tri phosphate
dNTP Dideoxy nucleoside tri phosphate
EPS Extracellular polymeric substance
NGS Next-generation sequencing
OTU Operational taxonomic unit
PE Paired-end
PCR Polymerase chain reaction
WRT Water residence time
List of Terms
Ablation Snow or ice removal from a glacier or iceberg due to
melting or evaporation
Allochthonous Originating from outside of the present position
Amplicon A nucleotide string resulting from amplification of a
specific nucleotide target
Annotation The assignment of a gene name and/or function to a
nucleotide strand
Autochthonous Indigenous to the present position
Binning Clustering, in this case of genomic elements from the same
genome
Bioinformatics Computational methodology for handling and analyzing
biological information, in this thesis DNA information
Contig Short for contiguous, a set of overlapping DNA segments
that make up a consensus DNA region
Cosmopolitan World citizen, Globally distributed

" " xix"" " "
"" " "
Cryoconite Microbe-mineral aggregates on ice surfaces
Cryosphere The parts of Earth composed of frozen water
Endemic Restricted to a certain location
Homotherm With a constant temperature
in situ On site, studies performed in the natural setting
omics Suffix of data-intensive research fields such as
metagenomics, i.e. data intensive genomics including all
organisms of a given environment
Shotgun metagenomics High-throughput sequencing of genetic information
utilizing universal primers with no specific target
Supraglacial At the surface of a glacier

xx"
""

" " 1"
Part I

"
"2"
" " "" " "
"" " " 3"
1 Introduction
Polar research in its earliest form was only available to the bravest. The brave, who
wanted to make their name in the world through proving themselves capable of surviving
some of the harshest environments on the planet. Today polar research covers the broader
Arctic including not only the harsh polar environments such as the cryosphere but also
the impact of these environments on their inhabitants and their surroundings. It has
become a field of research with relevance to the common public and in particular those
that inhabit the Arctic.
Microbial ecology plays a central role in modern Arctic research as microbial
ecosystems and dynamics are determinants in the exchange of nutrients and gases and
therefore comprise a key element of climate change - the centerpiece of today's Arctic
research.
Our understanding of microbial ecology has undergone dramatic expansion in the
current wave of next-generation sequencing (NGS) of genetic information. This is owed
to the development of stronger computational tools as well as efficient and low-cost
nucleotide sequencing. The large amounts of nucleotide data available from NGS have
enabled the exploration of extreme environments and the development of novel
hypotheses on microbial ecology and biogeography.
This thesis encompasses research in the field of microbial ecology and more specifically
cryosphere microbial biogeography using bioinformatical methodology.
The following sections comprise a very short introduction to the cryosphere and to
microbial biogeography followed by a critical review of the use of bioinformatics and
NGS technologies in microbial ecology with biogeography of the cryosphere as an
example. Technologies and methods relevant to this thesis will be highlighted in method-
boxes throughout part I.
"
"4"
1.1 The Cryosphere
The cryosphere, from Latin kryos, ice, and sphaera, globe, is the part of our planet
consisting of frozen water. As cold and inhospitable as it may seem it is the home of
microbes, fungi, birds, mammals and people. The cryosphere covers a remarkable 11% of
Earth’s surface (Benn and Evans 2010).
The cryosphere was once believed to be only a depository of microbes not able to sustain
its own ecosystem (Lutz et al. 2016; Boetius et al. 2015). Through the advancement of
molecular techniques the cryosphere has now been fully recognized as a biome (Boetius
et al. 2015; Anesio and Laybourn-Parry 2012).
1.2 Microbial Biogeography
Modern microbial biogeography is a synthesis of the tradition-bound scientific discipline
of ecology and the newly developed field of bioinformatics, which has become a field of
research in its own right.
Biogeographers deal with the distribution of the diversity of organisms over time and
space (Ramette and Tiedje 2007; Martiny et al. 2006). While biogeography of
macroorganisms has been a well-established discipline for centuries, it was not
recognized until recently that microorganisms also show biogeographic patterns (Ramette
and Tiedje 2007; Martiny et al. 2006; Staley and Gosink 1999). At a time when
microorganisms were characterized by culturing there was a general belief that this
domain of life was not as diverse as macroorganisms (Martiny et al. 2006; Staley and
Gosink 1999). An early study that utilized nucleotide composition for describing
microbial diversity in an environmental sample was performed by Vigdis Torsvik and
colleagues published in 1990 (Torsvik, Goksyr, and Daae 1990). Based on thermal
denaturation and reassociation of DNA measured with spectrophotometry the results of
this study suggested that a gram of soil contain more than 4000 species (Torsvik, Goksyr,
and Daae 1990). The study argued that soil is so diverse that the biodiversity can only be
approximated with difficulty and that most of the diversity in soil cannot be cultured
(Torsvik, Goksyr, and Daae 1990). One particular development in microbiology changed
the paradigm of bacterial diversity. Carl Woese and colleagues pioneered the use of
" " "" " "
"" " " 5"
genetic signatures in assessing phylogeny and taxonomy of microorganisms (Woese
1987). This made it possible to compare prokaryotes at a much greater resolution than
previously. Since then nucleotide-based methods and particularly the 16S rRNA gene
have been widely used in microbial biogeography for estimating diversity (Nemergut et
al. 2013; Ramette and Tiedje 2007; Staley and Gosink 1999). Today it is acknowledged
that “microbial diversity is beyond practical calculation” (Wilson 1999; Fierer and
Lennon 2011).
In microbial biogeography there is one seminal hypothesis that dominates. The Baas-
Becking hypothesis proposed by Lourens G. M. Baas-Becking in 1934 states that
Everything is everywhere, but the environment selects (Baas-Becking 1934). This idea
still dominates hypotheses in microbial biogeography and has yet to be finally accepted
or rejected (Fierer and Lennon 2011; Martiny et al. 2006; Staley and Gosink 1999).
The Baas-Becking hypothesis suggests that microbes are cosmopolitans, that are globally
distributed, and local differences can be owed to selection in a specific habitat (Staley
and Gosink 1999).
Proving or disproving the Baas-Becking hypothesis has shown to be a difficult task
(Ramette and Tiedje 2007; Martiny et al. 2006; Staley and Gosink 1999). One of the
major reasons for this is the dynamic and promiscuous character of microbial genomes,
which results in genetic changes over relatively short periods of time (Martiny et al.
2006; Staley and Gosink 1999). A second reason is the difficulty in agreeing on a
definition of a microbial species (Martiny et al. 2006; Staley and Gosink 1999). Based on
16S rRNA gene sequences, or parts thereof, a number of studies have concluded in
support of the Baas-Becking Hypothesis (Lutz et al. 2016; Abell and Bowman 2005; Cho
and Tiedje 2000; Oda et al. 2003). Other methods that assess diversity at a higher
resolution such as rep-PCR fingerprinting have revealed unique genotypes isolated to
specific niches in support of endemic organisms (Cho and Tiedje 2000). Specifically, it
has been shown that a set of nine genes is required in order to reach a resolution that
indicates endemic clades (Whitaker, Grogan, and Taylor 2003).
"
"6"
Trying to discern whether the Baas-Becking hypothesis holds for all prokaryotes might
not even be possible. For one thing, to prove that a microorganism is absent from a
habitat is nearly impossible (Martiny et al. 2006; Staley and Gosink 1999). Furthermore,
different microbes may very well have different dispersal patterns, such as suggested for
spore-forming bacteria, that may more easily survive long-distance transportation (Staley
and Gosink 1999).
The cryosphere has been proposed as the ideal habitat for the studying of microbial
biogeography (Staley and Gosink 1999). The clear bi-polar distribution of cold habitats
on Earth makes a good case for studying microbial distribution (Margesin and Miteva
2011). Despite the potential of cold habitats as model habitats for the studying of
microbial biogeography, these habitats have not given any final answers on cosmopolitan
versus endemic distribution of microorganisms (Margesin and Miteva 2011).
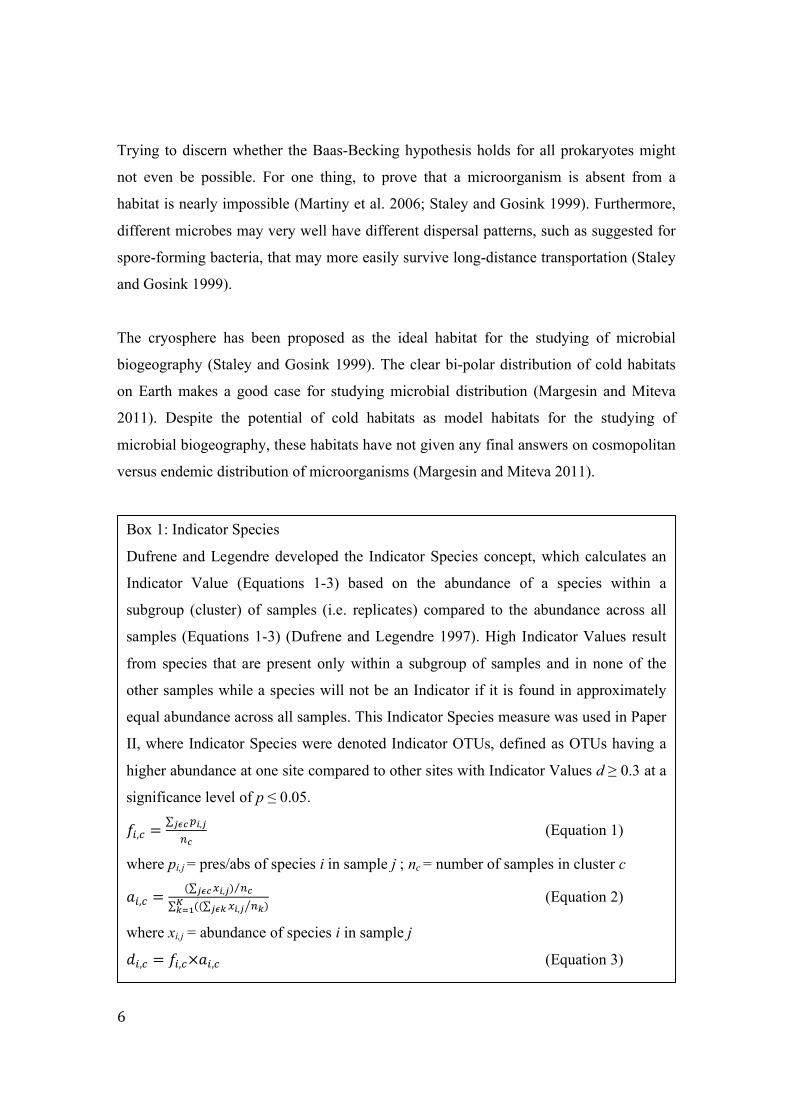
Box 1: Indicator Species
Dufrene and Legendre developed the Indicator Species concept, which calculates an
Indicator Value (Equations 1-3) based on the abundance of a species within a
subgroup (cluster) of samples (i.e. replicates) compared to the abundance across all
samples (Equations 1-3) (Dufrene and Legendre 1997). High Indicator Values result
from species that are present only within a subgroup of samples and in none of the
other samples while a species will not be an Indicator if it is found in approximately
equal abundance across all samples. This Indicator Species measure was used in Paper
II, where Indicator Species were denoted Indicator OTUs, defined as OTUs having a
higher abundance at one site compared to other sites with Indicator Values d ≥ 0.3 at a
significance level of p ≤ 0.05.
!!,! =∑ !!,!!"#!!
(Equation 1)
where pi,j = pres/abs of species i in sample j ; nc = number of samples in cluster c
!!,! =(∑ !!,!!"# ) !!⁄
∑ ((∑ !!,!!"#!!!! !!! ) (Equation 2)
where xi,j = abundance of species i in sample j
!!,! = !!,!×!!,! (Equation 3)!

" " "" " "
"" " " 7"
Trying to describe a general pattern that holds true for all microbes seems a formidable
task at a point where we have acknowledged the incredible diversity of the microbial
world and technologies have developed that enable us to study the diversity at a high
resolution. Studying the biogeography of a defined group of organisms in a defined
ecosystem type and with regard to a defined hypothesis seems a better use of an
investigators time rather than trying again to reject or confirm the Baas-Becking
hypothesis on a general level (Ramette and Tiedje 2007). Identifying the scale of
underlying biogeographic principles and identification of indicator taxa has been
suggested for future research (Ramette and Tiedje 2007) (Box 1: Indicator Species).
Additionally, it has been suggested that future biogeography research should sample
systematically to better distinguish between contemporary and historical factors (Martiny
et al. 2006). As stated therein:
“If they do not, the field of microbial biogeography will probably become
mired in phenomenological description, instead of tackling the mechanisms
that generate the patterns.” (Martiny et al. 2006)

"
"8"
Box 2: Genomes from Metagenomes
A missing piece in metagenomics has long been the linking of taxonomy and function.
Within recent years a variety of tools have been developed for clustering or binning
contigs or genes from a metagenomic sample into genomes, which represent
organisms from the sample. In this way, also genomes of uncultured organisms may
be obtained. Different strategies have been used to detect DNA fragments that belong
to the same genome. Some methods use either marker genes or signature oligos that
utilize the notion that each organism has a certain signature in its nucleotide
composition (Kang et al. 2015; Laczny et al. 2015; Y. Wu et al. 2014; Alneberg et al.
2014; Sunagawa et al. 2013; Dick et al. 2009). Other methods are based on underlying
statistics in the distribution of reads sequenced at different depth (Albertsen et al.
2013; Nielsen et al. 2014). The Metagenomic-species (MGS) method used for Paper
III is such a tool based on the logic that DNA fragments from a single entity will be
sequenced to the same depth (Nielsen et al. 2014). Across many samples, the entities,
which are always present to the same depth across all the samples will belong to the
same entity, whether this be a genome, a plasmid, a virus or other DNA entities.
" " "" " "
"" " " 9"
1.3 Cryosphere Biogeography through Next-generation Sequencing
Next-generation sequencing (NGS) technologies have been defining in the transition
from the paradigm of the uninhabitable cryosphere to the now acknowledged paradigm of
the cryosphere as one of Earth’s biomes (Boetius et al. 2015; Anesio and Laybourn-Parry
2012). Just as it has been seminal for our acknowledgement of the incredible diversity of
the prokaryotic domains of Life and the development of the field of microbial
biogeography (Ramette and Tiedje 2007; Staley and Gosink 1999). NGS has made it
possible for us to “see" the diversity and functions of life in the microbially dominated
cryosphere, which was not visible to us before.
As illustrated by the difficulty in discerning the validity of the long proposed
Baas-Becking hypothesis in microbial biogeography, the large amounts of data made
available with NGS technologies also poses some challenges. This has lead to ongoing
debates about the integrity of old-fashioned research with new methods such as the
debate of data-driven versus hypothesis-driven research in microbial ecology (Jansson
and Prosser 2013).
There has been a natural development in the type of research deemed to be
interesting based upon the novelty of the method in use. In the beginning of
genome sequencing the publication of a microbial genome, however descriptive, was a
sensation on its own. Today, sequenced genomes are not published as peer reviewed
papers (Hauptmann et al. 2013). The same development has been seen for metagenomic
sequencing where 16S rRNA gene amplicon sequencing studies of descriptive character
had an interest in the early examples of using this technique, but today both in shotgun
and amplicon metagenomic studies there is a requirement for studying some question of
interest rather than announcing the first use of the method in a certain environment.
Lately, the novelty of shotgun metagenomics has been the possibility to link taxonomy
and function of uncultured organisms through computational binning of genomes from
metagenomes (Box 2: Genomes from Metagenomes).
In the following sections three themes will be reviewed with relation to the use of NGS
technologies in microbial biogeography of the cryosphere. First, the discussion of data-
driven versus hypothesis-driven research will be quantitatively assessed. Next, the less

"
"10"
data-intensive amplicon metagenomic sequencing and the more data-intensive shotgun
metagenomic sequencing technologies will be compared and discussed. Finally, the
impact of the usage of NGS technology in microbial ecology on measures of biodiversity,
the key measure of microbial biogeography, will be presented and discussed before part
II of this thesis.
1.3.1 Is Data-intensive research less Hypothesis-driven?
There are two dominant and opposing opinions on the use of NGS technologies in
microbial ecology. One opinion is that NGS and the data intensive omics are at an
opposite of hypothesis-driven research and leads to “an overemphasis on descriptive
approaches” and that “It is easier to describe and compare data than to construct and
test hypotheses.” (Jansson and Prosser 2013). Another opinion is that omics and
hypothesis-driven research go hand in hand and that “The data will themselves be
hypothesis-generating.” (Jansson and Prosser 2013; Schloss 2008).
To quantitatively test these statements the combined research articles within the fields of
research in part II of this thesis (n=49) were assessed for selected words that relate to
either ecology (hypothesis-focused) or technology (data-focused) (List of words
Appendix 1). We might see less use of hypothesis-focused words when we are
overwhelmed by technological advances, which then take the place of the theoretically
and ecologically important content.
Through text-processing scripts written in Perl language the list of words were counted in
each of the papers and within each year (Perl script Appendix 2). Within the two
categories the counts of the words were summed for each year and divided by the number
of total research articles included for that year (Figure 1). A similar calculation was made
including only words related to the term “hypothesis” (Figure 2).
" " "" " "
"" " " 11"
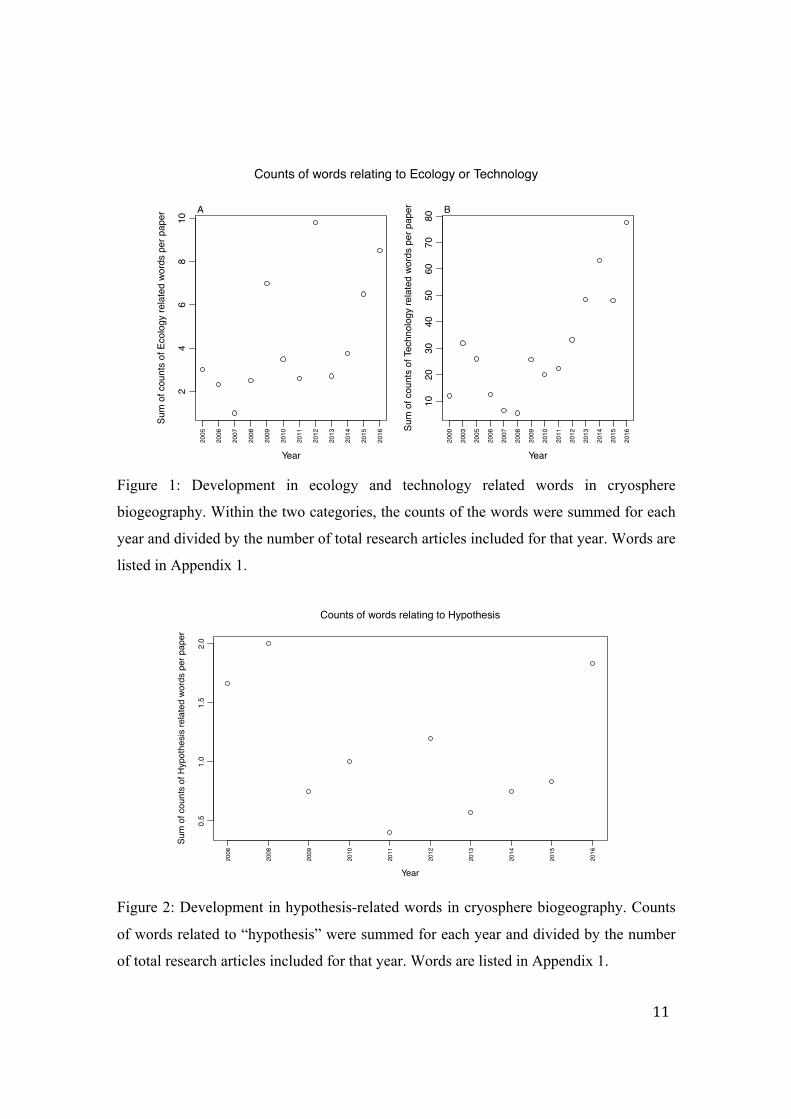
Figure 1: Development in ecology and technology related words in cryosphere
biogeography. Within the two categories, the counts of the words were summed for each
year and divided by the number of total research articles included for that year. Words are
listed in Appendix 1.
Figure 2: Development in hypothesis-related words in cryosphere biogeography. Counts
of words related to “hypothesis” were summed for each year and divided by the number
of total research articles included for that year. Words are listed in Appendix 1.
24
68
10
Year
Sum
of c
ount
s of
Eco
logy
rela
ted
word
s pe
r pap
er
2005
2006
2007
2008
2009
2010
2011
2012
2013
2014
2015
2016
A
1020
3040
5060
7080
Year
Sum
of c
ount
s of
Tec
hnol
ogy
rela
ted
word
s pe
r pap
er
2000
2003
2005
2006
2007
2008
2009
2010
2011
2012
2013
2014
2015
2016
B
Counts of words relating to Ecology or Technology
0.5
1.0
1.5
2.0
Counts of words relating to Hypothesis
Year
Sum
of c
ount
s of
Hyp
othe
sis
rela
ted
word
s pe
r pap
er
2006
2008
2009
2010
2011
2012
2013
2014
2015
2016
"
"12"
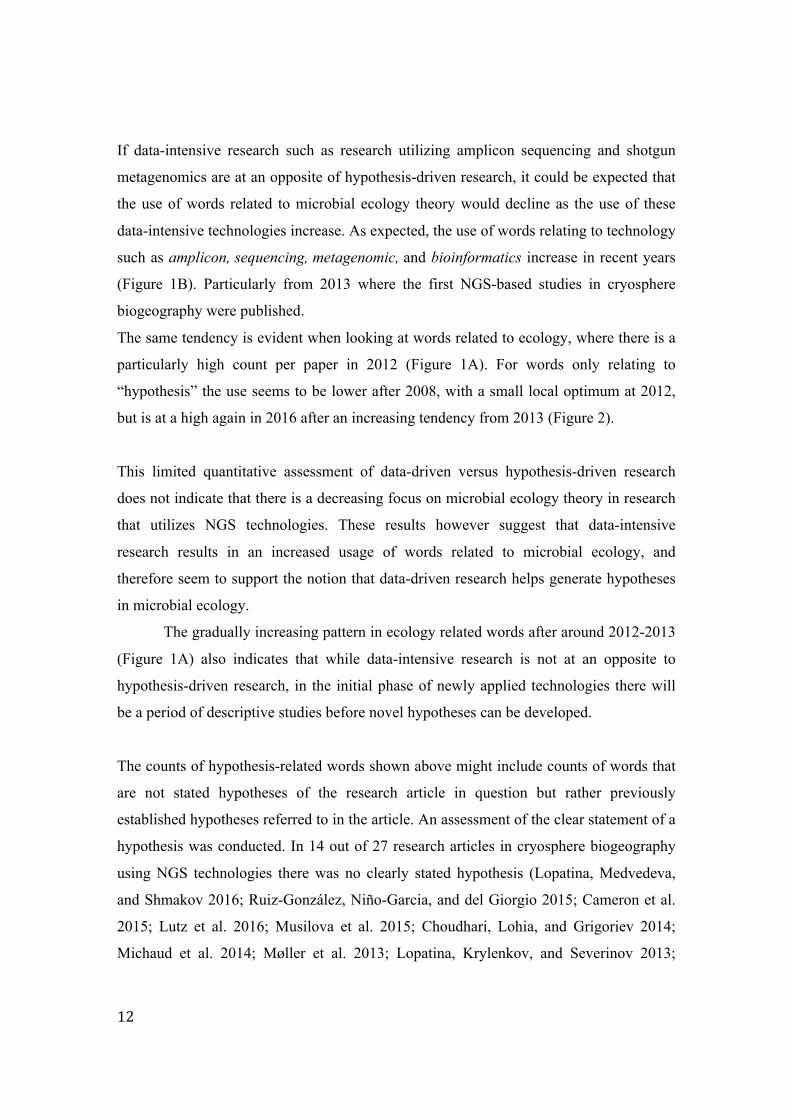
If data-intensive research such as research utilizing amplicon sequencing and shotgun
metagenomics are at an opposite of hypothesis-driven research, it could be expected that
the use of words related to microbial ecology theory would decline as the use of these
data-intensive technologies increase. As expected, the use of words relating to technology
such as amplicon, sequencing, metagenomic, and bioinformatics increase in recent years
(Figure 1B). Particularly from 2013 where the first NGS-based studies in cryosphere
biogeography were published.
The same tendency is evident when looking at words related to ecology, where there is a
particularly high count per paper in 2012 (Figure 1A). For words only relating to
“hypothesis” the use seems to be lower after 2008, with a small local optimum at 2012,
but is at a high again in 2016 after an increasing tendency from 2013 (Figure 2).
This limited quantitative assessment of data-driven versus hypothesis-driven research
does not indicate that there is a decreasing focus on microbial ecology theory in research
that utilizes NGS technologies. These results however suggest that data-intensive
research results in an increased usage of words related to microbial ecology, and
therefore seem to support the notion that data-driven research helps generate hypotheses
in microbial ecology.
The gradually increasing pattern in ecology related words after around 2012-2013
(Figure 1A) also indicates that while data-intensive research is not at an opposite to
hypothesis-driven research, in the initial phase of newly applied technologies there will
be a period of descriptive studies before novel hypotheses can be developed.
The counts of hypothesis-related words shown above might include counts of words that
are not stated hypotheses of the research article in question but rather previously
established hypotheses referred to in the article. An assessment of the clear statement of a
hypothesis was conducted. In 14 out of 27 research articles in cryosphere biogeography
using NGS technologies there was no clearly stated hypothesis (Lopatina, Medvedeva,
and Shmakov 2016; Ruiz-González, Niño-Garcia, and del Giorgio 2015; Cameron et al.
2015; Lutz et al. 2016; Musilova et al. 2015; Choudhari, Lohia, and Grigoriev 2014;
Michaud et al. 2014; Møller et al. 2013; Lopatina, Krylenkov, and Severinov 2013;
" " "" " "
"" " " 13"
Larose et al. 2013; Liu et al. 2011; Edwards et al. 2013; Edwards et al. 2014; Larose,
Dommergue, and Vogel 2013), in 11 articles the hypothesis of the paper was clearly
stated up-front (Gokul et al. 2016; Franzetti et al. 2016; Cameron et al. 2016; Niño-
García, Ruiz-González, and del Giorgio 2016; Peter and Sommaruga 2016; Stibal et al.
2015; Maccario, Vogel, and Larose 2014; Hell et al. 2013; Fortunato et al. 2013;
Fortunato et al. 2012; Larouche et al. 2012) while in two articles the hypothesis was
vaguely indicated as either an “idea” (Crump, Amaral-Zettler, and Kling 2012) or later in
the discussion section of the article (Hisakawa et al. 2015).
It is not new to scientific method that one needs to observe and describe prior to stating a
hypothesis (Popper 1935). What might seem problematic in the era of NGS in microbial
ecology is that one might generate or alter ones hypothesis after designing and
conducting ones study, which does not comply with traditional scientific practice. In an
enormous amount of data there will most likely be something that pops out as significant
that one might then state a hypothesis about. Moreover, it becomes increasingly difficult
to falsify research results with increasing amounts of data. The worry about data-driven
research might also be, that we are at risk of being able to justify unclear and hard-to-test
results that do not necessarily advance our understanding of microbial ecology.
Advancing our understanding of microbial ecology and biogeography at this point in
time, does not only require greater amounts of data. Maybe more importantly it requires
the right type of sampling, hence the concept of Think before you sequence (Jansson and
Prosser 2013). A lot of data from the wrong samples does not advance our understanding
of cryosphere biogeography.
Indeed, when looking into the literature of microbial biogeography of the
cryosphere, conclusions commonly refer to the need for additional sampling over spatial
and temporal ranges (Maccario, Vogel, and Larose 2014; Crump, Amaral-Zettler, and
Kling 2012; Fortunato et al. 2013; Ruiz-González, Niño-Garcia, and del Giorgio 2015;
Niño-García, Ruiz-González, and del Giorgio 2016; Cameron et al. 2016; Edwards et al.
2013) while studies have not been found to include sequencing depth as part of the future
needs of cryosphere microbial biogeography.
"
"14"
Box 3: The 454 Pyrosequencing Platform
Pyrosequencing with the 454 Life Sciences GS FLX platform was used for amplicon
sequencing of 16S rRNA genes from snow on North Pole ice floes as described in
Paper I. Pyrosequencing employs the sequencing-by-synthesis principle, which allows
the detection of the incorporated nucleotide during DNA synthesis (Ronaghi, Uhlén,
and Nyrén 1998). In short, the 454 platform reads light emission from a PicoTiterPlate
device consisting of wells that contain one bead each, which under optimal conditions
is coated with one clone of a DNA fragment. The clonal DNA fragments on the beads
are synthesized by adding one type of dNTP at a time, which in turn releases
pyrophosphate. The pyrophosphate is then converted to ATP by ATP sulfurases and
lastly the ATP is used to activate the process of converting luciferin to oxyluciferin
under the emission of light. In this way light is emitted only if the added type of dNTP
is incorporated, which allows the base calling. If a clone contains more than one of the
added nucleotide the incorporation of the nucleotides will result in the emission of
light proportional to the number of nucleotides incorporated. This specific feature of
the pyrosequencing platform results in a higher error rate in DNA regions of
homopolymer sequences as the proportionality gets decreasingly accurate as the length
of the homopolymer increases (Ronaghi, Uhlén, and Nyrén 1998). 454
Pyrosequencing can yield reads with length up to 500 bases.

" " "" " "
"" " " 15"
1.3.2 Amplicon Sequencing versus Shotgun Metagenomics
There seems to be a general belief that shotgun metagenomics is an advancement over the
first established amplicon sequencing. This can be seen for one thing in the declining use
of the 454 pyrosequencing platform, which generates longer reads appropriate for
amplicons, replaced by the Illumina platforms (Heather and Chain 2016) (Box 3 and 4:
NGS Platforms).
Box 4: The Illumina Platform
Illumina MiSeq 250bp paired-end sequencing was used for amplicon sequencing of
16S rRNA genes from the Red River freshwater network and its estuary as described
in Paper II and Illumina HiSeq 100bp paired-end sequencing was used for shotgun
sequencing of cryoconite shotgun metagenomes as described in Paper III.
The Illumina platform employs sequencing-by-synthesis but differs from 454
pyrosequencing in that all four nucleotides are added at once and the detection of the
nucleotide incorporated is done through the detection of the different colors emitted
when the differentially fluorescently labeled nucleotides are excited by a light source
(Heather and Chain 2016). In summary, a flow cell is coated with clonal clusters of a
DNA fragment as a result of bridge amplification of singular DNA fragments on the
flow cell. Fluorescently labeled dNTPs are added and the complementary dNTP to the
DNA strand is incorporated. Only one dNTP can be incorporated at each cycle. After
each step the clusters are excited with a light source resulting in a fluorescent signal
corresponding to the nucleotide incorporated. This procedure is first done with one
strand of the DNA fragments but may be complemented by also sequencing the
reverse strand afterwards resulting in paired-end (PE) data. The MiSeq platform can
yield reads with length up to 300 bases, while HiSeq has a limit of 150 bases.

"
"16"
There are a number of obvious limitations to the most common usage of amplicon
sequencing in microbial biogeography, which is the sequencing of the 16S rRNA gene.
First and foremost the 16S rRNA gene does not allow the interpretation of the functional
capabilities of the microbial community (Nemergut et al. 2013; Staley and Gosink 1999).
Furthermore, 16S rRNA genes are often sequenced only in part comprising one to three
variable regions and therefore do not allow the detection of taxonomy at species level
(Staley and Gosink 1999). Commonly, we also assume that one 16S rRNA gene
amplicon equals one organism, while one organism may in fact have several 16S rRNA
genes in its genome (Nemergut et al. 2013). This could potentially lead to an over-
estimation of diversity, which is also a bias introduced at several other steps of the
amplicon sequencing and analysis process (Fierer and Lennon 2011) (More details in
section on Biodiversity in the era of Next-Generation Sequencing and Box 5: Alpha
Diversity).
What 16S rRNA gene amplicon sequencing is ideal for is the assessment of
biodiversity, a principal measure in microbial ecology (Box 5: Alpha Diversity).
Diversity measures have the advantage that they can be compared between studies and
between habitats.
At this point in time shotgun metagenomics does not give a direct measure of diversity,
as we have not yet been able to sequence samples exhaustively (Nemergut et al. 2013;
Fierer and Lennon 2011; Staley and Gosink 1999). Any functional gene is not per se
suitable for assigning taxonomy both due to the potential for horizontal gene transfer but
also due to our lack of knowledge of the functions of specific gene sequences in the
environment resulting in very limited base of knowledge to compare to. Another reason is
that despite a very high level of sequencing efforts, targeting all genes in a pool of
organisms will increase the level of undersampling, so that rare species will be even
harder to detect (Nemergut et al. 2013).
As long as undersampling is an unresolved issue, a targeted approach to estimating
diversity will most likely give more accurate results. At this point databases of 16S rRNA
genes and curation of these are at a higher level than for the general gene databases and
" " "" " "
"" " " 17"
therefore supports a more accurate basis for comparison. While amplicon sequencing has
several identified steps in which diversity measures may become inflated, calculating
diversity based on shotgun metagenomics certainly will also lead to an overestimation of
diversity (Ranjan et al. 2016). In a comparison between 16S rRNA gene amplicon
sequencing and shotgun metagenomics in human microbiome studies the conclusion was
in favor of the shotgun sequencing of whole genomes (Ranjan et al. 2016). The authors
were stuck by the result that 16S rRNA gene amplicon sequencing results in a lower
diversity when compared to shotgun metagenomics, which had taxonomy assigned
through the MG-RAST pipeline. MG-RAST assigns taxonomy based on the taxonomy of
the organism of the gene, which the query sequence matches best (Meyer et al. 2008).
While 16S rRNA genes do not allow detection at species level, this gene was selected
based on the fact that it was the best candidate for sorting out phylogeny (Woese 1987).
Any functional gene from a shotgun metagenome does not live up to the same
characteristics as the 16S rRNA gene and cannot predict taxonomy to the same accuracy
and will therefore result in a highly inflated diversity of a sample.
Several tools are being developed that estimate diversity and taxonomy based on
shotgun metagenomic data (Meyer et al. 2008; Huson et al. 2011; M. Wu and Eisen
2008) (Box 6: MGmapper). These tools aim at not just detecting species but advancing
into the detection of organisms at strain level. This is an advancement from the current
use of 16S rRNA genes for species assignment.
In time, when shotgun metagenomics allows the exhaustive sequencing of a
sample and databases have been updated and curated based on the new knowledge that
shotgun metagenomics allows, then this technology will approach the potential for the
equal detection of diversity at the highest possible level and the simultaneous detection of
functional potential of a microbial community.
"
"18"
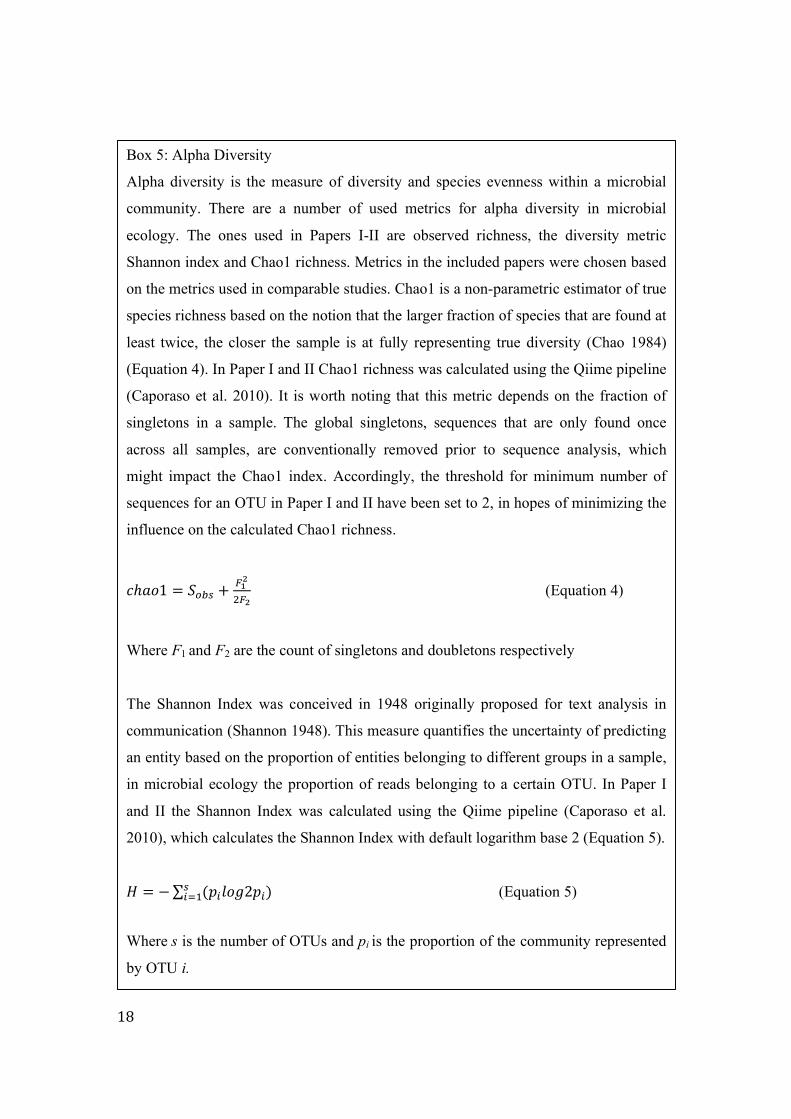
Box 5: Alpha Diversity
Alpha diversity is the measure of diversity and species evenness within a microbial
community. There are a number of used metrics for alpha diversity in microbial
ecology. The ones used in Papers I-II are observed richness, the diversity metric
Shannon index and Chao1 richness. Metrics in the included papers were chosen based
on the metrics used in comparable studies. Chao1 is a non-parametric estimator of true
species richness based on the notion that the larger fraction of species that are found at
least twice, the closer the sample is at fully representing true diversity (Chao 1984)
(Equation 4). In Paper I and II Chao1 richness was calculated using the Qiime pipeline
(Caporaso et al. 2010). It is worth noting that this metric depends on the fraction of
singletons in a sample. The global singletons, sequences that are only found once
across all samples, are conventionally removed prior to sequence analysis, which
might impact the Chao1 index. Accordingly, the threshold for minimum number of
sequences for an OTU in Paper I and II have been set to 2, in hopes of minimizing the
influence on the calculated Chao1 richness.
!ℎ!"1 = !!"# + !!!!!!
(Equation 4)
Where F1 and F2 are the count of singletons and doubletons respectively
The Shannon Index was conceived in 1948 originally proposed for text analysis in
communication (Shannon 1948). This measure quantifies the uncertainty of predicting
an entity based on the proportion of entities belonging to different groups in a sample,
in microbial ecology the proportion of reads belonging to a certain OTU. In Paper I
and II the Shannon Index was calculated using the Qiime pipeline (Caporaso et al.
2010), which calculates the Shannon Index with default logarithm base 2 (Equation 5).
! = −∑ (!!!"#2!!)!!!! (Equation 5)
Where s is the number of OTUs and pi is the proportion of the community represented
by OTU i.

" " "" " "
"" " " 19"
There seems to be a consensus in cryosphere biogeography that there is no need to argue
for the choice of methods when it comes to sequencing. The reasoning behind this might
be the existence of the notion that newer methods are inherently better and choosing
sequencing is based only on what the investigators can afford. Since sequencing is the
foundation for these studies the different methods and their applicability should be
rigorously tested and debated in the scientific community (Mizrahi-Man, Davenport, and
Gilad 2013). Before spending additional resources by choosing shotgun metagenomics
over amplicon sequencing, we need to ask; does more data give clearer results or is there
a tendency to sequence the whole haystack, when one could have targeted the needle?
For microbial ecology the knowledge base is low compared to e.g. human
microbiome-studies and the diversity potentially higher, therefore one needs to consider
carefully what kind of data answers ecological research questions best. Cryosphere
biogeography is one end of an extreme with the other end being clinical biogeography,
for which we have a much deeper understanding and detailed knowledgebase. We are
able to track exactly how human pathogens are distributed because we know what we are
looking for from decades of detailed studies of isolated cultures that are now often fully
sequenced and annotated. In cryosphere biogeography we are at a much earlier stage and
the great amounts of data provided by shotgun metagenomics might not always be the
optimal choice of advancing our understanding.
We know that it is nearly impossible to disprove the major microbial biogeography
hypotheses, such as Everything is everywhere (Martiny et al. 2006). This is still true
today despite the much larger amount of data available. One reason is that we do not yet
sequence exhaustively, another is that we are still not able to accurately assign organisms
to their precise taxonomy, which would require complete whole genome sequences.
Developments in sequencing technologies and computational tools such as binning (Box
2: Genomes from Metagenomes) are bringing us closer to be able to do this. In the future,
the extraction of the entire set of complete genomes from metagenomes holds promise of
finally testing the Baas-Becking hypothesis.
For the massive amounts of data generated by NGS technologies to make sense
we need to have solidly curated databases for comparison. Therefore, advancements in
"
"20"
NGS go hand in hand with developments in culturing and in situ detection through e.g.
FISH (Nemergut et al. 2013; Staley and Gosink 1999).
Until shotgun metagenomics allows us to fully sequence a sample we need to
consider our hypothesis before choosing a sequencing strategy. This is particularly
important in cryosphere biogeography, where our base for comparison is limited and
more data does not necessarily equal more knowledge. 16S rRNA amplicon sequencing
has merit in usage for answering research question that involves measures of diversity.
16S rRNA gene amplicons are also useful for tracing dispersal in the environment, where
the DNA sequence serves as a tracer of microbial communities, rather than a detection of
a specific strain (Hauptmann et al. 2016).
1.3.3 What Next-generation Sequencing Taught Us about Microbial Biogeography
of the Cryosphere
Potentially the most important outcome of the application of NGS technologies in
microbial biogeography of the cryosphere is the acknowledgement of the cryosphere as a
biome (Boetius et al. 2015; Anesio and Laybourn-Parry 2012). The cryosphere is a
microbially dominated habitat and thus the life in this habitat was not fully visible to us
prior to the advancement of molecular techniques for the assessment of the diversity and
functions of microbial life. Through NGS technologies the cryosphere has been shown to
harbor a distinct and diverse microbial community.
In this final section of part I the caveats of utilizing NGS technologies for estimating
diversity and community composition will be discussed and examples from cryosphere
microbial biogeography will be presented.
1.3.3.1 Biodiversity in the era of Next-generation Sequencing
Snow was once believed to harbor only an allochthonous microbial community, and was
not considered a habitat sustaining its own adapted community (Boetius et al. 2015). The
first studies of snow using 16S rRNA gene amplicon sequencing emerged in 2013
(Møller et al. 2013; Hell et al. 2013). With these studies the diversity of snow increased
from an estimated species richness of below 100 (Lopatina, Krylenkov, and Severinov
2013; Chuvochina et al. 2011; Harding et al. 2011) to several hundred (Hell et al. 2013)

" " "" " "
"" " " 21"
and even up to almost 10.000 OTUs per sample (Møller et al. 2013). With this notable
increase in estimated diversity of a seeming uninhabitable environment, snow no longer
seemed to be only a depository of inactive microbes. Furthermore, the results indicated
that the samples had not yet been sequenced exhaustively (Møller et al. 2013).
The measurement of diversity using NGS technologies and bioinformatical tools
has been reviewed thoroughly and there are several important caveats to consider when
measuring diversity using NGS data (Ranjan et al. 2016; Sinclair et al. 2015; Mizrahi-
Man, Davenport, and Gilad 2013). For the two first NGS studies of snow both of them
employed the 454 pyrosequencing platform (Box 3: The 454 Pyrosequencing Platform).
One study targeted 16S rRNA gene variable regions V1-V3 (Hell et al. 2013) the other
targeted variable regions V3 and V4 (Møller et al. 2013). Due to the limited length of
amplicons available with commonly used sequencing platforms (Box 3 and 4: NGS
Platforms) it is conventional to sequence only selected variable regions of the ca. 1500bp
length of the 16S rRNA gene. This ultimately means that studies are often not comparing
the same signature of diversity. Also, within a study sequences are conventionally
clustered into operational taxonomic units (OTUs), roughly equivalent to species, at 97%
identity (Nguyen et al. 2016). This threshold was based on results from the whole length
of the 16S rRNA gene (Konstantinidis and Tiedje 2005) and is in fact not appropriate
when using only selected variable regions (Nguyen et al. 2016). A recent study showed
that paired-end sequencing of variable regions 3 or 4 gives the most effective study
design but the study also emphasized the lack of consensus in the literature reviewing
sequencing and data analysis strategies for 16S rRNA gene amplicons (Mizrahi-Man,
Davenport, and Gilad 2013).
454 pyrosequencing has been used extensively for amplicon sequencing of the
16S rRNA gene due to its ability to produce longer reads. However, its higher error rate
in regions of homopolymers results in an artificially high number of operational
taxonomic units (OTUs), which then inflates the resulting diversity (Box 3: The 454
Pyrosequencing Platform). Therefore, it has become mandatory to denoise
pyrosequencing amplicon data to reduce the noise from artificial OTUs (Reeder and
Knight 2011). Today Illumina sequencing, in particular MiSeq, is widely used for
amplicon sequencing (Sinclair et al. 2015) (Box 4: The Illumina Platform). Illumina
"
"22"
MiSeq yields shorter reads than 454 pyrosequencing but has the advantage of allowing
paired-end sequencing, which has shown to give a better balance between precision and
coverage in the results (Mizrahi-Man, Davenport, and Gilad 2013).
Before amplicon data analysis the data is quality checked. In addition to denoising
of the data, removal of chimeric sequences is also important to avoid inflation of the
detected diversity (Edgar et al. 2011). Chimeras are artifacts of PCR amplification, which
occur when short fragments from incomplete amplification anneal to target sequences
during subsequent PCR cycles and thereby act as primers. This results in chimeric
sequences between the incomplete fragment and the target fragment to which it annealed.
Commonly used software for removing chimeras is the UCHIME algorithm from the
USEARCH package (Edgar et al. 2011).
A bioinformatical pipeline for 16S rRNA gene processing is employed after
quality checking of sequencing data, which allows the classification and clustering of
operational taxonomic units (OTUs). The difference in clustering methods should be
taken into close consideration when comparing results from one study to another. Using
default settings of a commonly used bioinformatics pipeline for amplicon data Qiime
(Caporaso et al. 2010) has shown to inflate the resultant diversity measures over ten fold
(Sinclair et al. 2015). Reviews however also show that general trends in alpha and beta
diversity were conserved and corresponded well regardless of the clustering algorithm
(Sinclair et al. 2015). Encouragingly, comparisons within a single study where all
samples are processed alike can be expected to be comparable and general trends among
different studies can also be compared when the known discrepancies are kept in mind
and absolute richness estimates are not compared directly (Sinclair et al. 2015).
The first study of microbe-mineral aggregates on ice, termed cryoconite, using shotgun
metagenomics was published prior to the use of 16S rRNA gene amplicon sequencing in
this habitat (Edwards et al. 2013). This study did not give any measures of diversity but
estimated taxonomy through the commonly used tool MG-RAST (Meyer et al. 2008).
A number of bioinformatics software packages are available for estimating
taxonomic composition of shotgun metagenomic samples (Meyer et al. 2008; Huson et al.
2011; M. Wu and Eisen 2008) (Box 6: MGmapper). A caveat when estimating diversity
" " "" " "
"" " " 23"
and taxonomy from shotgun metagenomic samples is the genome length bias, which
results in more reads from longer genomes (Kerepesi and Grolmusz 2016). This bias
makes it problematic to make quantitative comparisons among different taxa within
samples. Some tools estimate taxonomic fractions based on single copy marker genes and
are able to circumvent the genome length bias (M. Wu and Eisen 2008). Other tools,
including MG-RAST, have been shown to wrongfully estimate quantities of taxa
(Kerepesi and Grolmusz 2016).
In addition to bioinformatical tools there are a number of other potential biases when
employing NGS technologies to microbial communities such as sample collection,
storage, DNA/RNA extraction, Reverse Transcriptase, PCR, sequencing and statistical
analyses (Sinha et al. 2015; Sinclair et al. 2015). The magnitude of these biases and the
reproducibility of NGS-based studies have not yet been thoroughly tested (Sinha et al.
2015). At the frontier of NGS-based studies are human microbiome projects, where
initiatives such as The microbiome quality control project have just started assessing the
potential biases and reproducibility of NGS-based studies of microbial communities
(Sinha et al. 2015).
As we rightfully marvel at the technological advances that will lead to great scientific
discoveries such as the recent in-depth sequencing of 10,000 human genomes (Telenti et
al. 2016) we need to take special care in rigorously and critically reviewing our
methodologies in the light of our specific field of research.
In well-defined fields of research such as cryosphere microbial biogeography we need to
let the technologies be aids in developing our understanding of our field rather than the
focus of our research. In the end of the day we need to put emphasis on hypothesis-driven
research in microbial ecology, use our hypothesis for choosing our methods, as this is the
prerequisite for obtaining truthful and useful knowledge about microbial ecology through
bioinformatics.
"
"24"
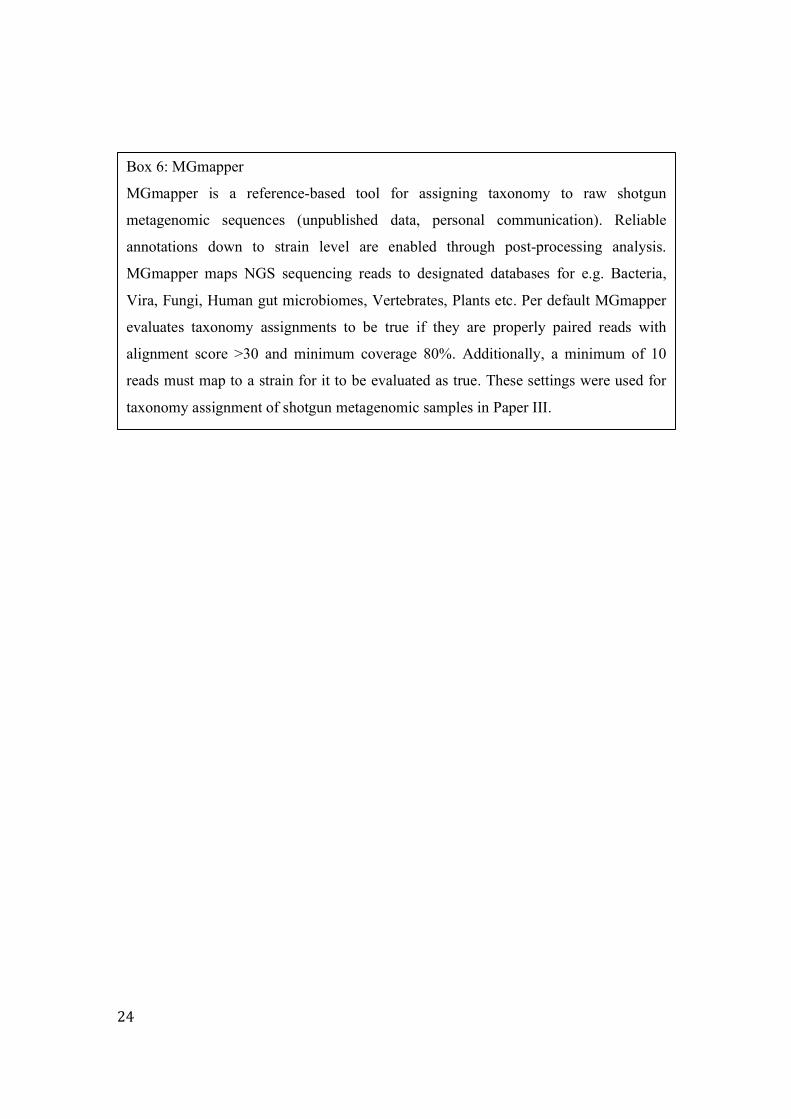
Box 6: MGmapper
MGmapper is a reference-based tool for assigning taxonomy to raw shotgun
metagenomic sequences (unpublished data, personal communication). Reliable
annotations down to strain level are enabled through post-processing analysis.
MGmapper maps NGS sequencing reads to designated databases for e.g. Bacteria,
Vira, Fungi, Human gut microbiomes, Vertebrates, Plants etc. Per default MGmapper
evaluates taxonomy assignments to be true if they are properly paired reads with
alignment score >30 and minimum coverage 80%. Additionally, a minimum of 10
reads must map to a strain for it to be evaluated as true. These settings were used for
taxonomy assignment of shotgun metagenomic samples in Paper III.

" " "" " "
"" " " 25"
Part II

"
"26"
" " "" " "
"" " " 27"
2 Cryosphere Microbial Biogeography
The current thesis comprises three studies of microbial biogeography in three different
habitats of the cryosphere. The three studies are examples of different next-generation
sequencing approaches. Three chapters in this part will be opened with a short
introduction to each of the habitats of the cryosphere followed by an overview of the
results and utilization of NGS methodology in this habitat. Each chapter will be
concluded with the paper concerning the specific cryosphere habitat.
Chapter 2.1 is an exploratory study of snow on North Pole ice floes using 16S rRNA
gene amplicon sequencing (Paper I). This chapter illustrates the first use of NGS
methodology in one extreme and remote habitat.
Chapter 2.2 addresses the potential link between the cryosphere, specifically a
glacier on the Disko Island of Greenland, and the ocean through a freshwater network
also utilizing 16S rRNA gene amplicon sequencing (Paper II). This chapter illustrates
how the cryosphere interacts with the downstream ecosystems.
Finally, chapter 2.3 describes the use of shotgun metagenomics in assessing the
microbial communities around the Greenland ice sheet. In this chapter it is discussed how
the cryosphere potentially takes part in global interactions, receiving input from
anthropogenic activities and potentially influences ecosystems and food chains of the
Arctic (Paper III).
The three chapters together illustrate a range of the possibilities and impact that NGS
technologies enables in cryosphere microbial biogeography. From a purely explorative
study, through a study illustrating the interactions of the cryosphere at a local scale and
lastly to the interaction of the cryosphere at a global scale.

"
"28"
2.1 Snow
Snow is the largest frozen habitat on Earth covering up to 35% of the land surface area
(Margesin and Miteva 2011). There has been a long interest in microbes on snow due to
the visibility of these microbes resulting in phenomena such as red snow (Hardy and Curl
1968). The current interest in these microbes lies in their potential for lowering albedo of
snow surfaces resulting in an accelerated melting of snow (Lutz et al. 2014; Lutz et al.
2016).
Despite the long history of interest in snow microbes our understanding of the dynamics
of snow microbial communities is still limited. It has been hypothesized that snow is
inoculated from proximate terrestrial habitats, as snow microbial communities showed
closest resemblance to soil microbial communities and surprisingly less similarity to
communities from close-by cryosphere habitats (Cameron et al. 2015). A similar result
was obtained also in a study of the different environments on the Greenland ice sheet
(Musilova et al. 2015). In here, snow and dust microbial communities showed
resemblance but did not seem to establish themselves in the more long term communities
of cryoconite holes (Musilova et al. 2015). In a recent study of red pigmented snow algae,
results showed no apparent distinct communities at different sites in favor of a
cosmopolitan distribution on red snow algae (Lutz et al. 2016).
While snow microbial communities have shown to be important from a global climate
change perspective (Lutz et al. 2014), our understanding of the microbial biogeography
and adaptation of these communities to the cryosphere is still in an early phase.
PAPER I: Bacterial diversity in snow on North Pole ice floes
Paper I was one of the first applications of NGS technologies in snow. The relevance of
the paper was in its example of an extremely isolated location, the North Pole, with
minimal influence from terrestrial and anthropogenic sources.
The study was a purely explorative study, which was linked to previous results on ice
from the same locations (Bowman et al. 2012).
" " "" " "
"" " " 29"
Results from pyrosequencing of the 16S rRNA gene and qPCR showed a less diverse and
less abundant community than snow communities on land. This study acts as a negative
control to support the idea that a fraction of land-based snow communities from other
NGS studies originate from terrestrial environments.
The microbial community sampled from the three different sites on the North Pole had
one major difference between them in that one sample site (C) had notably few
Cyanobacteria when compared to the two other sites. This Cyanobacteria discrepancy
was also observed in Paper III, where it is discussed further.
Despite the notable difference among the snow samples the samples were still similar
enough that they clustered clearly when compared to the nearby ice and ocean
environment as shown by principal component analysis. This aligns with more recent
results that have shown a different community in snow when compared to ice (Cameron
et al. 2015; Musilova et al. 2015).
Finally, the results from Paper I support the idea that snow microbial communities are
globally distributed at the resolution enabled by 16S rRNA amplicon sequencing. It is
still unknown to which degree the snow environment selects and if an autochthonous
community inhabits snow or if it is simply too transient to support its own distinct
microbial community. As described in chapter 2, the residence time in a habitat can be
determining for the microbial community composition and the degree to which it is
adapted to its environment. Whether this is true for snow remains to be answered.

ORIGINAL PAPER
Bacterial diversity in snow on North Pole ice floes
Aviaja L. Hauptmann • Marek Stibal • Jacob Bælum •
Thomas Sicheritz-Ponten • Søren Brunak • Jeff S. Bowman •
Lars H. Hansen • Carsten S. Jacobsen • Nikolaj Blom
Received: 6 March 2014 / Accepted: 18 May 2014 / Published online: 21 June 2014! The Author(s) 2014. This article is published with open access at Springerlink.com
Abstract The microbial abundance and diversity in snowon ice floes at three sites near the North Pole was assessed
using quantitative PCR and 454 pyrosequencing. Abun-
dance of 16S rRNA genes in the samples ranged between43 and 248 gene copies per millilitre of melted snow. A
total of 291,331 sequences were obtained through 454
pyrosequencing of 16S rRNA genes, resulting in 984 OTUsat 97 % identity. Two sites were dominated by Cyano-
bacteria (72 and 61 %, respectively), including chloro-
plasts. The third site differed by consisting of 95 %Proteobacteria. Principal component analysis showed that
the three sites clustered together when compared to the
underlying environments of sea ice and ocean water. TheShannon indices ranged from 2.226 to 3.758, and the
Chao1 indices showed species richness between 293 and
353 for the three samples. The relatively low abundancesand diversity found in the samples indicate a lower rate of
microbial input to this snow habitat compared to snow in
the proximity of terrestrial and anthropogenic sources ofmicroorganisms. The differences in species composition
and diversity between the sites show that apparently similar
snow habitats contain a large variation in biodiversity,although the differences were smaller than the differences
to the underlying environment. The results support the idea
that a globally distributed community exists in snow andthat the global snow community can in part be attributed to
microbial input from the atmosphere.
Keywords Polar microbiology ! Arctic ! Bacterialdiversity ! Pyrosequencing ! Snow
Introduction
The extent of sea ice in the Arctic is diminishing due to
climate change (Perovich and Richter-Menge 2009), and
Communicated by A. Oren.
Electronic supplementary material The online version of thisarticle (doi:10.1007/s00792-014-0660-y) contains supplementarymaterial, which is available to authorized users.
A. L. Hauptmann ! J. Bælum ! S. Brunak ! N. BlomCenter for Biosustainability, Technical University of Denmark,Hørsholm, Denmark
A. L. Hauptmann ! J. Bælum ! T. Sicheritz-Ponten !S. Brunak ! N. Blom (&)Center for Biological Sequence Analysis, Technical University ofDenmark, Building 208, 2800 Kongens Lyngby, Denmarke-mail: [email protected]
M. Stibal ! C. S. JacobsenDepartment of Geochemistry, Geological Survey of Denmark andGreenland (GEUS), Copenhagen, Denmark
M. Stibal ! C. S. JacobsenCenter for Permafrost (CENPERM),University of Copenhagen, Copenhagen, Denmark
J. S. BowmanDepartment of Biological Oceanography,University of Washington, Seattle, WA, USA
L. H. HansenDepartment of Environmental Science,Aarhus University, Roskilde, Denmark
C. S. JacobsenDepartment of Plant and Environment,University of Copenhagen, Copenhagen, Denmark
123
Extremophiles (2014) 18:945–951
DOI 10.1007/s00792-014-0660-y
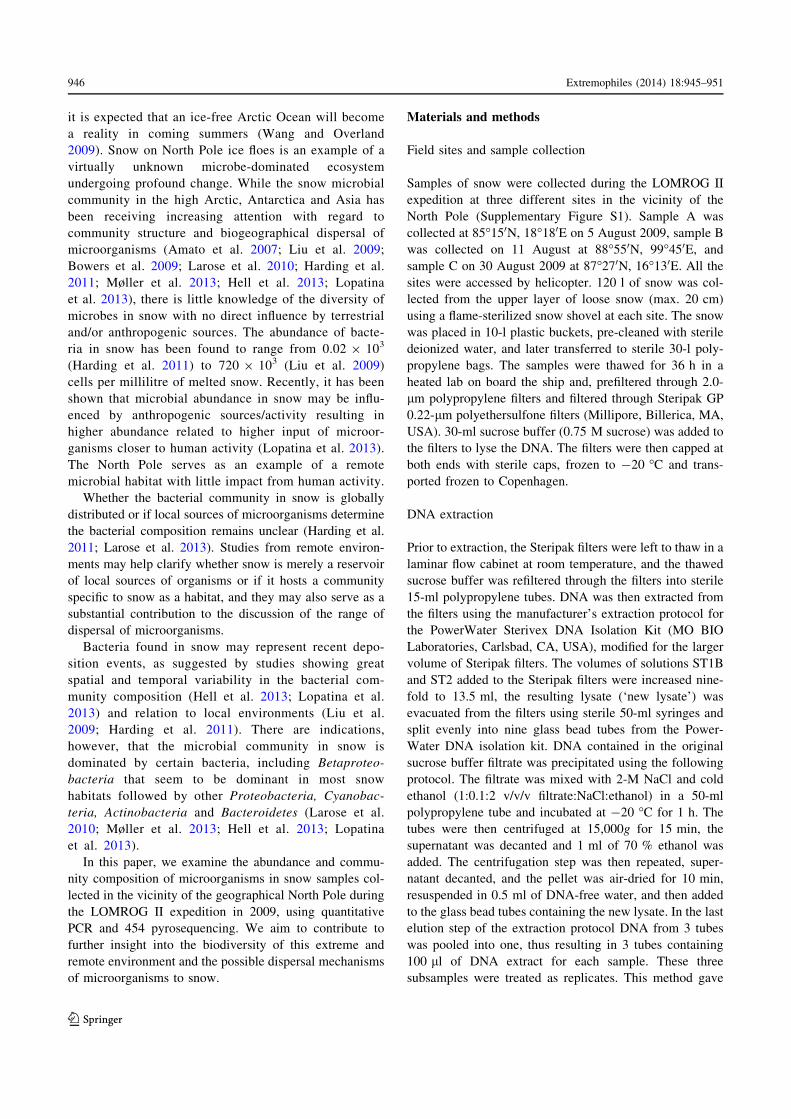
it is expected that an ice-free Arctic Ocean will become
a reality in coming summers (Wang and Overland2009). Snow on North Pole ice floes is an example of a
virtually unknown microbe-dominated ecosystem
undergoing profound change. While the snow microbialcommunity in the high Arctic, Antarctica and Asia has
been receiving increasing attention with regard to
community structure and biogeographical dispersal ofmicroorganisms (Amato et al. 2007; Liu et al. 2009;
Bowers et al. 2009; Larose et al. 2010; Harding et al.2011; Møller et al. 2013; Hell et al. 2013; Lopatina
et al. 2013), there is little knowledge of the diversity of
microbes in snow with no direct influence by terrestrialand/or anthropogenic sources. The abundance of bacte-
ria in snow has been found to range from 0.02 9 103
(Harding et al. 2011) to 720 9 103 (Liu et al. 2009)cells per millilitre of melted snow. Recently, it has been
shown that microbial abundance in snow may be influ-
enced by anthropogenic sources/activity resulting inhigher abundance related to higher input of microor-
ganisms closer to human activity (Lopatina et al. 2013).
The North Pole serves as an example of a remotemicrobial habitat with little impact from human activity.
Whether the bacterial community in snow is globally
distributed or if local sources of microorganisms determinethe bacterial composition remains unclear (Harding et al.
2011; Larose et al. 2013). Studies from remote environ-
ments may help clarify whether snow is merely a reservoirof local sources of organisms or if it hosts a community
specific to snow as a habitat, and they may also serve as a
substantial contribution to the discussion of the range ofdispersal of microorganisms.
Bacteria found in snow may represent recent depo-
sition events, as suggested by studies showing greatspatial and temporal variability in the bacterial com-
munity composition (Hell et al. 2013; Lopatina et al.
2013) and relation to local environments (Liu et al.2009; Harding et al. 2011). There are indications,
however, that the microbial community in snow is
dominated by certain bacteria, including Betaproteo-bacteria that seem to be dominant in most snow
habitats followed by other Proteobacteria, Cyanobac-
teria, Actinobacteria and Bacteroidetes (Larose et al.2010; Møller et al. 2013; Hell et al. 2013; Lopatina
et al. 2013).
In this paper, we examine the abundance and commu-nity composition of microorganisms in snow samples col-
lected in the vicinity of the geographical North Pole during
the LOMROG II expedition in 2009, using quantitativePCR and 454 pyrosequencing. We aim to contribute to
further insight into the biodiversity of this extreme and
remote environment and the possible dispersal mechanismsof microorganisms to snow.
Materials and methods
Field sites and sample collection
Samples of snow were collected during the LOMROG IIexpedition at three different sites in the vicinity of the
North Pole (Supplementary Figure S1). Sample A was
collected at 85!150N, 18!180E on 5 August 2009, sample Bwas collected on 11 August at 88!550N, 99!450E, and
sample C on 30 August 2009 at 87!270N, 16!130E. All the
sites were accessed by helicopter. 120 l of snow was col-lected from the upper layer of loose snow (max. 20 cm)
using a flame-sterilized snow shovel at each site. The snow
was placed in 10-l plastic buckets, pre-cleaned with steriledeionized water, and later transferred to sterile 30-l poly-
propylene bags. The samples were thawed for 36 h in a
heated lab on board the ship and, prefiltered through 2.0-lm polypropylene filters and filtered through Steripak GP
0.22-lm polyethersulfone filters (Millipore, Billerica, MA,
USA). 30-ml sucrose buffer (0.75 M sucrose) was added tothe filters to lyse the DNA. The filters were then capped at
both ends with sterile caps, frozen to -20 !C and trans-
ported frozen to Copenhagen.
DNA extraction
Prior to extraction, the Steripak filters were left to thaw in a
laminar flow cabinet at room temperature, and the thawedsucrose buffer was refiltered through the filters into sterile
15-ml polypropylene tubes. DNA was then extracted from
the filters using the manufacturer’s extraction protocol forthe PowerWater Sterivex DNA Isolation Kit (MO BIO
Laboratories, Carlsbad, CA, USA), modified for the larger
volume of Steripak filters. The volumes of solutions ST1Band ST2 added to the Steripak filters were increased nine-
fold to 13.5 ml, the resulting lysate (‘new lysate’) was
evacuated from the filters using sterile 50-ml syringes andsplit evenly into nine glass bead tubes from the Power-
Water DNA isolation kit. DNA contained in the original
sucrose buffer filtrate was precipitated using the followingprotocol. The filtrate was mixed with 2-M NaCl and cold
ethanol (1:0.1:2 v/v/v filtrate:NaCl:ethanol) in a 50-ml
polypropylene tube and incubated at -20 !C for 1 h. Thetubes were then centrifuged at 15,000g for 15 min, the
supernatant was decanted and 1 ml of 70 % ethanol was
added. The centrifugation step was then repeated, super-natant decanted, and the pellet was air-dried for 10 min,
resuspended in 0.5 ml of DNA-free water, and then added
to the glass bead tubes containing the new lysate. In the lastelution step of the extraction protocol DNA from 3 tubes
was pooled into one, thus resulting in 3 tubes containing
100 ll of DNA extract for each sample. These threesubsamples were treated as replicates. This method gave
946 Extremophiles (2014) 18:945–951
123
the highest DNA yield compared to a method using the
Sterivex protocol only without adding the precipitatedDNA from the filtrate and with a method based on pro-
teinase K lysis, as tested on filtered tap water samples (data
not shown).
Quantitative PCR
The abundance of 16S rRNA genes in the extracts was
determined using quantitative PCR (qPCR) performed withthe PRBA338f and P518r primers (Muyzer et al. 1993) and
standards with known quantities of the gene extracted from
1.8 ml of a culture of E. coli using an UltraClean microbialDNA isolation kit (MO BIO Laboratories, Carlsbad, CA,
USA) following the manufacturer’s protocol. The qPCR
was set up under DNA-free conditions in a clean, UVsterilized (3 h on a daily basis) lab with an HEPA-filtered
air inlet. The setup was as follows: 20-ll reactions con-
taining 10 ll of SYBR Premix Ex Taq II (TaKaRa, Kyoto,Japan), 0.8 ll of the primers (final concentration 0.4 lM)
and 1 ll of template DNA. The reaction was then carried
out on a CFX96 Touch qPCR system (Bio-Rad, Hercules,CA, USA). The cycle program was 95 !C for 1 min fol-
lowed by 50 cycles of 95 !C for 30 s, 30 s at 60 !C and
72 !C for 30 s. The reaction was completed by a final72 !C elongation step for 6 min. All qPCR reactions were
performed in triplicate, and confirmatory melting curve
analysis was performed on all qPCR products. Negativecontrols containing no template were used to assess the
contamination potential.
Pyrosequencing
The diversity of 16S rRNA genes in the snow samples wasdetermined by pyrosequencing. Amplicons of 466-bp
flanking the V3 and V4 regions of the 16S rRNA gene were
amplified using the primers 341F (50-CCTAYGGGRBGCASCAG-30) and 806R (50-GGACTACNNGGGTATC
TAAT-30) followed by a second PCR where primers with
adapters and 10-bp tags were used (Hansen et al. 2012).PCR amplification was performed using 1 9 AccuPrime
buffer II which contained 0.2 mM dNTP’s, 0.75 U Accu-
Prime Taq DNA Polymerase High fidelity (Invitrogen,Carlsbad, CA, USA), 0.5 lM of each of the primers, and
1 ll of DNA extract to a total of 25 ll per reaction. PCR
was performed with a DNA Engine Dyad Peltier ThermalCycler (MJ Research, Massachusetts, USA). The cycle
conditions were 94 !C for 2 min, 30 cycles of denaturation
at 94 !C for 20 s, annealing at 56 !C for 30 s and elon-gation at 68 !C for 40 s, and a final elongation step at
72 !C for 5 min. The conditions of the second PCR were as
the first PCR, except that the number of cycles was reducedto 15 cycles. The PCR products were run on a gel and the
appropriate fragments were cut and purified using the
Montage DNA Gel Extraction kit (Millipore, Bedford,Massachusetts, USA). The amplified fragments with
adapters and tags were quantified using a Qubit fluorometer
(Invitrogen, Carlsbad, CA, USA) and mixed in approxi-mately equal concentrations (1 9 107 copies ll-1) to
ensure equal representation of each sample. Samples were
run on a GS FLX Titanium Pico TiterPlate using a GS FLXTitanium Sequencing Kit XLR70 according to the manu-
facturer’s instructions (Roche Diagnostics, Indianapolis,IN, USA).
Bioinformatics
The 454 pyrosequencing data were analyzed using the
software package QIIME version 1.7.0 (Caporaso et al.2010). The data were denoised to remove characteristic
sequencing errors for 454 pyrosequencing, specifically
faulty additional operational taxonomic units (OTUs)caused by long homopolymers (Reeder and Knight
2010). Chimeras were removed with the USEARCH
toolbox version 7.0.1001 UCHIME reference-basedchimera detection using the Greengenes database
gg_13_5 release downloaded on 13 February 2014 as
reference (DeSantis et al. 2006; Edgar et al. 2011).Samples were assigned to multiplex reads with the
following default parameters: min. quality score of 25,
min. length 200, max. length 1000 and no ambiguousbases and mismatches allowed in primer sequences. De
novo OTU picking in QIIME was done by assigning
similar sequences to a single OTU at a 97 % similaritythreshold. Taxonomy of the OTUs was assigned through
QIIME with BLAST (Altschul et al. 1990), the RDP
Classifier (Wang et al. 2007) and the QIIME RTAXclassifier. Rarefaction curves (Hughes et al. 2001),
Shannon indices (Magurran 1988) and richness indices
(Chao 1984) were obtained through QIIME. Furtheranalysis of sequences matching cyanobacterial OTUs
was done through manually blasting with the NCBI
Standard Nucleotide BLAST against the nr/nt databaseusing Megablast (Altschul et al. 1990).
Statistical analysis
The multivariate data analysis software Canoco 5 (ter
Braak and Smilauer 2012) was used to conduct principalcomponent analysis (PCA) of the relative abundance data
to analyze the total variation within the snow dataset, as
well as between snow samples and ice and ocean samples.PCA is an unconstrained ordination method that describes
the axes of maximum variability in the data and helps
discern patterns within datasets. The data were log(x ? 1)transformed prior to analysis.
Extremophiles (2014) 18:945–951 947
123
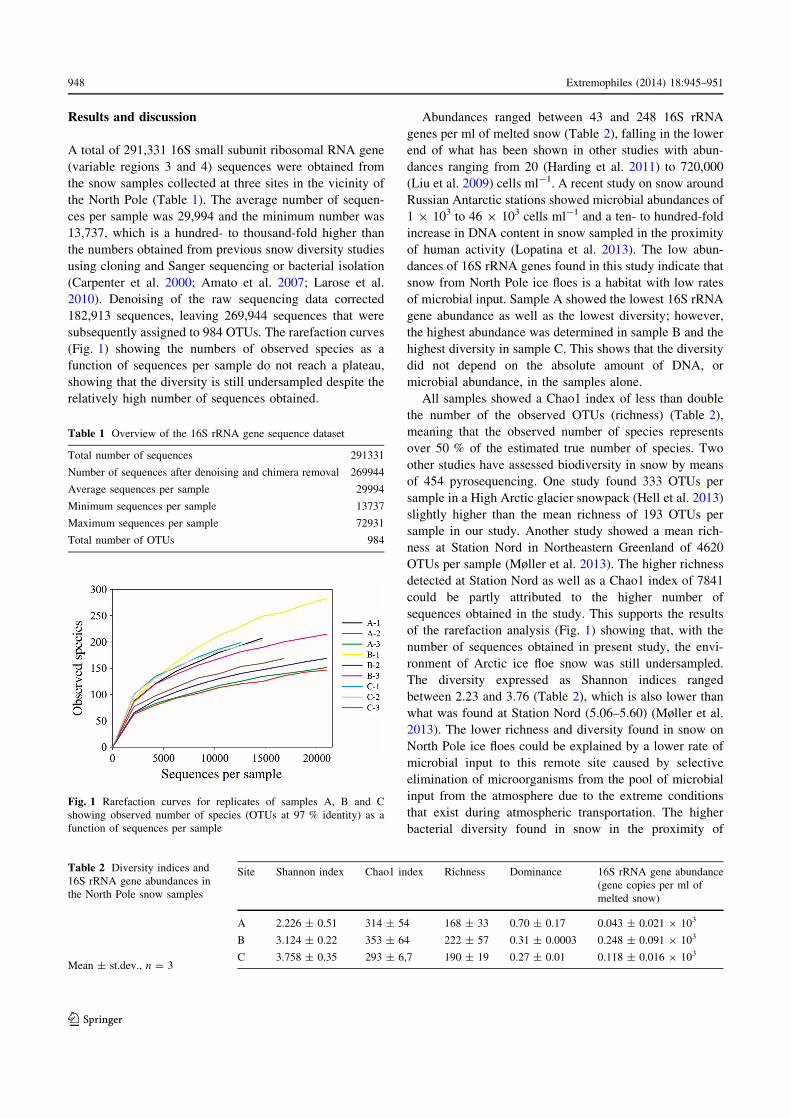
Results and discussion
A total of 291,331 16S small subunit ribosomal RNA gene
(variable regions 3 and 4) sequences were obtained from
the snow samples collected at three sites in the vicinity ofthe North Pole (Table 1). The average number of sequen-
ces per sample was 29,994 and the minimum number was
13,737, which is a hundred- to thousand-fold higher thanthe numbers obtained from previous snow diversity studies
using cloning and Sanger sequencing or bacterial isolation
(Carpenter et al. 2000; Amato et al. 2007; Larose et al.2010). Denoising of the raw sequencing data corrected
182,913 sequences, leaving 269,944 sequences that were
subsequently assigned to 984 OTUs. The rarefaction curves(Fig. 1) showing the numbers of observed species as a
function of sequences per sample do not reach a plateau,
showing that the diversity is still undersampled despite therelatively high number of sequences obtained.
Abundances ranged between 43 and 248 16S rRNA
genes per ml of melted snow (Table 2), falling in the lowerend of what has been shown in other studies with abun-
dances ranging from 20 (Harding et al. 2011) to 720,000
(Liu et al. 2009) cells ml-1. A recent study on snow aroundRussian Antarctic stations showed microbial abundances of
1 9 103 to 46 9 103 cells ml-1 and a ten- to hundred-fold
increase in DNA content in snow sampled in the proximityof human activity (Lopatina et al. 2013). The low abun-
dances of 16S rRNA genes found in this study indicate thatsnow from North Pole ice floes is a habitat with low rates
of microbial input. Sample A showed the lowest 16S rRNA
gene abundance as well as the lowest diversity; however,the highest abundance was determined in sample B and the
highest diversity in sample C. This shows that the diversity
did not depend on the absolute amount of DNA, ormicrobial abundance, in the samples alone.
All samples showed a Chao1 index of less than double
the number of the observed OTUs (richness) (Table 2),meaning that the observed number of species represents
over 50 % of the estimated true number of species. Two
other studies have assessed biodiversity in snow by meansof 454 pyrosequencing. One study found 333 OTUs per
sample in a High Arctic glacier snowpack (Hell et al. 2013)
slightly higher than the mean richness of 193 OTUs persample in our study. Another study showed a mean rich-
ness at Station Nord in Northeastern Greenland of 4620
OTUs per sample (Møller et al. 2013). The higher richnessdetected at Station Nord as well as a Chao1 index of 7841
could be partly attributed to the higher number of
sequences obtained in the study. This supports the resultsof the rarefaction analysis (Fig. 1) showing that, with the
number of sequences obtained in present study, the envi-
ronment of Arctic ice floe snow was still undersampled.The diversity expressed as Shannon indices ranged
between 2.23 and 3.76 (Table 2), which is also lower than
what was found at Station Nord (5.06–5.60) (Møller et al.2013). The lower richness and diversity found in snow on
North Pole ice floes could be explained by a lower rate of
microbial input to this remote site caused by selectiveelimination of microorganisms from the pool of microbial
input from the atmosphere due to the extreme conditions
that exist during atmospheric transportation. The higherbacterial diversity found in snow in the proximity of
Fig. 1 Rarefaction curves for replicates of samples A, B and Cshowing observed number of species (OTUs at 97 % identity) as afunction of sequences per sample
Table 1 Overview of the 16S rRNA gene sequence dataset
Total number of sequences 291331
Number of sequences after denoising and chimera removal 269944
Average sequences per sample 29994
Minimum sequences per sample 13737
Maximum sequences per sample 72931
Total number of OTUs 984
Table 2 Diversity indices and16S rRNA gene abundances inthe North Pole snow samples
Mean ± st.dev., n = 3
Site Shannon index Chao1 index Richness Dominance 16S rRNA gene abundance(gene copies per ml ofmelted snow)
A 2.226 ± 0.51 314 ± 54 168 ± 33 0.70 ± 0.17 0.043 ± 0.021 9 103
B 3.124 ± 0.22 353 ± 64 222 ± 57 0.31 ± 0.0003 0.248 ± 0.091 9 103
C 3.758 ± 0.35 293 ± 6,7 190 ± 19 0.27 ± 0.01 0.118 ± 0.016 9 103
948 Extremophiles (2014) 18:945–951
123

terrestrial and anthropogenic sources is likely to originate
from the surrounding habitats, where microbial abundances
are higher than compared to environments on the NorthPole. This is supported by studies showing similarity of the
snow microbial community to the community found in
environments adjacent to the sampled snow (Liu et al.2009; Harding et al. 2011).
The most abundant OTUs in sample A were chloroplasts
(69.7 %), Burkholderiaceae (7 %) and Sphingomonas(4.5 %). Sample B was dominated by diatoms (Bacilla-
riophyta, 30.9 %), (26.8 %), chloroplasts and Shewanella
(11.6 %). The dominant OTUs in sample C were Pseud-oalteromonas (26.8 %), Herbaspirillum (18.4 %) and
Sphingomonas (7.9 %). The variation in diversity within
samples (i.e., between replicates) was smaller than thevariation between sites, which is visualised in a principal
component analysis plot shown in Fig. 2, where replicates
from the same site cluster together. This shows that errorspotentially introduced during handling and analyses of the
samples are smaller than the real differences between sites.
At phylum level, the diversity of samples from site A and Bwas dominated by Cyanobacteria, including chloroplasts,
(72 and 61 % respectively), Proteobacteria (23 and 35 %),
Firmicutes (1.9 and 1.2 %) and Bacteroidetes (1.1 and1.5 %) (Fig. 3). Sample C had similar abundances of
Bacteroidetes (1.3 %) and Firmicutes (1.4 %) as in sam-
ples A and B, but was otherwise dominated by Proteo-bacteria (95 %) and lacked the high abundance of
Cyanobacteria (1.4 %). Thus far most studies on snow
have found Proteobacteria to be dominant, followed by
Bacteroidetes and Actinobacteria (Bowers et al. 2009; Liuet al. 2009; Hell et al. 2013; Lopatina et al. 2013; Møller
et al. 2013). Firmicutes have also shown to be common in
snow (Bowers et al. 2009; Liu et al. 2009; Larose et al.2010; Hell et al. 2013; Møller et al. 2013), as have Cya-
nobacteria (Bowers et al. 2009; Larose et al. 2010; Harding
et al. 2011; Hell et al. 2013; Møller et al. 2013). The resultsof the present study are in line with previous findings that
Proteobacteria, Bacteroidetes, Firmicutes and Cyanobac-teria are the most abundant phyla in snow habitats. The
similarity found between studies of snow from different
locations supports the idea that a core community of bac-teria might inhabit the snow habitat globally. Our study
shows that the community composition at remote sites with
minimum input from terrestrial and anthropogenic sourcesresembles that of sites in proximity to these sources and
that the similarity in communities is, therefore, not a result
of input from terrestrial ground, anthropogenic activities oras in our case the underlying environment of ice and ocean.
Samples A and B showed similarity also at the genus
level confirming the results at the phylum level (FigureS2). Both samples had a high representation ([1 % of total
OTUs) of Cyanobacteria and chloroplasts, Sphingomonas
(Alphaproteobacteria), Burkholderia (Betaproteobacteria),Pseudomonas (Gammaproteobacteria) and various genera
of the Comamonadaceae family of Betaproteobacteria.
Sample C contained a greater variety of sequences relatedto bacteria known from marine environments than samples
A and B, including 4.6 % of Idiomarina (Ivanova et al.
2000), 5 % of Marinobacter (Gauthier et al. 1992), 3.3 %of Shewanella (Hau and Gralnick 2007) and 1.2 % of
Alteromonas (Baumann et al. 1972). Shewanella was the
only predominantly marine genus found in samples A andB with over 1 %, representing 11.7 % of sequences in
sample B. A higher number of marine-related bacteria
suggest that the microbial community at site C hadreceived greater input from the ocean compared to sites A
and B at the time of sampling. The marine input may be
caused by disruption of the ice and exposure of the snow toaerosols from the ocean, or by warmer or more saline ice,
which could result in an easier migration of marine bacteria
to the snow cover on the ice surface through brine channels(Ewert and Deming 2013). These factors may also partly
account for the higher diversity found in this sample
(Table 2). The differences in community composition atthe three sites show that the bacterial community in snow is
influenced by the surrounding environments, which
potentially leads to an increase in biodiversity. It is highlyunlikely that any of the three samples could have avoided
receiving input from the underlying environment at some
time point. The lack of the marine-related bacteria insamples A and B could be explained by these organisms
Fig. 2 Principal component analysis (PCA) ordination of the micro-bial diversity data in the snow from the three North Pole sites. Thefirst axis explains 31.8 % of the variation in the data, and the secondaxis explains 25.9 % of the variation in the data. The size of thecircles is determined by the richness of the samples
Extremophiles (2014) 18:945–951 949
123
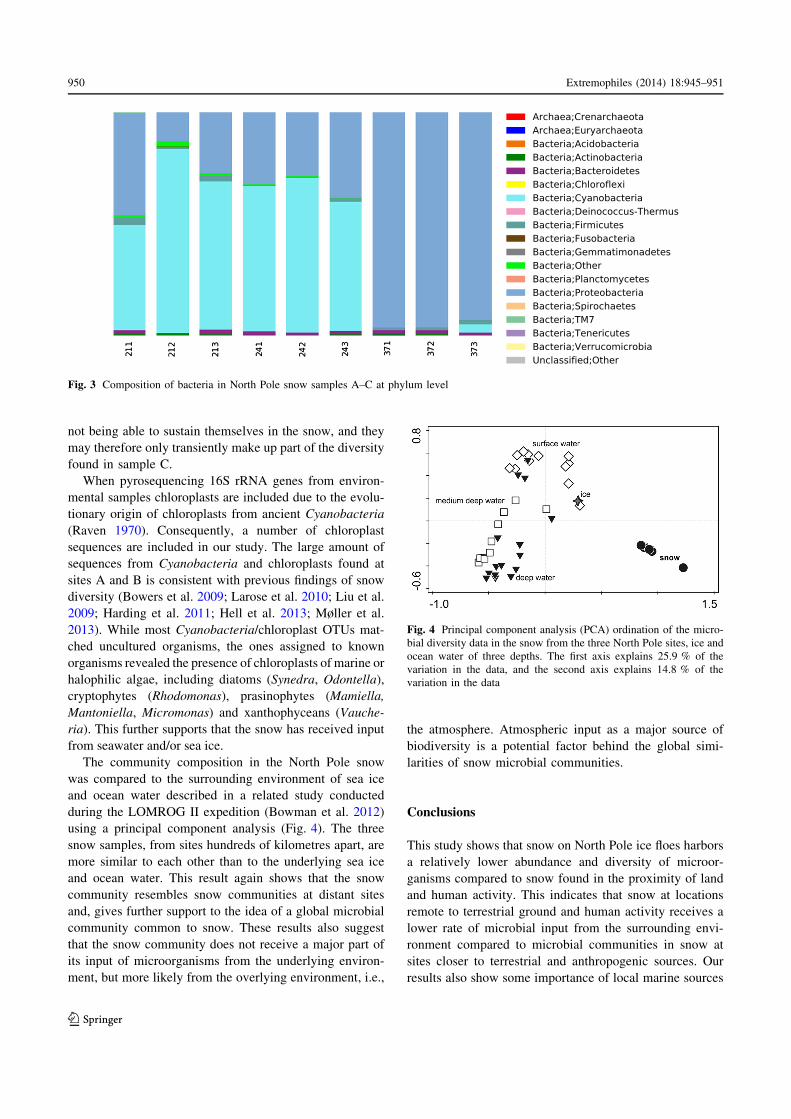
not being able to sustain themselves in the snow, and theymay therefore only transiently make up part of the diversity
found in sample C.
When pyrosequencing 16S rRNA genes from environ-mental samples chloroplasts are included due to the evolu-
tionary origin of chloroplasts from ancient Cyanobacteria
(Raven 1970). Consequently, a number of chloroplastsequences are included in our study. The large amount of
sequences from Cyanobacteria and chloroplasts found at
sites A and B is consistent with previous findings of snowdiversity (Bowers et al. 2009; Larose et al. 2010; Liu et al.
2009; Harding et al. 2011; Hell et al. 2013; Møller et al.
2013). While most Cyanobacteria/chloroplast OTUs mat-ched uncultured organisms, the ones assigned to known
organisms revealed the presence of chloroplasts of marine or
halophilic algae, including diatoms (Synedra, Odontella),cryptophytes (Rhodomonas), prasinophytes (Mamiella,
Mantoniella, Micromonas) and xanthophyceans (Vauche-
ria). This further supports that the snow has received inputfrom seawater and/or sea ice.
The community composition in the North Pole snow
was compared to the surrounding environment of sea iceand ocean water described in a related study conducted
during the LOMROG II expedition (Bowman et al. 2012)using a principal component analysis (Fig. 4). The three
snow samples, from sites hundreds of kilometres apart, are
more similar to each other than to the underlying sea iceand ocean water. This result again shows that the snow
community resembles snow communities at distant sites
and, gives further support to the idea of a global microbialcommunity common to snow. These results also suggest
that the snow community does not receive a major part of
its input of microorganisms from the underlying environ-ment, but more likely from the overlying environment, i.e.,
the atmosphere. Atmospheric input as a major source of
biodiversity is a potential factor behind the global simi-larities of snow microbial communities.
Conclusions
This study shows that snow on North Pole ice floes harborsa relatively lower abundance and diversity of microor-
ganisms compared to snow found in the proximity of landand human activity. This indicates that snow at locations
remote to terrestrial ground and human activity receives a
lower rate of microbial input from the surrounding envi-ronment compared to microbial communities in snow at
sites closer to terrestrial and anthropogenic sources. Our
results also show some importance of local marine sources
Fig. 3 Composition of bacteria in North Pole snow samples A–C at phylum level
Fig. 4 Principal component analysis (PCA) ordination of the micro-bial diversity data in the snow from the three North Pole sites, ice andocean water of three depths. The first axis explains 25.9 % of thevariation in the data, and the second axis explains 14.8 % of thevariation in the data
950 Extremophiles (2014) 18:945–951
123
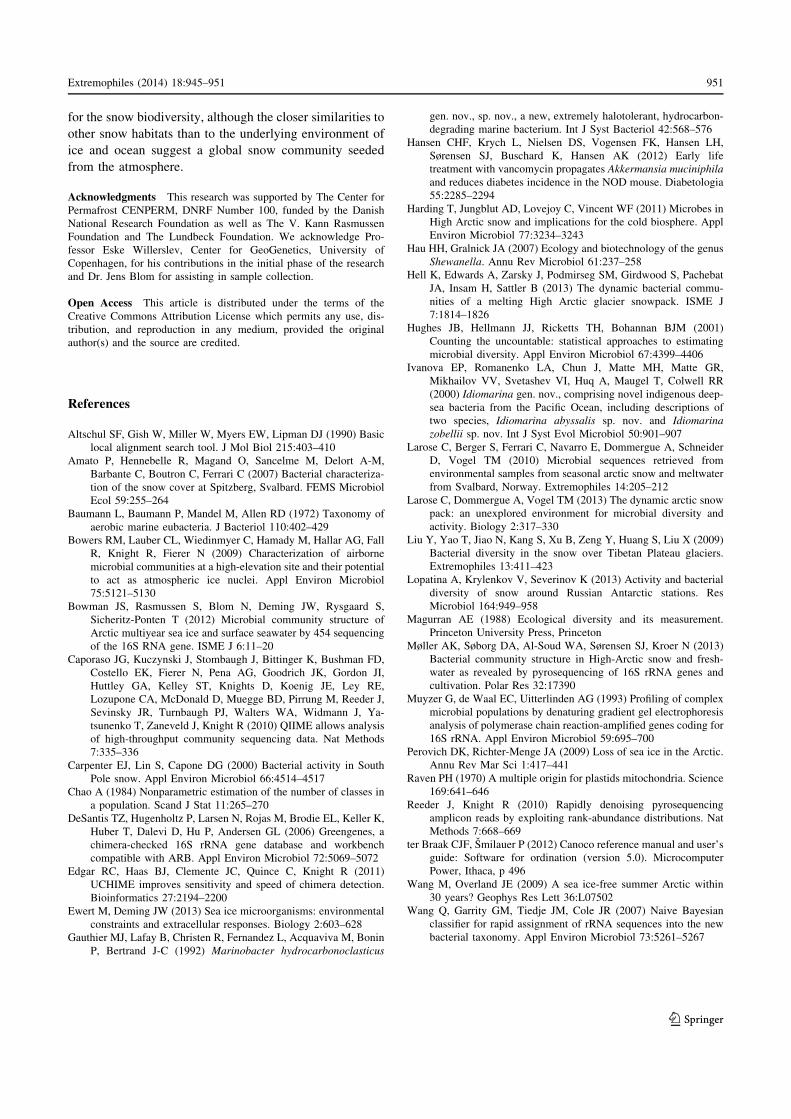
for the snow biodiversity, although the closer similarities to
other snow habitats than to the underlying environment ofice and ocean suggest a global snow community seeded
from the atmosphere.
Acknowledgments This research was supported by The Center forPermafrost CENPERM, DNRF Number 100, funded by the DanishNational Research Foundation as well as The V. Kann RasmussenFoundation and The Lundbeck Foundation. We acknowledge Pro-fessor Eske Willerslev, Center for GeoGenetics, University ofCopenhagen, for his contributions in the initial phase of the researchand Dr. Jens Blom for assisting in sample collection.
Open Access This article is distributed under the terms of theCreative Commons Attribution License which permits any use, dis-tribution, and reproduction in any medium, provided the originalauthor(s) and the source are credited.
References
Altschul SF, Gish W, Miller W, Myers EW, Lipman DJ (1990) Basiclocal alignment search tool. J Mol Biol 215:403–410
Amato P, Hennebelle R, Magand O, Sancelme M, Delort A-M,Barbante C, Boutron C, Ferrari C (2007) Bacterial characteriza-tion of the snow cover at Spitzberg, Svalbard. FEMS MicrobiolEcol 59:255–264
Baumann L, Baumann P, Mandel M, Allen RD (1972) Taxonomy ofaerobic marine eubacteria. J Bacteriol 110:402–429
Bowers RM, Lauber CL, Wiedinmyer C, Hamady M, Hallar AG, FallR, Knight R, Fierer N (2009) Characterization of airbornemicrobial communities at a high-elevation site and their potentialto act as atmospheric ice nuclei. Appl Environ Microbiol75:5121–5130
Bowman JS, Rasmussen S, Blom N, Deming JW, Rysgaard S,Sicheritz-Ponten T (2012) Microbial community structure ofArctic multiyear sea ice and surface seawater by 454 sequencingof the 16S RNA gene. ISME J 6:11–20
Caporaso JG, Kuczynski J, Stombaugh J, Bittinger K, Bushman FD,Costello EK, Fierer N, Pena AG, Goodrich JK, Gordon JI,Huttley GA, Kelley ST, Knights D, Koenig JE, Ley RE,Lozupone CA, McDonald D, Muegge BD, Pirrung M, Reeder J,Sevinsky JR, Turnbaugh PJ, Walters WA, Widmann J, Ya-tsunenko T, Zaneveld J, Knight R (2010) QIIME allows analysisof high-throughput community sequencing data. Nat Methods7:335–336
Carpenter EJ, Lin S, Capone DG (2000) Bacterial activity in SouthPole snow. Appl Environ Microbiol 66:4514–4517
Chao A (1984) Nonparametric estimation of the number of classes ina population. Scand J Stat 11:265–270
DeSantis TZ, Hugenholtz P, Larsen N, Rojas M, Brodie EL, Keller K,Huber T, Dalevi D, Hu P, Andersen GL (2006) Greengenes, achimera-checked 16S rRNA gene database and workbenchcompatible with ARB. Appl Environ Microbiol 72:5069–5072
Edgar RC, Haas BJ, Clemente JC, Quince C, Knight R (2011)UCHIME improves sensitivity and speed of chimera detection.Bioinformatics 27:2194–2200
Ewert M, Deming JW (2013) Sea ice microorganisms: environmentalconstraints and extracellular responses. Biology 2:603–628
Gauthier MJ, Lafay B, Christen R, Fernandez L, Acquaviva M, BoninP, Bertrand J-C (1992) Marinobacter hydrocarbonoclasticus
gen. nov., sp. nov., a new, extremely halotolerant, hydrocarbon-degrading marine bacterium. Int J Syst Bacteriol 42:568–576
Hansen CHF, Krych L, Nielsen DS, Vogensen FK, Hansen LH,Sørensen SJ, Buschard K, Hansen AK (2012) Early lifetreatment with vancomycin propagates Akkermansia muciniphilaand reduces diabetes incidence in the NOD mouse. Diabetologia55:2285–2294
Harding T, Jungblut AD, Lovejoy C, Vincent WF (2011) Microbes inHigh Arctic snow and implications for the cold biosphere. ApplEnviron Microbiol 77:3234–3243
Hau HH, Gralnick JA (2007) Ecology and biotechnology of the genusShewanella. Annu Rev Microbiol 61:237–258
Hell K, Edwards A, Zarsky J, Podmirseg SM, Girdwood S, PachebatJA, Insam H, Sattler B (2013) The dynamic bacterial commu-nities of a melting High Arctic glacier snowpack. ISME J7:1814–1826
Hughes JB, Hellmann JJ, Ricketts TH, Bohannan BJM (2001)Counting the uncountable: statistical approaches to estimatingmicrobial diversity. Appl Environ Microbiol 67:4399–4406
Ivanova EP, Romanenko LA, Chun J, Matte MH, Matte GR,Mikhailov VV, Svetashev VI, Huq A, Maugel T, Colwell RR(2000) Idiomarina gen. nov., comprising novel indigenous deep-sea bacteria from the Pacific Ocean, including descriptions oftwo species, Idiomarina abyssalis sp. nov. and Idiomarinazobellii sp. nov. Int J Syst Evol Microbiol 50:901–907
Larose C, Berger S, Ferrari C, Navarro E, Dommergue A, SchneiderD, Vogel TM (2010) Microbial sequences retrieved fromenvironmental samples from seasonal arctic snow and meltwaterfrom Svalbard, Norway. Extremophiles 14:205–212
Larose C, Dommergue A, Vogel TM (2013) The dynamic arctic snowpack: an unexplored environment for microbial diversity andactivity. Biology 2:317–330
Liu Y, Yao T, Jiao N, Kang S, Xu B, Zeng Y, Huang S, Liu X (2009)Bacterial diversity in the snow over Tibetan Plateau glaciers.Extremophiles 13:411–423
Lopatina A, Krylenkov V, Severinov K (2013) Activity and bacterialdiversity of snow around Russian Antarctic stations. ResMicrobiol 164:949–958
Magurran AE (1988) Ecological diversity and its measurement.Princeton University Press, Princeton
Møller AK, Søborg DA, Al-Soud WA, Sørensen SJ, Kroer N (2013)Bacterial community structure in High-Arctic snow and fresh-water as revealed by pyrosequencing of 16S rRNA genes andcultivation. Polar Res 32:17390
Muyzer G, de Waal EC, Uitterlinden AG (1993) Profiling of complexmicrobial populations by denaturing gradient gel electrophoresisanalysis of polymerase chain reaction-amplified genes coding for16S rRNA. Appl Environ Microbiol 59:695–700
Perovich DK, Richter-Menge JA (2009) Loss of sea ice in the Arctic.Annu Rev Mar Sci 1:417–441
Raven PH (1970) A multiple origin for plastids mitochondria. Science169:641–646
Reeder J, Knight R (2010) Rapidly denoising pyrosequencingamplicon reads by exploiting rank-abundance distributions. NatMethods 7:668–669
ter Braak CJF, Smilauer P (2012) Canoco reference manual and user’sguide: Software for ordination (version 5.0). MicrocomputerPower, Ithaca, p 496
Wang M, Overland JE (2009) A sea ice-free summer Arctic within30 years? Geophys Res Lett 36:L07502
Wang Q, Garrity GM, Tiedje JM, Cole JR (2007) Naive Bayesianclassifier for rapid assignment of rRNA sequences into the newbacterial taxonomy. Appl Environ Microbiol 73:5261–5267
Extremophiles (2014) 18:945–951 951
123
" " "" " "
"" " " 37"
2.2 Freshwater Networks and the Cryosphere
Freshwater networks and in particular riverine networks make good model systems for
microbial biogeography, as there is one obvious and dominating direction of transport,
along the water flow. This gives a good starting point for making hypotheses and testing
these. Consequently, NGS-based studies of freshwater networks linked to the cryosphere
have resulted in the formulation of solid hypotheses about biogeography of microbial
communities in these systems.
One established hypothesis about freshwater networks is the origin of the riverine
microbial community from the upstream terrestrial environment.
The diversity of microbial communities in a freshwater system in Alaska showed a uni-
directional decreasing pattern in diversity (Crump, Amaral-Zettler, and Kling 2012).
Diversity was highest in soil waters upstream and decreased downstream in larger
streams and rivers (Crump, Amaral-Zettler, and Kling 2012). This lead to the hypothesis
that freshwater microbial communities originate in upstream terrestrial environments, and
the microbes that enter the network at the top are sorted downstream resulting in
gradually decreasing diversity. This was confirmed in a recent extensive study of a boreal
freshwater system in Eastern Quebec (Ruiz-González, Niño-Garcia, and del Giorgio
2015). This study showed selection by the environment in that microbes from soil were
numerically dominant along the freshwater network and microbes that were rare in soil
became increasingly abundant downstream, resulting also in a lower diversity
downstream (Ruiz-González, Niño-Garcia, and del Giorgio 2015).
Another closely linked hypothesis in freshwater networks is the interaction of two
dominating forces that shape microbial communities in riverine systems. Water residence
time (WRT) is hypothesized to be a major determinant for the relative influence of
hydrology and local sorting (Niño-García, Ruiz-González, and del Giorgio 2016; Nelson,
Sadro, and Melack 2009). Hydrology results in a mass-effect through mass-transport of
microbial communities and local environmental factors cause selection by the
environment (Niño-García, Ruiz-González, and del Giorgio 2016; Nelson, Sadro, and
Melack 2009). Longer WRT enables the sorting of species, i.e. selection by the
environment. Meanwhile in waters with short WRT local sorting will have less influence

"
"38"
compared to hydrology (Niño-García, Ruiz-González, and del Giorgio 2016; Nelson,
Sadro, and Melack 2009).
In summary, NGS studies of freshwater networks have shown that indeed the
environment selects and that this force interacts with large-scale transportation in
structuring the microbial communities of freshwater networks, which originate from
terrestrial microbial communities.
PAPER II: Upstream Freshwater and Terrestrial Sources Are Differentially
Reflected in the Bacterial Community Structure along a Small Arctic River and Its
Estuary
This research paper deals with the diversity and community composition of a freshwater
network on the Disko Island off the West coast of Greenland (69°N). The network
consists of a main river, the Red River, and the input from a proglacial lake and a glacier
stream as well as the downstream estuary. Samples were assessed through amplicon
sequencing of the 16S rRNA gene.
Prior to this paper several recent papers had established the importance of soil microbes
in freshwater systems connected to the cryosphere (Niño-García, Ruiz-González, and del
Giorgio 2016; Ruiz-González, Niño-Garcia, and del Giorgio 2015; Crump, Amaral-
Zettler, and Kling 2012). In this paper we established the addition of microbial
communities from the cryosphere to an Arctic freshwater network, with communities
coming from a proglacial lake and a glacier stream.
These results had several implications: First, the pattern of diversity found in the
Red River freshwater network did not resemble the otherwise established diversity-
pattern of freshwater networks. Our results showed a low diversity in the glacier stream
coming into the Red River, which contrasted previous results where soil microbes
resulted in higher diversity in smaller streams (Ruiz-González, Niño-Garcia, and del
Giorgio 2015; Crump, Amaral-Zettler, and Kling 2012).
Second, the results have important implications for the role of freshwater networks
connected to the cryosphere. Increasing temperatures and concurring increases in melting
" " "" " "
"" " " 39"
of the cryosphere will result in an even greater influence from these sources on
freshwater networks.
The results from Paper II also illustrated the value of assessing Indicator Species, as
previously described in part I (Ramette and Tiedje 2007).
Through the calculation of Indicator Species from samples along the river it was possible
to identify Indicator OTUs that could be assessed in detail and which gave important
information about the distribution of microbes in the Red River network. Through
assessment of Indicator OTUs it was possible to clearly visualize the low abundance of
these OTUs in the downstream river and the surprising high abundance further into the
estuary. Indicator OTUs from the river showed to make up on average a quarter of the
microbial community in the estuary. Furthermore, this study highlighted the importance
of proper sampling for microbial biogeography studies. Microbial communities in the
Red River microbiome that originated from the proglacial lake and glacier stream were
visible only close to the input sites and not at the river mouth. If these sites had not been
sampled it would not have been possible to know that such a large part of the estuary
community was indeed similar to microbes from the river.
Paper II demonstrated the potential use of NGS data from microbial communities as
living tracers in ecosystems at a large scale. The genetic signature of microbial
communities in the environment can act as both tracers of transport in a large scale and
simultaneously give indications of adaptation at a local scale. This has implications for
use not only in microbial ecology but also in geomorphology in assessing connectivity in
the landscape.
Lastly, this paper is an example of a study in which the use of 16S rRNA gene amplicon
sequencing was the optimal choice for testing the hypotheses and research questions. To
properly test our hypotheses we needed to be able to compare diversity parameters. This
is possible only with amplicon sequencing as discussed in part I. Also we utilized the
potential of the signature from 16S rRNA gene sequences as traceable markers.
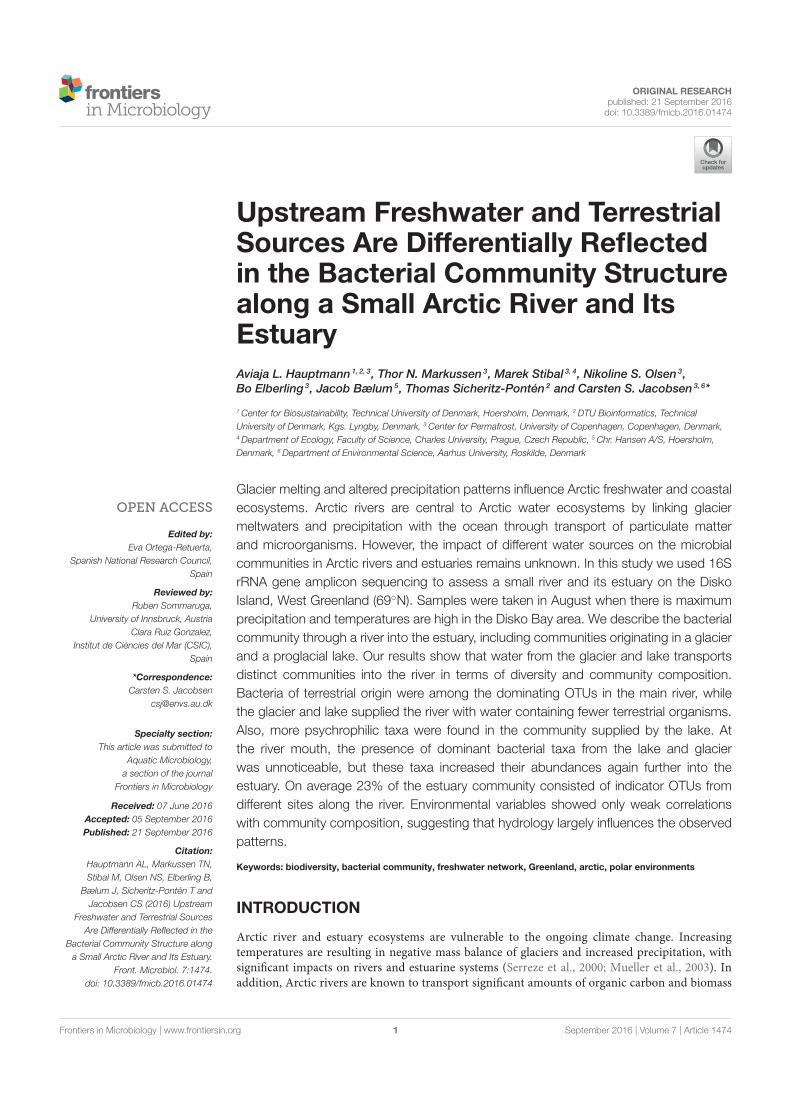
ORIGINAL RESEARCHpublished: 21 September 2016doi: 10.3389/fmicb.2016.01474
Frontiers in Microbiology | www.frontiersin.org 1 September 2016 | Volume 7 | Article 1474
Edited by:
Eva Ortega-Retuerta,
Spanish National Research Council,
Spain
Reviewed by:
Ruben Sommaruga,
University of Innsbruck, Austria
Clara Ruiz Gonzalez,
Institut de Ciències del Mar (CSIC),
Spain
*Correspondence:
Carsten S. Jacobsen
Specialty section:
This article was submitted to
Aquatic Microbiology,
a section of the journal
Frontiers in Microbiology
Received: 07 June 2016
Accepted: 05 September 2016
Published: 21 September 2016
Citation:
Hauptmann AL, Markussen TN,
Stibal M, Olsen NS, Elberling B,
Bælum J, Sicheritz-Pontén T and
Jacobsen CS (2016) Upstream
Freshwater and Terrestrial Sources
Are Differentially Reflected in the
Bacterial Community Structure along
a Small Arctic River and Its Estuary.
Front. Microbiol. 7:1474.
doi: 10.3389/fmicb.2016.01474
Upstream Freshwater and TerrestrialSources Are Differentially Reflectedin the Bacterial Community Structurealong a Small Arctic River and ItsEstuaryAviaja L. Hauptmann1, 2, 3, Thor N. Markussen3, Marek Stibal 3, 4, Nikoline S. Olsen 3,Bo Elberling 3, Jacob Bælum5, Thomas Sicheritz-Pontén 2 and Carsten S. Jacobsen3, 6*
1 Center for Biosustainability, Technical University of Denmark, Hoersholm, Denmark, 2 DTU Bioinformatics, Technical
University of Denmark, Kgs. Lyngby, Denmark, 3 Center for Permafrost, University of Copenhagen, Copenhagen, Denmark,4 Department of Ecology, Faculty of Science, Charles University, Prague, Czech Republic, 5 Chr. Hansen A/S, Hoersholm,
Denmark, 6 Department of Environmental Science, Aarhus University, Roskilde, Denmark
Glacier melting and altered precipitation patterns influence Arctic freshwater and coastal
ecosystems. Arctic rivers are central to Arctic water ecosystems by linking glacier
meltwaters and precipitation with the ocean through transport of particulate matter
and microorganisms. However, the impact of different water sources on the microbial
communities in Arctic rivers and estuaries remains unknown. In this study we used 16S
rRNA gene amplicon sequencing to assess a small river and its estuary on the Disko
Island, West Greenland (69◦N). Samples were taken in August when there is maximum
precipitation and temperatures are high in the Disko Bay area. We describe the bacterial
community through a river into the estuary, including communities originating in a glacier
and a proglacial lake. Our results show that water from the glacier and lake transports
distinct communities into the river in terms of diversity and community composition.
Bacteria of terrestrial origin were among the dominating OTUs in the main river, while
the glacier and lake supplied the river with water containing fewer terrestrial organisms.
Also, more psychrophilic taxa were found in the community supplied by the lake. At
the river mouth, the presence of dominant bacterial taxa from the lake and glacier
was unnoticeable, but these taxa increased their abundances again further into the
estuary. On average 23% of the estuary community consisted of indicator OTUs from
different sites along the river. Environmental variables showed only weak correlations
with community composition, suggesting that hydrology largely influences the observed
patterns.
Keywords: biodiversity, bacterial community, freshwater network, Greenland, arctic, polar environments
INTRODUCTION
Arctic river and estuary ecosystems are vulnerable to the ongoing climate change. Increasingtemperatures are resulting in negative mass balance of glaciers and increased precipitation, withsignificant impacts on rivers and estuarine systems (Serreze et al., 2000; Mueller et al., 2003). Inaddition, Arctic rivers are known to transport significant amounts of organic carbon and biomass

Hauptmann et al. Red River’s Bacterial Communities
from permafrost and glacier ecosystems into the Arctic oceansand are therefore important factors in global climate changemodels (Kling et al., 1991; Guo et al., 2007; Lawson et al.,2014; Hawkings et al., 2015). Higher river flow associated withthe warming climate may result in a more river-dominatedcommunity in the estuaries (Fortunato et al., 2013). Once riverinebacteria reach the estuary, they may influence local nutrientcycling through biofilm formation and forming aggregates (flocs;Decho, 2000). Thus, bacterial communities dispersed throughArctic riverine systems may be important for biogeochemicalcycling processes in Arctic estuarine and coastal ecosystems.
There are a number of studies on Arctic estuarineecosystems focused on biodiversity, biological productivity,seasonal variability, food web interactions, and responses toenvironmental variables (Galand et al., 2006, 2008; Wellset al., 2006; Vallieres et al., 2008; Fortunato et al., 2012, 2013).However, the river communities have usually been assessedas a whole. How different communities added to the riveraffect the estuarine community has not been addressed todate. While previous studies have shown that increased riverflow alters Arctic river and estuary communities in seasonalpatterns (Crump et al., 2009; Fortunato et al., 2012, 2013), itis yet unknown how upstream sources of freshwater microbialcommunities influence these communities.
A few recent studies on freshwater ecosystems at differentspatial scales have greatly increased our understanding of thebiogeography of riverine networks (Nelson et al., 2009; Crumpet al., 2012, 2007; Ruiz-González et al., 2015; Niño-Garcíaet al., 2016). These studies have shown that biogeographicpatterns of bacterioplankton communities are a result of theinteraction between local environmental variables and mass-effects. Furthermore, that mass-effects are determined by thehydrology as well as the position along the network (Crumpet al., 2007, 2012; Nelson et al., 2009; Ruiz-González et al., 2015;Niño-García et al., 2016).
Water residence time (WRT) has shown to be an importantfactor for determining the relative influence of hydrology vs. localsorting (Niño-García et al., 2016). There seems to be a greaterinfluence from hydrology and mass-effects in systems with shortWRT and a greater influence from local sorting in systems withlong WRT (Niño-García et al., 2016). Longer WRT in lakesand larger rivers compared to smaller streams consequentlyresults in less diverse communities due to local sorting (Niño-García et al., 2016). In this way, hydrology and local sortinginteract and result in a uni-directional pattern of graduallydecreasing diversity from smaller streams to larger rivers andlakes (Niño-García et al., 2016). Furthermore, beyond a WRTof 10 days hydrology has been shown to have no additionalimpact on the structuring of the microbial community (Niño-García et al., 2016). The importance of WRT for selecting lake-specific phylotypes in a freshwater network was also highlightedin another study (Nelson et al., 2009). The study showed lesssimilarity between the microbial community in the inlet andthe outlet of a headwater lake compared to the inlets and theoutlets of downstream lakes. This indicates that the first lakeselects for a lake-specific community, which is then transporteddownstream in the network (Nelson et al., 2009). These results
also illustrated the importance of the position along the networkfor understanding the bacterial community structure (Nelsonet al., 2009). As the position of water bodies in the systemmight be a key factor for determining the structure of themicrobial community at that particular position, the right spatialresolution is important for understanding the structural changesthe microbial community undergoes along a freshwater network.
Together with WRT a terrestrial seed bank for freshwaternetworks also seem to result in a uni-directional structure ofthe microbial community (Crump et al., 2012; Ruiz-Gonzálezet al., 2015). In the catchment of the Toolik Lake, Alaska,a clear pattern of decreasing diversity was shown from soilwaters farthest upstream with highest species richness throughheadwater streams and lastly to lowest richness in lake water(Crump et al., 2012). OTUs originating in soil were numericallydominant throughout a freshwater network in the Eastern borealregion of Québec, Canada, and certain OTUs that were rare insoil were shown to increase in number and become dominant inthe downstream freshwater environments (Ruiz-González et al.,2015). These studies indicate that an initial inoculation from soilat the beginning of a freshwater network is followed by a species-sorting process downstream (Crump et al., 2012; Ruiz-Gonzálezet al., 2015).
On a large spatial scale the uni-directional pattern ofdecreasingmicrobial diversity along a rivermight be explained bythe common origin from a highly diverse terrestrial community(Ruiz-González et al., 2015) and by increasing local sorting(Niño-García et al., 2016). However, there might be anotherpattern on a smaller spatial scale revealed with higher resolution.Higher resolution of samples along a freshwater network mightreveal the input of new microbial taxa of different origin alongthe freshwater network. Input of new taxa along a networkcould result in a different structuring pattern of the microbialcommunity, which is not uni-directional. The addition of newmicrobial communities along a freshwater network would beparticularly clear in smaller networks where input makes up alarger fraction of the downstream water body. This also impliesthat in larger networks, the downstream community mightmask new communities added along the network. Therefore,river communities on a small spatial scale may show not tohave a uni-directional structure, explained by seeding withnew microbial communities along the network. Furthermore,it is yet unknown whether the spatial directionality describedabove extends into saline waters or whether the very differentenvironmental conditions met by the riverine community in theestuary result in a different pattern of the microbial network.
We address the question of how the bacterial communitiesfrom the Red River, a small river on the Disko Island, WestGreenland (69◦N) are structured at the small spatial scale,by comparing bacterial communities from five sites along theriver including input sites from a glacier and a proglacial lake.We investigate whether the structure of the riverine bacterialcommunities can help explain the structure of the estuarycommunities by including 23 samples through three transects ofthe Red River estuary.
Sampling was done in 2013 in August when precipitationevents are common and the permafrost active layer thickness
Frontiers in Microbiology | www.frontiersin.org 2 September 2016 | Volume 7 | Article 1474
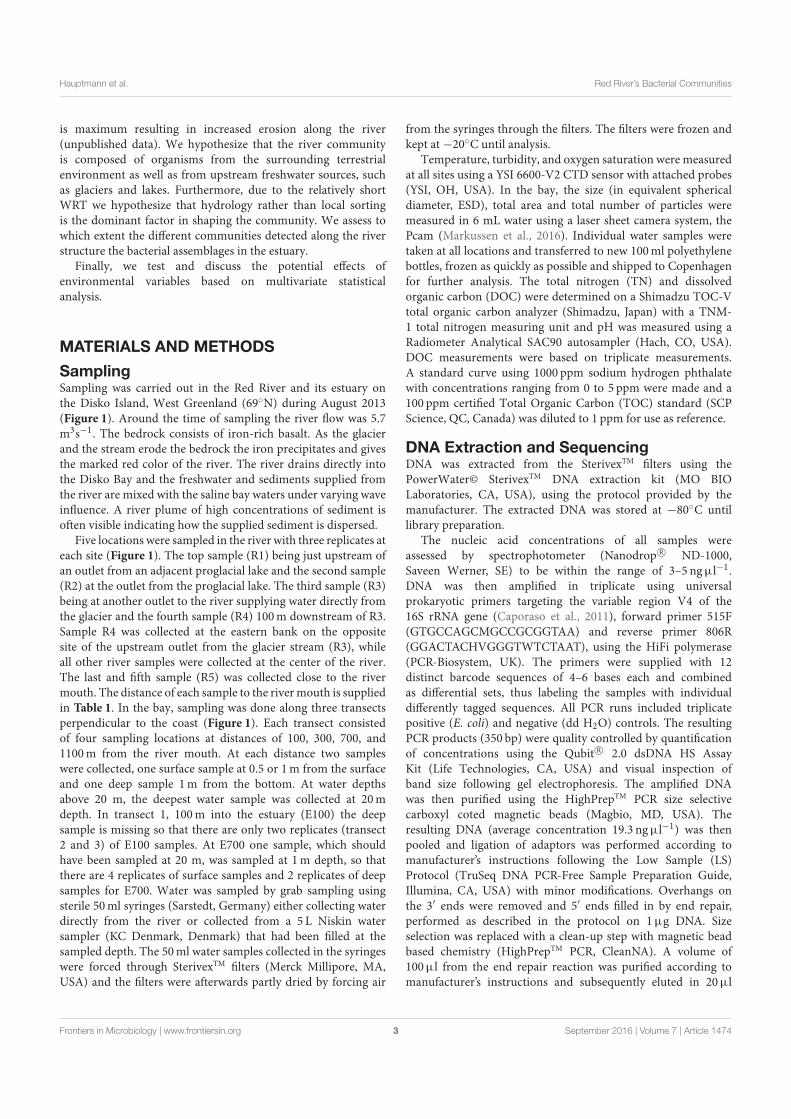
Hauptmann et al. Red River’s Bacterial Communities
is maximum resulting in increased erosion along the river(unpublished data). We hypothesize that the river communityis composed of organisms from the surrounding terrestrialenvironment as well as from upstream freshwater sources, suchas glaciers and lakes. Furthermore, due to the relatively shortWRT we hypothesize that hydrology rather than local sortingis the dominant factor in shaping the community. We assess towhich extent the different communities detected along the riverstructure the bacterial assemblages in the estuary.
Finally, we test and discuss the potential effects ofenvironmental variables based on multivariate statisticalanalysis.
MATERIALS AND METHODS
SamplingSampling was carried out in the Red River and its estuary onthe Disko Island, West Greenland (69◦N) during August 2013(Figure 1). Around the time of sampling the river flow was 5.7m3s−1. The bedrock consists of iron-rich basalt. As the glacierand the stream erode the bedrock the iron precipitates and givesthe marked red color of the river. The river drains directly intothe Disko Bay and the freshwater and sediments supplied fromthe river are mixed with the saline bay waters under varying waveinfluence. A river plume of high concentrations of sediment isoften visible indicating how the supplied sediment is dispersed.
Five locations were sampled in the river with three replicates ateach site (Figure 1). The top sample (R1) being just upstream ofan outlet from an adjacent proglacial lake and the second sample(R2) at the outlet from the proglacial lake. The third sample (R3)being at another outlet to the river supplying water directly fromthe glacier and the fourth sample (R4) 100m downstream of R3.Sample R4 was collected at the eastern bank on the oppositesite of the upstream outlet from the glacier stream (R3), whileall other river samples were collected at the center of the river.The last and fifth sample (R5) was collected close to the rivermouth. The distance of each sample to the rivermouth is suppliedin Table 1. In the bay, sampling was done along three transectsperpendicular to the coast (Figure 1). Each transect consistedof four sampling locations at distances of 100, 300, 700, and1100m from the river mouth. At each distance two sampleswere collected, one surface sample at 0.5 or 1m from the surfaceand one deep sample 1m from the bottom. At water depthsabove 20 m, the deepest water sample was collected at 20mdepth. In transect 1, 100m into the estuary (E100) the deepsample is missing so that there are only two replicates (transect2 and 3) of E100 samples. At E700 one sample, which shouldhave been sampled at 20 m, was sampled at 1m depth, so thatthere are 4 replicates of surface samples and 2 replicates of deepsamples for E700. Water was sampled by grab sampling usingsterile 50ml syringes (Sarstedt, Germany) either collecting waterdirectly from the river or collected from a 5 L Niskin watersampler (KC Denmark, Denmark) that had been filled at thesampled depth. The 50ml water samples collected in the syringeswere forced through SterivexTM filters (Merck Millipore, MA,USA) and the filters were afterwards partly dried by forcing air
from the syringes through the filters. The filters were frozen andkept at−20◦C until analysis.
Temperature, turbidity, and oxygen saturation were measuredat all sites using a YSI 6600-V2 CTD sensor with attached probes(YSI, OH, USA). In the bay, the size (in equivalent sphericaldiameter, ESD), total area and total number of particles weremeasured in 6 mL water using a laser sheet camera system, thePcam (Markussen et al., 2016). Individual water samples weretaken at all locations and transferred to new 100ml polyethylenebottles, frozen as quickly as possible and shipped to Copenhagenfor further analysis. The total nitrogen (TN) and dissolvedorganic carbon (DOC) were determined on a Shimadzu TOC-Vtotal organic carbon analyzer (Shimadzu, Japan) with a TNM-1 total nitrogen measuring unit and pH was measured using aRadiometer Analytical SAC90 autosampler (Hach, CO, USA).DOC measurements were based on triplicate measurements.A standard curve using 1000 ppm sodium hydrogen phthalatewith concentrations ranging from 0 to 5 ppm were made and a100 ppm certified Total Organic Carbon (TOC) standard (SCPScience, QC, Canada) was diluted to 1 ppm for use as reference.
DNA Extraction and SequencingDNA was extracted from the SterivexTM filters using thePowerWater© SterivexTM DNA extraction kit (MO BIOLaboratories, CA, USA), using the protocol provided by themanufacturer. The extracted DNA was stored at −80◦C untillibrary preparation.
The nucleic acid concentrations of all samples wereassessed by spectrophotometer (Nanodrop R⃝ ND-1000,Saveen Werner, SE) to be within the range of 3–5 ngµl−1.DNA was then amplified in triplicate using universalprokaryotic primers targeting the variable region V4 of the16S rRNA gene (Caporaso et al., 2011), forward primer 515F(GTGCCAGCMGCCGCGGTAA) and reverse primer 806R(GGACTACHVGGGTWTCTAAT), using the HiFi polymerase(PCR-Biosystem, UK). The primers were supplied with 12distinct barcode sequences of 4–6 bases each and combinedas differential sets, thus labeling the samples with individualdifferently tagged sequences. All PCR runs included triplicatepositive (E. coli) and negative (dd H2O) controls. The resultingPCR products (350 bp) were quality controlled by quantificationof concentrations using the Qubit R⃝ 2.0 dsDNA HS AssayKit (Life Technologies, CA, USA) and visual inspection ofband size following gel electrophoresis. The amplified DNAwas then purified using the HighPrepTM PCR size selectivecarboxyl coted magnetic beads (Magbio, MD, USA). Theresulting DNA (average concentration 19.3 ngµl−1) was thenpooled and ligation of adaptors was performed according tomanufacturer’s instructions following the Low Sample (LS)Protocol (TruSeq DNA PCR-Free Sample Preparation Guide,Illumina, CA, USA) with minor modifications. Overhangs onthe 3′ ends were removed and 5′ ends filled in by end repair,performed as described in the protocol on 1µg DNA. Sizeselection was replaced with a clean-up step with magnetic beadbased chemistry (HighPrepTM PCR, CleanNA). A volume of100µl from the end repair reaction was purified according tomanufacturer’s instructions and subsequently eluted in 20µl
Frontiers in Microbiology | www.frontiersin.org 3 September 2016 | Volume 7 | Article 1474
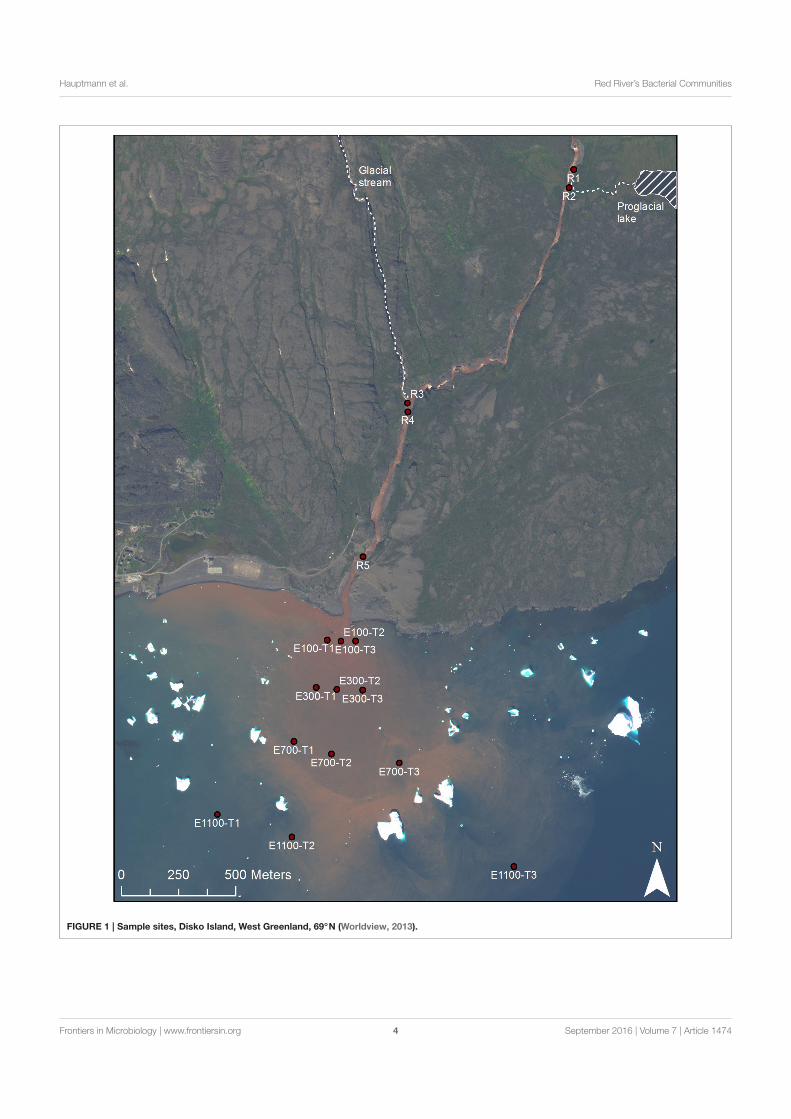
Hauptmann et al. Red River’s Bacterial Communities
FIGURE 1 | Sample sites, Disko Island, West Greenland, 69◦N (Worldview, 2013).
Frontiers in Microbiology | www.frontiersin.org 4 September 2016 | Volume 7 | Article 1474
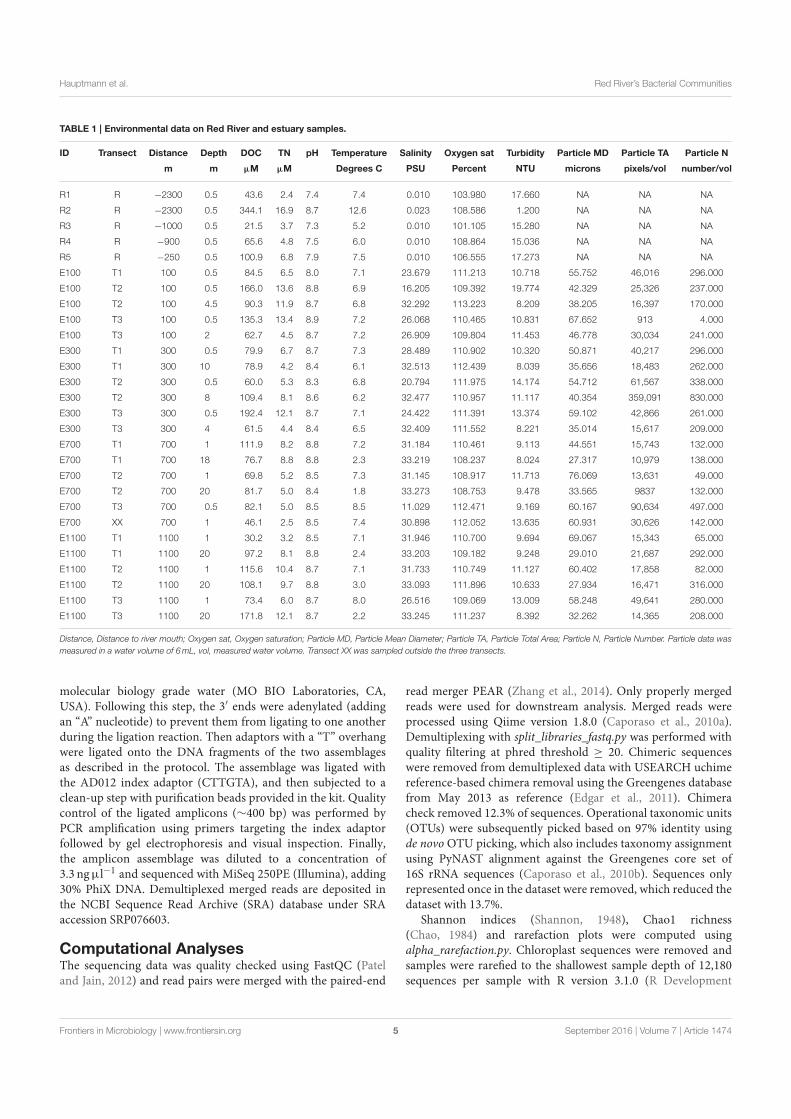
Hauptmann et al. Red River’s Bacterial Communities
TABLE 1 | Environmental data on Red River and estuary samples.
ID Transect Distance Depth DOC TN pH Temperature Salinity Oxygen sat Turbidity Particle MD Particle TA Particle N
m m µM µM Degrees C PSU Percent NTU microns pixels/vol number/vol
R1 R −2300 0.5 43.6 2.4 7.4 7.4 0.010 103.980 17.660 NA NA NA
R2 R −2300 0.5 344.1 16.9 8.7 12.6 0.023 108.586 1.200 NA NA NA
R3 R −1000 0.5 21.5 3.7 7.3 5.2 0.010 101.105 15.280 NA NA NA
R4 R −900 0.5 65.6 4.8 7.5 6.0 0.010 108.864 15.036 NA NA NA
R5 R −250 0.5 100.9 6.8 7.9 7.5 0.010 106.555 17.273 NA NA NA
E100 T1 100 0.5 84.5 6.5 8.0 7.1 23.679 111.213 10.718 55.752 46,016 296.000
E100 T2 100 0.5 166.0 13.6 8.8 6.9 16.205 109.392 19.774 42.329 25,326 237.000
E100 T2 100 4.5 90.3 11.9 8.7 6.8 32.292 113.223 8.209 38.205 16,397 170.000
E100 T3 100 0.5 135.3 13.4 8.9 7.2 26.068 110.465 10.831 67.652 913 4.000
E100 T3 100 2 62.7 4.5 8.7 7.2 26.909 109.804 11.453 46.778 30,034 241.000
E300 T1 300 0.5 79.9 6.7 8.7 7.3 28.489 110.902 10.320 50.871 40,217 296.000
E300 T1 300 10 78.9 4.2 8.4 6.1 32.513 112.439 8.039 35.656 18,483 262.000
E300 T2 300 0.5 60.0 5.3 8.3 6.8 20.794 111.975 14.174 54.712 61,567 338.000
E300 T2 300 8 109.4 8.1 8.6 6.2 32.477 110.957 11.117 40.354 359,091 830.000
E300 T3 300 0.5 192.4 12.1 8.7 7.1 24.422 111.391 13.374 59.102 42,866 261.000
E300 T3 300 4 61.5 4.4 8.4 6.5 32.409 111.552 8.221 35.014 15,617 209.000
E700 T1 700 1 111.9 8.2 8.8 7.2 31.184 110.461 9.113 44.551 15,743 132.000
E700 T1 700 18 76.7 8.8 8.8 2.3 33.219 108.237 8.024 27.317 10,979 138.000
E700 T2 700 1 69.8 5.2 8.5 7.3 31.145 108.917 11.713 76.069 13,631 49.000
E700 T2 700 20 81.7 5.0 8.4 1.8 33.273 108.753 9.478 33.565 9837 132.000
E700 T3 700 0.5 82.1 5.0 8.5 8.5 11.029 112.471 9.169 60.167 90,634 497.000
E700 XX 700 1 46.1 2.5 8.5 7.4 30.898 112.052 13.635 60.931 30,626 142.000
E1100 T1 1100 1 30.2 3.2 8.5 7.1 31.946 110.700 9.694 69.067 15,343 65.000
E1100 T1 1100 20 97.2 8.1 8.8 2.4 33.203 109.182 9.248 29.010 21,687 292.000
E1100 T2 1100 1 115.6 10.4 8.7 7.1 31.733 110.749 11.127 60.402 17,858 82.000
E1100 T2 1100 20 108.1 9.7 8.8 3.0 33.093 111.896 10.633 27.934 16,471 316.000
E1100 T3 1100 1 73.4 6.0 8.7 8.0 26.516 109.069 13.009 58.248 49,641 280.000
E1100 T3 1100 20 171.8 12.1 8.7 2.2 33.245 111.237 8.392 32.262 14,365 208.000
Distance, Distance to river mouth; Oxygen sat, Oxygen saturation; Particle MD, Particle Mean Diameter; Particle TA, Particle Total Area; Particle N, Particle Number. Particle data was
measured in a water volume of 6mL, vol, measured water volume. Transect XX was sampled outside the three transects.
molecular biology grade water (MO BIO Laboratories, CA,USA). Following this step, the 3′ ends were adenylated (addingan “A” nucleotide) to prevent them from ligating to one anotherduring the ligation reaction. Then adaptors with a “T” overhangwere ligated onto the DNA fragments of the two assemblagesas described in the protocol. The assemblage was ligated withthe AD012 index adaptor (CTTGTA), and then subjected to aclean-up step with purification beads provided in the kit. Qualitycontrol of the ligated amplicons (∼400 bp) was performed byPCR amplification using primers targeting the index adaptorfollowed by gel electrophoresis and visual inspection. Finally,the amplicon assemblage was diluted to a concentration of3.3 ngµl−1 and sequenced with MiSeq 250PE (Illumina), adding30% PhiX DNA. Demultiplexed merged reads are deposited inthe NCBI Sequence Read Archive (SRA) database under SRAaccession SRP076603.
Computational AnalysesThe sequencing data was quality checked using FastQC (Pateland Jain, 2012) and read pairs were merged with the paired-end
read merger PEAR (Zhang et al., 2014). Only properly mergedreads were used for downstream analysis. Merged reads wereprocessed using Qiime version 1.8.0 (Caporaso et al., 2010a).Demultiplexing with split_libraries_fastq.py was performed withquality filtering at phred threshold ≥ 20. Chimeric sequenceswere removed from demultiplexed data with USEARCH uchimereference-based chimera removal using the Greengenes databasefrom May 2013 as reference (Edgar et al., 2011). Chimeracheck removed 12.3% of sequences. Operational taxonomic units(OTUs) were subsequently picked based on 97% identity usingde novo OTU picking, which also includes taxonomy assignmentusing PyNAST alignment against the Greengenes core set of16S rRNA sequences (Caporaso et al., 2010b). Sequences onlyrepresented once in the dataset were removed, which reduced thedataset with 13.7%.
Shannon indices (Shannon, 1948), Chao1 richness(Chao, 1984) and rarefaction plots were computed usingalpha_rarefaction.py. Chloroplast sequences were removed andsamples were rarefied to the shallowest sample depth of 12,180sequences per sample with R version 3.1.0 (R Development
Frontiers in Microbiology | www.frontiersin.org 5 September 2016 | Volume 7 | Article 1474
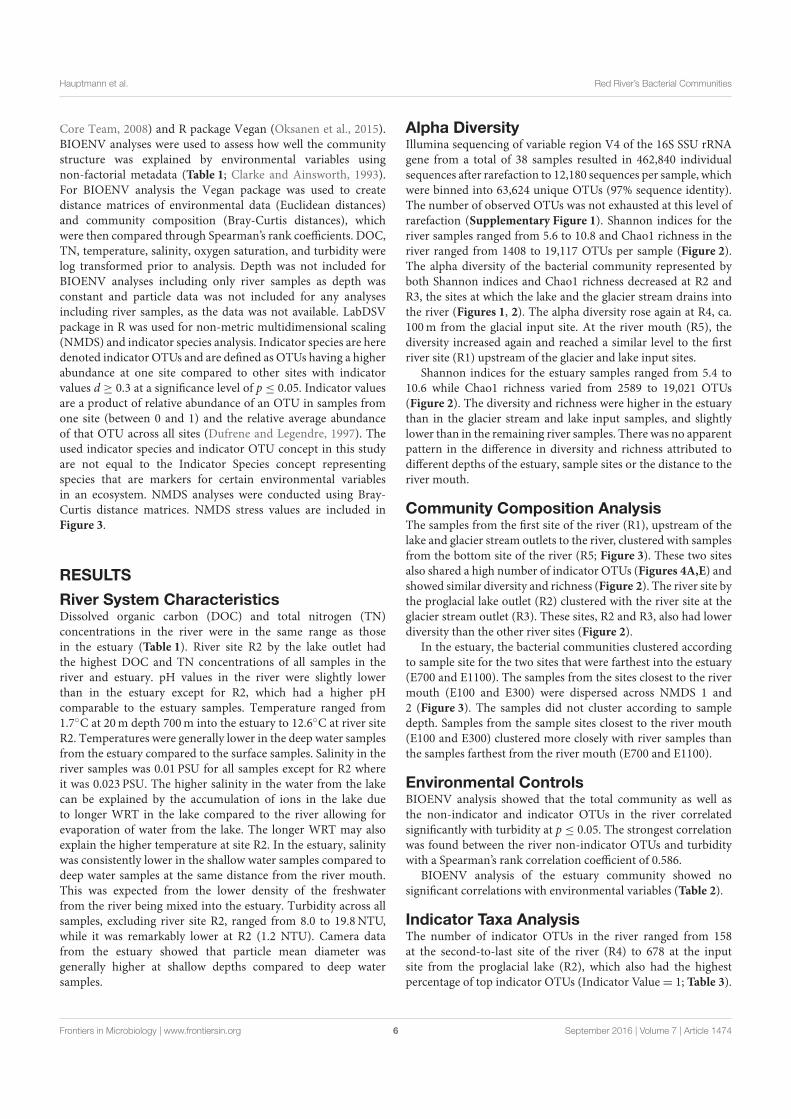
Hauptmann et al. Red River’s Bacterial Communities
Core Team, 2008) and R package Vegan (Oksanen et al., 2015).BIOENV analyses were used to assess how well the communitystructure was explained by environmental variables usingnon-factorial metadata (Table 1; Clarke and Ainsworth, 1993).For BIOENV analysis the Vegan package was used to createdistance matrices of environmental data (Euclidean distances)and community composition (Bray-Curtis distances), whichwere then compared through Spearman’s rank coefficients. DOC,TN, temperature, salinity, oxygen saturation, and turbidity werelog transformed prior to analysis. Depth was not included forBIOENV analyses including only river samples as depth wasconstant and particle data was not included for any analysesincluding river samples, as the data was not available. LabDSVpackage in R was used for non-metric multidimensional scaling(NMDS) and indicator species analysis. Indicator species are heredenoted indicator OTUs and are defined as OTUs having a higherabundance at one site compared to other sites with indicatorvalues d ≥ 0.3 at a significance level of p ≤ 0.05. Indicator valuesare a product of relative abundance of an OTU in samples fromone site (between 0 and 1) and the relative average abundanceof that OTU across all sites (Dufrene and Legendre, 1997). Theused indicator species and indicator OTU concept in this studyare not equal to the Indicator Species concept representingspecies that are markers for certain environmental variablesin an ecosystem. NMDS analyses were conducted using Bray-Curtis distance matrices. NMDS stress values are included inFigure 3.
RESULTS
River System CharacteristicsDissolved organic carbon (DOC) and total nitrogen (TN)concentrations in the river were in the same range as thosein the estuary (Table 1). River site R2 by the lake outlet hadthe highest DOC and TN concentrations of all samples in theriver and estuary. pH values in the river were slightly lowerthan in the estuary except for R2, which had a higher pHcomparable to the estuary samples. Temperature ranged from1.7◦C at 20m depth 700m into the estuary to 12.6◦C at river siteR2. Temperatures were generally lower in the deep water samplesfrom the estuary compared to the surface samples. Salinity in theriver samples was 0.01 PSU for all samples except for R2 whereit was 0.023 PSU. The higher salinity in the water from the lakecan be explained by the accumulation of ions in the lake dueto longer WRT in the lake compared to the river allowing forevaporation of water from the lake. The longer WRT may alsoexplain the higher temperature at site R2. In the estuary, salinitywas consistently lower in the shallow water samples compared todeep water samples at the same distance from the river mouth.This was expected from the lower density of the freshwaterfrom the river being mixed into the estuary. Turbidity across allsamples, excluding river site R2, ranged from 8.0 to 19.8NTU,while it was remarkably lower at R2 (1.2 NTU). Camera datafrom the estuary showed that particle mean diameter wasgenerally higher at shallow depths compared to deep watersamples.
Alpha DiversityIllumina sequencing of variable region V4 of the 16S SSU rRNAgene from a total of 38 samples resulted in 462,840 individualsequences after rarefaction to 12,180 sequences per sample, whichwere binned into 63,624 unique OTUs (97% sequence identity).The number of observed OTUs was not exhausted at this level ofrarefaction (Supplementary Figure 1). Shannon indices for theriver samples ranged from 5.6 to 10.8 and Chao1 richness in theriver ranged from 1408 to 19,117 OTUs per sample (Figure 2).The alpha diversity of the bacterial community represented byboth Shannon indices and Chao1 richness decreased at R2 andR3, the sites at which the lake and the glacier stream drains intothe river (Figures 1, 2). The alpha diversity rose again at R4, ca.100m from the glacial input site. At the river mouth (R5), thediversity increased again and reached a similar level to the firstriver site (R1) upstream of the glacier and lake input sites.
Shannon indices for the estuary samples ranged from 5.4 to10.6 while Chao1 richness varied from 2589 to 19,021 OTUs(Figure 2). The diversity and richness were higher in the estuarythan in the glacier stream and lake input samples, and slightlylower than in the remaining river samples. There was no apparentpattern in the difference in diversity and richness attributed todifferent depths of the estuary, sample sites or the distance to theriver mouth.
Community Composition AnalysisThe samples from the first site of the river (R1), upstream of thelake and glacier stream outlets to the river, clustered with samplesfrom the bottom site of the river (R5; Figure 3). These two sitesalso shared a high number of indicator OTUs (Figures 4A,E) andshowed similar diversity and richness (Figure 2). The river site bythe proglacial lake outlet (R2) clustered with the river site at theglacier stream outlet (R3). These sites, R2 and R3, also had lowerdiversity than the other river sites (Figure 2).
In the estuary, the bacterial communities clustered accordingto sample site for the two sites that were farthest into the estuary(E700 and E1100). The samples from the sites closest to the rivermouth (E100 and E300) were dispersed across NMDS 1 and2 (Figure 3). The samples did not cluster according to sampledepth. Samples from the sample sites closest to the river mouth(E100 and E300) clustered more closely with river samples thanthe samples farthest from the river mouth (E700 and E1100).
Environmental ControlsBIOENV analysis showed that the total community as well asthe non-indicator and indicator OTUs in the river correlatedsignificantly with turbidity at p ≤ 0.05. The strongest correlationwas found between the river non-indicator OTUs and turbiditywith a Spearman’s rank correlation coefficient of 0.586.
BIOENV analysis of the estuary community showed nosignificant correlations with environmental variables (Table 2).
Indicator Taxa AnalysisThe number of indicator OTUs in the river ranged from 158at the second-to-last site of the river (R4) to 678 at the inputsite from the proglacial lake (R2), which also had the highestpercentage of top indicator OTUs (Indicator Value= 1; Table 3).
Frontiers in Microbiology | www.frontiersin.org 6 September 2016 | Volume 7 | Article 1474
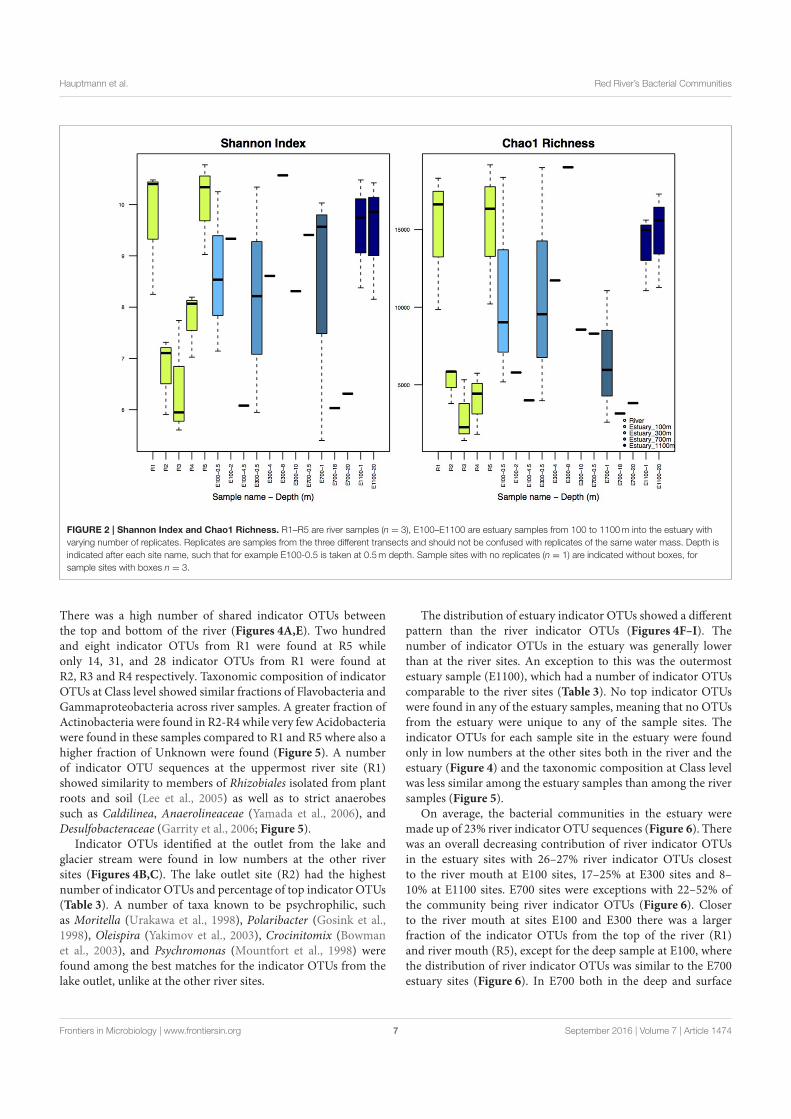
Hauptmann et al. Red River’s Bacterial Communities
FIGURE 2 | Shannon Index and Chao1 Richness. R1–R5 are river samples (n = 3), E100–E1100 are estuary samples from 100 to 1100m into the estuary with
varying number of replicates. Replicates are samples from the three different transects and should not be confused with replicates of the same water mass. Depth is
indicated after each site name, such that for example E100-0.5 is taken at 0.5m depth. Sample sites with no replicates (n = 1) are indicated without boxes, for
sample sites with boxes n = 3.
There was a high number of shared indicator OTUs betweenthe top and bottom of the river (Figures 4A,E). Two hundredand eight indicator OTUs from R1 were found at R5 whileonly 14, 31, and 28 indicator OTUs from R1 were found atR2, R3 and R4 respectively. Taxonomic composition of indicatorOTUs at Class level showed similar fractions of Flavobacteria andGammaproteobacteria across river samples. A greater fraction ofActinobacteria were found in R2-R4 while very fewAcidobacteriawere found in these samples compared to R1 and R5 where also ahigher fraction of Unknown were found (Figure 5). A numberof indicator OTU sequences at the uppermost river site (R1)showed similarity to members of Rhizobiales isolated from plantroots and soil (Lee et al., 2005) as well as to strict anaerobessuch as Caldilinea, Anaerolineaceae (Yamada et al., 2006), andDesulfobacteraceae (Garrity et al., 2006; Figure 5).
Indicator OTUs identified at the outlet from the lake andglacier stream were found in low numbers at the other riversites (Figures 4B,C). The lake outlet site (R2) had the highestnumber of indicator OTUs and percentage of top indicator OTUs(Table 3). A number of taxa known to be psychrophilic, suchas Moritella (Urakawa et al., 1998), Polaribacter (Gosink et al.,1998), Oleispira (Yakimov et al., 2003), Crocinitomix (Bowmanet al., 2003), and Psychromonas (Mountfort et al., 1998) werefound among the best matches for the indicator OTUs from thelake outlet, unlike at the other river sites.
The distribution of estuary indicator OTUs showed a differentpattern than the river indicator OTUs (Figures 4F–I). Thenumber of indicator OTUs in the estuary was generally lowerthan at the river sites. An exception to this was the outermostestuary sample (E1100), which had a number of indicator OTUscomparable to the river sites (Table 3). No top indicator OTUswere found in any of the estuary samples, meaning that no OTUsfrom the estuary were unique to any of the sample sites. Theindicator OTUs for each sample site in the estuary were foundonly in low numbers at the other sites both in the river and theestuary (Figure 4) and the taxonomic composition at Class levelwas less similar among the estuary samples than among the riversamples (Figure 5).
On average, the bacterial communities in the estuary weremade up of 23% river indicator OTU sequences (Figure 6). Therewas an overall decreasing contribution of river indicator OTUsin the estuary sites with 26–27% river indicator OTUs closestto the river mouth at E100 sites, 17–25% at E300 sites and 8–10% at E1100 sites. E700 sites were exceptions with 22–52% ofthe community being river indicator OTUs (Figure 6). Closerto the river mouth at sites E100 and E300 there was a largerfraction of the indicator OTUs from the top of the river (R1)and river mouth (R5), except for the deep sample at E100, wherethe distribution of river indicator OTUs was similar to the E700estuary sites (Figure 6). In E700 both in the deep and surface
Frontiers in Microbiology | www.frontiersin.org 7 September 2016 | Volume 7 | Article 1474
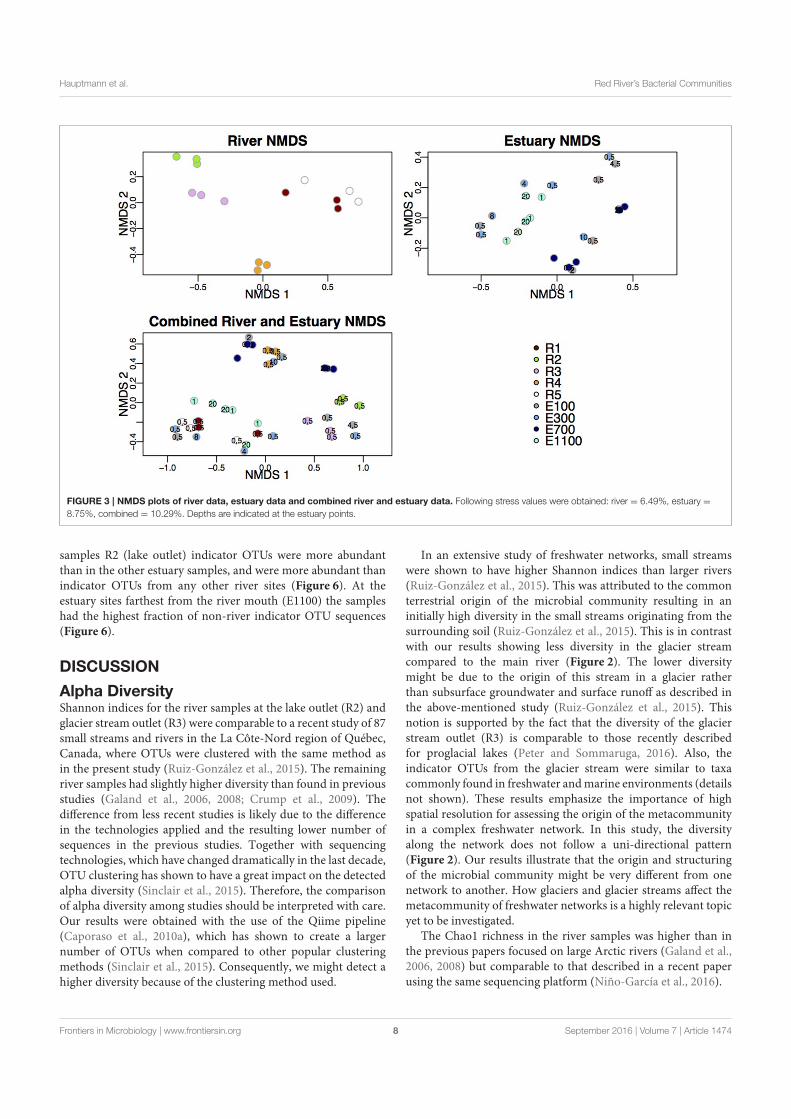
Hauptmann et al. Red River’s Bacterial Communities
FIGURE 3 | NMDS plots of river data, estuary data and combined river and estuary data. Following stress values were obtained: river = 6.49%, estuary =
8.75%, combined = 10.29%. Depths are indicated at the estuary points.
samples R2 (lake outlet) indicator OTUs were more abundantthan in the other estuary samples, and were more abundant thanindicator OTUs from any other river sites (Figure 6). At theestuary sites farthest from the river mouth (E1100) the sampleshad the highest fraction of non-river indicator OTU sequences(Figure 6).
DISCUSSION
Alpha DiversityShannon indices for the river samples at the lake outlet (R2) andglacier stream outlet (R3) were comparable to a recent study of 87small streams and rivers in the La Côte-Nord region of Québec,Canada, where OTUs were clustered with the same method asin the present study (Ruiz-González et al., 2015). The remainingriver samples had slightly higher diversity than found in previousstudies (Galand et al., 2006, 2008; Crump et al., 2009). Thedifference from less recent studies is likely due to the differencein the technologies applied and the resulting lower number ofsequences in the previous studies. Together with sequencingtechnologies, which have changed dramatically in the last decade,OTU clustering has shown to have a great impact on the detectedalpha diversity (Sinclair et al., 2015). Therefore, the comparisonof alpha diversity among studies should be interpreted with care.Our results were obtained with the use of the Qiime pipeline(Caporaso et al., 2010a), which has shown to create a largernumber of OTUs when compared to other popular clusteringmethods (Sinclair et al., 2015). Consequently, we might detect ahigher diversity because of the clustering method used.
In an extensive study of freshwater networks, small streamswere shown to have higher Shannon indices than larger rivers(Ruiz-González et al., 2015). This was attributed to the commonterrestrial origin of the microbial community resulting in aninitially high diversity in the small streams originating from thesurrounding soil (Ruiz-González et al., 2015). This is in contrastwith our results showing less diversity in the glacier streamcompared to the main river (Figure 2). The lower diversitymight be due to the origin of this stream in a glacier ratherthan subsurface groundwater and surface runoff as described inthe above-mentioned study (Ruiz-González et al., 2015). Thisnotion is supported by the fact that the diversity of the glacierstream outlet (R3) is comparable to those recently describedfor proglacial lakes (Peter and Sommaruga, 2016). Also, theindicator OTUs from the glacier stream were similar to taxacommonly found in freshwater andmarine environments (detailsnot shown). These results emphasize the importance of highspatial resolution for assessing the origin of the metacommunityin a complex freshwater network. In this study, the diversityalong the network does not follow a uni-directional pattern(Figure 2). Our results illustrate that the origin and structuringof the microbial community might be very different from onenetwork to another. How glaciers and glacier streams affect themetacommunity of freshwater networks is a highly relevant topicyet to be investigated.
The Chao1 richness in the river samples was higher than inthe previous papers focused on large Arctic rivers (Galand et al.,2006, 2008) but comparable to that described in a recent paperusing the same sequencing platform (Niño-García et al., 2016).
Frontiers in Microbiology | www.frontiersin.org 8 September 2016 | Volume 7 | Article 1474

Hauptmann et al. Red River’s Bacterial Communities
FIGURE 4 | Percentage of indicator OTU sequences distribution across sample sites. Please note that Y-axes are different in each plot. (A–E) River sites
(R1–R5) consist of three replicates corresponding to 36,540 sequences total for each site after rarefaction to 12,180 sequences per sample. (F–I) Estuary sample
sites E300–E1100 are each sampled in three transects at two depths, making up six samples per distance from the river mouth, corresponding to 73,080 sequences.
E100 lacks one sample at transect 1, deep sample, therefore it consists of 60,900 sequences.
The drop in alpha diversity at the input sites from the lakeand the glacier (R2 and R3, Figure 2) shows that the lake and theglacier stream input less diverse bacterial communities into themain river. Lower diversity in lakes compared with the connectedrivers has been attributed to longer WRT in lakes (Crump et al.,2012; Ruiz-González et al., 2015; Niño-García et al., 2016). Thisis especially pronounced in small streams and rivers, whereWRTis too short to allow for local sorting of the bacterial community(Crump et al., 2012; Ruiz-González et al., 2015; Niño-García et al.,2016). Downstream of the input sites, the alpha diversity risesagain and by the river mouth reaches a level similar to the firstriver site (R1) upstream of the input sites (R2 and R3). This showsthat the volume of water from the lake and glacier outlets doesnot dilute the downstream river community. Importantly, it alsosuggests that the less diverse communities from the lake and theglacier stream are concealed downstream of the input sites by thehigher diversity of the main river.
Shannon indices in the estuary samples were higher thanthose previously described for Arctic estuaries (Galand et al.,
2006, 2008). Previous studies of large Arctic rivers show thatbacterial diversity and abundance decrease from rivers toestuaries probably due to upstream input from terrestrial sources(Meon and Amon, 2004; Galand et al., 2006, 2008). Our resultsfrom a small river support this conclusion by showing a slightdecrease in diversity from the main river sites (R1 and R5) tothe estuary (Figure 2). The diversity in the estuary sites closerto the river and in the shallow samples could be expected tobe higher than more distant and deep estuary samples due to ahigher concentration of the river bacterial community, which isnot evident from our results (Figures 2, 6). This indicates thatalthough the community structure from the river to the estuaryaligns with previous results by showing a directional decreasein diversity, this directional structure cannot be detected furtherdown the network, in the estuary transects. The lack of patternin diversity and richness attributed to different depths of theestuary samples or the distance to the river mouth could partlybe attributed to an insufficient resolution in sample depth. Thelow resolution might not allow for the detection of a clear plume
Frontiers in Microbiology | www.frontiersin.org 9 September 2016 | Volume 7 | Article 1474

Hauptmann et al. Red River’s Bacterial Communities
TABLE 2 | BIOENV analysis of the total, river (n = 15) and estuary (n = 23)
communities and the indicator OTUs and non-indicator OTUs.
Community composition
subsamples
Spearman’s
rho
Environmental variables
River, Non-indicator OTUs 0.5864 Turbidity
River, Indicator OTUs 0.5473 Turbidity
River, all OTUs 0.5559 Turbidity
Total community, Non-indicator
OTUs
0.2021 Temperature, turbidity
Total community, Indicator OTUs 0.1976 DOC, turbidity
Estuary, Indicator OTUs 0.1480 Distance from river outlet,
DOC, Salinity, Turbidity
Estuary, all OTUs 0.1015 Distance from river outlet,
turbidity, TN, DOC, Total area
of particles
Estuary, Non-indicator OTUs 0.0756 Distance from river outlet,
turbidity, Total area of particles
TABLE 3 | Number of Indicator OTUs and Top Indicator OTUs across
sample sites.
Sample Number of Indicator OTUs* Number of Top Indicator OTUs**
R1 352 1 (0.28%)
R2 678 34 (5%)
R3 194 5 (2.58%)
R4 158 1 (0.63%)
R5 560 1 (0.18%)
E100 99 0
E300 18 0
E700 43 0
E1100 346 0
* Including only indicator OTUs with Indicator Value ≥ 0.3 and P-value ≤ 0.05.
** Indicator Value = 1.
and different depth zones. While distinct bacterial communitieshave been found to be associated with the plume and differentoceanic zones in an estuary, these results are from sampledoceanic zones several kilometers farther into the ocean than oursamples (Fortunato et al., 2012). Estuary samples were previouslydiscussed as harboring a mix of bacterial communities fromthe river and the coastal ocean with no distinct autochthonousestuary-community (Fortunato et al., 2012), which resemblesour results. The high variability in diversity found among theestuary samples suggests a highly heterogeneous community, alsoexpected in such a regionwhere waters of very different chemistryand origin meet. The large variability in diversity and richnessseen at the different estuarine sites (Figure 2) could be explainedby the sampling of the different water masses, since sequencesfrom the three different transects were pooled together for eachestuarine site and depth. The variability of diversity as well asenvironmental variables seem to lessen farther into the estuary,which could be expected as homogeneity increases as a greaterfraction of the estuary is made up of marine waters (Figure 2 andSupplementary Table 1).
Community Composition AnalysisSamples from the first site of the river (R1), upstream of thelake and glacier stream outlets, clustered with samples from thebottom site of the river (R5) while the river site by the proglaciallake outlet (R2) clustered with the river site at the glacier streamoutlet (R3) as shown by the NMDS plot (Figure 3). R1 and R5also shared a high number of indicator OTUs (Figures 4A,E)as well as similar diversity and richness (Figure 2). In contrast,R2 and R3 had lower diversity than the other river sites. TheNMDS plots, indicator OTU analysis and alpha diversity resultsimply that waters sourced from the lake and the glacier streamcarry different bacterial communities than that of the mainriver. The larger volume of the main river community thenprobably masks the lake and glacier stream communities, thusresulting in the close similarity between the sites R1 and R5.The isolation of the R4 samples from other river samples in theNMDS plots may be explained by the difference in sampling atthis site, which was closer to the river bank compared to theother river samples. Another explanation might be the imperfectmixing of water from the upstream lake and glacier outletswith that of the main river at this site. The latter seems tobe the best explanation since the comparably low number ofindicator OTUs found at R4 suggests that this site contains amixture of the upstream communities rather than a distinctcommunity from the sampling site (Table 3). This agrees withresults from a study on an Arctic tundra catchment, showingthat streams leaving lakes have decreasing similarity to the lakemicrobial community as a function of distance (Crump et al.,2007).
The dispersal of estuary samples on the NMDS plots wasin accordance with the diversity measures, which were similarwithin individual sampling sites independent of sample depth(Figures 2, 3). Samples from the sites closest to the river mouth(E100 and E300) clustered more closely with river samples thanthe samples farthest from the river mouth (E700 and E1100),consistent with a gradual mixing of the river community with amarine community within the estuary environment. Remarkably,R4 river samples clustered more closely with estuary samplesthan with the other river samples. Indicator OTUs from R4are present throughout the estuary transects (Figure 6) and thetaxonomic composition of samples from R4 has the largestresemblance to that of estuary site E1100 (Figure 5), which mightexplain the NMDS results (Figure 3). Furthermore, the bacterialcommunity at this site seems to be a mixture of the different rivercommunities as suggested by the indicator OTU results (Table 3).Therefore, the clustering of R4 samples with estuary samplesmight also reflect the resemblance to the estuary, in which theriver communities are also mixed (Figures 4F–I, 6).
Samples from E100 and E300 were more widely dispersedacross the NMDS plots than the samples from farther intothe estuary, indicating greater heterogeneity of the bacterialcommunities. This is not unexpected from a region of mixingof largely different water bodies both in terms of physical andchemical variables as well as origin. The NMDS plot did notindicate that the bacterial communities were stratified accordingto sample depth. The low resolution of samples through the watercolumn might be part of the explanation. However, the results
Frontiers in Microbiology | www.frontiersin.org 10 September 2016 | Volume 7 | Article 1474
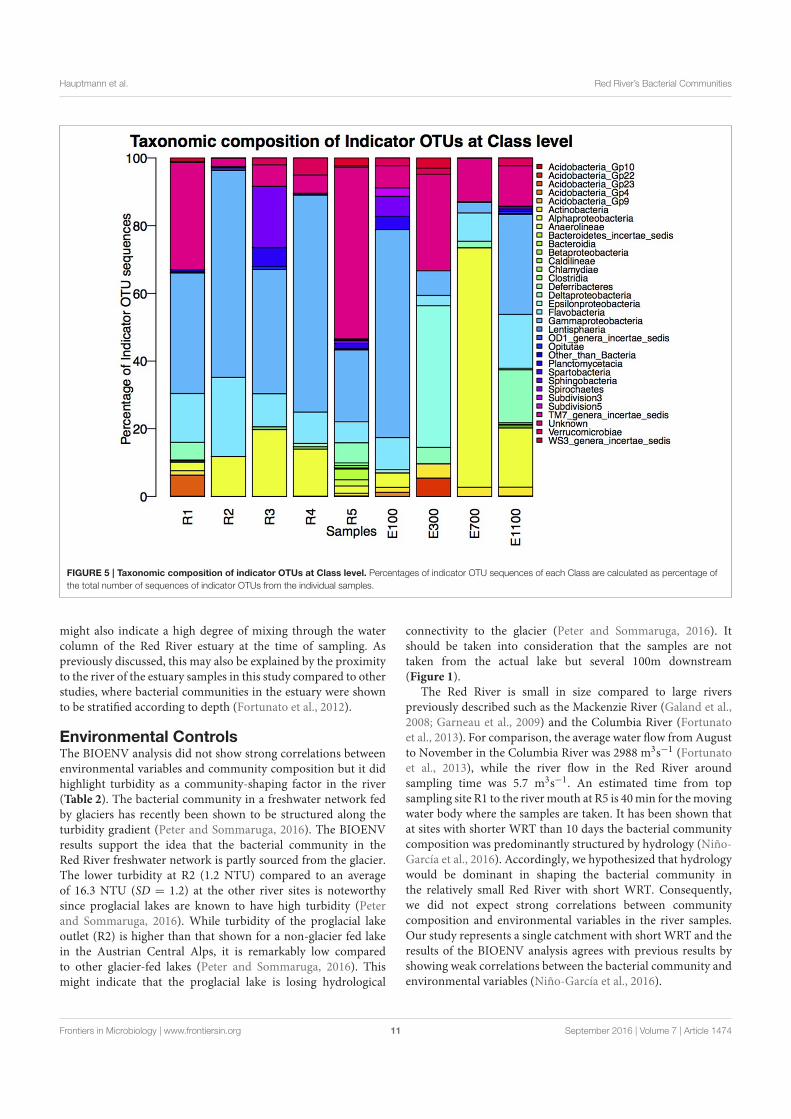
Hauptmann et al. Red River’s Bacterial Communities
FIGURE 5 | Taxonomic composition of indicator OTUs at Class level. Percentages of indicator OTU sequences of each Class are calculated as percentage of
the total number of sequences of indicator OTUs from the individual samples.
might also indicate a high degree of mixing through the watercolumn of the Red River estuary at the time of sampling. Aspreviously discussed, this may also be explained by the proximityto the river of the estuary samples in this study compared to otherstudies, where bacterial communities in the estuary were shownto be stratified according to depth (Fortunato et al., 2012).
Environmental ControlsThe BIOENV analysis did not show strong correlations betweenenvironmental variables and community composition but it didhighlight turbidity as a community-shaping factor in the river(Table 2). The bacterial community in a freshwater network fedby glaciers has recently been shown to be structured along theturbidity gradient (Peter and Sommaruga, 2016). The BIOENVresults support the idea that the bacterial community in theRed River freshwater network is partly sourced from the glacier.The lower turbidity at R2 (1.2 NTU) compared to an averageof 16.3 NTU (SD = 1.2) at the other river sites is noteworthysince proglacial lakes are known to have high turbidity (Peterand Sommaruga, 2016). While turbidity of the proglacial lakeoutlet (R2) is higher than that shown for a non-glacier fed lakein the Austrian Central Alps, it is remarkably low comparedto other glacier-fed lakes (Peter and Sommaruga, 2016). Thismight indicate that the proglacial lake is losing hydrological
connectivity to the glacier (Peter and Sommaruga, 2016). Itshould be taken into consideration that the samples are nottaken from the actual lake but several 100m downstream(Figure 1).
The Red River is small in size compared to large riverspreviously described such as the Mackenzie River (Galand et al.,2008; Garneau et al., 2009) and the Columbia River (Fortunatoet al., 2013). For comparison, the average water flow from Augustto November in the Columbia River was 2988 m3s−1 (Fortunatoet al., 2013), while the river flow in the Red River aroundsampling time was 5.7 m3s−1. An estimated time from topsampling site R1 to the rivermouth at R5 is 40min for themovingwater body where the samples are taken. It has been shown thatat sites with shorter WRT than 10 days the bacterial communitycomposition was predominantly structured by hydrology (Niño-García et al., 2016). Accordingly, we hypothesized that hydrologywould be dominant in shaping the bacterial community inthe relatively small Red River with short WRT. Consequently,we did not expect strong correlations between communitycomposition and environmental variables in the river samples.Our study represents a single catchment with short WRT and theresults of the BIOENV analysis agrees with previous results byshowing weak correlations between the bacterial community andenvironmental variables (Niño-García et al., 2016).
Frontiers in Microbiology | www.frontiersin.org 11 September 2016 | Volume 7 | Article 1474
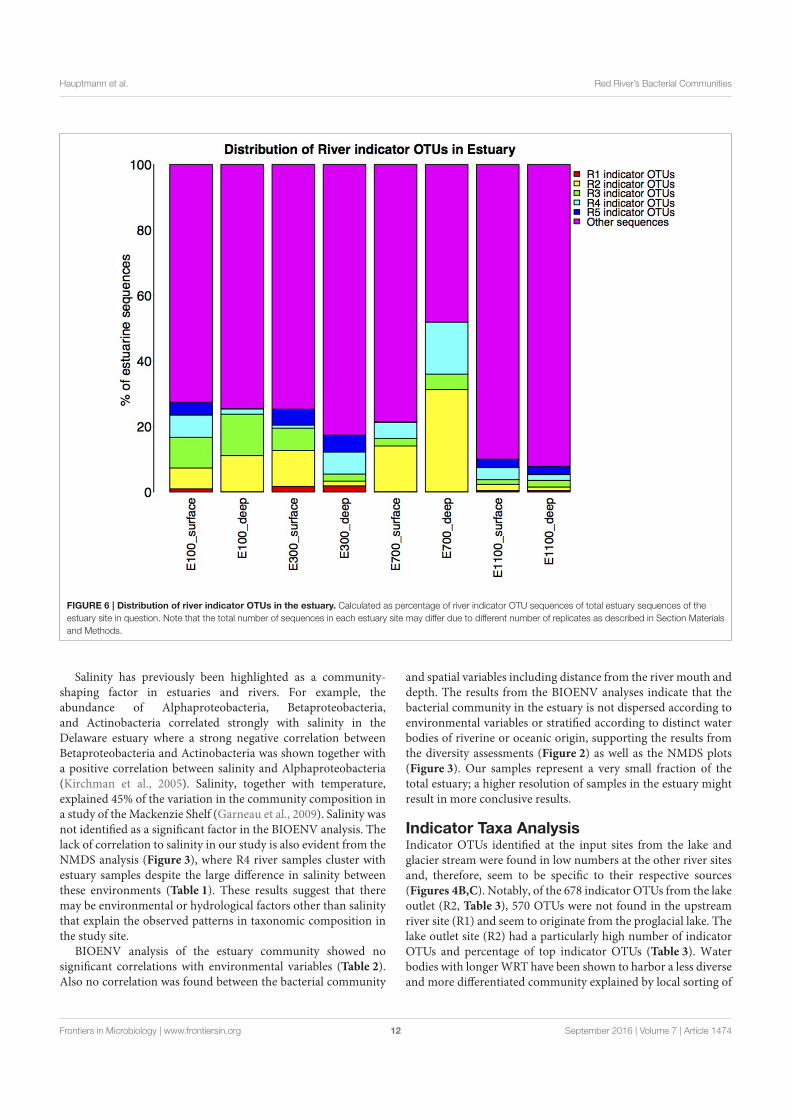
Hauptmann et al. Red River’s Bacterial Communities
FIGURE 6 | Distribution of river indicator OTUs in the estuary. Calculated as percentage of river indicator OTU sequences of total estuary sequences of the
estuary site in question. Note that the total number of sequences in each estuary site may differ due to different number of replicates as described in Section Materials
and Methods.
Salinity has previously been highlighted as a community-shaping factor in estuaries and rivers. For example, theabundance of Alphaproteobacteria, Betaproteobacteria,and Actinobacteria correlated strongly with salinity in theDelaware estuary where a strong negative correlation betweenBetaproteobacteria and Actinobacteria was shown together witha positive correlation between salinity and Alphaproteobacteria(Kirchman et al., 2005). Salinity, together with temperature,explained 45% of the variation in the community composition ina study of the Mackenzie Shelf (Garneau et al., 2009). Salinity wasnot identified as a significant factor in the BIOENV analysis. Thelack of correlation to salinity in our study is also evident from theNMDS analysis (Figure 3), where R4 river samples cluster withestuary samples despite the large difference in salinity betweenthese environments (Table 1). These results suggest that theremay be environmental or hydrological factors other than salinitythat explain the observed patterns in taxonomic composition inthe study site.
BIOENV analysis of the estuary community showed nosignificant correlations with environmental variables (Table 2).Also no correlation was found between the bacterial community
and spatial variables including distance from the river mouth anddepth. The results from the BIOENV analyses indicate that thebacterial community in the estuary is not dispersed according toenvironmental variables or stratified according to distinct waterbodies of riverine or oceanic origin, supporting the results fromthe diversity assessments (Figure 2) as well as the NMDS plots(Figure 3). Our samples represent a very small fraction of thetotal estuary; a higher resolution of samples in the estuary mightresult in more conclusive results.
Indicator Taxa AnalysisIndicator OTUs identified at the input sites from the lake andglacier stream were found in low numbers at the other river sitesand, therefore, seem to be specific to their respective sources(Figures 4B,C). Notably, of the 678 indicator OTUs from the lakeoutlet (R2, Table 3), 570 OTUs were not found in the upstreamriver site (R1) and seem to originate from the proglacial lake. Thelake outlet site (R2) had a particularly high number of indicatorOTUs and percentage of top indicator OTUs (Table 3). Waterbodies with longerWRT have been shown to harbor a less diverseand more differentiated community explained by local sorting of
Frontiers in Microbiology | www.frontiersin.org 12 September 2016 | Volume 7 | Article 1474
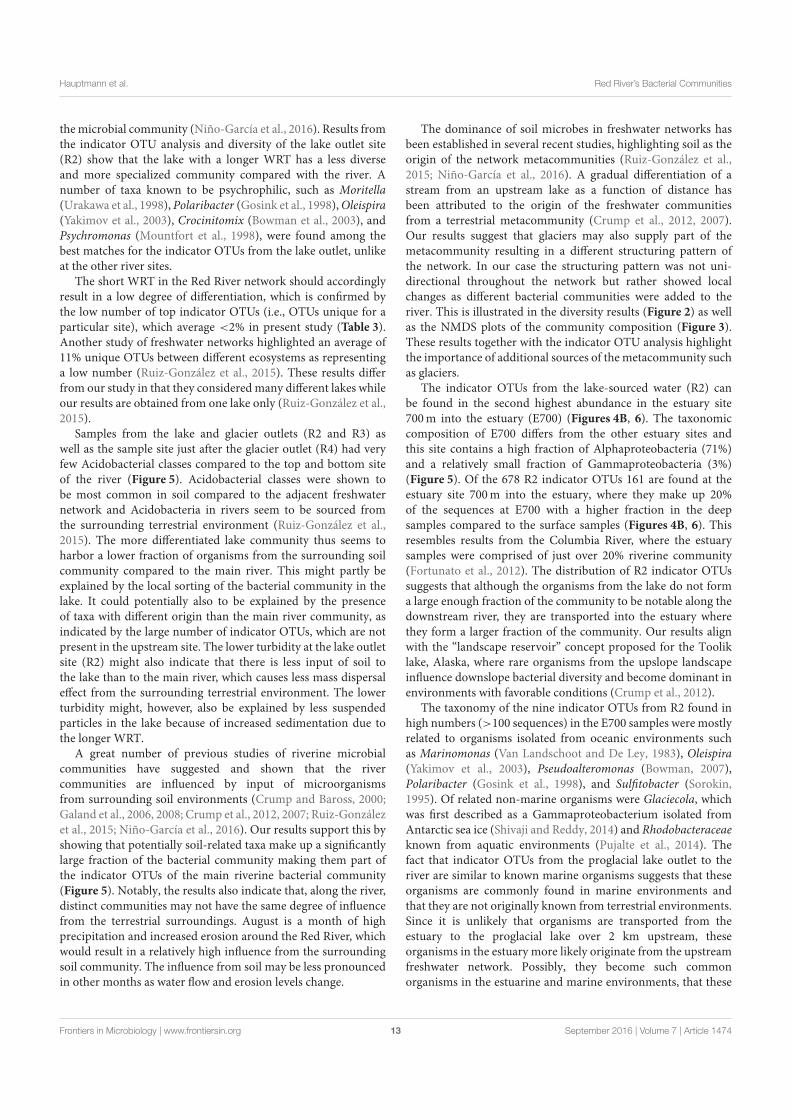
Hauptmann et al. Red River’s Bacterial Communities
themicrobial community (Niño-García et al., 2016). Results fromthe indicator OTU analysis and diversity of the lake outlet site(R2) show that the lake with a longer WRT has a less diverseand more specialized community compared with the river. Anumber of taxa known to be psychrophilic, such as Moritella(Urakawa et al., 1998), Polaribacter (Gosink et al., 1998),Oleispira(Yakimov et al., 2003), Crocinitomix (Bowman et al., 2003), andPsychromonas (Mountfort et al., 1998), were found among thebest matches for the indicator OTUs from the lake outlet, unlikeat the other river sites.
The short WRT in the Red River network should accordinglyresult in a low degree of differentiation, which is confirmed bythe low number of top indicator OTUs (i.e., OTUs unique for aparticular site), which average <2% in present study (Table 3).Another study of freshwater networks highlighted an average of11% unique OTUs between different ecosystems as representinga low number (Ruiz-González et al., 2015). These results differfrom our study in that they considered many different lakes whileour results are obtained from one lake only (Ruiz-González et al.,2015).
Samples from the lake and glacier outlets (R2 and R3) aswell as the sample site just after the glacier outlet (R4) had veryfew Acidobacterial classes compared to the top and bottom siteof the river (Figure 5). Acidobacterial classes were shown tobe most common in soil compared to the adjacent freshwaternetwork and Acidobacteria in rivers seem to be sourced fromthe surrounding terrestrial environment (Ruiz-González et al.,2015). The more differentiated lake community thus seems toharbor a lower fraction of organisms from the surrounding soilcommunity compared to the main river. This might partly beexplained by the local sorting of the bacterial community in thelake. It could potentially also to be explained by the presenceof taxa with different origin than the main river community, asindicated by the large number of indicator OTUs, which are notpresent in the upstream site. The lower turbidity at the lake outletsite (R2) might also indicate that there is less input of soil tothe lake than to the main river, which causes less mass dispersaleffect from the surrounding terrestrial environment. The lowerturbidity might, however, also be explained by less suspendedparticles in the lake because of increased sedimentation due tothe longer WRT.
A great number of previous studies of riverine microbialcommunities have suggested and shown that the rivercommunities are influenced by input of microorganismsfrom surrounding soil environments (Crump and Baross, 2000;Galand et al., 2006, 2008; Crump et al., 2012, 2007; Ruiz-Gonzálezet al., 2015; Niño-García et al., 2016). Our results support this byshowing that potentially soil-related taxa make up a significantlylarge fraction of the bacterial community making them part ofthe indicator OTUs of the main riverine bacterial community(Figure 5). Notably, the results also indicate that, along the river,distinct communities may not have the same degree of influencefrom the terrestrial surroundings. August is a month of highprecipitation and increased erosion around the Red River, whichwould result in a relatively high influence from the surroundingsoil community. The influence from soil may be less pronouncedin other months as water flow and erosion levels change.
The dominance of soil microbes in freshwater networks hasbeen established in several recent studies, highlighting soil as theorigin of the network metacommunities (Ruiz-González et al.,2015; Niño-García et al., 2016). A gradual differentiation of astream from an upstream lake as a function of distance hasbeen attributed to the origin of the freshwater communitiesfrom a terrestrial metacommunity (Crump et al., 2012, 2007).Our results suggest that glaciers may also supply part of themetacommunity resulting in a different structuring pattern ofthe network. In our case the structuring pattern was not uni-directional throughout the network but rather showed localchanges as different bacterial communities were added to theriver. This is illustrated in the diversity results (Figure 2) as wellas the NMDS plots of the community composition (Figure 3).These results together with the indicator OTU analysis highlightthe importance of additional sources of the metacommunity suchas glaciers.
The indicator OTUs from the lake-sourced water (R2) canbe found in the second highest abundance in the estuary site700m into the estuary (E700) (Figures 4B, 6). The taxonomiccomposition of E700 differs from the other estuary sites andthis site contains a high fraction of Alphaproteobacteria (71%)and a relatively small fraction of Gammaproteobacteria (3%)(Figure 5). Of the 678 R2 indicator OTUs 161 are found at theestuary site 700m into the estuary, where they make up 20%of the sequences at E700 with a higher fraction in the deepsamples compared to the surface samples (Figures 4B, 6). Thisresembles results from the Columbia River, where the estuarysamples were comprised of just over 20% riverine community(Fortunato et al., 2012). The distribution of R2 indicator OTUssuggests that although the organisms from the lake do not forma large enough fraction of the community to be notable along thedownstream river, they are transported into the estuary wherethey form a larger fraction of the community. Our results alignwith the “landscape reservoir” concept proposed for the Tooliklake, Alaska, where rare organisms from the upslope landscapeinfluence downslope bacterial diversity and become dominant inenvironments with favorable conditions (Crump et al., 2012).
The taxonomy of the nine indicator OTUs from R2 found inhigh numbers (>100 sequences) in the E700 samples were mostlyrelated to organisms isolated from oceanic environments suchas Marinomonas (Van Landschoot and De Ley, 1983), Oleispira(Yakimov et al., 2003), Pseudoalteromonas (Bowman, 2007),Polaribacter (Gosink et al., 1998), and Sulfitobacter (Sorokin,1995). Of related non-marine organisms were Glaciecola, whichwas first described as a Gammaproteobacterium isolated fromAntarctic sea ice (Shivaji and Reddy, 2014) and Rhodobacteraceaeknown from aquatic environments (Pujalte et al., 2014). Thefact that indicator OTUs from the proglacial lake outlet to theriver are similar to known marine organisms suggests that theseorganisms are commonly found in marine environments andthat they are not originally known from terrestrial environments.Since it is unlikely that organisms are transported from theestuary to the proglacial lake over 2 km upstream, theseorganisms in the estuary more likely originate from the upstreamfreshwater network. Possibly, they become such commonorganisms in the estuarine and marine environments, that these
Frontiers in Microbiology | www.frontiersin.org 13 September 2016 | Volume 7 | Article 1474
Hauptmann et al. Red River’s Bacterial Communities
are the environments from which they have become known. It iswell established that bacterial communities found in freshwaternetworks can be traced from upstream positions in the network(Crump et al., 2012; Ruiz-González et al., 2015; Niño-Garcíaet al., 2016). We show that in the Red River estuary the rivercommunity can be found in the estuary with an overall decreasingfraction from the river mouth toward the ocean (Figure 6).Interestingly, communities that are not notable throughout theriver are transported to the estuary where they seem to become anequally large fraction of the estuary as the main river community(Figures 4B, 6). Distinct communities from the river seem toinfluence the estuary to different extend, so that communitiesfrom certain parts of the river make up notably larger fractionsof the estuary at some sites (Figures 4, 6).
“Seed bank” is a term proposed for the fraction of dormantorganisms that may be resuscitated when met with differentenvironmental conditions through e.g., dispersal to otherecosystems (Lennon and Jones, 2011). The concept of seed bankswas recently extended to freshwater networks where organismsoriginating in a soil community were proposed as the seed bankfor boreal freshwater networks (Ruiz-González et al., 2015). Forfreshwater networks it was discussed that shallower sequencingdepth might lead to the erroneous conclusion that freshwatercommunities do not derive from a shared pool of terrestrialmicrobes (Ruiz-González et al., 2015). This could lead to anincomplete understanding of the mechanisms of assembly andthe actual linkages and dispersal of microbes between connectedecosystems (Ruiz-González et al., 2015). We show that samplingresolution not only in terms of sequencing depth but alsoresolution along the network may result in overlooking distinctmicrobial communities and how these are distributed and linkedto the downstream estuary. Our results indicate that not onlythe terrestrial surroundings but also upstream glaciers may actas seed banks for freshwater networks. While the uni-directionalstructure in freshwater networks might be a consequence of thenumerical dominance of terrestrial OTUs as shown previously(Crump et al., 2012; Ruiz-González et al., 2015) our resultssuggest that this does not necessarily imply that the bacterialcommunity in a freshwater network has a common origin frommicrobes from soil. A higher resolution along the river mightreveal distinct bacterial communities of different origin and withdifferent composition, which are introduced downstream in thenetwork. These distinct communities, which might be concealedby the numerically dominant terrestrial community along theriver, are able to act as seed banks for downstream environments.The different composition of inputs along the river affectsthe structure of the community, which is not necessarily uni-directional for all freshwater networks as shown in the presentstudy.
Therefore, sampling with the right resolution, both in termsof sequencing depth and the distance between samples along thenetwork, is crucial for understanding the source of microbialcommunities found in the estuary. This is especially true at timeswith high precipitation and erosion. Our study shows that withthe right resolution, microbial communities can be valuable inunderstanding transport pathways of meltwater and matter fromsource to oceans in that they can serve as both tracers as well asindicators of origin in their adaptation to the environment.
The indicator OTUs for each sample site in the estuary werefound only in low numbers at the other sites both in the riverand the estuary. This pattern is in contrast with the results fromthe Columbia River, USA, where indicator OTUs from the upperwater-column of the estuary (<56m depth) showed generalisttaxa qualities by having high relative abundance and occurrencein a high number of samples outside their indicator environmentwhen compared to the river environment (Fortunato et al., 2013).Ocean-specific taxa are not expected to be found upstream inthe river, which is also apparent from the distribution of estuaryindicator OTUs (Figures 4F–I). The low number of indicatorOTUs and lack of top-indicators in the estuary show that thedifferent sites in the estuary do not hold distinct communities.These results are in accordance with the results of the BIOENVanalysis and NMDS plots, which suggest that the bacterialcommunities are not dispersed according to environmental orspatial variables, as well as the highly variable diversity measuresin the estuary. As previously discussed, samples in the presentstudy are sampled relatively close to the river mouth and a moredistinct stratification of the bacterial communities might becomevisible farther into the estuary.
We expected the estuary sites to contain a mixture of thecommunities found in the river and the ocean, with moreenvironmental variability closer to the river mouth due to themixing of river- and sea-water. This is supported by our data,which show greater variance in environmental data closest to theriver mouth (Supplementary Table 1) as well as river indicatorOTUs from more of the river sites closer to the river mouth atE100 and E300 (Figure 6). Mixing of river and ocean water mayresult in an allochthonously dominated community shaped byhydrology rather than by environmental selection, also indicatedby the NMDS plot (Figure 3) and BIOENV analysis (Table 2).This is supported by the fact that the outermost sample site ofthe estuary (E1100) had a higher number of indicator OTUs(Table 3) as variability is expected to decrease with increasingdistance from the river mouth and the most distant estuary site isexpected to contain a higher number of ocean indicator OTUs.This was supported by the taxonomy of the indicator OTUsthat were all similar to marine-related taxa at E1100 (details notshown). This site also had a lower fraction of river indicatorOTUs compared to the estuary sites closer to the river mouth(Figures 4, 6).
CONCLUSIONS
The bacterial community in the Red River, a small river onthe Disko Island, West Greenland, is sourced partly from thesurrounding terrestrial environment but also receives distinctmicrobial communities from a proglacial lake and a glacierstream that harbor lower diversity and different compositionthan the main river. These input communities are less influencedby terrestrial sources than the main river and the proglacial lakeinput has a higher fraction of OTUs resembling psychrophilictaxa. The combined community in the river is then mixedwith oceanic waters in the estuary, where the indicator OTUsof the river communities made up on average 23% of theestuary community at different sites. While the indicatorOTUs from the lake and glacier outlets are not notable in
Frontiers in Microbiology | www.frontiersin.org 14 September 2016 | Volume 7 | Article 1474
Hauptmann et al. Red River’s Bacterial Communities
the downstream river they make up large fractions of thecommunity at some sites in the estuary. The bacterial communityof the river showed a weak correlation to turbidity whilethe estuarine bacterial community showed no correlation toenvironmental or spatial variables. Our results illustrate theadded value of examining bacterial communities to betterunderstand and trace the transport of meltwaters from theirsource to the oceans. Lastly the results show that samplingresolution along the river is crucial for understanding thesource of different bacterial communities in a river and estuarysystem.
AUTHOR CONTRIBUTIONS
CJ and TM designed the study and sampled, NO performedsample preparations and DNA sequencing, AH performedbioinformatical analyses with contributions from JB and TSand statistical analyses with contributions from MS, AH wrotethe manuscript with contributions from MS, TM, NO, BE,
and CJ. All authors discussed the results and reviewed themanuscript.
FUNDING
This work was supported by the Center for Permafrost(CENPERM) Center no 100 from the Danish National ResearchFoundation (DNRF100) as well as the Novo Nordisk FoundationCenter for Biosustainability.
SUPPLEMENTARY MATERIAL
The Supplementary Material for this article can be foundonline at: http://journal.frontiersin.org/article/10.3389/fmicb.2016.01474Supplementary Figure 1 | Rarefaction curve showing number of observed
species against sequences per sample.
Supplementary Table 1 | Statistics of environmental data for estuary
samples.
REFERENCES
Bowman, J. P. (2007). Bioactive compound synthetic capacity and ecologicalsignificance of marine bacterial genus Pseudoalteromonas. Mar. Drugs 5,220–241. doi: 10.3390/md504220
Bowman, J. P., Nichols, C. M., and Gibson, J. A. E. (2003). Algoriphagus ratkowskyigen. nov., sp. nov., Brumimicrobium glaciale gen. nov., sp. nov., Cryomorphaignava gen. nov., sp. nov. andCrocinitomix catalasitica gen. nov., sp. nov., novelflavobacteria isolated from various polar habitats. Int. J. Syst. Evol. Microbiol. 53,1343–1355. doi: 10.1099/ijs.0.02553-0
Caporaso, J. G., Bittinger, K., Bushman, F. D., DeSantis, T. Z., Andersen, G. L., andKnight, R. (2010b). PyNAST: a flexible tool for aligning sequences to a templatealignment. Bioinformatics 26, 266–267. doi: 10.1093/bioinformatics/btp636
Caporaso, J. G., Kuczynski, J., Stombaugh, J., Bittinger, K., Bushman, F.D., Costello, E. K., et al. (2010a). QIIME allows analysis of high-throughput community sequencing data. Nat. Methods 7, 335–336. doi:10.1038/nmeth.f.303
Caporaso, J. G., Lauber, C. L., Walters, W. A., Berg-Lyons, D., Lozupone, C. A.,Turnbaugh, P. J., et al. (2011). Global patterns of 16S rRNA diversity at a depthof millions of sequences per sample. Proc. Natl. Acad. Sci. U.S.A. 108(Suppl. 1),4516–4522. doi: 10.1073/pnas.1000080107
Chao, A. (1984). Nonparametric estimation of the number of classes in apopulation. Scand. J. Stat. 11, 265–270.
Clarke, K. R., and Ainsworth, M. (1993). A method of linking multivariatecommunity structure to environmental variables. Mar. Ecol. Prog. Ser. 92,205–219. doi: 10.3354/meps092205
Crump, B. C., Amaral-Zettler, L. A., and Kling, G. W. (2012). Microbial diversityin arctic freshwaters is structured by inoculation of microbes from soils. ISMEJ. 6, 1629–1639. doi: 10.1038/ismej.2012.9
Crump, B. C., and Baross, J. A. (2000). Archaeaplankton in the Columbia River,its estuary and the adjacent coastal ocean, USA. FEMS Microbiol. Ecol. 31,231–239. doi: 10.1111/j.1574-6941.2000.tb00688.x
Crump, B. C., Peterson, B. J., Raymond, P. A., Amon, R. M. W., Rinehart,A., McClelland, J. W., et al. (2009). Circumpolar synchrony in big riverbacterioplankton. Proc. Natl. Acad. Sci. U.S.A. 106, 21208–21212. doi:10.1073/pnas.0906149106
Crump, R. C., Adams, H. E., Hobbie, J. E., and Kling, G. W. (2007). Biogeographyof bacterioplankton in lakes and streams of an Arctic tundra catchment. Ecology88, 1365–1378. doi: 10.1890/06-0387
Decho, A. W. (2000). Microbial biofilms in intertidal systems: an overview. Cont.Shelf Res. 20, 1257–1273. doi: 10.1016/S0278-4343(00)00022-4
Dufrene, M., and Legendre, P. (1997). Species assemblages and indicator species:the need for a flexible asymmetrical approach. Ecol. Monogr. 64, 345–366. doi:10.2307/2963459
Edgar, R. C., Haas, B. J., Clemente, J. C., Quince, C., and Knight, R. (2011).UCHIME improves sensitivity and speed of chimera detection. Bioinforma.Oxf. Engl. 27, 2194–2200. doi: 10.1093/bioinformatics/btr381
Fortunato, C. S., Eiler, A., Herfort, L., Needoba, J. A., Peterson, T. D., andCrump, B. C. (2013). Determining indicator taxa across spatial and seasonalgradients in the Columbia River coastal margin. ISME J. 7, 1899–1911. doi:10.1038/ismej.2013.79
Fortunato, C. S., Herfort, L., Zuber, P., Baptista, A. M., and Crump, B. C.(2012). Spatial variability overwhelms seasonal patterns in bacterioplanktoncommunities across a river to ocean gradient. ISME J. 6, 554–563. doi:10.1038/ismej.2011.135
Galand, P. E., Lovejoy, C., Pouliot, J., Garneau, M.-È., and Vincent, W. F. (2008).Microbial community diversity and heterotrophic production in a coastalArctic ecosystem: a stamukhi lake and its source waters. Limnol. Oceanogr. 53,813–823. doi: 10.4319/lo.2008.53.2.0813
Galand, P. E., Lovejoy, C., and Vincent, W. F. (2006). Remarkably diverseand contrasting archaeal communities in a large arctic river and thecoastal Arctic Ocean. Aquat. Microb. Ecol. 44, 115–126. doi: 10.3354/ame044115
Garneau, M.-È., Vincent, W. F., Terrado, R., and Lovejoy, C. (2009). Importance ofparticle-associated bacterial heterotrophy in a coastal Arctic ecosystem. J. Mar.Syst. 75, 185–197. doi: 10.1016/j.jmarsys.2008.09.002
Garrity, G., Brenner, D. J., Staley, J. T., Krieg, N. R., Boone, D. R., Vos, P. D.,et al. (2006). Bergey’s Manual R⃝ of Systematic Bacteriology: Volume Two: TheProteobacteria. Berlin: Springer Science & Business Media.
Gosink, J. J., Woese, C. R., and Staley, J. T. (1998). Polaribacter gen. nov., withthree new species, P. irgensii sp. nov., P. franzmannii sp. nov. and P. filamentussp. nov., gas vacuolate polar marine bacteria of the Cytophaga-Flavobacterium-Bacteroides group and reclassification of “Flectobacillus glomeratus” asPolaribacter glomeratus comb. nov. Int. J. Syst. Bacteriol. 48(Pt 1), 223–235. doi:10.1099/00207713-48-1-223
Guo, L., Ping, C.-L., and Macdonald, R. W. (2007). Mobilization pathways oforganic carbon from permafrost to arctic rivers in a changing climate. Geophys.Res. Lett. 34, L13603. doi: 10.1029/2007GL030689
Hawkings, J. R., Wadham, J. L., Tranter, M., Lawson, E., Sole, A., Cowton,T., et al. (2015). The effect of warming climate on nutrient and soluteexport from the Greenland Ice Sheet. Geochem. Perspect. Lett. 1, 94–104. doi:10.7185/geochemlet.1510
Frontiers in Microbiology | www.frontiersin.org 15 September 2016 | Volume 7 | Article 1474
Hauptmann et al. Red River’s Bacterial Communities
Kirchman, D. L., Dittel, A. I., Malmstrom, R. R., and Cottrell, M. T. (2005).Biogeography of major bacterial groups in the Delaware Estuary. Limnol.Oceanogr. 50, 1697–1706. doi: 10.4319/lo.2005.50.5.1697
Kling, G. W., Kipphut, G. W., and Miller, M. C. (1991). Arctic Lakes and Streamsas Gas Conduits to the Atmosphere: implications for tundra carbon budgets.Science 251, 298–301. doi: 10.1126/science.251.4991.298
Lawson, E. C., Wadham, J. L., Tranter, M., Stibal, M., Lis, G. P., Butler,C. E. H., et al. (2014). Greenland Ice Sheet exports labile organic carbonto the Arctic oceans. Biogeosciences 11, 4015–4028. doi: 10.5194/bg-11-4015-2014
Lee, K.-B., Liu, C.-T., Anzai, Y., Kim, H., Aono, T., and Oyaizu, H.(2005). The hierarchical system of the “Alphaproteobacteria”: descriptionof Hyphomonadaceae fam. nov., Xanthobacteraceae fam. nov. andErythrobacteraceae fam. nov. Int. J. Syst. Evol. Microbiol. 55, 1907–1919.doi: 10.1099/ijs.0.63663-0
Lennon, J. T., and Jones, S. E. (2011). Microbial seed banks: the ecological andevolutionary implications of dormancy. Nat. Rev. Microbiol. 9, 119–130. doi:10.1038/nrmicro2504
Markussen, T. N., Elberling, B., Winter, C., and Andersen, T. J. (2016). Flocculatedmeltwater particles control Arctic land-sea fluxes of labile iron. Sci. Rep.6:24033. doi: 10.1038/srep24033
Meon, B., and Amon, R. M. W. (2004). Heterotrophic bacterial activity andfluxes of dissolved free amino acids and glucose in the Arctic rivers Ob,Yenisei and the adjacent Kara Sea. Aquat. Microb. Ecol. 37, 121–135. doi:10.3354/ame037121
Mountfort, D. O., Rainey, F. A., Burghardt, J., Kaspar, H. F., and Stackebrandt,E. (1998). Psychromonas antarcticus gen. nov., sp. nov., a new aerotolerantanaerobic, halophilic psychrophile isolated from pond sediment of theMcMurdo Ice Shelf, Antarctica. Arch. Microbiol. 169, 231–238. doi:10.1007/s002030050566
Mueller, D. R., Vincent, W. F., and Jeffries, M. O. (2003). Break-up of the largestArctic ice shelf and associated loss of an epishelf lake. Geophys. Res. Lett. 30,2031. doi: 10.1029/2003gl017931
Nelson, C. E., Sadro, S., and Melack, J. M. (2009). Contrasting the influencesof stream inputs and landscape position on bacterioplankton communitystructure and dissolved organic matter composition in high-elevationlake chains. Limnol. Oceanogr. 54, 1292–1305. doi: 10.4319/lo.2009.54.4.1292
Niño-García, J. P., Ruiz-González, C., and del Giorgio, P. A. (2016).Interactions between hydrology and water chemistry shape bacterioplanktonbiogeography across boreal freshwater networks. ISME J. 10, 1755–1766. doi:10.1038/ismej.2015.226
Oksanen, J., Blanchet, F. G., Kindt, R., Legendre, P., Minchin, P. R., O’Hara, R.B., et al. (2015). vegan: Community Ecology Package. R package version 2.2–1.Available online at: http://CRAN.R-project.org/package=vegan
Patel, R. K., and Jain, M. (2012). NGS QC Toolkit: a toolkit for qualitycontrol of next generation sequencing data. PLoS ONE 7:e30619. doi:10.1371/journal.pone.0030619
Peter, H., and Sommaruga, R. (2016). Shifts in diversity and function of lakebacterial communities upon glacier retreat. ISME J. 10, 1545–1554. doi:10.1038/ismej.2015.245
Pujalte, M. J., Lucena, T., Ruvira, M. A., Arahal, D. R., and Macián, M. C.(2014). “The Family Rhodobacteraceae” in The Prokaryotes, eds E. Rosenberg,E. F. DeLong, S. Lory, E. Stackebrandt, and F. Thompson (Berlin; Heidelberg:Springer), 439–512.
R Development Core Team (2008). R: A Language and Environment for StatisticalComputing. Vienna: R Foundation for Statistical Computing. Available onlineat: http://www.R-project.org
Ruiz-González, C., Niño-García, J. P., and del Giorgio, P. A. (2015). Terrestrialorigin of bacterial communities in complex boreal freshwater networks. Ecol.Lett. 18, 1198–1206. doi: 10.1111/ele.12499
Serreze, M. C., Walsh, J. E., Iii, F. S. C., Osterkamp, T., Dyurgerov, M.,Romanovsky, V., et al. (2000). Observational evidence of recent change in
the northern high-latitude environment. Clim. Change 46, 159–207. doi:10.1023/A:1005504031923
Shannon, C. E. (1948). A mathematical theory of communication. Bell Syst. Tech.J. 27, 379–423.
Shivaji, S., and Reddy, G. S. (2014). Phylogenetic analyses of the genus Glaciecola:emended description of the genus Glaciecola, transfer of Glaciecola mesophila,G. agarilytica, G. aquimarina, G. arctica, G. chathamensis, G. polaris and G.psychrophila to the genus Paraglaciecola gen. nov. as Paraglaciecola mesophilacomb. nov., P. agarilytica comb. nov., P. aquimarina comb. nov., P. arcticacomb. nov., P. chathamensis comb. nov., P. polaris comb. nov. and P.psychrophila comb. nov., and description of Paraglaciecola oceanifecundanssp. nov., isolated from the Southern Ocean. Int. J. Syst. Evol. Microbiol. 64,3264–3275. doi: 10.1099/ijs.0.065409-0
Sinclair, L., Osman, O. A., Bertilsson, S., and Eiler, A. (2015). Microbial communitycomposition and diversity via 16S rRNA gene amplicons: evaluating theillumina platform. PLoS ONE 10:e16955. doi: 10.1371/journal.pone.0116955
Sorokin, D. Y. (1995). Sulfitobacter pontiacus gen. nov. sp. nov. - a newheterotrophic bacterium from the black sea, specialized on sulfite oxidation.Microbiology 64, 354–365.
Urakawa, H., Kita-Tsukamoto, K., Steven, S. E., Ohwada, K., and Colwell, R. R.(1998). A proposal to transfer Vibrio marinus (Russell 1891) to a new genusMoritella gen. nov. as Moritella marina comb. nov. FEMS Microbiol. Lett. 165,373–378. doi: 10.1111/j.1574-6968.1998.tb13173.x
Vallieres, C., Retamal, L., Ramlal, P., Osburn, C. L., and Vincent, W. F.(2008). Bacterial production and microbial food web structure in a largearctic river and the coastal Arctic Ocean. J. Mar. Syst. 74, 756–773. doi:10.1016/j.jmarsys.2007.12.002
Van Landschoot, A., and De Ley, J. (1983). Intra- and intergeneric similaritiesof the rRNA cistrons of Alteromonas, Marinomonas (gen. nov.) andsome other gram-negative bacteria. J. Gen. Microbiol. 129, 3057–3074. doi:10.1099/00221287-129-10-3057
Wells, L. E., Cordray, M., Bowerman, S., Miller, L. A., Vincent, W. F., and Deming,J. W. (2006). Archaea in particle-rich waters of the Beaufort Shelf and FranklinBay, Canadian Arctic: Clues to an allochthonous origin? Limnol. Oceanogr. 51,47–59. doi: 10.4319/lo.2006.51.1.0047
Worldview (2013). The Earth Observing System Data and Information System(EOSDIS). NASA, USA. Available online at: https://worldview.earthdata.nasa.gov/
Yakimov, M. M., Giuliano, L., Gentile, G., Crisafi, E., Chernikova, T. N.,Abraham, W.-R., et al. (2003). Oleispira antarctica gen. nov., sp. nov., a novelhydrocarbonoclastic marine bacterium isolated from Antarctic coastal seawater. Int. J. Syst. Evol. Microbiol. 53, 779–785. doi: 10.1099/ijs.0.02366-0
Yamada, T., Sekiguchi, Y., Hanada, S., Imachi, H., Ohashi, A., Harada, H., et al.(2006). Anaerolinea thermolimosa sp. nov., Levilinea saccharolytica gen. nov.,sp. nov. and Leptolinea tardivitalis gen. nov., sp. nov., novel filamentousanaerobes, and description of the new classes Anaerolineae classis nov. andCaldilineae classis nov. in the bacterial phylum Chloroflexi. Int. J. Syst. Evol.Microbiol. 56, 1331–1340. doi: 10.1099/ijs.0.64169-0
Zhang, J., Kobert, K., Flouri, T., and Stamatakis, A. (2014). PEAR: a fast andaccurate Illumina Paired-End reAd mergeR. Bioinformatics 30, 614–620. doi:10.1093/bioinformatics/btt593
Conflict of Interest Statement: The authors declare that the research wasconducted in the absence of any commercial or financial relationships that couldbe construed as a potential conflict of interest.
Copyright © 2016 Hauptmann, Markussen, Stibal, Olsen, Elberling, Bælum,Sicheritz-Pontén and Jacobsen. This is an open-access article distributed under theterms of the Creative Commons Attribution License (CC BY). The use, distribution orreproduction in other forums is permitted, provided the original author(s) or licensorare credited and that the original publication in this journal is cited, in accordancewith accepted academic practice. No use, distribution or reproduction is permittedwhich does not comply with these terms.
Frontiers in Microbiology | www.frontiersin.org 16 September 2016 | Volume 7 | Article 1474
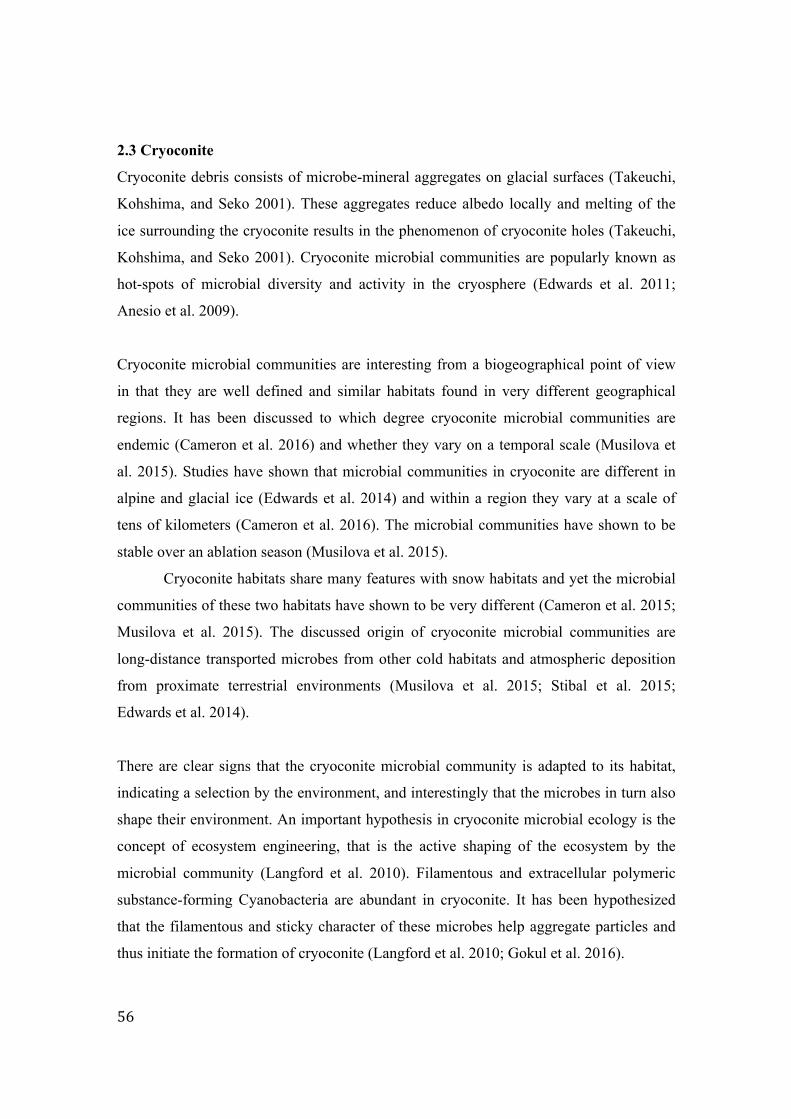
"
"56"
2.3 Cryoconite
Cryoconite debris consists of microbe-mineral aggregates on glacial surfaces (Takeuchi,
Kohshima, and Seko 2001). These aggregates reduce albedo locally and melting of the
ice surrounding the cryoconite results in the phenomenon of cryoconite holes (Takeuchi,
Kohshima, and Seko 2001). Cryoconite microbial communities are popularly known as
hot-spots of microbial diversity and activity in the cryosphere (Edwards et al. 2011;
Anesio et al. 2009).
Cryoconite microbial communities are interesting from a biogeographical point of view
in that they are well defined and similar habitats found in very different geographical
regions. It has been discussed to which degree cryoconite microbial communities are
endemic (Cameron et al. 2016) and whether they vary on a temporal scale (Musilova et
al. 2015). Studies have shown that microbial communities in cryoconite are different in
alpine and glacial ice (Edwards et al. 2014) and within a region they vary at a scale of
tens of kilometers (Cameron et al. 2016). The microbial communities have shown to be
stable over an ablation season (Musilova et al. 2015).
Cryoconite habitats share many features with snow habitats and yet the microbial
communities of these two habitats have shown to be very different (Cameron et al. 2015;
Musilova et al. 2015). The discussed origin of cryoconite microbial communities are
long-distance transported microbes from other cold habitats and atmospheric deposition
from proximate terrestrial environments (Musilova et al. 2015; Stibal et al. 2015;
Edwards et al. 2014).
There are clear signs that the cryoconite microbial community is adapted to its habitat,
indicating a selection by the environment, and interestingly that the microbes in turn also
shape their environment. An important hypothesis in cryoconite microbial ecology is the
concept of ecosystem engineering, that is the active shaping of the ecosystem by the
microbial community (Langford et al. 2010). Filamentous and extracellular polymeric
substance-forming Cyanobacteria are abundant in cryoconite. It has been hypothesized
that the filamentous and sticky character of these microbes help aggregate particles and
thus initiate the formation of cryoconite (Langford et al. 2010; Gokul et al. 2016).
" " "" " "
"" " " 57"
Studies of cryoconite have shown very different fractions of Cyanobacteria in these
communities (Franzetti et al. 2016; Cameron et al. 2016; Edwards et al. 2014).
This is also interesting as Cyanobacteria could be important for producing bio-available
carbon in these isolated and resource scarce ecosystems (Cameron et al. 2016). This
Cyanobacteria discrepancy was also discussed for the snow environment and has yet to
be resolved.
PAPER III: Contamination of the Arctic reflected in microbial metagenomes from
the Greenland ice sheet
Paper III illustrates the global context of a cryosphere community and how extensive data
from the newest NGS technologies enabled the proposal of new hypotheses. The idea of
contamination of the cryosphere is not new (Edwards et al. 2013; Møller et al. 2010), but
through broad and deep sequencing and through the extraction of full genomes from
shotgun metagenomes Paper III paints a picture of a community adapted to contamination
to a previously unacknowledged degree. While the results are obvious, they could easily
have been overlooked if the right question had not been asked. The large amounts of data
only revealed the presence of genes and genomes related to contamination through in-
depth assessments of the data. Had we not posed an initial hypothesis regarding the
potential adaptation of the cryoconite community to a contaminated habitat, we would
not have obtained this result. This shows the importance of hypotheses in cryosphere
biogeography, while also illustrating the potential for NGS data to test stated hypotheses.
There are several interesting implications of the results from Paper III.
First, it is likely that the cryoconite microbial community has adapted not only to
currently deposited contaminants but also to the accumulated contaminants trapped in the
ice deposited through decades. In this way, the microbial community of this seemingly
isolated environment is shaped not only by global influences, but influences from an
extensive temporal dimension in addition to the great spatial dimension. This supports the
suggestions for future biogeography research described in the Microbial Biogeography
section of part I of this thesis. According to this, biogeography research should aim at
sampling systematically to better distinguish between contemporary and historical factors
(Martiny et al. 2006).
"
"58"
Secondly, there was a surprising similarity between patterns in human
contamination around the coast of Greenland and microbial contamination expressed by
genes associated with contaminants corresponding to those found in Inuit. This
encourages further studies in the link between deposited contaminants in the cryosphere,
the entry of contaminants at the bottom of the food chain, and the bioaccumulation of
contaminants all the way through the food chain.
The notable presence of contamination-related genes and genomes suggests that
contaminants are a major factor in shaping the microbial community in cryoconite. In a
community with higher diversity of microbes and with less limited resources the
signature of contamination might not have been as strong as seen for cryoconite. Also
therefore, cryoconite microbial communities might serve as a good indicator of entry of
contaminants into an ecosystem and potentially the food chain.
In Paper III it was possible to extract 29 genomes from shotgun metagenomic
data, of which 16 genomes were complete according to their content of single copy
housekeeping genes. The method used for extracting genomes (Nielsen et al. 2014)
performed well on this relatively simple microbial community, while the same method
tested on the complex community of permafrost samples prior to this study did not
perform equally well (unpublished data). This illustrates well how the large amounts of
data generated by NGS technologies poses difficulties and how we are gradually
increasing our potential for exploring complex microbial communities through new
bioinformatical tools.
For 56% of the binned genomes the closest neighbors were organisms known to be able
to grow filamentously. As described above, previously ecosystem engineering of
cryoconite ecosystems has been attributed to the Cyanobacterial fraction of the
community alone. The binned genomes suggest that members of the cryoconite
community other than Cyanobacteria, including also heterotrophs, may play a role in the
function of ecosystem engineers. These results were not included in the study as this was
not part of the focus.
! 59!
Contamination of the Arctic reflected in microbial metagenomes from the 1!Greenland ice sheet 2! 3!Hauptmann, Aviaja L.1,2.; Sicheritz-Pontén, Thomas1; Cameron, Karen A.3,4,5; 4!Bælum, Jacob6; Plichta, Damian R.7; Dalgaard, Marlene1; and Stibal, Marek8 5! 6!1Department of Bio and Health Informatics, The Technical University of Denmark, 7!Kgs. Lyngby, Denmark 8!2Novo Nordisk Center for Biosustainability, The Technical University of Denmark, 9!Kgs. Lyngby, Denmark 10!3Department of Geochemistry, Geological Survey of Denmark and Greenland 11!(GEUS), Copenhagen, Denmark 12!4Center for Permafrost (CENPERM), University of Copenhagen, Copenhagen, 13!Denmark 14!5Institute of Biological, Environmental & Rural Sciences (IBERS), Aberystwyth 15!University, Penglais, Aberystwyth, UK. 16!6Chr. Hansen A/S, Hørsholm, Denmark 17!7Clinical-Microbiomics, Copenhagen, Denmark 18!8Department of Ecology, Charles University, Prague, Czech Republic 19! 20!Abstract 21!Globally emitted contaminants accumulate in the Arctic and are stored in the frozen 22!environments of the cryosphere. Climate change influences the release of these 23!contaminants through elevated melt rates, resulting in increased contamination 24!locally. Our understanding of how biological processes impact Arctic contamination 25!is limited. Through shotgun metagenomic data and binned genomes from 26!metagenomes we show that microbial communities, sampled from multiple surface 27!ice locations on the Greenland ice sheet, have the potential for degradation of, and 28!resistance to contaminants, which is suggestive of their adaptation to contaminated 29!habitats. Bacterial potential to degrade anthropogenically-sourced contaminants, such 30!as toxic and persistent polychlorinated biphenyls, was found to be spatially variable. 31!These results indicate that microbial communities of the Greenland ice sheet might 32!serve as a signature for first entry of contaminants into the Arctic food chain. We 33!

!60!
propose that cryoconite communities may act as first-response indicators of 34!Greenland ice sheet contamination. 35! 36!Introduction 37!The Arctic ecosystem and food chain is strongly influenced by anthropogenic 38!contaminants1. Long-range atmospheric transport is the major determinant in the 39!global distribution of contaminants2. Contaminants from around the globe become 40!trapped within the snow and ice of the cryosphere, resulting in these regions acting as 41!reservoirs of toxic chemicals2. 42! Climate change and concurrent increased melting of the cryosphere has 43!resulted in increased release of contaminants to the polar regions2,3. Melting glaciers 44!are becoming secondary sources of contaminants such as persistent organic pollutants 45!(POPs). Specifically, melting mountain glaciers are considered local sources for POPs 46!such as polychlorinated biphenyls (PCBs)2,4. Dynamic interconnections exists 47!between historic and current emissions for POPs, the cryosphere and climate change, 48!and it has been shown that climate change has lead to increased release of POPs from 49!Alpine glaciers since the 1990s3. 50! The role that microbial communities play in the fate of Arctic contaminants 51!has been identified as a knowledge-gap2. Microbial communities sampled from 52!cryoconite holes, that is supraglacial holes containing mineral-microbe aggregates, 53!have been shown to harbor genes associated with heavy metal resistance5. Cultured 54!isolates from cryoconite communities are known to be able to degrade xenobiotics 55!including PCBs6. Cryoconite microbial communities from the Greenland ice sheet 56!incubated under in situ conditions are able to degrade pesticides, suggesting that the 57!supraglacial microbial community might remove a fraction of the contaminants 58!deposited to this environment before they can be released to downstream ecosystems7. 59!Similarly, it has been suggested that bacteria in snow might lower the risk of bio-60!available mercury being incorporated into Arctic food chains8. The potential for 61!mercury reduction among microbes in Arctic coastal seawater has been found to be 62!able to account for most of the Hg(0) that is produced in high Arctic waters9. Mercury 63!concentrations in snow have been found to correlate with mercury resistance gene 64!copy numbers of snow microbiota10. In the culturable fraction of Bacteria in snow 65!from the high Arctic, 31% of the community were shown to be mercury-resistant, 66!compared to less than 2% in proximate environments of freshwater and brine8. 67!
! 61!
In this study we address the potential for degradation and resistance to 68!contamination by microbial communities sampled from cryoconite around the 69!Greenland ice sheet. Industrial emissions have resulted in deposited contaminants 70!such as black carbon on the Greenland ice sheet since the 1850s11. We hypothesized 71!that contaminants deposited on the nutrient-limited Greenland ice sheet influence the 72!microbial community composition, resulting in microbiota with the ability to utilize 73!and resist long-distance transported contaminants including PCBs, polycyclic 74!aromatic hydrocarbons (PAHs) and heavy metals such as mercury and lead. To the 75!best of our knowledge this is the largest shotgun metagenomic dataset of cryoconite to 76!date, and the first investigation that puts focus on cryoconite as a contaminated 77!habitat. 78! 79!Materials and Methods 80! 81!Sampling 82!Sampling has been described previously 12,13. In short, 34 cryoconite samples were 83!collected from the Greenland ice sheet in five different locations between May and 84!September 2013. Locations were Tasiilaq (TAS) in Southeast Greenland, Qassimiut 85!(QAS) in Southwest Greenland, Kangerlussuaq (KAN) in West Greenland and Dark 86!Site (DS) also in West Greenland, just inland from the Disko Bay area, and lastly 87!Thule (THU) in Northwest Greenland. Sample details and map of sampling sites are 88!available from previously published results 12,13. Within sampling regions A,B and C 89!samples were sampled 500 meters apart, within these samples 1,2 and 3 were sampled 90!10 meters apart and finally within these samples a and b were sampled 20 cm apart. 91! 92!Library preparation and Sequencing 93!DNA extraction was performed as previously described in Cameron et al., 201612. 94!DNA shearing and library preparations were performed according to the 95!NEXTflex Rapid DNA-Seq Kit, V13.08 (Bioo Scientific, Austin, TX, USA). 96!Briefly, 250ng genomic DNA was sheared by Covaris E210 System using 10% duty 97!cycle, intensity of 5 cycles per burst of 200 for 300 seconds to create 200bp 98!fragments. The samples were end-repaired and adenylated to produce an A-overhang. 99!Adapters containing unique barcodes were ligated on to the DNA. Samples were then 100!

!62!
purified using bead size selection for a selection range around 300-400bp with the 101!Agercount AMPure XP beads (Beckman Culter, Beverly, MA, USA). 102!The purified DNA libraries were amplified with a denaturation time of 2 minutes at 103!98°C, followed by 12 cycles of denaturation at 98°C for 30 seconds, annealing at 104!65°C for 30 seconds and extension at 72°C for 1 minute according to the protocol. 105!The final extension was performed at 72°C for 4 minutes. Amplification was followed 106!by DNA quantification using NanoDrop ND-1000 UV-VIS Spectrophotometer 107!(Thermo Fisher Scientific, Waltham, MA, USA) and the quality was checked on an 108!agilent 2100 Bioanalyzer using the Bioanalyser DNA High sensitivity (Agilent 109!Technologies, Santa Clara, CA, USA). Library preparation was performed by in-110!house facilities (DTU Multi-Assay Core (DMAC), Technical University of Denmark). 111!DNA libraries were mixed into 9 pools in equimolar ratios, resulting in 5 samples per 112!sequencing lane. Sequencing was performed as a 100 bp paired-end run on HiSeq 113!2000 (Illumina Int., San Diego, CA, USA) following the manufacturer’s 114!recommendations. 115! 116!Demultiplexing and Data Quality Check 117!The number of different barcodes in raw sequencing files were counted prior to 118!demultiplexing into individual sample files. This was done in order to confirm that all 119!barcodes were represented in roughly equal numbers in the sequencing output, and to 120!check for contamination. Demultiplexed files for each of the samples from nine lanes 121!of Illumina HiSeq sequencing were concatenated to obtain one complete sample file 122!in fastq format14. Data quality was assessed using FastQC version 0.11.215 and reads 123!were trimmed for bad quality bases and Illumina adaptors using Cutadapt16 through 124!MGmapper version 2.517. Cutadapt settings were used with a minimum phred score 125!for base quality of 30, and minimum read length of 30bp. 126! 127!Scaffold Assembly and Gene Calling 128!Quality trimmed fastq files were assembled using idba_ud assembler version 1.1.1. 129!with pre-correction18. Prokaryotic open reading frames were called using Prodigal 130!version 2.6.219. 131! 132! 133! 134!

! 63!
Binning of genomes 135!Files with genes called by Prodigal for each sample were concatenated into a gene 136!catalogue and each entry was given a unique header. The gene catalogue was 137!clustered to reduce homology at 95% identity using USEARCH package cluster_fast 138!version 8.1.186120. Centroids from the clustering were used in downstream analyses. 139!For each sample raw reads were mapped against the indexed gene catalogue using 140!bwa mem version 0.7.1221. Samtools version 0.1.1822 was used to sort and convert 141!sam format files from mapping to bam format files. An in house python script was 142!used to count number of reads mapping to genes in the gene catalogue and the read 143!counts were assembled into a count matrix with an in house perl script. The count 144!matrix was rarefied to the depth of the shallowest sample with a depth of 49,671,209 145!read counts per sample. This was done using the Vegan package rrarefy23 in R Studio 146!version 0.99.90324. Genome bins were clustered based on gene co-abundance with the 147!Canopy Clustering method with max canopy distance 0.1 and max merge distance 148!0.0525. A total of 29 bins with correlation to profile > 0.95 and between 3000 and 149!8000 genes were assembled from contigs to which binned genes belonged. The 150!quality of the binned genomes was tested with Checkm26. The genomes were 151!annotated and further assessed in RAST27. When comparing binned genomes with 152!control genomes in RAST the control genomes used were Escherichia coli 536 153!publicly available in RAST (control 1), Lactobacillus casei ATCC 334 also publicly 154!available in RAST (control 2) as well as Belliella baltica DSM 1588328 (control 3). 155! 156!MGmapper – taxonomic composition 157!MGmapper version 2.517 was used to remove PhiX and map reads from each sample 158!against genome databases of Bacteria and Bacteria draft genomes. Results from 159!mapping to the bacterial databases were used for making stacked barplot of 160!taxonomic composition. Parameters for mapped reads included in taxonomic 161!composition were properly paired reads, alignment score >30, minimum coverage 162!80% resulting in minimum identity of 86%, minimum 10 reads mapped to a strain for 163!it to be evaluated as true. 164! 165! 166! 167! 168!

!64!
Differential potential for degradation of xenobiotics and heavy metal resistance 169!Genes in the rarefied count matrix were annotated by blasting against KEGG 170!database29 using Diamond blastx version 0.7.930 resulting in BLAST tabular m8 171!format sequence IDs. Only genes from the original gene catalogue with blast hits E-172!value < 1e-50 were included in counts. There were several genes in the count matrix 173!with identical sequence IDs although the count matrix is based on homology-reduced 174!genes. This can be explained by the fact that homology reduction is sequence based 175!and entries in the count matrix from different parts of a gene would have the same 176!annotation but would not be combined in the homology reduction step (USEARCH 177!cluster_fast). The counts of identical sequence IDs were combined and information on 178!gene names and EC-numbers were added to each entry in the annotated and combined 179!count matrix using in house perl scripts. Entries in the count matrix with identical 180!gene names and EC-numbers were again combined (scripts are available upon 181!request). 182!The genetic potential for degradation or resistance to a number of contaminants were 183!selected based on known contaminants in the Arctic food chain1. Based on KEGG29 184!K0 numbers or gene names the number of reads mapping to responsible genes were 185!extracted from the rarefied count matrix. 186!For PCB degradation K08689, K08690, K00462 and K10222 were found in the count 187!matrix29. For PAH degradation EC-numbers 1.1.1.256, 1.13.11.3, 1.13.11.38, 188!1.13.11.8, 1.14.12.12, 1.14.12.15, 1.14.12.7, 1.14.13.1, 1.14.13.23, 1.2.1.78, 1.3.1.19, 189!1.3.1.29, 1.3.1.49, 1.3.1.53, 1.3.1.64, 3.1.1.35, 4.1.1.55, 4.1.1.69, 4.1.2.34 were 190!searched for29. For heavy metal resistance genes czc, chr, ncc and mer31 as well as 191!Pbr32 genes were extracted from the count matrix. 192!
Of other contaminants listed as important for the Arctic food chain1 PFOS 193!were not assessed as evidence suggests that these are not degraded by bacteria33. 194!PBDEs were also not assessed as it is still unknown which genes are responsible for 195!degradation34. 196! 197! 198! 199! 200! 201!
! 65!
For plotting the number of reads mapped to degradation and resistance genes and for 202!comparison between samples, the total number of reads mapped to target genes were 203!divided by the total number of reads mapped to 14 genes that have been found to be 204!present in most bacterial genomes35. This was used as a measure of an internal 205!constant, since the number of these genes could be expected not to differ between 206!organisms. In this way, we obtained an approximation of the fraction of degradation 207!and resistance genes in a sample. 208! 209!Two metagenomic samples of healthy human gut were run through the same pipeline 210!as described above. These samples were used as negative controls, and in particular, 211!to confirm that genes detected for contaminant degradation and resistance were not 212!background artifacts. Human gut metagenomes were downloaded from the European 213!Nucleotide Archive study PRJEB122025. We assume that the healthy human guts 214!were non-contaminated. None of the contaminant related genes were found in these 215!negative controls. 216! 217!Results and Discussion 218! 219!Table 1: Genome bin overview 220!
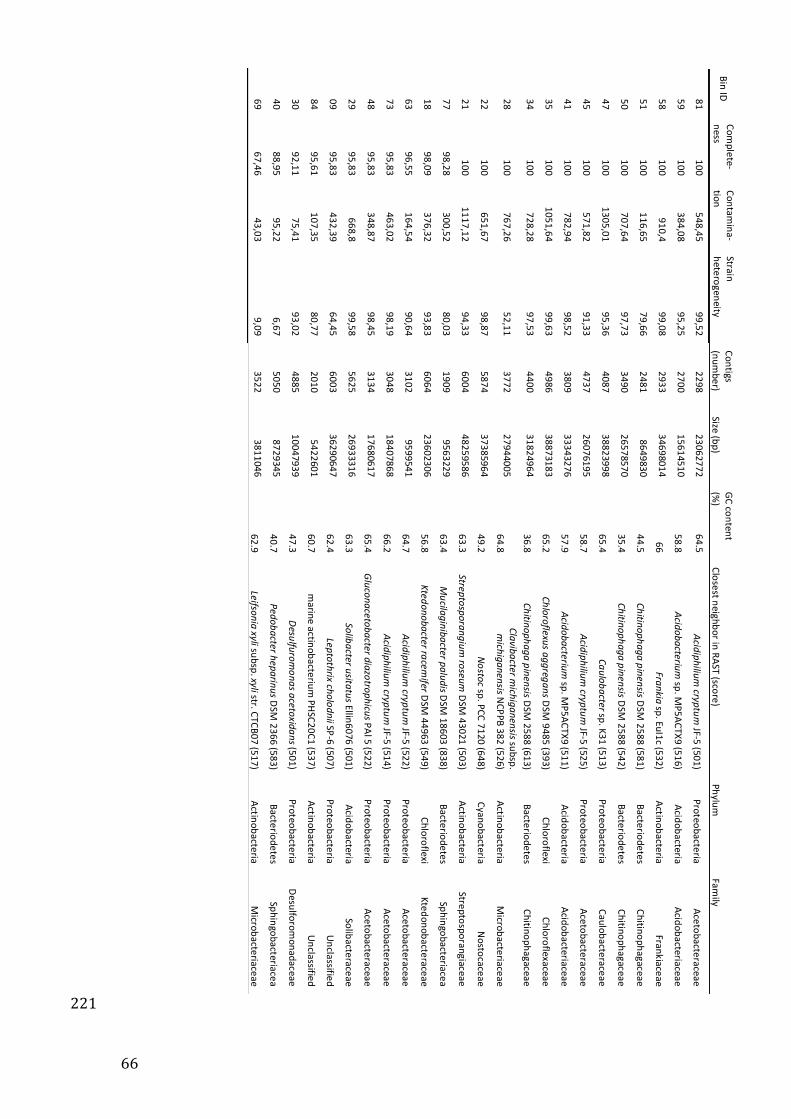
!66!
221!
Bin$ID
$Complete.
ness$
Contamina.
tion$
Stra
in$
heterogeneity
$
Contig
s$
(number)$
Size
$(bp)$
GC$co
ntent$
(%)$
Closest$n
eighbor$in
$RAST$(sco
re)$
Phylum$
Family$
81$
100$
548,45$
99,52$
2298$
23062772$
64.5$
Acidiphilium*cryptum
$JF.5$(5
01)$
Proteobacte
ria$
Acetobacte
raceae$
59$
100$
384,08$
95,25$
2700$
15614510$
58.8$
Acidobacterium$sp
.$MP5ACTX9$(5
16)$
Acid
obacte
ria$
Acid
obacte
riaceae$
58$
100$
910,4$
99,08$
2933$
34698014$
66$
Frankia$sp
.$EuI1c$(5
32)$
Actin
obacte
ria$
Frankiaceae$
51$
100$
116,65$
79,66$
2481$
8649830$
44.5$
Chitinophaga*pinensis$DSM$2588$(5
81)$
Bacte
riodetes$
Chitin
ophagaceae$
50$
100$
707,64$
97,73$
3490$
26578570$
35.4$
Chitinophaga*pinensis$DSM$2588$(5
42)$
Bacte
riodetes$
Chitin
ophagaceae$
47$
100$
1305,01$
95,36$
4087$
38823998$
65.4$
Caulobacter$sp.$K31$(5
13)$
Proteobacte
ria$
Caulobacte
raceae$
45$
100$
571,82$
91,33$
4737$
26076195$
58.7$
Acidiphilium*cryptum
$JF.5$(5
25)$
Proteobacte
ria$
Acetobacte
raceae$
41$
100$
782,94$
98,52$
3809$
33343276$
57.9$
Acidobacterium$sp
.$MP5ACTX9$(5
11)$
Acid
obacte
ria$
Acid
obacte
riaceae$
35$
100$
1051,64$
99,63$
4986$
38873183$
65.2$
Chloroflexus*aggregans$DSM$9485$(3
93)$
Chlorofle
xi$
Chlorofle
xaceae$
34$
100$
728,28$
97,53$
4400$
31824964$
36.8$
Chitinophaga*pinensis$DSM$2588$(6
13)$
Bacte
riodetes$
Chitin
ophagaceae$
28$
100$
767,26$
52,11$
3772$
27944005$
64.8$
Clavibacter*michiganensis$su
bsp.$
michiganensis$N
CPPB$382$(5
26)$
Actin
obacte
ria$
Micro
bacte
riaceae$
22$
100$
651,67$
98,87$
5874$
37385964$
49.2$
Nostoc$sp.$PCC$7120$(6
48)$
Cyanobacte
ria$
Nosto
caceae$
21$
100$
1117,12$
94,33$
6004$
48259586$
63.3$
Streptosporangium*roseum
$DSM$43021$(5
03)$
Actin
obacte
ria$
Stre
ptosporangiaceae$
77$
98,28$
300,52$
80,03$
1909$
9563229$
63.4$
Mucilaginibacter*paludis$D
SM$18603$(8
38)$
Bacte
riodetes$
Sphingobacte
riacea$
18$
98,09$
376,32$
93,83$
6064$
23602306$
56.8$
Ktedonobacter*racemifer$D
SM$44963$(5
49)$
Chlorofle
xi$
Ktedonobacte
raceae$
63$
96,55$
164,54$
90,64$
3102$
9599541$
64.7$
Acidiphilium*cryptum
$JF.5$(5
22)$
Proteobacte
ria$
Acetobacte
raceae$
73$
95,83$
463,02$
98,19$
3048$
18407868$
66.2$
Acidiphilium*cryptum
$JF.5$(5
14)$
Proteobacte
ria$
Acetobacte
raceae$
48$
95,83$
348,87$
98,45$
3134$
17680617$
65.4$
Gluconacetobacter*diazotrophicus$PAl$5$(5
22)$
Proteobacte
ria$
Acetobacte
raceae$
29$
95,83$
668,8$
99,58$
5625$
26933316$
63.3$
Solibacter*usitatus$Ellin
6076$(5
01)$
Acid
obacte
ria$
Solibacte
raceae$
09$
95,83$
432,39$
64,45$
6003$
36290647$
62.4$
Leptothrix*cholodnii$SP.6$(5
07)$
Proteobacte
ria$
Uncla
ssified$
84$
95,61$
107,35$
80,77$
2010$
5422601$
60.7$
marin
e$actin
obacte
rium$PHSC20C1$(5
37)$
Actin
obacte
ria$
Uncla
ssified$
30$
92,11$
75,41$
93,02$
4885$
10047939$
47.3$
Desulfuromonas*acetoxidans$(5
01)$
Proteobacte
ria$
Desulfo
romonadaceae$
40$
88,95$
95,22$
6,67$
5050$
8729345$
40.7$
Pedobacter*heparinus$DSM$2366$(5
83)$
Bacte
riodetes$
Sphingobacte
riacea$
69$
67,46$
43,03$
9,09$
3522$
3811046$
62.9$
Leifsonia*xyli$subsp.$xyli$str.$C
TCB07$(5
17)$
Actin
obacte
ria$
Micro
bacte
riaceae$
!
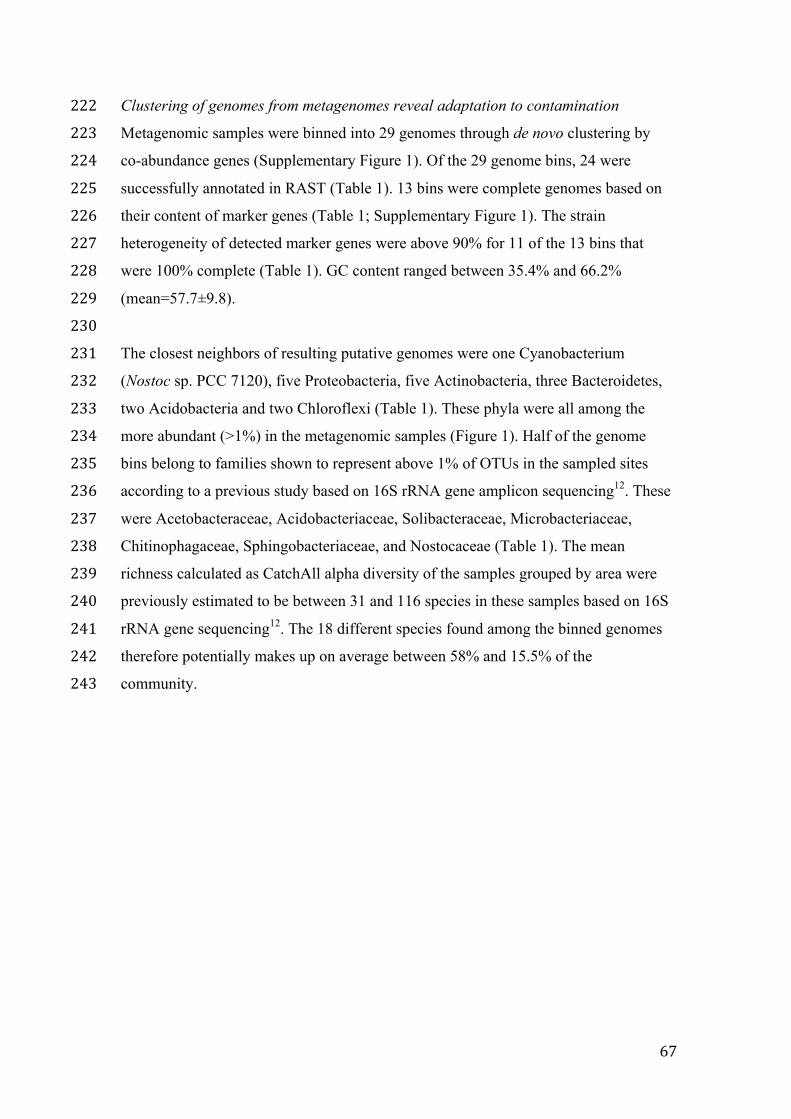
! 67!
Clustering of genomes from metagenomes reveal adaptation to contamination 222!Metagenomic samples were binned into 29 genomes through de novo clustering by 223!co-abundance genes (Supplementary Figure 1). Of the 29 genome bins, 24 were 224!successfully annotated in RAST (Table 1). 13 bins were complete genomes based on 225!their content of marker genes (Table 1; Supplementary Figure 1). The strain 226!heterogeneity of detected marker genes were above 90% for 11 of the 13 bins that 227!were 100% complete (Table 1). GC content ranged between 35.4% and 66.2% 228!(mean=57.7±9.8). 229! 230!The closest neighbors of resulting putative genomes were one Cyanobacterium 231!(Nostoc sp. PCC 7120), five Proteobacteria, five Actinobacteria, three Bacteroidetes, 232!two Acidobacteria and two Chloroflexi (Table 1). These phyla were all among the 233!more abundant (>1%) in the metagenomic samples (Figure 1). Half of the genome 234!bins belong to families shown to represent above 1% of OTUs in the sampled sites 235!according to a previous study based on 16S rRNA gene amplicon sequencing12. These 236!were Acetobacteraceae, Acidobacteriaceae, Solibacteraceae, Microbacteriaceae, 237!Chitinophagaceae, Sphingobacteriaceae, and Nostocaceae (Table 1). The mean 238!richness calculated as CatchAll alpha diversity of the samples grouped by area were 239!previously estimated to be between 31 and 116 species in these samples based on 16S 240!rRNA gene sequencing12. The 18 different species found among the binned genomes 241!therefore potentially makes up on average between 58% and 15.5% of the 242!community. 243!
!68!
244!Figure 1: Taxonomic composition across samples of A) most abundant Phyla (>1%) 245!and B) low abundant Phyla (≤1%) 246! 247!Among the closest neighbors to the binned genomes were a number of organisms 248!isolated from contaminated habitats or known to be resistant to contaminants. The 249!closest neighbor of bin 9, Leptothrix cholodnii SP-6, has received interest as a 250!potential bioremediation organism due to its ability to oxidize iron and manganese 251!and potential ability to sequester heavy metals36. Frankia sp. strain EuI1c, the closest 252!neighbor of bin 58, belongs to a group of organisms known to be less sensitive to 253!heavy metals such as lead and arsenic37 and this strain in particular has been shown to 254!have cellular mechanisms for increased copper tolerance38. The closest neighbor of 255!bin 47, Caulobacter sp. K31, was isolated from chlorophenol-contaminated 256!groundwater and has the ability to tolerate copper and chlorophenols39. Four of the 257!bin genomes (bins 81, 45, 73 and 63) were closest neighbors to Acidiphilium cryptum 258!JF-5, which was isolated from acidic coal mine lake in eastern Germany and was 259!shown to be able to reduce Fe(III)40. These binned putative genomes indicate that 260!cryoconite holes on the Greenland ice sheet are potentially contaminated habitats that 261!contain organisms with the ability to survive and utilize long-distance transported 262!contaminants. 263! 264!
DS−
1D
S−2
KAN
_P−A
2bKA
N_P−A
3aKA
N_P−B
3aKA
N_P−C
1aKA
N_P−C
2aKA
N_P−C
3aQ
AS−L
1Q
AS−L
2TA
S_L−
A1a
TAS_
L−A1
bTA
S_L−
A2a
TAS_
L−A2
bTA
S_L−
A3a
TAS_
L−A3
bTA
S_L−
B1a
TAS_
L−B1
bTA
S_L−
B2a
TAS_
L−B2
bTA
S_L−
B3a
TAS_
L−B3
bTA
S_L−
C1a
TAS_
L−C
1bTA
S_L−
C2a
TAS_
L−C
2bTA
S_L−
C3a
TAS_
L−C
3bTA
S_U−A
1aTA
S_U−A
1bTA
S_U−A
2aTA
S_U−A
2bTH
U−1
THU−2
A: Highly abundant Phyla (>1%)
Perc
enta
ge o
f rea
ds m
appe
d to
hig
hly
abun
dant
Phy
la (>
1%)
0
20
40
60
80
AcidobacteriaActinobacteriaArmatimonadetesBacteroidetesCandidatus SaccharibacteriaChlorobiChloroflexiCyanobacteriaDeinococcus−ThermusFirmicutesGemmatimonadetesPlanctomycetesProteobacteriaVerrucomicrobia
DS−
1D
S−2
KAN
_P−A
2bKA
N_P−A
3aKA
N_P−B
3aKA
N_P−C
1aKA
N_P−C
2aKA
N_P−C
3aQ
AS−L
1Q
AS−L
2TA
S_L−
A1a
TAS_
L−A1
bTA
S_L−
A2a
TAS_
L−A2
bTA
S_L−
A3a
TAS_
L−A3
bTA
S_L−
B1a
TAS_
L−B1
bTA
S_L−
B2a
TAS_
L−B2
bTA
S_L−
B3a
TAS_
L−B3
bTA
S_L−
C1a
TAS_
L−C
1bTA
S_L−
C2a
TAS_
L−C
2bTA
S_L−
C3a
TAS_
L−C
3bTA
S_U−A
1aTA
S_U−A
1bTA
S_U−A
2aTA
S_U−A
2bTH
U−1
THU−2
B: Low abundant Phyla (<=1%)
Perc
enta
ge o
f rea
ds m
appe
d to
low
abu
ndan
t Phy
la (<
=1%
)0.00
0.05
0.10
0.15
Aquificaecandidate division NC10Candidatus CampbellbacteriaCandidatus PeregrinibacteriaChlamydiaeChrysiogenetesDeferribacteresElusimicrobiaFibrobacteresFusobacteriaIgnavibacteriaeNitrospiraeSpirochaetesSynergistetesTenericutesThermotogaeUnclassified
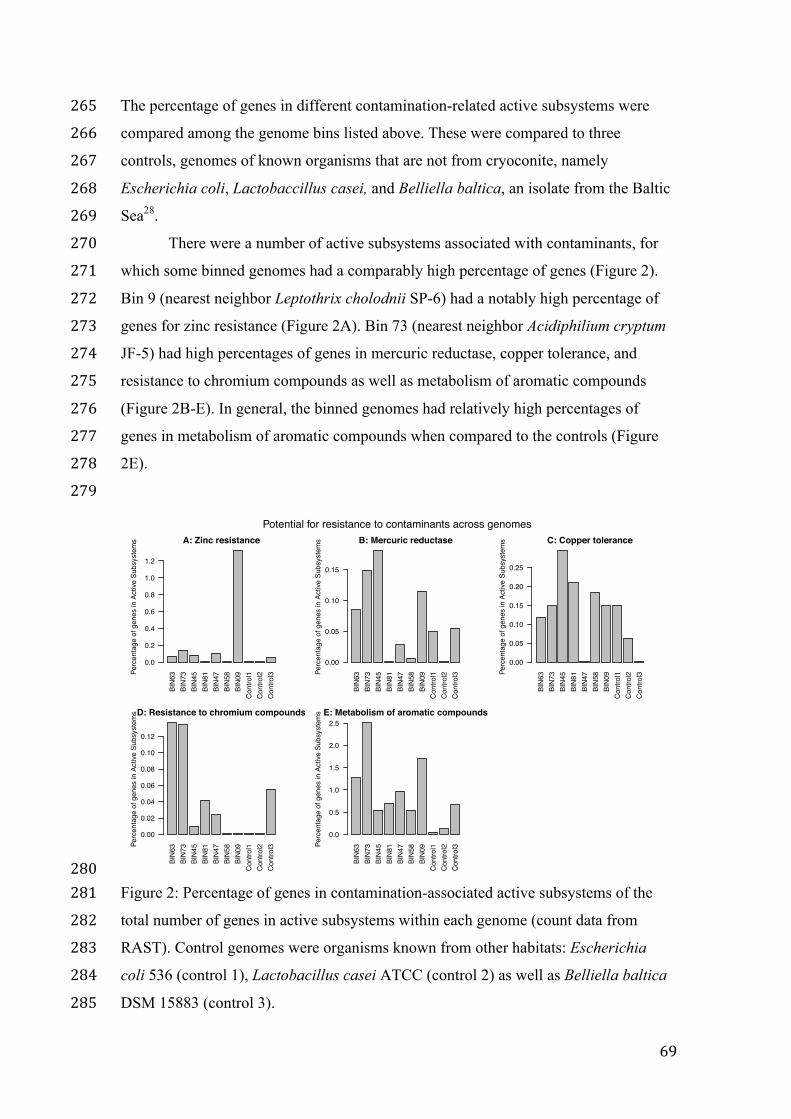
! 69!
The percentage of genes in different contamination-related active subsystems were 265!compared among the genome bins listed above. These were compared to three 266!controls, genomes of known organisms that are not from cryoconite, namely 267!Escherichia coli, Lactobaccillus casei, and Belliella baltica, an isolate from the Baltic 268!Sea28. 269!
There were a number of active subsystems associated with contaminants, for 270!which some binned genomes had a comparably high percentage of genes (Figure 2). 271!Bin 9 (nearest neighbor Leptothrix cholodnii SP-6) had a notably high percentage of 272!genes for zinc resistance (Figure 2A). Bin 73 (nearest neighbor Acidiphilium cryptum 273!JF-5) had high percentages of genes in mercuric reductase, copper tolerance, and 274!resistance to chromium compounds as well as metabolism of aromatic compounds 275!(Figure 2B-E). In general, the binned genomes had relatively high percentages of 276!genes in metabolism of aromatic compounds when compared to the controls (Figure 277!2E). 278! 279!
280!Figure 2: Percentage of genes in contamination-associated active subsystems of the 281!total number of genes in active subsystems within each genome (count data from 282!RAST). Control genomes were organisms known from other habitats: Escherichia 283!coli 536 (control 1), Lactobacillus casei ATCC (control 2) as well as Belliella baltica 284!DSM 15883 (control 3). 285!
BIN
63BI
N73
BIN
45BI
N81
BIN
47BI
N58
BIN
09C
ontro
l1C
ontro
l2C
ontro
l3
A: Zinc resistance
Perc
enta
ge o
f gen
es in
Act
ive S
ubsy
stem
s
0.0
0.2
0.4
0.6
0.8
1.0
1.2
BIN
63BI
N73
BIN
45BI
N81
BIN
47BI
N58
BIN
09C
ontro
l1C
ontro
l2C
ontro
l3
B: Mercuric reductase
Perc
enta
ge o
f gen
es in
Act
ive S
ubsy
stem
s
0.00
0.05
0.10
0.15
BIN
63BI
N73
BIN
45BI
N81
BIN
47BI
N58
BIN
09C
ontro
l1C
ontro
l2C
ontro
l3
C: Copper tolerance
Perc
enta
ge o
f gen
es in
Act
ive S
ubsy
stem
s
0.00
0.05
0.10
0.15
0.20
0.25
BIN
63BI
N73
BIN
45BI
N81
BIN
47BI
N58
BIN
09C
ontro
l1C
ontro
l2C
ontro
l3
D: Resistance to chromium compounds
Perc
enta
ge o
f gen
es in
Act
ive S
ubsy
stem
s
0.00
0.02
0.04
0.06
0.08
0.10
0.12
BIN
63BI
N73
BIN
45BI
N81
BIN
47BI
N58
BIN
09C
ontro
l1C
ontro
l2C
ontro
l3
E: Metabolism of aromatic compounds
Perc
enta
ge o
f gen
es in
Act
ive S
ubsy
stem
s
0.0
0.5
1.0
1.5
2.0
2.5
Potential for resistance to contaminants across genomes

!70!
Heavy metals mercury and lead, and persistent toxic compounds such as dichloro-286!diphenyl-trichloroethan (DDT) and polychlorinated biphenyls (PCB) are well-known 287!contaminants in Greenland and have been found to bio-accumulate in the food chain1. 288!Polycyclic aromatic hydrocarbons (PAHs) have been found on the Greenland ice 289!sheet41. Raw reads from each cryoconite community were mapped to microbial genes 290!associated with degradation or resistance to Arctic contaminants, including genes 291!involved in PCB, PAH and DDT degradation29 and genes for resistance to mercury 292!and lead31,32. Read counts were normalized to the number of reads mapped to 293!housekeeping genes in each sample (Figure 3A-E). 294! 295!
296!Figure 3: Read counts normalized to counts of reads mapped to housekeeping genes 297!for reads mapped to A) PCB degradation genes, B) PAH degradation genes 298!C) Mercury resistance genes, D) Lead resistance genes and E) general heavy metal 299!resistance genes. Note that counts in panel E have not been normalized to 300!housekeeping genes. 301! 302!All sample sites had reads that mapped to PCB degradation genes (Figure 3A). 303!Counts of reads mapped to PCB degradation genes were variable between samples 304!taken from each region. The highest number of reads mapped to PCB degradation 305!genes were found among the TAS samples from Tasiilaq in Southeast Greenland, 306!
0.00
000.
0005
0.00
100.
0015
A: Normalized PCB degradation gene read count
DS KAN QAS TAS THU
0.01
00.
015
0.02
00.
025
0.03
00.
035
B: Normalized PAH degradation gene read count
Rat
io o
f PAH
deg
r. re
ad c
ount
to H
ouse
keep
ing
gene
read
cou
nt
DS KAN QAS TAS THU
0.06
0.08
0.10
0.12
0.14
C: Normalized Hg resistance gene read count
Rat
io o
f Hg
res.
read
cou
nt to
Hou
seke
epin
g ge
ne re
ad c
ount
DS KAN QAS TAS THU
0e+0
01e−0
42e−0
43e−0
44e−0
45e−0
46e−0
4
D: Normalized Pb resistance gene read count
DS KAN QAS TAS THU8000
10000
12000
14000
16000
18000
E: Heavy metal resistance gene read count
DS−
1D
S−2
KAN
_P−A
2bKA
N_P−A
3aKA
N_P−B
3aKA
N_P−C
1aKA
N_P−C
2aKA
N_P−C
3aQ
AS−L
1Q
AS−L
2TA
S_L−
A1a
TAS_
L−A1
bTA
S_L−
A2a
TAS_
L−A2
bTA
S_L−
A3a
TAS_
L−A3
bTA
S_L−
B1a
TAS_
L−B1
bTA
S_L−
B2a
TAS_
L−B2
bTA
S_L−
B3a
TAS_
L−B3
bTA
S_L−
C1a
TAS_
L−C
1bTA
S_L−
C2a
TAS_
L−C
2bTA
S_L−
C3a
TAS_
L−C
3bTA
S_U−A
1aTA
S_U−A
1bTA
S_U−A
2aTA
S_U−A
2bTH
U−1
THU−2
! 71!
ranging from 0 (TAS-U-A1b) to 145 (TAS-L-C3b) reads per sample (normalized 307!counts 2.8e-4± 3.8e-4) (Figure 3A, Supplementary Table 1). Two TAS samples had 308!over twice as high counts of PCB degradation genes compared to all of the other 309!samples (1.70e-03 and 1.05e-03 PCB degradation reads/housekeeping reads). 310! The KAN samples from Kangerlussuaq had the most reads mapped to 311!degradation of PAHs followed by the THU (Thule) samples (Figure 3B). The 312!relatively high abundance in the KAN samples contrasts the pattern from the other 313!contaminants, where the KAN samples had relatively low abundance of reads (Figure 314!3A,C,D,E). PAHs are generated primarily through the incomplete combustion of 315!organic materials such as oil, petrol and wood42. The PAH content in snow from the 316!Kangerlussuaq region was assessed previously under the hypothesis that the 317!proximity of the site to the largest airport of Greenland could cause PAH 318!contamination41. While PAH contamination was found to be below detection limit in 319!the study, the results were inconsistent with previous results and well below the 320!concentrations found in near-by cryosphere environments41,43,44. The relatively high 321!abundance of reads mapping to PAH degradation genes in first Kangerlussuaq and 322!next Thule samples might be explained by the proximity of these sites to the largest 323!commercial airport of Greenland (Kangerlussuaq) and the Thule air base. 324!
The number of reads mapped to mercury resistance genes ranged from 4644 325!(KAN-P-A2b) to 10283 (TAS-L-B1b) (unnormalized counts 7671±1586.5). The 326!highest normalized read count of mercury resistance genes were also found in the 327!TAS samples (Figure 3C). The two QAS and the two THU samples had similar 328!counts, which were intermediate between the high TAS samples and the lower counts 329!in the DS and KAN samples (Figure 3C, Supplementary Table 1). Mercury 330!concentrations have been measured in the KAN, QAS, TAS and THU regions41. 331!Concentrations were lower in snow from Kangerlussuaq (KAN) and higher in the 332!South (QAS) and Southeast (TAS) (Supplementary Figure 2A), as seen for read 333!counts (Figure 3C). Interestingly, Inuit from Tasiilaq in Southeast Greenland have 334!also shown to have higher contamination with PCBs and mercury in recent years1. In 335!contrast, no reads from any of the samples mapped to DDT degradation. In the Arctic 336!regions concentrations of DDT have been declining since 1979 while PCB 337!concentrations started decreasing in 19861. 338!
Lead resistance read counts were found to have a distinct pattern of 339!abundance, with very high numbers in one of the DS samples in West Greenland and 340!
!72!
no reads in KAN and QAS samples in Southwest and South, respectively. The 341!number of reads mapped to lead resistance genes ranged between several samples 342!with 0 reads to 71 reads in the DS-1 sample (unnormalized counts 3.18±12.32). The 343!DS-1 sample had almost six times as many reads mapped to lead resistance genes as 344!the other samples (Figure 3D). In general, the KAN samples had lower numbers of 345!reads mapped to the combined set of heavy metal resistance genes (Figure 3E). Lead 346!concentrations on the Greenland ice sheet has been measured to be slightly higher in 347!the Thule (THU) region (Supplementary Figure 2B)41. The pattern for lead 348!concentrations (Supplementary Figure 2B) do not seem to resemple the pattern for 349!read counts of lead resistance genes (Figure 3D). 350!Inuit lead contamination has been shown to be similar across Greenland with slightly 351!lower contamination in Tasiilaq in Southeast Greenland1, in contrast to other 352!contaminants (Figure 3A-C,E), and in resemblance to the pattern observed for reads 353!mapped to lead resistance genes in cryoconite (Figure 3D). 354! 355!Our results show that microbial communities on the Greenland ice sheet have 356!differential potential for degradation and resistance to long-distance transported 357!contaminants known to the Arctic. These results suggest that deposition of 358!bioavailable compounds is one factor that shapes microbial communities in 359!cryoconite. The notion that supraglacial environments are innoculated through local 360!and long-range transport through the atmosphere has been discussed previously5,12,45–361!47. Previous reports from these sampling sites showed that area was the strongest 362!explanatory variable for community composition12. If microbial deposition from the 363!atmosphere solely shaped the supraglacial communities, factors such as altitude, 364!distance from the margin, position along the N-S transect as well as sample type (such 365!as ice and cryoconite) would have negligable effects, which is not the case12. 366! 367!Contamination of supraglacial environments is constantly occurring and contaminants 368!of previous times are locked into the ice at certain depths48. Temporal variability in 369!contaminant release should therefore be considered, and bioavailable contaminant 370!concentrations within cryoconite holes may indeed be dependent on the historic 371!deposition events of the exposed ice surfaces. In this respect, hundreds of years of 372!anthropogenic influence might be shaping cryosphere communities. It has been 373!established that current contaminations in higher trophic levels are largely caused by 374!

! 73!
past events49. This might also hold true for microbial communities, particularly in 375!supraglacial habitats where contaminants are locked in the ice. 376! 377!The observed pattern for microbial potential for degradation and resistance resembles 378!the one observed for the top of the food chain, the Inuit of Greenland. Our results 379!suggest that cryoconite microbial communities may serve as indicators for first entry 380!of contaminants into the Arctic food chain. This notion is not unlikely considering 381!that gene copy number of resistance genes is known to correlate with contaminant 382!concentrations in snow10, and melting of the cryosphere has been shown to release 383!contaminants into the downstream ecosystems2–4. Cryoconite microbial communities 384!may adapt to historic contaminants released from the melt of frozen waters, which 385!will be transported to downstream locations. Further studies are required in order to 386!better understand the biogeochemical relationships between microbial communities 387!and contaminants. This has important implications for the release of contaminants 388!into the ecosystem as a result of climate warming in the Arctic. 389! 390!Conclusions 391!The metagenome of the microbial community in cryoconite holes on the Greenland 392!ice sheet show clear potential for degradation and resistance to long-distance 393!transported contaminants including polychlorinated biphenyls (PCB), polycyclic 394!aromatic hydrocarbons (PAHs) and heavy metals including mercury and lead. Binned 395!genomes showed indications that the genomes and the closest neighbors of the 396!genomes have potential for degradation and resistance to contaminants, supporting the 397!idea that cryoconite is a polluted habitat. 398! 399!References 400!1. AMAP. AMAP Assessment 2015: Human Health in the Arctic. (2015). 401!2. Grannas, A. M. et al. The role of the global cryosphere in the fate of organic 402!
contaminants. Atmos. Chem. Phys. 13, 3271–3305 (2013). 403!3. Bogdal, C. et al. Release of Legacy Pollutants from Melting Glaciers: Model 404!
Evidence and Conceptual Understanding. Environ. Sci. Technol. 44, 4063–405!4069 (2010). 406!
4. Bogdal, C. et al. Blast from the Past": Melting Glaciers as a Relevant Source 407!for Persistent Organic Pollutants. Environ. Sci. Technol. 43, 8173–8177 (2009). 408!
!74!
5. Edwards, A. et al. A metagenomic snapshot of taxonomic and functional 409!diversity in an alpine glacier cryoconite ecosystem. Environ. Res. Lett. 8, 410!35003 (2013). 411!
6. Margesin, R., Zacke, G. & Schinner, F. Characterization of Heterotrophic 412!Microorganisms in Alpine Glacier Cryoconite. Arctic 34, 88–93 (2002). 413!
7. Stibal, M. et al. Microbial Degradation of 2,4-Dichlorophenoxyacetic Acid on 414!the Greenland Ice Sheet. Appl. Environ. Microbiol. 78, 5070–5076 (2012). 415!
8. Møller, A. K. et al. Diversity and characterization of mercury-resistant bacteria 416!in snow, freshwater and sea-ice brine from the High Arctic. FEMS Microbiol. 417!Ecol. 75, 390–401 (2011). 418!
9. Poulain, A. J. et al. Potential for Mercury Reduction by Microbes in the High 419!Arctic. Appl. Environ. Microbiol. 73, 2230–2238 (2007). 420!
10. Larose, C. et al. Interactions between Snow Chemistry, Mercury Inputs and 421!Microbial Population Dynamics in an Arctic Snowpack. PLoS One 8, e79972 422!(2013). 423!
11. McConnell, J. R. et al. 20th-Century Industrial Black Carbon Emissions 424!Altered Arctic Climate Forcing. Science (80-. ). 317, 1381–1384 (2007). 425!
12. Cameron, K. A. et al. Supraglacial bacterial community structures vary across 426!the Greenland ice sheet. FEMS Microbiol. Ecol. 92, (2016). 427!
13. Stibal, M. et al. Microbial abundance in surface ice on the Greenland Ice Sheet. 428!Front. Microbiol. 6, (2015). 429!
14. Cock, P. J. A., Fields, C. J., Goto, N., Heuer, M. L. & Rice, P. M. The Sanger 430!FASTQ file format for sequences with quality scores , and the Solexa / 431!Illumina FASTQ variants. Nucleic Acids Res. 38, 1767–1771 (2010). 432!
15. Patel, R. K. & Jain, M. NGS QC Toolkit: A Toolkit for Quality Control of 433!Next Generation Sequencing Data. PLoS One 7, (2012). 434!
16. Martin, M. Cutadapt removes adapter sequences from high-throughput 435!sequencing reads. EMBnet.journal 17, 10–12 (2011). 436!
17. Nordahl Petersen, T. et al. MGmapper: Reference based mapping and 437!taxonomy annotation of metagenomics sequence reads. unpublished (2016). 438!
18. Peng, Y., Leung, H. C. M., Yiu, S. M. & Chin, F. Y. L. Sequence analysis 439!IDBA-UD: a de novo assembler for single-cell and metagenomic sequencing 440!data with highly uneven depth. Bioinformatics 28, 1420–1428 (2012). 441!
19. Hyatt, D. et al. Prodigal: prokaryotic gene recognition and translation initiation 442!
! 75!
site identification. BMC Bioinformatics 11, (2010). 443!20. Edgar, R. C. Search and clustering orders of magnitude faster than BLAST. 444!
Bioinformatics 26, 2460–2461 (2010). 445!21. Li, H. Aligning sequence reads, clone sequences and assembly contigs with 446!
BWA-MEM. arXiv:1303.3997v1 [q-GN], (2013). 447!22. Li, H. et al. The Sequence Alignment/Map format and SAMtools. 448!
Bioinformatics 25, 2078–2079 (2009). 449!23. Oksanen, J. et al. vegan: Community Ecology Package. R package version 2.2–450!
1. Available online at: http://CRAN.R-project.org/package=vegan (2013). 451!24. RStudioTeam. RStudio: Integrated Development for R. (2015). 452!25. Nielsen, H. B. et al. Identification and assembly of genomes and genetic 453!
elements in complex metagenomic samples without using reference genomes. 454!Nat. Biotechnol. 32, 822–832 (2014). 455!
26. Parks, D. H., Imelfort, M., Skennerton, C. T., Hugenholtz, P. & Tyson, G. W. 456!CheckM: assessing the quality of microbial genomes recovered from isolates, 457!single cells, and metagenomes. Genome Res. 25, 1043–1055 (2015). 458!
27. Aziz, R. K. et al. The RAST Server: Rapid Annotations using Subsystems 459!Technology. BMC Genomics 9, (2008). 460!
28. Brettar, I., Christen, R. & Höfle, M. G. Belliella baltica gen. nov., sp. nov., a 461!novel marine bacterium of the Cytophaga-Flavobacterium-Bacteroides group 462!isolated from surface water of the central Baltic Sea. IJSEM 54, 65–70 (2004). 463!
29. Kanehisa, M., Furumichi, M., Tanabe, M., Sato, Y. & Morishima, K. KEGG: 464!new perspectives on genomes, pathways, diseases and drugs. Nucleic Acids 465!Res. preprint (2016). doi:10.1093/nar/gkw1092 466!
30. Buchfink, B., Xie, C. & Huson, D. H. Fast and sensitive protein alignment 467!using DIAMOND. Nat. Methods 12, 59–63 (2015). 468!
31. Abou-Shanab, R. A. I., Berkum, P. Van & Angle, J. S. Heavy metal resistance 469!and genotypic analysis of metal resistance genes in gram-positive and gram-470!negative bacteria present in Ni-rich serpentine soil and in the rhizosphere of 471!Alyssum murale. Chemosphere 68, 360–367 (2007). 472!
32. Jaroslawiecka, A. & Piotrowska-seget, Z. Lead resistance in micro-organisms. 473!Microbiology 12–25 (2014). doi:10.1099/mic.0.070284-0 474!
33. Ochoa-Herrera, V., Field, J. A., Luna-velasco, A. & Sierra-Alvarez, R. 475!Microbial toxicity and biodegradability of perfluorooctane sulfonate (PFOS) 476!
!76!
and shorter chain perfluoroalkyl and polyfluoroalkyl substances (PFASs). 477!Environ. Sci. 18, 1236–1246 (2016). 478!
34. Xia, X. Microbial Degradation of Polybrominated Diphenyl Ethers: Current 479!and Future. Bioremediation Biodegrad. 4, (2013). 480!
35. Neto, M. R. et al. Multiple Gene Sequence Analysis Using Genes of The 481!Bacterial DNA Repair Pathway. Brazilian Arch. Biol. Technol. 58, 421–430 482!(2015). 483!
36. Spring, S., Kampfer, P., Ludwig, W. & Schleifer, K. Polyphasic 484!Characterization of the Genus Leptothrix: New Descriptions of Leptothrix 485!mobilis sp. nov. and Leptothrix discophora sp. nov. nom. rev. and Emended 486!Description of Leptothrix cholodnii emend. Syst. Appl. Microbiol. 19, 634–643 487!(1996). 488!
37. Richards, J. W., Krumholz, G. D., Chval, M. S. & Tisa, L. S. Heavy Metal 489!Resistance Patterns of Frankia Strains. Appl. Environ. Microbiol. 68, 923–927 490!(2002). 491!
38. Rehan, M., Furnholm, T. & Finethy, R. H. Copper tolerance in Frankia sp. 492!strain EuI1c involves surface binding and copper transport. Environ. 493!Biotechnol. 98, 8005–8015 (2014). 494!
39. Ash, K. et al. A comparison of the Caulobacter NA1000 and K31 genomes 495!reveals extensive genome rearrangements and differences in metabolic 496!potential. Open Biol. 4, (2014). 497!
40. Kusel, K., Dorsch, T., Acker, G. & Stackebrandt, E. Microbial Reduction of 498!Fe(III) in Acidic Sediments: Isolation of Acidiphilium cryptum JF-5 Capable 499!of Coupling the Reduction of Fe(III) to the Oxidation of Glucose. Appl. 500!Environ. Microbiol. 65, 3633–3640 (1999). 501!
41. Jacobsen, C. S. et al. Global contamination of the Greenlandic icecap with 502!organic contaminants – distribution of contaminants and studies of the 503!microbiological and photochemical degradation. (2012). 504!
42. Abdel-Shafy, H. I. & Mansour, M. S. M. A review on polycyclic aromatic 505!hydrocarbons: Source, environmental impact, effect on human health and 506!remediation. Egypt. J. Pet. 25, 107–123 (2016). 507!
43. Peters, A. J., Gregor, D. J., Teixeira, C. F., Jones, N. P. & Spencer, C. The 508!recent depositional trend of polycyclic aromatic hydrocarbon to the Agassiz Ice 509!Cap, Ellesmere Island, Canada. Sci. Total Environ. 160, 167–179 (1995). 510!
! 77!
44. Masclet, P., Hoyau, V., Jaffrezo, J. L. & Cachier, H. Polycyclic aromatic 511!hydrocar- bon deposition on the ice sheet of Greenland. Part 1: superficial 512!snow. Atmos. Environ. 34, 3195–3207 (2000). 513!
45. Cameron, K. A. et al. Diversity and potential sources of microbiota associated 514!with snow on western portions of the Greenland Ice Sheet. Environ. Microbiol. 515!17, 594–609 (2015). 516!
46. Musilova, M., Tranter, M., Bennett, S. A., Wadham, J. & Anesio, A. M. Stable 517!microbial community composition on the Greenland Ice Sheet. Front. 518!Microbiol. 6, (2015). 519!
47. Stibal, M. et al. Different bulk and active bacterial communities in cryoconite 520!from the margin and interior of the Greenland ice sheet. Environ. Microbiol. 521!Rep. 7, 293–300 (2015). 522!
48. Stern, G. A. et al. How does climate change influence arctic mercury? Sci. 523!Total Environ. J. 414, 22–42 (2012). 524!
49. Bjerregaard, P., Sloth, H., Nielsen, N. O. & Dewailly, E. Population surveys in 525!Greenland 1993 – 2009: Temporal trend of PCBs and pesticides in the general 526!Inuit population by age and urbanisation. Sci. Total Environ. 454–455, 283–527!288 (2013). 528!
529! 530! 531! 532! 533! 534! 535! 536! 537! 538! 539! 540! 541! 542! 543! 544!
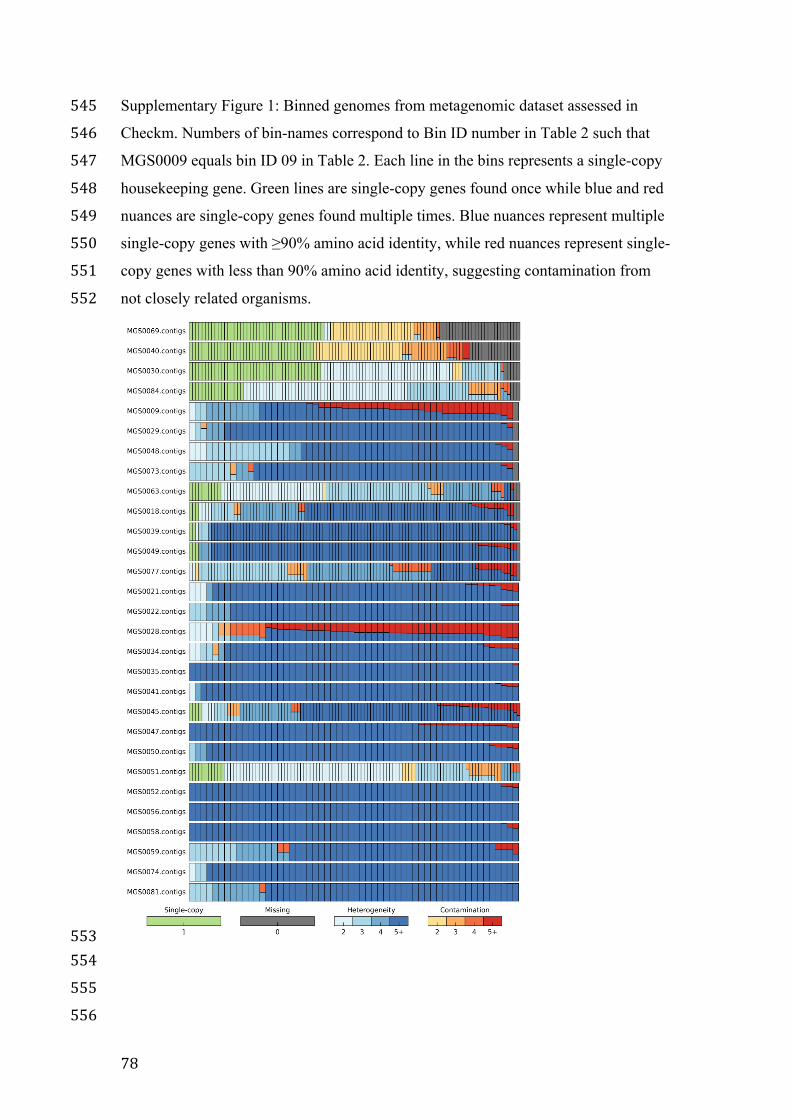
!78!
Supplementary Figure 1: Binned genomes from metagenomic dataset assessed in 545!Checkm. Numbers of bin-names correspond to Bin ID number in Table 2 such that 546!MGS0009 equals bin ID 09 in Table 2. Each line in the bins represents a single-copy 547!housekeeping gene. Green lines are single-copy genes found once while blue and red 548!nuances are single-copy genes found multiple times. Blue nuances represent multiple 549!single-copy genes with ≥90% amino acid identity, while red nuances represent single-550!copy genes with less than 90% amino acid identity, suggesting contamination from 551!not closely related organisms. 552!
553! 554! 555! 556!
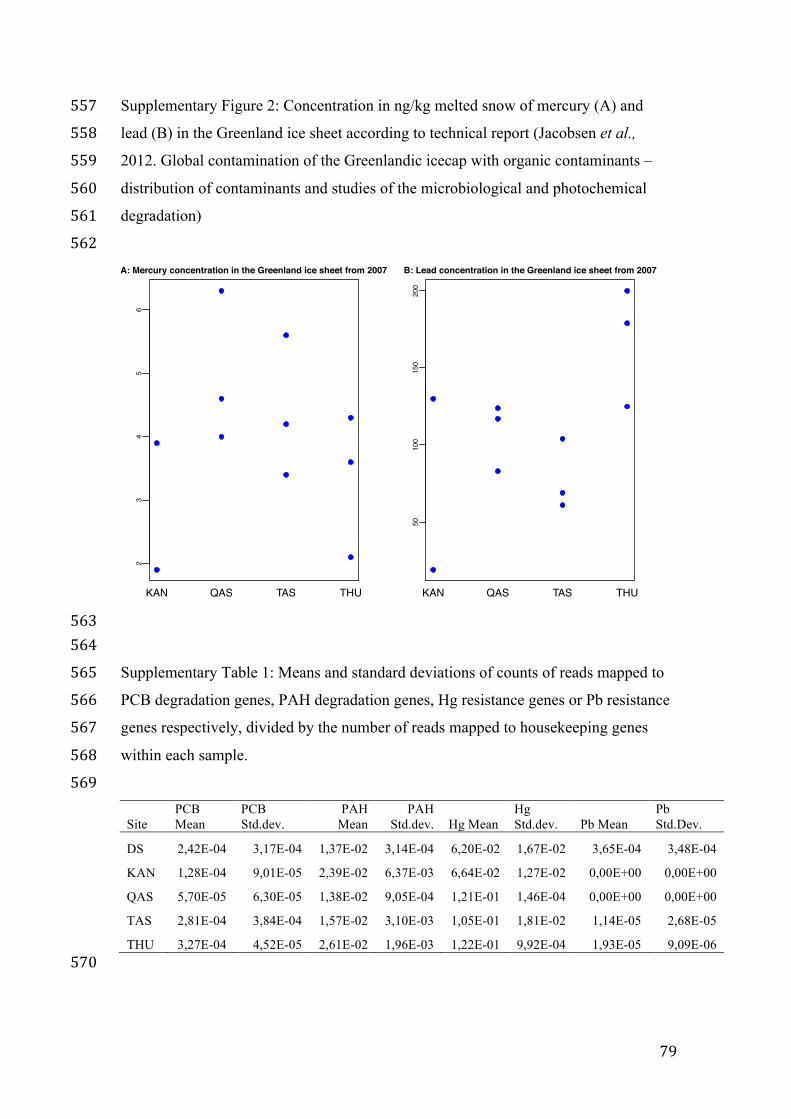
! 79!
Supplementary Figure 2: Concentration in ng/kg melted snow of mercury (A) and 557!lead (B) in the Greenland ice sheet according to technical report (Jacobsen et al., 558!2012. Global contamination of the Greenlandic icecap with organic contaminants – 559!distribution of contaminants and studies of the microbiological and photochemical 560!degradation) 561! 562!
563! 564!Supplementary Table 1: Means and standard deviations of counts of reads mapped to 565!PCB degradation genes, PAH degradation genes, Hg resistance genes or Pb resistance 566!genes respectively, divided by the number of reads mapped to housekeeping genes 567!within each sample. 568! 569!
Site PCB Mean
PCB Std.dev.
PAH Mean
PAH Std.dev. Hg Mean
Hg Std.dev. Pb Mean
Pb Std.Dev.
DS 2,42E-04 3,17E-04 1,37E-02 3,14E-04 6,20E-02 1,67E-02 3,65E-04 3,48E-04
KAN 1,28E-04 9,01E-05 2,39E-02 6,37E-03 6,64E-02 1,27E-02 0,00E+00 0,00E+00
QAS 5,70E-05 6,30E-05 1,38E-02 9,05E-04 1,21E-01 1,46E-04 0,00E+00 0,00E+00
TAS 2,81E-04 3,84E-04 1,57E-02 3,10E-03 1,05E-01 1,81E-02 1,14E-05 2,68E-05
THU 3,27E-04 4,52E-05 2,61E-02 1,96E-03 1,22E-01 9,92E-04 1,93E-05 9,09E-06 570!
23
45
6
A: Mercury concentration in the Greenland ice sheet from 2007
KAN QAS TAS THU
50100
150
200
B: Lead concentration in the Greenland ice sheet from 2007
ng/kg
KAN QAS TAS THU

"
"80"

" " "" " "
"" " " 81"
Part III

"
"82"

" " "" " "
"" " " 83"
3.1 Conclusions
The cryosphere is a biome
In part I it was argued that next-generation sequencing technologies has enabled the
acknowledgement of the cryosphere as a biome (Boetius et al. 2015; Anesio and
Laybourn-Parry 2012). In part II this was illustrated through two studies utilizing 16S
rRNA gene amplicon sequencing (Paper II) and shotgun metagenomics (Paper III)
respectively.
Paper II showed that the microbial community from cryosphere-associated
habitats, a proglacial lake and a glacier stream, are different from the microbial
community of the main freshwater habitat in terms of community composition and
diversity (Hauptmann et al. 2016). The diversity of microbial communities from these
cryosphere-associated habitats indicated a greater fraction of cold-adapted microbes and
less microbes from soil (Hauptmann et al. 2016).
Paper III showed that the cryoconite microbial community has the potential for
degradation and resistance to contaminants, indicating that this community is highly
adapted to the resource-scarce and potentially contaminated cryoconite habitat.
In conclusion, through the utilization of next-generation sequencing technologies
Paper II and III showed cryosphere-associated microbial communities adapted to their
respective cryosphere habitats, which illustrated the role of the cryosphere as a biome.
Data-intensive research can be hypothesis-driven
A quantitative assessment of hypothesis-driven versus data-driven research in part I
concluded in favor of the opinion that data-intensive research can go hand-in-hand with
hypothesis-driven research. Papers II and III showed that data-intensive research can
yield informative results if the data is used in a hypothesis-driven manner.
In Paper II 16S rRNA gene amplicon sequencing was used to assess the pattern in
biodiversity of a freshwater network in West Greenland (Hauptmann et al. 2016). In
contrast to conclusions from previous studies we had the hypothesis that the microbial
community in cryosphere-associated freshwater networks receive microbial input from
the cryosphere and not only from the terrestrial surroundings. This hypothesis was

"
"84"
confirmed through NGS technologies enabling in-depth assessment of biodiversity as
well as community composition. In addition, the utilization of Indicator Species analysis,
as suggested in part I, enabled the tracing of the distinct microbial communities from the
cryosphere-associated habitats into the estuary.
In Paper III shotgun metagenomics from Greenland ice sheet cryoconite holes
was used to confirm the initial hypothesis that cryoconite holes present a contaminated
habitat with a microbial community adapted to handling various sources of
contamination. It is noteworthy that without having first identified this hypothesis, this
result would not have been apparent in the large amount of data. Thus, hypothesis
generation prior to conducting data-intensive studies is crucial for obtaining clear and
interesting results. The extensive amount of data in Paper III also enabled the binning of
genomes from metagenomes, which lead to the new hypothesis that not only
Cyanobacteria but also other Bacterial phyla are part of cryoconite ecosystem
engineering.
In conclusion, data-intensive research benefits from identification of hypotheses
and can also lead to novel hypotheses.
The results from the quantitative assessment of hypothesis-driven versus data-driven
research also suggested that in the initial phase of implementing novel NGS technologies
in cryosphere biogeography around year 2012-2013, there might have been a lag-phase
where research was less hypothesis-driven. The oldest study included in this thesis, Paper
I (Hauptmann et al. 2014), was conducted in 2013 while the first NGS-studies of snow
were published (Møller et al. 2013; Hell et al. 2013). This study was less hypothesis-
driven and its strength was in its example of an extremely remote sampling site. This
Paper illustrates a descriptive approach to cryosphere biogeography, which shows
support of previous notions and encourages further studies.
It is important that in future implementations of novel technologies in cryosphere
biogeography we are aware of our potential lack of hypotheses. In this phase we must
design studies that optimize opportunities for generating novel hypotheses based on
results from descriptive studies.
" " "" " "
"" " " 85"
Amplicon sequencing is not per definition inferior to shotgun metagenomics
As described in part I NGS resulted in a greatly increased biodiversity of the cryosphere
when compared to pre-NGS studies. As microbial biogeography deals with the
distribution of microbial diversity, biodiversity is a central measure in this field of
research. As argued in part I shotgun metagenomics does not at this point in time present
the optimal method for assessing biodiversity. 16S rRNA gene amplicon sequencing has
the advantage of being optimized for assessing biodiversity and when applied to the right
studies therefore has its merits particularly in microbial biogeography.
Paper II presents such a study, where the use of amplicon sequencing was the
superior choice over shotgun metagenomics. In this study, the pattern of diversity, which
could be compared between samples, resulted in a conclusion in contrast to previously
established hypotheses based on the same measures of diversity (Hauptmann et al. 2016).
The biodiversity of the Red River freshwater network of the Disko Island in Greenland
did not show a uni-directional decrease in diversity along the river (Hauptmann et al.
2016) as had been shown in previous studies (Ruiz-González, Niño-Garcia, and del
Giorgio 2015; Crump, Amaral-Zettler, and Kling 2012). This result supported other
results from the study by indicating that the microbial community in the streams from the
glacier and the proglacial lake had low diversity because of their origin in the less diverse
cryosphere compared to soil (Hauptmann et al. 2016).
Therefore, in microbial biogeography studies where measures of diversity are
crucial for testing stated hypotheses amplicon sequencing can be the optimal choice.
Sampling strategy is an important future focus point in cryosphere biogeography –
think before you sequence
In part I better sampling was highlighted as important for avoiding that microbial
biogeography become mired in phenomenological description (Martiny et al. 2006).
Research papers of microbial biogeography of the cryosphere described in part I showed
a tendency to refer to additional sampling in conclusions for future research. In part II
different kinds of sampling could also have advanced the studies.
Paper I regarding snow included three sample sites from North Pole ice floes
(Hauptmann et al. 2014). These samples showed notable difference between the
"
"86"
microbial communities at the three samples sites (Hauptmann et al. 2014). Additional
spatial sampling could have helped an understanding of the geographic range to which
the microbial communities on North Pole ice floes differ. Furthermore, sampling of
additional metadata could have helped give suggestions for explanations of the
differences observed in the microbial community composition.
Paper III includes extensive sampling of the vast Greenland ice sheet. The
extensive dataset yielded interesting results as described above but additional sampling of
chemical data could have helped link the potential for degradation of and resistance to
contaminants to the contaminants themselves.
Paper II concluded that the right spatial resolution of samples in a freshwater
network enabled the identification of Indicator OTUs from the proglacial lake and glacier
stream and their distribution in the estuary (Hauptmann et al. 2016). These Indicator
OTUs could not be observed upstream or at the river mouth and would not have been
known to originate from the river if only these sites of the river had been sampled
(Hauptmann et al. 2016). As the river Indicator OTUs made up on average a quarter of
the estuary community, our understanding of the origin of the estuary community would
be greatly limited had the river not been sampled in the right spatial resolution
(Hauptmann et al. 2016).
In conclusion, based on the results from part I and part II of this thesis it is my
recommendation that increased focus on planning of sampling is important to advance
our understanding of microbial biogeography of the cryosphere.
To get a better understanding of microbial biogeography it was also suggested in part I
that we need to put focus on distinguishing between contemporary and historical factors
(Martiny et al. 2006). The results of Paper III showed just how important this distinction
might be in particular for cryosphere biogeography. Paper III showed that the microbial
community in cryoconite holes of the Greenland ice sheet are adapted to contaminants,
which have been emitted in present and even more in past times. These contaminants are
known to be trapped in the ice. The microbial community in cryoconite holes slowly
melts through the ice and will encounter contamination from past times. As the microbial
community of cryoconite seem to be highly adapted to contamination, the microbial
" " "" " "
"" " " 87"
community and their biogeography will be shaped in part by the availability of
contaminants from current and past times.
In this way, Paper III concludes in great favor of the recommendation that we
need to consider both contemporary and historical factors to advance our understanding
of microbial biogeography.
Microbial biogeography is more than testing the Baas-Becking hypothesis
The historical and central role that the Baas-Becking hypothesis plays in microbial
biogeography was described in part I. It was discussed that despite the great advances
that NGS technologies have enabled, there is still dispute about this one dominating
hypothesis in microbial biogeography. This is true also in the field of cryosphere
microbial biogeography, which has been suggested as the ideal habitat for studying
microbial biogeography (Staley and Gosink 1999).
Cryosphere microbial biogeography has become an established field of research
but based on the results of this thesis I do not believe that we can say something useful on
a general level about microbial biogeography of the cryosphere. Instead, we need to make
hypotheses about defined parts of the cryosphere. Very importantly, based on our
hypothesis about the microbial biogeography of our favorite cryosphere habitat, we need
to make informed choices about our methodology and not least about what data we need.
By focusing our research and using the right methodology we might do much more than
confirm or reject the Baas-Becking hypothesis.
In Paper II amplicon sequencing of microbes in a freshwater network enabled the
tracing of OTUs from the cryosphere to the ocean (Hauptmann et al. 2016). In this way,
the microbial community acted as tracers of dispersal from the cryosphere. Something
that is highly relevant to ongoing climate research.
In Paper III shotgun metagenomic sequencing revealed a microbial community
with potential for degradation and resistance to anthropogenic contaminants.
Surprisingly, the results also indicated that the level of potential align with the level of
contamination at the top of the food chain, among the Inuit. This encourages further
research into the use of microbial metagenomics as tracers for contamination. Particularly
"
"88"
in the cryosphere where contaminants are trapped in frozen environments and where
bioaccumulation of contaminants is of high concern (AMAP 2015).
In conclusion, microbial biogeography of the cryosphere through a next-generation
sequencing approach can be relevant not only to microbial biogeographers but also to the
wider scientific community and finally to the inhabitants of the Arctic.
" " "" " "
"" " " 89"
3.2 Perspectives
The freezing habitats of snow on the polar ice cap and the Greenland ice sheet seem like
barren places to the untrained eye. With a microbial perspective enabled by next-
generation sequencing technologies suddenly these extreme habitats of the Arctic
cryosphere become places of diverse bacterial communities.
These communities are important for our understanding of the impacts of the
changing climate. The melting cryosphere seeds microbial communities into downstream
ecosystems such as freshwater networks, which again transport microbes further on to the
oceans (Hauptmann et al. 2016). Here, the communities, which originated in the
cryosphere, may become part of a whole new ecosystem and their function may have
profoundly different impact on the ecosystem and the exchange of nutrients and gases.
The microbial communities of the cryosphere also seem to hold promise for the
inhabitants of the Arctic. Contamination of the food chain in the Arctic is of great
concern to local peoples such as the Inuit in Greenland, whose economy is based on the
fishing industry. The microbial community might serve as tracers of contamination and
help our understanding of dispersal of contamination through the Arctic food chain
(Paper III, unpublished).
Another potential that cryosphere microbiology holds for the inhabitants of the Arctic is
the identification of biotechnologically relevant microorganisms. Sustainable
development of the Arctic is a global concern, particularly in a time where the search for
oil and minerals in the Arctic is intensifying. In parallel to the work on this thesis this has
been a theme that I have dealt with extensively through the establishment of the first
biotechnological company of Greenland, through blogging and debates as well as through
interacting with the legislative system of Greenland. The original incentive to go Disko
Island in 2013, where sampling for Paper II was conducted, was based on local stories
about homothermal springs that might harbor cold-adapted microorganisms with
potential for industrial enzymes. The results from Paper II did indicate a higher fraction
of cold-adapted microorganisms in certain parts of the freshwater system of the Red
River.
"
"90"
In this way microbial biogeography might help steer more efficient
biotechnological research from Greenland. This is also indicated by Paper III, in which a
high number of genomes from organisms with ability to degrade contaminants were
found (Paper III, unpublished). Some of these organisms showed resemblance to
organisms known as bioremediators, which are also of high biotechnological relevance.
An important conclusion of this thesis is that future cryosphere biogeography research
must put emphasis on the correct sampling strategy. An aspect of sampling which is
absent from the cryosphere biogeography literature and research society is the legislative
framework that researchers are subject to in remote regions such as the Greenland ice
sheet or the Disko Island. Moreover, the ethical concerns that needs to be considered
when sampling.
When sampling in Greenland investigators are obligated to acquire a sampling
permission from the self-rule government of Greenland according to the newly updated
Greenlandic law of June 2016, number 3 of 3 on the utilization of genetic resources. This
is not well known in the research community and researchers rarely follow this law. The
law is an implementation of the Convention on Biological Diversity and the Nagoya
Protocol. The Convention’s main objectives are to protect biological diversity, ensure
sustainable use of biological diversity as well as help the fair and equitable sharing of the
benefits that may arise from the utilization of biological diversity.
While this might seem to be mostly relevant to biotechnological research from
which researchers might gain commercially, it is also important for researchers in
microbial biogeography of the cryosphere. As a central part of the culture the Inuit
depend on the prey for their hunt just as they also depend on the ice, to which they have
adapted their hunting methods for hundreds of years. But the ice is changing and part of
that change is the microbes. Therefore, knowledge of microbes in the cryosphere has
great value to the Inuit living in this environment as illustrated by the introductory
citation by H. C. Petersen (Petersen 2001).
" " "" " "
"" " " 91"
References
Abell, Guy C J, and John P Bowman. 2005. “Ecological and Biogeographic Relationships
of Class Flavobacteria in the Southern Ocean.” FEMS Microbiology Ecology 51:
265–77. doi:10.1016/j.femsec.2004.09.001.
Albertsen, Mads, Philip Hugenholtz, Adam Skarshewski, Kåre L Nielsen, Gene W
Tyson, and Per H Nielsen. 2013. “Genome Sequences of Rare, Uncultured Bacteria
Obtained by Differential Coverage Binning of Multiple Metagenomes.” Nature
Biotechnology 31 (6): 533–41. doi:10.1038/nbt.2579.
Alneberg, Johannes, Brynjar Smári Bjarnason, Ino De Bruijn, Melanie Schirmer, Joshua
Quick, Umer Z Ijaz, Leo Lahti, Nicholas J Loman, Anders F Andersson, and
Christopher Quince. 2014. “Binning Metagenomic Contigs by Coverage and
Composition.” Nature Methods 11 (11): 1144–46. doi:10.1038/nmeth.3103.
AMAP. 2015. AMAP Assessment 2015: Human Health in the Arctic. Oslo, Norway. vii +
165 pp.
Anesio, Alexandre M., Andrew J. Hodson, Andreas Fritz, Roland Psenner, and Birgit
Sattler. 2009. “High Microbial Activity on Glaciers: Importance to the Global
Carbon Cycle.” Global Change Biology 15: 955–60. doi:10.1111/j.1365-
2486.2008.01758.x.
Anesio, Alexandre M., and Johanna Laybourn-Parry. 2012. “Glaciers and Ice Sheets as a
Biome.” Trends in Ecology and Evolution 27 (4): 219–25.
doi:10.1016/j.tree.2011.09.012.
Benn, Douglas, and David J A Evans. 2010. Glaciers and Glaciation. 2nd ed.
Boetius, Antje, Alexandre M Anesio, Jody W Deming, Jill Mikucki, and Josephine Z
Rapp. 2015. “Microbial Ecology of the Cryosphere#: Sea Ice and Glacial Habitats.”
Nature Reviews Microbiology 13 (11). Nature Publishing Group: 677–90.
doi:10.1038/nrmicro3522.
Bowman, Jeff S, Simon Rasmussen, Nikolaj Blom, Jody W Deming, Søren Rysgaard,
and Thomas Sicheritz-ponten. 2012. “Microbial Community Structure of Arctic
Multiyear Sea Ice and Surface Seawater by 454 Sequencing of the 16S RNA Gene.”
The ISME Journal 6: 11–20. doi:10.1038/ismej.2011.76.
Baas-Becking, L. G. M. 1934. Geobiologie of Inleiding Tot de Milieukunde. The Hague:
"
"92"
Van Stockum & Zoon.
Cameron, Karen A., Birgit Hagedorn, Markus Dieser, Brent C. Christner, Kyla
Choquette, Ronald Sletten, Byron Crump, Colleen Kellogg, and Karen Junge. 2015.
“Diversity and Potential Sources of Microbiota Associated with Snow on Western
Portions of the Greenland Ice Sheet.” Environmental Microbiology 17 (3): 594–609.
doi:10.1111/1462-2920.12446.
Cameron, Karen A., Marek Stibal, Jakub D. Zarsky, Erkin Gözdereliler, Morten
Schostag, and Carsten S. Jacobsen. 2016. “Supraglacial Bacterial Community
Structures Vary across the Greenland Ice Sheet.” FEMS Microbiology Ecology 92
(2). doi:10.1093/femsec/fiv164.
Caporaso, J Gregory, Justin Kuczynski, Jesse Stombaugh, Kyle Bittinger, Frederic D
Bushman, and Rob Knight. 2010. “QIIME Allows Analysis of High- Throughput
Community Sequencing Data.” Nature Methods 7 (5): 335–36.
doi:10.1038/NMETH.F.303.
Chao, Anne. 1984. “Nonparametric Estimation of the Number of Classes in a
Population.” Scandinavian Journal of Statistics 11 (4): 265–70.
Cho, Jae-chang, and James M. Tiedje. 2000. “Biogeography and Degree of Endemicity of
Fluorescent Pseudomonas Strains in Soil.” Applied and Environmental
Microbiology 66 (12): 5448–56.
Choudhari, Sulbha, Ruchi Lohia, and Andrey Grigoriev. 2014. “Comparative
Metagenome Analysis of an Alaskan Glacier.” Journal of Bioinformatics and
Computational Biology 12 (1441003). doi:10.1142/S0219720014410030.
Chuvochina, M S, I A Alekhina, P Normand, J R Petit, and S A Bulat. 2011. “Three
Events of Saharan Dust Deposition on the Mont Blanc Glacier Associated with
Different Snow Colonizing Bacterial Phylotypes” 80 (1): 125–31.
doi:10.1134/S0026261711010061.
Crump, Byron C, Linda A Amaral-Zettler, and George W Kling. 2012. “Microbial
Diversity in Arctic Freshwaters Is Structured by Inoculation of Microbes from
Soils.” The ISME Journal 6 (9): 1629–39. doi:10.1038/ismej.2012.9.
Dick, Gregory J, Anders F Andersson, Brett J Baker, Sheri L Simmons, Brian C Thomas,
A Pepper Yelton, and Jillian F Banfield. 2009. “Community-Wide Analysis of
" " "" " "
"" " " 93"
Microbial Genome Sequence Signatures.” Genome Biology 10 (R85).
doi:10.1186/gb-2009-10-8-r85.
Dufrene, Marc, and Pierre Legendre. 1997. “Species Assemblages and Indicator Species:
The Need for a Flexible Asymmetrical Approach.” Ecological Monographs 67 (3):
345–66.
Edgar, Robert C, Brian J Haas, Jose C Clemente, Christopher Quince, and Rob Knight.
2011. “UCHIME Improves Sensitivity and Speed of Chimera Detection.”
Bioinformatics 27 (16): 2194–2200. doi:10.1093/bioinformatics/btr381.
Edwards, Arwyn, Luis A J Mur, Susan E. Girdwood, Alexandre M. Anesio, Marek
Stibal, Sara M E Rassner, Katherina Hell, et al. 2014. “Coupled Cryoconite
Ecosystem Structure-Function Relationships Are Revealed by Comparing Bacterial
Communities in Alpine and Arctic Glaciers.” FEMS Microbiology Ecology 89 (2):
222–37. doi:10.1111/1574-6941.12283.
Edwards, Arwyn, Justin a Pachebat, Martin Swain, Matt Hegarty, Andrew J Hodson,
Tristram D L Irvine-Fynn, Sara M E Rassner, and Birgit Sattler. 2013. “A
Metagenomic Snapshot of Taxonomic and Functional Diversity in an Alpine Glacier
Cryoconite Ecosystem.” Environmental Research Letters 8: 35003.
doi:10.1088/1748-9326/8/3/035003.
Edwards, Arwyn, Alexandre M Anesio, Sara M Rassner, Birgit Sattler, Bryn Hubbard,
William T Perkins, Michael Young, and Gareth W Griffith. 2011. “Possible
Interactions between Bacterial Diversity, Microbial Activity and Supraglacial
Hydrology of Cryoconite Holes in Svalbard.” The ISME Journal 5 (1): 150–60.
doi:10.1038/ismej.2010.100.
Fierer, Noah, and Jay T. Lennon. 2011. “The Generation and Maintenance of Diversity in
Microbial Communities.” American Journal of Botany 98 (3): 439–48.
doi:10.3732/ajb.1000498.
Fortunato, Caroline S, Alexander Eiler, Lydie Herfort, Joseph A Needoba, Tawnya D
Peterson, Byron C Crump, Fortunato CS, et al. 2013. “Determining Indicator Taxa
across Spatial and Seasonal Gradients in the Columbia River Coastal Margin.” The
ISME Journal 7 (10). Nature Publishing Group: 1899–1911.
doi:10.1038/ismej.2013.79.
"
"94"
Fortunato, Caroline S, Lydie Herfort, Peter Zuber, Antonio M Baptista, and Byron C
Crump. 2012. “Spatial Variability Overwhelms Seasonal Patterns in
Bacterioplankton Communities across a River to Ocean Gradient.” The ISME
Journal 6 (3). Nature Publishing Group: 554–63. doi:10.1038/ismej.2011.135.
Franzetti, Andrea, Ilario Tagliaferri, Isabella Gandolfi, Giuseppina Bestetti, Umberto
Minora, Christoph Mayer, Roberto S Azzoni, Guglielmina Diolaiuti, Claudio
Smiraglia, and Roberto Ambrosini. 2016. “Light-Dependent Microbial Metabolisms
Drive Carbon Fluxes on Glacier Surfaces.” The ISME Journal 10 (12): 2984–88.
doi:10.1038/ismej.2016.72.
Gokul, Jarishma K, Andrew J Hodson, Eli R Saetnan, Tristram D L Irvine-, Philippa J
Westall, Andrew P Detheridge, and Nozomu Takeuchi. 2016. “Taxon Interactions
Control the Distributions of Cryoconite Bacteria Colonizing a High Arctic Ice Cap.”
Molecular Ecology 25: 3752–67. doi:10.1111/mec.13715.
Harding, Tommy, Anne D Jungblut, Connie Lovejoy, and Warwick F Vincent. 2011.
“Microbes in High Arctic Snow and Implications for.” Applied and Environmental
Microbiology 77 (10): 3234–43. doi:10.1128/AEM.02611-10.
Hardy, J. T., and H. J. Curl. 1968. “Red Snow Caused by a New Species of
Trachelomonas.” J Phycol 4 (1): 1529–8817.
Hauptmann, Aviaja L, Mikkel A Glaring, Peter F Hallin, Anders Priemé, and Peter
Stougaard. 2013. “Draft Genome Sequence of the Psychrophilic and Alkaliphilic
Rhodonellum Psychrophilum Strain GCM71T.” Genome Announcements 1 (6):
e00774-13. doi:10.1186/1471-2164-9-75.8.
Hauptmann, Aviaja L, Thor N Markussen, Marek Stibal, and Nikoline S Olsen. 2016.
“Upstream Freshwater and Terrestrial Sources Are Differentially Reflected in the
Bacterial Community Structure along a Small Arctic River and Its Estuary.”
Frontiers in Microbiology 7 (1474). doi:10.3389/fmicb.2016.01474.
Hauptmann, Aviaja L, Marek Stibal, Jacob Bælum, Thomas Sicheritz-Pontén, Søren
Brunak, Jeff S Bowman, Lars H. Hansen, Carsten S. Jacobsen, and Nikolaj Blom.
2014. “Bacterial Diversity in Snow on North Pole Ice Floes.” Extremophiles 18 (6):
945–51. doi:10.1017/CBO9781107415324.004.
Heather, James M, and Benjamin Chain. 2016. “Genomics The Sequence of Sequencers:
" " "" " "
"" " " 95"
The History of Sequencing DNA.” Genomics 107 (1). The Authors: 1–8.
doi:10.1016/j.ygeno.2015.11.003.
Hell, Katherina, Arwyn Edwards, Jakub Zarsky, Sabine M Podmirseg, Susan Girdwood,
Justin a Pachebat, Heribert Insam, and Birgit Sattler. 2013. “The Dynamic Bacterial
Communities of a Melting High Arctic Glacier Snowpack.” The ISME Journal 7 (9):
1814–26. doi:10.1038/ismej.2013.51.
Hisakawa, Nao, Steven D Quistad, Eric R Hester, Daria Martynova, Heather Maughan,
Enric Sala, Maria V Gavrilo, and Forest Rohwer. 2015. “Metagenomic and Satellite
Analyses of Red Snow in the Russian Arctic.” PeerJ 3 (e1491).
doi:10.7717/peerj.1491.
Huson, Daniel H, Suparna Mitra, Hans-joachim Ruscheweyh, Nico Weber, and Stephan
C Schuster. 2011. “Integrative Analysis of Environmental Sequences Using
MEGAN4.” Genome Research 21: 1552–60. doi:10.1101/gr.120618.111.Freely.
Jansson, Janet K., and James Prosser. 2013. “Microbiology. The Life beneath Our Feet.”
Nature 494 (41): 7–8. doi:10.1038/494040a.
Kang, Dongwan D, Je V Froula, Rob Egan, and Zhong Wang. 2015. “MetaBAT, an
Effcient Tool for Accurately Reconstructing Single Genomes from Complex
Microbial Communities.” PeerJ 3 (e1165). doi:10.7717/peerj.1165.
Kerepesi, Csaba, and Vince Grolmusz. 2016. “Evaluating the Quantitative Capabilities of
Metagenomic Analysis Software.” Curr Microbiol 72: 612–16. doi:10.1007/s00284-
016-0991-2.
Konstantinidis, Konstantinos T, and James M Tiedje. 2005. “Genomic Insights That
Advance the Species Definition for Prokaryotes.” PNAS 102 (7): 2567–72.
Laczny, Cedric C, Tomasz Sternal, Valentin Plugaru, Piotr Gawron, Arash Atashpendar,
Houry Hera Margossian, Sergio Coronado, Laurens Van Der Maaten, Nikos Vlassis,
and Paul Wilmes. 2015. “VizBin - an Application for Reference-Independent
Visualization and Human-Augmented Binning of Metagenomic Data.” Microbiome
3 (1). doi:10.1186/s40168-014-0066-1.
Langford, Harry, Andy Hodson, Steve Banwart, and Carl Bøggild. 2010. “The
Microstructure and Biogeochemistry of Arctic Cryoconite Granules.” Annals of
Glaciology 51 (56): 87–94.
"
"96"
Larose, Catherine, Aurélien Dommergue, and Timothy Vogel. 2013. “The Dynamic
Arctic Snow Pack: An Unexplored Environment for Microbial Diversity and
Activity.” Biology 2 (1): 317–30. doi:10.3390/biology2010317.
Larose, Catherine, Emmanuel Prestat, Sébastien Cecillon, Sibel Berger, Timothy M
Vogel, Delina Lyon, Christophe Ferrari, and Dominique Schneider. 2013.
“Interactions between Snow Chemistry, Mercury Inputs and Microbial Population
Dynamics in an Arctic Snowpack.” PLoS ONE 8 (11): e79972.
doi:10.1371/journal.pone.0079972.
Larouche, Julia R., William B. Bowden, Rosanna Giordano, Michael B. Flinn, and Byron
C. Crump. 2012. “Microbial Biogeography of Arctic Streams: Exploring Influences
of Lithology and Habitat.” Frontiers in Microbiology 3 (309).
doi:10.3389/fmicb.2012.00309.
Liu, Yongqin, Tandong Yao, Nianzhi Jiao, Lide Tian, Anyi Hu, Wusheng Yu, and
Shenghai Li. 2011. “Microbial Diversity in the Snow, a Moraine Lake and a Stream
in Himalayan Glacier.” Extremophiles 15 (3): 411–21. doi:10.1007/s00792-011-
0372-5.
Lopatina, Anna, Vjacheslav Krylenkov, and Konstantin Severinov. 2013. “Activity and
Bacterial Diversity of Snow around Russian Antarctic Stations *.” Research in
Microbiology 164 (9). Elsevier Masson SAS: 949–58.
doi:10.1016/j.resmic.2013.08.005.
Lopatina, Anna, Sofia Medvedeva, and Sergey Shmakov. 2016. “Metagenomic Analysis
of Bacterial Communities of Antarctic Surface Snow.” Frontiers in Microbiology 7
(398). doi:10.3389/fmicb.2016.00398.
Lutz, Stefanie, Alexandre M Anesio, Susana E Jorge Villar, and Liane G Benning. 2014.
“Variations of Algal Communities Cause Darkening of a Greenland Glacier.” FEMS
Microbiology Ecology 89: 402–14. doi:10.1111/1574-6941.12351.
Lutz, Stefanie, Alexanre M Anesio, Rob Raiswell, Arwyn Edwards, Rob J Newton, Fiona
Gill, and Liane G Benning. 2016. “Algae Melt Arctic Glaciers: The Biogeography
and Function of Snow Microbiomes.” Nature Communications 7 (11968).
doi:10.1038/ncomms11968.
Maccario, Lorrie, Timothy M Vogel, and Catherine Larose. 2014. “Potential Drivers of

" " "" " "
"" " " 97"
Microbial Community Structure and Function in Arctic Spring Snow.” Frontiers in
Microbiology 5 (413). doi:10.3389/fmicb.2014.00413.
Margesin, Rosa, and Vanya Miteva. 2011. “Diversity and Ecology of Psychrophilic
Microorganisms.” Research in Microbiology 162 (3). Elsevier Masson SAS: 346–
61. doi:10.1016/j.resmic.2010.12.004.
Martiny, Jennifer B Hughes, Brendan J M Bohannan, James H Brown, Robert K Colwell,
Jed a Fuhrman, Jessica L Green, M Claire Horner-Devine, et al. 2006. “Microbial
Biogeography: Putting Microorganisms on the Map.” Nature Reviews 4: 102–12.
doi:10.1038/nrmicro1341.
Meyer, F, D Paarmann, M D Souza, R Olson, E M Glass, M Kubal, T Paczian, et al.
2008. “The Metagenomics RAST Server – a Public Resource for the Automatic
Phylogenetic and Functional Analysis of Metagenomes.” BMC Bioinformatics 9
(386). doi:10.1186/1471-2105-9-386.
Michaud, Luigi, Angelina Lo Giudice, Mohamed Mysara, Pieter Monsieurs, Carmela
Raffa, Natalie Leys, Stefano Amalfitano, and Rob Van Houdt. 2014. “Snow Surface
Microbiome on the High Antarctic Plateau (DOME C).” PLoS ONE 9 (8): e104505.
doi:10.1371/journal.pone.0104505.
Mizrahi-Man, Orna, Emily R Davenport, and Yoav Gilad. 2013. “Taxonomic
Classification of Bacterial 16S rRNA Genes Using Short Sequencing Reads:
Evaluation of Effective Study Designs.” PLoS ONE 8 (1): 18–23.
doi:10.1371/journal.pone.0053608.
Musilova, Michaela, Martyn Tranter, Sarah A. Bennett, Jemma Wadham, and Alexandre
M. Anesio. 2015. “Stable Microbial Community Composition on the Greenland Ice
Sheet.” Frontiers in Microbiology 6 (193). doi:10.3389/fmicb.2015.00193.
Møller, Annette K., Tamar Barkay, Waleed Abu Al-Soud, Søren J. Sørensen, Henrik
Skov, and Niels Kroer. 2010. “Diversity and Characterization of Mercury-Resistant
Bacteria in Snow, Freshwater and Sea-Ice Brine from the High Arctic.” FEMS
Microbiology Ecology 75: 390–401. doi:10.1111/j.1574-6941.2010.01016.x.
Møller, Annette K., Ditte A. Søborg, Waleed Abu Al-Soud, Søren J. Sørensen, and Niels
Kroer. 2013. “Bacterial Community Structure in High-Arctic Snow and Freshwater
as Revealed by Pyrosequencing of 16S rRNA Genes and Cultivation.” Polar

"
"98"
Research 32. doi:10.3402/polar.v32i0.17390.
Nelson, Craig E., Steven Sadro, and John M. Melack. 2009. “Contrasting the Influences
of Stream Inputs and Landscape Position on Bacterioplankton Community Structure
and Dissolved Organic Matter Composition in High-Elevation Lake Chains.”
Limnology and Oceanography 54 (4): 1292–1305. doi:10.4319/lo.2009.54.4.1292.
Nemergut, Diana R., Steven K. Schmidt, Tadashi Fukami, Sean P. O’Neill, Teresa M.
Bilinski, Lee F. Stanish, Joseph E. Knelman, et al. 2013. “Patterns and Processes of
Microbial Community Assembly.” Microbiology and Molecular Biology Reviews 77
(3): 342–56. doi:10.1128/MMBR.00051-12.
Nguyen, Nam-phuong, Tandy Warnow, Mihai Pop, and Bryan White. 2016. “A
Perspective on 16S rRNA Operational Taxonomic Unit Clustering Using Sequence
Similarity.” Biofilms and Microbiomes 2 (16004). doi:10.1038/npjbio.
Nielsen, H Bjørn, Mathieu Almeida, Agnieszka Sierakowska Juncker, Simon Rasmussen,
Junhua Li, Shinichi Sunagawa, Damian R Plichta, et al. 2014. “Identification and
Assembly of Genomes and Genetic Elements in Complex Metagenomic Samples
without Using Reference Genomes.” Nature Biotechnology 32 (8): 822–32.
doi:10.1038/nbt.2939.
Niño-García, Juan Pablo, Clara Ruiz-González, and Paul A del Giorgio. 2016.
“Interactions between Hydrology and Water Chemistry Shape Bacterioplankton
Biogeography across Boreal Freshwater Networks.” The ISME Journal 10 (7):
1755–66. doi:10.1038/ismej.2015.226.
Oda, Yasuhiro, Bastiaan Star, Louis A Huisman, Jan C Gottschal, and Larry J Forney.
2003. “Biogeography of the Purple Nonsulfur Bacterium Rhodopseudomonas
Palustris.” Applied and Environmental Microbiology 69 (9): 5186–91.
doi:10.1128/AEM.69.9.5186.
Peter, Hannes, and Ruben Sommaruga. 2016. “Shifts in Diversity and Function of Lake
Bacterial Communities upon Glacier Retreat.” The ISME Journal 10 (7): 1545–54.
doi:10.1038/ismej.2015.245.
Petersen, H C. 2001. Den Fiffige Ravn - Og Andre Beretninger Om Det Levende I Mit
Land. Atuakkiorfik.
Popper, Karl. 1935. Logik Der Forschung. Verlag von Julius Springer, Vienna, Austria.

" " "" " "
"" " " 99"
Ramette, Alban, and James M. Tiedje. 2007. “Biogeography: An Emerging Cornerstone
for Understanding Prokaryotic Diversity, Ecology, and Evolution.” Microbial
Ecology 53 (2): 197–207. doi:10.1007/s00248-005-5010-2.
Ranjan, Ravi, Asha Rani, Ahmed Metwally, Halvor S Mcgee, and David L Perkins. 2016.
“Analysis of the Microbiome: Advantages of Whole Genome Shotgun versus 16S
Amplicon Sequencing.” Biochemical and Biophysical Research Communications
469 (4). Elsevier Ltd: 967–77. doi:10.1016/j.bbrc.2015.12.083.
Reeder, Jens, and Rob Knight. 2011. “Rapid Denoising of Pyrosequencing Amplicon
Data: Exploiting the Rank-Abundance Distribution.” Nat Methods 7 (9): 668–69.
doi:10.1038/nmeth0910-668b.Rapid.
Ronaghi, Mostafa, Mathias Uhlén, and Pål Nyrén. 1998. “A Sequencing Method Based
on Real-Time Pyrophosphate.” Science 281 (5375): 363–65.
Ruiz-González, Clara, Juan Pablo Niño-Garcia, and Paul A. del Giorgio. 2015.
“Terrestrial Origin of Bacterial Communities in Complex Boreal Freshwater
Networks.” Ecology Letters 18 (11): 1198–1206. doi:10.1111/ele.12499.
Schloss, Patrick D. 2008. “Evaluating Different Approaches That Test Whether
Microbial Communities Have the Same Structure.” The ISME Journal 2: 265–75.
doi:10.1038/ismej.2008.5.
Shannon, C. E. 1948. “A Mathematical Theory of Communication.” The Bell System
Technical Journal 27: 379–423.
Sinclair, Lucas, Omneya Ahmed Osman, Stefan Bertilsson, and Alexander Eiler. 2015.
“Microbial Community Composition and Diversity via 16S rRNA Gene Amplicons:
Evaluating the Illumina Platform.” PLoS ONE 10 (2): e0116955.
doi:10.1371/journal.pone.0116955.
Sinha, Rashmi, Christian C Abnet, Owen White, Rob Knight, and Curtis Huttenhower.
2015. “The Microbiome Quality Control Project: Baseline Study Design and Future
Directions.” Genome Biology 16 (276). doi:10.1186/s13059-015-0841-8.
Staley, J T, and J J Gosink. 1999. “Poles Apart: Biodiversity and Biogeography of Sea
Ice Bacteria.” Annual Review of Microbiology 53: 189–215.
doi:10.1146/annurev.micro.53.1.189.
Stibal, Marek, Morten Schostag, Karen A. Cameron, Lars H. Hansen, David M.
"
"100"
Chandler, Jemma L. Wadham, and Carsten S. Jacobsen. 2015. “Different Bulk and
Active Bacterial Communities in Cryoconite from the Margin and Interior of the
Greenland Ice Sheet.” Environmental Microbiology Reports 7 (2): 293–300.
doi:10.1111/1758-2229.12246.
Sunagawa, Shinichi, Daniel R Mende, Georg Zeller, Fernando Izquierdo-carrasco, Simon
A Berger, Jens Roat Kultima, Luis Pedro Coelho, et al. 2013. “Metagenomic
Species Profiling Using Universal Phylogenetic Marker Genes.” Nature Methods 10
(12): 1196–1202. doi:10.1038/nmeth.2693.
Takeuchi, Nozomu, Shiro Kohshima, and Katsumoto Seko. 2001. “Structure, Formation,
and Darkening Process of Albedo-Reducing Material (Cryoconite) on a Himalayan
Glacier: A Granular Algal Mat Growing on the Glacier.” Arctic, Antarctic, and
Alpine Research 33 (2): 115–22.
Telenti, Amalio, Levi C T Pierce, William H Biggs, Emily H M Wong, and Martin M
Fabani. 2016. “Deep Sequencing of 10,000 Human Genomes.” PNAS 113 (42):
11901–6. doi:10.1073/pnas.1613365113.
Torsvik, Vigdis, Jostein Goksyr, and Frida Lise Daae. 1990. “High Diversity in DNA of
Soil Bacteria.” Applied and Environmental Microbiology 56 (3): 782–87.
Whitaker, Rachel J, Dennis W Grogan, and John W Taylor. 2003. “Geographic Barriers
Isolate Endemic Populations of Hyperthermophilic Archaea.” Science 301 (August):
976–79.
Wilson, E. O. 1999. The Diversity of Life. Penguin.
Woese, Carl R. 1987. “Bacterial Evolution.” Microbiological Reviews 51 (2): 221–71.
Wu, Martin, and Jonathan A Eisen. 2008. “A Simple, Fast, and Accurate Method of
Phylogenomic Inference.” Genome Biology 9 (10): R151. doi:10.1186/gb-2008-9-
10-r151.
Wu, Yu-wei, Yung-hsu Tang, Susannah G Tringe, Blake A Simmons, and Steven W
Singer. 2014. “MaxBin: An Automated Binning Method to Recover Individual
Genomes from Metagenomes Using an Expectation-Maximization Algorithm.”
Microbiome 2 (26). doi:10.1186/2049-2618-2-26.

" " "" " "
"" " " 101"
Appendices
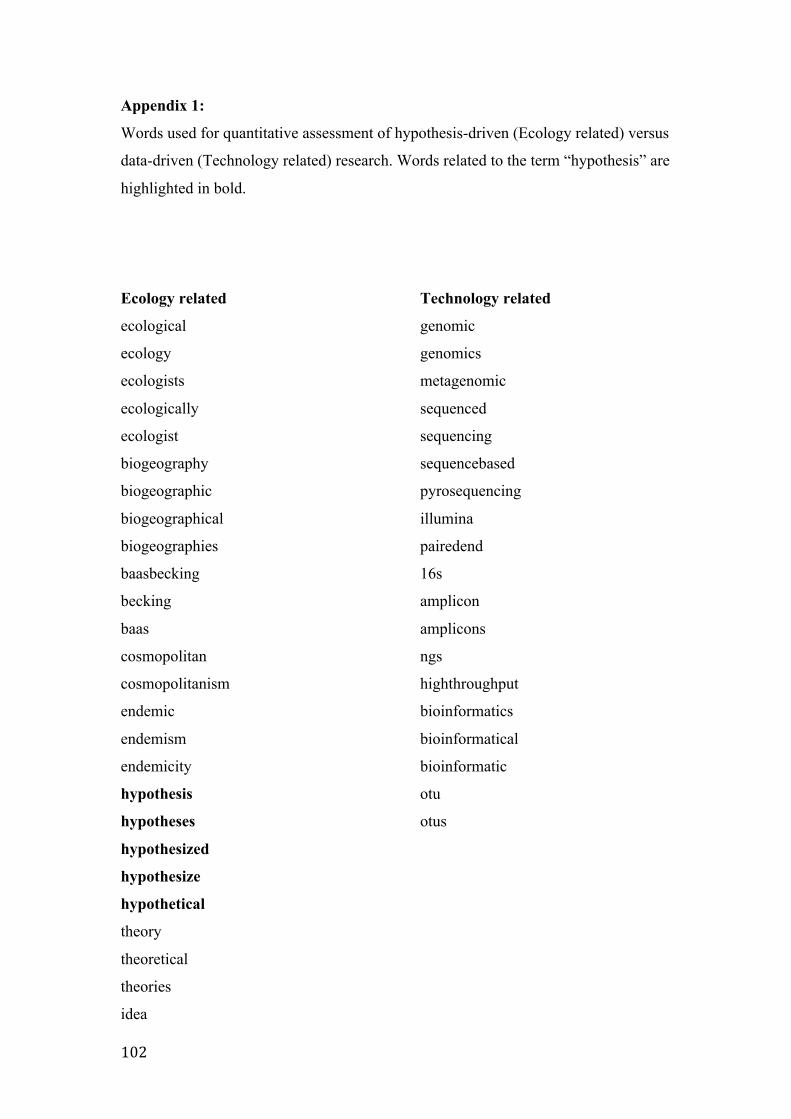
!102!
Appendix 1:
Words used for quantitative assessment of hypothesis-driven (Ecology related) versus
data-driven (Technology related) research. Words related to the term “hypothesis” are
highlighted in bold.
Ecology related
ecological
ecology
ecologists
ecologically
ecologist
biogeography
biogeographic
biogeographical
biogeographies
baasbecking
becking
baas
cosmopolitan
cosmopolitanism
endemic
endemism
endemicity
hypothesis
hypotheses
hypothesized
hypothesize
hypothetical
theory
theoretical
theories
idea
Technology related
genomic
genomics
metagenomic
sequenced
sequencing
sequencebased
pyrosequencing
illumina
pairedend
16s
amplicon
amplicons
ngs
highthroughput
bioinformatics
bioinformatical
bioinformatic
otu
otus
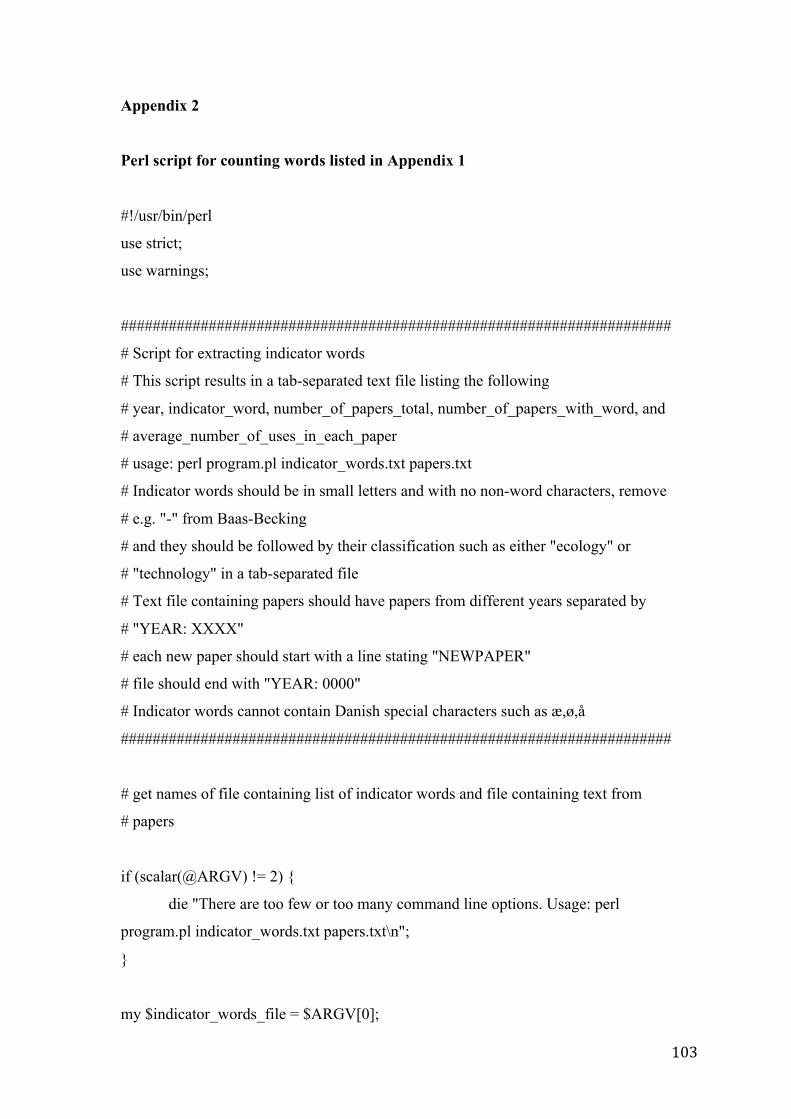
! 103!
Appendix 2
Perl script for counting words listed in Appendix 1
#!/usr/bin/perl
use strict;
use warnings;
#####################################################################
# Script for extracting indicator words
# This script results in a tab-separated text file listing the following
# year, indicator_word, number_of_papers_total, number_of_papers_with_word, and
# average_number_of_uses_in_each_paper
# usage: perl program.pl indicator_words.txt papers.txt
# Indicator words should be in small letters and with no non-word characters, remove
# e.g. "-" from Baas-Becking
# and they should be followed by their classification such as either "ecology" or
# "technology" in a tab-separated file
# Text file containing papers should have papers from different years separated by
# "YEAR: XXXX"
# each new paper should start with a line stating "NEWPAPER"
# file should end with "YEAR: 0000"
# Indicator words cannot contain Danish special characters such as æ,ø,å
#####################################################################
# get names of file containing list of indicator words and file containing text from
# papers
if (scalar(@ARGV) != 2) {
die "There are too few or too many command line options. Usage: perl
program.pl indicator_words.txt papers.txt\n";
}
my $indicator_words_file = $ARGV[0];
!104!
my $papers = $ARGV[1];
# read in indicator words into look-up hash
my %indicator_words;
my %classifications;
open (iw_IN, "<", "$indicator_words_file") or die "File containing indicator words
could not be opened.\n$!\n";
while (defined (my $iw_line = <iw_IN>)) {
chomp $iw_line;
my @temp = split/ /, $iw_line;
$classifications{$temp[0]} = $temp[1];
$indicator_words{$temp[0]} = 1;
}
close iw_IN;
# for each year count number of papers with each indicator word (%count_papers
hash)
# and count use of indicator word (%count_words hash)
my $year = "";
my $first_iteration = "ON";
my $paper_count_total = 0;
my %count_papers;
my %count_words;
# while loop over the entire text file for all years
open(IN, "<", "$papers") or die "The file containing papers to be assessed cannot be
opened.\n$!\n";
open(OUT, ">", "Indicator_word_statistics.txt");
print OUT
"year\tindicator_word\tnumber_of_papers_total\tnumber_of_papers_with_word\tcoun
t_of_word\taverage_number_of_uses_in_each_paper\tclassification\n";
! 105!
while (defined (my $line = <IN>)) {
chomp $line;
if ($line =~ m/^YEAR: (\d+)$/) {
if ($first_iteration eq "OFF") {
foreach my $keys (sort keys %indicator_words) {
if (exists $count_papers{$keys}) {
print OUT
"$year\t"."$keys\t"."$paper_count_total\t".$count_papers{$keys}."\t".$count_words{
$keys}."\t".$count_words{$keys}/$paper_count_total."\t".$classifications{$keys}."\n
";
}
}
} else {
$first_iteration = "OFF";
}
# for each new year the paper count should be reset, after it has been written to output,
# same with year and paper- and word-counts
$paper_count_total = 0;
$year = $1;
%count_papers = ();
%count_words = ();
} else {
if ($line =~ m/^NEWPAPER$/) {
$paper_count_total += 1;
# if it is a new paper the indicator for having counted a word in the paper should be
# reset
foreach my $keys (keys %indicator_words) {
$indicator_words{$keys} = 1;
}
} else {
$line =~ s/- //g; # remove "- " which
occurs at line ends when text has been copied
my @words = split / /, $line;
foreach my $word (@words) {
!106!
$word =~ tr/A-Z/a-z/; # makes all letters small
$word =~ s/\W//g; # removes all non-word
characters (including "-")
# for words that are defined as indicator words
if (exists $indicator_words{$word}) {
if (exists $count_papers{$word}) {
# the word is known
if ($indicator_words{$word} == 1) {
# the word is known but
not in this paper
$count_papers{$word} += 1;
$indicator_words{$word} = 2;
}
} else {
#
the first time the word is met in all papers
$count_papers{$word} = 1;
$indicator_words{$word} = 2;
}
if (exists $count_words{$word}) {
$count_words{$word} += 1;
} else {
$count_words{$word} = 1;
}
}
}
}
}
}
close IN;
close OUT;