
Microarray - Leukemia vs. normal GeneChip System.
31
-
Upload
crystal-evans -
Category
Documents
-
view
226 -
download
0
Transcript of Microarray - Leukemia vs. normal GeneChip System.


Microarray - Leukemia vs. normal

GeneChip System

Affymetrix Gene Expression Machine

Spotter device

Robot arm

Robot for printing

Print head
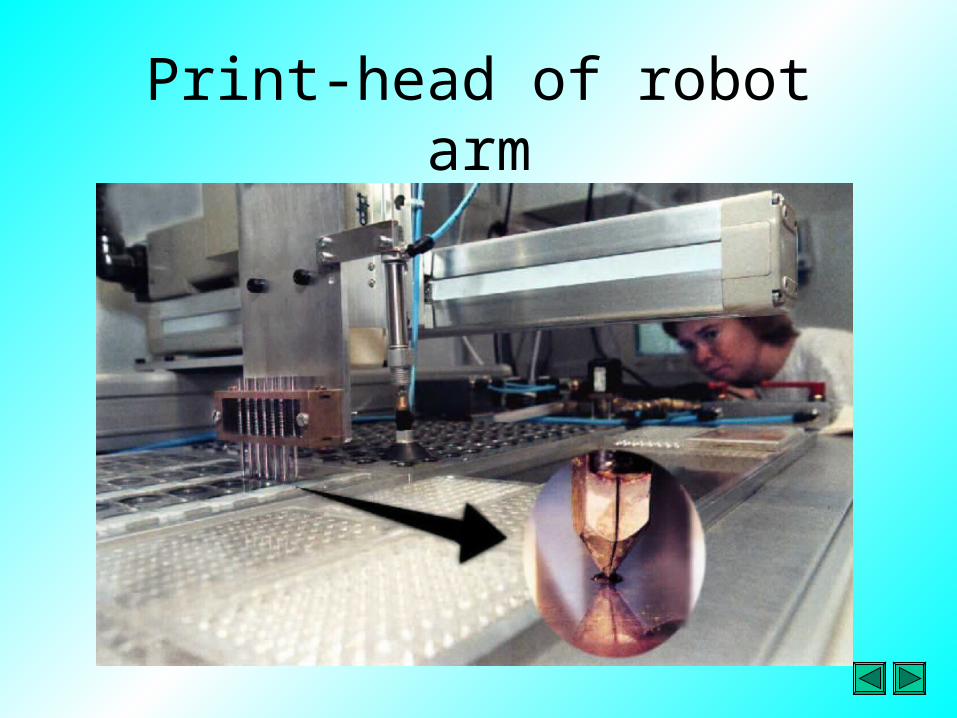
Print-head of robot arm

Hybridization equipment

Part
3
Raw Raw Microarray Microarray
DataData

Raw data from microarrays
• Microarray data comprise images from hybridized arrays representing hybridization signal intensities for individual spots
• These may be generated by single fluorescent, dual fluorescent, radioactive or colorimetric labels and the recording methods differ in each case

Microarray preparation
• They are miniature devices comprising a large number of DNA sequences immobilized on a substrate such as a glass microscope slide
• The sequences, known as features, are arranged as a grid
• Arrays are hybridized with a complex probe (a population of labeled DNA or RNA molecules, representing a particular cell type or tissue)
• The intensity of hybridization signal for each feature corresponds to the amount of that particular molecule in the probe, and this is directly proportional to the level of gene expression in the cell type or tissue from which the probe was prepared

• They consist of images from hybridized arrays• The exact nature of image depends on the array
platform (the type of array used)

First generation microarrays
• They were made by spotting DNA molecules onto nylon membranes and hybridized with a radioactive probe. The signals were detected and quantified using a phosphorimager
• spatial resolution of radioactive signals is low, so the features on the array cannot be packed very tightly
• Hence, nylon arrays tend to be large (in order of 10 cm2) and are sometimes called macroarrays for this reason
• Feature density can be increased by using a colorimetric label instead of a radioactive label, but the sensitivity is lower

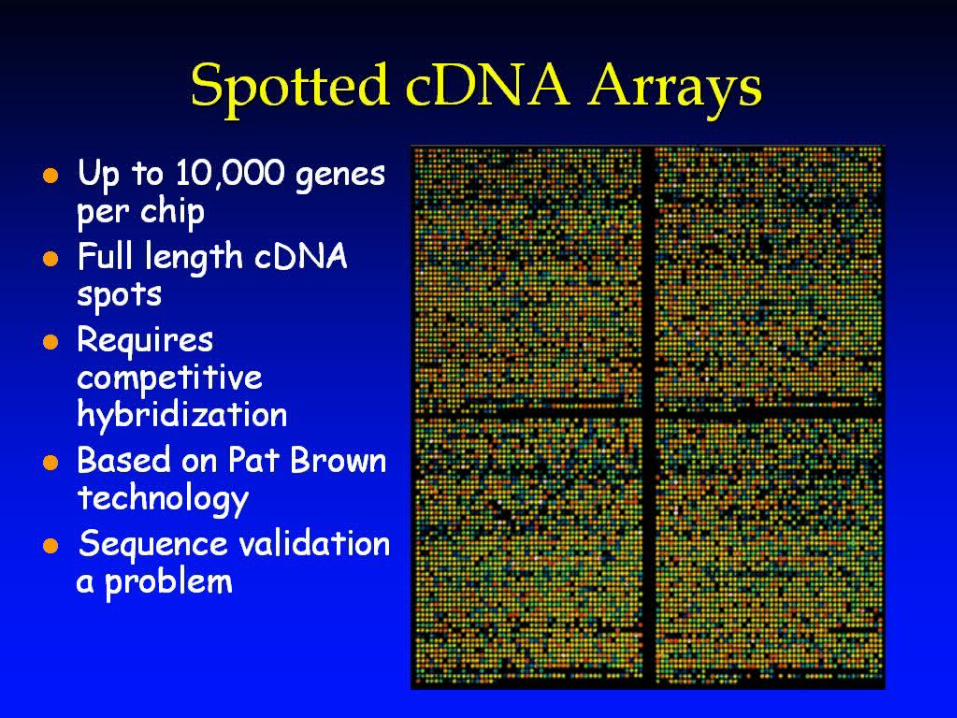
Second generation microarrays• Spotted cDNA microarrays or high-density
oligonucleotide chips are used in most array experiments these days
• In both cases, the substrate has minimal autofluorescence so a fluorescent probe can be used
• Data are acquired by confocal laser scanning of hybridized array at appropriate excitation wavelength and recording at appropriate emission wavelength (or channel)

Part
4
Data Data QualityQuality

Labeling and hybridization• A single label is used for oligonucleotide chips, so
differential gene expression is detected hybridizing different probes to duplicate arrays
• However, in the case of spotted arrays, two probes can be labeled with different fluorophores and hybridized simultaneously to the same array allowing differential gene expression to be monitored directly

Data Normalization Issues
• Normalization of data from different chips– MGED normalization standards -- www.mged.org
• natural biological variation is large • technical variation is small ~ 98% auto-correlation • MIT approach -- raw gene expression values• Stanford approach -- ratios

Data Preparation
• Thresholding: usually min 20, max 16,000– For older Affy chips (new Affy chips do not have
negative values)
• Filtering - remove genes with insufficient variation– e.g. MaxVal - MinVal < 500 and MaxVal/MinVal < 5– biological reasons– feature reduction for algorithmic
• For clustering, normalize each gene separately to – Mean = 0, Std. Dev = 1

Data quality
• It is essential to record signal intensities from individual spots accurately as errors in data recording cannot be detected or corrected at a later stage
• Software for reading microarrays is generally provided with the recording equipment (scanner or phosphorimager) but manual adjustment is necessary to compensate for variations in array manufacture
• The signal must be corrected for background (nonspecific hybridization, autofluorescence, contamination) and hybridization controls must be used when comparing results across different arrays

Process automation• DNA arrays may contain many thousands of features and
hence data acquisition and analysis must be automated
• Software for initial image processing is normally provided with the scanner (or phosphoimager), which allows boundaries of individual spots to be determined and the total signal intensity to be measured over the whole spot (called signal volume)
• Locating spots precisely can be problem, particularly if there is distortion on array surface, and hence often necessary to align the grid manually. This is essential since signal intensities can vary across individual spots and the shape an size of different spots may not be uniform

Noise suppression• Signal intensity has to be corrected for background
noise, which may creep in by non-specific hybridization, autofluorescence, dust and other contaminants or poor hybridization technique (e.g. partial dehydration)
• Noise can vary over the array surface, so signal intensities must be normalized for local background values
• Correction for background noise is difficult when the signal intensity for a particular spot is itself very low

Control features
• They should be included on array to measure non-specific hybridization and variable hybridization across arrays
• For instance, Affymetrix GeneChips incorporate a set of mismatching oligonucleotides for each perfect match set to determine non-specific hybridization
• Controls are important where duplicate arrays are being used to study differential gene expression, since variation in array manufacture or experimental protocol can influence signal intensities on different arrays
• Bottom line is that errors and artifacts introduced before or during data acquisition cannot be detected or corrected later

Gene expression matrices
• The raw data from microarray experiments are converted into tables known as gene expression matrices
• The rows represent genes and the columns represent experimental conditions
• The data in the table are signal intensities, representing relative levels of gene expression

Grouping expression data
• Each gene in a gene expression matrix has an expression profile, that is, the expression measurements over a range of conditions
• The analysis of microarray data involves grouping these data on the basis of similar expression profiles
• If a predefined classification system is used to group the genes, the analysis is described as supervised
• If there is no predefined classification, the analysis is described as unsupervised and is known as clustering

Clustering methods• Clustering first involves converting the gene
expression matrix into a distance matrix, so genes with similar expression profiles can be grouped together
• This generally involves calculating the Euclidean distance, the correlation measure based distance or the Pearson linear correlation based distance for each pair of values
• Several clustering methods can then be used including hierarchical clustering, k-means clustering and the derivation of self-organizing maps