Micro-scale testing and micromechanical modelling for high ...
45
1 Micro-scale testing and micromechanical modelling for high cycle fatigue of CoCr stent material. C.A. Sweeney a,* , B. O'Brien b , F.P.E. Dunne c , P.E. McHugh b , S.B. Leen a a Mechanical Engineering, College of Engineering and Informatics, National University of Ireland Galway, Ireland b Biomedical Engineering, College of Engineering and Informatics, National University of Ireland Galway, Ireland c Department of Materials, Imperial College London *Corresponding author: Tel: +353 (0)91 493020; Fax: +353 (0)91 563991; E-mail: [email protected] Abstract This paper presents a framework of experimental testing and crystal plasticity micromechanics for high cycle fatigue (HCF) of micro-scale L605 CoCr stent material. Micro-scale specimens, representative of stent struts, are manufactured via laser micro- machining and electro-polishing from biomedical grade CoCr alloy foil. Crystal plasticity models of the micro-specimens are developed using a length scale-dependent, strain-gradient constitutive model and a phenomenological (power-law) constitutive model, calibrated from monotonic and cyclic plasticity test data. Experimental microstructural characterization of the grain morphology and precipitate distributions is used as input for the polycrystalline finite element (FE) morphologies. Two microstructure-sensitive fatigue indicator parameters are applied, using local and non-local (grain-averaged) implementations, for the phenomenological and length scale-dependent models, respectively, to predict fatigue crack initiation (FCI) in the HCF experiments. Keywords: high cycle fatigue, CoCr alloy, crystal plasticity, finite element
Transcript of Micro-scale testing and micromechanical modelling for high ...

1
Micro-scale testing and micromechanical modelling for high cycle fatigue of CoCr stent
material.
C.A. Sweeneya,*
, B. O'Brienb, F.P.E. Dunne
c, P.E. McHugh
b, S.B. Leen
a
aMechanical Engineering, College of Engineering and Informatics, National University of Ireland Galway,
Ireland
b Biomedical Engineering, College of Engineering and Informatics, National University of Ireland Galway,
Ireland
c Department of Materials, Imperial College London
*Corresponding author: Tel: +353 (0)91 493020; Fax: +353 (0)91 563991;
E-mail: [email protected]
Abstract
This paper presents a framework of experimental testing and crystal plasticity
micromechanics for high cycle fatigue (HCF) of micro-scale L605 CoCr stent material.
Micro-scale specimens, representative of stent struts, are manufactured via laser micro-
machining and electro-polishing from biomedical grade CoCr alloy foil. Crystal plasticity
models of the micro-specimens are developed using a length scale-dependent, strain-gradient
constitutive model and a phenomenological (power-law) constitutive model, calibrated from
monotonic and cyclic plasticity test data. Experimental microstructural characterization of the
grain morphology and precipitate distributions is used as input for the polycrystalline finite
element (FE) morphologies. Two microstructure-sensitive fatigue indicator parameters are
applied, using local and non-local (grain-averaged) implementations, for the
phenomenological and length scale-dependent models, respectively, to predict fatigue crack
initiation (FCI) in the HCF experiments.
Keywords: high cycle fatigue, CoCr alloy, crystal plasticity, finite element

2
1. Introduction
The issue of premature fracture of stents has come to the fore in recent times due to the
evolution of drug-eluting stents (DESs) e.g. [1–3]. Fractures were previously concealed by
growth of neointima over stent struts and often went unnoticed as the tissue-growth provided
support at the site of the fracture and provided coverage from the blood flow [4,5]. The
prevention of restenosis with DESs resulted in the exposure of stent fracture sites. High cycle
fatigue is a cause of premature stent fracture. For example, slip bands reported by Halwani et
al. [1] at sites of stent fracture support the case for HCF as the probable fracture mechanism.
For micro-scale devices, for which dimensions are comparable in size to microstructural
features, such as stents, crack propagation is expected to play only a small role, i.e. it is
expected that fatigue life is dominated by fatigue crack initiation (FCI) and microstructurally
small crack growth, as the specimen cross-section is compromised before the later stages of
crack growth. Therefore, the dependence of fatigue performance on microstructural attributes
is expected to increase for such devices. It follows that microstructure-based approaches are
needed to truly assess stent fatigue performance.
Some studies have attempted to address this need, including the work of Marrey et al. [6] in
which an El-Haddad type approach [7], accounting for crack sizes which are below a
microstructural threshold, was applied to fracture mechanics calculations for a CoCr alloy
stent, facilitating prediction of the minimum size of an initial flaw in a stent strut which could
cause failure. A key conclusion of this work was the need for microstructural modelling in
stent fatigue assessment. Barrera et al. [8] adopted the Dang Van criterion for prediction of
fatigue performance of a 316L SS stent, using shear and hydrostatic stresses evaluated at the
mesoscopic level. The authors have previously applied a crystal plasticity (CP) approach (i.e.
modelling of slip on individual slips systems in the crystal lattice of discrete grains) to fatigue

3
assessment of 316L stainless steel [9] and L605 CoCr alloy stents [10], demonstrating the
ability to capture the effect of microstructural inhomogeneity and illustrating scope for the
CP framework as a tool for fatigue design of stent geometries. Patient-specific modelling,
such as presented by Schievano et al. [11], can offer a means of validation via direct
comparison between models and deformed stents, extracted from real patient vessel
geometries. However, the procurement of the required data is difficult and this approach may
be less applicable to the initial stages of stent fatigue design, prior to approval for in vivo
operation. Representative testing can be used for experimental validation of models at the
design stage. Wiersma et al. [12,13] applied the theory of critical distances to prediction of
the HCF behaviour of 316L stent material and validated predictions via comparison against
HCF tests on micro-specimens with features representative of stents. Pelton et al. [14]
demonstrated that a subcomponent micro-specimen exhibited similar fatigue behaviour to a
full stent, effectively endorsing the concept of a representative test as a simplified experiment
against which predictive models can be calibrated and validated.
As mentioned previously, crack initiation is expected to dominate over propagation in HCF,
particularly in the case of micro-scale components, and it has been firmly established that
FCI is a microstructurally-driven phenomenon [15–17]. Sangid [18] provides a
comprehensive description of the build-up of dislocations and development of energy
minimising dislocation structures leading to the formation of persistent slip bands, and
subsequent crack initiation at the slip band-matrix interface. It is clear that microstructure-
sensitive modelling methodologies are needed for the capture of the phenomena leading to
FCI and, thus, HCF failure. Sangid et al. [19–21] have developed a dislocation-driven
criterion for the prediction of FCI based on the stability of an energy balance for PSB
formation, including terms for dislocation-grain boundary interaction determined via

4
atomistic simulations. Microstructure-sensitive fatigue indicator parameters (FIPs) coupled
with CP modelling represents another approach. Studies by Przybyla and McDowell [22,23]
used such an approach to investigate the influence of different attributes on the development
of extreme values of FIPs, considered to be drivers of FCI, in HCF. These studies used large
numbers of statistical volume elements (SVEs) to develop reliable probability functions for
different microstructural attributes; the SVEs used were large enough such that FIPs at a
point were unaffected by microstructure variations at a distance equal to the size of the SVE.
The SVEs differ from representative volume elements (RVEs) in that the macroscopic
response of SVEs may vary. In a previous study by the authors [24], the use of a CP-based
microstructure model, coupled with the effective plastic strain FIP, p, was demonstrated for
prediction of FCI locations in HCF of ferritic steel, four-point bending specimens. This study
did not, however, investigate the ability of the framework to predict number of cycles to FCI.
Manonukul and Dunne [25] postulated that the critical value of the effective plastic strain
FIP, at which FCI is predicted to occur, is a material constant and have consolidated this
concept via prediction of fatigue behaviour for a range of loading conditions, across both low
cycle fatigue (LCF) and HCF regimes, including mean stress effects, for a nickel-base alloy.
A crystallographic work parameter [26], W, has also been successfully used to predict the
experimentally-observed FCI site for an austenitic steel [27].
The HCF performance of the L605 CoCr alloy, commonly used in cardiovascular stents, is
investigated in this study, both experimentally and computationally, via a micromechanical
framework. The study presented here adopts the concept of representative testing for stent
fatigue loading. The representative testing facilitates validation of the micromechanical
framework at a physical length scale consistent with the stent application, and for the HCF
regime. L605 foil micro-specimens are manufactured and tested under HCF loading

5
conditions, and microscopy is carried out on the foil to aid in generation of realistic cross-
section polycrystalline models for the foil specimens. The micromechanical framework used
for HCF prediction has been developed and calibrated in previous works [10,28] for the LCF
fatigue behaviour of the L605 alloy, and is hypothesised to predict fatigue behaviour across
both LCF and HCF regimes. Two CP models are investigated and compared within the
micromechanical framework for describing the material constitutive behaviour. The first is a
physically-based strain-gradient CP model, which has been calibrated against cyclic plasticity
data for as-received, fine-grain (d = 32 µm) L605 material in previous work [28] and, with
the same calibrated constants, has been shown to also capture the behaviour of heat-treated,
coarse grain (d = 243 µm) material. A phenomenological power-law constitutive model,
previously calibrated against both monotonic and cyclic plasticity data, and applied to the
assessment of a stent fatigue design for the L605 alloy [10], is also investigated. Two
microstructure-sensitive FIPs, effective plastic strain, p, and crystallographic work, W, are
implemented for the prediction of the number of cycles to crack initiation, Ni, for HCF
behaviour, based on critical FIP values calibrated and validated from macro-scale LCF test
data [10,28], and the predictions are compared with the experimental stress-life data. The
micromechanical framework presented and validated here for stent fatigue design addresses
an outstanding predictive need, highlighted by Marrey et al. [6], for HCF of CoCr alloy
stents.
2. Experiments
The experimental test program for the L605 CoCr alloy foil is discussed in this section,
including microstructural characterisation of the foil and preparation and testing of foil
fatigue specimens. The L605 foil used in the study was supplied in 100 × 100 mm sheets with
thickness of 265 to 270 µm by Goodfellow Cambridge Limited, with chemical composition
6
of 50 wt % cobalt, 20 wt % chromium, 15 wt % tungsten, 10 wt % nickel, 3 wt % iron and 2
wt % manganese.
2.1. Microscopy
Microstructural characterization of the foil was carried out to provide data for generation of
microstructure FE geometries, including grain size statistics, precipitate statistics and
crystallographic texture. Optical microscopy was first carried out to determine the grain
structure in the foil. An etching solution of 100 ml HCl and 5 ml 30% H2O2 was used, as
described for the macro-scale CoCr material in [10,28]. Optical micrographs of the foil are
shown in Fig. 1 (a), where three directions, corresponding to the flat surface and two
perpendicular edges, are investigated. A Matlab program was written to extract grain area
statistics from the micrographs; the program calculates individual grain areas based on the
number of pixels in a polygon, defined by the grain boundaries, and proceeds to generate a
distribution of grain areas. As seen from the micrographs of Fig. 1 (a) and the grain area
distributions of Fig. 1 (b), a similar grain morphology is observed for all three directions; it
appears the microstructure is equiaxed. As in previous studies [10,28], an approximation of
hexagonal grains is adopted to extract a grain size distribution; a hexagon-based conversion is
applied to each grain measurement, whereby the grain size of a hexagonal grain (flat-to-flat
dimension), with area equivalent to the measured grain area, is identified. The foil material is
found to have an average grain size of 38 µm, corresponding to the average grain size for
equivalent hexagonal grains. Additionally, twin boundaries can be observed in the
micrographs for the as-received foil, attributed to annealing carried out by the manufacturer.

7
Figure 1 (a) Optical micrographs of the etched foil in the flat and two edge directions and (b)
measured grain area distributions for the foil.
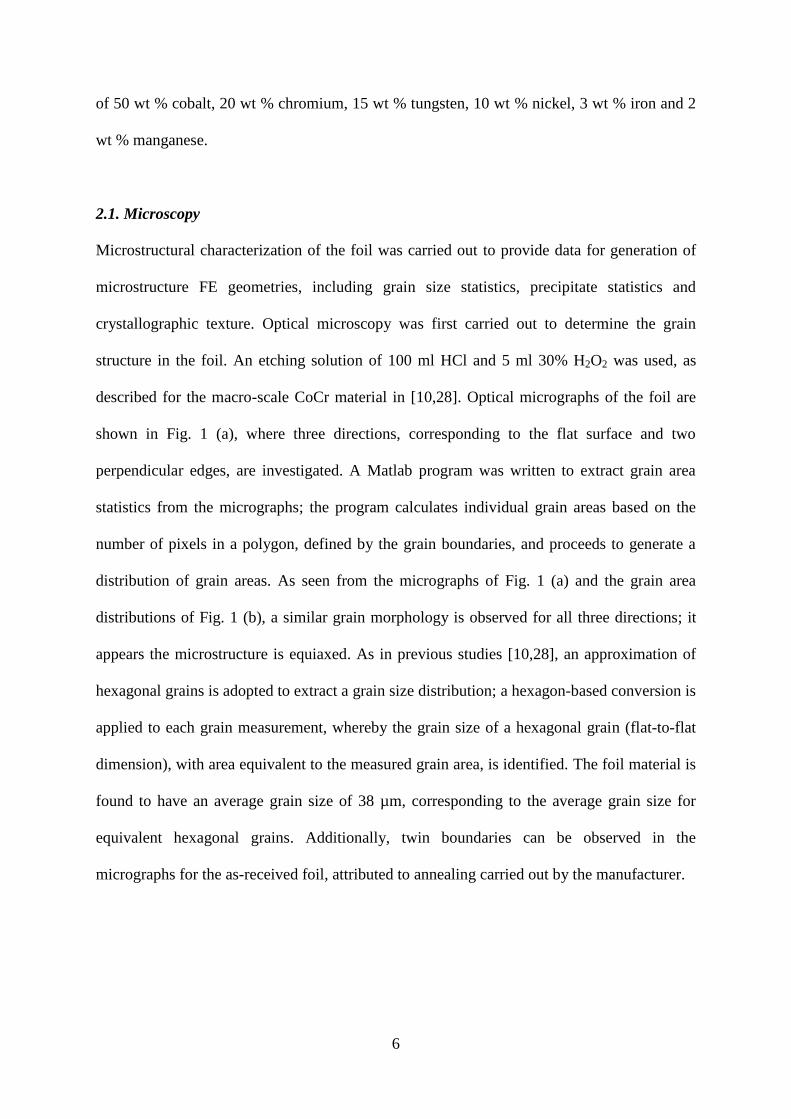
Scanning electron microscopy (SEM) is employed both for investigation of crystallographic
texture and characterization of particles in the microstructure. The electron backscatter
diffraction (EBSD) technique is coupled with SEM, to produce the EBSD crystallographic
orientation maps, shown in Fig. 2 (a), for the three directions of Fig. 1. A lack of
crystallographic texture is observed, due to heat treatment of the foil, indicating that the
grains have random crystallographic orientation. Without heat-treatment of the foil, a strong
crystallographic texture, developed during the manufacturing process, would still exist. If this
were the case, any attempt to simulate the foil fatigue behaviour would require inclusion of
such texture in the model, as it would have an effect on the mechanical performance of the
8
foil. For example, Mineur et al. [29] observed a softer cyclic response for fatigue specimens
machined from 316L (fcc) rolled sheet material to favour the ⟨110⟩ direction.
SEM is also used to identify precipitates in the microstructure, as shown in Fig. 2 (b), where
energy dispersive x-ray (EDX) analysis is employed to confirm a tungsten rich composition,
as for precipitates observed in as-received L605 bar material in previous work [10]. A Matlab
program was written to extract statistics for precipitate area and frequency from micrographs,
indicating an average precipitate area of 1.51 µm2 and area fraction of 0.34%.
Figure 2 (a) EBSD orientation maps for the three direction of the L605 foil and (b) SEM image
showing precipitates (light grey) within the L605 matrix (dark grey).
2.2. Fatigue Specimen Preparation
Micro-scale foil specimens were manufactured which are scale-consistent with stent struts.
Microscopy results from the previous section demonstrate the lack of morphological or
crystallographic texture in the foil, thus eliminating concerns over directionality in the
material itself. The specimens were manufactured via laser-cutting and electro-polishing
(EP). The specimen drawing used for the laser-cutting of foil specimens is given in Fig. 3 (a)

9
and (b), where consideration of laser beam spot size and material removal in EP is taken into
account. The specimen design, based on the work of Donnelly [30], has a dogbone-type
gauge region, with uniform gauge length and fillets at each end to a larger cross-section. A
second fillet is used to transition to the gripped cross-section. Support struts are included to
allow ease of handling and structural integrity before testing, and can be snipped once the
specimen is loaded in the fatigue tester. A laser-cut specimen is shown in Fig. 3 (c), in which
the support struts are labelled. The laser-cutting was carried out on a Trumpf TruMicro 5050
picosecond laser, which minimizes heat input and, therefore, gives a small heat-affected zone.
The laser has a fundamental wavelength of 1030 nm. 2100 passes at a rate of 0.5 m/s were
completed for each specimen using a final wavelength of 343 nm and beam power, repetition
rate and pulse energy of 5.6-5.7 W, 200 Hz and 120 µJ, respectively.

10
Figure 3 (a) Drawing of foil fatigue specimen with a magnified view of the gauge region in (b) and
(c) comparison of a laser-cut specimen with a 50 cent euro coin.
Electro-polishing (EP) is required to remove the heat-affected zone and any surface oxides
created during laser-cutting, and to provide a smooth surface A number of studies have
looked at the electro-polishing of L605 for stent applications, reporting the use of various EP
solutions, including a hydrofluoric and nitric acid solution [31], phosphoric acid of different
concentrations [32], a perchloric and acetic acid solution [33] and a sulfuric and phosphoric
acid solution [34]. Various optimal temperatures, EP times and current-voltage settings have
also been reported. Three studies report polishing temperatures of around 55 0C [31,33,34],
while another reports more uniform EP rates at 0 0C [32]. An EP approach based on the work
of Kaufmann et al. [34] is adopted here. The specimens were first cleaned ultrasonically in
deionised water after laser-cutting. EP was then applied to each specimen, followed by

11
rinsing with alcohol and then ultrasonic cleaning in deionised water. The EP solution was
comprised of 45 vol% sulfuric acid, 50 vol% phosphoric acid and 5 vol% water. A schematic
of the EP setup is provided in Fig. 4. The specimen and a piece of stainless steel are
connected to the anode and cathode of a 1.5-10 V/10 A power supply, respectively, and
agitation is provided via a magnetic stirrer.
Figure 4 Schematic of set-up for electro-polishing of laser-cut specimens.
EP trials were initially carried out at 55 0C with a current density of 1-1.5 A/cm
2 as
prescribed by Kaufmann et al. [34]. However, an uncontrolled EP process was observed at
these settings with non-uniform material removal resulting in pitting. Therefore, the
temperature and current were reduced until a more controlled EP process was observed. The
final temperature and current density settings of 25 0C and 0.66 A/cm
2, respectively, were
used, while it was found that an EP time of 10 minutes was required to remove visible surface
dross from the laser-cutting process. Optical images of the gauge region of a specimen before
and after EP are shown in Fig. 5, leading to a reduction in dimensions with significantly
improved surface quality for the post-EP specimens.

12
Figure 5 Optical images comparing surface quality before and after electro-polishing.
After cleaning, the gauge cross-section dimensions of each specimen were measured using an
optical microscope; a total of twelve measurements each for width and thickness were
recorded, including six measurements along each face of the gauge region (i.e. two flat faces
and two edge faces). The average measurements and standard deviations for the gauge cross-
section dimensions of twelve specimens are provided in Table 1; average width (flat
dimension) and thickness (edge dimension) of 176 and 208 µm, respectively, were recorded.
The ranges in measurements for individual specimen width and thickness dimensions were
18.9 and 14.7 µm, respectively.

13
Table 1 Final average gauge cross-sectional dimensions for foil dogbone specimens. Standard
deviations (SD) are provided for each measurement.
Specimen Width (µm) Thickness (µm)
Average SD Average SD
1 183.18 11.63 221.71 3.48
2 181.12 2.56 213.82 3.86
3 171.43 7.45 205.78 4.64
4 152.43 7.82 179.65 5.86
5 178.00 5.97 203.88 2.82
6 171.44 3.84 212.85 6.83
7 181.12 10.50 220.47 2.86
8 165.36 5.97 197.97 5.98
9 181.46 5.02 210.62 4.71
10 190.56 9.07 209.97 5.17
11 170.61 5.65 208.74 4.70
12 156.49 4.31 189.09 6.21
2.3. HCF Testing
HCF testing of the final polished specimens was carried out on the Bose Corporation
EnduraTEC® ElectroForce® 3200 Series fatigue tester. The tests were load-controlled at a
cyclic nominal stress ratio of Rσ=σmax/σmin=0.1 for three stress ranges corresponding to
maximum stresses of 600, 650 and 700 MPa, where the stress levels were chosen to give an
estimated range of lives below 107 cycles, based on L605 HCF data in Marrey et al. [6]. The
tests included a ramp to maximum load, followed by sinusoidal cyclic loading at 1 Hz for 10
cycles, 20 Hz for 1000 cycles and, finally, 50 Hz for the remainder of the test, where the
lower initial frequencies are applied to overcome transient feedback control effects. An upper
limit or run-out life of 107 cycles was selected for these tests. Twelve specimens were

14
successfully tested, comprising four at each stress range, where the loading applied was
specific to each specimen, based on the measured gauge cross-section dimensions (i.e. the
load was set to achieve the correct stress using the specimen specific dimensions of Table 1).
3. Computational Framework
The finite element computational framework developed for the simulation of the micro-
specimen HCF experiments is described in this section, including (i) constitutive models, (ii)
representative FE geometries and (iii) microstructure-sensitive indicator parameters for
prediction of FCI.
3.1. Constitutive Models
Crystal plasticity (CP) modelling is used to define the constitutive behaviour of the foil
micro-specimens, describing crystallographic slip on individual slip systems in discrete
microstructural grains. Previous studies by the authors on LCF of the L605 alloy have
developed both a phenomenological power-law (PL) CP formulation [10] and a physically-
based strain-gradient (SG) CP formulation [28]. Both formulations are implemented in this
study for comparative assessment of the prediction of the foil HCF behaviour. A brief
overview of the key equations is provided here; however further details can be found in the
previous work by the authors [10,28].
The PL CP formulation has been implemented in a user-defined material subroutine (UMAT)
in Abaqus/Standard by Huang [35] and was later modified by the authors [9] to include
kinematic hardening. The visco-plastic PL flow rule, defining the relationship between slip
rate on a slip system α, , and the slip system resolved shear stress τα, is given by:

15
(1)
where a is a reference strain rate, n is a rate sensitivity exponent and gα is the slip system
strain hardness. The slip system hardening function in Eq. (1) is based on that of Asaro and
co-workers [36–39], for which the evolution is defined as:
(2)
where hαβ
represents self (β=α) and latent (β≠α) hardening moduli, which are given by:
(3)
where h0 is the initial hardening modulus, g0 is equal to the critical resolved shear stress, g∞ is
the saturation stress and γa is the accumulated plastic slip. The accumulated plastic slip, used
in Eq. (3), is given by:
(4)
It was found in previous work, via comparison against uniaxial monotonic and LCF tests, that
two kinematic back-stresses are required for accurate simulation of the measured cyclic and
tensile behaviour for the L605 alloy [10]. Thus, the total back-stress here, for the flow rule of
Eq. (1), is given by:
(5)
where the Armstrong-Frederick rule for non-linear kinematic hardening is used to described
the evolution of individual back-stresses:

16
(6)
where Ci and Di are material constants controlling the initial hardening modulus and the rate
of decay, respectively. A more complete description of the PL formulation used here is
provided in previous work [10]. The calibrated PL CP constants, identified via comparison of
the model stress-strain response with cyclic hysteresis loops from LCF tests and tensile curve
for the as-received L605 material, are provided in Table 2.
Table 2 Calibrated PL CP constants for the L605 alloy [10].
g0
g∞
h0
C1
D1
C2
D2
a
n
100 MPa
130 MPa
100 MPa
80 GPa
750
1.25 GPa
0.001
0.002 s-1
50
The physically-based SG CP formulation has been implemented in a user-element subroutine
(UEL) in Abaqus/Standard [40] and has been applied by the authors to successfully predict
the experimentally-observed grain size effect in LCF behaviour of the L605 alloy [28]. The
SG formulation describes the slip due to the glide of statistically-stored mobile dislocations,
ρSSD,m, through the crystal lattice, where hardening occurs due to the presence of immobile
dislocations, including both immobile statistically-stored dislocations, ρSSD,i, and
geometrically necessary dislocations, ρGND. The flow rule for the SG model is defined as:
(7)

17
where b is Burger’s vector magnitude, ν is the frequency of attempts by mobile dislocations
to overcome energy barriers, ΔH is the Helmholtz free energy, k is the Boltzmann constant, T
is the temperature, τc is the critical resolved shear stress and 0 is a reference strain. The
geometrically necessary dislocation density is defined as a function of the elastic deformation
gradient, Fe:
(8)
where bα is Burger's vector and ρGND
α is comprised of both edge and screw dislocation density
components. From Eq. (8), it is clear that the geometrically necessary dislocations form due
to spatial gradients in the deformation gradient, thus introducing a strain gradient effect into
the formulation. Evolution of the immobile statistically-stored dislocations is given by:
(9)
where Hαβ
are interaction coefficients describing the mutual immobilisation between
dislocations of different slip systems, c is a constant and yc is the critical annihilation
distance. The calibrated SG CP constants, identified via comparison of the model stress-strain
response with cyclic hysteresis loops from LCF tests for the as-received L605 material, are
provided in Table 3; use of the same set of constants also allows the capture of the cyclic
plasticity behaviour of heat-treated, coarse grain L605 material [28].
Table 3 Calibrated SG CP constants for the L605 alloy [28].
k
T
b
ν
ρSSDα
0
τc
1.381 10-23
JK-1
293 K
2.56 10-10
m
1.0 1011
s-1
5 1010
m-2
173.5 MPa

18
0
yc
c
ΔH
1.0 10-3
2. 10-9
m
0.01
2.85 10-20
J
The L605 alloy has a face centred cubic crystal structure. Therefore, twelve {111}⟨110⟩ slip
systems are modelled in both CP formulations and anisotropic elasticity, corresponding to the
cubic elastic constants given in [10], is employed.
3.2. Polycrystal Generation
FE polycrystal geometries are generated for simulation of the foil fatigue testing using a
similar approach to that adopted by the authors in [10,28]. In this study, a repeating unit in
the foil specimen gauge region is modelled. It is important to emphasise that due to the small
cross-sectional area of the specimen, the full cross-section is modelled here, as shown in Fig.
6. A boundary condition assumption has, therefore, only to be made for two unit cell (top and
bottom) surfaces. Average width and thickness dimensions reported in the previous section
and a dimension of 200 µm in the loading direction are used for the unit cell, as shown in Fig.
7. Abaqus was used to generate a voxel mesh and a Matlab program was employed to
superimpose 3D Voronoi tessellations on the mesh and, thus, identify element sets
corresponding to grains. A grain volume distribution was generated from the measured grain
area statistics of the foil material , shown in Fig. 1(b), whereby approximation of 2D and 3D
grains as hexagons and rhombic-dodecahedrons, respectively, with a common dimension d,
allows conversion of each grain area measurement for the foil to a grain volume, as outlined
in previous work [10,28]. Five polycrystal morphologies corresponding to grain volume
distributions resembling that of the foil were identified, shown in Fig. 7 (labelled as
Realizations 1 to 5, respectively).

19
Figure 6 Schematic of the repeating unit cell modelled for the foil specimen and the boundary
conditions applied to the FE model, including two surfaces to which periodic boundary conditions
(BCs) are applied, to simulate periodicity along the gauge length, and four free surfaces.

20
Figure 7 HCF model dimensions and generated polycrystal realizations, including inverse pole
figures indicating crystallographic orientations for grains in each realization.
In order to include precipitates in the models, as described by the authors in [10], random
elements were replaced by a seven-element unit, consisting of a precipitate element
surrounded by six matrix elements. The approximation of the precipitate shape as a circle in
2D and a sphere in 3D allows conversion of area data to volume data. An average precipitate
volume is thus identified and used to determine dimensions of the precipitate element at the
centre of the seven-element unit. A sufficient number of regular elements are then replaced
by the unit to achieve the experimentally-measured precipitate volume fraction. The
precipitates are assumed to be tungsten carbides, based on the EDX observations of Section
2.1, and are thus modelled as hard particles with a Young’s modulus of 714 GPa [41]. Each
polycrystal model contains 19634 reduced-integration, 20-noded, brick elements,

21
corresponding to the same mesh density used for in previous 3D polycrystal models for
calibration of the CP constitutive formulations [10,28], and between 138 to 140 grains.
Random crystallographic orientations are assigned, in keeping with the absence of
crystallographic texture observed in Fig. 2, as evident from the inverse pole figures given for
each polycrystal in Fig. 7. As the polycrystal models include the full gauge cross-section,
periodic displacement boundary conditions are applied on faces perpendicular to the direction
of loading only, leaving the remaining four faces unconstrained, representing free surfaces, as
illustrated in Fig. 6.
All five polycrystal realizations of Fig. 7 are simulated at each stress range applied in the
experiments for the PL CP constitutive model. Due to the computational expense associated
with SG CP modelling, only the first realization of Fig. 7 is simulated across the three stress
ranges for the SG constitutive model. As for the experimental tests, the fatigue simulations
are load-controlled, whereby load levels corresponding to the desired nominal stress levels
are applied. The model is initially ramped up to the maximum load level, after which twenty
cycles of loading between maximum and minimum load levels are applied.
3.3. HCF Predictions
A key objective of the current study is to investigate the predictive ability of microstructure-
sensitive FIPs for fatigue performance under different regimes of loading. Two FIPs are
employed in this study. The first is an effective crystallographic plastic strain parameter [25],
p, given as a function of the plastic velocity gradient, Lp:
(10)
where the plastic velocity gradient can be found by Schmid’s Law:

22
(11)
where sα and m
α are the slip direction and slip plane normal, respectively, on slip system α.
This FIP has been successfully used to predict the number of cycles to FCI across LCF and
HCF regimes for a nickel base alloy [25]. Another study established the usefulness of p for
predicting the experimentally-observed FCI sites for explicit ferritic steel microstructures
under four-point bending fatigue [24]. The second FIP used is a crystallographic work
parameter [26], W, which sums strain energy dissipation over all slip systems:
(12)
The effective plastic strain and crystallographic work FIPs, based on the accumulation of
irreversible slip and energy dissipated due to slip, respectively, can be postulated to capture
local dislocation activity leading to FCI, as described in the Section 1. Wan et al. [42]
postulated that it is the energy stored in the formation of dislocation structures, instead of the
energy dissipated, that should be used in predictions of FCI. However, the stored energy
criterion presented was calculated as a fraction of the dissipated energy, where the ratio of
stored to dissipated energy was assumed to reach a stabilised value after the first few cycles
of loading; this is supported by experimental evidence that dissipated energy reaches a given
fraction of total energy (composed of dissipated and stored energy) after stabilisation of
material cyclic behaviour [43,44]. Based on this assumption, values of stored and dissipated
energy (both cyclic and critical quantities) are directly proportional, related by a constant, i.e.
the two energy criterions will give the same predictions of Ni. Thus, the stored energy
criterion of Wan et al. [42] is also captured by the crystallographic work parameter, W, used
here.

23
FCI is predicted to occur when critical values of the cumulative FIPs are reached, i.e. pcrit and
Wcrit. Maximum cyclic values of the FIPs, pcyc and Wcyc, extracted from the final cycle of CP
simulations can be used to predict the number of cycles to FCI via the relation Ni=pcrit/pcyc
(similar for W), where pcrit and Wcrit are identified via calibration against experimental FCI
data. Both local and non-local forms of the FIPs are investigated in this study for prediction
of HCF FCI behaviour. The local FIP approach utilises maximum cyclic FIPs at discrete
material (integration) points. In contrast to this, the non-local approach uses maximum cyclic
FIP values which have been volume averaged over individual grains. Przybyla and
McDowell [22,23] also employ grain volume averaging for FIPs in CP polycrystal models to
generate probability functions for the occurrence of extreme FIP values, thought to be drivers
of FCI. It can be postulated that the FIP distribution over an entire grain contributes to the
probability of slip band formation and, thus, FCI in that grain.
Critical values of the local FIPs, pcrit and Wcrit, have been identified in previous studies for the
PL and SG models ([10] and [28], respectively) via comparison of local maximum cyclic
parameters with L605 Ni data extracted from LCF tests, and these are listed in Table 4. For
the non-local approach, grain-averaging is applied here to the results of PL and SG
simulations presented in [10] and [28], respectively, to generate non-local pcyc and Wcyc
values. The maximum non-local cyclic FIPs are then identified and used to calibrate non-
local values of pcrit and Wcrit for the two CP models according to the relation pcrit =Ni pcyc
(similar for Wcrit), where Ni is the experimental number of cycles to crack initiation, back-
calculated from LCF life data using experimental damage curves, as presented in previous
studies [10,28]. The identified non-local critical FIP values, based on grain-averaged data, are
provided in Table 4 and the plots in Fig. 8 compare experimental LCF Ni data with

24
predictions based on non-local critical FIPs, for the PL and SG models. PL predictions are
compared with LCF data of the as-received material in Fig. 8(a), while SG pcrit and Wcrit
predictions are compared in Figs. 8 (b) and (c), respectively, with LCF data for both as-
received (d = 32 µm) and heat-treated (d = 243 µm) L605 material; both CP constitutive
models were calibrated against cyclic data for the as-received material in previous work
[10,28]. Calibration of critical FIP values is carried out for both models against one data
point, corresponding to the as-received material LCF test at ±1% total strain, while
simulation points corresponding to all other tests are predictions of the experimental data,
based on the identified critical FIP values.
Table 4 Local and non-local critical values of W and p for the power-law and strain-gradient CP
formulations, identified using cyclic FIP values at discrete material points and volume-averaged over
individual grains, respectively.
Power-Law CP Strain-Gradient CP
pcrit Wcrit (MJ/m3) pcrit Wcrit (MJ/m
3)
Local (discrete) [10,28] 439.9 15.63 × 10⁴
164.3 9.19 × 10⁴
Non-local (averaged) 200.8 7.32 × 10⁴ 123.8 6.39 × 10
4

25
Figure 8 Comparison of experimental Ni data for LCF of the L605 alloy with predictions using non-
local FIPs (a) pcrit and Wcrit for the PL constitutive model, and (b) pcrit and (c) Wcrit for the SG
constitutive model.
While the local and non-local critical FIP values have been calibrated against LCF data, these
FIPs are used here for prediction of HCF behaviour based on the hypothesis that critical FIP
values correspond to FCI across both the LCF and HCF regimes, as demonstrated in
Manonukul and Dunne [25].

26
4. Results
4.1. HCF Tests
Stress-life data for the foil HCF tests is provided in Fig. 9, where a single run-out occurred at
the lowest stress range. The Basquin-Goodman relation, derived in previous work [9] for the
prediction of HCF total life in the presence of a mean stress, σm, is given by:
(13)
where σTS is the ultimate tensile strength, identified in previously [10] as 1075 MPa for the
L605 alloy, and C2 and γ2 are constants. This relation is recast here to reflect a constant cyclic
and loading ratio 2/
2/
max
min
m
mR :
(14)
A fit of Eq. (14) to the experimental data is shown in Fig. 9, where C2 and γ2 are identified as
2351 MPa and 12.09, respectively.

27
Figure 9 Stress-life data for HCF tests. A separate marker is used where two data points overlap.
The displacement histories recorded for each test are provided in Fig. 10 (a) and the load-
displacement hysteresis loops output from the EnduraTEC® ElectroForce® fatigue tester for
one specimen at each stress range are given in Fig. 10 (b). Ratcheting occurs during the first
portion of each test, due to the stress-controlled cyclic plastic deformation with tensile mean
stress, gradually followed by a plateau corresponding to elastic shakedown. The tests for
which fracture occurred (all except Specimen 1) were characterised by a rapid increase in
displacement at the end of the test, attributed to the loss of stiffness in the specimen due to
accentuation and localisation of fatigue damage and failure, indicating that Ni Nf. The
hysteresis loops show a similar trend, whereby the loops for the highest stress level (Fig.
10(b), σmax = 700 MPa) appear marginally wider.

28
Figure 10 (a) Displacement histories for each specimen, divided according to maximum nominal
stress and (b) sample load-displacement hysteresis loops for one specimen from each stress range,
where ten cycles of loading are shown at each cycle number.
Post-test optical images of each specimen are provided in Fig. 11. The fracture region is
shown for each specimen, with the exception of the run-out specimen (1) for which a portion
of the gauge region is shown. Specimens 5, 6 and 9 show fractures which are located close to
the fillet at the end of the gauge length, while all other fractures occur within the gauge
length. Surface roughening is visible for every specimen, and this roughening appears to
increase with stress range. Slip lines are seen clearly in a magnified view of Specimen 9 in
Fig. 11, for example, at the highest stress range.

29
Figure 11 Optical images of specimens after fatigue tests, including a magnified view of a region near
the fracture site for one specimen.
4.2. HCF Simulations
In order to predict life via the local FIP approach, local pcyc and Wcyc values are extracted
from the final cycle of loading in the HCF simulations for each material integration point and
the maximum local cyclic FIPs are identified. The number of cycles to crack initiation is then
predicted via the relation Ni=pcrit/pcyc (similar for W), using previously identified local pcrit
and Wcrit values (Table 4). The results are shown in Fig. 12, compared to the measured life

30
data. The Ni predictions from the PL model (blue markers) generally lie within the range of
the experimental life data. However, for the SG models (red markers), life is generally under-
predicted, particularly for Wcrit, for which the predictions are lower than the experimental data
by approximately one order of magnitude.
Figure 12 Comparison of Ni predictions for the PL and SG models with experimental foil life data
using local cyclic FIPs.
Snapshot plots of the final pcyc and Wcyc distributions for one realization of the PL and SG
models are shown in Fig. 13. The peaks in all distributions occur in elements at the free
surface. In some cases peaks occur in corner elements, representing a junction between two
free surfaces and a third periodically constrained surface. While this is not unrealistic, some
of the peaks in corner elements are much higher in comparison with peaks not located in
corner elements. Particularly for Wcyc distributions in the SG models, peaks are an order of
magnitude higher than expected, as illustrated, for example, in a magnified view for the
σmax=600 MPa case of Fig. 13, demonstrating a sensitivity of the SG model to the mixed free
surface-periodic boundary conditions applied. The low predicted Ni values for the SG Wcrit

31
method of Fig. 12 are attributed to these local peaks in Wcrit for the length scale-dependent
model.
Figure 13 Distributions of pcyc and Wcyc for one realization of the PL models and for the SG models.
A non-local, volume-averaging FIP approach is also applied for the prediction of foil FCI
behaviour. Similar to the local prediction approach, non-local pcyc and Wcyc values are
extracted for each grain in the HCF simulations. The maximum cyclic FIP values are
identified and the newly calibrated non-local pcrit and Wcrit values of Table 4 are used for the
prediction of Ni, shown in Fig. 14. SG predictions, again, tend towards lower lives. However,

32
predictions for the two constitutive models are close, compared with Fig. 12 where discrete
FIP values are used. FCI is predicted to occur in grains at the free surface across all stress
levels, for both CP formulations; the critical grain is located at a corner for only one PL
realization (at σmax=700 MPa). The predictions lie within the range of experimental data for
the highest stress level, but are seen to decrease somewhat relative to the test data at lower
stress levels.
Figure 14 Comparison of foil HCF data with Ni predictions using non-local (grain-averaged) FIPs.
5. Discussion
5.1. HCF Tests
The experimental fatigue data of Fig. 9 shows a clear trend, which follows the Basquin-
Goodman relation of Eq. (14), where scatter in data is expected due to the dependence on
microstructure inhomogeneity in the HCF loading regime, particularly for micro-scale
specimens. The hysteresis loops of Fig. 10 (b) clearly show the elasticity-dominated nature of
loading. Ratchetting occurs in the earlier part of tests; however, only a small amount of
plasticity is observed in hysteresis loops except, perhaps, for the highest stress range where
the area encompassed by loops becomes more discernible, indicating a transition towards

33
more widespread plasticity. The optical images of Fig. 11 clearly demonstrate the important
role of micro-slip in fatigue of the foil specimens. Slip lines are visible in a large number of
grains, i.e. grains favourably oriented for slip. Increased surface roughness and improved
visibility of slip lines is observed with increasing stress range, due to increased plasticity.
Although some fractures occur at the edge of the gauge region (Specimens 5, 6 and 9), the
fatigue lives of these specimens are consistent with other specimens for which fractures occur
well within the gauge region.
5.2. Micromechanical Simulations
Two different approaches have been presented in Section 4.2 for interpretation of
micromechanical simulation results, to predict Ni for the foil HCF tests. The PL predictions
were found to be less sensitive to the model boundary conditions and generally give better
correlation with the experimental life data. The local PL Ni predictions lie in the range of
experimental data in Fig. 12; both FIPs perform reasonably well, with pcyc predicting
marginally longer lives in general. For predictions based on non-local cyclic FIP values,
shown in Fig. 14, the PL predictions lie at the lower end of the measured life range for the
lowest stress level. It can be postulated that as stress range reduces and HCF life increases,
microstructural inhomogeneity and local peaks in slip and strain energy dissipation become
more influential on FCI. In contrast, for higher stress ranges, the influence of peaks formed in
the microstructure diminishes in importance and less-localised or average slip and
crystallographic work are adequate predictors of FCI. This is also evident from the
effectiveness of grain volume-averaged FIPs in predictions of L605 LCF behaviour for both
the PL and SG models in Fig. 8.

34
Local SG Ni predictions are more conservative than PL predictions, as seen in Fig. 12,
particularly for Wcyc. This can be attributed to peaks in SG Wcyc distributions being an order
of magnitude higher than present elsewhere in the model, as seen in Fig. 13. The use of non-
local (grain-averaged) FIPs, which is consistent with the nature of the length scale-dependent
SG model, diminishes the effect of unexpectedly high peaks in FIP distributions. However,
the resulting predictions show low sensitivity to the applied stress ranges.
Ni predictions presented here for both the local and non-local FIPs are based on the
assumption of stabilised cyclic FIP values. Examples of the evolution of the maximum local
pcyc and Wcyc for PL and SG models are provided in Fig. 15 (a) and (b), respectively. While
the trends indicate that the cyclic FIPs are not fully stabilised, all curves appear to be
approaching stabilisation. Thus use of the cyclic FIP values for the final cycle simulated are
sufficient for the purposes of this study. Fully stabilised cyclic FIPs would result in a slight
increase in life predictions, improving correlation with experimental life data, as seen from
Figs. 12 and 14. The non-smooth SG plots of Fig. 15 (b) indicate that the SG model is less
stable than the PL model, for the local FIP approach.

35
Figure 15 Evolution of the maximum local FIPs, pcyc and Wcyc at σmax=650 MPa for (a) one
realization of the PL model and (b) the SG model.
Recalling [28], the SG formulation has been calibrated via comparison of the macroscopic
response of a polycrystal model against LCF data for as-received and heat-treated L605
specimens, with emphasis on capture of the stabilised hysteresis loops, rather than monotonic
initial yielding. The PL formulation has been calibrated against both tensile (monotonic) and
LCF data for the as-received L605 material, as described in [10], facilitated by the inclusion
of back-stress terms in the PL model, providing increased control over hysteresis loop shapes.
The PL model in this instance is, thus, better equipped for HCF predictions. The SG model is
also shown to be more sensitive to boundary conditions, evident from the peaks in corner
elements, and it would likely benefit from further mesh refinement to better capture local
strain-gradients away from the corners, at grain boundaries and precipitates. However, the
importance of SG effects cannot be ignored, particularly where a change in grain size is

36
considered. An average grain size of 38 µm is measured here for the L605 foil, which is quite
close to the measured average grain size for the as-received L605 material, used in previous
studies [10,28] (32 µm) for the calibration of the two CP formulations. Therefore, use of the
PL model is acceptable here. However, for material with a gradient in grain sizes (e.g. at the
treated surface of a component), a different distribution of grain sizes or an overall decrease
in grain size, as discussed in [28], a significant change of fatigue behaviour for the alloy
could result. In such cases, the SG formulation would be a more appropriate constitutive
model choice, since it would automatically capture the effect of grain size [28] without the
need to re-calibrate; the PL model would need to be separately calibrated for each
microstructure with different grain size statistics.
The micromechanical models presented here are less successful at capturing the measured
scatter in life data, particularly at lower stresses. In the plot of Fig. 12 the majority of
predictions remain in the 104 and 10
5 cycle regimes, whereas, one test specimen failed at
about 106 cycles and another specimen reached the 10
7 run-out limit. As expected, use of
grain volume-averaged cyclic FIP values reduces further the predicted scatter (Fig. 14). It can
be postulated that extreme microstructure combinations (e.g. the “rogue” grain combination
modelled in fatigue facet nucleation simulations by Dunne and Rugg [45]) must be modelled
in order to capture true scatter. The polycrystal realizations of Fig. 7 represent microstructure
samples with grain volume distributions strongly correlated to the average value of grain
volume and, therefore, are limited with respect to predicting the influence of microstructural
inhomogeneity. Clearly, also, the use of only five polycrystal realizations limits predicted
scatter. A study by Przybyla and McDowell [22] show that use of twenty five SVEs is
sufficient to investigate the link of potentially influential microstructural attributes with
extreme values of FIPs, via probability functions.

37
Some further observations can be made on preferential sites for FCI in HCF, based on the CP
simulations presented here. Aside from the unconstrained free surfaces, predicted FCI sites
are also observed to be influenced by precipitates and grain boundaries. The locations of all
FCI sites predicted are listed in Table S1 of the supplementary data. Corner element
predictions are excluded here, due to sensitivity of corner elements to the applied boundary
conditions. The following general trends for FCI locations are observed for the PL models:
FCI is generally predicted at the free surface, but the probability of subsurface FCI
increases with decreasing stress level. This is consistent with previous observations of
increasing probability of FCI due to subsurface mechanisms at increased numbers of
cycles [15], a trend also predicted by Przybyla et al. [46] for the HCF regime, using
extreme value statistics.
Grain boundaries are dominant predicted locations for FCI, both subsurface and at the
free surface. This is corroborated by experimental observations in the literature of FCI
occurring in PSBs at the grain boundaries (e.g. Schwartz et al. [47]), which act as
barriers to dislocation motion, causing the build-up of dislocations and the formation
of dislocation structures.
FCI is predicted to occur adjacent to precipitates for approximately 50% of Wcyc
predictions. Based on a product of shear stress and plastic slip, Wcyc is more sensitive
to the influence of increased stresses near precipitates than the purely slip-based pcyc.
All subsurface FCI sites are predicted either at a grain boundary or adjacent to a
precipitate or both.
For the SG model, FCI sites are predicted to occur at the free surface for pcyc, but away from
grain boundaries and precipitates. This is attributed to increased material hardening and, thus,
reduced slip at grain boundaries and precipitates due to build-up of geometrically necessary

38
dislocations in SG models. In contrast, Wcyc predictions for the SG model forecast subsurface
FCI sites, both at grain boundaries and adjacent to precipitates, capturing an increase in
crystallographic work at these stress-concentrators. For both the PL and SG models, there are
no conclusive trends to show that FCI predictions either subsurface, adjacent to precipitates
or at grain boundaries correspond to an increase or decrease in Ni values, for the study
presented here. Twin boundaries observed in the foil microstructure in Figs. 1 (a) and 2 (a)
are not represented in the polycrystal models presented here, as for previous macro-scale
material studies [10,28]. It is anticipated, based on the study of Castelluccio and McDowell
[48] on the effect of twin boundaries on FIP accumulation, that twin boundaries would also
be predicted as preferred sites for FCI.
The plots of Figs. 16 (a) and (b) show ranges of maximum Schmid factors across all slip
systems with respect to the direction of applied load for all integration points and for all
grains, respectively, in each of the micromechanical models. The markers indicate integration
points (Fig. 16 (a)) and grains (Fig. 16 (b)) for which FCI is predicted to occur using
maximum local and non-local values, respectively, of pcyc and Wcyc, again excluding
predictions at corner elements for local predictions. For the local FIP approach in Fig. 16 (a),
maximum Schmid factors at the predicted sites of FCI are generally in the upper half of the
full range, with Wcrit predictions in particular favouring higher maximum Schmid factors.
However, a consistent correlation between Schmid factor and FCI location cannot be made,
for predictions based on local FIPs. For the non-local FIP approach, all FCI predictions occur
for grains with maximum Schmid factors in the upper half of the range shown (Fig. 16 (b)),
indicating a clear correlation between grain Schmid factor and FCI location.

39
Figure 16 Maximum Schmid factor at predicted FCI locations using (a) local FIPs at discrete points
and (b) non-local (grain-averaged) FIPs. The range of maximum Schmid factors in each model is also
shown.
Due to the microstructure-sensitive nature of the tests and models presented, multiaxiality
effects in individual grains due to the microstructure itself is inherently accounted for.
However, further validation is required to investigate performance of the micromechanical
framework as a tool in stent fatigue design. The uniform gauge length of the foil specimens
tested here and uniaxial loading applied do not capture the macroscopically multiaxial nature
of stent fatigue. Also, as high mean stresses are common in stents, owing to the high
deformation installation procedure, further testing at higher cyclic load ratios than that used
here would provide further insight into mean stress effects on stent fatigue performance.

40
It is recommended that future work should focus on the development of experimental
methods for identification of the critical values of the FIPs investigated here, to resolve the
unavoidable uncertainties inherent in a model-based identification. It is evident from Table 4
that in a model-based process for identification of the FIP material constants (parameters), the
identified values naturally depend on the specifics of the microstructure-sensitive,
constitutive-failure model combination and associated assumptions (e.g. local, non-local, PL
CP, SG CP, etc.). The key message of this paper is that, for a given constitutive-failure model
combination (and associated assumptions), it is possible to identify, via LCF test calibration,
a critical value of microstructure-sensitive FIP which can successfully predict HCF crack
initiation. Naturally, the quality of this prediction depends, to a certain degree, on the quality
and consistency of the combination of microstructure representation, constitutive model,
failure (FIP) model and associated assumptions. It is postulated that the experimental values
for pcrit and Wcrit lie within the range of critical FIP values identified (Table 4) for the
different constitutive-failure model combinations investigated here. The range of critical FIP
values identified (e.g. between 123.8 and 439.9 for pcrit) would not significantly affect
predicted HCF behaviour on a logarithmic life scale and, thus, choice of critical FIP (within
this range) does not have a significant effect on predicted correlation with HCF test data,
even if consistency is still advised between constitutive-failure model combination used for
FIP calibration and for prediction.
The micromechanics approach for the HCF behaviour of CoCr alloy stents presented here
addresses for the first time a need, highlighted in a study by Marrey et al. [6], for CoCr stent
fatigue predictive modelling capability which accounts for the influence of microstructure.
Validation of the predictive ability of the micromechanical framework for HCF behaviour of
the L605 CoCr alloy has been presented; previous work demonstrated application of the

41
framework as a tool for the efficient design of CoCr stents against fatigue. For future
development of the micromechanical framework for stent fatigue assessment and design, the
results of the current study indicate that the phenomenological PL CP approach performs well
and is suitable for use when data on the stent microstructure is available for calibration.
However, in the case that variations in the precipitate content, grain size and other attributes
affecting strain-gradients exist between calibration and final stent material, it is
recommended, based on the work of a previous study [28], that the SG constitutive model be
used.
6. Conclusions
The HCF behaviour of the L605 CoCr alloy has been successfully characterised via testing of
foil micro-specimens. Slip lines observed on the tested specimens reaffirm the need for
microstructure-sensitive prediction techniques for HCF of micro-components. An L605
micromechanical framework for the prediction of this behaviour has been developed, using
multiple FE microstructure realizations of the foil specimen cross-section and two CP
formulations coupled with microstructure-sensitive FIPs.
Polycrystal simulations allowed identification of free surfaces, precipitates and grain
boundaries as preferred sites for FCI, using local FIP predictions, while grain Schmid factor
is also shown to have influence on FCI location, using non-local FIP predictions. Predictions
of number of cycles to FCI using the power-law CP formulation are in good agreement with
experimental data, while coupling of a non-local FIP approach with the strain-gradient, length
scale-dependent CP formulation produces generally conservative predictions of the foil life
data. Parameters pcrit and Wcrit, calibrated against LCF data and previously shown to be

42
effective across multiple grain sizes, have been validated here as indicators of FCI for the
HCF regime also.
The micromechanical framework has been used here to predict the experimental fatigue
behaviour of a CoCr foil micro-specimen, representative of stent fatigue both in terms of
size-scale and applied HCF loading, and, thus, fulfils the need for a microstructure-sensitive
approach to stent fatigue assessment and design.
Acknowledgements
The authors would like to acknowledge funding from the Irish Research Council under the
EMBARK Initiative Scheme and the Irish Centre for High-End Computing (ICHEC) for the
provision of computational facilities and support. Laser-cutting presented here was carried
out at the National Centre for Laser Applications (NCLA) at the National University of
Ireland, Galway and EBSD work was carried out at the Materials and Surface Science
Institute (MSSI) at the University of Limerick.
References
[1] D.O. Halwani, P.G. Anderson, B.C. Brott, A.S. Anayiotos, J.E. Lemons, The role of
vascular calcification in inducing fatigue and fracture of coronary stents, J. Biomed.
Mater. Res. B Appl. Biomater. 100B (2012) 292–304. doi:10.1002/jbm.b.31911.
[2] F. Shaikh, R. Maddikunta, M. Djelmami-Hani, J. Solis, S. Allaqaband, T. Bajwa, Stent
fracture, an incidental finding or a significant marker of clinical in-stent restenosis?,
Catheter. Cardiovasc. Interv. 71 (2008) 614–618. doi:10.1002/ccd.21371.
[3] G. Sianos, S. Hofma, J.M.R. Ligthart, F. Saia, A. Hoye, P.A. Lemos, et al., Stent
fracture and restenosis in the drug-eluting stent era, Catheter. Cardiovasc. Interv. 61
(2004) 111–116. doi:10.1002/ccd.10709.
[4] T. Celik, A. Iyisoy, B. Jata, C.U. Yuksel, E. Isik, Stent fracture: A new villain of the
village, Int. J. Cardiol. 138 (2010) 100–101. doi:10.1016/j.ijcard.2008.06.010.
[5] R.N. Nair, K. Quadros, Coronary Stent Fracture A Review of the Literature, Card. Cath
Lab Dir. 1 (2011) 32–38. doi:10.1177/2150133510395496.
[6] R.V. Marrey, R. Burgermeister, R.B. Grishaber, R.O. Ritchie, Fatigue and life
prediction for cobalt-chromium stents: A fracture mechanics analysis, Biomaterials. 27
(2006) 1988–2000. doi:10.1016/j.biomaterials.2005.10.012.

43
[7] M.H. El Haddad, T.H. Topper, K.N. Smith, Prediction of non propagating cracks, Eng.
Fract. Mech. 11 (1979) 573–584. doi:10.1016/0013-7944(79)90081-X.
[8] O. Barrera, A. Makradi, M. Abbadi, M. Azaouzi, S. Belouettar, On high-cycle fatigue of
316L stents, Comput. Methods Biomech. Biomed. Engin. (2012) 1–12.
doi:10.1080/10255842.2012.677442.
[9] C.A. Sweeney, P.E. McHugh, J.P. McGarry, S.B. Leen, Micromechanical methodology
for fatigue in cardiovascular stents, Int. J. Fatigue. 44 (2012) 202–216.
doi:10.1016/j.ijfatigue.2012.04.022.
[10] C.A. Sweeney, B. O’Brien, P.E. McHugh, S.B. Leen, Experimental characterisation for
micromechanical modelling of CoCr stent fatigue, Biomaterials. 35 (2014) 36–48.
doi:10.1016/j.biomaterials.2013.09.087.
[11] S. Schievano, A.M. Taylor, C. Capelli, P. Lurz, J. Nordmeyer, F. Migliavacca, et al.,
Patient specific finite element analysis results in more accurate prediction of stent
fractures: application to percutaneous pulmonary valve implantation, J. Biomech. 43
(2010) 687–693. doi:16/j.jbiomech.2009.10.024.
[12] S. Wiersma, F. Dolan, D. Taylor, Fatigue and fracture in materials used for micro-scale
biomedical components., Biomed. Mater. Eng. 16 (2006) 137–146.
[13] S. Wiersma, D. Taylor, Fatigue of materials used in microscopic components, Fatigue
Fract. Eng. Mater. Struct. 28 (2005) 1153–1160. doi:10.1111/j.1460-
2695.2005.00952.x.
[14] A.R. Pelton, V. Schroeder, M.R. Mitchell, X.-Y. Gong, M. Barney, S.W. Robertson,
Fatigue and durability of Nitinol stents, J. Mech. Behav. Biomed. Mater. 1 (2008) 153–
164. doi:16/j.jmbbm.2007.08.001.
[15] K.S. Chan, Roles of microstructure in fatigue crack initiation, Int. J. Fatigue. 32 (2010)
1428–1447. doi:10.1016/j.ijfatigue.2009.10.005.
[16] D.L. McDowell, F.P.E. Dunne, Microstructure-sensitive computational modeling of
fatigue crack formation, Int. J. Fatigue. 32 (2010) 1521–1542.
doi:10.1016/j.ijfatigue.2010.01.003.
[17] F.P.E. Dunne, Fatigue crack nucleation: Mechanistic modelling across the length scales,
Curr. Opin. Solid State Mater. Sci. 18 (2014) 170–179.
doi:10.1016/j.cossms.2014.02.005.
[18] M.D. Sangid, The physics of fatigue crack initiation, Int. J. Fatigue. 57 (2013) 58–72.
doi:10.1016/j.ijfatigue.2012.10.009.
[19] M.D. Sangid, H.J. Maier, H. Sehitoglu, The role of grain boundaries on fatigue crack
initiation - An energy approach, Int. J. Plast. 27 (2011) 801–821.
doi:16/j.ijplas.2010.09.009.
[20] M.D. Sangid, H.J. Maier, H. Sehitoglu, An energy-based microstructure model to
account for fatigue scatter in polycrystals, J. Mech. Phys. Solids. 59 (2011) 595–609.
doi:16/j.jmps.2010.12.014.
[21] M.D. Sangid, H.J. Maier, H. Sehitoglu, A physically based fatigue model for prediction
of crack initiation from persistent slip bands in polycrystals, Acta Mater. 59 (2011) 328–
341. doi:16/j.actamat.2010.09.036.
[22] C.P. Przybyla, D.L. McDowell, Microstructure-sensitive extreme value probabilities for
high cycle fatigue of Ni-base superalloy IN100, Int. J. Plast. 26 (2010) 372–394.
doi:10.1016/j.ijplas.2009.08.001.
[23] C.P. Przybyla, D.L. McDowell, Microstructure-sensitive extreme-value probabilities of
high-cycle fatigue for surface vs. subsurface crack formation in duplex Ti–6Al–4V,
Acta Mater. 60 (2012) 293–305. doi:10.1016/j.actamat.2011.09.031.
[24] C.A. Sweeney, W. Vorster, S.B. Leen, E. Sakurada, P.E. McHugh, F.P.E. Dunne, The
role of elastic anisotropy, length scale and crystallographic slip in fatigue crack

44
nucleation, J. Mech. Phys. Solids. 61 (2013) 1224–1240.
doi:10.1016/j.jmps.2013.01.001.
[25] A. Manonukul, F.P.E. Dunne, High– and low–cycle fatigue crack initiation using
polycrystal plasticity, Proc. R. Soc. Lond. Ser. Math. Phys. Eng. Sci. 460 (2004) 1881 –
1903. doi:10.1098/rspa.2003.1258.
[26] A.M. Korsunsky, D. Dini, F.P.E. Dunne, M.J. Walsh, Comparative assessment of
dissipated energy and other fatigue criteria, Int. J. Fatigue. 29 (2007) 1990–1995.
doi:16/j.ijfatigue.2007.01.007.
[27] Y. Li, V. Aubin, C. Rey, P. Bompard, Microstructural modeling of fatigue crack
initiation in austenitic steel 304L, Procedia Eng. 31 (2012) 541–549.
doi:10.1016/j.proeng.2012.01.1065.
[28] C.A. Sweeney, B. O’Brien, F.P.E. Dunne, P.E. McHugh, S.B. Leen, Strain-gradient
modelling of grain size effects on fatigue of CoCr alloy, Acta Mater. 78 (2014) 341–
353. doi:10.1016/j.actamat.2014.06.044.
[29] M. Mineur, P. Villechaise, J. Mendez, Influence of the crystalline texture on the fatigue
behavior of a 316L austenitic stainless steel, Mater. Sci. Eng. A. 286 (2000) 257–268.
doi:16/S0921-5093(00)00804-2.
[30] E. Donnelly, Geometry effect in the fatigue behaviour of microscale 316L stainless steel
specimens, Thesis, 2012. http://aran.library.nuigalway.ie/xmlui/handle/10379/3029
(accessed September 16, 2014).
[31] P. Sojitra, C. Engineer, A. Rval, D. Kothwala, A. Jariwala, H. Kotadia, et al., Surface
enhancement and characterization of L-605 cobalt alloy cardiovascular stent by novel
electrochemical treatment, Artif. Organs. 23 (2009) 55–64.
[32] H. Aihara, Surface and biocompatibility study of electropolished Co-Cr alloy L605,
Thesis, San Jose State University, 2009.
[33] S.K. Sudheer, D. Kothwala, S. Prathibha, C. Engineer, A. Raval, H. Kotadia, Laser
microfabrication of L605 cobalt-chromium cardiovascular stent implants with
modulated pulsed Nd:YAG laser, J. MicroNanolithography MEMS MOEMS. 7 (2008)
033012–1–033012–9. doi:10.1117/1.2965539.
[34] C. Kaufmann, G. Mani, D. Marton, D. Johnson, C.M. Agrawal, Long-term stability of
self-assembled monolayers on electropolished L605 cobalt chromium alloy for stent
applications, J. Biomed. Mater. Res. B Appl. Biomater. 98 (2011) 280–289.
doi:10.1002/jbm.b.31850.
[35] Y. Huang, A user-material subroutine incorporating single crystal plasticity in the
Abaqus finite element program, Harvard University, 1991.
[36] D. Peirce, R. Asaro, A. Needleman, An analysis of nonuniform and localized
deformation in ductile single crystals, Acta Metall. 30 (1982) 1087–1119.
doi:10.1016/0001-6160(82)90005-0.
[37] R.J. Asaro, Micromechanics of Crystals and Polycrystals, Adv. Appl. Mech. 23 (1983)
1–115. doi:10.1016/S0065-2156(08)70242-4.
[38] R.J. Asaro, Crystal plasticity, J. Appl. Mech. 50 (1983) 921–934.
doi:10.1115/1.3167205.
[39] P.E. McHugh, R.J. Asaro, C.F. Shih, Computational modeling of metal matrix
composite materials—I. Isothermal deformation patterns in ideal microstructures, Acta
Metall. Mater. 41 (1993) 1461–1476. doi:10.1016/0956-7151(93)90255-Q.
[40] F.P.E. Dunne, R. Kiwanuka, A.J. Wilkinson, Crystal plasticity analysis of micro-
deformation, lattice rotation and geometrically necessary dislocation density, Proc. R.
Soc. Math. Phys. Eng. Sci. 468 (2012) 2509–2531. doi:10.1098/rspa.2012.0050.

45
[41] P. Connolly, P.E. McHugh, Fracture modelling of WC-Co hardmetals using crystal
plasticity theory and the Gurson model, Fatigue Fract. Eng. Mater. Struct. 22 (1999) 77–
86. doi:10.1046/j.1460-2695.1999.00153.x.
[42] V.V.C. Wan, D.W. MacLachlan, F.P.E. Dunne, A stored energy criterion for fatigue
crack nucleation in polycrystals, Int. J. Fatigue. 68 (2014) 90–102.
doi:10.1016/j.ijfatigue.2014.06.001.
[43] A.K. Wong, G.C. Kirby III, A hybrid numerical/experimental technique for determining
the heat dissipated during low cycle fatigue, Eng. Fract. Mech. 37 (1990) 493–504.
doi:10.1016/0013-7944(90)90375-Q.
[44] G. Meneghetti, M. Ricotta, The use of the specific heat loss to analyse the low- and
high-cycle fatigue behaviour of plain and notched specimens made of a stainless steel,
Eng. Fract. Mech. 81 (2012) 2–16. doi:10.1016/j.engfracmech.2011.06.010.
[45] F.P.E. Dunne, D. Rugg, On the mechanisms of fatigue facet nucleation in titanium
alloys, Fatigue Fract. Eng. Mater. Struct. 31 (2008) 949–958. doi:10.1111/j.1460-
2695.2008.01284.x.
[46] C. Przybyla, R. Prasannavenkatesan, N. Salajegheh, D.L. McDowell, Microstructure-
sensitive modeling of high cycle fatigue, Int. J. Fatigue. 32 (2010) 512–525.
doi:10.1016/j.ijfatigue.2009.03.021.
[47] J. Schwartz, O. Fandeur, C. Rey, Fatigue crack initiation modeling of 316LN steel based
on non local plasticity theory, Procedia Eng. 2 (2010) 1353–1362.
doi:10.1016/j.proeng.2010.03.147.
[48] G.M. Castelluccio, D.L. McDowell, Effect of annealing twins on crack initiation under
high cycle fatigue conditions, J. Mater. Sci. 48 (2013) 2376–2387. doi:10.1007/s10853-
012-7021-y.