Micro Focus International plc Debt Investor Breakfast · PDF fileMicro Focus International plc...
52
Micro Focus International plc Debt Investor Breakfast Mike Phillips – Chief Financial Officer Rob Ebrey – Director of Tax, Treasury & Risk 18 November 2016
Transcript of Micro Focus International plc Debt Investor Breakfast · PDF fileMicro Focus International plc...

Micro Focus International plc Debt Investor Breakfast
Mike Phillips – Chief Financial Officer
Rob Ebrey – Director of Tax, Treasury & Risk
18 November 2016

Agenda
• Micro Focus Company Overview
• Announced Transaction Summary
• HPE Software Assets Overview
• Financial Impact & Integration
• Appendix
2
Micro Focus International plc Company Overview

Micro Focus
$1.4bn
Offices Worldwide
20,000+ Customers
Annual Revenue
5,000+ Partners
80+ 4,500+ Employees 4

We Are a Software Company We make software, we sell software and we support software
5
Everything is organised to help us do this:
• Our systems
• The way we interact with customers and
partners
• How we deliver consulting services
• We aim to provide investors with a sustainable
return of between 15% to 20% per annum
• In doing so we need to be building a company with
sustainable prospects for the ‘long’ term!

Micro Focus helps its customers
to innovate faster with lower risk
We enable them to embrace new
technology while building on what
already works. We call this
bridging the old and the new
6

An Evolutionary Journey Resulting in Great Complexity - all in the last 35 years!
Internet
of
Things
(IoT) z / OS
PL / I
COBOL
CICS
IMS
Public Cloud Private
Cloud
7

Portfolio Positioning and Approach in Context of the Software Industry
Software company leading consolidation in the mature infrastructure software market to win
through operational efficiency and scale
Product lifecycle
Introduction Growth Maturity Decline
Area of primary focus
New tech models
“Me too” models
Potential change in
trajectory (return to growth)
Reduce rates of decline
Nature of software
• Innovative and often disruptive technologies
• High capex and R&D
• User base rapidly expanding, products repeatedly enhanced
Investment strategy and valuation
• Investing in growth = valuation and returns
• Rich valuations
Nature of software
• Infrastructure software: embedded products with high switching costs
• Limited growth capex
• Margin expansion and efficiency opportunities
Investment strategy and valuation
• Returns driven by maximizing cash flow
• Lower valuations
8

Portfolio Positioning and Approach in Context of the Software Industry (cont’d)
Micro Focus specialises in managing mature infrastructure software assets which have been delivering
value to significant numbers of customers over long periods of time
Product portfolio characteristics Micro Focus approach
• Broad based – covering all industrial sectors
• Significant numbers of customers
• Significant maintenance streams
• Relatively high switching costs
• Significant market positions
‘Fund of funds’ approach to product portfolio
Investment and focus driven by four-box model
Objective: modest growth over medium-term, high levels of
profitability, strong cash flow
Delivered through: efficient and focused investment
across portfolio
Four box model
New Models
Products that are relatively new and unproven in the market but
expected to be growth drivers
1
Optimise
Products with declining sales over a period of time, and the
strategy is to move back to core OR manage decline and
optimize returns in the long run
3
Growth Drivers
Products that have shown consistent potential for sales growth
2
Core
Products that have maintained ‘flat sales’ over time with limited
growth, but are central to the company’s revenues
4
9

Operating Model & Structure: One company with two product portfolios
10
North America International
(EMEA, LATAM)
APJ
Corporate Operations
Finance IT HR
Product Development
Legal Business Operations & PMO
Field Marketing
Product Management
Go To Market
Product
Development
NA, EMEA & APJ (LATAM from MF shared team)
Product Management
Field Marketing
Services, Customer Care, Renewals,
Shared Marketing Services, Sales Operations
Channel, Systems
Integrators & OEM Channel, Systems Integrators & Independent Software Vendors
Product Group
Go To Market
Product Group

Name Role Experience
Kevin Loosemore Executive Chairman
(11 years)
• Appointed non-executive Chairman of the Company in 2005
• Executive Chairman in April 2011
• Previously non-executive Chairman of Morse plc
• Previously, Kevin has acted as Chief Operating Officer of Cable & Wireless plc, President of Motorola EMEA. Prior
to this he was Chief Executive of IBM UK Limited
Mike Phillips CFO (6 years) • Joined Micro Focus in September 2010
• Chief Executive Officer at Morse plc, following his initial role as Group Finance Director
• Left Morse plc in July 2010 following the turnaround and successful corporate sale to 2e2 in June 2010
Stephen Murdoch CEO, Micro Focus
division (4 years)
• Has held senior executive positions in general management, sales, and strategy with IBM and Dell
• Most recently, he was the General Manager of EMEA for Dell's Public Sector and Large Commercial Enterprise
business unit
Nils Brauckmann CEO, SUSE (5 years) • Previously served in cross-functional and international management positions at WRQ (acquired by TAG in 2004),
Novell and Siemens Nixdorf, where he started his technology career
Micro Focus Management Team
Source: Publicly available information, Company websites, BoardEx
Board & Management Team Track record of successful integration
11
2007 2008 2009 2010 2011 2012 2013 2014 2015 2016
CompuWare Application Testing
Liant COBOL and
PL/I development
Orbix CORBA
Novell, NetIQ,
Attachmate, SUSE Identity, Access, Security
Host Connectivity
Collaboration
Performance Monitoring
Workload Management
Cloud Management
Enterprise Linux
Borland Application Lifecycle
Management
& Testing
Acquisitions to Strengthen our Customer Proposition
Authasas Advanced Authentication
Serena ALM & DevOps
NetManage Connectivity
AcuCorp Acu COBOL
Relativity Technologies Application portfolio Management AccuRev
Agile Software
Delivery
PrismTech CORBA
SoforTe Mainframe Solutions
12
Note: Does not include acquisitions smaller than $10M: Authasas (’15), Openfusion (’13), Soforte (’13), Relativity (’09) and Liant (’08).
*Values for Borland, NetManage, Acucorp and Accurev are operating profit, not EBITDA. **Orbix acquisition value includes other assets acquired from Progress Software.
Source: Micro Focus and other companies annual reports, Internal Micro Focus data; Bain Analysis.
ACQUISITION PORTFOLIO GROUPS / MAIN PRODUCTS YEAR ACQUISITION VALUE ($M) EBITDA ($M)
1
2
4
Micro Focus made eight major acquisitions in last 10 years
Serena Dev & ITOM: Mainframe and distributed ALM and
BPM 2016 540 80
Attachmate (TAG) Collab. & Networking (Novell), Host Connectivity
(Attachmate), IAS (NetIQ) and SUSE 2014 2,350 313
Accurev Dev & ITOM: Accurev 2013 19 (2)*
Orbix assets from
Progress SW Collab. & Networking: CORBA 2012 15** 8
Borland Dev & ITOM: Borland / Silk Suite 2009 87 (11)*
Compuware Dev & ITOM: Application Testing and Automated
Software Quality 2009 63 19
NetManage Host Connectivity: RUMBA 2008 46 (2)*
Acucorp CDMS: AcuCobol 2007 40 4*
3
5
6
7
8
13

Net operational improvement accounts for ~36% of Micro Focus’ EBITDA growth over last 10 years
Micro Focus’ EBITDA evolution ($mm)
Note: Does not include acquisitions smaller than $10M: Authasas (’15), Openfusion (’13), Soforte (’13), Relativity (’09) and Liant (’08).
Values for Borland, NetManage, Acucorp and Accurev are operating profit, not EBITDA.
Source: Micro Focus and other companies annual reports, Bain Analysis.
39 3 (2) 19 (11) 8 (2)
313
166 532
80 612
'06 EBITDA Acucorp ('07) NetManage('08)
Compuware('09)
Borland ('09) Orbix assetsfrom Progresss
SW ('12)
Accurev ('13) TAG ('14) Opimprovement
'16 EBITDA Serena ('16) '16 EBITDA(incl Serena)
~34% of ~$490M total EBITDA
growth driven by real net
operational improvement
Serena
acquisition
closed end of
FY16
1 2 4 3 5 6 7 8
14
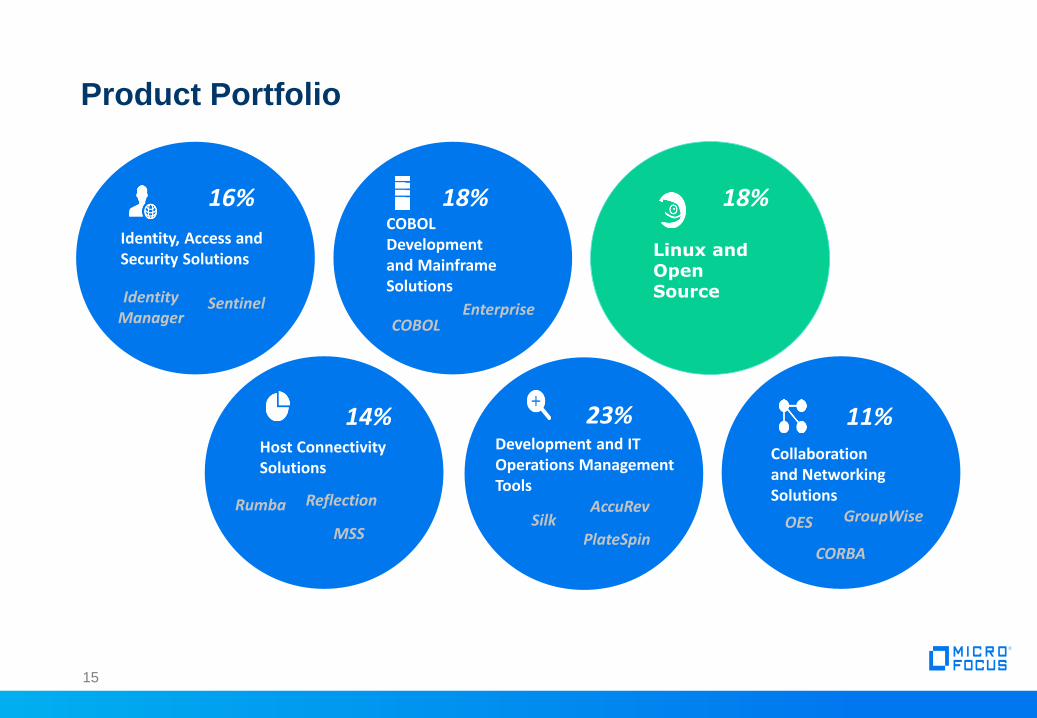
Product Portfolio
15
Linux and Open Source
18% COBOL Development and Mainframe Solutions
18%
COBOL Enterprise
Identity, Access and Security Solutions
16%
Identity Manager
Sentinel
Development and IT Operations Management Tools
13%
Development and IT Operations Management Tools
23%
Silk AccuRev
PlateSpin
11%
OES GroupWise
CORBA
Collaboration and Networking Solutions
Host Connectivity Solutions
14%
MSS
Reflection Rumba

Micro Focus – Product Portfolio Snapshot
16
Identity, Access and
Security Solutions (IAS)
COBOL Development
and Mainframe
solutions (CDMS)
Host Connectivity
Solutions
Development and IT
Operations Mgmt (Dev
& ITOM1)
Collaboration and
Networking Solutions SUSE
$217m
(16% of total)
• Facilitate secure access
by using identity
information (identity
management, access
management, single-
sign-on etc)
• Increased compliance /
regulation, expansion
and diversity of cyber
threats and resultant
financial impact and
virtualisation and cloud
deployment are key
trends driving industry
growth
$259m
(18% of total)
• CD products enable
programmers to
develop applications
written in COBOL
across multiple
platforms including
Windows, UNIX, Linux
and the cloud
• MS products let
customers maximise
value out of their
mainframe. These
technologies allow
customers flexibility in
deciding the platform
choice for development,
testing and deployment
of their business
applications
$198m
(14% of total)
• Enable use of
centralised applications
(especially mainframes)
to end-users across
different environments
and devices
• Enable use of mainframe
applications and data
with modern dev.
environments and
business analytics
• Core products deliver
graphical user interfaces
(GUI) for legacy
applications
$320m
(23% of total)
• Includes tools
(applications) that
enable IT departments
to better manage their
datacenters, software
development and
testing as well as
system monitor and
support tools
• Source Code Change
Management,
Application Lifecycle
Management and
Business Process
Management software
from the Serena
acquistion
$160m
(11% of total)
• Core products include
email, calendaring,
contact management,
solutions for file & print /
storage of enterprise
files
• Brings people, projects
and processes together
in a secure environment
$254m
(18% of total)
• Operating system built
on top of the open
source Linux kernel that
allows a computer and
its various hardware
and software
components to interact
• Enterprise grade Linux
server, open stack,
cloud and storage
solutions
Descri
pti
on
F
Y16
Rev
2
Total
$1,408m
Source: Micro Focus annual report and filings; company data 1 Incl. Serena 2 Pro Forma for Serena acquisition
COBOL
Enterprise
Identity Manager
Sentinel
Rumba
MSS
Reflection
Silk
AccuRev
PlateSpin
OES
GroupWise
CORBA
Pro
du
cts
Linux & Open Stack
1 2 3 4 5 6
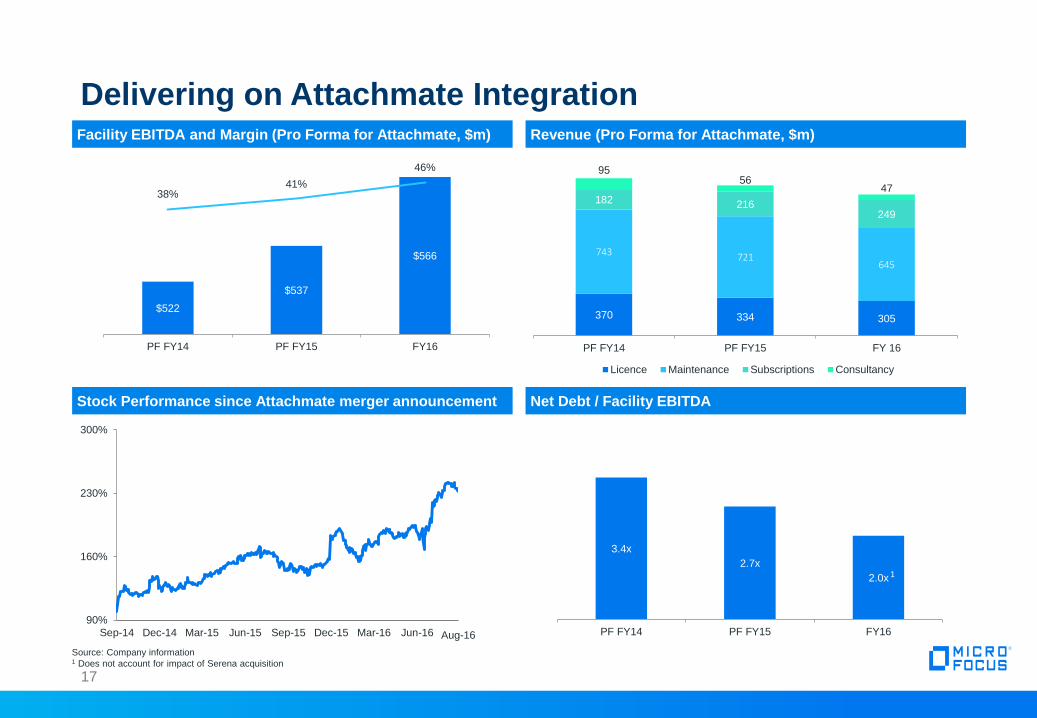
Facility EBITDA and Margin (Pro Forma for Attachmate, $m)
17
Delivering on Attachmate Integration
90%
160%
230%
300%
Sep-14 Dec-14 Mar-15 Jun-15 Sep-15 Dec-15 Mar-16 Jun-16
Revenue (Pro Forma for Attachmate, $m)
Stock Performance since Attachmate merger announcement Net Debt / Facility EBITDA
Aug-16
$522
$537
$566
38% 41%
46%
PF FY14 PF FY15 FY16
370 334 305
743 721 645
182 216 249
95 56
47
PF FY14 PF FY15 FY 16
Licence Maintenance Subscriptions Consultancy
3.4x
2.7x
2.0x
PF FY14 PF FY15 FY16
Source: Company information 1 Does not account for impact of Serena acquisition
1

Micro Focus Overview and Outlook
18 Source: Micro Focus FY16 preliminary results presentation
Overview
• FY16 Results at the high end of management expectations
• Total Shareholder Return strategy continues
– Final Dividend increased by 50.7% to 49.74 cents (2015: 33.00 cents)
– Full Year Dividend increased by 37.8% to 66.68 cents (2015: 48.40 cents)
– Return of Value to shareholders in 2017
Outlook
• Consistent double digit shareholder returns
• Revenue in FY17 minus 2% to zero
– Compared to FY16 CCY pro-forma with Serena
• FY17 revenue exit rate flat with FY16 and anticipate revenue growth in FY18
• Maintain target net debt at 2.5 times to Facility EBITDA
• Appropriate value enhancing acquisitions

Announced Transaction Summary

Announcement ‘At A Glance’ – Key Points
20
Industry Logic Aggregate Consideration Combination Shareholder Impact
1 Based upon the closing share price of Micro Focus as at 6 September 2016; Consideration comprises $6.3bn in Micro Focus equity to HPE shareholders and $2.5bn cash payment to HPE; 2 Acquired EBITDA is UAEBITDA adjusted
for overhead costs of c.$80m that will not transfer to Micro Focus as part of this transaction; 3 Multiple calculated based on effective Enterprise Value of $8.8bn less $400m assumed Return of Value to Micro Focus shareholders
divided by Acquired LTM Q2 2016 Underlying Adjusted EBITDA of $738m; 4 Sales multiples represent implied transaction value at announcement divided by announced Sales metrics; HPE Software Q2 2016 LTM Sales of $3,172m;
Attachmate Group respective transaction value and Revenue FYE March 2014 of $2,350m and $957m; 5 Combined revenues and UAEBITDA based on the twelve months to 30 April 2016, adjusted for the acquisition of Serena; 6 Underlying Adjusted EBITDA removes the impact of net capitalisation/amortisation of development costs and foreign currency gains and losses from Adjusted EBITDA; Combined Underlying Adjusted EBITDA assumes Micro Focus
UAEBITDA of $613m and HPE Software Acquired EBITDA of $738m; 7 Micro Focus margin ex-SUSE and Serena; unadjusted for overhead costs of c.$80m that will not transfer to Micro Focus as part of this transaction; 8 Based on
fully diluted shares outstanding as at 6 September 2016, calculated using the Treasury Share Method
$1.68 per ordinary share8 to existing Micro Focus shareholders prior to
Completion
Merger of Micro Focus International plc with HPE’s Software Business
Segment
$738m Acquired EBITDA
11.4x Expected Completion
Micro
Focus HPE
Software ~$400m RoV
Creates one of the world’s largest pure-play infrastructure software
companies
~$8.8 billion
Aggregate Transaction Value
SUSE
~$4.5 billion
Combined Revenue
~$1.35 billion
Combined Underlying Adjusted EBITDA6
(“UAEBITDA”)
46% vs 21% 12 months to 30 April 2016
EBITDA margin comparison7
Significant scope for operational efficiency gains
HPE Micro Focus and HPE have
separately entered into a
commercial partnership naming
SUSE as HPE’s preferred Linux
partner
Post Completion ownership based on
fully diluted share capital8 of the pro
forma entity
Micro Focus HPE
shareholders
49.9% vs 50.1%
Acquired EBITDA Multiple
HPE Software EV/Sales 4 : 2.64x
TAG EV/Sales 4 : 2.46x
Q3 CY2017
Subject to satisfying closing conditions
& Micro Focus HPE Software
1 5
2
5
3
Ownership

Transaction Overview
• HPE Software revenues4 for the LTM 30 April 2016 of $3.2bn (LTM Q2 2016 y-o-y growth rate adjusted for divestitures, MOBU and currency of
1.5%) and Acquired EBITDA2 was $738m
• Largely complementary portfolio of assets in the infrastructure software space
What Is Being
Acquired?
Proposed
Transaction
• Merger of the software business segment of Hewlett Packard Enterprise (“HPE Software”) with Micro Focus International plc (“Micro Focus”)
• Aggregate acquisition consideration of $8.8bn, representing an effective multiple of 11.4x1 Acquired EBITDA2 LTM to 30 April 2016
• Consideration to HPE shareholders comprises the issuance of Micro Focus shares representing 50.1% of the fully diluted issued share capital3
of the combined group on Completion and a pre-Completion cash payment of $2.5bn to HPE
• Micro Focus shareholders will own 49.9% of the fully diluted share capital of the combined company following Completion of the Transaction,
with HPE shareholders owning the remaining 50.1%
• Proposed Return of Value (“RoV”) to existing Micro Focus shareholders prior to Completion of $400m
Why Is This
Being
Contemplated?
• Transaction consistent with Micro Focus’ strategy of acquiring & efficiently managing sticky mature infrastructure assets
• Transaction significantly increases Micro Focus’ scale in a number of business segments
• Significant potential for operational efficiency gains through the application of Micro Focus’ disciplined operating model. HPE Software delivered
Underlying Adjusted EBITDA margin of 21%5 in the twelve months to 30 April 2016. Micro Focus believes it will be possible to improve the
margin delivered by HPE Software's mature software assets (approximately 80% of revenue) to Micro Focus’ level by the end of the third full
financial year following Completion6
• HPE and Micro Focus have separately announced their intent to enter into a commercial partnership naming SUSE as HPE’s preferred Linux
partner
21
Note: HPE Software financials prepared under US GAAP, Micro Focus financials prepared under IFRS; 1 Multiple calculated based on effective Enterprise Value of $8.8bn less $400m assumed Return of Value to Micro
Focus shareholders divided by HPE Software’s Acquired LTM Q2 2016 EBITDA of $738m; 2 HPE Software’s Acquired EBITDA is UAEBITDA adjusted for overhead costs of c.$80m that will not transfer to Micro Focus
as part of this transaction for the twelve months to 30 April 2016; 3 Fully diluted basis calculated using the Treasury Share Method; 4 HPE Software historical financials have been adjusted for a number of divestments
at various points during the last two fiscal years and the transfer of the Marketing Optimisation Business Unit (“MOBU”) in the fourth quarter of FYE 2015; 5 UAEBITDA margin unadjusted for overhead costs of c.$80m
that will not transfer to Micro Focus as part of this transaction; 6 This is not a profit forecast, and should not be interpreted to mean that the earnings per share of the Enlarged Group following Completion will necessarily be above or below the historical published earnings per share of Micro Focus
Debt financing
• Micro Focus has entered into commitments for a total of US$5.5 billion of debt financing related to the Transaction including a revolving credit
facility of US$500 million
• Enlarged Group expected to have a pro-forma Net Debt to Facility EBITDA multiple of approximately 3.3x at close (post the RoV), which is
expected to reduce to 2.5x within two years following Completion
Completion
Conditions &
Timing
• Completion is subject (amongst other things) to Micro Focus shareholder approval, regulatory clearances, SEC filings in order to create
American Depository Shares for the Consideration Shares and receipt of certain tax opinions
• Completion is expected in Q3 CY2017

Sources & Uses
22
Sources $bn Uses $bn
Issue of new shares 6.3 Equity to HPE shareholders 6.3
New debt 5.0 Cash payment to HPE 2.5
Acquisition purchase price 8.8
RoV 0.4
Acquiror existing debt, other 2.1
Total Sources 11.3 Total Uses 11.3
Capitalisation $bn X LTM EBITDA
RCF ($500mm) -
Debt committed funding 5.0
Total debt 5.0 3.6x Apr-16 / 3.3x Closing
Micro Focus market cap 6.3
HPE Software equity value 6.3
Equity value (at announcement)1 12.6
PF Adj. LTM Facility EBITDA Apr-16 1.392
Source: FactSet, Company announcements
Note: Micro Focus Facility EBITDA PF Serena acquisition of $81mm; Facility EBITDA is Adjusted EBITDA before amortisation and impairment of capitalised development costs 1 Based upon the closing share price of Micro Focus as at 6 September 2016 and the fully diluted share count under the Treasury Method 2 $1,385mm Facility EBITDA as of 30 Apr-16 LTM based on Micro Focus Facility EBITDA of $647mm (PF for Serena acquisition), HPE Software Facility EBITDA of $738mm, adjusted for overhead costs of c.$80m
that will not transfer to Micro Focus as part of this transaction; as per RNS release on 7 September 2016, HPE Software’s underlying adjusted EBITDA and Facility EBITDA as calculated result in the same figure
Sources and Uses
Pro Forma capitalisation (Apr-16A)
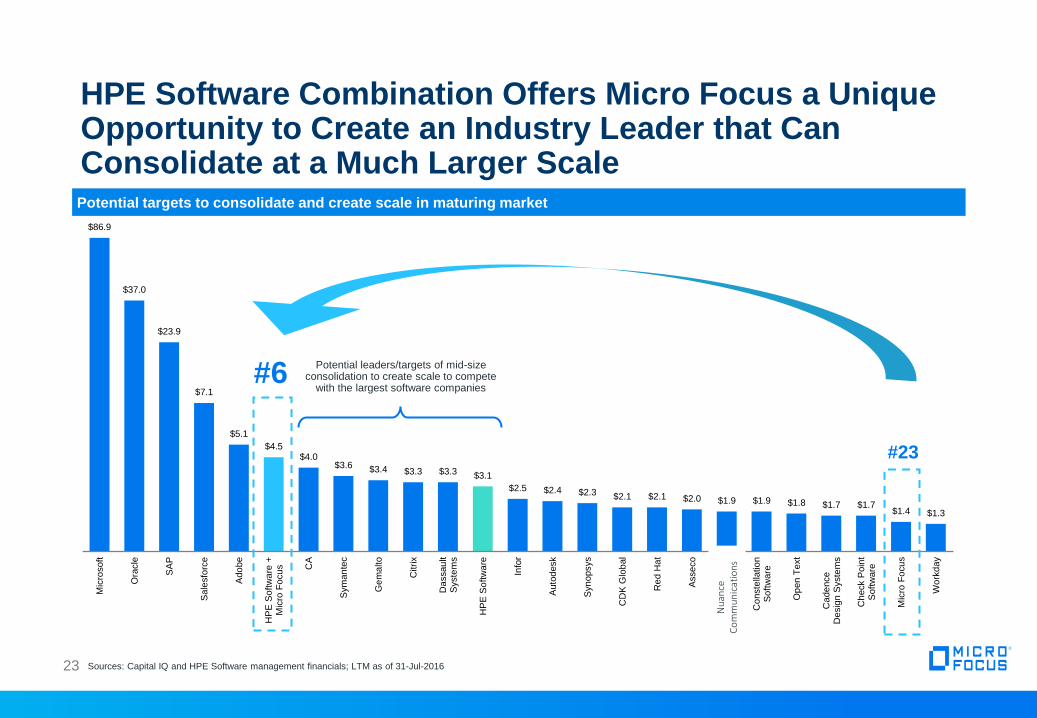
HPE Software Combination Offers Micro Focus a Unique Opportunity to Create an Industry Leader that Can Consolidate at a Much Larger Scale
23
Sources: Capital IQ and HPE Software management financials; LTM as of 31-Jul-2016 23
$86.9
$37.0
$23.9
$7.1
$5.1
$4.5 $4.0
$3.6 $3.4 $3.3 $3.3 $3.1
$2.5 $2.4 $2.3 $2.1 $2.1 $2.0 $1.9 $1.9 $1.8 $1.7 $1.7 $1.4 $1.3
Mic
rosoft
Ora
cle
SA
P
Sale
sfo
rce
Ado
be
HP
E S
oftw
are
+M
icro
Fo
cu
s CA
Sym
an
tec
Ge
ma
lto
Citri
x
Da
ssau
ltS
yste
ms
HP
E S
oftw
are
Info
r
Auto
desk
Syn
opsys
CD
K G
lob
al
Re
d H
at
Asse
co
Nu
an
ce
Co
mm
un
icatio
ns
Co
nste
llatio
nS
oft
ware
Op
en
Text
Ca
de
nce
De
sig
n S
yste
ms
Ch
eck P
oin
tS
oft
ware
Mic
ro F
ocu
s
Wo
rkd
ay
#6
#23
Potential leaders/targets of mid-size consolidation to create scale to compete
with the largest software companies
Nu
ance
C
om
mu
nic
atio
ns
Potential targets to consolidate and create scale in maturing market

24
Merger Rationale
• Adds additional breadth and scale to Micro Focus’ existing portfolio of sticky products in core
areas, with strong cash flows
• Increased exposure to fast growing segments through HPE Software’s security and big data
products
• Integration of functions and rationalisation provide scope for cost savings
• Leverage Micro Focus’ management’s experience from previous transactions and in-house cost
rationalization exercises
• Appropriate categorisation of products within the four box model to identify spending priorities
• Effective, targeted spending to grow revenues in areas with market potential
• Extend the life and productivity of products in areas of systematic decline or with limited
potential for top line growth
Extend Market
Presence
Increased Operational
Efficiency
Deliver Effective
Product Management
and Improve Sales
Productivity
Focus on EBITDA and FCF growth
Focus on Total Shareholder Returns
Maintain a stable platform to deliver results
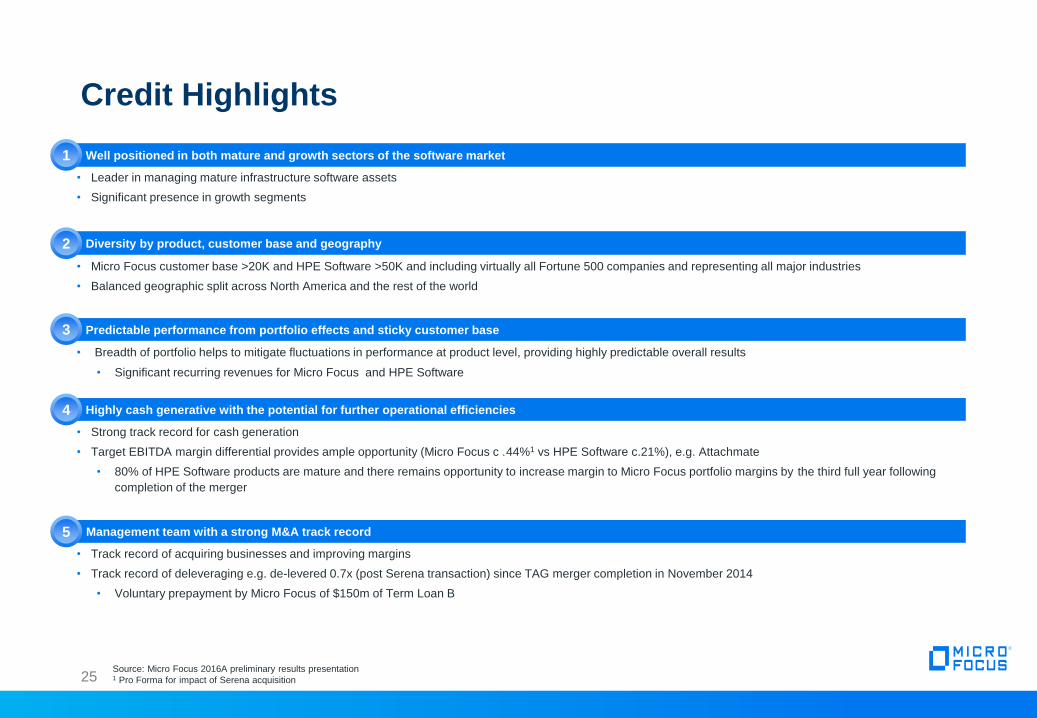
Credit Highlights
25
Well positioned in both mature and growth sectors of the software market
• Leader in managing mature infrastructure software assets
• Significant presence in growth segments
Highly cash generative with the potential for further operational efficiencies
• Strong track record for cash generation
• Target EBITDA margin differential provides ample opportunity (Micro Focus c .44%1 vs HPE Software c.21%), e.g. Attachmate
• 80% of HPE Software products are mature and there remains opportunity to increase margin to Micro Focus portfolio margins by the third full year following
completion of the merger
Diversity by product, customer base and geography
• Micro Focus customer base >20K and HPE Software >50K and including virtually all Fortune 500 companies and representing all major industries
• Balanced geographic split across North America and the rest of the world
Predictable performance from portfolio effects and sticky customer base
• Breadth of portfolio helps to mitigate fluctuations in performance at product level, providing highly predictable overall results
• Significant recurring revenues for Micro Focus and HPE Software
Management team with a strong M&A track record
• Track record of acquiring businesses and improving margins
• Track record of deleveraging e.g. de-levered 0.7x (post Serena transaction) since TAG merger completion in November 2014
• Voluntary prepayment by Micro Focus of $150m of Term Loan B
2 1
2 2
2 3
2 4
2 5
Source: Micro Focus 2016A preliminary results presentation 1 Pro Forma for impact of Serena acquisition

HPE Software Assets Overview
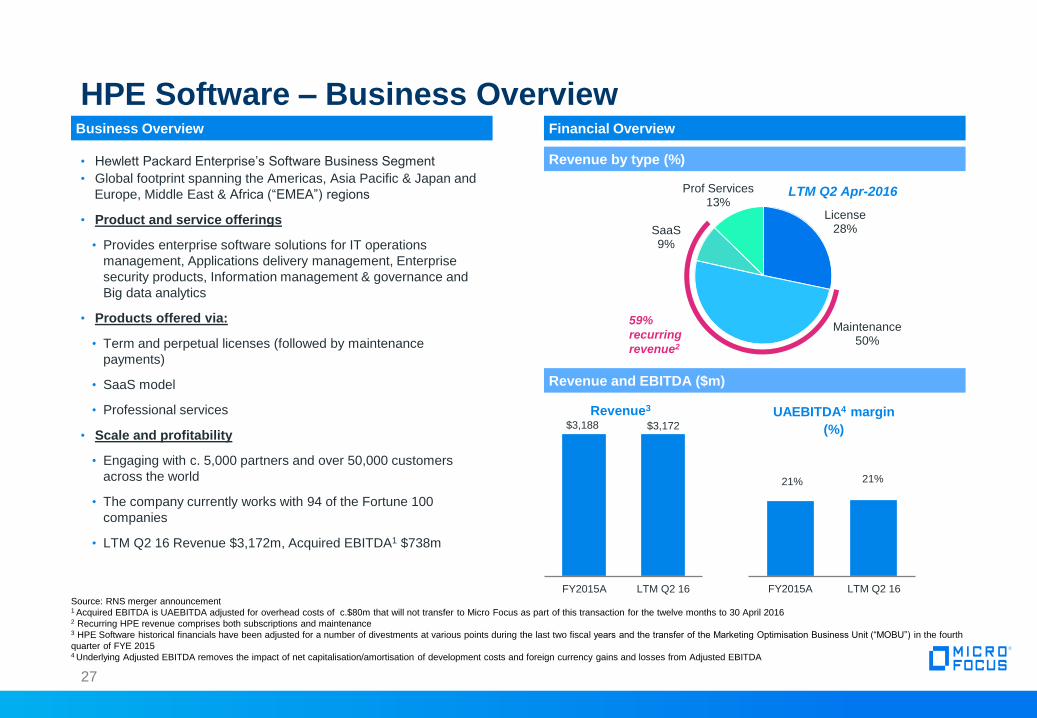
Business Overview
• Hewlett Packard Enterprise’s Software Business Segment
• Global footprint spanning the Americas, Asia Pacific & Japan and
Europe, Middle East & Africa (“EMEA”) regions
• Product and service offerings
• Provides enterprise software solutions for IT operations
management, Applications delivery management, Enterprise
security products, Information management & governance and
Big data analytics
• Products offered via:
• Term and perpetual licenses (followed by maintenance
payments)
• SaaS model
• Professional services
• Scale and profitability
• Engaging with c. 5,000 partners and over 50,000 customers
across the world
• The company currently works with 94 of the Fortune 100
companies
• LTM Q2 16 Revenue $3,172m, Acquired EBITDA1 $738m
$3,188 $3,172
FY2015A LTM Q2 16
Revenue3
21% 21%
FY2015A LTM Q2 16
UAEBITDA4 margin
(%)
License 28%
Maintenance 50%
SaaS 9%
Prof Services 13%
Source: RNS merger announcement 1 Acquired EBITDA is UAEBITDA adjusted for overhead costs of c.$80m that will not transfer to Micro Focus as part of this transaction for the twelve months to 30 April 2016 2 Recurring HPE revenue comprises both subscriptions and maintenance 3 HPE Software historical financials have been adjusted for a number of divestments at various points during the last two fiscal years and the transfer of the Marketing Optimisation Business Unit (“MOBU”) in the fourth
quarter of FYE 2015 4 Underlying Adjusted EBITDA removes the impact of net capitalisation/amortisation of development costs and foreign currency gains and losses from Adjusted EBITDA
27
HPE Software – Business Overview
Revenue and EBITDA ($m)
Financial Overview
LTM Q2 Apr-2016
59%
recurring
revenue2
Revenue by type (%)

IT operations management Application delivery
management (ADM)
Enterprise security
products (ESP)
Information management &
governance (IM&G) Big data analytics
Description
• Facilitating
management,
automation and
optimisation of data
centers and cloud
infrastructure
• Quality and lifecycle
tools for traditional and
DevOps application
development models
• Enabling enterprises to
protect interactions
among users, apps and
data across locations
and devices
• Key offerings include
threat identification,
digital asset protection,
data security and
application hardening
• Helping customers
manage, govern, store
and secure their
information
• Solutions: data
protection, archiving &
e-Discovery, and
content management
• Providing platforms that
help customers harness
their data and identify
new opportunities
• Platforms: next-
generation enterprise
search and data
analytics (IDOL) and
columnar database
(Vertica)
Select
Product
portfolio
28
HPE Software Product Portfolio
HPE Software – Product Portfolio
Digital Safe
Data Protector AppPulse
Cloud Orchestration
Service Anywhere
Data Center Automation
ALM IDOL
Financial Impact & Integration

Micro Focus – Standalone Historical Financials
30
Historical financials (Pro Forma for Serena acquisition, $m)
Source: Micro Focus company filings
Note: Financials pro forma for acquisition of Serena in May 2016; Underlying Adjusted EBITDA removes the impact of net capitalisation/amortisation of development costs and foreign currency gains and losses from
Adjusted EBITDA
FY Apr-16 FY Apr-15 FY Apr-14
Licence Revenue 336 367 401
Maintenance Revenue 763 849 877
Subscriptions 249 216 182
Consultancy 60 67 112
Total Reported Revenue 1,408 1,500 1,572
% growth (6.1%) (4.6%) –
Underlying Adjusted EBITDA 613 592 586

Micro Focus Pro Forma Revenue
(FYE April, IFRS)
HPE Software Pro Forma Revenue
(FYE October, US GAAP)
~$4.5bn Combined Revenue
• Note: Actual Currency, Pro Forma (i.e. adjusted for a number
of divestments at various points during the last two fiscal
years and the transfer of the Marketing Optimisation Business
Unit (“MOBU”) in the fourth quarter of FYE 2015)
• Accounting Standard: US GAAP
• FYE 31-October
• This represents the Micro
Focus IFRS revenues
added to the HPE Software
revenues adjusted for
divestitures and MOBU for
the twelve months to 30
April 2016
• IFRS treatment of the US
GAAP financial statements
are likely to produce a
difference from this
calculation
• Note: Actual currency, Pro Forma1
• Accounting Standard: IFRS
• FYE 30-April
$1,572 $1,500 $1,408
401 367 336
877 849 763
182 216 249
112 67 60
FY14 FY15 FY16
License Maintenance
Subscriptions Consulting
$3,391 $3,188 $3,172
1,014 896 896
1,679 1,628 1,596
266 265 277
432 399 403
FY14 FY15 LTM Q2 16
License Maintenance
SaaS Professional Services
Revenue ($m) Revenue ($m)
31
Revenues: Micro Focus (IFRS) and HPE Software (US GAAP)
1 Pro Forma for acquisitions of the Attachmate Group and Serena acquisition

688 657 658
80
738
FY14A FY15A LTM Q2 16
586 592 613
FY14A FY15A FY16A
Micro Focus Pro Forma UAEBITDA
(FYE 30 April, IFRS)
HPE Software Pro Forma UAEBITDA1
(FYE 31 October, US GAAP)
~$1.35bn Combined
UAEBITDA
• This represents the Micro
Focus IFRS EBITDA added
to the US GAAP EBITDA for
the twelve months to April
30th 2016
• The IFRS treatment of the
US GAAP financial
statements are likely to
produce a difference from
this calculation
• Note: Actual Currency, Pro Forma2
• Accounting Standard: IFRS
• FYE 30-April
Underlying Adj. EBITDA ($m) EBITDA ($m)
1 Included in the LTM Q2 2016 HPE Software illustrative constant perimeter EBITDA is approximately US$80m in overhead costs that will not transfer as part of the sale transaction 2 Pro Forma for acquisitions of the Attachmate Group and Serena acquisition
32
EBITDA: Micro Focus (IFRS) and HPE Software (US GAAP)
Costs not transferring
• Note: Actual Currency, Pro Forma (i.e. adjusted for a number of
divestments at various points during the last two fiscal years
and the transfer of the Marketing Optimisation Business Unit
(“MOBU”) in the fourth quarter of FYE 2015)
• Accounting Standard: US GAAP
• FYE 31-October

Strong Cash Flow Profile
Micro Focus Cash Flow From Operations1 (FYE 30 April) HPE Software Cash Flow From Operations1 (FYE 31 October)
Note: Cash flow information for HPE Software on an as-reported basis. Hence cash flows include contributions – both negative and positive – from disposals. To this regard, the year-on-year changes do not reflect
changes in performance of ongoing operations 1 Cash Flows on an as-reported basis, HPE Software accounts are prepared under US GAAP and Micro Focus’ under IFRS
$207m
$289m
$456m
FY14A FY15A FY16A
$860m
$990m
$648m
FY13A FY14A FY15A
Cash from Operations Cash from Operations
33
Complementary and strong operational cash flow profiles
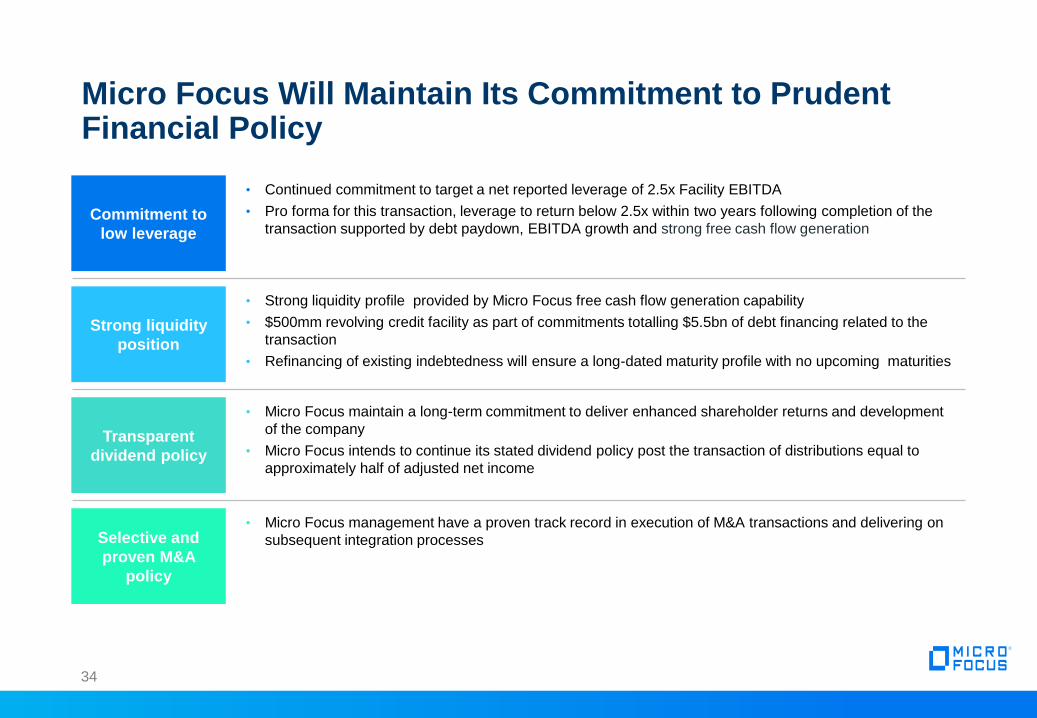
Micro Focus Will Maintain Its Commitment to Prudent Financial Policy
34
Commitment to
low leverage
• Continued commitment to target a net reported leverage of 2.5x Facility EBITDA
• Pro forma for this transaction, leverage to return below 2.5x within two years following completion of the
transaction supported by debt paydown, EBITDA growth and strong free cash flow generation
Strong liquidity
position
• Strong liquidity profile provided by Micro Focus free cash flow generation capability
• $500mm revolving credit facility as part of commitments totalling $5.5bn of debt financing related to the
transaction
• Refinancing of existing indebtedness will ensure a long-dated maturity profile with no upcoming maturities
Transparent
dividend policy
• Micro Focus maintain a long-term commitment to deliver enhanced shareholder returns and development
of the company
• Micro Focus intends to continue its stated dividend policy post the transaction of distributions equal to
approximately half of adjusted net income
Selective and
proven M&A
policy
• Micro Focus management have a proven track record in execution of M&A transactions and delivering on
subsequent integration processes

Micro Focus Approach to Acquisition Integration
• HPE and Micro Focus have formed a separation committee to
monitor and oversee the separation of HPE Software in accordance
with the Transaction documents
• Micro Focus has integrated many business over the last five years
and takes a structured approach to post acquisition integration, which
includes:
• Minimise day 1 changes – we will ensure changes are well
planned – key integration planning over the first 90 days post
Completion1
• Multiple work streams to plan and then manage changes, and
deliver to integration objectives:
• Identify, leverage and embed best practice
• Decide where teams fit, and the shape of the organisation
• Identify and validate synergy opportunities
• Decide system changes and timelines
• Implement system and process cutovers
• Transition people related changes, including benefits
• Identify, leverage and embed best practice
• Minimise Go To Market disruption
1 Accelerate if pre-close integration planning possible, once regulatory approvals have been given
35

A Phased Approach to Delivery and Setting Market Expectations
36
Phase I: Assessment
• Deliver plans for FY17
• Detailed review of
combined businesses
• Invigorate Product
Management
Ac
tio
ns
Phase II: Integration
Ac
tio
ns
• Standardise systems
• Rationalise Properties
• Rationalise Legal entities
• New Go to Market (GTM)
model
• Maintain/improve cash
conversion
• Rationalise
underperforming elements
• New market initiatives
Phase III: Stabilisation
• Stabilise top line
• Improve GTM productivity
• Growth from new areas
• Improved profitability
• Standardise systems A
cti
on
s
Phase IV: Growth
• Top line growth
• Click and repeat!
Ac
tio
ns
FY17 FY18 FY19 FY20

Credit Highlights
37
Well positioned in both mature and growth sectors of the software market
• Leader in managing mature infrastructure software assets
• Significant presence in growth segments
Highly cash generative with the potential for further operational efficiencies
• Strong track record for cash generation
• Target EBITDA margin differential provides ample opportunity (Micro Focus c .44%1 vs HPE Software c.21%), e.g. Attachmate
• 80% of HPE Software products are mature and there remains opportunity to increase margin to Micro Focus portfolio margins by the third full year following
completion of the merger
Diversity by product, customer base and geography
• Micro Focus customer base >20K and HPE Software >50K and including virtually all Fortune 500 companies and representing all major industries
• Balanced geographic split across North America and the rest of the world
Predictable performance from portfolio effects and sticky customer base
• Breadth of portfolio helps to mitigate fluctuations in performance at product level, providing highly predictable overall results
• Significant recurring revenues for Micro Focus and HPE Software
Management team with a strong M&A track record
• Track record of acquiring businesses and improving margins
• Track record of deleveraging e.g. de-levered 0.7x (post Serena transaction) since TAG merger completion in November 2014
• Voluntary prepayment by Micro Focus of $150m of Term Loan B
2 1
2 2
2 3
2 4
2 5
Source: Micro Focus 2016A preliminary results presentation 1 Pro Forma for impact of Serena acquisition

Appendix

Selected Financial Information on HPE Software
JPM – pls add financial schedules
For the fiscal years ended 31 October
LTM Q2 2016 2015 2014
US$m US$m US$m
Net Revenues as reported under SEC US GAAP Carveout rules
HPE Software Segment $3,412 $3,622 $3,933
Less:
MOBU Transfer (56) (163) (232)
Disposals in the period1 (184) (271) (310)
HPE Software revenue adjusted for divestitures and MOBU $3,172 $3,188 $3,391
Revenue growth rate adjusted for divestitures, MOBU and currency 1.5% (1.9)% N/A
Earnings before taxes as reported in SEC US GAAP Carveout rules 344 319 413
Add back interest – – –
Add back depreciation and amortisation of capitalised software 81 104 111
Add back amortisation of intangibles 186 224 248
HPE Software EBITDA 611 647 772
Add back separation costs 89 91 –
Add back restructuring charges 74 35 48
Add back stock based compensation 61 59 60
Add back acquisition related charges 2 5 10
HPE Software Underlying Adjusted EBITDA2 837 837 890
Less:
MOBU Transfer (13) (33) (48)
Disposals in the period* (166) (147) (154)
HPE Software underlying adjusted EBITDA further adjusted for divestitures and MOBU3 $658 $657 $688
Note: LTM Q2 2016 refers to the trailing twelve months for the period 1 May 2015 through 30 April 2016 1 Disposals of Tipping Point, iManage, Live Vault, HPPA Teleform. Amounts shown for these divestitures are management's best estimate of the amount of revenue and EBITDA generated by these divested
businesses during the periods presented, adjusted for management's estimate of overhead and other costs that did not exit HPE Software on divestment of these businesses 2 Micro Focus reports a metric referred to as “Facility EBITDA,” which is defined earlier in this document. HPE Software’s underlying adjusted EBITDA and Facility EBITDA as calculated result in the same figure 3 Included in the LTM Q2 2016 HPE Software illustrative EBITDA is approximately US$80m in overhead costs that will not transfer as part of the transaction
39

Micro Focus Strategy: Unchanged, Still Working Reiterated in July preliminary results for the twelve months ended 30 April 2016
Micro Focus helps bridge the old and the new by enabling you to:
• Exploit advances in technology such as virtualisation, cloud and mobile
without the cost and risk of starting again with the application suite
• Protect prior investments in your data and business logic whilst unlocking new
opportunities & use cases
• Optimize where you build, test and deploy business applications
• Execute with a balance of speed, flexibility and risk, that is right for your
business
Our execution needs to ensure we:
• Identify opportunities to exploit new models and market niches
• Focus on “sticky” products which are embedded within customers’ systems
and processes
• Develop product capabilities & services that encourage and promote use of
current product over the decision to move
• Acquire assets that add capabilities that incentivize customers to remain with
their current products, or add further similar types of product and customer
sets
• EBITDA and FCF growth
• Total shareholder return
• Stable platform delivering sustainable results
Industry Logic
Operational Approach
Operational Outputs
75
100
125
150
175
200
225
Sep-13 Mar-14 Sep-14 Mar-15 Sep-15 Mar-16 Sep-16
+118%
Regular Dividends
40
Shareholder Returns
Three year share price progression ($, rebased to 100)
Periodic Returns
of Value (“RoV”)
HPE Software acquisition consistent with stated strategy

Micro Focus COBOL Development and Mainframe solutions (CDMS)
41
• COBOL development (CD) products primarily target the off-mainframe
distributed development market
• The CD products enable programmers to develop and deploy applications
written in COBOL across multiple platforms including Windows, UNIX and
Linux and the cloud
• COBOL applications continue to be at the heart of the world’s business
transactions and to power the majority of large organizations’ key business
operations
• Visual COBOL is the key growth driver to enable migration of existing
COBOL applications to the cloud and mobile
• Mainframe Solutions (MS) allow customers the choice of where they develop,
test and deploy their business applications, either within the mainframe
environment or outside of it on distributed Windows, UNIX and Linux
machines
• Enables customers to re-use existing business logic and data, while also
looking to exploit new innovations in technology such as mobile and cloud
through enabling the re-deployment of enterprise mainframe applications
to distributed systems, virtualized mobile platforms, and the cloud
Description Market opportunities
Development Opportunities
Transforming the way that mainframe customers maintain and develop their
business applications
Mobile
Helping customers to adapt to the way their customers want to consume
their applications and services
Emerging markets
Removing the platform constraints associated with fit for purpose enterprise
applications
Cost containment
Enabling customers to align the cost of application service delivery with the
business value
Source: Company presentations
Historical revenues by half-year, CCY basis
67 69 71 71 72 73
53 62 48 58 40
65 3
4 4
4 4
5 $122 $135
$122 $134
$116
$143
HY1-14 HY2-14 HY1-15 HY2-15 HY1-16 HY2-16
Maintenance License Services
Y ear on year growth
Maintenance 6.0% 3.0% 1.6% 3.1%
License (10.0%) (6.4%) (16.0%) 11.0%
Services 56.0% 5.0% 2.6% 16.7%
T otal 0.1% (1.3%) (5.2%) 7.0%

Micro Focus Identity, Access and Security Solutions (IAS)
42
Description Benefits
• Protect sensitive data and intellectual property
• Ensure compliance with regulatory and audit requirements
• Manage the identity of everything
• Reduce the risk of a breach and rapidly respond to attacks
• Protect the connections between systems as well as the data
• Manage business risk through better governance
• Manage privileged user activity, especially with sensitive data
• Deliver the right access to the right people, faster
• Implement adaptive authentication depending on business needs
• Identity and Access Management products enable simple, secure access by
using integrated identity information to create, modify, and retire identities and
control their access to enterprise, cloud and mobile resources
• Key features include identity management, access management, single sign-
on, access governance, identity tracking and active directory administration
• Virtualisation, cloud development and increased compliance / regulation aid
segment growth
Source: Company presentations
Historical revenues by half-year, CCY basis
71 75 74 73 71 72
20 29 23 20 20 32
14 14 13 14 12
10
$105 $118 $110 $108 $103
$114
HY1-14 HY2-14 HY1-15 HY2-15 HY1-16 HY2-16
Maintenance License Services
Y ear on year growth
Maintenance 5.0% (3.2%) (5.0%) (1.5%)
License 13.5% (30.4%) (10.1%) 56.9%
Services (8.3%) 6.7% (11.4%) (27.8%)
T otal 4.8% (8.8%) (6.8%) 6.0%

Micro Focus Host Connectivity Solutions
43
• The Host Connectivity product set is the combination of the Attachmate
products from TAG and the Micro Focus Rumba products
• Enable IT organizations using centralized applications to provide business-
critical information to the end-user of the system while modernizing the
functionality and access to the information which can be held across a broad
array of new and legacy systems
• Core products deliver graphical user interfaces (GUI) for legacy
applications
• The customer value proposition centers on user productivity; and the ability to
extend modern and secure user access to legacy systems on the mobile
device technologies that continue to emerge
Description Market opportunities
Security and Regulatory Compliance
Continue to invest in security technologies that enable enterprises to protect
host data and adhere to regulatory mandates
Navigate Evolution of Desktop Platform
Support continuous evolution of desktop with certification for Windows 10,
Citrix, VMware, DaaS, cloud, containers
Mobility
Enable users to leverage modern devices to productively interact with host
applications from anywhere
Centrally Manage and Secure Host Assets
Centrally administer desktop host access and configurations to gain central
control of terminal emulation clients
Source: Company presentations
Historical revenues by half-year, CCY basis
55 54 55 51 54 51
39 45 27
68 49 41
3 2
2
2 1
2
$97 $101
$83
$121 $104
$94
HY1-14 HY2-14 HY1-15 HY2-15 HY1-16 HY2-16
Maintenance License Services
Y ear on year growth
Maintenance (0.9%) (4.6%) (0.6%) (0.2%)
License (31.6%) 49.1% 80.3% (38.8%)
Services (40.0%) 0.0% (33.3%) (22.7%)
T otal (14.5%) 19.5% 24.9% (22.2%)
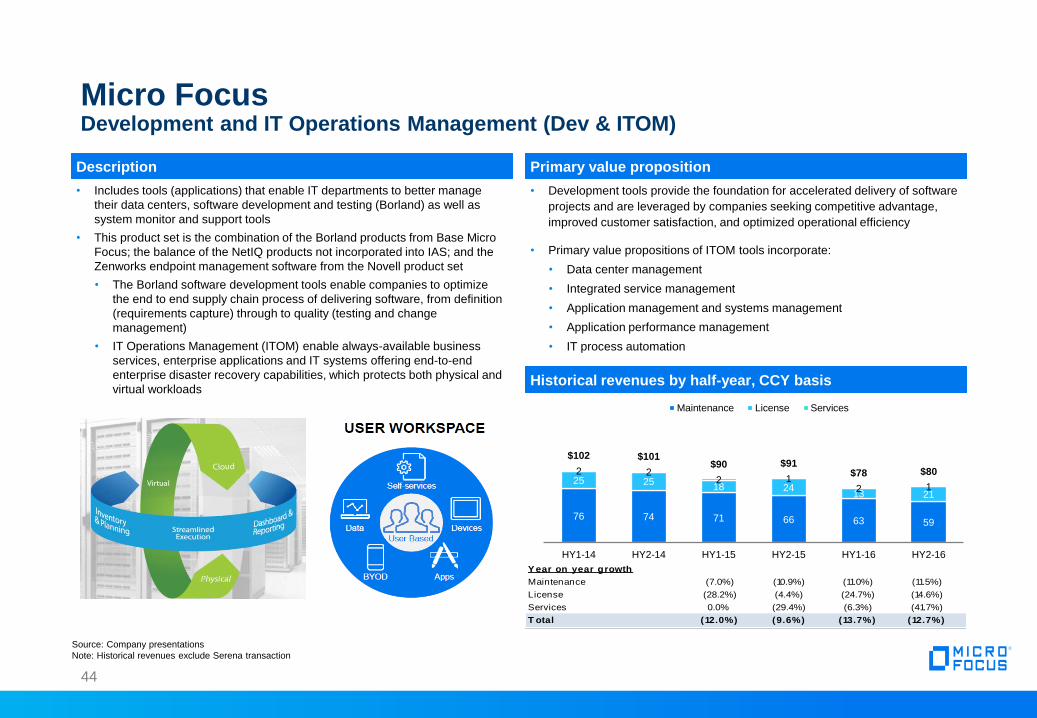
Micro Focus Development and IT Operations Management (Dev & ITOM)
44
• Includes tools (applications) that enable IT departments to better manage
their data centers, software development and testing (Borland) as well as
system monitor and support tools
• This product set is the combination of the Borland products from Base Micro
Focus; the balance of the NetIQ products not incorporated into IAS; and the
Zenworks endpoint management software from the Novell product set
• The Borland software development tools enable companies to optimize
the end to end supply chain process of delivering software, from definition
(requirements capture) through to quality (testing and change
management)
• IT Operations Management (ITOM) enable always-available business
services, enterprise applications and IT systems offering end-to-end
enterprise disaster recovery capabilities, which protects both physical and
virtual workloads
Description
• Development tools provide the foundation for accelerated delivery of software
projects and are leveraged by companies seeking competitive advantage,
improved customer satisfaction, and optimized operational efficiency
• Primary value propositions of ITOM tools incorporate:
• Data center management
• Integrated service management
• Application management and systems management
• Application performance management
• IT process automation
Primary value proposition
Source: Company presentations
Note: Historical revenues exclude Serena transaction
Historical revenues by half-year, CCY basis
76 74 71 66 63 59
25 25 18 24
13 21
2 2 2 1
2 1
$102 $101 $90 $91
$78 $80
HY1-14 HY2-14 HY1-15 HY2-15 HY1-16 HY2-16
Maintenance License Services
Y ear on year growth
Maintenance (7.0%) (10.9%) (11.0%) (11.5%)
License (28.2%) (4.4%) (24.7%) (14.6%)
Services 0.0% (29.4%) (6.3%) (41.7%)
T otal (12.0%) (9.6%) (13.7%) (12.7%)
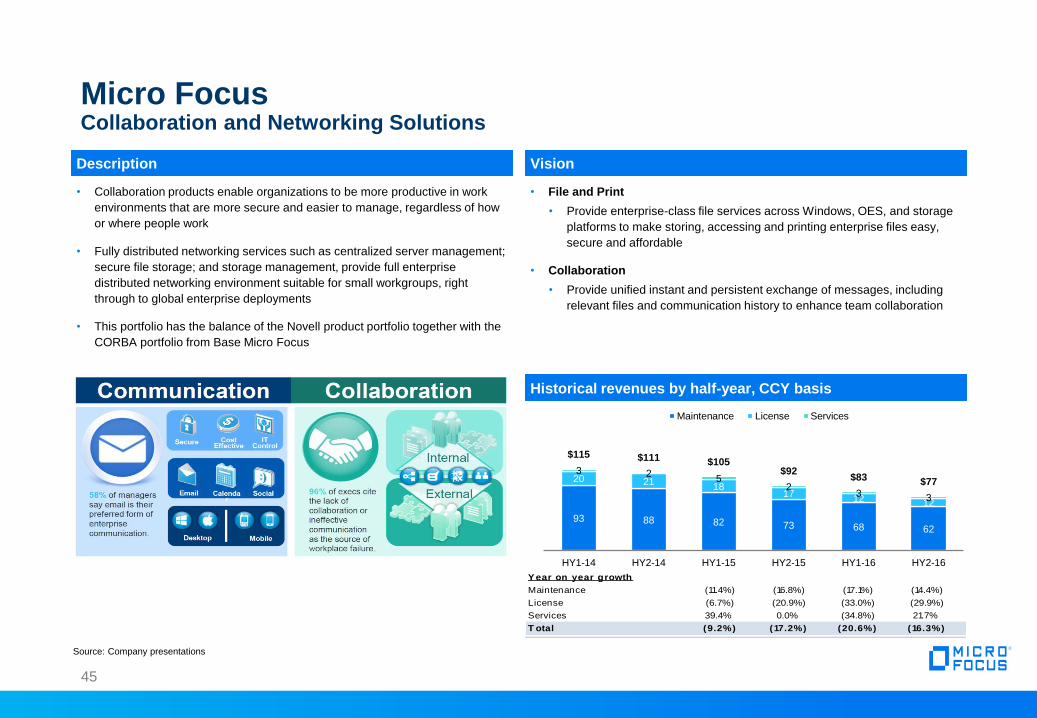
Micro Focus Collaboration and Networking Solutions
45
• Collaboration products enable organizations to be more productive in work
environments that are more secure and easier to manage, regardless of how
or where people work
• Fully distributed networking services such as centralized server management;
secure file storage; and storage management, provide full enterprise
distributed networking environment suitable for small workgroups, right
through to global enterprise deployments
• This portfolio has the balance of the Novell product portfolio together with the
CORBA portfolio from Base Micro Focus
Description
• File and Print
• Provide enterprise-class file services across Windows, OES, and storage
platforms to make storing, accessing and printing enterprise files easy,
secure and affordable
• Collaboration
• Provide unified instant and persistent exchange of messages, including
relevant files and communication history to enhance team collaboration
Vision
Historical revenues by half-year, CCY basis
Source: Company presentations
93 88 82 73 68 62
20 21 18
17 12 12
3 2 5
2 3 3
$115 $111 $105 $92
$83 $77
HY1-14 HY2-14 HY1-15 HY2-15 HY1-16 HY2-16
Maintenance License Services
Y ear on year growth
Maintenance (11.4%) (16.8%) (17.1%) (14.4%)
License (6.7%) (20.9%) (33.0%) (29.9%)
Services 39.4% 0.0% (34.8%) 21.7%
T otal (9.2%) (17.2%) (20.6%) (16.3%)
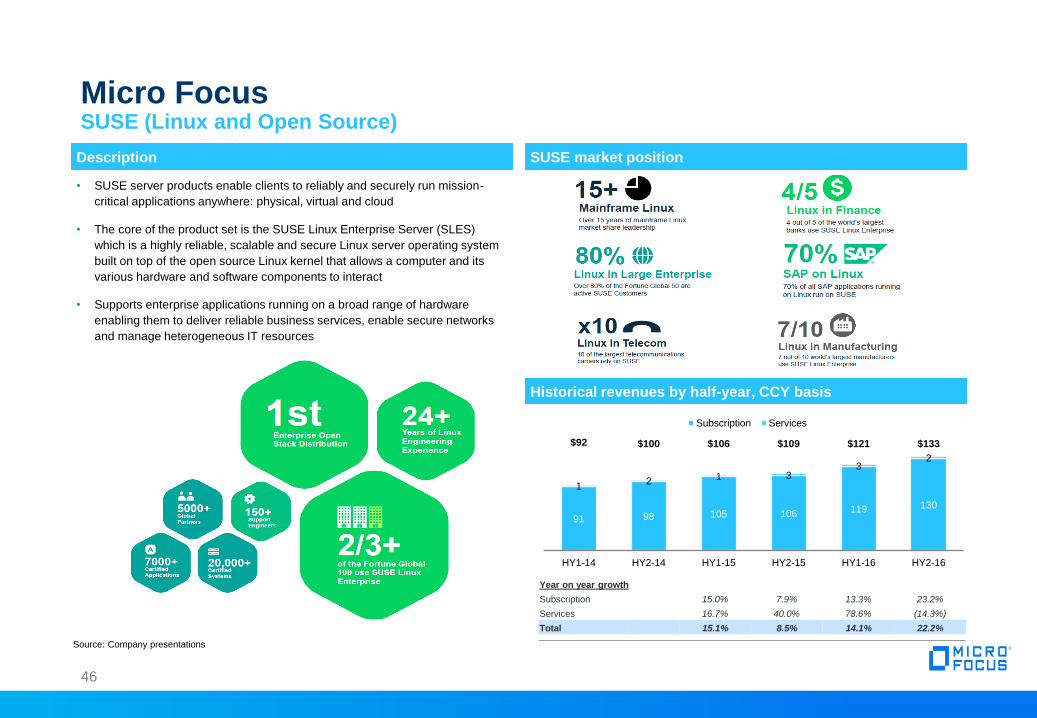
Micro Focus SUSE (Linux and Open Source)
46
• SUSE server products enable clients to reliably and securely run mission-
critical applications anywhere: physical, virtual and cloud
• The core of the product set is the SUSE Linux Enterprise Server (SLES)
which is a highly reliable, scalable and secure Linux server operating system
built on top of the open source Linux kernel that allows a computer and its
various hardware and software components to interact
• Supports enterprise applications running on a broad range of hardware
enabling them to deliver reliable business services, enable secure networks
and manage heterogeneous IT resources
Description SUSE market position
Historical revenues by half-year, CCY basis
Source: Company presentations
$92 $100 $106 $109 $121 $133
91 98 105 106 119 130
1 2 1 3
3 2
HY1-14 HY2-14 HY1-15 HY2-15 HY1-16 HY2-16
Subscription Services
Year on year growth
Subscription 15.0% 7.9% 13.3% 23.2%
Services 16.7% 40.0% 78.6% (14.3%)
Total 15.1% 8.5% 14.1% 22.2%
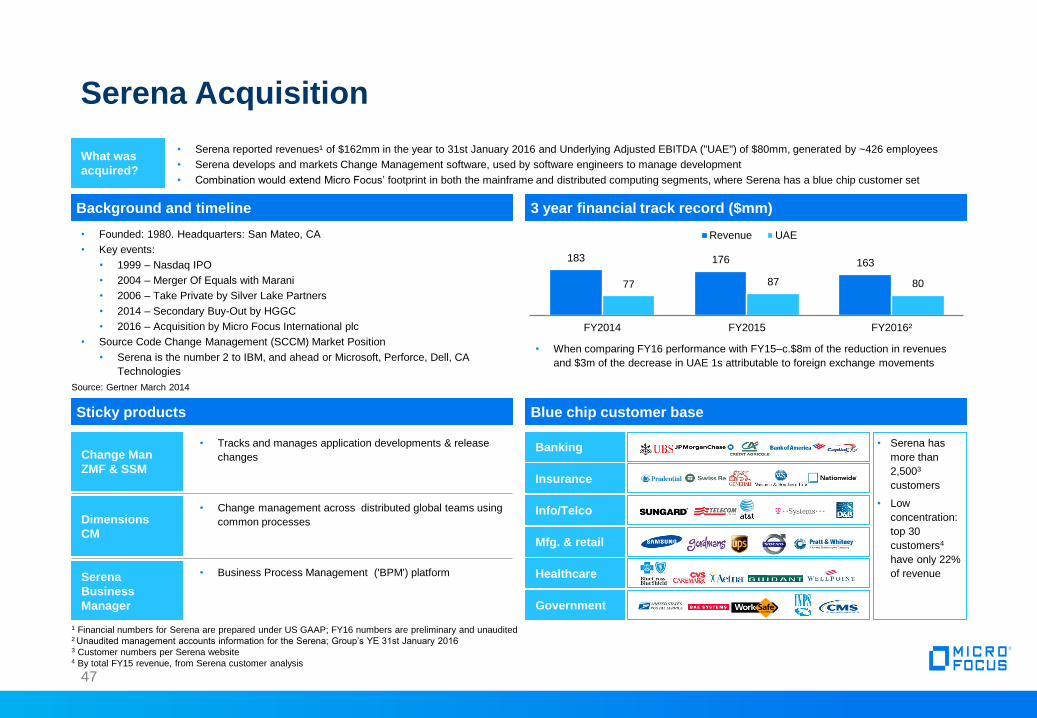
Serena Acquisition
47
What was
acquired?
• Serena reported revenues¹ of $162mm in the year to 31st January 2016 and Underlying Adjusted EBITDA ("UAE") of $80mm, generated by ~426 employees
• Serena develops and markets Change Management software, used by software engineers to manage development
• Combination would extend Micro Focus’ footprint in both the mainframe and distributed computing segments, where Serena has a blue chip customer set
• Founded: 1980. Headquarters: San Mateo, CA
• Key events:
• 1999 – Nasdaq IPO
• 2004 – Merger Of Equals with Marani
• 2006 – Take Private by Silver Lake Partners
• 2014 – Secondary Buy-Out by HGGC
• 2016 – Acquisition by Micro Focus International plc
• Source Code Change Management (SCCM) Market Position
• Serena is the number 2 to IBM, and ahead or Microsoft, Perforce, Dell, CA
Technologies
Background and timeline 3 year financial track record ($mm)
183 176 163
77 87 80
FY2014 FY2015 FY2016²
Revenue UAE
• When comparing FY16 performance with FY15–c.$8m of the reduction in revenues
and $3m of the decrease in UAE 1s attributable to foreign exchange movements
Source: Gertner March 2014
• Tracks and manages application developments & release
changes Change Man
ZMF & SSM
• Change management across distributed global teams using
common processes Dimensions
CM
• Business Process Management ('BPM') platform Serena
Business
Manager
Sticky products Blue chip customer base
Banking
Insurance
Info/Telco
Mfg. & retail
Healthcare
Government
• Serena has
more than
2,5003
customers
• Low
concentration:
top 30
customers4
have only 22%
of revenue
1 Financial numbers for Serena are prepared under US GAAP; FY16 numbers are preliminary and unaudited 2 Unaudited management accounts information for the Serena; Group’s YE 31st January 2016 3 Customer numbers per Serena website 4 By total FY15 revenue, from Serena customer analysis

Serena Product Summary Portfolio of mature infrastructure software products
48
LTM Dec 15
Revenue
Makret
Products
Mainframe
ALM/SCCM¹
Distributed
ALM/SCCM Distributed BPM
Mainframe Other
and SaaS
Serena
Total
57 53 37 15 162
Governance of
software
development
lifecycle
Governance of
software
development
lifecycle
Business process
optimization N/A
Change Man ZMF
Dimensions CM,
Release
Management, PVCS
Serena Business
Manager Comparex, Startool
4% (10)% (11)% (7)% (6)%
Revenue ($mm)
Growth²
Primary Market
Description
Key Competitors
Market Rank Top 2 Top 10 N/A
IBM,
CA, Compuwar
IBM, Microsoft
Perforce
IBM, Oracle,
Progress SW N/A
Key Products
1 ALM = Application Lifecycle Management; SCCM = Source Code Change Management 2 Product growth is 2yr CAGR FY14-LTM Dec 15. Market rank and competitor data provided by Gartner 2013

www.microfocus.com
Disclaimer
NOT FOR RELEASE, PUBLICATION OR DISTRIBUTION, IN WHOLE OR IN PART, IN, INTO OR FROM ANY JURISDICTION WHERE TO DO SO WOULD CONSTITUTE A VIOLATION OF THE RELEVANT
LAWS OR REGULATIONS OF SUCH JURISDICTION.
This presentation does not constitute or form part of any offer or invitation to sell or issue, or any solicitation of any offer to purchase or subscribe for, any securities, or any solicitation of any vote or approval. It
does not constitute a prospectus or a prospectus "equivalent" document.
ADDITIONAL INFORMATION AND WHERE TO FIND IT
This presentation has been prepared and issued by and is the sole responsibility of Micro Focus International PLC (the "Company"). This presentation relates to the Company and its conditional agreement to
acquire the software business of Hewlett Packard Enterprise Co. (“HPE") to be held by HPE Software Spinco, Inc. ("HPE Software"), a wholly owned subsidiary of HPE, constituting a reverse takeover for the
purposes of the Listing Rules of the UKLA (the "Acquisition" or the "Transaction"). The Transaction will be submitted to the Company’s shareholders for their consideration and approval. In connection with the
Transaction, the Company will file relevant materials with the SEC, including a registration statement on Form F-4 or S-4 containing a prospectus relating to the Company’s American Depositary Shares to be
issued in connection with the Transaction, and HPE Software will file a registration statement with the SEC. The Company will mail the prospectus contained in the Form F-4 or S-4 to HPE’s stockholders. This
presentation is not a substitute for the registration statements or other document(s) that the Company and/or HPE Software may file with the SEC in connection with the Transaction. INVESTORS ARE URGED TO
READ THE REGISTRATION STATEMENTS AND OTHER DOCUMENTS FILED WITH THE SEC WHEN THEY BECOME AVAILABLE BECAUSE THEY WILL CONTAIN IMPORTANT INFORMATION ABOUT
THE PARTIES, AND THE TRANSACTION. Shareholders will be able to obtain copies of these documents (when they are available) and other documents filed with the SEC with respect to the Company free of
charge from the SEC’s website at www.sec.gov. These documents (when they are available) can also be obtained free of charge from the Company upon written request to the Company’s investor relations or
HPE’s investor relations.
For the purposes of this notice, "presentation" means this document, any oral presentation, any question and answer session and any written or oral material discussed or distributed during the presentation
meeting or while access to the presentation has been made available to you.
This presentation has not been approved by the UK Financial Conduct Authority ("FCA") or any other regulator. This presentation is for information purposes only. The material and information herein is not to be
shared with any other parties.
Neither this presentation, nor any part of it nor the fact of its availability or distribution is investment or financial product advice and nor is it intended to be used as the basis for making an investment decision.
Neither the Company nor J.P. Morgan Limited ("J.P. Morgan Cazenove") nor Numis Securities Limited ("Numis") makes any representation to any recipient regarding an investment in the securities referred to in
this presentation. This presentation has been prepared without taking into account the investment objectives, financial situation or particular needs of any particular person. You should seek your own legal,
investment and tax advice as you see fit and you should not act upon any information contained in this presentation without first consulting a financial or other professional adviser.
This presentation must not be recorded, copied, reproduced, published, distributed, disclosed, stored in a retrieval system, transmitted or passed on, directly or indirectly, in whole or in part, or disclosed by any
recipient, to any other person (whether within or outside such person’s organisation or firm) at any time without the written consent of the Company.
The availability and distribution of this presentation in certain jurisdictions may be restricted by law. No action has been taken by the Company, J.P. Morgan Cazenove or Numis that would permit access to or
possession or distribution of this presentation or any other offering or publicity material relating to the Company in any jurisdiction where action for that purpose is required. Persons into whose possession this
presentation comes or who have accessed this presentation are required by the Company, J.P. Morgan Cazenove and Numis to inform themselves about, and to observe, such restrictions.
50

Disclaimer (Cont’d)
Neither this presentation nor the information contained herein constitutes or forms part of an offer to sell or the solicitation of an offer to buy securities in the United States. Securities may not be offered or sold in
the United States absent registration or an exemption from registration. The securities of the Company have not been and will not be registered under the US Securities Act of 1933, as amended (the "Securities
Act"), or under any securities laws of any state or other jurisdiction of the United States and may not be offered, sold or transferred, directly or indirectly, in or into the United States absent registration or pursuant to
an applicable exemption from, or in a transaction not subject to, the registration requirements of the Securities Act and in compliance with the securities laws of any state or other jurisdiction of the United States.
There will be no public offer of any securities in the United States or any other jurisdiction.
J.P. Morgan Cazenove, which is authorised and regulated in the United Kingdom by the FCA, is acting as financial adviser and sponsor to the Company and no-one else in connection with the Acquisition and will
not regard any other person as its client in relation to the Acquisition and is not, and will not be, responsible to anyone other than the Company for providing the protections afforded to its clients or for providing
advice in relation to the Acquisition and/or any other matter referred to in this presentation. Apart from the responsibilities and liabilities, if any, which may be imposed on J.P. Morgan Cazenove by FSMA (as
defined below), or the regulatory regime established thereunder, J.P. Morgan Cazenove accepts no responsibility or liability whatsoever and makes no representation or warranty, express or implied, in relation to
the contents of this presentation, including its accuracy, completeness or for any other statement made or purported to be made by it or on behalf of it, the Company, its directors or any other person in connection
with the Company, the Acquisition or any other matter in this presentation and nothing in this presentation shall be relied upon as a promise or representation in this respect, whether as to the past or the future.
J.P. Morgan Cazenove accordingly disclaims all and any liability whatsoever, whether arising out of tort, contract or otherwise (save as referred to above), which it might otherwise have in respect of this
presentation or any such statement.
Numis, which is authorised and regulated in the United Kingdom by the FCA, is acting as corporate broker and financial adviser to the Company and no-one else in connection with the Acquisition and will not
regard any other person as its client in relation to the Acquisition and is not, and will not be, responsible to anyone other than the Company for providing the protections afforded to its clients or for providing advice
in relation to the Acquisition and/or any other matter referred to in this presentation. Apart from the responsibilities and liabilities, if any, which may be imposed on Numis by FSMA (as defined below), or the
regulatory regime established thereunder, Numis accepts no responsibility or liability whatsoever and makes no representation or warranty, express or implied, in relation to the contents of this presentation,
including its accuracy, completeness or for any other statement made or purported to be made by it or on behalf of it, the Company, its directors or any other person in connection with the Company, the Acquisition
or any other matter in this presentation and nothing in this presentation shall be relied upon as a promise or representation in this respect, whether as to the past or the future. Numis accordingly disclaims all and
any liability whatsoever, whether arising out of tort, contract or otherwise (save as referred to above), which it might otherwise have in respect of this presentation or any such statement.
Information set forth in this announcement (including information incorporated by reference in this announcement), oral statements made regarding the Transaction, and other information published by Micro Focus
or HPE may contain certain statements about the Company, HPE and HPE Software that are “forward-looking statements” within the meaning of the U.S. Private Securities Litigation Reform Act of 1995. The
forward-looking statements contained in this presentation may include statements about the expected effects on the Company, HPE and HPE Software of the Transaction, the anticipated timing and benefits of the
Transaction, the Company’s and HPE Software’s anticipated standalone or combined financial results and all other statements in this document other than historical facts. Without limitation, any statements
preceded or followed by or that include the words “targets”, “plans”, “believes”, “expects”, “intends”, “will”, “likely”, “may”, “anticipates”, “estimates”, “projects”, “should”, “would”, “expect”, “positioned”, “strategy”,
“future” or words, phrases or terms of similar substance or the negative thereof, are forward-looking statements. These statements are based on the current expectations of the management of the Company, HPE
or HPE Software (as the case may be) and are subject to uncertainty and changes in circumstances and involve risks and uncertainties that could cause actual results to differ materially from those expressed or
implied in such forward-looking statements. As such, forward-looking statements should be construed in light of such factors. Neither Micro Focus nor HPE, nor any of their respective associates or directors,
officers or advisers, provides any representation, assurance or guarantee that the occurrence of the events expressed or implied in any forward-looking statements in this announcement will actually occur or that if
any of the events occur, that the effect on the operations or financial condition of Micro Focus, HPE or HPE Software will be as expressed or implied in such forward-looking statements. Forward-looking statements
contained in this presentation based on past trends or activities should not be taken as a representation that such trends or activities will necessarily continue in the future. In addition, these statements are based
on a number of assumptions that are subject to change. Such risks, uncertainties and assumptions include: the satisfaction of the conditions to the Transaction and other risks related to the completion of the
Transaction and actions related thereto; the Company’s and HPE’s ability to complete the Transaction on anticipated terms and schedule, including the ability to obtain shareholder or regulatory approvals of the
Transaction; risks relating to any unforeseen liabilities of the Company or HPE Software; future capital expenditures, expenses, revenues, earnings, synergies, economic performance, indebtedness, financial
condition, losses and future prospects of the Company, HPE Software and the resulting combined company; business and management strategies and the expansion and growth of the operations of the Company,
HPE Software and the resulting combined company; the ability to successfully combine the business of the Company and HPE Software and to realise expected operational improvement from the Transaction; the
effects of government regulation on the businesses of the Company, HPE Software or the combined company; the risk that disruptions from the Transaction will impact the Company’s or HPE Software’s business;
and the Company’s, HPE Software’s or HPE’s plans, objectives, expectations and intentions generally. Additional factors can be found under “Risk Factors” in HPE’s Annual Report on Form 10-K for the fiscal year
ended October 31, 2015 and subsequent Quarterly Reports on Form 10-Q. For a discussion of important factors which could cause actual results to differ from forward looking statements relating to Micro Focus,
refer to Micro Focus's Annual Report and Accounts 2016. Forward-looking statements included herein are made as of the date hereof, and none of the Company, HPE Software or HPE undertakes any obligation
to update publicly such statements to reflect subsequent events or circumstances.
51

Disclaimer (Cont’d)
Subject to any requirement under applicable law, Miami undertakes no obligation to update or revise any forward-looking statements, whether as a result of new information, future events or otherwise. Investors
should not place undue reliance on forward-looking statements, which speak only as of the date of this communication.
Except as otherwise explicitly stated, neither the content of the Miami website nor the Houston website, nor any other website accessible via hyperlinks on either such website, is incorporated into, or forms part of,
this communication.
The information contained within this presentation has not been independently verified by J.P. Morgan Cazenove or Numis. No reliance may be placed, for any purpose whatsoever, on the information or opinions
contained in this presentation nor on its completeness, accuracy or fairness and no representation or warranty, express or implied, is given by or on behalf of the Company, J.P. Morgan Cazenove or Numis or any
of their respective parent or subsidiary undertakings, or the subsidiary undertakings of any such parent undertakings, or any of their respective directors, officers, employees, agents, affiliates or advisers as to the
accuracy, completeness or fairness of the information or opinions contained in this presentation and to the extent permitted by law no responsibility or liability is assumed by any such persons for any such
information or opinions or for any errors or omissions. The projections contained herein should not be regarded as a representation or warranty, express or implied, by the Company, J.P. Morgan Cazenove or
Numis or any of their respective parent or subsidiary undertakings, or the subsidiary undertakings of any such parent undertakings or any of their respective directors, officers, employees, agents, affiliates or
advisers that the projected or estimated results will be achieved. To the maximum extent permitted by law, neither the Company, its directors, officers, shareholders, advisers, affiliates, employees or agents, nor
any other person accept any liability, including, without limitation, any liability arising out of fault or negligence for any loss arising from the use of the information contained in this presentation. Statements
contained in this presentation regarding past trends or activities should not be taken as a representation that such trends or activities will continue in the future. This presentation speaks as at the date on which it is
made. All information presented or contained in this presentation is subject to verification, correction, completion and change without notice. Neither the delivery of this presentation nor any further discussions by
the Company, J.P. Morgan Cazenove or Numis with any of the recipients thereof shall, under any circumstances, create any implication that there has been no change in the affairs of the Company and/or HPE
Software since that date and neither the Company nor J.P. Morgan Cazenove nor Numis undertakes any duty or assumes any obligation to update, revise publicly or correct this presentation whether as a result of
new information, future events or otherwise, except to the extent required by the FCA, the London Stock Exchange or by the Listing Rules, the Disclosure Guidance and Transparency Rules or by applicable law.
No statement in this presentation is, is intended to be, or should be construed as, a profit forecast or profit estimate for any period or to imply that the earnings of the Company for the current or future financial
years will necessarily match or exceed the historical or published earnings of the Company.
Certain market data information in this presentation is based on management’s estimates. The Company obtained the industry, market and competitive position data used throughout this presentation from internal
estimates and research as well as from industry publications and research, surveys and studies conducted by third parties. However, this information may prove to be inaccurate because of the method by which
the Company obtained some of the data for their estimates or because this information cannot always be verified due to the limits on the availability and reliability of raw data, the voluntary nature of the data
gathering process and other limitations and uncertainties. Where information contained in this presentation has been sourced from a third party (including HPE Software and/or HPE), the Company confirms that
such information has been accurately reproduced and, so far as the Company is aware and has been able to ascertain from that information, no facts have been omitted which would render the reproduced
information, or information derived from it, inaccurate or misleading. By attending this presentation or otherwise accessing this presentation you warrant, represent, acknowledge and agree to and with the
Company, J.P. Morgan Cazenove and Numis that (i) you are a Relevant Person as defined above, (ii) you have read, agree to and will comply with the contents of this disclaimer including, without limitation, the
obligation to keep this presentation and its contents confidential and (iii) you will not at any time have any discussion, correspondence or contact concerning the information in this presentation with any of the
directors or employees of the Company or with any of their suppliers in respect of the Company without the prior written consent of the Company.
52