MICRO ECONOMICS CHAPTER 1 INTRODUCTION TO ECONOMICS
58
Page 1 of 58 www.growthrateeconomicsinstitute.com MICRO-ECONOMICS CHAPTER-1 INTRODUCTION TO ECONOMICS C.B.S.E. QUESTIONS (2012) SET-1 1. Define microeconomics. (set1)1 2. Define production possibilities curve. Explain why it is downward sloping from left to right. (set1)3 SET-2 3. Define microeconomics. (set2)1 4. Explain the central problem of `how to produce’. (set2)3 SET-3 5. Define microeconomics? (set3)1 6. What is opportunity cost? Explain with the help of an example.(set3) 3 C.B.S.E. QUESTIONS (2011) SET-1 7. What is planned economy? (set1)1 8. How is production possibilities curve affected by unemployed in the economy? Explain (set1)3 SET-2 9. Define microeconomics. (set2)1 10. Explain how a production possibilities curve is affected when resource are inefficient employed in an economy. (set2)3 SET-3 11. What is a market economy? (set3)1 12. Why is a production possibilities curve concave? Explain.(set3) 3 KV-PRE-BOARD-1
Transcript of MICRO ECONOMICS CHAPTER 1 INTRODUCTION TO ECONOMICS
Page 1 of 58
www.growthrateeconomicsinstitute.com
MICRO-ECONOMICS
CHAPTER-1 INTRODUCTION TO ECONOMICS
C.B.S.E. QUESTIONS (2012)
SET-1
1. Define microeconomics. (set1)1
2. Define production possibilities curve. Explain why it is
downward sloping from left to right. (set1)3
SET-2
3. Define microeconomics. (set2)1
4. Explain the central problem of `how to produce’. (set2)3
SET-3
5. Define microeconomics? (set3)1
6. What is opportunity cost? Explain with the help of an example.(set3) 3
C.B.S.E. QUESTIONS (2011)
SET-1
7. What is planned economy? (set1)1
8. How is production possibilities curve affected by unemployed
in the economy? Explain (set1)3
SET-2
9. Define microeconomics. (set2)1
10. Explain how a production possibilities curve is affected when
resource are inefficient employed in an economy. (set2)3
SET-3
11. What is a market economy? (set3)1
12. Why is a production possibilities curve concave? Explain.(set3) 3
KV-PRE-BOARD-1

Page 2 of 58
www.growthrateeconomicsinstitute.com
13. How is an economic
problem , a choice-making.1
14. Explain “what to
produce” with the help of an example?3
C.B.S.E. QUESTIONS (2004 onwards)
1. Why does the problem of choice arise?
2. Define marginal rate of transformation. (1)
3. State any two causes of an economic problem. (1)
4. Give meaning of opportunity cost. (1)
5. What does a production possibility curve show? When will it shift to the right? (3)
6. Draw and define production possibility curve. Why is it downward sloping from left
to right?(3)
7. Why does PPC look concave to the origin? Explain. (3)
8. “An economy always produces on, but not inside a PPC”. Explain.
Or
Does production take place only on the PPC?
r
9. What are the three central problems of an economy? Why do they arise?( 4)
10. “Massive unemployment will shift the PPC to the left” explain.
11. “Scarcity is the mother of all economic problems “explain.
12. Explain the problem of ‘what to produce’ with the help of production possibility
curve.
(4)
13. Why does an economic problem arise? Explain the problem of ‘how to produce’.
(4)
14. 9. Explain the problem of ‘how to produce’ with the help of an example. (4)
15. Draw a production possibility curve. What does a point below this curve indicate?
Explain.
(4)
16. 11. Explain the problem of ‘for whom to produce′ with the help of an example. (4)
17. Draw PPC and show the followings:- (4)
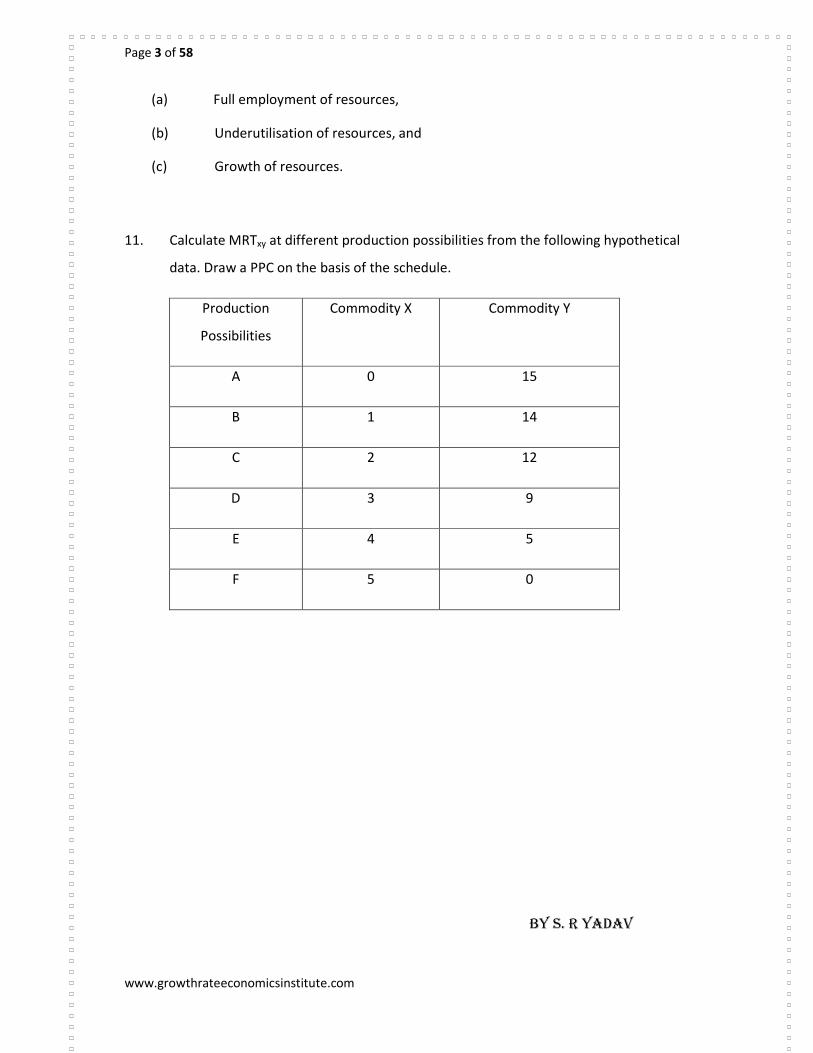
Page 3 of 58
www.growthrateeconomicsinstitute.com
(a) Full employment of resources,
(b) Underutilisation of resources, and
(c) Growth of resources.
11. Calculate MRTxy at different production possibilities from the following hypothetical
data. Draw a PPC on the basis of the schedule.
BY S. R YADAV
Production
Possibilities
Commodity X Commodity Y
A 0 15
B 1 14
C 2 12
D 3 9
E 4 5
F 5 0
Page 4 of 58
www.growthrateeconomicsinstitute.com
CHAPTER-2 CONSUMER BEHAVIOUR
C.B.S.E. QUESTIONS (2012)
SET-1
1. A consumer consumes
only two goods x and y and is in equilibrium. Price of x falls. Explain the reaction of
the consumer through the utility analysis .(set1) 3
2. Define an indifference map. Why does an indifference curve to the right show more
utility? explain.(set1) 4
3. Explain the difference between cardinal utility and ordinal utility. Give example in
each case.(set1) 3
SET-2
4. A consumer consumes
only two goods x and y and is in equilibrium. Price of x falls. Explain the reaction of
the consumer through the utility analysis .(set1) 3
5. Define a budget line.
When can it shift to the right? (set2)4
6. Explain the difference between cardinal utility and ordinal utility. Give example in
each case.(set1) 3
SET-3
7. A consumer consumes
only two goods x and y and is in equilibrium. Price of x falls. Explain the reaction of
the consumer through the utility analysis .(set1) 3
8. What is budget set? Explain what can lead to change in budget set.(set3)4
9. Explain the difference between cardinal utility and ordinal utility. Give example in
each case.(set1) 3
C.B.S.E. QUESTIONS (2011)
SET-1
10. Define a budget
line.(set1) 1
11. A consumer consumes only two goods X and Y. At a consumption level of these
two goods, he finds that the ratio of marginal utility to price in case of X is higher
than in case of Y. Explain the reaction of the consumer.(set1) 4
Page 5 of 58
www.growthrateeconomicsinstitute.com
12. Explain the conditions of consumer's equilibrium with the help of the Indifference
Curve Analysis.(set1) 6
SET-2
13. Drive the inverse relation
between price of a good and its demand from the single commodity consumer
equilibrium condition “marginal utility= price”. (set2)4
14. Explain the conditions of consumer equilibrium with the help
of indifference curve analysis.(set2)6
SET-3
15. Define budget set.(set3) 1
16. A consumer consumes only two goods X and Y. State and explains the conditions of
Consumer’s equilibrium with the help of utility analysis.(set3)4
17. Explain the three
properties of indifference curves. (set3)6
KV-PRE-BOARD-1
1. What is marginal utility?1
2. “How many ice-cream will a consumer have , if ice-cream is available free of cost”
explain with the help of suitable example?3
3. Give the answer of followings;
a. What a budget line? Give its equation
b. What would be the effect on budget line when price of
commodity decreases. Show in diagram.
c. A consumer consumes two commodities X&Y. His income
is �24 and price of X &Y is ₹ 4&₹2 respectively. Can a consumer afford a
bundle of 4 unit of X and 5 unit of Y.
C.B.S.E. QUESTIONS (2004 onwards)
1. Define Consumer’s equilibrium.(1)
2. What does the budget constraint refer to?
3. What is mean by consumer’s equilibrium? State its condition in case of a single
commodity.(1)
4. What is indifference map?(1)
5. What is meant by monotonic preference?(1)
6. What is meant by utility? (1)
7. Define marginal utility. State the law of diminishing marginal utility.(4)
8. Distinguish between marginal utility and total utility.(4)
9. Explain why the budget line is downward sloping.
10. (1)What is a budget line? What does the point on it indicate in term of prices?
Page 6 of 58
www.growthrateeconomicsinstitute.com
(2)A consumer wants to consume only two goods X and Y. The price of the two
goods are Rs.4/- and Rs.2/- respectively. The consumer’s income is Rs.24/-
a. Can the consumer afford a bundle 4X and 5Y? Explain.
b. What will be the MRSxy when the consumer is in equilibrium? explain
11. Suppose a consumer can afford to buy 6 units of Good x and 8 unit of Good Y, if he
spends his entire income. The prices of the two goods are Rs.6/- and Rs.8/-
respectively. How much is the consumer’s income?
12. How does a consumer reach equilibrium position when he is buying only one
commodity? Explain with the help of marginal utility schedule. (6)
13. What do you understand by consumer’s equilibrium? Show consumers equilibrium
with the help of indifference curve analysis.(6) 14. A consumer wants to consume two goods. The prices of the two goods are Rs 4 and
Rs 5 respectively. The consumer’s income is Rs 20.
a. Write down the equation of the budget line.
b. How much of good 1 can the consumer consume if he/she spends his/her
entire income on that good?
c. How much of good 2 can be consumed if he/she spends his/her entire income
on that good?
d. What is the slope of the budget line?
e. How does the budget line change if the consumer’s income increases to Rs 40
but the prices remain unchanged?
f. How does the budget line change if the price of good 2 decreases by a rupee
but the price of good 1 and the consumer’s income remain unchanged?
g. What happens to the budget set if the prices as well as the income double?
15. Suppose a consumer wants to consume two goods that are available only in integer
units. The two goods are equally priced at Rs 10 and the consumer’s income is Rs 40.
i. Write down all the bundles that are available to the consumer.
ii. Among the bundles that are available to a consumer, identify those that
costs will him/her exactly Rs 40.
16. Suppose a consumer’s preferences are monotonic. What can you say about his/her
preference ranking over the bundles (10, 10), (10, 9) and (9, 9)?
17. For a consumer to be in equilibrium why must marginal rate of substitute be
equal to the ratio of prices of the two goods.

Page 7 of 58
www.growthrateeconomicsinstitute.com
Px=�1 py=� 1 y=� 8
BY S.R.YADAV
CHAPTER=3 THEORY OF DEMAND
C.B.S.E. QUESTIONS (2012)
SET-1
1. Give one reason for a shift in demand curve. 1
2. Explain the difference between inferior goods and normal goods. Give example in
each case. 3
SET-2
3. Give one reason for a shift in demand curve. 1
4. Explain the difference between inferior goods and normal goods. Give example in
each case. 3
SET-3
Q 1 2 3 4 5 6 7 8 total
mux 11 10 9 8 7 6 5 4 60
muy 19 17 15 13 12 10 8 6 100
FOR EX. X AND Y GOODS
Page 8 of 58
www.growthrateeconomicsinstitute.com
5. Give one reason for a shift in demand curve. 1
6. Explain the difference between inferior goods and normal goods. Give example in
each case. 3
C.B.S.E. QUESTIONS (2011)
SET-1
7. Explain how rise in income of a consumer affects the demand of a good. Give
examples. 4
SET-2
8. Explain how the demand for a good is affected by the prices of its related goods.
Give examples. 4
SET-3
9. Explain how the demand for a good is affected by the prices of its related goods.
Give examples. 4
KV-PRE-BOARD-1
1. When a good is called a” Normal good”?1
2. Explain the effect of rise in the prices of related goods on the demand for a good
of X?3
C.B.S.E. QUESTIONS (2004 onwards)
1. Define the market demand.
2. Why a good is called an inferior good?
3. When a good is called a normal good?
4. Explain the meaning of normal goods and inferior goods.
5. State any three factors that cause an ‘increase’ in demand of a commodity.
6. Distinguish between ‘Change in demand’ and ‘Change in quantity demanded’ of a
commodity.
7. Define market demand. State the law of demand and the assumption behind it.
8. State three causes of shift of demand curve.
9. Explain with the help of diagrams the effect of following changes on demand of a
commodity:
i. A fall in the price of substitute good.
ii. A fall in the income of its buyer.

Page 9 of 58
www.growthrateeconomicsinstitute.com
10. Explain with the help of diagrams the effect of following changes on demand of a
commodity:
i. A fall in the price of complementary good.
ii. A rise in the income of its buyer.
11. Explain with the help of diagrams the effect of the following changes on the demand of a
commodity:
i. An unfavourable change in tastes of buyers of the commodity.
ii. A fall in the income of its buyer, if the commodity is inferior.
12. Explain with the help of diagrams the effect of the following changes on the demand of a
commodity:
i. A fall in the price of the commodity.
ii. A favourable change in the taste of the buyer.
13. State three causes each for a rightward shift and a leftward shift of a demand curve.
14. Define market demand. State the factors that affect it.
15. Explain the law of demand and the reasons behind it.
16. Explain the effect of increase in income of the buyers of the good ‘X’ on the demand for X.
Use diagram showing for good X on the X-axis and its price on the Y-axis.
17. A consumer consumes good X . Explain the effect of fall in the prices of related goods on the
demand for X. Use diagram showing demand showing demand for good X on the X-axis and
its price on the Y-axis.
18. Suppose there are two consumers in the market for a good and their demand functions are
as follows:
a. d1(p) = 20 – p for any price less than or equal to 20 and d1(p) = 0 at any price greater
than 20.
b. d2(p) = 30 − 2p for any price less than or equal to 15 and d1(p) = 0 at any price
greater than 15.
c. Find out the market demand function.
19. Suppose there are 20 consumers for a good and they have identical demand functions:
i. D(p) = 10 − 3pfor any price less than or equal to and d1(p) = 0 at any
price greater than .
ii. What is the market demand function?
Page 10 of 58
www.growthrateeconomicsinstitute.com
20. Determine how the following changes (or shifts) will affect market demand curve for a
product.
(a) A new steel plant comes up in Jharkhand people who were
previously unemployed in the area are now employed. How will this
affect the demand for colour T.V. and Black and White T.V. in the
region?
(b) In order to encourage e tourism in Goa. The Government of India
suggests Indian Airlines to reduce air fare to Goa from the four
major cities of Chennai, Kolkata, Mumbai and New Delhi. If the
Indian Airlines reduces the fare to Goa, How will this affect the
market demand curve for air travel to Goa?
(c) There are train and bus services between New Delhi and Jaipur.
Suppose that the train fare between the two cities comes down.
How will this affect demand curve for bus travel between the two
cities?
CHAPTER=3 ELASTICITY OF DEMAND
C.B.S.E. QUESTIONS (2012)
SET-1
1. A consumer buys 10 units of a commodity at a price of ₹10 per unit. He incurs an
expenditure of ₹200 on buying 20 units. Calculate price elasticity of demand by the
percentage method. Comment upon the shape of demand curve based on this information.4
SET-2
2. A consumer buys 14 units of a good at a price of ₹8 per unit. At price ₹7 per unit he spends
₹98 on the good. Calculate price elasticity of demand by the percentage method. Comment
upon the shape of demand curve based on this information.4
SET-3
3. A consumer buys 8 units of a good at a price of ₹7 per unit. When price rises to ₹8 per unit
he buys 7 units. Calculate price elasticity of demand through the expenditure approach.
Comment upon the shape of demand curve based on this information.4
C.B.S.E. QUESTIONS (2011)
SET-1
Page 11 of 58
www.growthrateeconomicsinstitute.com
4. When price of a good is Rs. 13 per unit, the consumer buys 11 units of that good.
When price rises to Rs. 15 per unit, the consumer continues to buy 11 units. Calculate
price elasticity of demand. 3
SET-2
5. A consumer buys 17 units of a good at a price of rs 10 per unit. When price falls to rs 8 per
unit the consumer buys 23 units. Using expenditure approach, what will you say about price
elasticity of the good?
SET-3
6. 8 units of a good are demanded at a price of Rs. 7 per unit. Price elasticity of
demand is (-)1. How many units will be demanded if the price rises to Rs. 8 per unit?
Use expenditure approach of price elasticity of demand to answer this question.(set3) 3
KV-PRE-BOARD-1
1. 10 percent increase in prices leads 20 percent decrease in demand of
goods. A consumer buys 80 units of the good at a price of �20 per unit. How many units will
the consumer buy when price changes to �22?
KV-PRE-BOARD-2
Quantity demand of a commodity rises by 6 units when its price falls by rs 1 per units. Its price
elascity o f demand is -1. If the price before the change was rs 20 per unit, calculate quantity
demanded at this price.
C.B.S.E. QUESTIONS (2004 onwards)
1. What is meant by price elasticity of demand?
2. Find out price elasticity of demand when 5% increase in price causes 5% increase in
expenditure on the commodity.
3. If good can be used for many purposes, the demand for it will be elastic. Why?
4. ‘A downward sloping demand curve has different elasticities at its different
points.’ Explain and show it in the diagram.
5. Explain the expenditure method of measuring price elasticity of demand of a
commodity. When is the demand said to be inelastic?
6. Mention any three factors that affect the price elasticity of demand of a commodity.
7. Give meaning of perfectly elastic demand and perfectly inelastic demand of a
commodity.
Page 12 of 58
www.growthrateeconomicsinstitute.com
8. Price elasticity of demand of a good is (-) 2. 40 unit of this good are bought at a price of
Rs 10 per unit. How many units will be bought at a price of Rs 11 per unit? Calculate.
9. Suppose the price elasticity of demand for a good is (– )0.2. How will the expenditure
on the good be affected if there is 10% increase in the price of the good?
10. Consider the demand curve D(p) = 10 − 3p. What is the elasticity at price ?
11. Suppose the price elasticity of demand for a good is −0.2. How will the expenditure on
the good be affected if there is a 10% increase in its price?
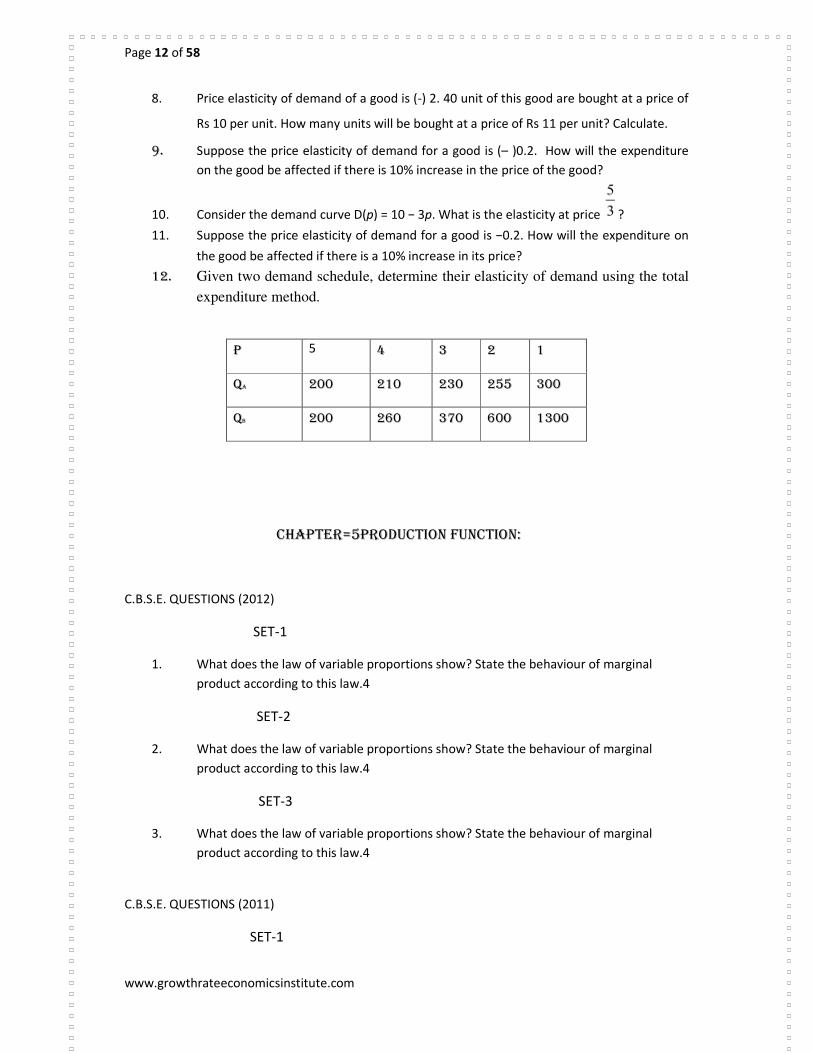
12. Given two demand schedule, determine their elasticity of demand using the total
expenditure method.
CHAPTER=5PRODUCTION FUNCTION:
C.B.S.E. QUESTIONS (2012)
SET-1
1. What does the law of variable proportions show? State the behaviour of marginal
product according to this law.4
SET-2
2. What does the law of variable proportions show? State the behaviour of marginal
product according to this law.4
SET-3
3. What does the law of variable proportions show? State the behaviour of marginal
product according to this law.4
C.B.S.E. QUESTIONS (2011)
SET-1
P 5 4 3 2 1
QA 200 210 230 255 300
QB 200 260 370 600 1300
Page 13 of 58
www.growthrateeconomicsinstitute.com
4. Define production function.1
SET-2
5. Giving reason, explain the behaviour of total product under law of variable proportions.
Use diagram.6
KV-PRE-BOARD-1
1. What does mean by “returns to a factor”, what are the reasons of increasing return to a
factor? Any one.3
2. Giving reason, state whether the following statement are true of false.(any two)
a. When there are diminishing returns to a factor total product always decreases.
b. When there are diminishing returns to a factor marginal and total product both
always fall.
c. Increase in total product always indicates that there are increasing returns to factor.
C.B.S.E. QUESTIONS (2004 onwards)
1. Complete the following table:
Variable input TPP APP MPP
0 0 ---
1 --- 20
2 --- 26
3 66 ---
4 --- 19 10
5 --- 4
2. Complete the following table: -
Units of
Labour
TP AP MP
1 20 -- --
--- -- 21 22
3 66 -- ---
-- --- 22 22
5 -- 21 ---
Page 14 of 58
www.growthrateeconomicsinstitute.com
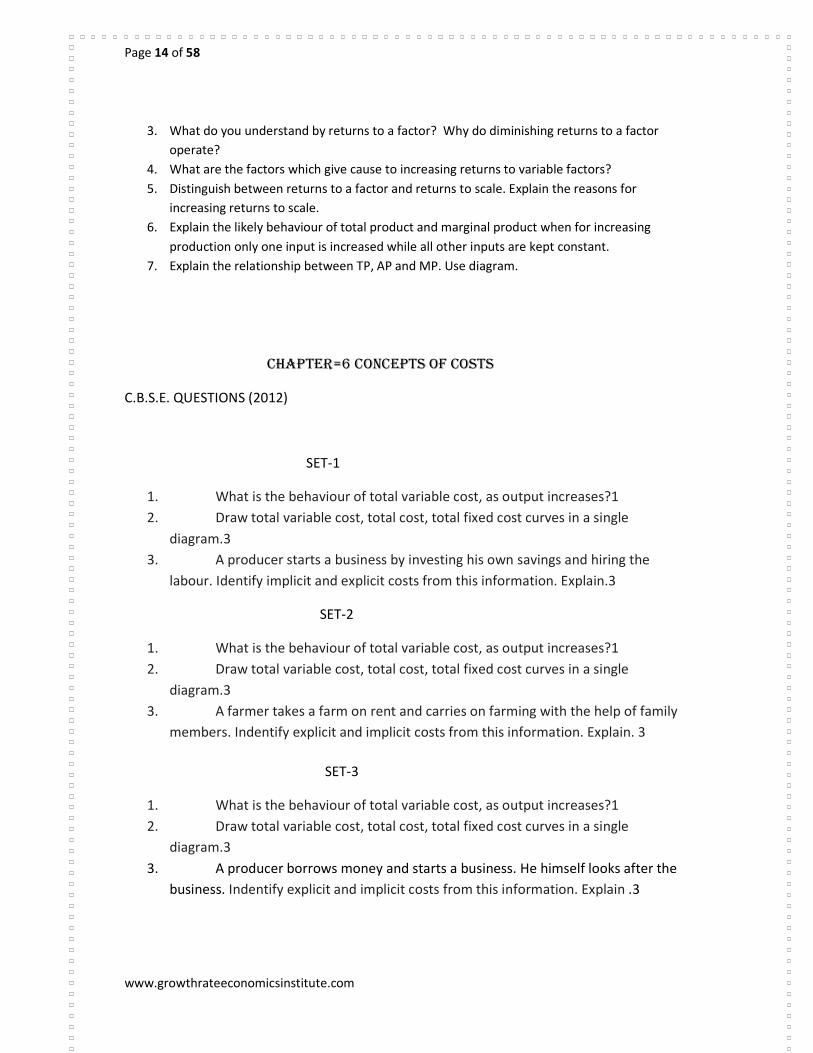
3. What do you understand by returns to a factor? Why do diminishing returns to a factor
operate?
4. What are the factors which give cause to increasing returns to variable factors?
5. Distinguish between returns to a factor and returns to scale. Explain the reasons for
increasing returns to scale.
6. Explain the likely behaviour of total product and marginal product when for increasing
production only one input is increased while all other inputs are kept constant.
7. Explain the relationship between TP, AP and MP. Use diagram.
CHAPTER=6 CONCEPTS OF COSTS
C.B.S.E. QUESTIONS (2012)
SET-1
1. What is the behaviour of total variable cost, as output increases?1
2. Draw total variable cost, total cost, total fixed cost curves in a single
diagram.3
3. A producer starts a business by investing his own savings and hiring the
labour. Identify implicit and explicit costs from this information. Explain.3
SET-2
1. What is the behaviour of total variable cost, as output increases?1
2. Draw total variable cost, total cost, total fixed cost curves in a single
diagram.3
3. A farmer takes a farm on rent and carries on farming with the help of family
members. Indentify explicit and implicit costs from this information. Explain. 3
SET-3
1. What is the behaviour of total variable cost, as output increases?1
2. Draw total variable cost, total cost, total fixed cost curves in a single
diagram.3
3. A producer borrows money and starts a business. He himself looks after the
business. Indentify explicit and implicit costs from this information. Explain .3
Page 15 of 58
www.growthrateeconomicsinstitute.com
C.B.S.E. QUESTIONS (2011)
SET-1
4. Giving examples, explain the meaning of cost in economics. 3
SET-2
4. Distinguish between explicit cost and implicit cost and give examples. 3
5. Define marginal cost. Explain its relation with average cost. 4
OR
Define variable cost. Explain the behaviour of total variable cost as output increases.
4
SET-3
4. Giving examples, distinguish between fixed cost and variable cost.3
KV-PRE-BOARD-1
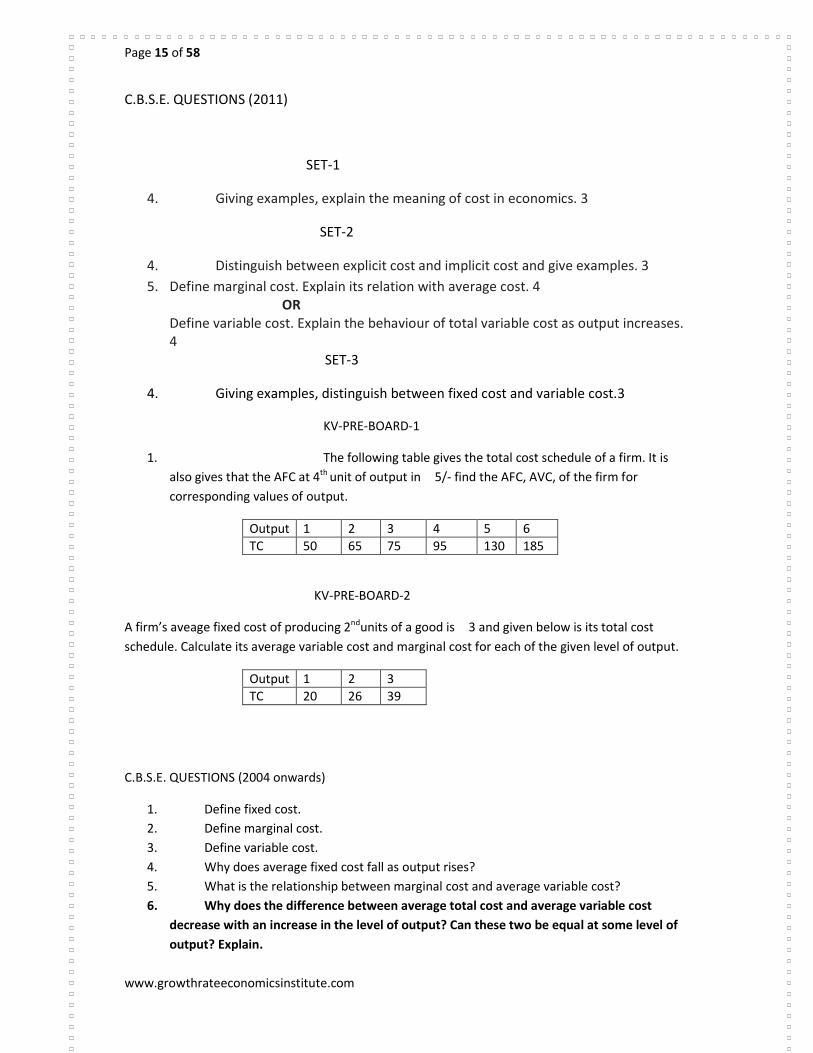
1. The following table gives the total cost schedule of a firm. It is
also gives that the AFC at 4th unit of output in �5/- find the AFC, AVC, of the firm for
corresponding values of output.
Output 1 2 3 4 5 6
TC 50 65 75 95 130 185
KV-PRE-BOARD-2
A firm’s aveage fixed cost of producing 2ndunits of a good is �3 and given below is its total cost
schedule. Calculate its average variable cost and marginal cost for each of the given level of output.
Output 1 2 3
TC 20 26 39
C.B.S.E. QUESTIONS (2004 onwards)
1. Define fixed cost.
2. Define marginal cost.
3. Define variable cost.
4. Why does average fixed cost fall as output rises?
5. What is the relationship between marginal cost and average variable cost?
6. Why does the difference between average total cost and average variable cost
decrease with an increase in the level of output? Can these two be equal at some level of
output? Explain.
Page 16 of 58
www.growthrateeconomicsinstitute.com
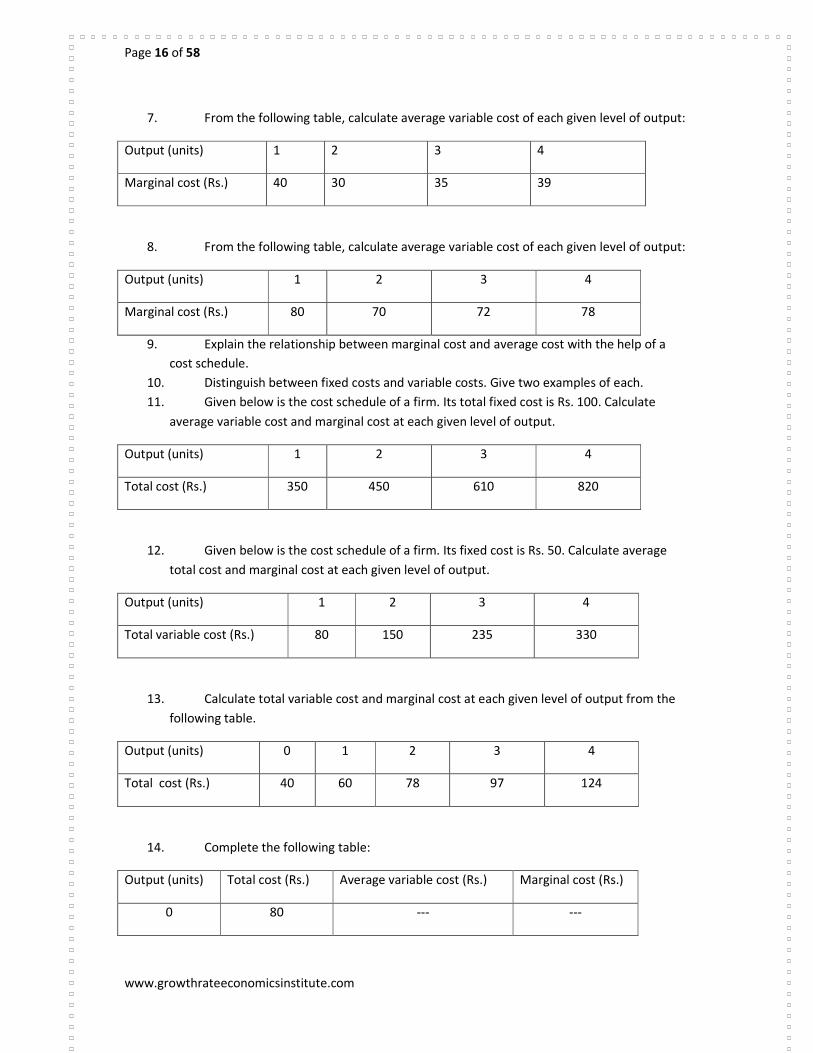
7. From the following table, calculate average variable cost of each given level of output:
Output (units) 1 2 3 4
Marginal cost (Rs.) 40 30 35 39
8. From the following table, calculate average variable cost of each given level of output:
Output (units) 1 2 3 4
Marginal cost (Rs.) 80 70 72 78
9. Explain the relationship between marginal cost and average cost with the help of a
cost schedule.
10. Distinguish between fixed costs and variable costs. Give two examples of each.
11. Given below is the cost schedule of a firm. Its total fixed cost is Rs. 100. Calculate
average variable cost and marginal cost at each given level of output.
Output (units) 1 2 3 4
Total cost (Rs.) 350 450 610 820
12. Given below is the cost schedule of a firm. Its fixed cost is Rs. 50. Calculate average
total cost and marginal cost at each given level of output.
Output (units) 1 2 3 4
Total variable cost (Rs.) 80 150 235 330
13. Calculate total variable cost and marginal cost at each given level of output from the
following table.
Output (units) 0 1 2 3 4
Total cost (Rs.) 40 60 78 97 124
14. Complete the following table:
Output (units) Total cost (Rs.) Average variable cost (Rs.) Marginal cost (Rs.)
0 80 --- ---
Page 17 of 58
www.growthrateeconomicsinstitute.com
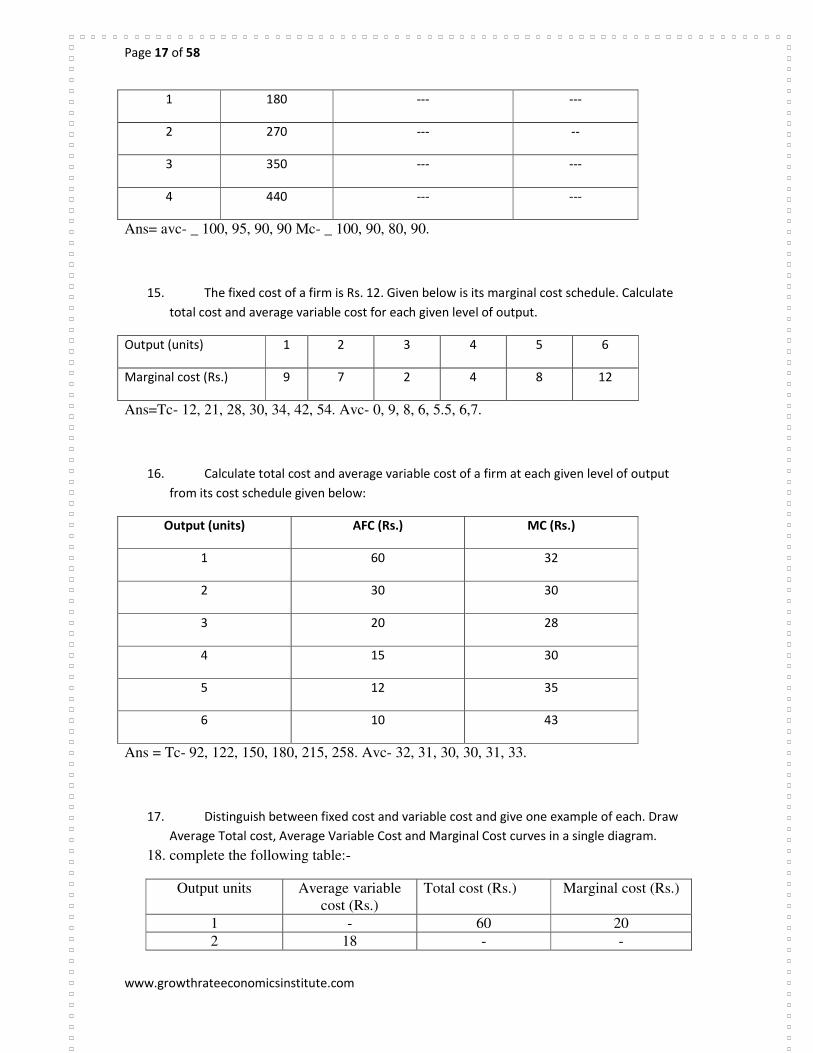
1 180 --- ---
2 270 --- --
3 350 --- ---
4 440 --- ---
Ans= avc- _ 100, 95, 90, 90 Mc- _ 100, 90, 80, 90.
15. The fixed cost of a firm is Rs. 12. Given below is its marginal cost schedule. Calculate
total cost and average variable cost for each given level of output.
Output (units) 1 2 3 4 5 6
Marginal cost (Rs.) 9 7 2 4 8 12
Ans=Tc- 12, 21, 28, 30, 34, 42, 54. Avc- 0, 9, 8, 6, 5.5, 6,7.
16. Calculate total cost and average variable cost of a firm at each given level of output
from its cost schedule given below:
Output (units) AFC (Rs.) MC (Rs.)
1 60 32
2 30 30
3 20 28
4 15 30
5 12 35
6 10 43
Ans = Tc- 92, 122, 150, 180, 215, 258. Avc- 32, 31, 30, 30, 31, 33.
17. Distinguish between fixed cost and variable cost and give one example of each. Draw
Average Total cost, Average Variable Cost and Marginal Cost curves in a single diagram.
18. complete the following table:-
Output units Average variable
cost (Rs.)
Total cost (Rs.) Marginal cost (Rs.)
1 - 60 20
2 18 - -
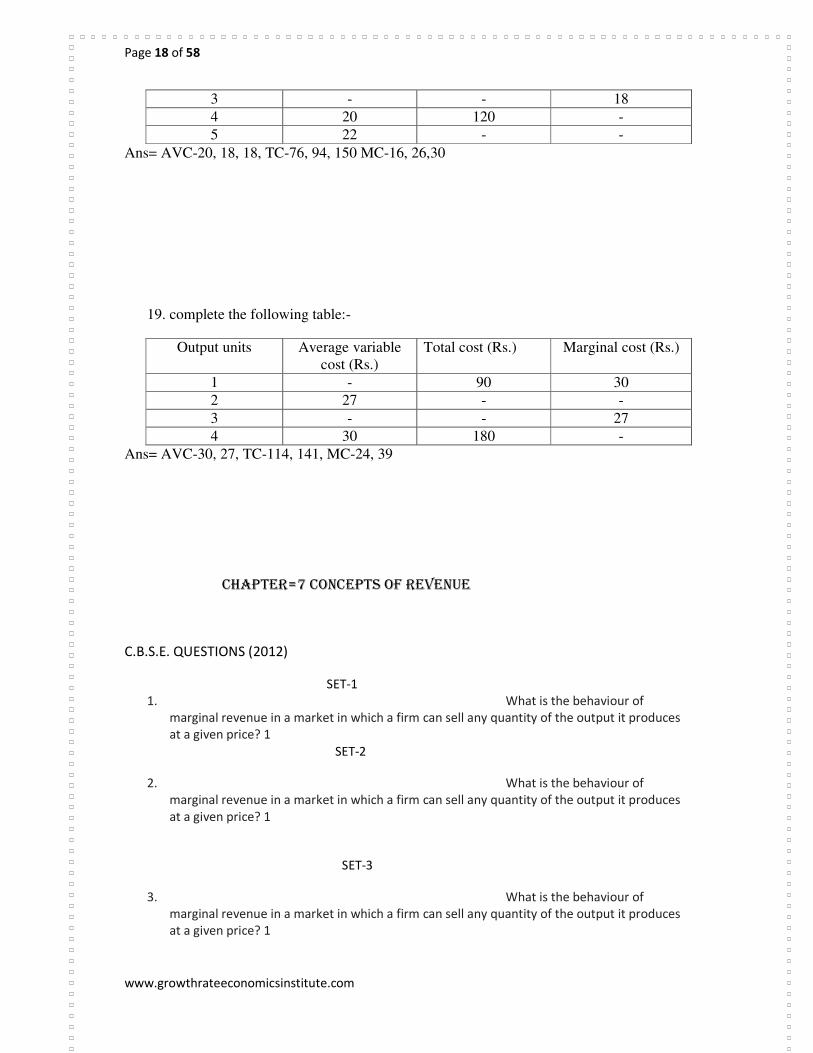
Page 18 of 58
www.growthrateeconomicsinstitute.com
3 - - 18
4 20 120 -
5 22 - -
Ans= AVC-20, 18, 18, TC-76, 94, 150 MC-16, 26,30
19. complete the following table:-
Output units Average variable
cost (Rs.)
Total cost (Rs.) Marginal cost (Rs.)
1 - 90 30
2 27 - -
3 - - 27
4 30 180 -
Ans= AVC-30, 27, TC-114, 141, MC-24, 39
CHAPTER=7 CONCEPTS OF REVENUE
C.B.S.E. QUESTIONS (2012)
SET-1
1. What is the behaviour of
marginal revenue in a market in which a firm can sell any quantity of the output it produces
at a given price? 1
SET-2
2. What is the behaviour of
marginal revenue in a market in which a firm can sell any quantity of the output it produces
at a given price? 1
SET-3
3. What is the behaviour of
marginal revenue in a market in which a firm can sell any quantity of the output it produces
at a given price? 1
Page 19 of 58
www.growthrateeconomicsinstitute.com
C.B.S.E. QUESTIONS (2011)
SET-1
1. Draw average revenue and
marginal revenue curves in a single diagram of a firm
which can sell more units of a good only by lowering the price of that good. Explain.3
SET-2
2. Draw in a single diagram the average revenue and marginal revenue curves of a firm
which can sell any quantity of the good at a given price. Explain. 3
SET-3
3. Draw total revenue and marginal revenue curves of a firm which is free to sell any
quantity of the good at a given price. Explain. 3
KV-PRE-BOARD-1
4. What is marginal revenue?1
5. In which market form, are the average and marginal revenue
of a firm always equal?1
KV-PRE-BOARD-2
1. State whether the following statements are true or false. Give
reasons for your answer:
i. When marginal revenue is constant and not equal to zero, then total
revenue will also be constant.
ii. As soon as marginal cost starts rising, average variable cost also starts
rising.4
C.B.S.E. QUESTIONS (2004 onwards)
2. Define marginal revenue.
3. Define total revenue.
4. Define average revenue.
5. What change should take place in total revenue so that
i. Marginal revenue is positive.
ii. Marginal revenue is falling.
6. Explain the relationship between total revenue and marginal revenue with the help of a
revenue schedule.
7. Complete the following table:
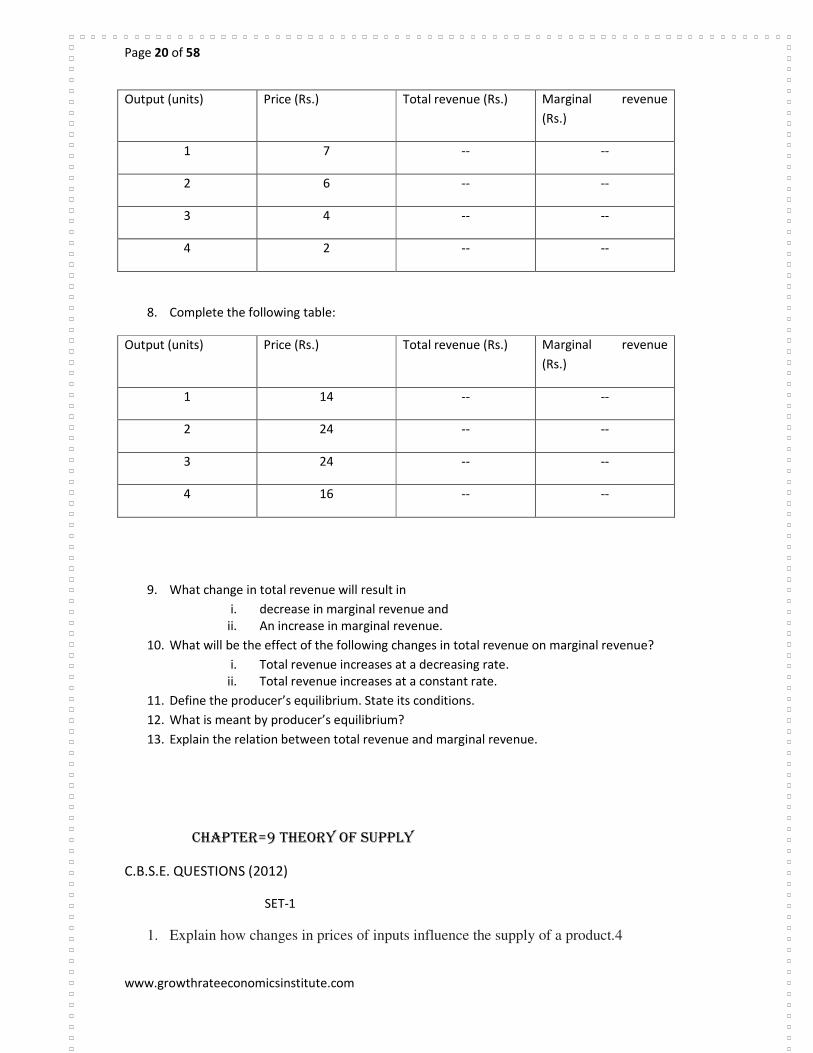
Page 20 of 58
www.growthrateeconomicsinstitute.com
Output (units) Price (Rs.) Total revenue (Rs.) Marginal revenue
(Rs.)
1 7 -- --
2 6 -- --
3 4 -- --
4 2 -- --
8. Complete the following table:
Output (units) Price (Rs.) Total revenue (Rs.) Marginal revenue
(Rs.)
1 14 -- --
2 24 -- --
3 24 -- --
4 16 -- --
9. What change in total revenue will result in
i. decrease in marginal revenue and
ii. An increase in marginal revenue.
10. What will be the effect of the following changes in total revenue on marginal revenue?
i. Total revenue increases at a decreasing rate.
ii. Total revenue increases at a constant rate.
11. Define the producer’s equilibrium. State its conditions.
12. What is meant by producer’s equilibrium?
13. Explain the relation between total revenue and marginal revenue.
CHAPTER=9 THEORY OF SUPPLY
C.B.S.E. QUESTIONS (2012)
SET-1
1. Explain how changes in prices of inputs influence the supply of a product.4
Page 21 of 58
www.growthrateeconomicsinstitute.com
2. Explain the distinction between “change in quantity supplied” and “change in
supply”. Use diagram.6
SET-2
1. Explain how changes in prices of inputs influence the supply of a product.4
2. Explain the distinction between “change in quantity supplied” and “change in
supply”. Use diagram.6
SET-3
1. Explain how changes in prices of inputs influence the supply of a product.4
2. Explain the distinction between “change in quantity
supplied” and “change in supply”. Use diagram.6
C.B.S.E. QUESTIONS (2011)
SET-1
3. What is meant by 'increase' in supply? 1
4. Define supply. 1
5. Define 'Market-supply'. What is the effect on the supply of a good when Government
imposes a tax on the production of that good? Explain.
OR 6. What is a supply schedule? What is the effect on the supply of a good when
Government gives a subsidy on the production of that good? Explain. 4 SET-2
3. What is 'decrease' in supply? 1 SET-3
3. Give meaning of change in quantity supplied.
4. What is a supply schedule? Explain how change in technology of producing a good
affects the supply of that good. 4
OR
5. Define supply curve. How does fall in price of an input affect the supply of the good
using that input?
KV-PRE-BOARD-1
Page 22 of 58
www.growthrateeconomicsinstitute.com
CHAPTER=8 PRODUCER EQUILIBRIUM
C.B.S.E. QUESTIONS (2012)
SET-1
1. Market for a good is in equilibrium. There is simultaneous “decrease” both in demand
and supply but there is no change in market price. Explain with the help of a schedule
how it is possible.6
OR
Market for a good is in equilibrium. Explain the chain of reactions in the market if the
price is (a) higher than equilibrium price and (b) lower than equilibrium price. 6 SET-2
1. Market for a good is in equilibrium. There is simultaneous “decrease” both in demand
and supply but there is no change in market price. Explain with the help of a schedule
how it is possible.6
OR
Market for a good is in equilibrium. Explain the chain of reactions in the market if the
price is (a) higher than equilibrium price and (b) lower than equilibrium price. 6 SET-3
1. Market for a good is in equilibrium. There is simultaneous “decrease” both in demand
and supply but there is no change in market price. Explain with the help of a schedule
how it is possible.6
OR
Market for a good is in equilibrium. Explain the chain of reactions in the market if the
price is (a) higher than equilibrium price and (b) lower than equilibrium price. 6
C.B.S.E. QUESTIONS (2011)
SET-1
2. What is meant by producer's equilibrium? Explain the conditions of producer's
equilibrium through the 'total revenue and total cost' approach. Use diagram. 6
3. Market for a good is in equilibrium. There is an 'increase' in demand for this good.
Explain the chain of effects of this change. Use diagram. 6 SET-2
1. What is producer's equilibrium? Explain the conditions of producer's equilibrium
through the 'marginal cost and marginal revenue' approach. Use diagram. 6
2. Market for a good is in equilibrium. There is 'increase' in supply of the good. Explain
the chain of effects of this change. Use diagram. 6 SET-3
1. Market for a good is in equilibrium. There is ‘decrease’ in supply of the good. Explain
the chain of effects of this change. Use diagram. 6
Page 23 of 58
www.growthrateeconomicsinstitute.com
KV-PRE-BOARD-1
1. Explain the situation of producer’s equilibrium with the help of total cost and total revenue
curve.4
2. Explain the effect on equilibrium price and quantity in the following cases: use diagram.6
a. Income of the consumer increases
b. Number of firm’s increases
a. Or
3. There is a simultaneous “decrease” in demand and supply of commodity when will it result
in. use diagram:6
a. No change in equilibrium price.
b. A fall in equilibrium price.
KV-PRE-BOARD-2
1. From the following schedule find out the level of output at which the
producer is in equilibrium, using marginal cost and marginal revenue approach. Give reasons
for your answer.6
Price� Output TC
8 1 6
7 2 11
6 3 15
5 4 20
4 5 26
2. There is simultaneous increase in demand and supply of a commodity what will be impact on
equilibrium price and equilibrium quantity when-
a. Demand and supply increase equally.
b. Increase in demand is less than to increase in supply.
C.B.S.E. QUESTIONS (2004 onwards)
1. What is meant by equilibrium price?
2. Define the producer’s equilibrium. State its conditions.
3. What is meant by producer’s equilibrium?
Page 24 of 58
www.growthrateeconomicsinstitute.com
4. Explain the chain of effects on demand, supply and price of a commodity caused by a
leftward shift of its demand curve. Use diagram
5. Explain the changes that take place when at a given price of a commodity there is excess
supply of it. Use diagram
6. A product market is in equilibrium. Suppose the demand for the product decreases.
What changes will take place in the market? Use diagram
7. If at a given price of a commodity, there is excess demand how will the equilibrium price
be reached?
8. Explain with the help of diagram the effect of a rightward shift of supply curve of
commodity on its equilibrium price and quantity.
9. If at a given price of commodity there is excess supply, how will the equilibrium price be
reached? Explain with the help of diagram.
10. Explain the effect of a leftwards shift of demand curve of a commodity on its equilibrium
price and quantity, with the help of diagram.
11. Explain with the help of a diagram the effect of a leftward shift of the supply curve of a
commodity on its equilibrium price and quantity.
12. At a given price of a commodity, there is excess supply. What changes is establish the
equilibrium price? Explain with the help of diagram.
13. How is equilibrium price and equilibrium quantity of a normal commodity affected by an
increase of its buyers? Explain with the help of diagram.
14. How will an increase in the income of the buyers of an ‘inferior good’ affect its
equilibrium price equilibrium quantity? Explain with the help of diagram.
15. Explain the process of price determination under perfect competition with the help of a
schedule and a diagram.
16. When will (a) simultaneous increase and) simultaneous decrease in both demand and
supply not effect the equilibrium price? Explain with the help of diagram.
17. Why must the quantity demanded and quantity supplied of a commodity be equal at its
equilibriumprice? Explain.
CHAPTER=10-11 FORMS OF MARKET AND PRICE DETERMINATION
C.B.S.E. QUESTIONS (2012)
Page 25 of 58
www.growthrateeconomicsinstitute.com
SET-1
1. What is price- maker firm?1
2. Explain the implication of “large number of sellers in a perfect
Competitive market.3
OR Explain why there are only a few firms in an oligopoly market.3
SET-2
1. What is price- maker firm?1
2. Explain the implication of “large number of sellers in a perfect
Competitive market.3
OR Explain why there are only a few firms in an oligopoly market.3
SET-3
1. What is price- maker firm?1
2. Explain the implication of “large number of sellers in a perfect
Competitive market.3
OR Explain why there are only a few firms in an oligopoly market.3
C.B.S.E. QUESTIONS (2011)
SET-1
3. Explain the implication of 'freedom of entry and exit to the firms' under perfect
competition.
OR 4. Explain the implication of 'perfect knowledge about market' under perfect
competition.
3
5. Distinguish between collusive and non-collusive 'oligopoly. Explain how the
oligopolyfirms are interdependent in taking price and output decisions. 6
SET-2
1. Explain the implications of the feature 'large number of buyers' in a perfectly
competitivemarket. 3
OR 2. Explain the implications of the feature 'homogeneous products' in a perfectly
competitivemarket. 3
3. Distinguish between 'non-collusive' and 'collusive' oligopoly. Explain the following
features of oligopoly: 6
(i) Few firms
(ii) Non-price competition SET-3
1. What is market equilibrium?1
Page 26 of 58
www.growthrateeconomicsinstitute.com
2. Explain the implication of 'freedom of entry and exit to the firms' under perfect
competition. Or
3. Explain the implications of the feature 'large number of
buyers' in a perfectly competitivemarket. 3
4. Distinguish between 'cooperative' and 'non-cooperative' oligopoly. Explain the
followingfeatures of oligopoly: 6
(i) Barriers to the entry of firms
(ii) Non-price competition
KV-PRE-BOARD-1
1. State three features of a monopoly market. Describe any one.3
KV-PRE-BOARD-2
1. In which market firms is price taker?1
2. Explain the implication of the feature of ‘product differentiation’
under monopolistic competition?
Or
3. Explain the implication of the feature of ‘possibility of price discrimination’ under
monopoly.3
C.B.S.E. QUESTIONS (2004 onwards)
1. Under which market from a firm is a price taker?
2. In which market from are the products homogeneous?
3. In which market from are average revenue and marginal revenue of a firm always equal?
4. In which market from there is product differentiation?
5. Draw average revenue curve of a firm under perfect competition?
6. State three main features of a monopoly market. Describe any one.
7. State any three main features of monopolistic competition. Describe any one.
8. State clearly any three features of a perfectly competitive market?
9. Why is average revenue curve of a firm under perfect competition .Parallel to X-axis.and
negatively slopped under monopoly?
10. Draw average revenue curve of a firm under (i) monopoly and (ii) perfect competition. Explain
the differences in theses curves, if any?
Page 27 of 58
www.growthrateeconomicsinstitute.com
11. Why is average revenue curve of a monopolist less elastic than the average revenue curve of a
firm under monopolistic competition?
12. Explain the features ‘large number of buyers and sellers ‘of a perfectly competitive market.
13. Explain the feature ‘differentiated products’ of a market with monopolistic competition.
MACRO-ECONOMICS
UNIT-1 NATIONAL INCOME AND RELATED AGGREGATES
C.B.S.E. QUESTIONS (2012)
SET-1
1. Define consumption goods. 1
2. Define flow variables.1
3. Should the following be treated as final expenditure or intermediate expenditure? Give
reasons for your answer:4
(i) Purchase of furniture by a firm. (Final expenditure)
(ii) Expenditure on maintenance by a firm. (Intermediate expenditure) 4
4. Find Net Value Added at market price: 3
ITEMS (Rs. Crore)
(i) Depreciation 700
Page 28 of 58
www.growthrateeconomicsinstitute.com
(ii) Output sold (units) 900
(iii) price per unit of output 40
(iv) closing stock 1000
(v) Opening stock 800
(vi) Sales tax 3000
(vii) Intermediate cost 20000
Ans- NAVmp = 1550
5. Find out (a) GNPmp and (b) Net current transfers to abroad: 6
Items Rs. Crore)
(i) Depreciation 100
(ii) Private final consumption expenditure 1000
(iii) Net national disposable income 1500
(iv) Net factor income to abroad (-) 10
(v) Government final consumption expenditure 300
(vi) Net indirect tax 50
(vii) Net domestic fixed capital formation 110
(viii) Net imports 15
(ix) Closing stock 20
(x) Opening stock 20
Ans- GNPMP = �1535 crore, PDI = (-) �65 crore
SET-2
6. Define consumption goods. 1
7. Define flow variables.1
8. Give reason, explain how should the following be treated while estimating national income:
4
(i) Expenditure on free services provided by government. (Should be included in national income)
(ii) Payment of interest by a government firm. (Include in national income because it is a factor payment)
9. Find Gross Value Added at factor cost : 3
ITEMS (Rs. Crore)
(i) Depreciation 2000
(ii) Output sold (units) 2000
(iii) price per unit of output 20
(iv) Change in stock (-) 500
(v) Intermediate cost 15000
(vi) subsidy 3000
Ans- GAVFC = 27500
10. Find out (a) National Income and (b) NNDI : 6
Items Rs. Crore)
(i) Depreciation 60
(ii) Private final consumption expenditure 600
(iii) Net current transfers to abroad 30
(iv) Net factor income to abroad 20
(v) Government final consumption expenditure 200
Page 29 of 58
www.growthrateeconomicsinstitute.com
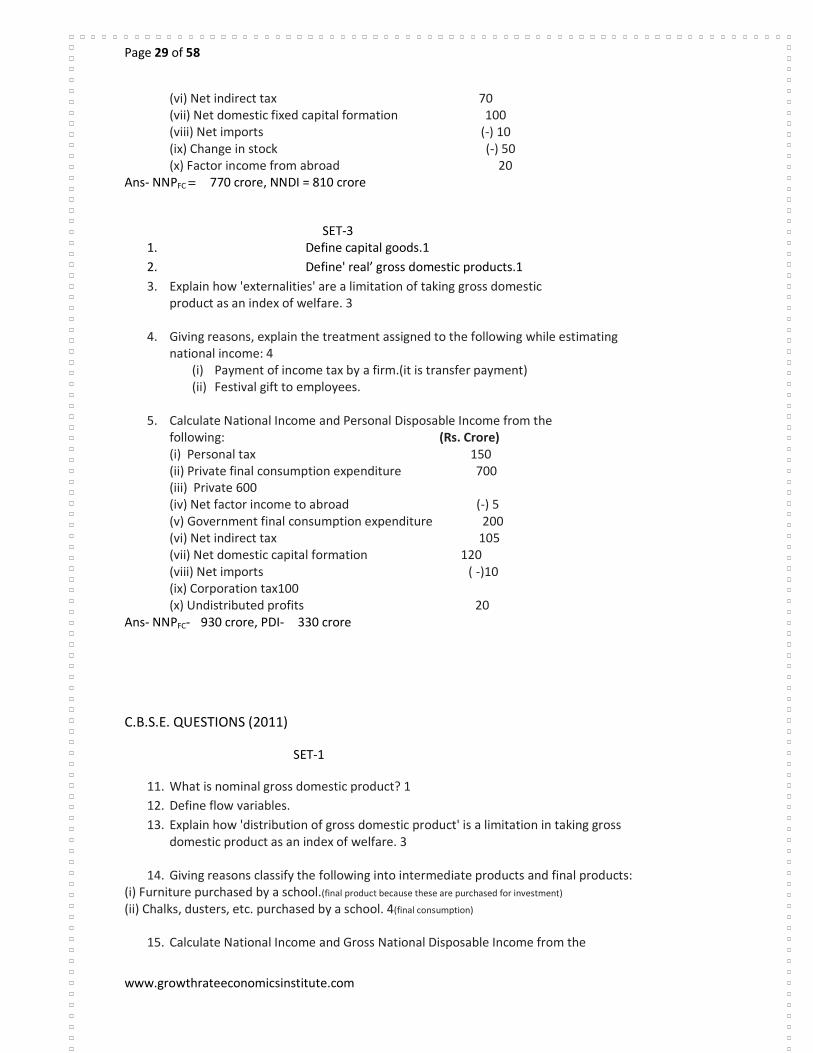
(vi) Net indirect tax 70
(vii) Net domestic fixed capital formation 100
(viii) Net imports (-) 10
(ix) Change in stock (-) 50
(x) Factor income from abroad 20
Ans- NNPFC = �770 crore, NNDI = 810 crore
SET-3
1. Define capital goods.1
2. Define' real’ gross domestic products.1
3. Explain how 'externalities' are a limitation of taking gross domestic
product as an index of welfare. 3
4. Giving reasons, explain the treatment assigned to the following while estimating
national income: 4
(i) Payment of income tax by a firm.(it is transfer payment)
(ii) Festival gift to employees.
5. Calculate National Income and Personal Disposable Income from the
following: (Rs. Crore)
(i) Personal tax 150
(ii) Private final consumption expenditure 700
(iii) Private 600
(iv) Net factor income to abroad (-) 5
(v) Government final consumption expenditure 200
(vi) Net indirect tax 105
(vii) Net domestic capital formation 120
(viii) Net imports ( -)10
(ix) Corporation tax100
(x) Undistributed profits 20
Ans- NNPFC-�930 crore, PDI- �330 crore
C.B.S.E. QUESTIONS (2011)
SET-1
11. What is nominal gross domestic product? 1
12. Define flow variables.
13. Explain how 'distribution of gross domestic product' is a limitation in taking gross
domestic product as an index of welfare. 3
14. Giving reasons classify the following into intermediate products and final products:
(i) Furniture purchased by a school.(final product because these are purchased for investment)
(ii) Chalks, dusters, etc. purchased by a school. 4(final consumption)
15. Calculate National Income and Gross National Disposable Income from the
Page 30 of 58
www.growthrateeconomicsinstitute.com
following: (Rs. Crore)
(i) Net current transfers to the rest of the world (-)5
(ii) Private final consumption expenditure 500
(iii) Consumption of fixed capital 20
(iv) Net factor income to abroad (-)10
(v) Government final consumption expenditure 200
(vi) Net indirect tax 100
(vii) Net domestic fixed capital formation 120
(viii) Net imports 30
(ix) Change in stocks (-)20 6
ANS- NNPFC-680 CRORE , GNDI- 805 crore.
SET-2
1. What are stock variables? 1
2. Define ‘depreciation'. 1
3. Explain how 'non-monetary exchanges' are a limitation in taking gross domestic
product as an index of welfare. 3
4. Giving reasons, explain the treatment assigned to the following while estimating
national income: 4
(i) Family members working free on the farm owned by the family.
(ii) Payment of interest on borrowings by general government.
5. Calculate (a) 'Net Domestic Product at Factor Cost' and (b) 'Private Income' from
the following: 6
(Rs. core)
(i) Domestic product accruing to government 300
(ii) Wages and salaries 1000
(iii) Net current transfers to abroad (-) 20
(iv) Rent100
(v) Interest paid by the production units 130
(vi) National debt interest 30
(vii) Corporation tax 50
(viii) Current transfers by government 40
(ix) Contribution to social security schemes by employers 200
(x) Dividends 100
(xi) Undistributed profits 20
(xii) Net factor income to abroad 0
Ans- NDPFC-1400 crores, Pvt. Icome-1199 crores
SET-3
6. Define capital goods.1
7. Define' real’ gross domestic products.1
8. Explain how 'externalities' are a limitation of taking gross domestic
product as an index of welfare. 3
9. Giving reasons, explain the treatment assigned to the following while estimating
national income: 4
(i) Payment of income tax by a firm.(it is transfer payment)
(ii) Festival gift to employees.

Page 31 of 58
www.growthrateeconomicsinstitute.com
10. Calculate National Income and Personal Disposable Income from the
following: (Rs. Crore)
(i) Personal tax 150
(ii) Private final consumption expenditure 700
(iii) Private 600
(iv) Net factor income to abroad (-) 5
(v) Government final consumption expenditure 200
(vi) Net indirect tax 105
(vii) Net domestic capital formation 120
(viii) Net imports ( -)10
(ix) Corporation tax100
(x) Undistributed profits 20
Ans- NNPFC-�930 crore, PDI- �330 crore
KV-PRE-BOARD-1
Give the meaning of nominal GDP and real GDP.3
Machine purchased is always a final good; do you agree? Give reason for your answer.
Or
Distinguish between factor income and transfer receipt.3
From the following data relating to a firm, calculate its net value added at factor cost.3
(�In lakh)
(i) Subsidy 40
(ii) Sales 800
(iii) Depreciation30
(iv) Export100
(v) Closing stock 20
(vi) Opening stock 50
(vii) Intermediate purchase 500
(viii) Purchaseof machinery for own use200
(ix) Import of row material 60
Calculate Gross National Product at market price and personal disposable income from the following
data:
(Rs. core)
(i) Net national disposable income 1000
(ii) Saving of private corporation 40
(iii) Net current transfers from abroad 20
(iv) Indirect tax 100
Page 32 of 58
www.growthrateeconomicsinstitute.com
(v) Miscellaneous receipts of the govt. admin dept. 30
(vi) National debt interest 30
(vii) Corporation tax 90
(viii) Current transfers by government 50
(ix) Consumption of fixed capital 50
(x) Personal tax 110
(xi) Private income 700
(xii) Net factor income from abroad -60 6
KV-PRE-BOARD-2
Calculate gross domestic product at factor cost from the following data:
(Rs. Crore)
(i) Increase in stock30
(ii) Private final consumption expenditure 800
(iv) Net factor income to abroad 20
(v) Government final consumption expenditure 450
(vi) Net indirect tax 120
(vii) Gross fixed capital formation 170
(viii) Net imports ( -)30
How will you treat the following while estimating National Income of India? Give reasons for
youranswer.
(i) Purchase by foreign tourist.(it is included as it generates income for people in domestic market)
(ii) Profits earned by a branch of an Indian bank in Canada.
(iii) Scholarship given to Indian students studying in India by a foreign company.
Or
Explain the problem of double counting in estimating national income, with the help of an example.
Also explain two alternative ways of avoiding the problem.
From the following data calculate (a) gross domestic product at market price ,and (b) factor income
from abroad:
(Rs. core)
Page 33 of 58
www.growthrateeconomicsinstitute.com
(i) Gross national product at factor cost 6150
(ii) Net exports -50
(iii) Compensation of employees 3000
(iv) Rent800
(v) Interest 900
(vi) Profit 1300
(vii) Net indirect tax 300
(viii) Net domestic capital formation 800
(ix) Gross fixed capital formation 850
(x) Dividends 300
(xi) Change in stock 50
(xii) factor income to abroad 80
Ans- GDPMP-�6400, FIFA-�30
Important question:
1. State whether the following statements are true or false. Give reasons for your answer:
a. Capital formation is a flow.
b. Bread is always a consumer good.
c. Nominal GDP can never be less than real GDP.
d. Gross domestic capital formation is always greater than gross fixed capital
formation.
CBSE QUESTION QUESTIONS (2004 ONWARDS)
1. Is the study of cotton textile industry a macro economic study or a micro economic
study?
2. Give two examples of Macro Economic studies.
3. What is macro economics?
4. Give an example of a microeconomics?
5. Give two examples of microeconomic study.
Page 34 of 58
www.growthrateeconomicsinstitute.com
6. Why is the study of problem of unemployment in India considered a Macro Economic
study?
7. Is the study of general price level a macro economic study?
1. Calculate Gross National Disposal Income from the following data:
Rs. (Crores)
(i) National income. 2,000
(ii) Net current transfers from rest of the world. 200
(iii) Consumption of fixed capital. 100
(iv) Net factor income from abroad. (-) 50
(v) Net indirect taxes. 250
(3 marks)
Ans. G.N.D.I. = GNPmp + NCT R/W
= (N.I. + CFC + NIT) + NCT R/W
= (2000 + 100 + 250) + 200
= 2350 + 200 = Rs. 2550.
2. Calculate Gross National Disposal Income from the following data:
Rs.
(Crores)
(i) Net national product of factor cost. 3,000
(ii) Net factor income from abroad. (-) 50
(iii) Consumption of fixed capital. 150
(iv) Net indirect taxes. 250
(v) Net current transfers from rest of the world. 300
(3 marks)
Ans. = Rs. 3700 crores.
Page 35 of 58
www.growthrateeconomicsinstitute.com
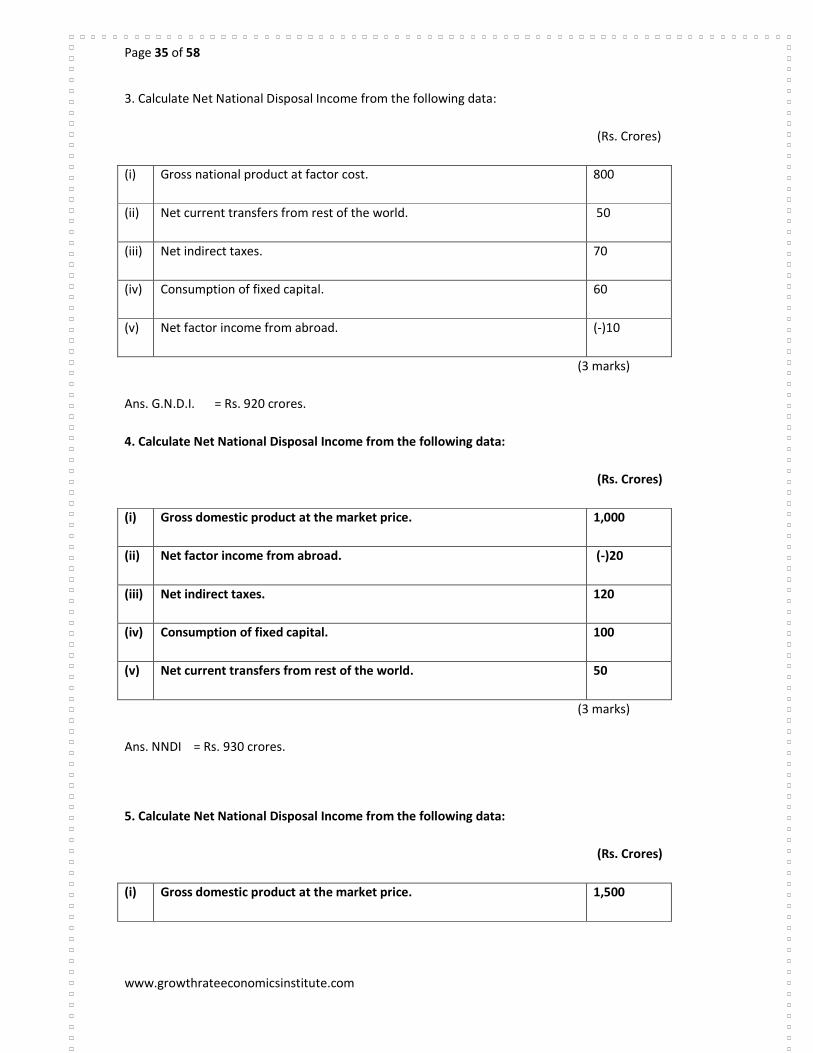
3. Calculate Net National Disposal Income from the following data:
(Rs. Crores)
(i) Gross national product at factor cost. 800
(ii) Net current transfers from rest of the world. 50
(iii) Net indirect taxes. 70
(iv) Consumption of fixed capital. 60
(v) Net factor income from abroad. (-)10
(3 marks)
Ans. G.N.D.I. = Rs. 920 crores.
4. Calculate Net National Disposal Income from the following data:
(Rs. Crores)
(i) Gross domestic product at the market price. 1,000
(ii) Net factor income from abroad. (-)20
(iii) Net indirect taxes. 120
(iv) Consumption of fixed capital. 100
(v) Net current transfers from rest of the world. 50
(3 marks)
Ans. NNDI = Rs. 930 crores.
5. Calculate Net National Disposal Income from the following data:
(Rs. Crores)
(i) Gross domestic product at the market price. 1,500
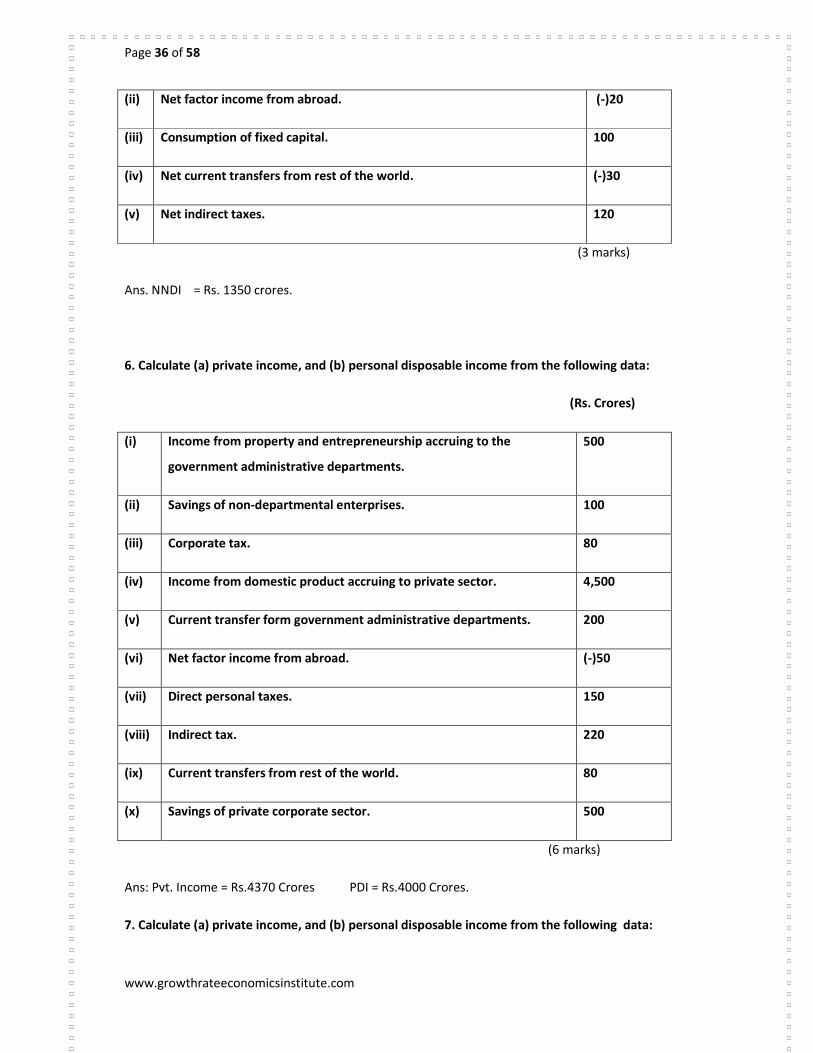
Page 36 of 58
www.growthrateeconomicsinstitute.com
(ii) Net factor income from abroad. (-)20
(iii) Consumption of fixed capital. 100
(iv) Net current transfers from rest of the world. (-)30
(v) Net indirect taxes. 120
(3 marks)
Ans. NNDI = Rs. 1350 crores.
6. Calculate (a) private income, and (b) personal disposable income from the following data:
(Rs. Crores)
(i) Income from property and entrepreneurship accruing to the
government administrative departments.
500
(ii) Savings of non-departmental enterprises. 100
(iii) Corporate tax. 80
(iv) Income from domestic product accruing to private sector. 4,500
(v) Current transfer form government administrative departments. 200
(vi) Net factor income from abroad. (-)50
(vii) Direct personal taxes. 150
(viii) Indirect tax. 220
(ix) Current transfers from rest of the world. 80
(x) Savings of private corporate sector. 500
(6 marks)
Ans: Pvt. Income = Rs.4370 Crores PDI = Rs.4000 Crores.
7. Calculate (a) private income, and (b) personal disposable income from the following data:
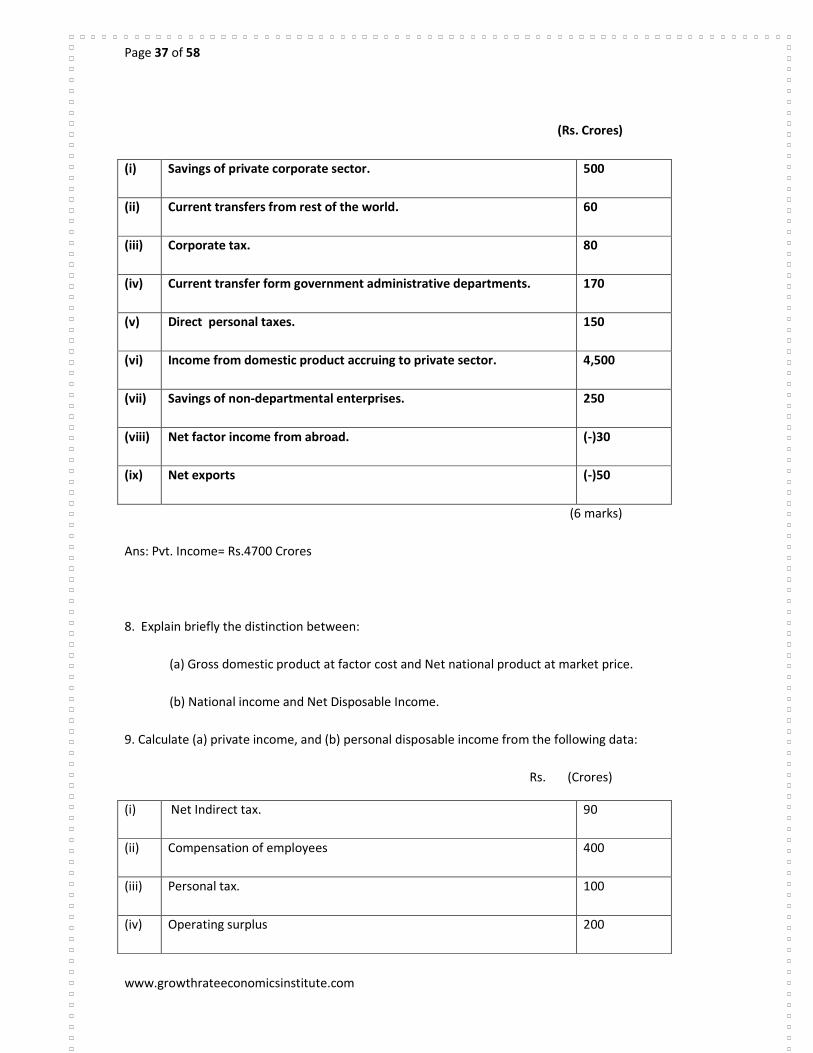
Page 37 of 58
www.growthrateeconomicsinstitute.com
(Rs. Crores)
(i) Savings of private corporate sector. 500
(ii) Current transfers from rest of the world. 60
(iii) Corporate tax. 80
(iv) Current transfer form government administrative departments. 170
(v) Direct personal taxes. 150
(vi) Income from domestic product accruing to private sector. 4,500
(vii) Savings of non-departmental enterprises. 250
(viii) Net factor income from abroad. (-)30
(ix) Net exports (-)50
(6 marks)
Ans: Pvt. Income= Rs.4700 Crores
8. Explain briefly the distinction between:
(a) Gross domestic product at factor cost and Net national product at market price.
(b) National income and Net Disposable Income.
9. Calculate (a) private income, and (b) personal disposable income from the following data:
Rs. (Crores)
(i) Net Indirect tax. 90
(ii) Compensation of employees 400
(iii) Personal tax. 100
(iv) Operating surplus 200
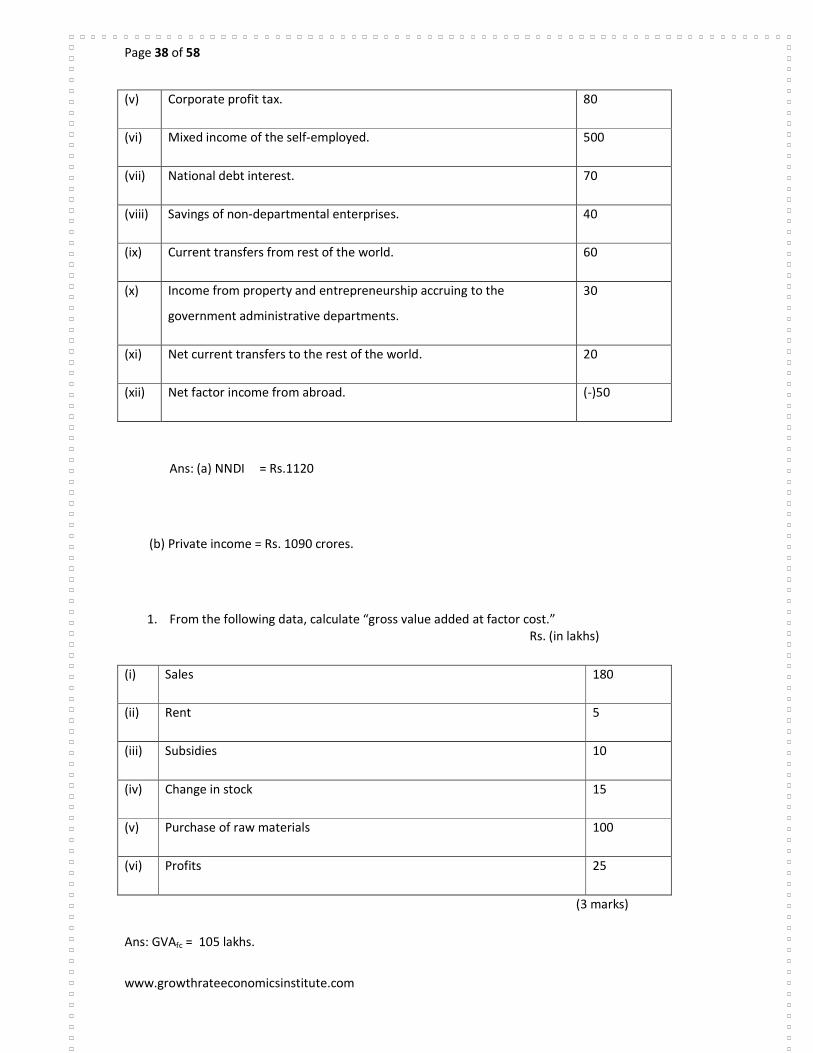
Page 38 of 58
www.growthrateeconomicsinstitute.com
(v) Corporate profit tax. 80
(vi) Mixed income of the self-employed. 500
(vii) National debt interest. 70
(viii) Savings of non-departmental enterprises. 40
(ix) Current transfers from rest of the world. 60
(x) Income from property and entrepreneurship accruing to the
government administrative departments.
30
(xi) Net current transfers to the rest of the world. 20
(xii) Net factor income from abroad. (-)50
Ans: (a) NNDI = Rs.1120
(b) Private income = Rs. 1090 crores.
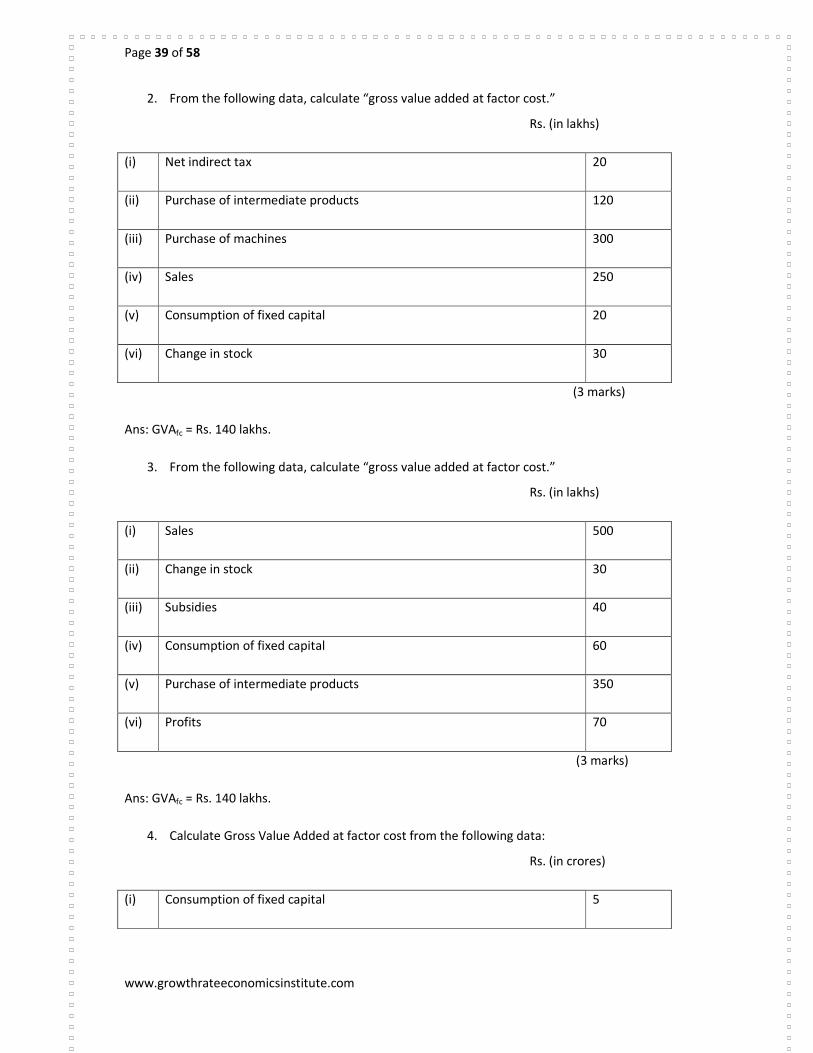
1. From the following data, calculate “gross value added at factor cost.”
Rs. (in lakhs)
(i) Sales 180
(ii) Rent 5
(iii) Subsidies 10
(iv) Change in stock 15
(v) Purchase of raw materials 100
(vi) Profits 25
(3 marks)
Ans: GVAfc = 105 lakhs.
Page 39 of 58
www.growthrateeconomicsinstitute.com
2. From the following data, calculate “gross value added at factor cost.”
Rs. (in lakhs)
(i) Net indirect tax 20
(ii) Purchase of intermediate products 120
(iii) Purchase of machines 300
(iv) Sales 250
(v) Consumption of fixed capital 20
(vi) Change in stock 30
(3 marks)
Ans: GVAfc = Rs. 140 lakhs.
3. From the following data, calculate “gross value added at factor cost.”
Rs. (in lakhs)
(i) Sales 500
(ii) Change in stock 30
(iii) Subsidies 40
(iv) Consumption of fixed capital 60
(v) Purchase of intermediate products 350
(vi) Profits 70
(3 marks)
Ans: GVAfc = Rs. 140 lakhs.
4. Calculate Gross Value Added at factor cost from the following data:
Rs. (in crores)
(i) Consumption of fixed capital 5

Page 40 of 58
www.growthrateeconomicsinstitute.com
(ii) Sales 100
(iii) Subsidies 2
(iv) Closing Stock 10
(v) Purchase of raw materials 50
(vi) Opening stock 15
(vii) Indirect tax 10
(3 marks)
Ans: GVAfc = Rs. 28 crores
5. Calculate Net Value Added at market price from the following data:
Rs. (in crores)
(i) Depreciation 5
(ii) Sales 100
(iii) Opening stock 22
(iv) Intermediate consumption 70
(v) Excise duty 10
(vi) Change in Stock (-)10
(3 marks)
Ans: NVAmp = Rs. 15 crores
6. From the following data about Firm ‘A’, calculate Net value added at market price by it:
Rs. (in crores)
(i) Sales 700
(ii) Change in stock 40
(iii) Depreciation 80
Page 41 of 58
www.growthrateeconomicsinstitute.com
(iv) Net Indirect tax 100
(v) Purchase of machines 250
(vi) Purchase of intermediate products 400
(3 marks)
Ans: NVAmp = Rs. 260 crores
7. Explain the following terms giving suitable examples:
(i) Final products.
(ii) Intermediate expenditure.
(iii) Transfer Payment.
1. Will the following be a part of domestic factor of India? Give reasons for your answers.
(i) Factor income from abroad.
(ii) Salaries to Indian residents working in Russian Embassy in India.
(ii) Profits earned by a company in India, which is owned by a non – resident.
Ans. (i) Old age pension is not a part of domestic income because no factor service is
rendered in return.
(ii) Factor income from abroad is not a part of domestic income because it is earned by
the residents from outside the economic (domestic) territory.
(iii) Salaries to Indian residents by the Russian embassy is not a part of domestic product
of India because the income is created within the economic (domestic) territory of
India.
Page 42 of 58
www.growthrateeconomicsinstitute.com
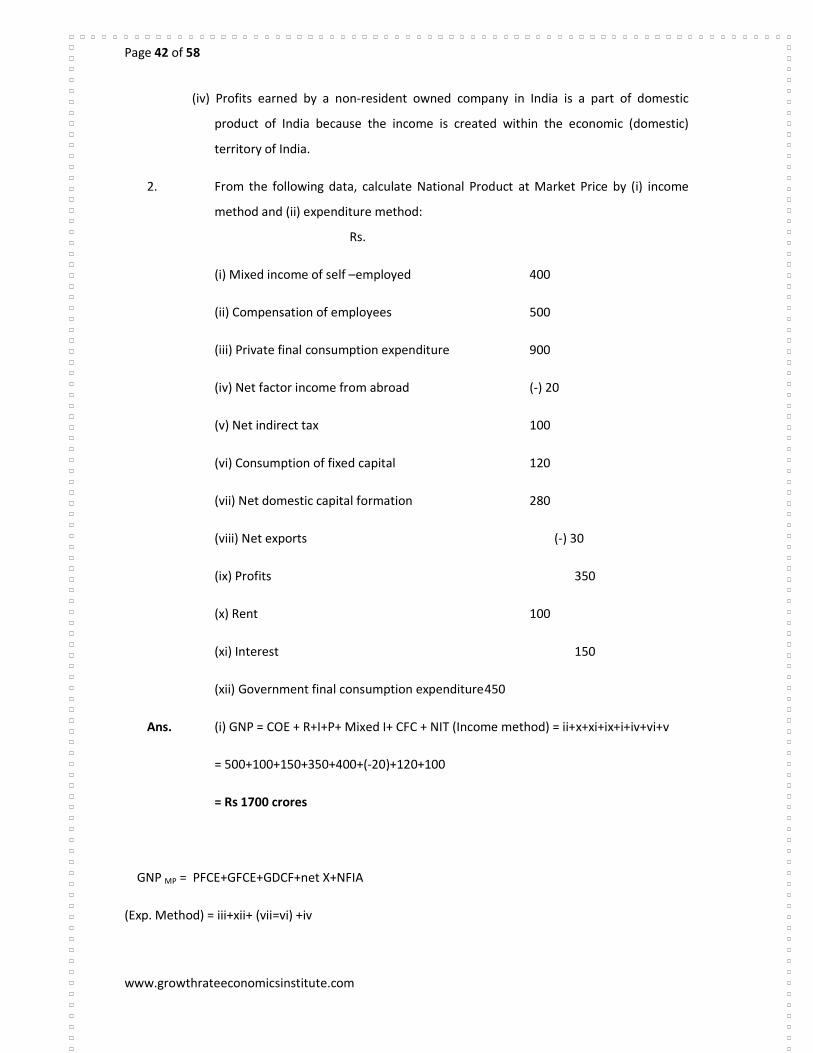
(iv) Profits earned by a non-resident owned company in India is a part of domestic
product of India because the income is created within the economic (domestic)
territory of India.
2. From the following data, calculate National Product at Market Price by (i) income
method and (ii) expenditure method:
Rs.
(i) Mixed income of self –employed 400
(ii) Compensation of employees 500
(iii) Private final consumption expenditure 900
(iv) Net factor income from abroad (-) 20
(v) Net indirect tax 100
(vi) Consumption of fixed capital 120
(vii) Net domestic capital formation 280
(viii) Net exports (-) 30
(ix) Profits 350
(x) Rent 100
(xi) Interest 150
(xii) Government final consumption expenditure 450
Ans. (i) GNP = COE + R+I+P+ Mixed I+ CFC + NIT (Income method) = ii+x+xi+ix+i+iv+vi+v
= 500+100+150+350+400+(-20)+120+100
= Rs 1700 crores
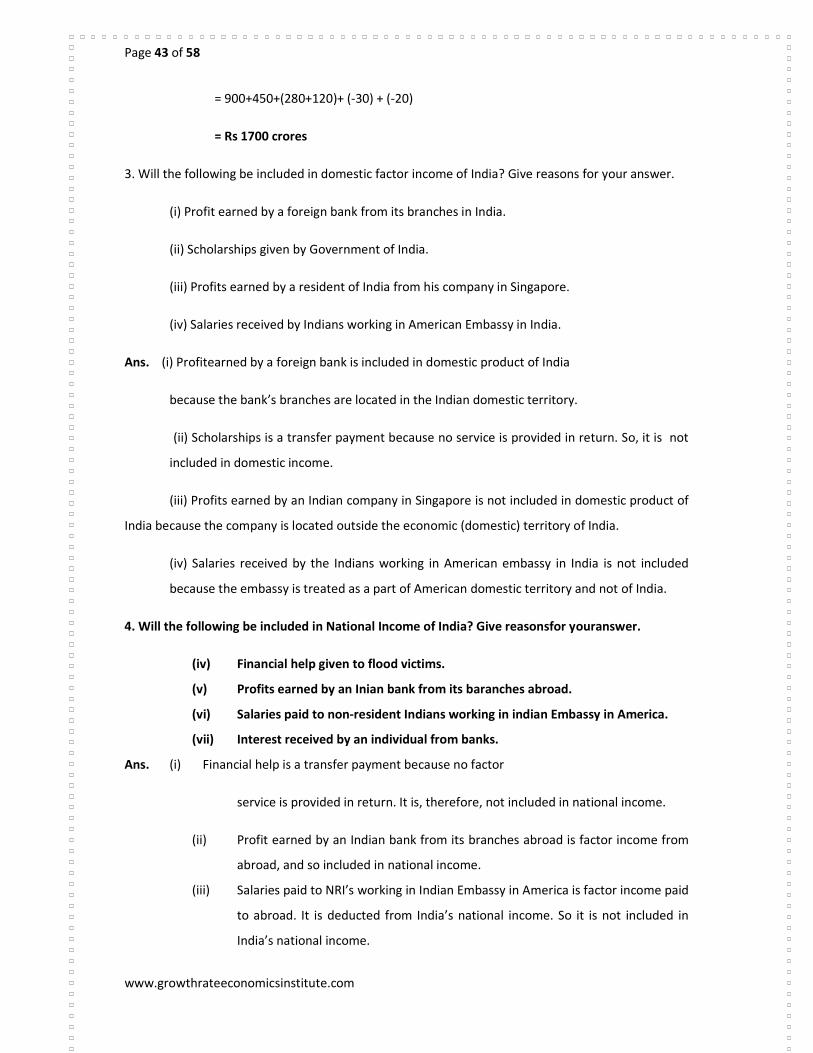
GNP MP = PFCE+GFCE+GDCF+net X+NFIA
(Exp. Method) = iii+xii+ (vii=vi) +iv
Page 43 of 58
www.growthrateeconomicsinstitute.com
= 900+450+(280+120)+ (-30) + (-20)
= Rs 1700 crores
3. Will the following be included in domestic factor income of India? Give reasons for your answer.
(i) Profit earned by a foreign bank from its branches in India.
(ii) Scholarships given by Government of India.
(iii) Profits earned by a resident of India from his company in Singapore.
(iv) Salaries received by Indians working in American Embassy in India.
Ans. (i) Profitearned by a foreign bank is included in domestic product of India
because the bank’s branches are located in the Indian domestic territory.
(ii) Scholarships is a transfer payment because no service is provided in return. So, it is not
included in domestic income.
(iii) Profits earned by an Indian company in Singapore is not included in domestic product of
India because the company is located outside the economic (domestic) territory of India.
(iv) Salaries received by the Indians working in American embassy in India is not included
because the embassy is treated as a part of American domestic territory and not of India.
4. Will the following be included in National Income of India? Give reasonsfor youranswer.
(iv) Financial help given to flood victims.
(v) Profits earned by an Inian bank from its baranches abroad.
(vi) Salaries paid to non-resident Indians working in indian Embassy in America.
(vii) Interest received by an individual from banks.
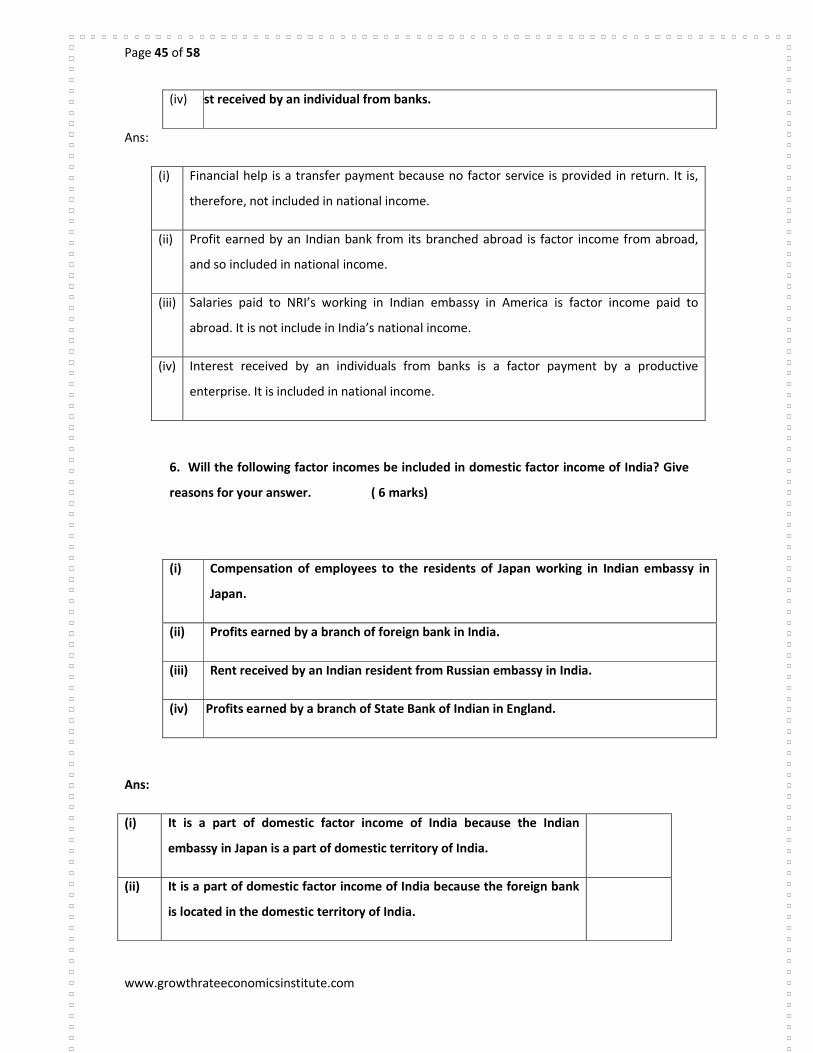
Ans. (i) Financial help is a transfer payment because no factor
service is provided in return. It is, therefore, not included in national income.
(ii) Profit earned by an Indian bank from its branches abroad is factor income from
abroad, and so included in national income.
(iii) Salaries paid to NRI’s working in Indian Embassy in America is factor income paid
to abroad. It is deducted from India’s national income. So it is not included in
India’s national income.
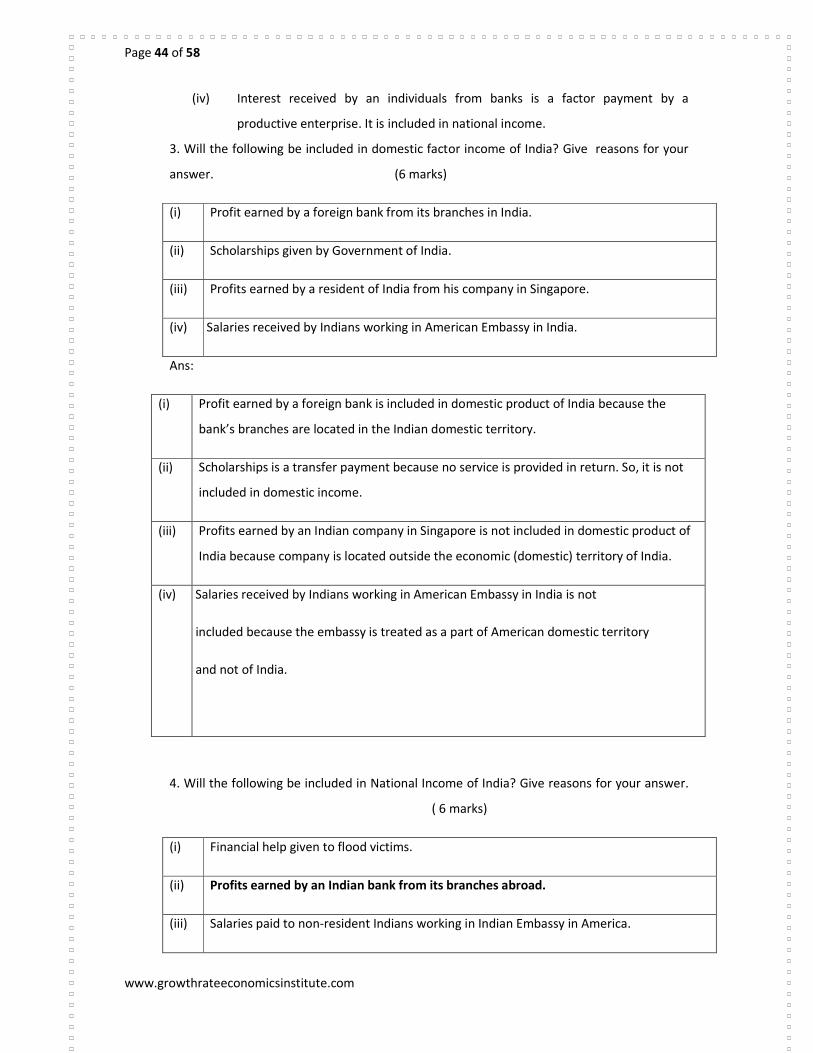
Page 44 of 58
www.growthrateeconomicsinstitute.com
(iv) Interest received by an individuals from banks is a factor payment by a
productive enterprise. It is included in national income.
3. Will the following be included in domestic factor income of India? Give reasons for your
answer. (6 marks)
(i) Profit earned by a foreign bank from its branches in India.
(ii) Scholarships given by Government of India.
(iii) Profits earned by a resident of India from his company in Singapore.
(iv) ssssS Salaries received by Indians working in American Embassy in India.
Ans:
(i) Profit earned by a foreign bank is included in domestic product of India because the
bank’s branches are located in the Indian domestic territory.
(ii) Scholarships is a transfer payment because no service is provided in return. So, it is not
included in domestic income.
(iii) Profits earned by an Indian company in Singapore is not included in domestic product of
India because company is located outside the economic (domestic) territory of India.
(iv) ssssS Salaries received by Indians working in American Embassy in India is not
included because the embassy is treated as a part of American domestic territory
and not of India.
4. Will the following be included in National Income of India? Give reasons for your answer.
( 6 marks)
(i) Financial help given to flood victims.
(ii) Profits earned by an Indian bank from its branches abroad.
(iii) Salaries paid to non-resident Indians working in Indian Embassy in America.
Page 45 of 58
www.growthrateeconomicsinstitute.com
(iv) Interest received by an individual from banks.
Ans:
(i) Financial help is a transfer payment because no factor service is provided in return. It is,
therefore, not included in national income.
(ii) Profit earned by an Indian bank from its branched abroad is factor income from abroad,
and so included in national income.
(iii) Salaries paid to NRI’s working in Indian embassy in America is factor income paid to
abroad. It is not include in India’s national income.
(iv) Interest received by an individuals from banks is a factor payment by a productive
enterprise. It is included in national income.
6. Will the following factor incomes be included in domestic factor income of India? Give
reasons for your answer. ( 6 marks)
(i) Compensation of employees to the residents of Japan working in Indian embassy in
Japan.
(ii) Profits earned by a branch of foreign bank in India.
(iii) Rent received by an Indian resident from Russian embassy in India.
(iv) Prod Profits earned by a branch of State Bank of Indian in England.
Ans:
(i) It is a part of domestic factor income of India because the Indian
embassy in Japan is a part of domestic territory of India.
(ii) It is a part of domestic factor income of India because the foreign bank
is located in the domestic territory of India.
Page 46 of 58
www.growthrateeconomicsinstitute.com
(iii) It is not a part of domestic income of India because Russian embassy in
India is not a part of domestic territory of India.
UNIT-3 DETERMINATION OF INCOME AND EMPLOYMENT
C.B.S.E. QUESTIONS (2011)
SET-1
1. Given that national income is Rs.80 crore and consumption expenditure Rs.64 crore,
find out average propensity to save. When income rises to Rs.100 crore and
consumption expenditure to Rs.78 crore, what will be the average propensity to
consume and the marginal propensity to consume? 3 (Ans-APS-.2,APC-.78, MPC-.7)
2. Explain the relationship between investment multiplier and marginal propensity to
consume. 3
3. Explain the role of the following in correcting 'deficient demand' in an economy:
(i) Open market operations.
(ii) Bank rate.
OR 4. Explain the role of the following in correcting 'excess demand' in an economy:
(i) Bank rate.
(ii) Open market operations. 6
SET-2
1. In an economy the marginal propensity to consume is 0.75. Investment expenditure
in the economy increases by Rs. 75 crore. Calculate the total increase in national
income. 3(Ans- ∆Y300)
2. Explain the distinction between voluntary and involuntary unemployment. 3
3. Explain the role of the following in correcting the inflationary gap in an economy: 6
(i) Legal reserves
(ii) Bank rate
OR
4. Explain the role of the following in correcting the deflationary gap in an economy: 6
(i) Open market operations
(ii) Margin requirements SET-3
1. An economy is in equilibrium. Its consumption function is
C=300+0.8Y where C is consumption expenditure and Y is income and investment
is�700.find national income.3
2. Explain the role of the following in correcting 'deficient demand' in an economy:
(i) Legal reserves
(ii) Government expenditure
Page 47 of 58
www.growthrateeconomicsinstitute.com
OR
3. Explain the role of the following in correcting the inflationary gap in an economy: 6
(i) Open market operations.
(ii) Government expenditure
KV-PRE-BOARD-1
1. What is the relationship between average propensity to
consume and average propensity to save? 1
2. What are the two components of aggregate supply?1
3. In an economy, MPS is 0.25. If investment expenditure is
increased by �500 crore. Calculate the total increased in income and consumption
expenditure.
OR
Explain the working of multiplier with the help of table.4
4. Given below is the consumption function an economy
C=100+0.5Y. with the help of numerical example show that in this economy as income
increases APC will decrease.
OR
Explain the inflationary gap with the help of diagram .also describe two fiscal measures to
solve this problem.6
KV-PRE-BOARD-2
1. If MPC 0.9, what is the value of the multiplier.1
2. If saving greater than the investment, what will be its effect on
national income?1
3. Giving reasons, state whether the following statements are
true or false:
a. If the ratio of marginal propensity to consume and marginal propensity to save is
4:1, the value of investment multiplier will be 4.(K=5)
b. Sum of average propensity to consume and marginal propensity to consume is
always equal to 1.(no) 4
4. In an economy the equilibrium level of income is �12000crore. The ratio of MPC and
MPS is 3:1. Calculate the additional investment needed to reach a new equilibrium level of
income of �20,000crore.(MPC= .75, ΔI=2000) 6
CBSE EXAMINATION QUESTIONS (2004 ONWARDS)
Is underemployment equilibrium possible? When does it happen?
Why APC is always more than MPC , Why?
Can the value of MPC be greater than one.( no , it is equal to one when change in
consumption is equal to change in income)
Can the value of APC be greater than one.(consumption more than incone)
Can the value of APS be negative.(consumption more than income)
1. Distinguish between Average Propensity to Consume and marginal Propensity to consume.
The value of which of these two can be greater than one and when?
Page 48 of 58
www.growthrateeconomicsinstitute.com
2. Give meaning of marginal propensity to save. Can the value of average propensity to save be
negative? If yes, when
3. Distinguish between average propensity to consume and marginal propensity to consume
with the help of numerical examples.
4. Define aggregate demand. State its components.
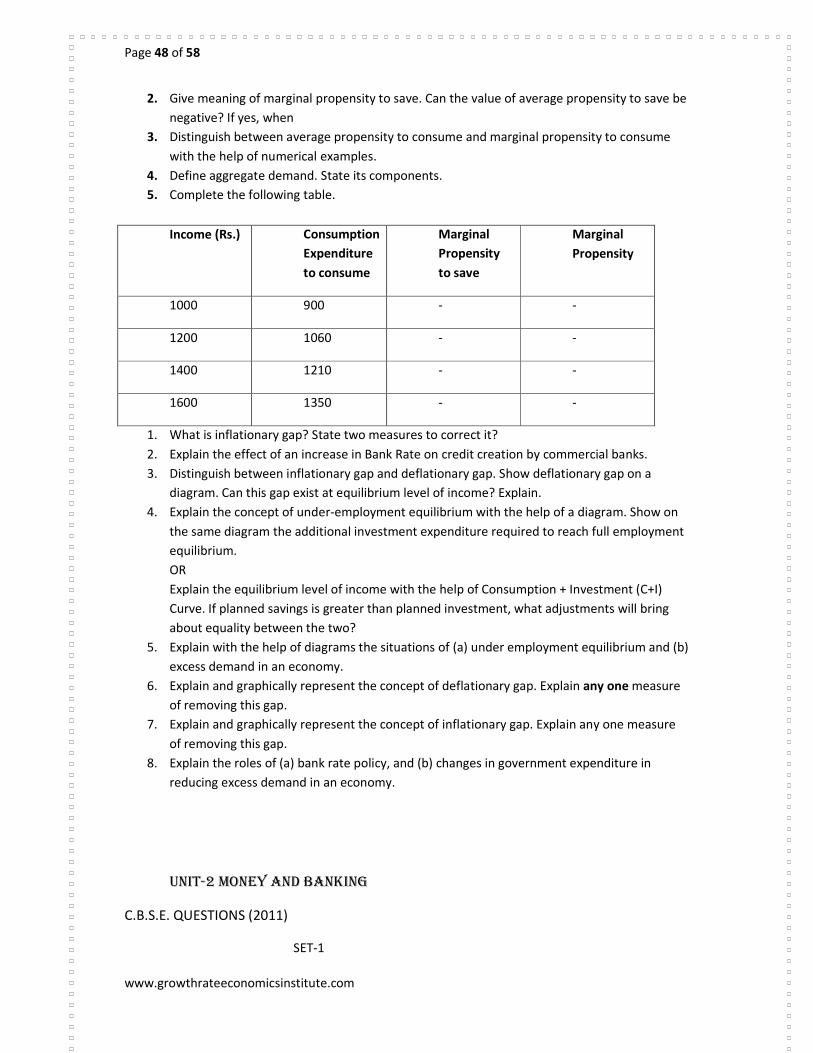
5. Complete the following table.
Income (Rs.) Consumption
Expenditure
to consume
Marginal
Propensity
to save
Marginal
Propensity
1000 900 - -
1200 1060 - -
1400 1210 - -
1600 1350 - -
1. What is inflationary gap? State two measures to correct it?
2. Explain the effect of an increase in Bank Rate on credit creation by commercial banks.
3. Distinguish between inflationary gap and deflationary gap. Show deflationary gap on a
diagram. Can this gap exist at equilibrium level of income? Explain.
4. Explain the concept of under-employment equilibrium with the help of a diagram. Show on
the same diagram the additional investment expenditure required to reach full employment
equilibrium.
OR
Explain the equilibrium level of income with the help of Consumption + Investment (C+I)
Curve. If planned savings is greater than planned investment, what adjustments will bring
about equality between the two?
5. Explain with the help of diagrams the situations of (a) under employment equilibrium and (b)
excess demand in an economy.
6. Explain and graphically represent the concept of deflationary gap. Explain any one measure
of removing this gap.
7. Explain and graphically represent the concept of inflationary gap. Explain any one measure
of removing this gap.
8. Explain the roles of (a) bank rate policy, and (b) changes in government expenditure in
reducing excess demand in an economy.
UNIT-2 MONEY AND BANKING
C.B.S.E. QUESTIONS (2011)
SET-1
Page 49 of 58
www.growthrateeconomicsinstitute.com
1. Define money supply.1
2. Define cash reserve ratio.1
3. Explain the process of money creation by the commercial banks with the help of a
numerical example. 6
SET-2
1. Define money. 1
2. Define 'Statutory Liquidity Ratio'. 1
3. Explain the following functions of the central bank: 6
(i) Bank of issue
(ii) Bankers' bank 4
SET-3
1. Define legal reserve ratio. 1
2. What are demand deposits? 1
3. How do commercial banks create credit? 6
KV-PRE-BOARD-1
1. What are the components of money supply? 1
2. What will be the effect on a rise in the bank rate on money supply?1
3. Explain the following monetary measures to control the credit in the economy by central
bank: 6
(i) Cash reserve ratio
(ii) Open market operation
KV-PRE-BOARD-2
1. What is meant by cash reserve ratio? 1
2. What will be the effect of decrease in bank rate on money supply? 1
3. Distinguished between money value of money and commodity value of money? 3
4. How does a commercial bank create money?
Or
Explain how do ‘open market operations’ by the central bank affect money creation by
commercial banks.3
CBSE EXAMINATION QUESTIONS (2004 ONWARDS)
1. Define money supply.
2. Briefly explain any two functions of money.
3. State the four functions of money. Describe any one.
4. Explain the store of value function of money.
5. Explain any one problem faced in the barter system. How has money solved this problem?

Page 50 of 58
www.growthrateeconomicsinstitute.com
6. Explain the unit of value functions of money.
7. State any three methods by which a central bank tries to control the quantity of credit.
8. Explain any one of the following functions of a central bank.
a. Currency authority, and (ii) lender of last resort.
9. How does a central bank control the availability of credit by open market operations?
10. State of any four functions of a commercial bank. Describe any one.
11. How does a central bank perform the function of controller of credit?
12. Explain the meaning and any one function of a commercial bank.
13. Describe the banker to the government function of the central bank.
14. Distinguish between a commercial bank and central bank.
UNIT =4 GOVERNMENT BUDGET AND ECONOMY
C.B.S.E. QUESTIONS (2011)
SET-1
1. Explain the ‘redistribution of income’
objective of government budget.
Or
Explain the ‘economy stability’ objective of government budget. 4
2. From the following data about a government budget find: 4
a. Revenue deficit.
b. Fiscal deficit and
c. Primary deficit
Items ₹in Arab
Tax revenue 47
Capital receipts 34
Non-tax revenue 10
Borrowing 32
Revenue expenditure 80
Interest payments 20
Ans = rd=₹23 arab, fd= ₹21 arab, p.d= ₹1 arab
CBSE EXAMINATION QUESTIONS ( 2004 ONWARDS)
1. A government budget shows a primary deficit of Rs. 4,400 crores. The revenue expenditure on
interest payment is Rs 400 crores. How much is the fiscal deficit?
2. Define fiscal deficit.
Page 51 of 58
www.growthrateeconomicsinstitute.com
3. What is meant by revenue deficit?
4. In a government budget revenue deficit is Rs 50000 crores and borrowings are Rs 75000 crores.
How much is the fiscal deficit?
5. In a government budget revenue deficit is Rs 50000 crores and borrowing is Rs 75000 crores. How
much is the fiscal deficit?
6. Define a tax.
7. What is a government budget?
8. Why are borrowing treated as capital receipts?
9. Why is recovery of loans is treated as capital receipts?
10. Why is repayment of loan treated as capital expenditure?
11. Why is payment of interest a revenue expenditure?
12. Why are subsidies treated as revenue expenditure?
13. Give two examples of non-tax revenue receipts.
14. What is a government budget Name two sources each of non-tax revenue receipts and capital
receipts.
15. What is meant by revenue deficit? What are the implications of this deficit?
16. What is the basis of classifying government receipts into revenue receipts and capital receipts.
Give an example of each.
17. State any three objectives of a government budget.
18. Define a tax. Give two examples each of direct taxes and indirect taxes.
19. Define a government budget. State any four of its main objectives.
20. What is the basis of classifying government expenditure into
(i) Revenue expenditure and capital expenditure.
(ii) Plan expenditure and non-pan expenditure.
21. Explain briefly any two objectives of a government budget.
22. Distinguish between revenue receipts and capital receipts in a government budget. Give two
examples of each.
23. Give meaning any implications of revenue deficit in a government budget.
24. Giving reasons, categories the following into revenue receipts and capital receipts:
Page 52 of 58
www.growthrateeconomicsinstitute.com
(i) Recovery of loans
(ii) Corporation tax
(iii) Dividends on investments made by government.
(iv) Sale of a public sector undertaking.
25. Giving reasons, categories the following into revenue expenditure and capital expenditure.
(i) Subsidies
(ii) Grants given to State Governments.
(iii) Repayment of loans
(iv) Construction of school building.
26. Giving reasons, categorize the following into direct tax and indirect tax:
(i) Corporation tax
(ii) Sales tax
(iii) Wealth tax
(iv) Service tax
27. Explain the concept of revenue deficit to a government budget. What does this deficit indicate?
28. What does fiscal deficit in a government budget mean? What are its implications?
UNIT=4UNIT=4UNIT=4UNIT=4 BALANCE OF PAYMENTS BALANCE OF PAYMENTS BALANCE OF PAYMENTS BALANCE OF PAYMENTS
CBSE EXAMINATION (FOREIGN EXCHANGE RATE)
1. What is meant by foreign exchange rate?
2. What is meant by appreciation of currency?
3. State four sources each of demand and supply of foreign exchange.
4. How is foreign exchange rate determined? Explain with the help of a diagram.
Page 53 of 58
www.growthrateeconomicsinstitute.com
5. What is meant by foreign exchange rate? Why a rise in exchange rate does causes a rise in
its supply?
6. What is meant by foreign exchange rate? List three sources each of demand and supply of
foreign exchange in a country?
7. Define foreign exchange rate. Why does the demand for foreign exchange rise when its price
falls?
8. Why is supply curve of foreign exchange positively sloped?
CBSE QUESTIONS (2004 onwards) BALANCE OF PAYMENT
1. The balance of trade shows a deficit of Rs 5000 crores and the values of imports are Rs 9000
crores. What is value of exports?
2. The balance of trade shows a deficit of Rs 3000 crores.
The values of exports are Rs 500 crores. What is the value of imports?
3. When will there be a surplus in balance of trade?
4. Which two transactions determine balance of trade?
5. When will a balance of trade show a deficit?
6. What is the balance of visible items in the balance of payments account called?
7. What does balance of payment account record?
8. What is meant by balance of payments account?
9. What is the difference between the value of exports of goods and the value of imports of
goods called?
10. What does a deficit in the balance of trade indicate?
11. State any four items each of current account and capital account of the balance of payments
account.
12. Distinguish between current account and capital account of balance of payments account.
Mention any two transactions of capital account.
13. What is balance of payments account? Name three components each of its current account
and capital account.
14. What is meant by visible and invisible items in the balance of payments account? Give two
examples of invisible items.
Page 54 of 58
www.growthrateeconomicsinstitute.com
15. State any four items each of current account and capital account of the balance of payments
account.
16. Distinguish between current account and capital account of balance of payments account.
Mention any two transactions of capital account.
17. What is balance of payments account? Name three components each of its current account
and capital account.
18. What is meant by visible and invisible items in the balance of payments account? Give two
examples of invisible items.
APPLICATION AND VALUE BASED QUESTION
MICRO ECONOMICS
Note:- Q1 to Q7 carry the weightage of 1 marks each and from Q8 to Q20 carry the weightage of 3/4
Page 55 of 58
www.growthrateeconomicsinstitute.com
marks each
Ques1. In an underdeveloped economy why there is the need of efficient utilization of resources?
Ques 2. A farmer is getting more profit in producing opium than in production of wheat. In the
situation of famine which crop should be produced?
Ques3. Why has the power crisis increased in India?
Ques 4. According to law of demand by increasing the price of a good its demand decreases but in
the case of petrol, its demand is increasing with increase in price why? Explain.
Ques5. Inspite of having monopoly, Why the Indian Railway has not increased the fare for many
years?
Ques 6. The market price of sugar rises when its demand increases. How the supply of sugar can be
changed so that price of sugar remain constant?
Ques7. Although there are few (more than one) firms in oligopoly. Even these firms can enjoy
monopoly power. How?
Ques 8. How can the productivity of Human resources be increased?
Ques 9. What efforts should be made in an economy for the continuous use of exhaustible natural
resources in production?
Ques 10. There are various sources of income a teacher has such as
1. He can earn Rs 40000 from teaching in school.
2. He can earn Rs 50000 by tuition/coaching
3. He earns Rs 60000 by writing help book guides.
What is the opportunity cost of teaching in school? Why should he choose teaching profession?
Ques 11- How is the law of diminishing marginal utility applied with regard to education/
knowledge?
Ques12- The demand of electricity is increasing but due to scarcity of resources its supply cannot be
increased. Give any two measures how the demand of electricity can be decreased?
Ques13. Even the price of petrol is very high but still its demand is very high. How can the demand of
petrol be decreased?
Ques 14. A manager of zoo wants to increase the revenue, which measure is more appropriate
i. Increase the entry fee
Page 56 of 58
www.growthrateeconomicsinstitute.com
ii. Decrease the entry fee. Explain?
Ques15. Even the contribution of plastic industry in GDP is more then why it is not considered an
Index of social welfare?
Ques16. Explain the effects on the market equilibrium by imposing ban on the sale of GUTKA in
Delhi?
Ques17. How can the tax policy of Govt be effective in controlling the supply of LIQUOR like harmful
product?
Ques 18. In a situation of fall in the sale of Ice-Cream, the Ice-Cream producer would like to reduce
the production. What factors of production fixed or variable will be reduced by him? Explain with
reasons.
Ques 19. Availability of agricultural land (fixed factor) is limited in the world, but demand of food
grain incontinuously increasing, is it possible to increase the supply of food grains by continuously
increasing
variable factors like seeds, fertilizers etc. explain?
Ques 20. The demand for cooking gas is not falling inspite of regular hike in the price of cooking gas.
What will be the elasticity of demand for cooking gas. Explain giving suitable reasons in support of
your answer.
PART-II MACRO ECONOMICS
Note:- Q1 to Q6 carry the weightage of 1 marks each and from Q7 to Q25 carry the weightage of 3/4
marks each
Ques1. Why comparing the GDP of various nations might not tell you which nation is better off?
Page 57 of 58
www.growthrateeconomicsinstitute.com
Ques 2. Compensation to flood victims is a good social security measure by the Govt. But why it is
not included in the estimation of national income?
Ques3. GDP Calculation do not directly include the social costs of environmental damages for
example global warming, acid rain. Do you think these costs should be included in GDP? Why or Why
not?
Ques4. Why did India devalue its currency in 1991?
Ques5. Do you think that a rise in BPO services a good source of supply of foreign currency?
Ques6. Suppose the present foreign exchange rate is 1$= Rs50 and if it falls to 1$=Rs60 should
central bank intervene in the foreign exchange rate?
Ques7. Why do non market economic activities like
1. Services of housewives
2. Voluntary services
3. Leisure time activities
help in the flow of goods and services of a country. But why these are not included in the estimation
of national income?
Ques 8. GDP growth rate in India for the last few years is more than 6% but still more than 28% of
population is lying below poverty line. Explain any two factors responsible for it.
Ques9. In the situation of inflation credit creation by commercial bank is beneficial for the bank but
it explains its negative impact on economy?
Ques10. In Indian market, money supply is the reason of rising price level. Explain any one measure
of central bank to control money supply?
Ques11. Why is the use of money more convenient for exchange than barter system. Explain?
Ques 12. Suppose all the customers of a commercial bank demand for their deposits at the same
time then how does central bank help to commercial bank in this situation.
Ques 13. Why do all the compensation in form of money than toys more convenient to an employee
working in toy manufacturing factory?
Ques14. Excess money supply is necessary for rapid economic development but it creates
inflationary
situation. Write any two fiscal measures to control inflationary situation.
Ques15. Saving provides economics security in future but why it is not good from the viewpoint of
investment multiplier?

Page 58 of 58
www.growthrateeconomicsinstitute.com
Ques 16. Why do the consumption expenditure of involuntary unemployed worker not zero, even at
zero level of income?
Ques17. What impacts will be on economy when there is planned investment is less than planned
saving? What steps should be taken by the govt to maintain equilibrium in the economy.
Ques 18. Increase in money supply is an effective measure to control economic depression but it
creates the burden of borrowing on economy. Explain any two measures by which economic
depression can be controlled even in the situation of increase in money supply.
Ques 19. In India unemployment is a major problem, if aggregate demand is equal to aggregate
supply, can it be called a situation of equilibrium?
Ques20. In India a majority of population is lying below poverty line due to inequality of ‘Income and
Wealth’ . How can budget be helpful in solving this problem?
Ques21. There has been consistent rise in prices of fruits and vegetables in Delhi for sometimes.
Which measures of budget will you support to reduce the prices of these commodities?
Ques22. Budget deficit creates disequilibrium in every economy but in developing countries like
India, why does Govt depend on it?
Ques23. Should a current account deficit be a cause for alarm? Explain.
Ques24. What impact will fall on the expenditure of an American citizen who comes to India for
Medical treatment if foreign rate is increased?