Micro Earthquake Survey Design, Optimization with modeling
45
Solo, 13 - 16 October 2014 “Micro Earthquake Survey Design, Optimization with modeling” “PIT2014-1022” Name : Firman Syaifuddin Date/Place of Birth : 11-09-1984/ Jakarta Institution / Afiliation : Institut Teknologi Sepuluh Nopember (ITS) Educations Background : - Master Degree at Teknik Geofisika Institut Teknologi Bandung (ITB) - Undergraduate Degree at Geofisika Meteorologi Institut Teknologi Bandung (ITB)
-
Upload
firman-syaifuddin -
Category
Science
-
view
60 -
download
0
Transcript of Micro Earthquake Survey Design, Optimization with modeling
Solo, 13 - 16 October 2014
“Micro Earthquake Survey Design, Optimization with modeling”
“PIT2014-1022”
Name : Firman Syaifuddin
Date/Place of Birth : 11-09-1984/ Jakarta
Institution / Afiliation : Institut Teknologi Sepuluh Nopember (ITS)
Educations Background : - Master Degree at Teknik Geofisika
Institut Teknologi Bandung (ITB)
- Undergraduate Degree at Geofisika Meteorologi
Institut Teknologi Bandung (ITB)

PIT HAGI Solo 2014

PIT HAGI Solo 2014

PIT HAGI Solo 2014
Exploration geothermal is one important things in
geothermal industry.
Geophysical prospect generation commonly use potential
and electrical method as preliminary survey.
MicroEarthquake survey used as tools for monitoring effect
of injection well in development stage
MEQ survey can be uses as validation and verification of
our geothermal reservoir geometry or body in the
exploration stages.
Possible to optimizing MEQ survey to get better data with
survey design and modeling the best location of our tools
to record the MEQ event related to the hydrothermal
system in geothermal plays.

PIT HAGI Solo 2014

PIT HAGI Solo 2014

PIT HAGI Solo 2014
PIT HAGI Solo 2014
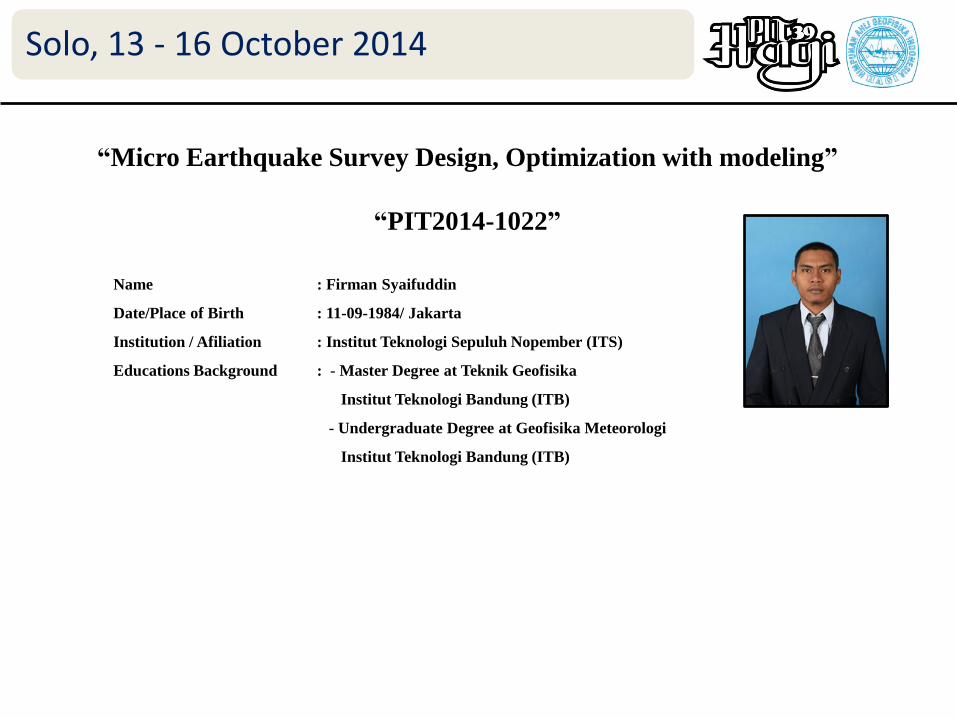
What kind information given by microearthquakes records in the
geothermal/ hydrothermal system :
• Fracture structure map by seismicity
• Hydrologic structure details defined
• Induced seismicity affected by man made activities (i.e injection.)

PIT HAGI Solo 2014
The identification of micro
earthquakes (MEQ) with Richter
magnitude range: 1 to 3 in a
prospective geothermal area is a
means to investigate and characterize
modern tectonic activity and volcanic
areas.
Such activity is frequently related to
major hydrothermal convection
systems including active faulting and
fracturing in the subsurface, and also
the base of the brittle/ductile transition
above a heat source (Ward, 1972;
Wright et al., 1985; Manzella, 2000;
Chan, 2013).

PIT HAGI Solo 2014
• Station Distribution
For an effective microearthquake network (permanent or temporary), which can
provide reliable data for earthquake location, the station sites should be evenly
distributed by azimuth and distance. The maximum azimuthal gap between the
stations should be less than 180°, and the distance between the stations should not
be more than twice the average focal depth of the earthquakes. Optimal distribution of
stations has been studied by Sato and Skoko (1965) and Uhrhammer (1980),
• Site Selection
There are various constraints in site selection, which affect station distribution If
seismic noise is high, benefit of modern instrument is lost and poor detection will
result. If stations are situated on soft ground, even Broad Band or very broadband
records will be useless and Short Period responses will not be interpretable due to
local noises.

PIT HAGI Solo 2014

PIT HAGI Solo 2014
Hydrothermal convection systems creates seismic source.
Seismic velocity and Resistivity has good correlation (faust 1951).
Our resistivity data extracted from MT survey have good quality.
Seismic wave modeling used 2D elastic wave modeling in lateral
average velocity model
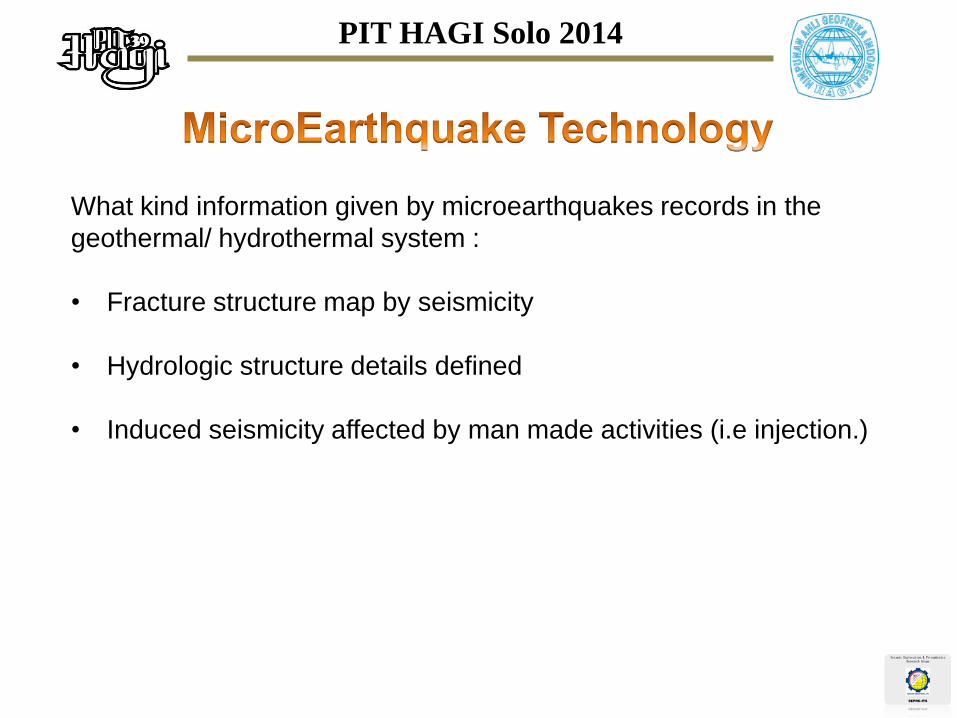
PIT HAGI Solo 2014
Resistivity data Velocity model
Velocity-Resistivity correlation
Random points/ locations (Site Selection)
Possible source position identification
Seismic wave propagation
modeling
Seismic wave simulation parameters
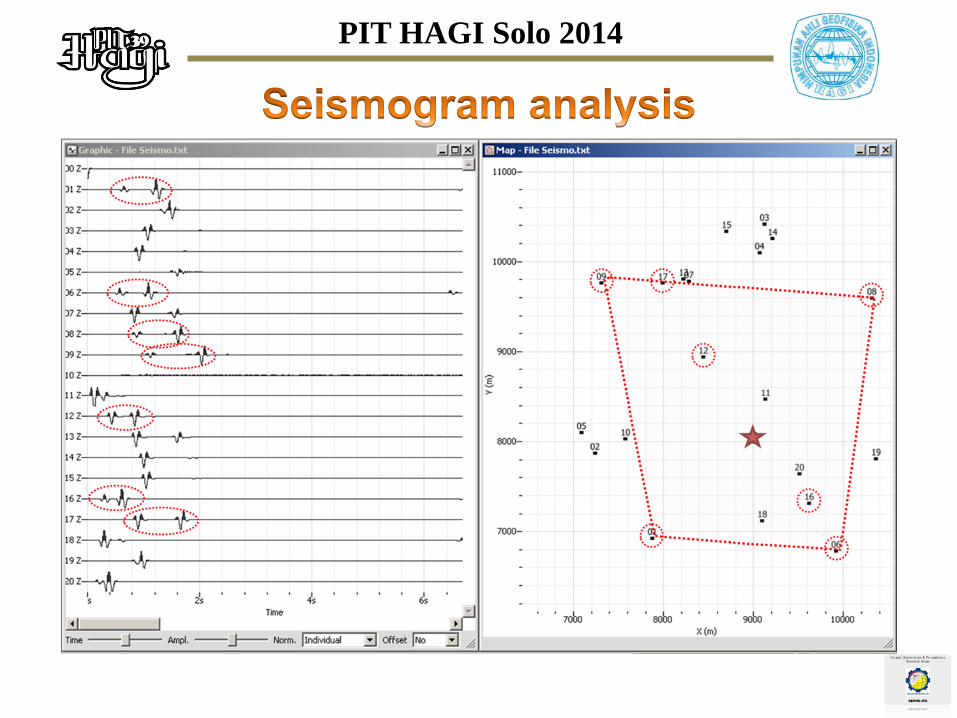
Seismogram analysis
The best station locations
(Faust, 1951)

PIT HAGI Solo 2014

PIT HAGI Solo 2014
Resistivity – Velocity correlation

PIT HAGI Solo 2014
Near surface velocity map
Averaging Velocity 0-1500m

PIT HAGI Solo 2014
PIT HAGI Solo 2014

PIT HAGI Solo 2014

PIT HAGI Solo 2014

PIT HAGI Solo 2014
• Based on our evaluation in arrival time separation between p-wave and s-wave, from 20
stations the stations which well recorded data is only 7 stations. The separation of P-S
wave range from 0.314 to 0.924 with lateral distance from 914 to 2447 m from the center
geyser location or MEQ source simulated.
• The distribution of well recorded data stations relatively uniform, 4 stations in the eastern
part of fault and 3 stations in the western part of fault. The best location of the stations
shows in figure above, black dot shows all the stations, and the black dot covered by red
dot circle.
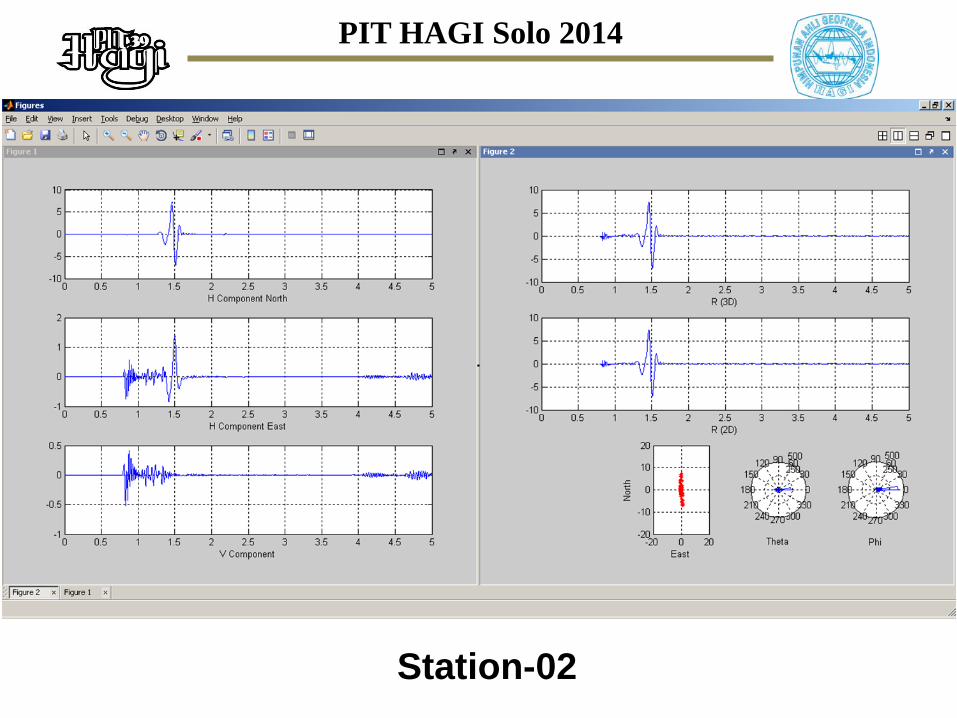
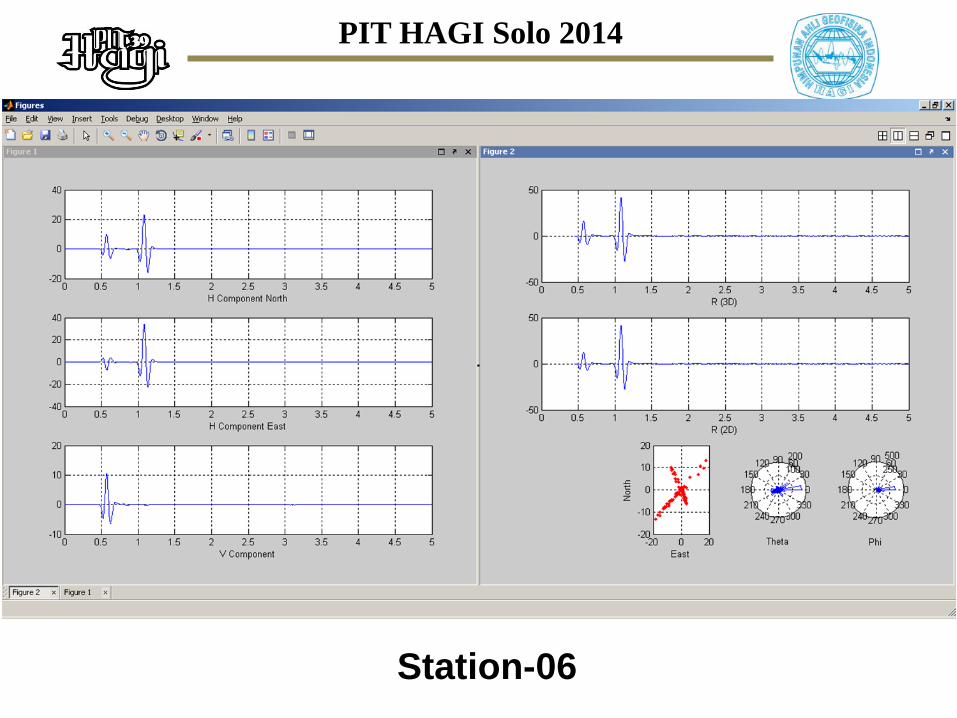
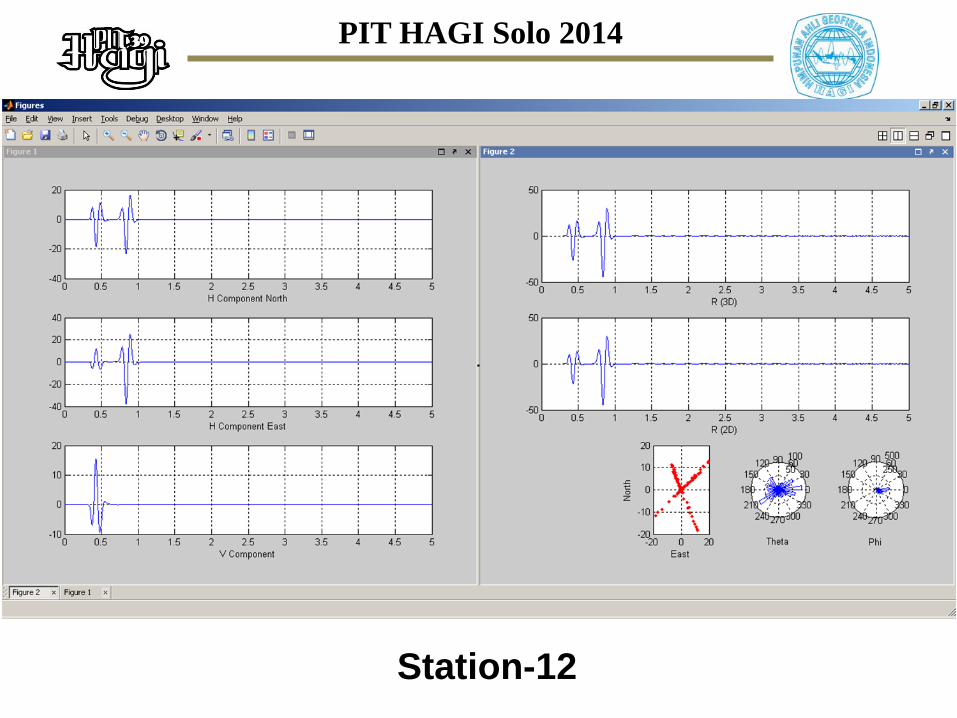
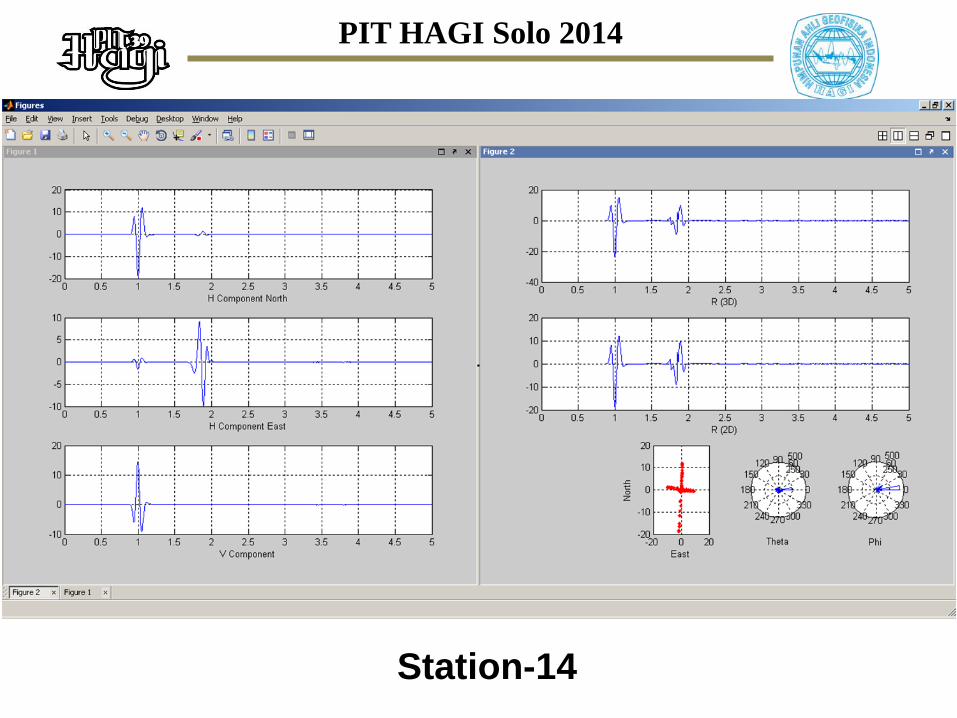
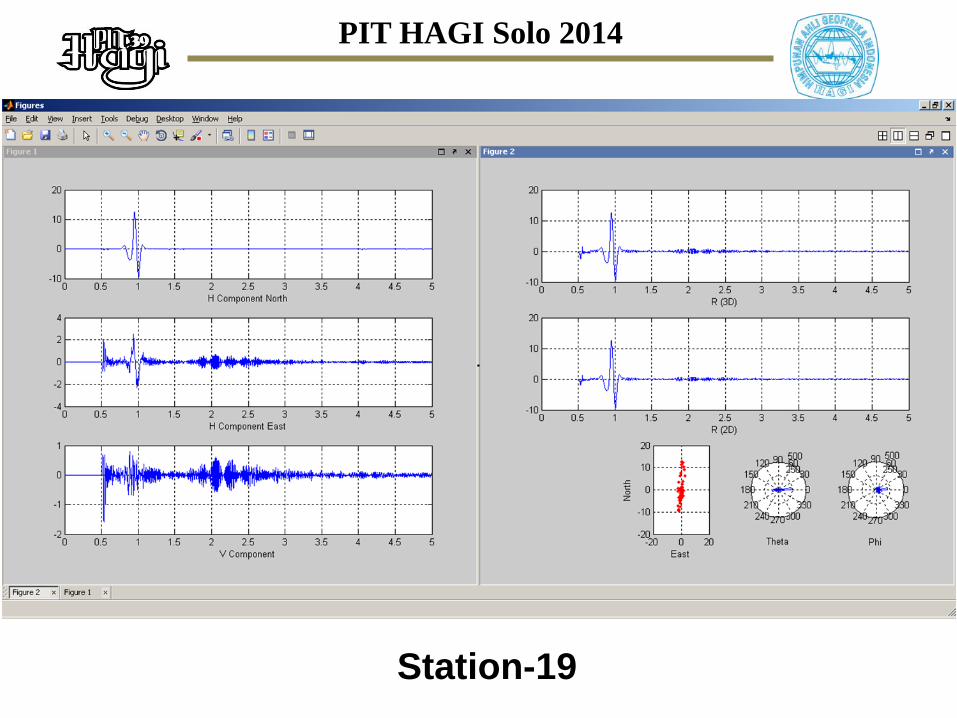
• In figure before shows seismogram resulted from seismic wave simulation, that give
information about which station location the saparation of P and S arrival time. If in the real
MEQ survey use only 4 stations, from this result, I suggest to use the stations location
number 1, 6, 8 and 9 to cover the possible MEQ source location associated with geyser or
hydrothermal activity and fault.
• In this study evaluation only used P-S wave separation as tool to analyzed, for better
knowledge and more useful information we have to modeled in 3 dimension and use
attenuation property that effecting the recording quality of the data. This algorithm still to
be tested to the real survey to get better conclusion.

PIT HAGI Solo 2014
• To get better data quality of MEQ survey, we have to get more information
about subsurface condition in our field for designing the survey where to put our
sensor location as recording stations.
• Used electrical property information from magnetotelluric (MT) survey can be
very useful to built preliminary velocity model as an input to simulating the
propagation of seismic wave triggered by MEQ around geyser or hydrothermal
activity in the geothermal prospect field.

PIT HAGI Solo 2014

PIT HAGI Solo 2014
References
• Chang, J. S. H., 2013, MSc Thesis, Department of Physics, University of Alberta.
• Faust, L. Y., 1951, Geophysics, v. 18, p. 271-288.
• Mukuhira, Y., Asanuma, H., Niitsuma, H., Haring, M., Deichmann, N., 2010, GRC
Transactions, Vol. 34, p. 407-412.
• Onacha, S., Kahn, D., Malin, P., Shalev, E., 2005, GRC Transactions, Vol. 29, p. 497-502.
• Pramono, B., Colombo, D., 2005, Proceedings World Geothermal Congress 2005,
Antalya, Turkey.
• Tim Geofisika terpadu, 2009, Pusat Sumber Daya geologi, Badan Geologi.
• Warr, P. L., 1972, Geothermics, Vol. 1, No.1, p.3-12.
• Kayal, J.R., 2008, Microearthquake Seismology and Seismotectonics of South Asia
• Warpinski, N.R., 2011, Microseismic Source Mechanisms Must Be Understood Before
Results Can be Accurately Interpreted.

PIT HAGI Solo 2014
Station-00

PIT HAGI Solo 2014
Station-01
PIT HAGI Solo 2014
Station-02

PIT HAGI Solo 2014
Station-03

PIT HAGI Solo 2014
Station-04

PIT HAGI Solo 2014
Station-05
PIT HAGI Solo 2014
Station-06

PIT HAGI Solo 2014
Station-07

PIT HAGI Solo 2014
Station-08

PIT HAGI Solo 2014
Station-09

PIT HAGI Solo 2014
Station-10

PIT HAGI Solo 2014
Station-11
PIT HAGI Solo 2014
Station-12

PIT HAGI Solo 2014
Station-13
PIT HAGI Solo 2014
Station-14

PIT HAGI Solo 2014
Station-15

PIT HAGI Solo 2014
Station-16

PIT HAGI Solo 2014
Station-17

PIT HAGI Solo 2014
Station-18
PIT HAGI Solo 2014
Station-19

PIT HAGI Solo 2014
Station-20