
Michigan’s Application for ESEA Flexibility: Overview and Request for Feedback
65
Michigan’s Application for ESEA Flexibility: Overview and Request for Feedback January 30, 2012 Statewide Webcast
-
Upload
wang-bradford -
Category
Documents
-
view
26 -
download
0
description
Michigan’s Application for ESEA Flexibility: Overview and Request for Feedback. January 30, 2012 Statewide Webcast. Logistics for the Day. Please email questions during this presentation to: [email protected] ESEA Public Comment Will open February 2, 2012 - PowerPoint PPT Presentation
Transcript of Michigan’s Application for ESEA Flexibility: Overview and Request for Feedback

Michigan’s Application for ESEA Flexibility: Overview and
Request for FeedbackJanuary 30, 2012
Statewide Webcast

2
Logistics for the Day
• Please email questions during this presentation to:
[email protected] • ESEA Public Comment
–Will open February 2, 2012–Email comments to [email protected]

3
Request to ISD Sponsors
• Thank you for hosting this webcast!• Please email a count of the people
in attendance at your location to:–[email protected]

4
Today’s Presenters• Linda Forward
– Director, Office of Educational Improvement and Innovation
• Karen Ruple– Manager, MI-Excel Program, Office of Educational
Improvement and Innovation • Joseph Martineau
– Executive Director, Bureau of Assessment and Accountability
• Venessa Keesler– Manager, Evaluation Research and Accountability, Office
of Psychometrics, Accountability, Research and Evaluation

5
Overview of the Day
• Background to ESEA Flexibility request
• Overview of Michigan’s application• Opportunities for feedback

6
Flexibility Basics• Opportunity to submit a set of waivers
regarding how the SEA implements current NCLB language
• Two waiver periods– First due – November 14, 2011– Second due – February 2012
• MDE Notification to USED – October 12, 2011

7
Flexibility Basics
• Council of Chief State School Officers– Roadmap for Next-Generation State
Accountability Systems
• ESEA Flexibility– Four Principles
– 10 Waiver Package + 1

8
Flexibility Basics• Four Principles
– College and Career Ready Expectations for all Students
– State-Developed Differentiated Recognition, Accountability, and Support
– Supporting Effective Instruction and Leadership
– Reducing Duplication and Unnecessary Burden

9
Flexibility Basics• 10 Waiver Package + 1
– 2013-2014 Timeline for Determining Adequate Yearly Progress
– Implementation of School Improvement Requirements
– Implementation of LEA Improvement Requirements
– Rural LEAs
– Schoolwide Programs

10
Flexibility Basics• 10 Waiver Package + 1
– Support of School Improvement
– Reward Schools
– Regarding Highly Qualified Teachers Improvement Plans
– Transfer Certain Funds
– Use School Improvement Grant Funds to Support Priority Schools
– Use of Twenty-First Century Community Learning Center Program Funds

11
• General Requirements– Stakeholder Input– Goal– Theory of Action
• Evaluation– One program, practice or strategy in MDE plan– USED will financially support

12
CAREER AND COLLEGE READY EXPECTATIONS FOR ALL STUDENTS
Principle 1

13
ESEA Option – Principle I• Principle 1A: Adopt career and college ready
standards
– Option A: Michigan adopted the Common Core State Standards in June 2010.
– Option B: Involvement of IHE’s in the development of college and career-ready standards• IHE involvement in SBAC• Makes Option A more strategic for Michigan

14
Transition to Career and College Ready Standards
• Alignment crosswalk between Michigan standards and Common Core standards.
• Participating in ELP standards based on Common Core.
• Participating in Dynamic Learning Maps alternate assessment based on Common Core.
15
Transition to Career and College Ready Standards
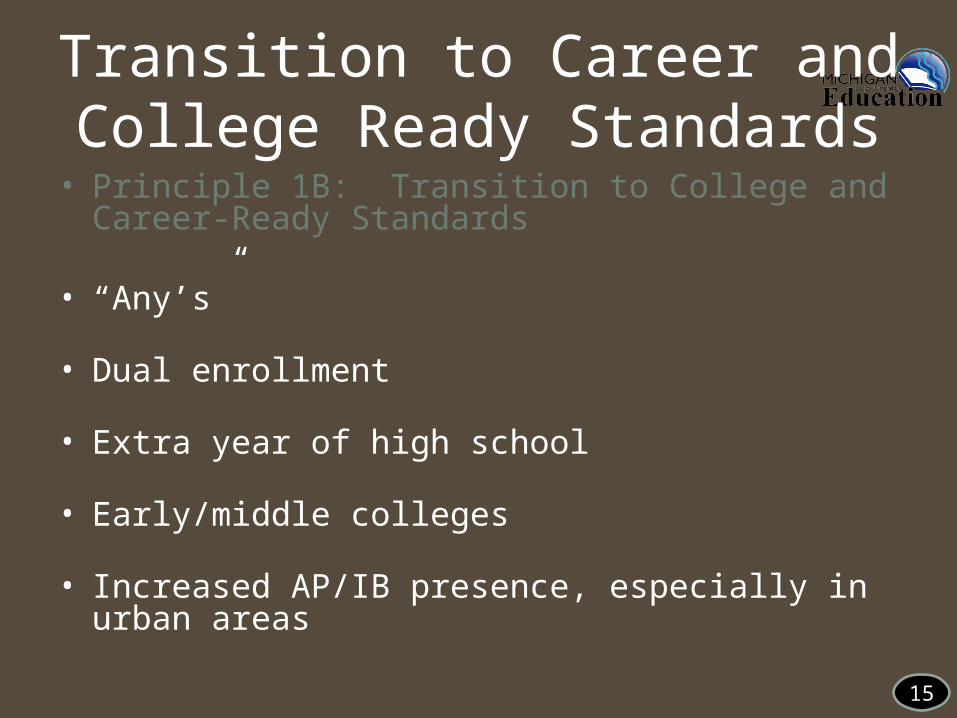
• Principle 1B: Transition to College and Career-Ready Standards
• “Any’s”
• Dual enrollment
• Extra year of high school
• Early/middle colleges
• Increased AP/IB presence, especially in urban areas

16
Transition to Career and College Ready Standards
• Principle 1B: Transition to College and Career-Ready Standards
• Have identified a coherent plan to align teacher/principal preparation programs with school, teacher, and student accountability
• Integrate CCR standards into the pre-service curriculum• Aligning pre-service requirements with knowledge and
skills necessary for today’s successful teachers and principals
• Challenge:– Developing a teacher/administrator force prepared to teach both in the traditional classroom
and in the new digital classroom

17
Transition to Career and College Ready Standards
• Principle 1B: Transition to College and Career-Ready Standards
• Raised cut scores to be consistent with career and college readiness
• Include items on MEAP (fall 2012 and 2013) and MME Day 3 to cover Common Core standards
• Potential evidence that rigorous cut scores in one subject (writing, high school) has resulted in increased student achievement

18
DIFFERENTIATED ACCOUNTABILITYPrinciple 2:

19
Michigan’s Differentiated System of Accountability
Green Schools Yellow Schools Red Schools
PrioritySchools
FocusSchools
RewardSchools

20
Understanding the ComponentsPriority/Focus/Reward AYP
Green-Yellow-Red ScorecardNormative—ranks schools
against each otherCriterion--referenced—are schools achieving a certain
PROFICIENCY level?Focuses attention on a smaller
subset of schools; targets resources
Given to all schools; acts as an “early warning” system; easy
indicatorsThe primary mechanism for
sanctions and supportsUsed primarily to identify areas
of intervention and differentiate supports
Fewer schools All schools

21
PRIORITY, FOCUS AND REWARD SCHOOLS
Normative Approaches

22
Priority Schools
• Current Thinking– Approach
• Bottom 5% of the Top to Bottom List– Benefits
• Aligns with current methodology• Results in PLA = Priority

23
Focus Schools
• Current Thinking–Composite achievement gap–All tested subjects–Gap between bottom 30% and top 30%
of students in each school–10% of schools with largest gaps

24
Stakeholder Concerns
• May disadvantage high performing schools
• May result in resources going to schools with fewer needs

25
MDE Response
• Both high-performing and low-performing schools are focus schools.
• Laser focus on achievement gap• AYP applies to all schools• Supports will differ by need

26
Reward Schools
• Current Thinking• Top 5% of schools on top to
bottom list• Top 5% of schools on
improvement metric• Schools identified as Beating the
Odds

27
ACCOUNTABILITY SCORECARDCriterion-Referenced Approach

28
Key Elements
• Proficiency targets (AMOs)• Improvement targets• Subgroup targets• Graduation/attendance rate• Educator evaluations• Compliance factors

29
Guiding Principles
• Produces green-yellow-red final color for every school
• Easy-to-read display• Includes all five tested subjects • Adds more differentiation than
pass/fail of AYP

30
Setting Proficiency Targets
• Annual Measurable Outcomes (AMOs)
• Every school will get to 85% by 2022.
• Targets differentiated to reflect each school’s starting point

31
85.0% 85.0% 85.0% 85.0% 85.0% 85.0% 85.0% 85.0% 85.0% 85.0%
53.5%57.0%
60.5%64.0%
67.5%71.0%
74.5%78.0%
81.5%85.0%
8.5%
17.0%
25.5%
34.0%
42.5%
51.0%
59.5%
68.0%
76.5%
85.0%
0%
10%
20%
30%
40%
50%
60%
70%
80%
90%
100%
2012 2013 2014 2015 2016 2017 2018 2019 2020 2021 2022
Profi
cien
cy T
arge
t (A
MO
)
Year
School Proficiency Targets (AMOs)
School A
School B
School C

32
Concerns
• Are the targets ambitious enough?• Are they attainable enough?• Is there a disincentive to cross 85%
proficient?

33
Are the AMOs ambitious enough?
• New cut scores—standard for proficiency is much higher.
• Almost no school in Michigan is above 85% on the new cut scores.
• 85% is an interim goal; 100% is still the ultimate goal.

34
Are the AMOs attainable?
• These rates of improvement have largely not been demonstrated
• BUT:–Still have safe harbor–Expect behavior will change with new
expectations AND new supports

35
Crossing 85%
• When a school crosses 85% and remains there for two consecutive years:–“Green” status –Opportunity to be a reward school by
showing improvement

36
Safe Harbor
• Balance between ambitious proficiency targets and attainable improvement goals.
• Need to find a rate of improvement that has been demonstrated, but that is still rigorous

37

38
Subgroups
• Retain original nine demographic subgroups–Concern was voiced with dropping
these, loss of focus on these groups• Add the bottom 30% subgroup
–Affirms our laser focus on closing the achievement gap

39
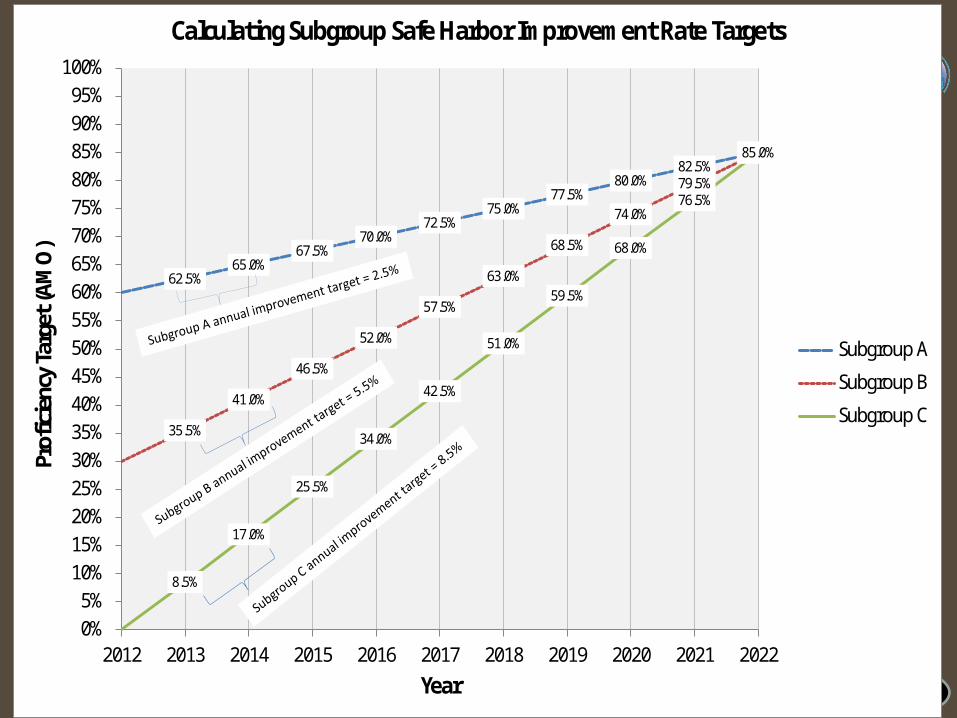
Subgroup Targets and Safe Harbor• Targets are the same for the whole
school and all subgroups• Safe harbor:
–For bottom 30%: improvement at the 80th percentile
–For all subgroups: improvement so that the subgroup reaches 85% by 2022
40
62.5%65.0%
67.5%70.0%
72.5%75.0%
77.5%80.0%
82.5%85.0%
35.5%
41.0%
46.5%
52.0%
57.5%
63.0%
68.5%
74.0%
79.5%
85.0%
8.5%
17.0%
25.5%
34.0%
42.5%
51.0%
59.5%
68.0%
76.5%
85.0%
0%5%
10%15%20%25%30%35%40%45%50%55%60%65%70%75%80%85%90%95%
100%
2012 2013 2014 2015 2016 2017 2018 2019 2020 2021 2022
Profi
cien
cy T
arge
t (AM
O)
Year
Calculating Subgroup Safe Harbor Improvement Rate Targets
Subgroup A
Subgroup B
Subgroup C
41
Accountability Scorecard
• Green/red/yellow for each school• Clear labels for priority, focus, and
reward.• Ability to click through and see
more detailed information.

42
Determining the Colors• Whole school and each subgroup
receive green, red or yellow for each subject.–Red = did not meet proficiency OR
improvement–Yellow = met improvement target, not
proficiency–Green = met proficiency target

43
Participation
• Must assess 95% of students overall and in each subgroup
• Failure to do so in one subgroup = one red
• Two “red” for participation = automatic overall red

44
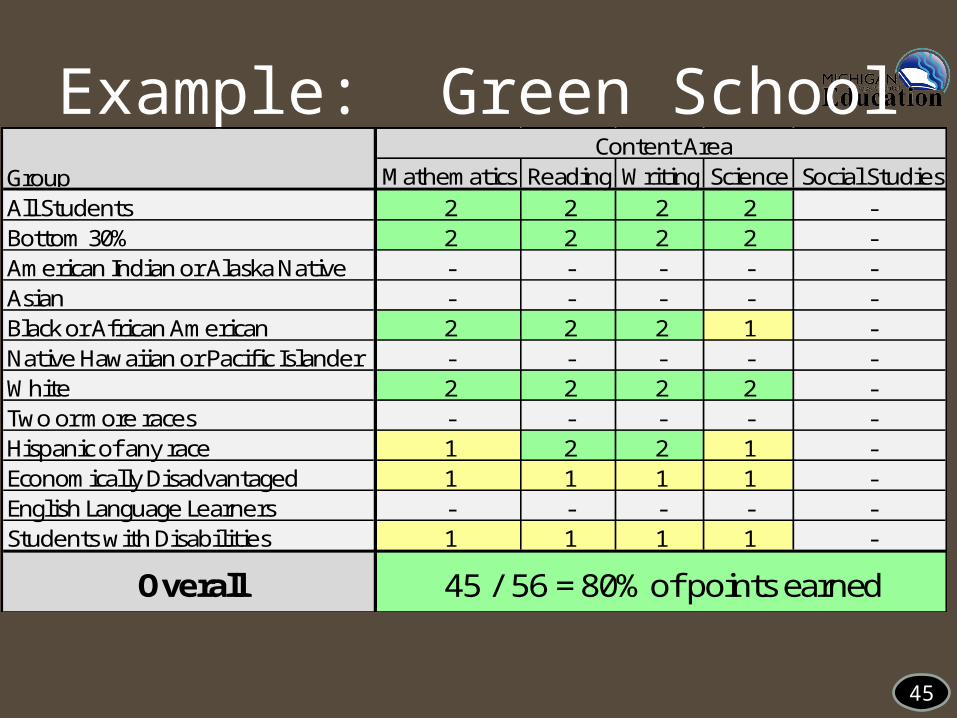
Final Overall Color• Each subgroup color in each
subject awarded point value:–Green = 2 points; Yellow = 1 point; Red
= 0 points–80% or more = Green; 50-80% =
Yellow; less than 50% = Red• Red for one or more subgroups,
maximum overall rating = yellow
45
Example: Green SchoolMathematics Reading Writing Science Social Studies
All Students 2 2 2 2 -Bottom 30% 2 2 2 2 -American Indian or Alaska Native - - - - -Asian - - - - -Black or African American 2 2 2 1 -Native Hawaiian or Pacific Islander - - - - -White 2 2 2 2 -Two or more races - - - - -Hispanic of any race 1 2 2 1 -Economically Disadvantaged 1 1 1 1 -English Language Learners - - - - -Students with Disabilities 1 1 1 1 -
Content AreaGroup
Overall 45 / 56 = 80% of points earned

46
Example: Yellow SchoolMathematics Reading Writing Science Social Studies
All Students 1 2 1 1 -Bottom 30% 0 2 2 0 -American Indian or Alaska Native - - - - -Asian - - - - -Black or African American 1 1 2 1 -Native Hawaiian or Pacific Islander - - - - -White 2 2 2 1 -Two or more races - - - - -Hispanic of any race 1 2 1 1 -Economically Disadvantaged 1 1 2 1 -English Language Learners - - - - -Students with Disabilities 1 1 0 0 -
GroupContent Area
Overall 33 / 56 = 59% of points earned

47
Example: Red School (Points)Mathematics Reading Writing Science Social Studies
All Students 1 1 1 1 -Bottom 30% 2 2 2 0 -American Indian or Alaska Native - - - - -Asian - - - - -Black or African American 1 1 1 0 -Native Hawaiian or Pacific Islander - - - - -White 1 1 1 0 -Two or more races - - - - -Hispanic of any race 0 1 1 0 -Economically Disadvantaged 1 1 1 0 -English Language Learners - - - - -Students with Disabilities 1 1 1 0 -
GroupContent Area
Overall 24 / 56 = 43% of points earned

48
Example: Yellow School (Red Subgroup)
Mathematics Reading Writing Science Social StudiesAll Students 2 2 2 2 -Bottom 30% 2 2 2 0 -American Indian or Alaska Native - - - - -Asian - - - - -Black or African American - - - - -Native Hawaiian or Pacific Islander - - - - -White 2 2 2 2 -Two or more races - - - - -Hispanic of any race - - - - -Economically Disadvantaged - - - - -English Language Learners - - - - -Students with Disabilities - - - - -
GroupContent Area
Overall 22 / 24 = 92% of points earned

49
Highlights• More differentiation; not simply
pass/fail AYP.• Many schools will be yellow• Intuitive to users• Red = warning system to schools

50
Other Academic Indicators• Graduation rate and improvement• Attendance• Participation • Educator evaluations
– Reporting 100% of labels• Compliance with state law
– School Improvement Plan, school performance indicators

51
DIFFERENTIATED RECOGNITIONRewards

52
Differentiated Recognition• Recognition options (as funds allow):
– Note Reward Schools in Annual Education Reports– Distribute a list to media & encourage coverage locally– Recognize schools at state conferences
– MDE Sponsored conferences– Education Organizations sponsored conferences
– Fund audio or video documentaries for 20-40 top schools post as promising practices
– Plan visits by state officials– Network Reward schools with demographically similar lower
performing schools– Certificates or Banners for Reward schools– Seek corporate or philanthropic sponsors for recognition activities

53
DIFFERENTIATED SUPPORTS

54
Differentiated Supports• New Redesigned Statewide System of Support:
– Must address needs of schools– Consider building capacity at school and district level– Must move schools rapidly from low achievement to high
achievement
• Challenge– Rapid, sustained growth required
• Opportunity– Think outside the box– What can work that we aren’t currently trying

55
Priority Schools• Align with the PLA and SIG initiatives
• Schools utilize one of four reform models:– Transition– Transformation– Restart– Closure
• Support selection of model based on data from a Data Workshop
• Survey of Enacted Curriculum
• Rubrics to determine if principal remains in place

56
Priority Schools• School Improvement Review
• Content and district intervention liaison
• ISD Support
• Current Tools on AdvancED Website
• Challenges– Number of schools– Trained Turnaround Specialists– District capacity
57
Focus Schools• Supports will be provided at District level
• Data-based decisions
• Build around an RtI model
• Strong monitoring component
• Challenge– Number of schools– District capacity

58
EDUCATOR EVALUATIONSPrinciple 3

59
Adopt Guidelines
• Governor’s Council: creating recommendations for guidelines for statewide evaluation system (2013-2014 and beyond)
• MDE—will consider producing interim guidelines to implement current legislation until statewide guidelines

60
Support for Implementation?
• Educating field on legislative requirements (current and upcoming)
• Teacher/Student Data Link and state assessment data
• Educator Evaluation Best Practices Conference (February 29, 2012)

61
Supports (cont’d)
• Pilot studies– Using performance level change data in
value-added modeling– Setting standards on common assessments– Survey data
• Model observation protocol• Guidelines for training evaluators
62
Ensuring Compliance
• Legislative requirement• Publish aggregate educator
effectiveness labels• Accountable for submitting 100% of
labels on Accountability Scorecard• Cross-reference available assessment
data with reported labels

63
NEXT STEPSFeedback

65
Next Steps
• Application due by February 21, 2012
• Begin negotiations with USED