Michigan Education Policy Fact Base - Bellwether … · 2017-01-30 · Michigan Education Policy...
48
By Bonnie O’Keefe, Kaitlin Pennington, and Sara Mead Published: January 23, 2017 Updated: January 30, 2017 Michigan Education Policy Fact Base
Transcript of Michigan Education Policy Fact Base - Bellwether … · 2017-01-30 · Michigan Education Policy...

By Bonnie O’Keefe, Kaitlin Pennington, and Sara Mead
Published: January 23, 2017
Updated: January 30, 2017
Michigan Education Policy Fact Base

2
Executive Summary
• Educational authority in Michigan is highly decentralized, with multiple
state entities and over 40 charter authorizers
• The state has implemented the Common Core standards and new
assessments, despite some opposition
1. As measured by the National Assessment of
Educational Progress (NAEP), administered in 4th and 8th
grade in reading and math.
• Michigan has one of the nation’s largest charter sectors: ~10% of
students attend public charter schools
• While charter school quality varies, on average charters have a significant
learning advantage over comparable traditional public schools2
• Michigan typically ranks in the lowest third of states in terms of student
proficiency,1 and state assessment results show wide achievement gaps
by racial/ethnic group and income level
• Only one in three 11th grade students meet college readiness
benchmarks
Student
Achievement
Policy
Landscape
Charter
Schools and
School Choice
Policies
Education
Reform in
Detroit
2. As measured by CREDO (2013).
• Repeated reform efforts to improve Detroit Public Schools have failed to
produce academic results for students or district financial solvency
• A new law reinstates local control over Detroit schools and creates an A-F
accountability system for traditional public schools and charter schools

3
College
Readiness
Reading Proficiency
Key Michigan Data Points
Public Schools
Charter School
Share
899public
schools,
56school
districts
Student
Enrollment
1.5Mstudents
Sources: Michigan Department of Education, National Alliance of Public Charter Schools (NAPCS)
Michigan Student Race/Ethnicity
35%of 11th grade
students
attain college
readiness on
the SAT
10%of total public
school
enrollment,
6th largest in
the country7%
18%
67%
1%3%3%
Other
Two or More Races
Asian
Hispanic
Black
White
24%
34%
37% Below Basic
Basic
Proficient
5%
4th grade reading
results on 2015
National
Assessment of
Educational
Progress (NAEP) Advanced

4
Table of Contents
1 Michigan Student Demographics and Achievement
2 Education Policy Landscape and Recent Changes
3 Charter Schools and School Choice Policies
4 Education Reform in Detroit

5
1.5 million students attend Michigan’s public schoolsDemographics largely reflect our nation’s diversity, with key differences in a few groups
Michigan Demographics and Achievement
Sources: Michigan State Report Card, student count report 2015-
16; NCES Common Core of Data 2013-14
7%
25%18%
16%
67%
50%
0%
40%
80%
100%
20%
60%
U.S.Michigan
(1.5M public
school students)
46%52%
Michigan U.S.
Demographics of Michigan K-12 Students by Race/Ethnicity and Socio-Economic Status
Other
Asian
Hispanic/Latino
Two or More Races
White
Black
Race / Ethnicity Low Income Students(measured by % of students who receive
free or reduced lunch)

6
200
210
220
230
240
250
260
270
280
290
300
2002 2004 2006 2008 2010 2012 2014 2016
NAEP Scale Score
Reading achievement for Michigan students has stagnated;
4th grade scores now fall below national average
Source: NAEP NCES Data Explorer
Michigan Demographics and Achievement
National Assessment of Educational Progress (NAEP) Reading Scale Score Trends, 2002-2015
Michigan ranks 41st among states in 4th grade reading and 31st in 8th grade reading
No statistical difference
between Michigan and
national average
Michigan statistically lower
than national average
Michigan
National Average
8th grade reading
4th grade reading

7
200
210
220
230
240
250
260
270
280
290
300
2000 2002 2004 2006 2008 2010 2012 2014 2016
NAEP Scale Score
In math, Michigan students have been below the national
average since 2007, and the gap is growing
Source: NAEP NCES Data Explorer
Michigan Demographics and Achievement
National Assessment of Educational Progress (NAEP) Math Scale Score Trends, 2000-2015
Michigan statistically lower
than national average
Michigan
National Average
8th grade math
4th grade math
Michigan ranks 42nd among states in 4th grade math and 38th in 8th grade math
Michigan statistically lower
than national average

8
Results on state exams in grades 4 and 8 show less than
half of students achieving proficiency
Michigan Demographics and Achievement
Sources: Michigan State Report Card, M-STEP report 2015-16
MathReading
Michigan is a member of the Smarter Balanced testing consortium; however, M-STEP is
composed of Smarter Balanced items and state-created items.
Scores are not comparable to other Smarter Balanced state test scores.
M-STEP Reading and Math Proficiency Rates, Grades 4 and 8, 2015-16
24%15%
22%34%
22%28%
31%23%
0%
25%
50%
75%
100%
8th Grade4th Grade
% of Students
17% 16%
27%
17%
21%
41%
35%
4th Grade 8th Grade
27%
Advanced
Proficient
Not Proficient
Partially Proficient
Students
achieving
proficiency

9
Michigan has large 4th grade achievement gaps by race,
ethnicity, and income
0%
20%
40%
60%
80%
100%
Hispanic Low
Income
Black
46%
20%
31%34%
54%
% of Students
All
Students
White
Michigan Demographics and Achievement
Michigan M-STEP 4th Grade Reading Proficiency, by Subgroup, 2015
All
Students
44%
52%
15%
28%31%
Low
Income
HispanicBlackWhite
4th Grade Reading 4th Grade MathAdvanced
Proficient
Sources: Michigan State Report Card, M-STEP report 2015-16
107K 71K 19K 8K 55K# students
assessed107K 71K 19K 8K 55K# students
assessed

10
These achievement gaps persist into 8th grade
0%
20%
40%
60%
80%
100%
% of Students
White HispanicBlackAll
Students
49%
35%32%
55%
24%
Low
Income
Michigan Demographics and Achievement
All
Students
HispanicWhite Black Low
Income
38%
17%
33%
19%
10%
8th Grade Reading 8th Grade Math
Advanced
Proficient
Sources: Michigan State Report Card, M-STEP report 2015-16
Michigan M-STEP 8th Grade Reading Proficiency, by Subgroup, 2015
109K 75K 18K 8K 50K# students
assessed109K 75K 18K 8K 50K
# students
assessed

11
80%
74%
83%
79%
50
55
60
65
70
75
80
85
90
95
100
2011 2012 2013 2014 2015
Graduation rates for Michigan students have increased over
the past 5 years, but still fall below national averages
Source: NCES Common Core of Data
Michigan Demographics and Achievement
Michigan and National 4-Year Average Cohort Graduation Rates, 2011-2015
4-Year Average Cohort Graduation RateMichigan
National Average

12
Only 35 percent of Michigan 11th grade students are
college-ready according to the SAT
Michigan Demographics and Achievement
Source: Michigan State Report Card
0%
100%
80%
60%
40%
20%
% Michigan 11th grade students
Did not meet
college readiness
benchmark
65%
Met college
readiness benchmark35%
11th Grade Students
This suggests a 75% likelihood that a
student will earn at least a “C” in a first-
semester, credit-bearing college course
Michigan SAT College Readiness, 2016
All 11th grade Michigan public school students took the SAT in 2016This replaced the ACT as the state’s measure of college readiness

13
College-readiness rates are notably lower for black,
Hispanic, English learner, and low-income students
Michigan Demographics and Achievement
Source: Michigan State Report Card
35%40%
19%
63%
17%7%10%
0%
20%
40%
60%
80%
100%
English
Learner
<5%
Special
Education
HispanicBlack Low IncomeAsianWhiteAll Students
Michigan SAT College Readiness Rates, 2016
104K 75K 16K 6K 3K 39K 9K 3K# students
assessed
% 11th grade students college ready

14
Michigan students who graduate high school enroll in
college at lower rates than the national average
Sources: Michigan State Report Card, Postsecondary Report of
College Enrollment 2014-15
0%
20%
40%
60%
80%
100%
National*
68%
44%
25%
English
Learner
43%
12%
32%
Special
Education
34%
10%
24%
Low
Income
47%
24%
23%
Asian
77%
59%
17%
Hispanic
48%
25%
22%
Black
50%
28%
21%
White
64%
41%
23%
Statewide
61%
39%
23%
Michigan Demographics and Achievement
4 Year Colleges and Universities
Community Colleges
*National data from 2013-14 via NCES Common Core of Data
College Enrollment Rates, 2014-15
% High school graduates enrolling in college within 6 months of graduation

15
Michigan’s bachelor’s degree attainment rate lags behind the
national average in every age group
Source: American Community Survey 5-Year Estimates
Michigan Demographics and Achievement
0%
10%
20%
30%
40%
50%
% Population with B.A.
29%
>65
24%
45-64
21%
35-44
32%
25-34
National
33%26%
Michigan
31%33%
Share of Population with a Bachelor’s Degree, 2015
Age group
Michigan
National Average

16
Table of Contents
1 Michigan Student Demographics and Achievement
2 Education Policy Landscape and Recent Changes
3 Charter Schools and School Choice Policies
4 Education Reform in Detroit

17
Michigan policymakers have enacted numerous education
reforms in the past 10 years
Education Policy Landscape and Recent Changes
31
%28
%10
%
10
%
2006 • Raised high school graduation requirements with Michigan Merit Curriculum
2009 • Passed bill package addressing teacher merit pay, charter school expansion,
public school takeover, and the high school dropout age
2010 • Adopted the Common Core State Standards
2011 • Changed teacher tenure requirements and established intent for new teacher evaluation
system
• Raised charter school cap
2012 • Received No Child Left Behind waiver
2013 • Awarded Race to the Top Early Learning Challenge grant
2014 • Developed the M-STEP, a new assessment combining Smarter Balanced Assessment
Consortium questions with state-created questions
2015 • Created new teacher evaluation system
2016 • Passed a third grade reading and retention bill
• Provided $617 million in debt relief and restructuring for Detroit Public Schools

18
Multiple players shape education in Michigan
Education Policy Landscape and Recent Changes
31
%10
%
10
%
Governor
School Reform
Office (SRO)
State Board of
Education
Michigan
Department of
Education
Superintendent of
Public Instruction
Elected
Appointed
Government Agency
The SRO works to
establish priorities and
procedures to turnaround
the lowest achieving 5
percent of schools in the
state and is mandated to
publish closure lists for
persistently failing district
and charter schools
across the state.
8 elected members
Serves as Chairman of
the Board
Member of Governor’s
cabinet

19
2000 ’01 ’02 ’03 ’04 ’05 ’06 ’07 ’08 ‘09 ’10 ’11 ’12 ’13 ‘14 ’15 ’16
2000 ’01 ’02 ’03 ’04 ’05 ’06 ’07 ’08 ‘09 ’10 ’11 ’12 ’13 ‘14 ’15 ’16
Education Policy Landscape and Recent Changes
Republicans have controlled Michigan state leadership
since 2011
Go
ve
rno
rS
tate
Se
na
teS
tate
Ho
use
Su
p’t
of
Pu
bli
c In
st.
Republican Senate Majority
John Engler Jennifer Granholm Rick Snyder
Republican House MajorityDemocratic
House MajorityRepublican House
Majority
Arthur
EllisThomas D.
Watkins, Jr.Michael Flanagan
Brian
Whiston
Republican
Democrat
Non-Partisan Office

20
Michigan passed major teacher tenure and evaluation
reform laws in 2011 and 2015
Education Policy Landscape and Recent Changes
• Required dismissal for
teachers rated
ineffective on 3
consecutive annual
evaluations
• Increased time to
earn tenure from four
to five years
• Tasked governor to
appoint a council to
develop recommend-
ations on teacher
evaluation details
• Set requirements for
components of
teacher evaluations
and their weight
o Weight of student
learning measures
set at 25%, with
planned increase to
40% in 2018-19
• Districts can use the
state evaluation tool or
adopt their own
• Families must be
informed when a
student is taught by an
ineffective teacher for
two consecutive years
Public Acts 100-103, a
package of laws on
teacher tenure and
evaluation laid the
groundwork for teacher
evaluation reform
Public Act 173
created a teacher
evaluation system to
complement the 2011
tenure reforms
Public Act 173 will be fully
implemented; teacher
evaluations will follow
formula below
2011 2015 2018-19
Teacher
evaluation
Formula
60%
20%
20% … measured
by state assessments
… measured
by other means
Evaluation tool of
district’s choice
Student learning

21
From 2011-2016, 97% of Michigan’s teachers were rated
effective or highly effective under the evaluation system
23%33%
38% 42% 42%
75%64%
59%56% 56%
0%
20%
40%
60%
80%
100%
2015-20162014-20152013-20142012-20132011-2012
Michigan Demographics and Achievement Education Policy Landscape and Recent Changes
Most differentiation occurs between effective and highly effective teachers
Effective
Minimally Effective
Ineffective
Highly Effective
Source: Michigan Department of Education School and
Staffing Information
Michigan Teacher Effectiveness Ratings, 2015
Effective +
Highly Effective
97% - 98%

22
Michigan adopted the Common Core StandardsState’s M-STEP assessment combines state-designed questions with those from SBAC1
Education Policy Landscape and Recent Changes
31
%10
%
2010 • Michigan adopts the Common Core State Standards & joins Smarter Balanced Assessment Consortium (SBAC)
2013 • Republican-controlled legislature attempts to block implementation of the Common Core State Standards
through budget bills; Governor Snyder works with legislature to advance the standards
2014 • Michigan begins implementing the Common Core State Standards
• State legislature requires state officials to recreate the state test; State officials combined SBAC questions with
state-designed questions to create the Michigan Student Test of Educational Progress, or M-STEP
2015 • Michigan changes its high school exam from the ACT to the Michigan Merit Exam, which includes SAT, WorkKeys
2016 • State Superintendent Whiston announces intent to change the M-STEP after the 2016-2017 school year
1. Smarter Balanced Assessment Consortium
2. Betsy DeVos sits on the board of Great
Lakes Education Project
Key PolicymakersRepublican Governor Rick Snyder; Former
Republican Governor John Engler
Key GroupsBusiness Leaders for Michigan, Great Lakes
Education Project2, Regional Chamber,
the Business Roundtable, Michigan Department
of Education, State Board of Education,
Michigan PTA, Michigan Association of
Secondary School Principals, Michigan
Association of School Boards, State
Universities of Michigan, and the Michigan
College Access Network
Key PolicymakersState Senator Phil Pavlov,
chair of the Senate Education
Committee; Senator Patrick
Colbeck sponsored 2016
repeal bill; State
Representative Tom McMillin
(now elected School Board
member) sponsored 2013
repeal bill
Key Groups Stop Common Core Michigan
Michigan
policymakers &
organizations
took varying
stances on the
Common Core…

23
Michigan’s accountability system previously assigned
schools to one of five color levels based on multiple factors
Components of color rating
Participation rate on
state assessments
Proficiency rate on state
assessments
Graduation OR
attendance rates
Educator evaluations
Compliance factors
Education Policy Landscape and Recent Changes
100%
40%
0%
20%
80%
60%
5%
State Accountability
Scorecard
11%
43%
38%
2%
Lime
Share of Schools, 2015-16
Yellow
Orange
Green (Highest performance)
Red (Lowest performance)
Source: Michigan Department of Education,
MISchoolData.org
This system is currently being revised under
the Every Student Succeeds Act (ESSA)

24
Michigan’s school finance system is controlled by the state,
challenges in equity remain
Sources: State of Michigan, Michigan House and
Senate, NCES, Michigan Education Finance Study
2016
Recent Developments
• Since 1994, the local share of nonfederal funding has fallen from 69% to 20%
• A recent study found that Michigan's school finance system is “moderately
inequitable,” even when federal sources are taken into account, and may have
become more inequitable in recent years
Current System• Districts receive per-pupil funding amount
called a “foundation allowance,” initially
determined in 1994-95
• Most school districts – and all charter
schools – currently receive minimum
allowance, $7,511 per pupil for 2016-17
• Foundation allowance payments comprise
nearly two-thirds of the state’s K-12 budget
Early 1990s Reforms• P.A. 145 (1993) drastically reduced local
property taxes as a source of revenue for
education
• Prop A (1994) raised sales tax and other
state taxes to account for the reduction
• These reforms shifted the bulk of Michigan
school funding from local to state sources
Education Policy Landscape and Recent Changes

25
Per-pupil spending in Michigan is on par with the U.S.
average per-pupil spending
Education Policy Landscape and Recent Changes
In the late 90s and early 2000s, MI per pupil spending was above the US average.
Today, spending is nearly identical.
Note: Nominal dollars, not adjusted for inflation. Expenditures per
student includes school operations, which represent about 90
percent of school expenditures on average. Amounts exclude
capital outlay, e.g. debt service on bonds. SY denotes the year in
which school ended, so SY99 is the 1998-1999 school year.
$10,000
$8,000
$12,000
$6,000
$4,000
$2,000
$0SY99 SY00 SY01 SY02 SY03 SY04 SY05 SY06 SY07 SY08 SY09 SY10 SY11 SY12 SY13 SY14
National Average Michigan
Sources: NCES, Census
Total Expenditures per Student, Michigan and National Average, SY99-SY14 (nominal dollars)

26
Michigan policies have aggressively expanded school
choice options in multiple waves over past 25 years
Sources: Michigan legislature, Mackinac Center,
Education Sector, Public Sector Consultants, Inc.
1993• P.A. 284: First charter school law is passed; replaced by P.A. 362 to better withstand legal
challenge
1994• Circuit court, Michigan Court of Appeals rule charter schools are ineligible for state monies
• P.A. 416: Responds to courts’ findings with new language and a provision negating P.A. 416 and
reinstating P.A. 362 if the Michigan Supreme Court found the latter constitutional
1995 • P.A. 289: Caps the total number of charter schools that state universities may authorize
1996 • P.A. 300: Creates Michigan’s first inter-district choice program
1997 • Michigan Supreme Court determines P.A. 362 is constitutional, negating P.A. 416
1999 • P.A. 119: Inter-district choice program expands
2000• Proposal 1: Failed ballot initiative financed by Betsy and Dick DeVos would allow students to use
tuition vouchers at nonpublic schools in districts with graduation rate under 2/3rds.
2003 • P.A. 179: Allows 15 “Urban High School Academies,” university-authorized charter high schools
in Detroit
2009 • Adopted a “smart cap” for charter schools with a demonstrated record of performance to be
exempt from the state's limit on charter schools and allowed to expand beyond the cap
2011 • P.A. 277: Gradually eliminates the cap on charter schools state universities may authorize
2012 • P.A. 129: Gradually increases the cap on cyber schools and cyber school enrollment
Education Policy Landscape and Recent Changes

27
Table of Contents
1 Michigan Student Demographics and Achievement
2 Education Policy Landscape and Recent Changes
3 Charter Schools and School Choice Policies
4 Education Reform in Detroit
28
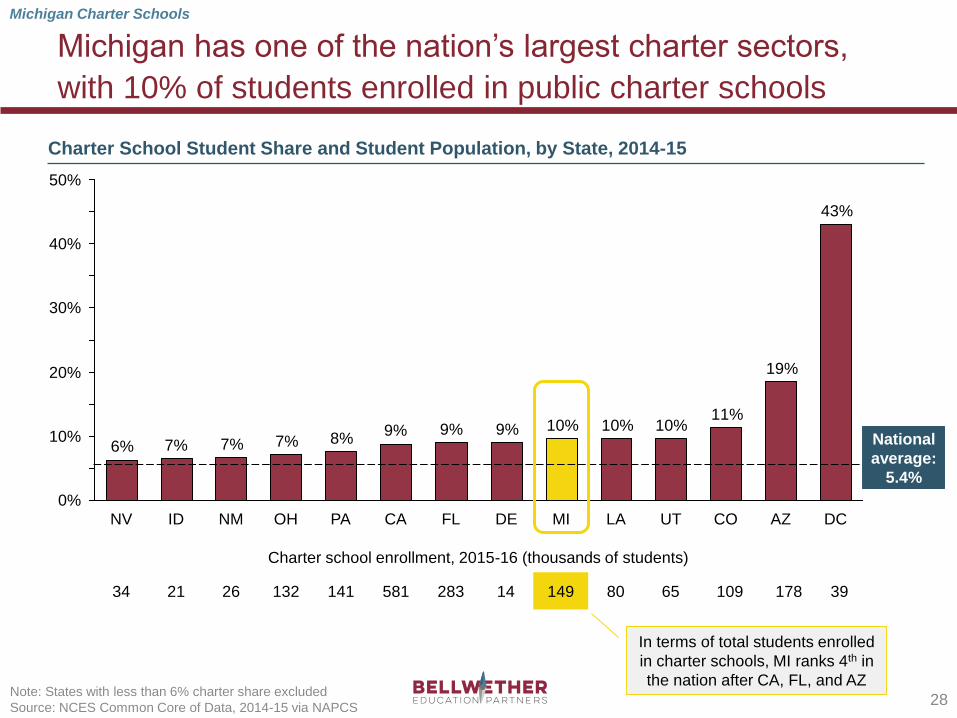
Michigan has one of the nation’s largest charter sectors,
with 10% of students enrolled in public charter schools
43%
19%
11%10%10%10%9%9%9%
8%7%7%7%6%
40%
50%
30%
20%
10%
0%
CANM MI LAOH PA DE DCAZFLNV COUT
5.4
ID
Note: States with less than 6% charter share excluded
Source: NCES Common Core of Data, 2014-15 via NAPCS
Charter school enrollment, 2015-16 (thousands of students)
34 21 26 132 141 581 283 14 149 80 65 109 178 39
National
average:
5.4%
Charter School Student Share and Student Population, by State, 2014-15
Michigan Charter Schools
In terms of total students enrolled
in charter schools, MI ranks 4th in
the nation after CA, FL, and AZ

29
0
50
100
150
200
250
300
350
0
20
40
60
80
100
120
140
160
1995 '96 '97 '98 '99 '00 '01 '02 '03 '04 '05 '06 '07 '08 '09 '10 '11 '12 '13 '14 '15 '16
# charter schools# students, in
thousands
Sources: Michigan Department of Education 1995-98,
NAPCS 1999-2016
Students
Schools
Number of Charter Schools and Student Enrollment Over Time
Michigan Charter Schools
5% annual growth
since 2010
The number of MI charter students has grown dramatically,
and in recent years has been growing at 5% annually

30
Nine Michigan cities have at least 10% of students enrolled
in charter schools
Michigan Charter Schools
Detroit
FlintGrand Rapids
LansingPort Huron
Wayne-
Westland
Kentwood
Traverse
City
Plymouth-Canton
Source: NAPCS, 2016,
“A Growing Movement: America’s Largest Public Charter
School Communities and their Impact on Student Outcomes”
Size of bubble reflects
approximate relative number
of charter school students
Michigan cities with at least 10% of
students in public charter schools
CityEnrollment
Share
Total
Students
Detroit 53% 51,240
Flint 53% 5,940
Grand Rapids 31% 6,890
Lansing 18% 2,380
Port Huron 16% 1,640
Wayne-Westland 14% 1,880
Kentwood 14% 1,390
Traverse City 12% 1,360
Plymouth-Canton 11% 2,210

31
Michigan public charter schools enroll a much larger share of
black and low-income students than the statewide average
8% 7%
52%
18%
34%
67%
100%
80%
60%
40%
20%
0%
Michigan
Schools Overall
Michigan
Charter Schools
Student Population by Race/Ethnicity and Income
Michigan Charter Schools
Sources: Income via Michigan Department of Education,
2014-15; Race/Ethnicity via NAPCS, 2013-14
Other
Asian
Hispanic
Black
White
70%
46%
Michigan
Schools Overall
Michigan
Charter Schools
Race / Ethnicity Low-Income

32
Students in Michigan charter schools learn more over the
course of the year than comparable students in district schools
-140
-120
-100
-80
-60
-40
-20
0
20
40
60
80
100
120
1008060-40 40-80 0 20-60 -20-120
MA
RIDC
NM
MO
LA
FL
Michigan
NV
CO
UT
IL
PA
CA
AKOH
NC
IN
TX
MN
OR
AZ
NY
NJ
GA
TN
Source: CREDO National Charter School Study (2013)
across 27 states for time period. Study sample includes
data from school years 2008-2011.
Charter Learning Impact, in Days
• Charter schools in Michigan produced
significant learning gains in reading and
math versus district peers:
– Gains of 43 days in reading and math
– One of 12 states with positive results in
both subjects
• However, the bar for performance in
Michigan is low compared to many other
states and cities
– Michigan charters are
disproportionately located in Detroit,
which has the nation’s lowest
performing public school system (see
Section 4)
– Study does not include charter schools
opened after 2011
Michigan Charter Schools
A 2013 CREDO study compares charter
students’ growth to demographically
similar students attending traditional
public schools
Ma
th
Reading

33
Charter schools have a greater share of bottom-tier schools
than the state average, but fewer than Detroit Public Schools
Source: Michigan Department of Education Accountability
Determinations 2015-16
School Accountability System Ratings, 2015-16
Michigan Charter Schools
21%11%
23%
51%8%
5%
9%
12%
42%
43%
46%
29%
27%
38%
21%
8%
0%
10%
20%
30%
40%
50%
60%
70%
80%
90%
100% 2%
Michigan Statewide Detroit Charter Schools
2% 0%2%
Detroit Public SchoolsMichigan Charter Schools
Lowest Highest
State Accountability Scorecard Ratings
Statewide DetroitPercent of Schools, 2015-16

34
Michigan has a higher percentage of charter schools run by
for-profit entities than any other state
Michigan Charter Schools
71%
16%
11%
28%
17%
55%
0%
20%
40%
60%
80%
100%
National Charter
Schools
Pe
rce
nt o
f S
ch
oo
ls
Michigan
Charter Schools
Source: NAPCS, 2014-15
Charter School Management Organizations Types, Michigan and National
Charter schools not
connected to any CMO or
EMO
Independent
Schools
Charter
Management
Organization
(CMO)
Education
Management
Organization
(EMO)
Nonprofit operator that
operated more than two
public charter schools during
this time period
For-profit operator that
operated multiple public
charter schools during this
time period, including virtual
operators

35
Multiple factors cause Michigan’s charter operators to look
different from national operator trends
Michigan Charter Schools
• Every charter school in Michigan is incorporated with a nonprofit board, however
Michigan law permits boards to contract with education service providers (ESPs),
which may be nonprofit or for-profit.
– ESP contracts can range in scope from full-service school management to limited
“back office” HR and administrative support.
– An estimated 61% of for-profit Michigan ESPs have responsibility for academics in
schools.*
• Under Michigan law, teachers employed by charter schools must participate in the state
pension system at an approximate cost of 25% of payroll, while teachers employed
indirectly by management firms do not participate. This creates an incentive for
charter schools to contract with staffing management firms to lower costs.
• Large Education Management Organizations (EMOs) such as National Heritage
Academies, CS Partners, and The Leona Group collectively operate more than 1 in 4
charter campuses in the state. Michigan is also home to many small EMOs that operate
only one or two schools.*
• Few high-performing, multi-state, nonprofit charter management organizations,
such as KIPP, Uncommon Schools, or Achievement First, have chosen to operate in
Michigan.*Source: Michigan Association of Public School
Academies/Grand Valley State University Charter Operator
Estimates

36
Michigan schools associated with for-profit entities produce
larger learning gains than other charter schools
Source: CREDO Charter School Performance in Michigan
(2013); CREDO Charter School Growth and Replication
(2013), which includes data from 2007-2011
Michigan Charter Schools
0.070.06
0.01
0.09
0.04
0.02
0.00
0.01
0.02
0.03
0.04
0.05
0.06
0.07
0.08
0.09
0.10
Learning Growth (in standard deviations)
National EMO
Schools
Michigan Non-EMO
Charter Schools
Michigan EMO-Run
Schools
Reading
Math
Learning Impact of Michigan Charter Schools, by Education Management Organization (EMO) Affiliation
Michigan EMO impacts are significantly larger than nationally aggregated EMO results, though this
is impacted by differences in traditional public schools to which EMO-run charters are compared.
The math advantage of EMO
schools in Michigan is roughly
equivalent to 1.8 months of
learning over non-EMO charters.

37
Presence of multiple authorizers and lack of authorizer
accountability has decentralized responsibility for charter quality
Source: Michigan Department of Education
Authorizer # Schools
Central Michigan University 62
Grand Valley State University 59
Bay Mills Community College 42
Lake Superior State University 22
Ferris State University 20
Saginaw Valley State University 18
Detroit City School District 13
Eastern Michigan University 10
Northern Michigan University 9
Oakland University 9
All Other Authorizers (34) 40
34 authorizers are
responsible for 3
schools or fewer each
Michigan Charter Schools
• The Michigan Department of
Education has authority to suspend
an authorizer’s ability to issue new
charters; they have not yet done so.
• 11 authorizers were identified
as “at-risk” for suspension for
the first time in 2014.
• 4 remained “at-risk” in 2015,
and were slated to receive
increased technical assistance
from the state
• There are new restrictions and
processes for authorizers seeking to
open new schools in Detroit;
currently only Grand Valley State
University and Central Michigan
University are accredited to
authorize new schools in Detroit.
More than 40 authorizers oversee
charter schools in MichiganThe state is gradually increasing its
scrutiny of authorizers

38
Michigan Charter Schools
Michigan has also expanded choice through robust inter-
district choice policies
Source: Michigan Department of Education
• In 2015-16, approximately 200,000
students— or 13% of all Michigan
students— participated in some sort of
inter-district choice program.
• District participation in these programs is
voluntary, and participating districts may
limit the number of students they choose to
enroll.
• State Level Policy: Under Sections 105
and 105c of the School Aid Act, school
boards may allow students to enroll from
within nearby districts.
• Local Level Policy: A collection of school
districts may establish “Cooperative
Agreements” that permit inter-district
enrollment, or enroll nonresident students
on a case-by-case basis.No Inter-District Choice Local Program
State Program
87%
8%
5%
Percentage of All Michigan Students Participating in Inter-District Choice, by Program

39
Table of Contents
1 Michigan Student Demographics and Achievement
2 Education Policy Landscape and Recent Changes
3 Charter Schools and School Choice Policies
4 Education Reform in Detroit

40
Number of Schools
Detroit is home to 97,340 students, primarily low income
and black, and a variety of educational options
Number and Percentage
of Charter Students
51,240 53%
Population Trends
DPS: 104
Charter: 64
Sources: National Alliance for Public Charter Schools, Michigan
Department of Education, Bellwether Education Partners.
* = 2013-14 data.
Cities: DetroitEducation Reform in Detroit
Low Income* (Free and reduced lunch)Demographics*
Charter
Students
Non-Charter
Students
Black
Latino
White
Asian
Other
Charter StudentsNon-Charter
Students
Low Income
Not Low
Income
Annual Growth Rate of Charters
64
45
0
10
20
30
40
50
60
70
2015 201620142009 20122010 201320112006 2007 2008
+3.3%
# schools
Since 1994, Detroit’s population
declined 33% while DPS
enrollment declined 73%

41
Detroit Public Schools produce significantly worse
outcomes than other large, urban districts
Education Reform in Detroit
21% 20%21%
32%
23%
36%
73%
41%
73%
38%
6%6%6%0%
20%
40%
60%
80%
100%
4%
TUDA
Large Cities
% of students
TUDA
Large Cities
DetroitDetroit
Advanced
Proficient
Basic
Below Basic
National Assessment of Educational Progress (NAEP) Trial Urban District Assessment (TUDA)
Results, 2015
Note: Detroit data do not include charter schoolsSource: NAEP TUDA 2015
4th Grade Reading 8th Grade Math

42
Nationally, Detroit is tied with Flint for the second-highest
percentage of students in charter schools
30% and above
Note: Percentages represent market share of local districts.
Source: NAPCS
Detroit is one of three school districts in Michigan to have more than 30% of
students in charter schools
Detroit: 53%
San Antonio: 30%
Cleveland: 31%
New Orleans: 92%
D.C.: 45%
Education Reform in Detroit
Dayton: 31%
50% and above
Flint: 53%
Grand Rapids: 31%
Gary: 43%
Indianapolis: 31%St. Louis: 30%
Kansas City: 40%
Philadelphia: 32%
Camden City: 34%
Victory Valley Union: 31%
Natomas Unified: 30%
Newark City: 30%

43
50
65
0
10
20
30
40
50
60
70
ReadingMath
-150
-100
-50
0
50
100
150
200
250
100600 804020-40 180-60 -20 160140120
Bay Area
Boston
West Palm Beach
Tucson
Ma
th
Atlanta
Colorado Springs
Chicago
AustinColumbus
Cleveland
Phoenix
Milwaukee
NYC
Miami
Tampa South Bay
Orlando
Newark
San Antonio
New Orleans
Philadelphia
Minneapolis
Southern CADC
Las Vegas
Memphis
Jacksonville
Denver
Dallas
Fort Worth
Fort Myers
Indianapolis
Mesa
Detroit
Houston
El Paso
Performance
Source: CREDO Urban Charter School Study (2015).
Study sample includes data from school years 2008-2012.
Education Reform in Detroit
Students in Detroit charter schools learn more over the
course of the year than comparable students in DPS
Detroit Charter Schools vs. Detroit Public
Schools
Selected Urban Charter Schools vs. Local
District Schools
More days of learning
in charters
More days of learning
in local district
Reading
Detroit Charter Sector Learning Impact, in Days

44
Declining population in Detroit and presence of school choice
options has caused an enrollment decline in DPS
Education Reform in Detroit
• Since 1994, Detroit’s total population has declined 33% while DPS enrollment
declined 73%
• Since 2000, the population of Detroit ages 0-19 has declined 41%, and DPS has
also lost students to charter schools and inter-district choice options
Sources: U.S. Census Bureau, U.S. Department of
Education, and the Michigan House Fiscal Agency.
DPS’ General Fund revenues have declined by more than 50% over the past
decade due to population and enrollment trends
200
0
400
600
1,000
800
1,200
Population (Thousands)
173K
‘11‘00‘94 ‘96 ‘97 ‘07‘95 ‘08‘04‘02 ‘06 ‘10‘05 ‘09‘03‘01‘99‘98
1M
Detroit Popoulation677K
‘14‘13
DPS Enrollment
‘12 ‘15
47K
Year
Detroit Population and Detroit Public Schools (DPS) Enrollment, 1994-2015
45
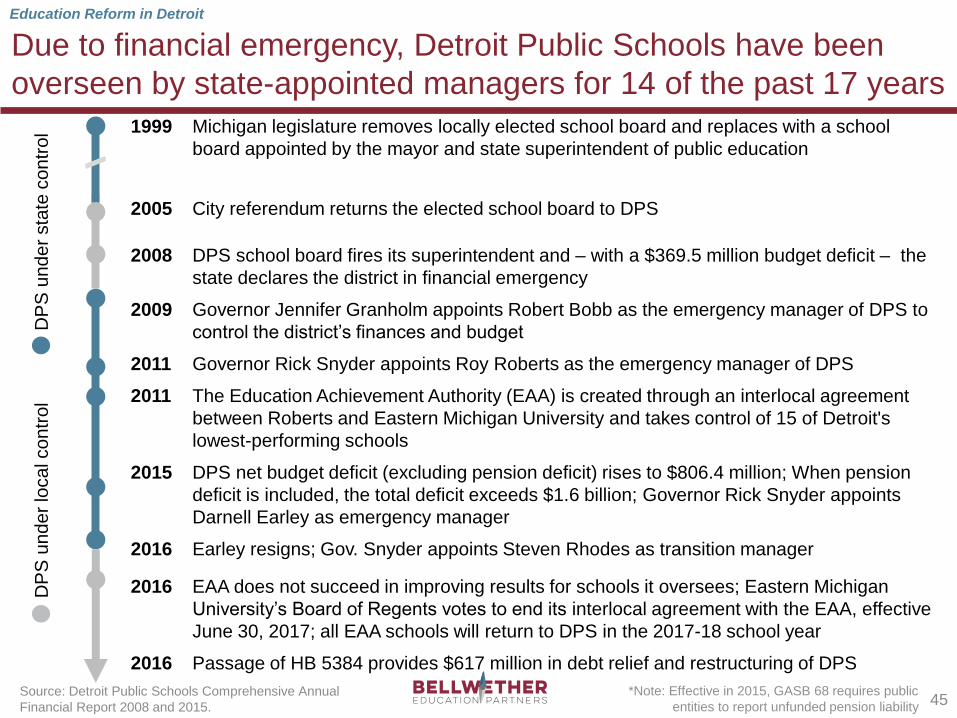
Due to financial emergency, Detroit Public Schools have been
overseen by state-appointed managers for 14 of the past 17 years
Education Reform in Detroit
1999 Michigan legislature removes locally elected school board and replaces with a school
board appointed by the mayor and state superintendent of public education
2005 City referendum returns the elected school board to DPS
2008 DPS school board fires its superintendent and – with a $369.5 million budget deficit – the
state declares the district in financial emergency
2009 Governor Jennifer Granholm appoints Robert Bobb as the emergency manager of DPS to
control the district’s finances and budget
2011 Governor Rick Snyder appoints Roy Roberts as the emergency manager of DPS
2011 The Education Achievement Authority (EAA) is created through an interlocal agreement
between Roberts and Eastern Michigan University and takes control of 15 of Detroit's
lowest-performing schools
2015 DPS net budget deficit (excluding pension deficit) rises to $806.4 million; When pension
deficit is included, the total deficit exceeds $1.6 billion; Governor Rick Snyder appoints
Darnell Earley as emergency manager
2016 Earley resigns; Gov. Snyder appoints Steven Rhodes as transition manager
2016 EAA does not succeed in improving results for schools it oversees; Eastern Michigan
University’s Board of Regents votes to end its interlocal agreement with the EAA, effective
June 30, 2017; all EAA schools will return to DPS in the 2017-18 school year
2016 Passage of HB 5384 provides $617 million in debt relief and restructuring of DPS
DP
S u
nd
er
sta
te c
on
tro
lD
PS
un
de
r lo
ca
l co
ntr
ol
*Note: Effective in 2015, GASB 68 requires public
entities to report unfunded pension liability
Source: Detroit Public Schools Comprehensive Annual
Financial Report 2008 and 2015.
46
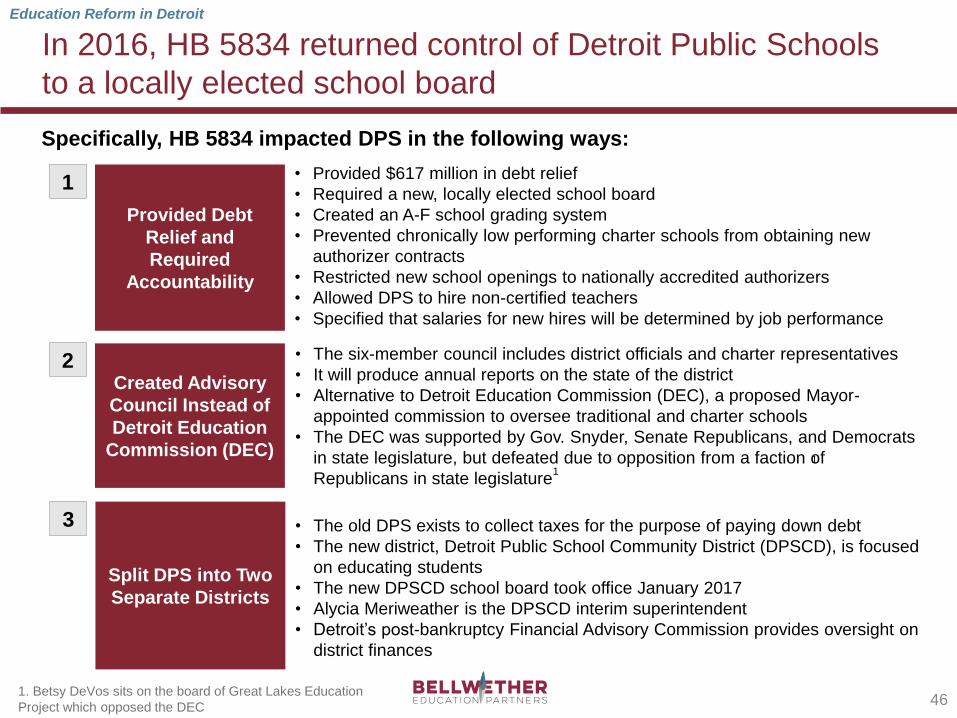
In 2016, HB 5834 returned control of Detroit Public Schools
to a locally elected school board
Education Reform in Detroit
Provided Debt
Relief and
Required
Accountability
• Provided $617 million in debt relief
• Required a new, locally elected school board
• Created an A-F school grading system
• Prevented chronically low performing charter schools from obtaining new
authorizer contracts
• Restricted new school openings to nationally accredited authorizers
• Allowed DPS to hire non-certified teachers
• Specified that salaries for new hires will be determined by job performance
Created Advisory
Council Instead of
Detroit Education
Commission (DEC)
• The six-member council includes district officials and charter representatives
• It will produce annual reports on the state of the district
• Alternative to Detroit Education Commission (DEC), a proposed Mayor-
appointed commission to oversee traditional and charter schools
• The DEC was supported by Gov. Snyder, Senate Republicans, and Democrats
in state legislature, but defeated due to opposition from a faction of
Republicans in state legislature
Split DPS into Two
Separate Districts
• The old DPS exists to collect taxes for the purpose of paying down debt
• The new district, Detroit Public School Community District (DPSCD), is focused
on educating students
• The new DPSCD school board took office January 2017
• Alycia Meriweather is the DPSCD interim superintendent
• Detroit’s post-bankruptcy Financial Advisory Commission provides oversight on
district finances
Specifically, HB 5834 impacted DPS in the following ways:
1
2
3
1. Betsy DeVos sits on the board of Great Lakes Education
Project which opposed the DEC
11

47
Key Takeaways
• Michigan is in the bottom half of all states on NAEP, and Michigan’s achievement
gaps are large and persistent across many student performance metrics.
• Michigan policymakers have aggressively moved to expand school choice options
over the past 25 years, through charter schools and inter-district choice, but oversight of
those options has been decentralized and uneven, leading to the proliferation of low-
performing charter schools in some communities.
• Charter schools in Michigan and in Detroit produce greater learning gains on average
than district schools for comparable student populations, but student performance in
the charter sector is low on average, and school quality varies widely.
• Michigan has the nation’s highest percentage of charter schools managed by for-
profit entities. Critics see these schools as having incentive to expand too quickly and
underinvest in students, but for-profit schools in Michigan see greater academic impact
on average than traditional district schools or other charter schools.
• Under Michigan’s education system, educational authority is split between multiple
state players and many authorizers, creating a lack of clarity as to which entity is
accountable for student results and the health of the system as a whole.
• Repeated efforts to improve Detroit Public Schools academically and financially have
failed to produce results. The issues in Detroit Public Schools have worsened as
enrollment declines due to population loss and competition from inter-district choice
and charter schools.

48
Acknowledgements
Bellwether Education Partners would like to express gratitude for the generous support
from the Walton Family Foundation for this project.
We would also like to thank the following individuals who provided advice and thoughtful
feedback on this project: Kristina Campa-Gruca, Excellent Schools Detroit; Dan
Quisenberry, Michigan Association of Public School Academies; and Buzz Thomas,
Thomas Consulting Group and former Michigan State Senator and Representative.
Bellwether contributors to this report include: Allison Baron; Phillip Burgoyne-Allen; Sarah
Kramer; Ashley LiBetti Mitchel; and Andrew Rotherham.
The views and opinions expressed in this report, however, are the responsibility of the
authors alone and should not be interpreted to reflect the views of others.