Conditioners for Hay and Haylage Dr. Dan Undersander University of Wisconsin.

Michigan Agricultural Statistics
2014-2015

All tables contain Michigan data unless otherwise noted. In some tables, details may not add to the total shown due to rounding.
Contents
Farm Economics ........................................... 1 National rankings .................................................. 1 Farm numbers and land in farms .......................... 2 Farm income ......................................................... 2 Prices received, livestock ...................................... 8 Farm marketings .................................................. 9 Prices received, crops ......................................... 10 Production expenses ........................................... 11 Farm Labor .......................................................... 11 Agricultural Exports ............................................. 12
Field Crops .................................................. 13 Weather summary ............................................... 13 Area and value .................................................... 13 Record highs and lows ........................................ 14 Barley .................................................................. 15 Corn ..................................................................... 15 Dry edible beans ................................................. 18 Hay and haylage ................................................. 20 Maple syrup ......................................................... 21 Mint ...................................................................... 21 Oats ..................................................................... 21 Potatoes .............................................................. 22 Soybeans ............................................................ 23 Sugarbeets .......................................................... 26 Wheat .................................................................. 26
Chemical ...................................................... 28 Asparagus ........................................................... 28 Carrots ................................................................. 28 Sweet Corn .......................................................... 28 Cucumbers .......................................................... 29 Pumpkins ............................................................. 30 Squash ................................................................ 30 Corn ..................................................................... 31 Potatoes .............................................................. 32
Fruit .............................................................. 33 Record highs and lows ........................................ 33 Fruit Acres, Production and Value ...................... 34 Apples.................................................................. 35 Blueberries .......................................................... 35 Cherries, sweet ................................................... 36 Cherries, tart ........................................................ 36 Grapes ................................................................. 37 Strawberries ........................................................ 38 Refrigerated warehouses .................................... 38
Vegetables ................................................... 39 Record highs and lows ........................................ 39 Processing ........................................................... 40 Fresh market........................................................ 41 Dual purpose ....................................................... 42 U.S. Pickle stocks ................................................ 42
Horticulture .................................................. 43 Growers and growing area .................................. 43 Floriculture crops ................................................. 43 Bedding plants ..................................................... 45 Hanging baskets .................................................. 46 Potted flowering and annual bedding plants ....... 47 Herbaceous perennials ........................................ 49
Livestock, Dairy, & Poultry ......................... 50 Record highs and lows ........................................ 50 Cattle and calves ................................................. 50 Dairy .................................................................... 52 Hogs and pigs ...................................................... 55 Honey .................................................................. 57 Mink ..................................................................... 57 Poultry .................................................................. 58 Sheep .................................................................. 59 Goats ................................................................... 60 Trout .................................................................... 60
County Estimates ........................................ 61 County rankings ................................................... 62 Corn .................................................................. 63 Dry edible beans .............................................. 65 Oats .................................................................. 66 Soybeans ......................................................... 68 Sugarbeets ....................................................... 70 Wheat ............................................................... 71 Cash Rents ....................................................... 73 Cattle ................................................................ 75
Customer Service Agriculture internet sites ................. Appendix A 76 Internet and other services ............. Appendix B 77

Charts and Graphs
Major Michigan Commodity Groups, 2014 .............................. 3 Top 20 Commodities in Gross Value, 2014 ............................. 3 Corn for grain acres, 1939-2014 ........................................... 16 Corn yield, 1939-2014 ........................................................... 16 Corn production, 1939-2014 ................................................. 16 Corn progress, 2010-2014 .................................................... 18 Soybean progress, 2010-2014 .............................................. 24 Soybean harvested acres, 1939-2014 ................................... 25 Soybean yield, 1939-2014 .................................................... 25 Soybean production, 1939-2014 ........................................... 25 Wheat harvested acres, 1939-2014 ...................................... 27 Wheat yield, 1939-2014 ........................................................ 27 Wheat production, 1939-2014 ............................................... 27 Selected Floriculture Crops: Value of Sales, 2014 ................ 44 Michigan Livestock: Value of Production, 2014 ..................... 51 Annual Milk per Cow, 1988-2014 .......................................... 52 December 1 Hog Inventory, 1939-2014 ................................ 55 Agricultural Statistics Districts ............................................... 61

Rank in U.S. agriculture by selected commodities, 2014
Rank Item Unit Quantity Percent of U.S. Leading state
1
Thousands Percent
Beans, dry, black Cwt 2,264 56.6 Michigan
Beans, dry, cranberry Cwt 57 75.0 Michigan
Beans dry, navy Cwt 1766 39.9 Michigan
Beans, dry, small red Cwt 359 50.7 Michigan
Begonias Baskets 511 28.3 Michigan
Begonias Flats 742 19.2 Michigan
Blueberries Pounds 99,000 17.2 Michigan
Cucumbers for pickles Tons 167.1 34.7 Michigan
Cherries, tart Pounds 203,000 66.8 Michigan
Easter Lilies Pots 1,518 26.4 Michigan
Geraniums, from seed Pots 8,548 51.4 Michigan
Geraniums, vegetative cuttings Baskets 760 23.4 Michigan
Hostas Pots 2,139 23.7 Michigan
Impatiens, other Baskets 552 29.7 Michigan
Impatiens, other Flats 1,274 27.6 Michigan
Other Flowering and Foliar Baskets 3,398 26.3 Michigan
Petunias Baskets 1,273 23.6 Michigan
Petunias Flats 1,331 19.8 Michigan
Petunias Pots 4,253 17.0 Michigan
Squash Cwt 1,200 20.9 Michigan
2
Asparagus Cwt 220 29.6 California
Beans, dry, all Cwt 4,749 16.3 North Dakota
Carrots (fresh market) Cwt 496 2.0 California
Celery Cwt 985 5.4 California
Grapes, Niagara Tons 20.0 28.4 Washington
Impatiens, New Guinea Pots 2,382 14.4 Florida
Marigolds Flats 566 15.7 California
Pansies/Violas Baskets 190 16.5 North Carolina
3
Apples Pounds 1,025,000 9.0 Washington
Alfalfa haylage and greenchop Tons 2,236 10.2 Wisconsin
Beans, dry, light red kidney Cwt 173 14.3 Minnesota
Chrysanthemums, hardy/garden Pots 5,947 12.2 California
Geraniums, from vegetative cuttings Pots 3,254 10.3 California
Other herbaceous perennials Pots 13,476 10.8 California
Vegetable type bedding plants Pots 4,396 9.7 California
4
Cherries, sweet Tons 22.9 8.2 Washington
Cucumbers (fresh market) Cwt 680 9.9 Florida
Grapes, Concord Tons 44.4 8.8 Washington
Sugarbeets Tons 4,410 14.0 Minnesota
Tomatoes (processing) Tons 129.2 0.9 California
5
All haylage and greenchop Tons 2,368 7.4 Wisconsin
Grapes Tons 63.3 0.8 California
Plums Tons 1.70 0.1 California
Pumpkins Cwt 970 7.4 Illinois
7
Corn for Silage Tons 6,560 5.1 Wisconsin
Milk Pounds 9,609,000 4.7 California
Maple Syrup Gallons 91 2.9 Vermont
Sweet Corn (Fresh) Cwt 828 3.3 Florida
8
Egg Production Eggs 3,867,000 3.9 Iowa
Peaches Tons 8.9 1.0 California
Potatoes Cwt 15,725 3.5 Idaho
11 Corn for grain Bushels 355,810 2.5 Iowa
12 Hogs, as of Dec. 1, 2014 Head 1,100 1.7 Iowa
13 Soybeans Bushels 92,020 2.3 Illinois
16 Wheat, winter Bushels 35,890 2.6 Kansas
19 Cash receipts Dollars 8,586,669 2.0 California
23 Hay, all, dry Tons 2,570 1.8 Texas
28 Cattle, as of Jan. 1, 2015 Head 1,140 1.3 Texas

2 FARM ECONOMICS MICHIGAN AGRICULTURAL STATISTICS 2014-2015
Farm Economics
Number of farms and land in farms by economic sales class, 2010-2014 1
Year
Economic sales class
Total
Average
size of
farm $1,000-
$9,999
$10,000-
$99,999
$100,000-
$249,999
$250,000-
$499,999 $500,000+
1,000 farms 1,000 farms 1,000 farms 1,000 farms 1,000 farms 1,000 farms
2010
2011
2012
2013
2014
29.40
28.50
27.00
26.30
25.80
15.30
15.20
15.50
15.30
14.80
3.65
3.90
3.80
3.90
4.20
2.10
2.10
2.35
2.60
2.70
2.85
3.00
3.55
3.90
4.10
53.30
52.70
52.20
52.00
51.60
Million acres Million acres Million acres Million acres Million acres Million acres Acres
2010
2011
2012
2013
2014
1.58
1.50
1.46
1.37
1.10
1.96
1.87
1.78
1.68
1.70
1.18
1.18
1.02
1.00
1.05
1.26
1.19
1.16
1.10
1.20
4.00
4.26
4.53
4.80
4.90
9.98
10.00
9.95
9.95
9.95
187
190
191
191
193
1 USDA estimates of farm number and land in farms are based on the definition "a farm is any establishment from which $1,000 or more of
agricultural products were sold or would normally be sold during the year."
Farm real estate: Values and cash rents, 2011-2015
Year
Farm real
estate average
value per acre
Cropland Pasture
Average value
per acre
Average cash
rent per acre
Average value
per acre
Dollars Dollars Dollars Dollars
2011
2012
2013
2014
2015
3,600
3,890
4,300
4,700
4,900
3,370
3,660
4,120
4,500
4,550
90
108
118
123
118
2,340
2,290
2,420
2,500
2,680
Government payments, 2010-2014 1
Program 2010 2011 2012 2013 2014
1,000 dollars 1,000 dollars 1,000 dollars 1,000 dollars 1,000 dollars
Conservation programs
BMAC-Biomass crop assistance
Direct payments
Counter-cyclical payments
Loan deficiency payments
Miscellaneous programs
Ad Hoc and emergency programs
Milk income loss payments
ACRE
Total
51,192
10,086
80,974
-2
-183
-105
36,416
2,496
3,724
184,599
58,034
676
78,994
-2
54
-62
18,480
18
376
156,567
61,281
194
78,198
0
1
-2
12,822
22,896
-5
175,384
52,098
0
71,160
0
-1
0
8,017
11,367
-224
142,418
46,053
43
318
0
0
0
14,053
25
-3
60,578
1 Source: U.S. Department of Agriculture, Economic Research Service.
MICHIGAN AGRICULTURAL STATISTICS 2014-2015 FARM ECONOMICS 3
0 300 600 900 1200 1500 1800 2100 2400 2700 3000
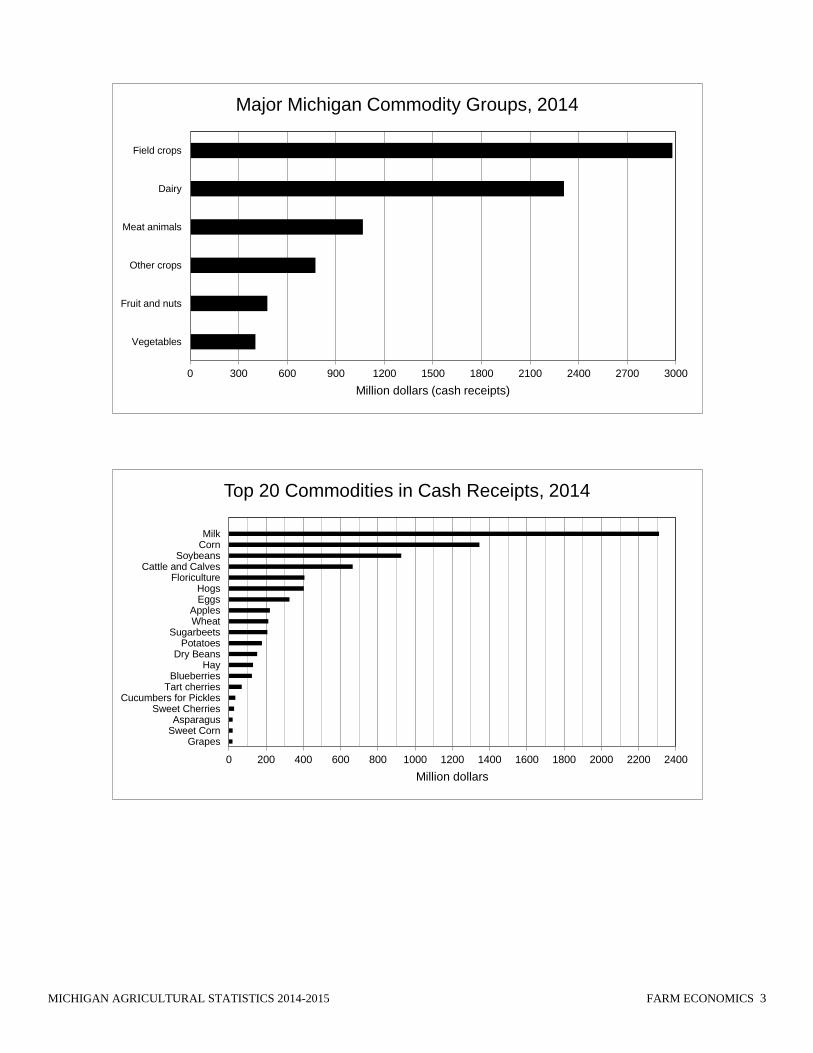
Vegetables
Fruit and nuts
Other crops
Meat animals
Dairy
Field crops
Million dollars (cash receipts)
Major Michigan Commodity Groups, 2014
0 200 400 600 800 1000 1200 1400 1600 1800 2000 2200 2400
GrapesSweet CornAsparagus
Sweet CherriesCucumbers for Pickles
Tart cherriesBlueberries
HayDry Beans
PotatoesSugarbeets
WheatApples
EggsHogs
FloricultureCattle and Calves
SoybeansCornMilk
Million dollars
Top 20 Commodities in Cash Receipts, 2014
4 FARM ECONOMICS MICHIGAN AGRICULTURAL STATISTICS 2014-2015
Value added to the economy by the Michigan agricultural sector 2010-2014 1
Item 2 2010 2011 2012 2013 2014
Million dollars Million dollars Million dollars Million dollars Million dollars
Value of crop production
Food grains
Feed crops
Oil crops
Fruits and tree nuts
Vegetables, potatoes, dry beans
All other crops
Home consumption
Value of inventory adjustment 3
Value of livestock production
Meat animals
Dairy products
Poultry and eggs
Miscellaneous livestock
Home consumption
Value of inventory adjustment 3
Farm related income
Forest products sold
Machine hire and custom work
Other farm income
Gross imputed rental value-farm dwellings
Value of agricultural sector production
less: Purchased inputs
Farm origin
Feed purchased
Livestock and poultry purchased
Seed purchased
Manufactured inputs
Fertilizers and lime
Pesticides
Petroleum fuel and oils
Electricity
Other intermediate expenses
Repair and maintenance of capital items
Machine hire and custom work
Marketing, storage, and transp. expenses
Miscellaneous expenses
Contract labor
plus: Net government transactions
Direct Government payments
Property taxes and fees
Gross value added
less: Capital consumption
Net value added
less: Payments to stakeholders
Employee compensation (total hired labor)
Net rent paid to landlords
Real estate and nonreal estate interest
Net farm income
3,878.3
207.1
1,219.4
871.6
308.3
503.5
962.4
1.6
-195.6
2,438.0
700.8
1,412.0
262.1
67.2
9.6
-13.7
629.5
7.5
39.1
186.3
396.7
6,945.9
3,573.3
1,280.9
692.4
98.9
489.6
1,185.7
597.4
222.6
280.3
85.5
1,106.7
370.3
118.5
100.8
517.2
33.1
-84.2
184.6
268.8
3,255.3
420.6
2,834.7
1,226.0
528.4
399.7
298.0
1,608.6
4,922.4
306.5
1,778.0
909.8
438.4
597.8
1,002.6
1.8
-112.6
3,030.4
850.9
1,774.3
299.0
71.0
9.7
25.5
941.7
3.7
226.5
371.6
339.9
8,894.5
3,906.9
1,385.3
692.4
83.2
609.6
1,334.2
593.3
265.2
367.6
108.2
1,187.4
368.8
70.2
95.7
652.7
15.1
-121.6
156.6
278.2
4,850.8
446.5
4,404.3
1,362.3
673.8
406.5
282.0
3,042.0
4,963.1
336.0
1,993.6
1,206.0
207.3
544.6
1,049.1
1.8
-375.3
2,997.1
829.8
1,694.4
343.3
74.6
10.7
44.4
1,076.2
3.2
77.0
659.0
337.0
9,036.4
5,213.1
2,057.6
1,127.2
166.2
764.2
1,614.9
769.9
318.9
401.8
124.3
1,540.6
466.2
104.7
165.0
804.6
161.7
-137.7
175.4
313.1
3,524.0
782.1
2,741.9
1,638.7
877.1
354.9
406.8
1,103.2
5,424.7
281.0
1,658.9
1,113.7
535.0
599.6
1,076.5
5.2
154.8
3,323.9
947.8
1,872.9
432.1
75.7
10.6
-15.2
938.7
5.6
70.9
448.4
413.8
9,687.3
5,235.5
2,053.4
1,122.8
152.8
777.9
1,623.0
735.7
364.4
415.3
107.6
1,559.1
499.6
98.4
149.5
811.5
23.3
-183.1
142.4
325.5
4,245.5
842.0
3,403.5
1,564.6
807.7
397.9
359.0
1,838.9
4,496.8
215.1
1,479.3
926.1
476.8
554.8
980.4
5.8
-141.7
3,991.7
1,067.2
2,309.5
498.0
79.3
9.0
28.7
933.8
7.7
123.0
344.5
458.6
9,422.3
5,625.7
2,239.2
1,345.3
150.7
743.2
1,674.1
731.2
338.1
465.4
139.4
1,712.4
526.6
127.6
248.9
809.3
51.0
-343.7
60.6
404.2
3,401.9
1,102.3
2,299.6
1,575.6
949.7
248.6
377.3
724.0
1 Source: U.S. Department of Agriculture, Economic Research Service. 2 Value of agricultural sector production is the gross value of the commodities and services produced within a year. Net value-added is the sector's
contribution to the National economy and is the sum of the income from production earned by all factors-of-production, regardless of ownership.
Net farm income is the farm operator's share of income from the sector's production activities. The concept presented is consistent with that
employed by the Organization for Economic Cooperation and Development. 3 A positive value of inventory change represents current-year production not sold by December 31. A negative value is an offset to production from
prior years included in current-year sales.

MICHIGAN AGRICULTURAL STATISTICS 2014-2015 FARM ECONOMICS 5
Cash receipts by commodity groups and selected commodities 2010-2014 1
Item 2010 2011 2012 2013 2014
1,000 dollars 1,000 dollars 1,000 dollars 1,000 dollars 1,000 dollars
Total cash receipts
Total livestock and products
Meat animals
Cattle and calves
Hogs
Dairy (milk)
Poultry and eggs
Miscellaneous livestock
Total crops Field crops
Corn
Dry beans
Hay
Soybeans
Sugarbeets
Wheat
Other
Vegetables
Asparagus
Cabbage, fresh
Celery
Corn, sweet (fresh)
Cucumbers, fresh
Cucumbers, processing
Onions
Peppers, bell
Potatoes
Pumpkins
Squash
Tomatoes, fresh
Tomatoes, processing
Other
Fruits and nuts
Apples
Blueberries
Grapes
Peaches
Strawberries
Sweet cherries
Tart cherries
Other
All other crops
Floriculture
Other
6,514,394
2,442,127
700,808
381,420
319,388
1,412,020
262,126
67,173
4,072,267
2,622,666
1,140,190
99,235
75,939
871,613
225,326
205,439
4,924
404,228
13,948
10,920
17,880
23,218
20,498
49,600
10,419
12,144
150,064
13,804
12,144
23,760
11,550
34,279
308,290
103,375
134,300
15,497
12,731
4,089
9,765
27,260
1,273
737,083
408,133
328,950
8,028,349
2,995,199
850,889
433,661
417,228
1,774,290
298,992
71,027
5,033,150
3,472,918
1,708,850
189,552
67,312
909,819
289,017
304,652
3,716
408,211
17,322
12,144
12,958
20,539
19,228
45,125
9,664
14,580
156,072
16,762
19,598
21,120
11,340
31,759
438,405
201,650
118,700
33,957
11,995
4,522
18,042
47,210
2,329
713,616
376,135
337,481
8,278,712
2,942,060
829,767
473,212
356,555
1,694,385
343,328
74,580
5,336,651
3,978,240
1,894,577
120,873
97,194
1,205,990
321,769
333,855
3,982
423,708
17,274
11,900
22,380
24,218
17,978
37,195
7,748
15,808
165,665
13,230
24,024
20,800
14,210
31,278
207,347
40,475
122,700
17,646
2,624
4,826
6,133
12,880
63
727,356
379,020
348,336
8,593,320
3,328,507
947,839
552,137
395,702
1,872,880
432,100
75,689
5,264,813
3,504,128
1,535,417
164,659
120,811
1,113,748
285,787
278,671
5,035
434,930
18,640
11,040
20,359
23,400
13,965
37,352
11,082
13,875
177,210
11,212
17,690
31,680
13,600
33,825
535,044
254,953
125,200
35,528
13,972
7,095
21,012
74,515
2,769
790,711
418,931
371,780
8,586,669
3,954,034
1,067,184
664,566
402,618
2,309,503
498,046
79,301
4,632,634
2,979,380
1,345,693
152,157
129,955
926,074
206,662
212,305
6,534
402,666
20,505
13,392
18,853
20,452
13,872
35,099
11,094
13,468
177,361
11,398
18,032
16,636
15,116
17,388
476,830
220,140
123,840
19,292
7,758
7,258
27,708
68,827
2,007
773,758
405,671
368,087
1 Source: U.S. Department of Agriculture, Economic Research Service. 2 Includes Barley, Oats, Mint, Rye, and all other miscellaneous crops.

6 FARM ECONOMICS MICHIGAN AGRICULTURAL STATISTICS 2014-2015
Corn production costs and returns, 2013-2014
Item United States Northern Crescent 1
2013 2014 2013 2014
Dollars per planted acre Dollars per planted acre Dollars per planted acre Dollars per planted acre
Gross value of production
Operating costs
Seed
Fertilizer 2
Chemicals
Custom operations
Fuel, lube, and electricity
Repairs
Purchased irrigation water
Interest on operating capital
Total, operating costs
Allocated overhead
Hired labor
Opportunity cost of unpaid labor
Capital recovery of machinery and equipment
Opportunity cost of land (rental rate)
Taxes and insurance
General farm overhead
Total, allocated overhead
Total, costs listed
Value of production less total costs listed
Value of production less operating costs
Supporting information
Yield (bushels per planted acre)
Price (dollars per bushel at harvest)
Enterprise size (planted acres) 3
Production practices 3
Irrigated (percent)
Dryland (percent)
720.51
97.59
153.33
28.57
17.77
32.27
25.79
0.12
0.16
355.60
3.12
24.40
96.86
167.74
9.19
19.54
320.85
676.45
44.06
364.91
156
4.61
280
11
89
603.18
101.04
149.23
29.20
18.24
32.80
26.17
0.12
0.12
356.92
3.16
24.75
100.15
175.60
9.34
19.88
332.88
689.80
-86.62
246.26
170
3.54
280
11
89
677.72
90.05
167.08
28.04
21.89
29.25
25.28
0.00
0.16
361.75
3.87
32.28
84.68
110.23
9.84
25.57
266.47
628.22
49.50
315.97
147
4.57
146
0
100
565.43
93.01
162.11
28.56
22.51
29.68
25.77
0.00
0.12
361.76
3.94
32.89
87.82
114.28
10.03
26.07
275.03
636.79
-71.36
203.67
156
3.58
146
0
100
1 Includes NE Minnesota, Wisconsin, Michigan, NE Ohio, Central Maryland, most of Pennsylvania, New Jersey, New York, and New England. 2 Includes soil conditioners and manure. 3 Developed from survey base year, 2010.

MICHIGAN AGRICULTURAL STATISTICS 2014-2015 FARM ECONOMICS 7
Soybean production costs and returns, 2013-2014
Item United States Northern Crescent 1
2013 2014 2013 2014
Dollars per planted acre Dollars per planted acre Dollars per planted acre Dollars per planted acre
Gross value of production
Operating costs
Seed
Fertilizer 2
Chemicals
Custom operations
Fuel, lube, and electricity
Repairs
Purchased irrigation water
Interest on operating capital
Total, operating costs
Allocated overhead
Hired labor
Opportunity cost of unpaid labor
Capital recovery of machinery and equipment
Opportunity cost of land (rental rate)
Taxes and insurance
General farm overhead
Total, allocated overhead
Total, costs listed
Value of production less total costs listed
Value of production less operating costs
Supporting information
Yield (bushels per planted acre)
Price (dollars per bushel at harvest)
Enterprise size (planted acres) 3
Production practices 3
Irrigated (percent)
Dryland (percent)
540.08
59.34
38.19
28.18
9.96
21.57
22.78
0.06
0.08
180.16
3.05
17.70
84.63
153.97
9.97
17.96
287.28
467.44
72.64
359.92
43
12.56
273
10
90
497.76
60.06
36.70
28.62
10.25
21.58
23.33
0.06
0.05
180.65
3.10
18.07
88.19
158.43
10.17
18.32
296.28
476.93
20.83
317.11
48
10.37
273
10
90
547.68
62.34
51.49
22.12
12.21
17.33
19.26
0.00
0.08
184.83
1.68
17.71
70.83
121.50
10.21
22.39
244.32
429.15
118.53
362.85
42
13.04
136
3
97
495.00
62.99
49.47
22.53
12.56
17.33
19.63
0.00
0.06
184.57
1.71
18.04
73.45
125.97
10.41
22.82
252.40
436.97
58.03
310.43
44
11.25
136
3
97
1 Includes NE Minnesota, Wisconsin, Michigan, NE Ohio, most of Pennsylvania, New Jersey, New York, Central Maryland, and New England. 2 Includes soil conditioners and manure. 3 Developed from survey base year, 2012.

8 FARM ECONOMICS MICHIGAN AGRICULTURAL STATISTICS 2014-2015
Milk and milk cow replacement prices received by farmers, 2014-2015
Month Milk cows per head 1 All milk wholesale per cwt
Dollars Dollars
2014
January
February
March
April
May
June
July
August
September
October
November
December
2015
January
February
March
April
May
June
July
August
September
October
November
December
1,650
1,850
1,950
2,100
2,200
2,100
2,100
2,100
23.50
24.90
25.20
25.40
24.50
23.50
23.70
24.40
26.20
24.30
23.00
20.50
17.60
16.60
16.20
16.20
16.00
16.00
15.90
16.00
17.20
17.30
17.80
16.50
1 Sold for dairy herd replacement only. Prices published January, April, July, and October.
MICHIGAN AGRICULTURAL STATISTICS 2014-2015 FARM ECONOMICS 9
Dry edible beans: Percent of sales by month, 2009-2014
Month 2009-10 2010-11 2011-12 2012-13 2013-14
Percent Percent Percent Percent Percent
Sept.
Oct.
Nov.
Dec.
January
February
March
April
May
June
July
August
27
29
10
8
7
3
1
1
1
2
11
23
18
12
3
2
6
3
5
3
5
1
19
13
58
9
2
2
1
1
3
2
4
1
4
18
35
8
7
5
3
4
1
2
3
1
13
18
53
10
4
3
1
1
1
1
2
1
5
Corn: Percent of sales by month, 2009-2014
Month 2009-10 2010-11 2011-12 2012-13 2013-14
Percent Percent Percent Percent Percent
Oct.
Nov.
Dec.
January
February
March
April
May
June
July
August
Sept.
5
16
13
11
6
6
6
6
8
9
6
8
21
11
9
14
8
8
8
5
5
4
4
3
10
22
10
14
9
8
6
5
5
5
3
3
14
20
7
10
7
8
4
5
9
7
5
4
7
16
11
13
10
8
7
6
5
7
6
4
Hay: Percent of sales by month, 2009-2014
Month 2009-10 2010-11 2011-12 2012-13 2013-14
Percent Percent Percent Percent Percent
June
July
August
Sept.
Oct.
Nov.
Dec.
January
February
March
April
May
13
10
11
8
8
6
8
6
7
7
8
8
14
15
11
7
7
8
8
7
8
7
4
4
10
9
10
9
7
7
10
8
9
8
8
5
18
19
14
6
7
6
8
4
5
5
4
4
12
11
10
8
9
9
7
7
8
7
6
6
Oats: Percent of sales by month, 2009-2014
Month 2009-10 2010-11 2011-12 2012-13 2013-14
Percent Percent Percent Percent Percent
July
August
Sept.
Oct.
Nov.
Dec.
January
February
March
April
May
June
2
47
26
5
2
1
3
3
5
1
2
3
26
52
4
2
2
3
3
1
4
1
1
1
6
52
13
5
4
1
8
1
1
5
3
1
22
25
2
2
1
2
5
2
5
2
5
27
16
54
8
3
1
1
1
6
6
1
2
1
Soybeans: Percent of sales by month, 2009-2014
Month 2009-10 2010-11 2011-12 2012-13 2013-14
Percent Percent Percent Percent Percent
Sept.
Oct.
Nov.
Dec.
January
February
March
April
May
June
July
August
1
33
24
7
11
5
4
4
2
4
3
2
13
41
8
6
11
5
4
3
2
3
2
2
1
34
14
8
12
10
9
5
3
2
1
1
7
40
11
5
11
6
3
3
5
4
3
2
3
32
20
8
12
8
4
4
3
3
1
2
Wheat: Percent of sales by month, 2009-2014
Month 2009-10 2010-11 2011-12 2012-13 2013-14
Percent Percent Percent Percent Percent
July
August
Sept.
Oct.
Nov.
Dec.
January
February
March
April
May
June
31
27
11
8
3
2
7
2
2
2
2
3
69
15
5
1
1
1
4
2
1
1
52
23
6
2
1
2
4
3
3
1
1
2
73
10
5
1
1
1
3
1
1
1
2
1
44
25
9
5
1
2
3
3
4
1
1
2
10 FARM ECONOMICS MICHIGAN AGRICULTURAL STATISTICS 2014-2015
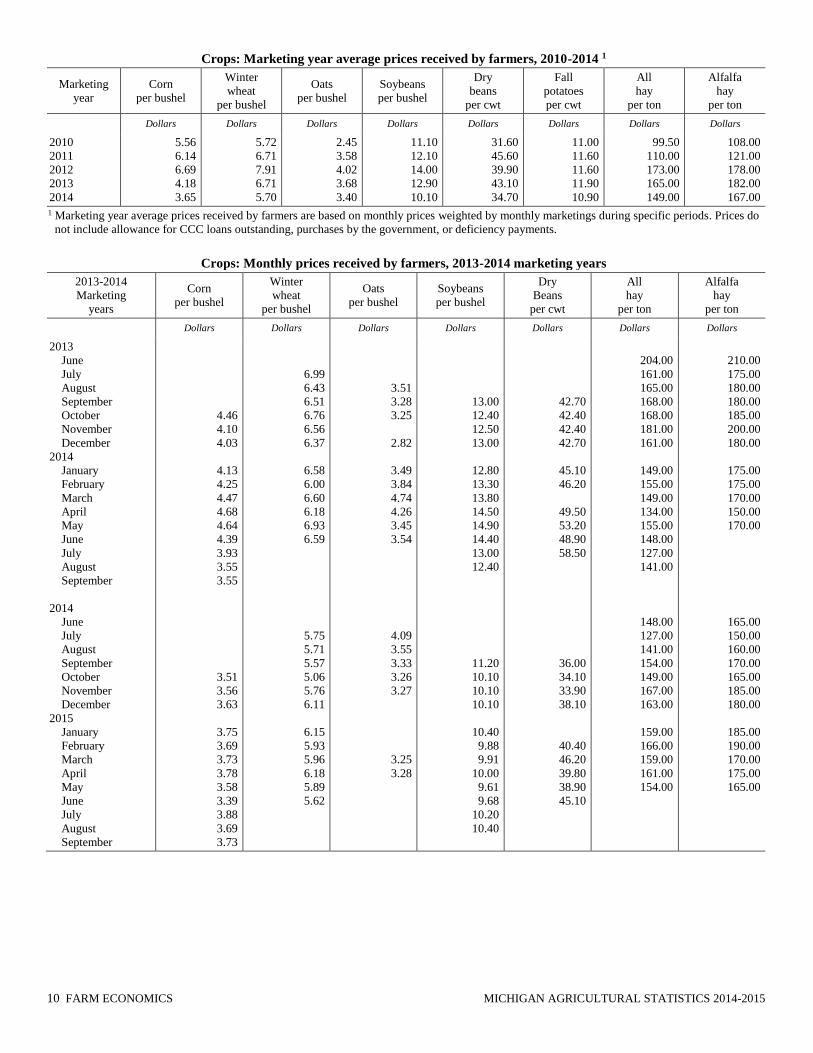
Crops: Marketing year average prices received by farmers, 2010-2014 1
Marketing
year
Corn
per bushel
Winter
wheat
per bushel
Oats
per bushel
Soybeans
per bushel
Dry
beans
per cwt
Fall
potatoes
per cwt
All
hay
per ton
Alfalfa
hay
per ton
Dollars Dollars Dollars Dollars Dollars Dollars Dollars Dollars
2010
2011
2012
2013
2014
5.56
6.14
6.69
4.18
3.65
5.72
6.71
7.91
6.71
5.70
2.45
3.58
4.02
3.68
3.40
11.10
12.10
14.00
12.90
10.10
31.60
45.60
39.90
43.10
34.70
11.00
11.60
11.60
11.90
10.90
99.50
110.00
173.00
165.00
149.00
108.00
121.00
178.00
182.00
167.00
1 Marketing year average prices received by farmers are based on monthly prices weighted by monthly marketings during specific periods. Prices do
not include allowance for CCC loans outstanding, purchases by the government, or deficiency payments.
Crops: Monthly prices received by farmers, 2013-2014 marketing years
2013-2014
Marketing
years
Corn
per bushel
Winter
wheat
per bushel
Oats
per bushel
Soybeans
per bushel
Dry
Beans
per cwt
All
hay
per ton
Alfalfa
hay
per ton
Dollars Dollars Dollars Dollars Dollars Dollars Dollars
2013
June
July
August
September
October
November
December
2014
January
February
March
April
May
June
July
August
September
2014
June
July
August
September
October
November
December
2015
January
February
March
April
May
June
July
August
September
4.46
4.10
4.03
4.13
4.25
4.47
4.68
4.64
4.39
3.93
3.55
3.55
3.51
3.56
3.63
3.75
3.69
3.73
3.78
3.58
3.39
3.88
3.69
3.73
6.99
6.43
6.51
6.76
6.56
6.37
6.58
6.00
6.60
6.18
6.93
6.59
5.75
5.71
5.57
5.06
5.76
6.11
6.15
5.93
5.96
6.18
5.89
5.62
3.51
3.28
3.25
2.82
3.49
3.84
4.74
4.26
3.45
3.54
4.09
3.55
3.33
3.26
3.27
3.25
3.28
13.00
12.40
12.50
13.00
12.80
13.30
13.80
14.50
14.90
14.40
13.00
12.40
11.20
10.10
10.10
10.10
10.40
9.88
9.91
10.00
9.61
9.68
10.20
10.40
42.70
42.40
42.40
42.70
45.10
46.20
49.50
53.20
48.90
58.50
36.00
34.10
33.90
38.10
40.40
46.20
39.80
38.90
45.10
204.00
161.00
165.00
168.00
168.00
181.00
161.00
149.00
155.00
149.00
134.00
155.00
148.00
127.00
141.00
148.00
127.00
141.00
154.00
149.00
167.00
163.00
159.00
166.00
159.00
161.00
154.00
210.00
175.00
180.00
180.00
185.00
200.00
180.00
175.00
175.00
170.00
150.00
170.00
165.00
150.00
160.00
170.00
165.00
185.00
180.00
185.00
190.00
170.00
175.00
165.00

MICHIGAN AGRICULTURAL STATISTICS 2014-2015 FARM ECONOMICS 11
Prices paid index for agricultural production items, U.S., base=2011
Commodity 2010 2011 2012 2013 2014
Feed, grains
Feed, complete
Feed, concentrates
Feed, forage
Nitrogen
Potash & Phosphate
Fungicides
Herbicides
Insecticides
Seeds & Plants
Cows, milk replacement
Feeder cattle
Feeder pigs
Fuels, diesel
Fuels, gasoline
Fuels, LP gas
Machinery, self propelled
Tractors
Trucks & Autos
Building materials
Supplies & Repairs
Labor
Custom Rates
Interest
Rent
Taxes
64
82
92
71
73
79
96
101
97
93
94
82
108
76
80
85
93
94
97
97
96
99
98
92
93
96
100
100
100
100
100
100
100
100
100
100
100
100
100
100
100
100
100
100
100
100
100
100
100
100
100
100
110
117
119
118
106
101
105
106
104
106
101
109
90
103
103
80
106
103
102
103
103
103
103
94
101
101
102
120
124
118
104
95
106
108
111
110
97
109
113
97
103
97
109
106
103
105
104
106
106
95
106
103
71
122
136
113
102
94
105
110
112
114
129
157
182
92
104
112
115
108
104
107
106
108
109
96
109
105
Farm Labor
Hired farm workers: Annual average wage rates, 2010-2014 1
Year All hired
workers
Field
workers
Field and
livestock workers
Dollars per hour Dollars per hour Dollars per hour
2010
2011
2012
2013
2014
11.37
11.40
12.05
12.15
12.18
11.23
11.09
11.55
11.96
11.73
10.62
10.78
11.30
11.49
11.56
1 Lake States region (Michigan, Minnesota, and Wisconsin).

12 FARM ECONOMICS MICHIGAN AGRICULTURAL STATISTICS 2014-2015
Agricultural Exports
Michigan agricultural exports: Calendar year 2013 1 2
Commodity Value Percent of total Rank in U.S.
Million dollars Percent Number
Soybeans
Dairy products
Corn
Feeds & fodder
Fruit (fresh and processed)
Vegetables (fresh and processed)
Wheat
Soybean meal
Pork
Grain products
Vegetable oils
Beef and veal
Hides and skins
Other
Total
578.9
332.3
255.0
224.6
217.0
212.4
136.5
133.2
101.6
75.3
73.9
58.4
29.0
751.1
3,179.2
18.2
10.5
8.0
7.1
6.8
6.7
4.3
4.2
3.2
2.4
2.3
1.8
0.9
23.6
100
12
7
11
14
5
6
19
12
13
16
13
29
24
18
1 Source: U.S. Department of Agriculture, Economic Research Service, www.ers.usda.gov/data-products/state-export-data. 2 Based on location of farm where commodity is produced.
Michigan agricultural exports: Top 10 destinations, 2013-2014 1 2
Country 2013 2014
Dollars Dollars
Canada
Indonesia
Japan
Mexico
Italy
United Kingdom
Turkey
South Africa
Guatemala
India
Others
Total
335,936,983
20,434,978
27,150,747
31,482,221
4,604,174
1,625,324
824,256
1,810,672
1,619,725
166,456
21,689,802
447,345,338
417,602,375
35,739,509
27,145,897
25,347,344
10,583,237
7,865,450
3,902,449
2,838,249
1,922,340
1,235,013
13,953,374
548,135,237
1 Source: U.S. Department of Commerce, International Trade Administration, www.ita.doc.gov. 2 Based on location of exporting firm.

MICHIGAN AGRICULTURAL STATISTICS 2014-2015 FIELD CROPS 13
Field Crops
Growing Season Weather Summary Dr. Jeff Andresen, Michigan State University
The 2014 growing season was preceded by a severe winter. It
was the coldest November through March period in over 100
years, causing the most extensive ice cover on the Great Lakes
since the winter of 1978/1979. Extreme minimum temperatures
ranged from -35°F or less in the western UP to just below 0°F at
a few locations along the lake shore in western Lower Michigan.
Snowfall was heavier than normal in most areas, ranging from
about 40 inches in some central and southern sections to more
than 250 inches in the Upper Peninsula’s lake effect snow belts.
The prolonged cold temperatures allowed the development of an
unusually deep snow pack across the state, which contained very
high levels of water equivalent. Given the deep snow cover, soil
temperatures remained at warmer than normal levels across the
state, and much of the water in the snow pack infiltrated the soil
following an extended thaw in late March. By the beginning of
April, all of the state was categorized by the Palmer Drought
Severity Index as ‘Unusually Moist' to 'Extremely Moist'.
The spring of 2014 was challenging for most agricultural
activities. Mean temperatures were below normal while
precipitation ranged from less than 2” across southern sections of
the state to more than 6” across central and northern sections of
the Lower Peninsula. The cool, wet weather slowed development
of overwintering perennial and annual crops and severely
hampered spring planting and other fieldwork. A period of warm,
dry conditions developed during the second half of May and
continued into early June, finally allowing spring planting and
associated fieldwork to progress at a rapid rate.
Conditions were wetter than normal, and there were several
rounds of severe weather in mid to late June. June rainfall ranged
from less than 2” across some eastern sections of the state to more
than 6” in the southwestern Lower Peninsula. Widespread heavy
rainfall late in the month reversed earlier drier than normal
conditions that had slowed vegetative crop growth in some
southwestern areas. Mean temperatures for the month were above
long term normals at most locations. This led to an acceleration
of crop growth and development. By the end of June, seasonal
growing degree day totals had increased to levels near to slightly
ahead of normal across most southern and central sections.
Seasonal totals across western and central sections of Upper
Michigan continued to lag from 7-10 days behind normal.
Mean temperatures for the July through mid-August period
generally remained from 2-5°F below the long term normals. As
of late August seasonal growing degree day accumulations were
well behind normal rates over most of the state. There was a
highly variable pattern of rainfall across the state during the mid-
summer period. Central sections of Upper Michigan and
northwestern South Central Lower Michigan were categorized as
‘Abnormally Dry’ by the U.S. Drought Monitor as of late August.
The first freezing temperatures of the fall were in western and
central sections of the Upper Peninsula on the 12th and 13th of
September and in interior sections of northern Lower Michigan
on the 13th and 14th. There was heavy precipitation during early
September. Monthly totals ranged from less than 3” across
southern sections of Lower Michigan to more than 6” across some
northwestern sections of the Lower Peninsula. Abnormally warm
and dry weather the last week of September advanced late-
maturing crops and accelerating grain dry down rates. Still, as of
the end of September, seasonal growing degree day
accumulations lagged well behind normal in most areas.
Cool, wet weather prevailed in early October. There was a
series of frost/freeze events on the 10th, 11th, and 12th of October,
and again on the 19th that ended the growing season for many
crops. While the first freezes were close to the climatic average
dates in many cases, they came before a portion of the corn crop,
which was delayed by late planting and an abnormally cool July,
had reached maturity. Low grain test weights and high moisture
content were a challenge for some growers. In early November as
a major winter storm brought strong winds and heavy snow.
Several rounds of lake effect snowfall through the third week of
the month slowed vegetative development of fall-planted crops
and brought harvest operations to a halt in most areas.
Field crops: Acres harvested and value of production, 2010-2014
Item Unit 2010 2011 2012 2013 2014
Acres harvested
Value of production
1,000 acres
1,000 dollars
6,420
3,797,108
6,500
4,425,163
6,620
4,606,889
6,440
3,846,327
6,620
3,427,089
Grain storage capacity, December 1, 2010-2014
Year Off farm On farm
capacity Facilities Rated capacity
Number Million bushels Million bushels
2010
2011
2012
2013
2014
200
201
201
206
200
170
190
200
210
217
280
290
290
290
295
14 FIELD CROPS MICHIGAN AGRICULTURAL STATISTICS 2014-2015
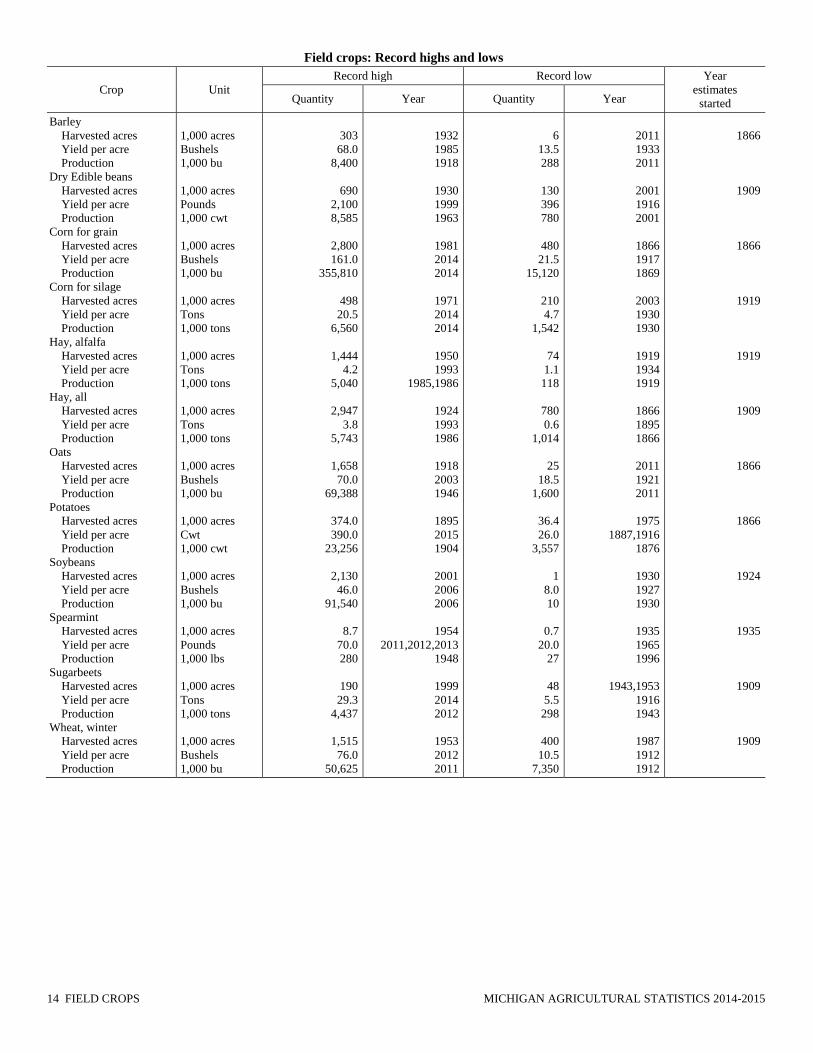
Field crops: Record highs and lows
Crop Unit
Record high Record low Year
estimates
started Quantity Year Quantity Year
Barley
Harvested acres
Yield per acre
Production
Dry Edible beans
Harvested acres
Yield per acre
Production
Corn for grain
Harvested acres
Yield per acre
Production
Corn for silage
Harvested acres
Yield per acre
Production
Hay, alfalfa
Harvested acres
Yield per acre
Production
Hay, all
Harvested acres
Yield per acre
Production
Oats
Harvested acres
Yield per acre
Production
Potatoes
Harvested acres
Yield per acre
Production
Soybeans
Harvested acres
Yield per acre
Production
Spearmint
Harvested acres
Yield per acre
Production
Sugarbeets
Harvested acres
Yield per acre
Production
Wheat, winter
Harvested acres
Yield per acre
Production
1,000 acres
Bushels
1,000 bu
1,000 acres
Pounds
1,000 cwt
1,000 acres
Bushels
1,000 bu
1,000 acres
Tons
1,000 tons
1,000 acres
Tons
1,000 tons
1,000 acres
Tons
1,000 tons
1,000 acres
Bushels
1,000 bu
1,000 acres
Cwt
1,000 cwt
1,000 acres
Bushels
1,000 bu
1,000 acres
Pounds
1,000 lbs
1,000 acres
Tons
1,000 tons
1,000 acres
Bushels
1,000 bu
303
68.0
8,400
690
2,100
8,585
2,800
161.0
355,810
498
20.5
6,560
1,444
4.2
5,040
2,947
3.8
5,743
1,658
70.0
69,388
374.0
390.0
23,256
2,130
46.0
91,540
8.7
70.0
280
190
29.3
4,437
1,515
76.0
50,625
1932
1985
1918
1930
1999
1963
1981
2014
2014
1971
2014
2014
1950
1993
1985,1986
1924
1993
1986
1918
2003
1946
1895
2015
1904
2001
2006
2006
1954
2011,2012,2013
1948
1999
2014
2012
1953
2012
2011
6
13.5
288
130
396
780
480
21.5
15,120
210
4.7
1,542
74
1.1
118
780
0.6
1,014
25
18.5
1,600
36.4
26.0
3,557
1
8.0
10
0.7
20.0
27
48
5.5
298
400
10.5
7,350
2011
1933
2011
2001
1916
2001
1866
1917
1869
2003
1930
1930
1919
1934
1919
1866
1895
1866
2011
1921
2011
1975
1887,1916
1876
1930
1927
1930
1935
1965
1996
1943,1953
1916
1943
1987
1912
1912
1866
1909
1866
1919
1919
1909
1866
1866
1924
1935
1909
1909

MICHIGAN AGRICULTURAL STATISTICS 2014-2015 FIELD CROPS 15
Barley
Barley: Acres, yield, production, and value, 2010-2014
Year Planted Harvested Yield Production Price 1 Value of
production
1,000 acres 1,000 acres Bushels 1,000 bushels Dollars 1,000 dollars
2010
2011
2012
2013
2014
11
10
11
10
8
10
6
9
9
7
54
48
48
52
53
540
288
432
468
371
2.45
3.50
5.00
4.75
3.50
1,323
1,008
2,160
2,223
1,299
1 Marketing year average.
Corn
Corn: Acres, yield, production, and value, 2010-2014
Year Planted Harvested Yield Production Price 1 Value of
production
1,000 acres 1,000 acres Bushels 1,000 bushels Dollars 1,000 dollars
All
2010
2011
2012
2013
2014
Grain
2010
2011
2012
2013
2014
2,400
2,500
2,700
2,600
2,550
2,100
2,190
2,380
2,230
2,210
149
153
132
155
161
312,900
335,070
314,160
345,650
355,810
5.56
6.14
6.69
4.18
3.65
1,739,724
2,057,330
2,101,730
1,444,817
1,298,707
1,000 acres 1,000 acres Tons 1,000 tons
Silage
2010
2011
2012
2013
2014
290
300
300
350
320
18.5
18.0
15.5
17.5
20.5
5,365
5,400
4,650
6,125
6,560
1 Marketing year average.

16 FIELD CROPS MICHIGAN AGRICULTURAL STATISTICS 2014-2015
500
1000
1500
2000
2500
3000
19
39
19
41
19
43
19
45
19
47
19
49
19
51
19
53
19
55
19
57
19
59
19
61
19
63
19
65
19
67
19
69
19
71
19
73
19
75
19
77
19
79
19
81
19
83
19
85
19
87
19
89
19
91
19
93
19
95
19
97
19
99
20
01
20
03
20
05
20
07
20
09
20
11
20
13
Tho
usa
nd
acr
es
Year
Corn for grain acres, 1939-2014
20
40
60
80
100
120
140
160
180
19
39
19
41
19
43
19
45
19
47
19
49
19
51
19
53
19
55
19
57
19
59
19
61
19
63
19
65
19
67
19
69
19
71
19
73
19
75
19
77
19
79
19
81
19
83
19
85
19
87
19
89
19
91
19
93
19
95
19
97
19
99
20
01
20
03
20
05
20
07
20
09
20
11
20
13
Bu
she
ls p
er
acre
Year
Corn yield, 1939-2014
04080
120160200240280320360
19
39
19
41
19
43
19
45
19
47
19
49
19
51
19
53
19
55
19
57
19
59
19
61
19
63
19
65
19
67
19
69
19
71
19
73
19
75
19
77
19
79
19
81
19
83
19
85
19
87
19
89
19
91
19
93
19
95
19
97
19
99
20
01
20
03
20
05
20
07
20
09
20
11
20
13
Mill
ion
bu
she
ls
Year
Corn production, 1939-2014

MICHIGAN AGRICULTURAL STATISTICS 2014-2015 FIELD CROPS 17
Corn for grain: Stocks by quarter, 2010-2014
Crop
year
December 1 March 1 June 1 September 1
On farm Off farm On farm Off farm On farm Off farm On farm Off farm
1,000 bushels 1,000 bushels 1,000 bushels 1,000 bushels 1,000 bushels 1,000 bushels 1,000 bushels 1,000 bushels
2010
2011
2012
2013
2014
175,000
200,000
155,000
195,000
215,000
74,091
70,450
81,776
96,334
67,968
79,000
96,000
78,000
105,000
110,000
62,089
56,300
62,728
81,306
63,953
41,000
46,000
34,000
43,000
45,000
41,550
42,300
39,398
53,674
43,723
11,000
13,000
8,400
15,000
11,500
14,400
11,866
9,240
20,616
16,520
Corn: Percentage of acreage planted, 2010-2014
Year
Month and day
April May June
20 30 10 20 30 10
2010
2011
2012
2013
2014
5-year-average
13
0
10
0
0
5
47
4
30
1
2
16
76
17
56
24
18
38
83
52
87
80
36
68
93
69
98
92
73
85
100
92
100
98
96
97
Corn: Percentage of acreage silked, 2010-2014
Year
Month and day
July August
1 10 20 30 10 20
2010
2011
2012
2013
2014
5-year-average
10
0
2
0
1
3
28
1
18
5
6
12
70
27
65
38
32
46
91
68
90
80
65
79
98
93
99
94
90
95
100
98
100
99
97
99
Corn: Percentage of acreage dent stage, 2010-2014
Year
Month and day
August September October
10 20 30 10 20 30 10
2010
2011
2012
2013
2014
5-year-average
13
0
9
0
0
4
46
11
28
8
9
20
76
26
52
25
26
41
91
59
77
57
51
67
99
81
91
80
69
84
100
93
99
92
84
94
100
98
100
97
94
98
Corn: Percentage of acreage harvested for grain, 2010-2014
Year
Month and day
September October November December
10 20 30 10 20 30 10 20 30 10
2010
2011
2012
2013
2014
5-year-average
3
0
2
0
0
2
14
0
8
2
0
5
25
3
17
7
2
11
45
9
29
14
6
20
66
17
46
21
12
32
82
32
62
38
27
48
96
63
82
62
45
70
98
83
94
79
65
84
99
94
99
92
77
93
100
100
100
95
88
97

18 FIELD CROPS MICHIGAN AGRICULTURAL STATISTICS 2014-2015
Dry Edible Beans
Dry edible beans: Acres, yield, production, and value, 2010-2014
Year Planted Harvested Yield Production Price 1 Value of
production
1,000 acres 1,000 acres Pounds 1,000 cwt Dol/cwt 1,000 dollars
2010
2011
2012
2013
2014
236
170
200
175
230
235
168
197
172
226
1,800
2,000
1,790
1,900
1,940
4,230
3,360
3,526
3,270
4,375
31.60
45.60
39.90
43.10
34.70
133,668
153,216
140,687
140,937
151,812
1 Marketing year average.
0
10
20
30
40
50
60
70
80
90
100A
pr
20
Ap
r 3
0
May
10
May
20
May
30
Jun
10
Jun
20
Jun
30
Jul 1
0
Jul 2
0
Jul 3
0
Au
g 1
0
Au
g 2
0
Au
g 3
0
Sep
10
Sep
20
Sep
30
Oct
10
Oct
20
Oct
30
No
v 1
0
No
v 2
0
No
v 3
0
De
c 1
0
De
c 2
0
Pe
rce
nt
Corn progressFive-year average, 2010-2014
Planted
Silked
Dent
Harvested
MICHIGAN AGRICULTURAL STATISTICS 2014-2015 FIELD CROPS 19
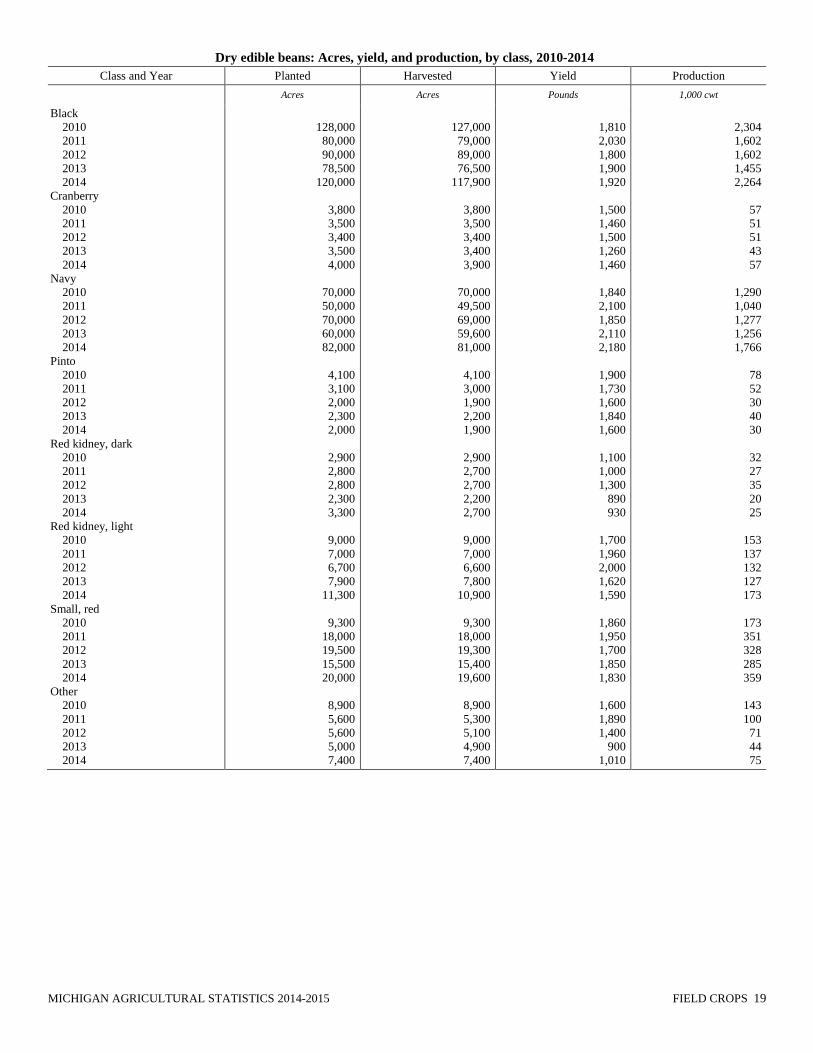
Dry edible beans: Acres, yield, and production, by class, 2010-2014
Class and Year Planted Harvested Yield Production
Acres Acres Pounds 1,000 cwt
Black
2010
2011
2012
2013
2014
Cranberry
2010
2011
2012
2013
2014
Navy
2010
2011
2012
2013
2014
Pinto
2010
2011
2012
2013
2014
Red kidney, dark
2010
2011
2012
2013
2014
Red kidney, light
2010
2011
2012
2013
2014
Small, red
2010
2011
2012
2013
2014
Other
2010
2011
2012
2013
2014
128,000
80,000
90,000
78,500
120,000
3,800
3,500
3,400
3,500
4,000
70,000
50,000
70,000
60,000
82,000
4,100
3,100
2,000
2,300
2,000
2,900
2,800
2,800
2,300
3,300
9,000
7,000
6,700
7,900
11,300
9,300
18,000
19,500
15,500
20,000
8,900
5,600
5,600
5,000
7,400
127,000
79,000
89,000
76,500
117,900
3,800
3,500
3,400
3,400
3,900
70,000
49,500
69,000
59,600
81,000
4,100
3,000
1,900
2,200
1,900
2,900
2,700
2,700
2,200
2,700
9,000
7,000
6,600
7,800
10,900
9,300
18,000
19,300
15,400
19,600
8,900
5,300
5,100
4,900
7,400
1,810
2,030
1,800
1,900
1,920
1,500
1,460
1,500
1,260
1,460
1,840
2,100
1,850
2,110
2,180
1,900
1,730
1,600
1,840
1,600
1,100
1,000
1,300
890
930
1,700
1,960
2,000
1,620
1,590
1,860
1,950
1,700
1,850
1,830
1,600
1,890
1,400
900
1,010
2,304
1,602
1,602
1,455
2,264
57
51
51
43
57
1,290
1,040
1,277
1,256
1,766
78
52
30
40
30
32
27
35
20
25
153
137
132
127
173
173
351
328
285
359
143
100
71
44
75

20 FIELD CROPS MICHIGAN AGRICULTURAL STATISTICS 2014-2015
Hay and Haylage
Hay, haylage, and greenchop: Acres, yield, production, and value, 2010-2014
Year Planted Harvested Yield Production Price 1 Value of
production
1,000 acres 1,000 acres Tons 1,000 tons Dollars 1,000 dollars
All dry hay
2010
2011
2012
2013
2014
Alfalfa hay
2010
2011
2012
2013
2014
Alfalfa
seedings
2010
2011
2012
2013
2014
Other hay
2010
2011
2012
2013
2014
All haylage
and greenchop
2010
2011
2012
2013
2014
Alfalfa haylage
and greenchop
2010
2011
2012
2013
2014
110
90
95
95
90
1,000
1,000
970
940
980
700
700
660
610
640
300
300
310
330
340
330
270
250
295
290
310
250
220
270
260
2.73
2.75
1.88
2.68
2.62
3.00
3.20
2.10
3.10
2.90
2.10
1.70
1.40
1.90
2.10
7.29
6.90
6.26
7.20
8.02
7.50
7.10
6.60
7.40
8.60
2,730
2,750
1,820
2,518
2,570
2,100
2,240
1,386
1,891
1,856
630
510
434
627
714
2,405
1,863
1,566
2,123
2,326
2,325
1,775
1,452
1,998
2,236
99.50
110.00
173.00
165.00
149.00
108.00
121.00
178.00
182.00
167.00
81.00
86.00
160.00
143.00
124.00
277,830
314,900
316,148
433,823
398,488
226,800
271,040
246,708
344,162
309,952
51,030
43,860
69,440
89,661
88,536
1 Marketing year average.
Hay: Stocks on farms, 2011-2015
Year May 1 December 1
1,000 tons 1,000 tons
2011
2012
2013
2014
2015
420
360
140
270
490
1,500
835
1,140
2,000
( 1 )
1 Published in January 2016.

MICHIGAN AGRICULTURAL STATISTICS 2014-2015 FIELD CROPS 21
Maple Syrup
Maple syrup: Taps, yield, production, price, and value, 2011-2015
Year Taps Yield
per tap Production
Price
per gallon
Value of
production
1,000 Gallons 1,000 gallons Dollars 1,000 dollars
2011
2012
2013
2014
2015
495
435
490
430
470
0.248
0.159
0.302
0.244
0.270
123
69
148
105
127
43.80
51.60
48.80
49.50
( 1 )
5,387
3,560
7,222
5,198
( 1 )
1 Published in June 2016.
Mint
Mint: Acres, yield, production, and value, 2010-2014
Year Harvested Yield Production Price
per pound 1
Value of
production
1,000 acres Pounds 1,000 Pounds Dollars 1,000 dollars
Peppermint
2010
2011
2012
2013
Spearmint
2010
2011
2012
2013
0.7
0.8
0.9
0.7
1.6
1.8
1.7
1.7
61
58
60
60
70
70
70
70
43
46
54
42
112
126
119
119
22.00
23.00
27.00
27.60
17.00
18.00
19.00
18.00
946
1,058
1,458
1,159
1,904
2,268
2,261
2,142
1 Marketing year average.
Oats
Oats: Acres, yield, production, and value, 2010-2014
Year Planted Harvested Yield Production Price 1 Value of
production
1,000 acres 1,000 acres Bushels 1,000 bushels Dollars 1,000 dollars
2010
2011
2012
2013
2014
75
40
50
50
55
60
25
35
30
40
68
64
60
62
69
4,080
1,600
2,100
1,860
2,760
2.45
3.58
4.02
3.68
3.40
9,996
5,728
8,442
6,845
9,384
1 Marketing year average.

22 FIELD CROPS MICHIGAN AGRICULTURAL STATISTICS 2014-2015
Potatoes
Fall potatoes: Acres, yield, production, and value, 2010-2014
Year Planted Harvested Yield Production Price 1 Value of
production
1,000 acres 1,000 acres Cwt 1,000 cwt Dollars 1,000 dollars
2010
2011
2012
2013
2014
44.0
45.0
47.0
44.5
43.0
43.5
44.0
46.0
44.0
42.5
360
345
350
360
370
15,660
15,180
16,100
15,840
15,725
11.00
11.60
11.60
11.90
10.90
170,694
176,088
186,760
188,496
171,403
1 Marketing year average.
Fall potatoes: Stocks by type as percent of total stocks, December 1, 2010-2014
Type 2010 2011 2012 2013 2014
Percent Percent Percent Percent Percent
White
Russet
Red
Yellow
90
9
1
0
88
11
1
0
86
13
1
0
( 1 )
( 1 )
( 1 )
( 1 )
85
14
0
1
1 Suspended due to sequestration.
Fall potatoes: Production and disposition, 2010-2014
Crop
year Production
Total used
for seed
Farm Disposition
Sold Seed, feed,
and home use
Shrinkage
and loss
1,000 cwt 1,000 cwt 1,000 cwt 1,000 cwt 1,000 cwt
2010
2011
2012
2013
2014
15,660
15,180
16,100
15,840
15,725
1,089
1,168
1,068
1,035
1,058
210
260
273
310
315
1,180
1,420
764
430
450
14,270
13,500
15,063
15,100
14,960
Fall potatoes: Stocks, 2010-2014
Crop year December 1 February 1 April 1
1,000 cwt 1,000 cwt 1,000 cwt
2010
2011
2012
2013
2014
9,300
8,600
9,700
( 1 )
9,400
5,900
4,700
5,700
( 1 )
5,000
2,300
1,600
( 1 )
2,100
1,650
1 Estimate suspended due to sequestration.

MICHIGAN AGRICULTURAL STATISTICS 2014-2015 FIELD CROPS 23
Soybeans
Soybeans: Acres, yield, production, and value, 2010-2014
Year Planted Harvested Yield Production Price 1 Value of
production
1,000 acres 1,000 acres Bushels 1,000 bushels Dollars 1,000 dollars
2010
2011
2012
2013
2014
2,050
1,950
2,000
1,930
2,050
2,040
1,940
1,990
1,920
2,040
43.5
44.5
43.0
44.5
42.5
88,740
86,330
85,570
85,440
86,700
11.10
12.10
14.00
12.90
10.10
985,014
1,044,593
1,197,980
1,102,176
875,670
1 Marketing year average.
Soybeans: Stocks by quarter, 2010-2014
Crop
year
December 1 March 1 June 1 September 1
On farm Off farm On farm Off farm On farm Off farm On farm Off farm
1,000 bushels 1,000 bushels 1,000 bushels 1,000 bushels 1,000 bushels 1,000 bushels 1,000 bushels 1,000 bushels
2010
2011
2012
2013
2014
22,000
31,000
25,000
20,000
28,500
32,051
34,300
28,591
25,315
36,200
11,000
16,500
11,000
5,000
12,500
22,651
25,000
13,494
12,516
20,871
5,200
5,100
6,200
1,900
5,000
11,650
16,000
6,090
5,283
11,838
1,400
900
300
750
650
4,200
2,957
1,703
1,397
3,891
Soybeans: Percentage of acreage planted, 2010-2014
Year
Month and day
April May June
30 10 20 30 10 20 30
2010
2011
2012
2013
2014
5-year-average
14
1
10
0
0
6
35
6
25
9
9
17
44
21
62
51
19
40
73
34
87
73
52
64
89
73
99
91
91
89
96
96
100
100
98
98
100
99
100
100
100
100
Soybeans: Percentage of acreage setting pods, 2010-2014
Year
Month and day
July August
10 20 30 10 20 30
2010
2011
2012
2013
2014
5-year-average
9
0
3
4
1
3
22
9
20
13
12
14
46
18
47
41
37
30
76
56
87
63
73
71
94
88
95
84
92
91
100
98
100
95
97
98

24 FIELD CROPS MICHIGAN AGRICULTURAL STATISTICS 2014-2015
Soybeans: Percentage of acreage shedding leaves, 2010-2014
Year
Month and day
August September October
30 10 20 30 10 20
2010
2011
2012
2013
2014
5-year-average
3
0
4
0
1
2
31
5
24
6
15
16
69
28
58
40
37
47
92
60
91
75
75
79
97
89
99
88
93
93
100
99
100
100
100
100
Soybeans: Percentage of acreage harvested, 2010-2014
Year
Month and day
September October November
20 30 10 20 30 10 20 30
2010
2011
2012
2013
2014
5-year-average
7
0
4
0
0
2
27
2
24
7
4
13
66
27
55
32
15
39
87
58
76
56
26
61
96
77
89
69
59
78
100
93
97
87
86
93
100
98
100
96
94
98
100
100
100
100
100
100
0
10
20
30
40
50
60
70
80
90
100
Ap
r 2
0
Ap
r 3
0
May
10
May
20
May
30
Jun
10
Jun
20
Jun
30
Jul 1
0
Jul 2
0
Jul 3
0
Au
g 1
0
Au
g 2
0
Au
g 3
0
Sep
10
Sep
20
Sep
30
Oct
10
Oct
20
Oct
30
No
v 1
0
No
v 2
0
No
v 3
0
De
c 1
0
De
c 2
0
Pe
rce
nt
Soybean progressFive-year average, 2010-2014
Planted
Setting Pods
Dropping Leaves
Harvested

MICHIGAN AGRICULTURAL STATISTICS 2014-2015 FIELD CROPS 25
0
500
1000
1500
2000
2500
19
39
19
41
19
43
19
45
19
47
19
49
19
51
19
53
19
55
19
57
19
59
19
61
19
63
19
65
19
67
19
69
19
71
19
73
19
75
19
77
19
79
19
81
19
83
19
85
19
87
19
89
19
91
19
93
19
95
19
97
19
99
20
01
20
03
20
05
20
07
20
09
20
11
20
13
Tho
usa
nd
acr
es
Year
Soybean harvested acres, 1939-2014
10141822263034384246
19
39
19
41
19
43
19
45
19
47
19
49
19
51
19
53
19
55
19
57
19
59
19
61
19
63
19
65
19
67
19
69
19
71
19
73
19
75
19
77
19
79
19
81
19
83
19
85
19
87
19
89
19
91
19
93
19
95
19
97
19
99
20
01
20
03
20
05
20
07
20
09
20
11
20
13
Bu
she
ls p
er
acre
Year
Soybean yield, 1939-2014
0
20
40
60
80
100
19
39
19
41
19
43
19
45
19
47
19
49
19
51
19
53
19
55
19
57
19
59
19
61
19
63
19
65
19
67
19
69
19
71
19
73
19
75
19
77
19
79
19
81
19
83
19
85
19
87
19
89
19
91
19
93
19
95
19
97
19
99
20
01
20
03
20
05
20
07
20
09
20
11
20
13
Mill
ion
bu
she
ls
Year
Soybean production, 1939-2014

26 FIELD CROPS MICHIGAN AGRICULTURAL STATISTICS 2014-2015
Sugarbeets
Sugarbeets: Acres, yield, production, and value, 2010-2014
Year Planted Harvested Yield Production Price 1 Value of
production
1,000 acres 1,000 acres Tons 1,000 tons Dollars 1,000 dollars
2010
2011
2012
2013
2014
147
153
154
154
151
147
153
153
153
150
26.0
24.0
29.0
26.2
29.3
3,822
3,672
4,437
4,009
4,395
71.30
87.70
72.40
53.60
( 2 )
272,509
322,034
321,239
214,882
( 2 )
1 Marketing year average. 2 Published in February 2016.
Wheat
Wheat: Acres, yield, production, and value, 2010-2014
Year Planted Harvested Yield Production Price 1 Value of
production
1,000 acres 1,000 acres Bushels 1,000 bushels Dollars 1,000 dollars
2010
2011
2012
2013
2014
520
700
560
620
550
495
675
535
590
470
70
75
76
75
74
34,650
50,625
40,660
44,250
34,780
5.72
6.71
7.91
6.71
5.70
198,198
339,694
321,621
296,918
198,246
1 Marketing year average.
Wheat: Stocks by quarter, 2010-2014
Crop
year
September 1 December 1 March 1 June 1
On
farm
Off
farm
On
farm
Off
farm
On
farm
Off
farm
On
farm
Off
farm
1,000 bushels 1,000 bushels 1,000 bushels 1,000 bushels 1,000 bushels 1,000 bushels 1,000 bushels 1,000 bushels
2010
2011
2012
2013
2014
3,100
5,500
2,600
4,900
3,500
39,970
47,850
46,182
42,436
32,369
1,300
3,200
1,700
2,100
3,000
35,767
41,200
41,213
35,653
25,169
800
2,500
1,000
1,500
1,300
29,870
33,900
32,826
26,943
19,456
700
400
600
420
510
20,480
24,450
22,410
14,850
12,615

MICHIGAN AGRICULTURAL STATISTICS 2014-2015 FIELD CROPS 27
200
400
600
800
1000
1200
1400
1600
19
39
19
41
19
43
19
45
19
47
19
49
19
51
19
53
19
55
19
57
19
59
19
61
19
63
19
65
19
67
19
69
19
71
19
73
19
75
19
77
19
79
19
81
19
83
19
85
19
87
19
89
19
91
19
93
19
95
19
97
19
99
20
01
20
03
20
05
20
07
20
09
20
11
20
13
Har
vest
ed
acr
es
Year
Wheat harvested acres, 1939-2014
10
20
30
40
50
60
70
80
19
39
19
41
19
43
19
45
19
47
19
49
19
51
19
53
19
55
19
57
19
59
19
61
19
63
19
65
19
67
19
69
19
71
19
73
19
75
19
77
19
79
19
81
19
83
19
85
19
87
19
89
19
91
19
93
19
95
19
97
19
99
20
01
20
03
20
05
20
07
20
09
20
11
20
13
Bu
she
ls p
er
acre
Year
Wheat yield, 1939-2014
10
15
20
25
30
35
40
45
50
19
39
19
41
19
43
19
45
19
47
19
49
19
51
19
53
19
55
19
57
19
59
19
61
19
63
19
65
19
67
19
69
19
71
19
73
19
75
19
77
19
79
19
81
19
83
19
85
19
87
19
89
19
91
19
93
19
95
19
97
19
99
20
01
20
03
20
05
20
07
20
09
20
11
20
13
Mill
ion
bu
she
ls
Year
Wheat production, 1939-2014

28 CHEMICAL MICHIGAN AGRICULTURAL STATISTICS 2014-2015
Agricultural Chemical Usage
Asparagus: Agricultural chemical applications, 2014 1
Agricultural
chemical
Area
applied Applications
Rate per
application
Rate per
crop year
Total
applied
Percent Number Pounds per acre Pounds per acre Pounds
Herbicides
2,4-D, dimeth. salt
2,4-D, triiso. salt
Diuron
Glyphosate iso. salt
Glyphosate pot. salt
Metribuzin
Sulfentrazone
Terbacil
Fungicides
Tebuconazole
22
13
87
38
60
68
26
11
9
1.4
1.6
1.9
1.7
1.9
1.8
1
1.5
2.1
0.55
0.654
1.481
0.87
1.13
0.395
0.169
0.387
0.137
0.75
1.04
2.811
1.496
2.117
0.706
0.17
0.581
0.295
1,700
1,400
25,100
5,800
13,100
4,900
500
700
300
1 Planted acres in 2014 were 10,300 acres.
Carrots, Fresh: Agricultural chemical applications, 2014 1
Agricultural
chemical
Area
applied Applications
Rate per
application
Rate per
crop year
Total
applied
Percent Number Pounds per acre Pounds per acre Pounds
Herbicides
Clethodim
96
1.9
0.128
0.239
400
1 Planted acres in 2014 were 1,700 acres.
Sweet Corn, Fresh: Agricultural chemical applications, 2014 1
Agricultural
chemical
Area
applied Applications
Rate per
application
Rate per
crop year
Total
applied
Percent Number Pounds per acre Pounds per acre Pounds
Herbicides
Atrazine
Glyphosate iso. salt
Glyphosate pot. salt
Mesotrione
Pendimethalin
S-Metolachlor
Tembotrione
Insecticides
Bifenthrin
Cyfluthrin
Esfenvalerate
Lambda-cyhalothrin
Methomyl
Permethrin
Zeta-cypermethrin
67
14
14
37
14
69
10
15
30
14
50
5
3
34
1.1
1.1
1
1
1
1
1.1
1.8
1.6
1.7
2.5
2
1.3
1.6
1.006
1.163
0.955
0.129
0.954
1.183
0.076
0.069
0.041
0.038
0.044
0.419
0.149
0.024
1.098
1.238
0.99
0.129
0.954
1.209
0.084
0.124
0.065
0.063
0.108
0.841
0.194
0.037
7,200
1,700
1,300
500
1,300
8,100
100
200
200
100
500
400
100
100
1 Planted acres in 2014 were 9,700.

MICHIGAN AGRICULTURAL STATISTICS 2014-2015 CHEMICAL 29
Cucumbers, Fresh: Agricultural chemical applications, 2014 1
Agricultural
chemical
Area
applied Applications
Rate per
application
Rate per
crop year
Total
applied
Percent Number Pounds per acre Pounds per acre Pounds
Herbicides
S-Metolachlor
Insecticides
Carbaryl
Permethrin
Fungicides
Chlorothalonil
Copper hydroxide
Propamocarb hydroch.
1
/ 3
47
79
79
65
1
1.6
5
4.2
4.6
4.2
1.118
0.835
0.15
1.035
0.639
0.9
1.118
1.368
0.748
4.324
2.937
3.736
/ 2
/ 2
1,300
12,300
8,300
8,700
1 Planted acres in 2014 were 3,500 acres. 2 Total applied was less than 50 lbs. 3 Not published.
Cucumbers, Pickles: Agricultural chemical applications, 2014 1
Agricultural
chemical
Area
applied Applications
Rate per
application
Rate per
crop year
Total
applied
Percent Number Pounds per acre Pounds per acre Pounds
Herbicides
Clomazone
Ethalfluralin
Fungicides
Chlorothalonil
Cyazofamid
Mancozeb
Propamocarb hydroch.
94
97
24
75
88
53
1
1
2.4
1
2.2
1.5
0.271
0.739
1.291
0.076
2.113
0.91
0.271
0.739
3.151
0.08
4.647
1.34
7,100
20,000
20,800
1,700
113,500
19,900
1 Planted acres in 2014 were 27,900.

30 CHEMICAL MICHIGAN AGRICULTURAL STATISTICS 2014-2015
Pumpkins: Agricultural chemical applications, 2014 1
Agricultural
chemical
Area
applied Applications
Rate per
application
Rate per
crop year
Total
applied
Percent Number Pounds per acre Pounds per acre Pounds
Herbicides
Clomazone
Ethalfluralin
Glyphosate pot. salt
Halosulfuron
S-Metolachlor
Insecticides
Carbaryl
Esfenvalerate
Fungicides
Chlorothalonil
Copper hydroxide
Cymoxanil
Mancozeb
Myclobutanil
Pyraclostrobin
Thiophanate-methyl
29
25
14
6
12
25
11
57
29
8
7
12
18
16
1
1
1.2
1.2
1
2.4
1.9
3.3
2.4
1.8
2.1
1.8
1.3
2.7
0.328
0.803
1.22
0.047
1.136
0.765
0.044
1.431
0.377
0.122
1.434
0.169
0.117
0.382
0.336
0.814
1.473
0.055
1.136
1.812
0.085
4.681
0.91
0.222
3.053
0.302
0.152
1.048
600
1,300
1,300
/ 2
900
2,900
100
17,000
1,700
100
1,400
200
200
1,100
1 Planted acres in 2014 were 6,400. 2 Total applied was less than 50 lbs.
Squash: Agricultural chemical applications, 2014 1
Agricultural
chemical
Area
applied Applications
Rate per
application
Rate per
crop year
Total
applied
Percent Number Pounds per acre Pounds per acre Pounds
Herbicides
Clomazone
Ethalfluralin
Glyphosate iso. salt
S-Metolachlor
Insecticides
Carbaryl
Esfenvalerate
Lambda-cyhalothrin
Permethrin
Zeta-cypermethrin
Fungicides
Chlorothalonil
Copper hydroxide
Cymoxanil
Famoxadone
Fluopicolide
Mancozeb
Propamocarb hydroch.
Pyraclostrobin
Thiophanate-methyl
46
46
3
10
41
6
2
35
18
56
29
1
1
20
2
24
23
32
1
1
1
1
1.8
2.8
1.8
9.3
1
4.6
1.7
2.7
2.7
1.8
1.8
2.2
1.7
2.4
0.281
0.867
0.77
1.124
0.681
0.044
0.026
0.174
0.02
1.438
0.471
0.086
0.086
0.095
1.211
0.921
0.114
0.355
0.291
0.867
0.77
1.124
1.231
0.122
0.047
1.613
0.021
6.559
0.822
0.232
0.232
0.171
2.146
1.982
0.192
0.853
800
2,400
200
700
3,100
( 2 )
( 2 )
3,400
( 2 )
22,500
1,400
( 2 )
( 2 )
200
300
2,900
300
1,700
1 Planted acres in 2014 were 6,100 acres. 2 Total applied was less than 50 lbs.

MICHIGAN AGRICULTURAL STATISTICS 2014-2015 CHEMICAL 31
Fertilizer applications: Corn, 2014 1
Fertilizer Symbol Area
applied Applications
Rate per
application
Rate per
crop year
Total
applied
Percent Number Pounds per acre Pounds per acre Million pounds
Nitrogen
Phosphate
Potash
Sulfur
N
P2O5
K2O
S
98
84
82
25
2.5
1.2
1.2
1.2
54
35
75
10
135
42
92
12
338.7
89.2
192.6
7.4
1 Planted acres in 2014 were 2.55 million acres.
Agricultural chemical applications: Corn, 2014 1
Agricultural
chemical
Area
applied Applications
Rate per
application
Rate per
crop year
Total
applied
Percent Number Pounds per acre Pounds per acre Pounds
Herbicides:
Acetochlor
Atrazine
Clopyralid
Flumetsulam
Glyphosate iso. Salt
Glyphosate Pot. Salt
Mesotrione
S-Metolachlor
Tembotrione
15
56
10
10
38
28
27
32
11
1.00
1.00
1.00
1.00
1.20
1.50
1.00
1.00
1.60
1.553
1.044
0.090
0.036
0.843
0.980
0.090
1.056
0.080
1.553
1.049
0.090
0.036
1.048
1.474
0.090
1.094
0.132
593,000
1,492,000
22,000
9,000
1,023,000
1,048,000
61,000
898,000
38,000
1 Planted acres in 2014 were 2.55 million acres.

32 CHEMICAL MICHIGAN AGRICULTURAL STATISTICS 2014-2015
Fertilizer applications: Fall potatoes, 2014 1
Fertilizer Symbol Area
applied Applications
Rate per
application
Rate per
crop year
Total
applied
Percent Number Pounds per acre Pounds per acre Million pounds
Nitrogen
Phosphate
Potash
N
P2O5
K2O
100
99
100
3.3
1.2
2.0
56
76
111
184
89
223
7.9
3.8
9.6
1 Planted acres in 2014 were 43,000 acres.
Agricultural chemical applications: Fall potatoes 2014 1
Agricultural
chemical
Area
applied Applications
Rate per
application
Rate per
crop year
Total
applied
Percent Number Pounds per acre Pounds per acre Pounds
Herbicides
Dimethenamid-P
Linuron
Metribuzin
Pendimethalin
S-Metolachlor
Insecticides
Imidacloprid
Lambda-Cyhalothrin
Oxamyl
Thiamethoxam
Fungicides
Azoxystrobin
Chlorothalonil
Cymoxanil
Difenoconazole
Famoxadone
Fluopyram
Manocozeb
Mandipropamide Techn
Mefenoxam
Pyrimethanil
Triphenyltin Hydrox.
Other chemicals
Diquat dibromide
24
90
79
32
58
39
44
38
25
35
98
68
59
64
11
77
59
31
35
43
72
1.0
1.0
1.1
1.0
1.1
1.4
1.0
1.3
1.0
1.6
6.2
1.6
1.8
1.6
2.4
3.8
1.5
1.8
1.9
2.0
1.7
0.570
0.606
0.210
0.703
1.243
0.130
0.030
1.090
0.051
0.106
0.748
0.124
0.101
0.124
0.090
1.234
0.110
0.171
0.272
0.161
0.435
0.570
0.606
0.240
0.703
1.335
0.175
0.030
1.412
0.051
0.174
4.628
0.203
0.184
0.198
0.214
4.734
0.166
0.300
0.525
0.320
0.746
6,000
24,000
8,000
10,000
33,000
3,000
1,000
23,000
1,000
3,000
195,000
6,000
5,000
5,000
1,000
156,000
4,000
4,000
8,000
6,000
23,000
1 Planted acres in 2014 were 43,000 acres.

MICHIGAN AGRICULTURAL STATISTICS 2014-2015 FRUIT 33
Fruit
Fruit: Record highs and lows
Crop and Unit
Record high Record low Year
estimates
started Quantity Year Quantity Year
Apples ......................................... Million pounds
Blueberries .................................. Million pounds
Cherries, sweet ............................................. Tons
Cherries, tart ............................... Million pounds
Grapes .......................................................... Tons
Peaches ....................................... Million pounds
Pears ............................................................ Tons
Plums ........................................................... Tons
Strawberries ......................................... 1,000 cwt
1,260
117
37,500
380
102,700
255
48,600
25,000
451
2013
2013
1978
1964
2005
1945,1946
1964
1971
1940
53
12
500
12
4,200
4.0
40
65
29
1945
1977
1945
2012
1889
2012
2012
2012
2010
1889
1977
1925
1925
1889
1889
1889
1919
1928
Fruit: Bearing acres and value of production, 2010-2014
Item Unit 2010 2011 2012 2013
Bearing acres ...................................... 1,000 acres
Value of production ......................... 1,000 dollars
107
308,290
106
438,405
107
207,347
110
531,044
110
475,935

34 FRUIT MICHIGAN AGRICULTURAL STATISTICS 2014-2015
Fruit: Acres, production, and value, 2010-2014
Fruit
and Year
Bearing
acres Yield
Production Price
Value of
production Total Utilized
Acres Pounds Million pounds Million pounds Dollars per pound 1,000 dollars
Apples
2010
2011
2012
2013
2014
Blueberries 1
2010
2011
2012
2013
2014
Cherries, tart
2010
2011
2012
2013
2014
Peaches
2010
2011
2012
2013
2014
35,000
34,500
35,000
36,500
37,000
18,600
19,200
19,000
19,500
20,200
26,200
26,700
27,300
28,000
27,900
4,000
3,700
3,500
3,300
2,900
16,300
28,400
3,290
34,500
27,700
5,860
3,750
4,850
6,000
4,900
5,150
5,900
425
7,810
7,280
7,000
9,000
1,140
12,500
6,120
570
980
115
1,260
1,025
109
72
87
117
99
135
158
12
219
203
28.0
33.3
4.0
41.2
17.7
570
975
115
1,260
1,025
109
72
87
117
99
129
157
12
216
201
27.7
32.8
4.0
39.6
16.9
0.181
0.207
0.352
0.204
0.215
1.230
1.650
1.410
1.070
1.250
0.212
0.301
1.110
0.345
0.342
0.460
0.366
0.665
0.353
0.460
103,375
201,650
40,475
254,953
220,140
134,300
118,700
122,700
125,200
123,840
27,260
47,210
12,880
74,515
68,827
12,731
11,995
2,624
13,972
7,758
Acres Tons Tons Tons Dollars per ton 1,000 dollars
Cherries, sweet
2010
2011
2012
2013
2014
Grapes
2010
2011
2012
2013
2014
Pears
2010
2011
2012
2013
2014
Plums
2010
2011
2012
2013
2014
6,700
6,500
6,500
6,600
6,900
14,000
14,000
13,900
13,800
13,600
800
700
700
700
700
550
500
500
500
400
2.25
2.86
0.65
3.47
4.33
2.57
6.74
2.75
6.81
4.65
1.13
6.29
0.06
7.64
3.89
3.64
3.20
0.13
3.78
4.25
15,100
18,600
4,250
22,900
29,860
36,000
94,400
38,200
94,000
63,300
900
4,400
40
5,350
2,720
2,000
1,600
65
1,890
1,700
14,400
18,600
4,250
21,800
29,460
36,000
93,400
38,200
94,000
63,300
900
4,400
40
5,180
2,610
1,500
1,600
65
1,890
1,600
678
970
1,440
964
941
430
364
462
378
305
348
275
625
348
441
640
700
585
510
535
9,765
18,042
6,133
21,012
27,708
15,497
33,957
17,646
35,528
19,292
313
1,209
25
1,805
1,151
960
1,120
38
964
856
1 Harvested acres.

MICHIGAN AGRICULTURAL STATISTICS 2014-2015 FRUIT 35
Apples: Utilization and price, 2010-2014
Year
Fresh market Processing Total
Quantity Price
per lb Quantity
Price
per lb Quantity
Price
per lb
Million pounds Dollars Million pounds Dollars Million pounds Dollars
2010
2011
2012
2013
2014
210
350
45
500
425
0.300
0.350
0.480
0.345
0.366
360
625
70
750
600
0.112
0.126
0.270
0.110
0.108
570
975
115
1,260
1,025
0.181
0.207
0.352
0.204
0.215
Apples, processing: Utilization and price, 2010-2014
Year
Canned Frozen and
fresh slices
Juice and
cider
Quantity Price
per lb Quantity
Price
per lb Quantity
Price
per lb
Million pounds Dollars Million pounds Dollars Million pounds Dollars
2010
2011
2012
2013
2014
160
245
25
360
275
0.120
0.130
0.275
0.113
0.105
115
235
30
228
213
0.115
0.141
0.312
0.132
0.126
80
135
15
160
110
0.090
0.095
0.175
0.070
0.078
Blueberries: Utilization and price, 2010-2014
Year
Production Fresh market Processed
Total Utilized Quantity Price
per pound Quantity
Price
per pound
Million pounds Million pounds Million pounds Dollars Million pounds Dollars
2010
2011
2012
2013
2014
109
72
87
117
99
109
72
87
117
99
49
34
33
50
48
1.700
2.150
2.000
1.700
1.900
60
38
54
67
51
0.850
1.200
1.050
0.600
0.640

36 FRUIT MICHIGAN AGRICULTURAL STATISTICS 2014-2015
Cherries, sweet: Production and utilization, 2010-2014
Year Total
production
Utilized production
Fresh Canned Brined Other 1
Quantity Price
per ton Quantity
Price
per ton Quantity
Price
per ton Quantity
Price
per ton
Tons Tons Dollars Tons Dollars Tons Dollars Tons Dollars
2010
2011
2012
2013
2014
15,100
18,600
4,250
22,900
29,860
1,100
2,200
120
1,200
660
2,290
2,410
4,280
2,290
2,430
450
1,800
( 2 )
( 2 )
( 2 )
660
1,000
( 2 )
( 2 )
( 2 )
8,500
9,150
1,350
13,100
( 2 )
490
600
1,050
730
( 2 )
4,350
5,450
2,780
7,500
28,800
640
1,000
1,510
1,160
906
1 Frozen, juice, etc. 2 Included in other.
Cherries, tart: Utilization, 2010-2014
Year
Production
Fresh
market
Processed
Total Utilized
Canned Frozen Other
Quantity Price
per pound Quantity
Price
per pound Quantity
Price
per pound
Million pounds Million pounds Million pounds Million pounds Dollars Million pounds Dollars Million pounds Dollars
2010
2011
2012
2013
2014
135
158
12
219
203
129
157
12
216
201
0.2
0.2
0.1
0.3
0.1
29.0
34.0
3.0
36.3
( 1 )
0.210
0.340
1.160
0.360
( 1 )
87
101
8
118
141
0.215
0.295
1.080
0.341
0.337
12.5
21.5
0.5
61.7
59.7
0.180
0.261
1.040
0.342
0.354
1 Included in Other.
Cherries, tart: Production by region, 2010-2014
Region 2010 2011 2012 2013 2014
Million pounds Million pounds Million pounds Million pounds Million pounds
Northwest
West Central
Southwest and other
Michigan
66.0
57.0
12.0
135.0
92.5
48.0
17.0
157.5
2.6
7.8
1.2
11.6
126.7
62.4
29.6
218.7
139.2
45.0
18.9
203.0
Cherries, tart, frozen: Stocks in cold storage, 2011-2014
Month East North Central region 1 48 States total 2
2011-12 2012-13 2013-14 2014-15 2011-12 2012-13 2013-14 2014-15
1,000 pounds 1,000 pounds 1,000 pounds 1,000 pounds 1,000 pounds 1,000 pounds 1,000 pounds 1,000 pounds
July
August
September
October
November
December
January
February
March
April
May
June
87,152
86,189
76,941
67,829
62,002
56,549
47,930
41,829
35,781
28,252
17,628
15,119
16,670
14,435
14,056
14,946
21,617
18,688
18,604
16,400
14,446
11,790
9,066
6,874
83,133
113,816
104,879
95,972
86,756
86,134
78,114
72,678
67,145
57,246
47,865
40,328
65,886
128,085
117,557
110,489
104,290
97,601
95,003
89,535
82,644
75,173
66,025
62,950
96,444
124,645
108,842
98,395
90,339
83,622
73,371
65,185
54,211
44,684
32,532
26,924
59,120
51,815
50,514
49,966
56,135
51,161
44,651
38,315
33,746
26,644
19,127
14,227
114,938
150,224
139,064
128,171
114,676
112,101
99,639
91,631
82,926
71,746
58,869
50,181
103,362
178,542
164,429
153,521
144,280
134,908
129,319
120,870
105,707
98,519
85,866
79,026
1 Illinois, Indiana, Michigan, Ohio, and Wisconsin. 2 Excluding Alaska and Hawaii.
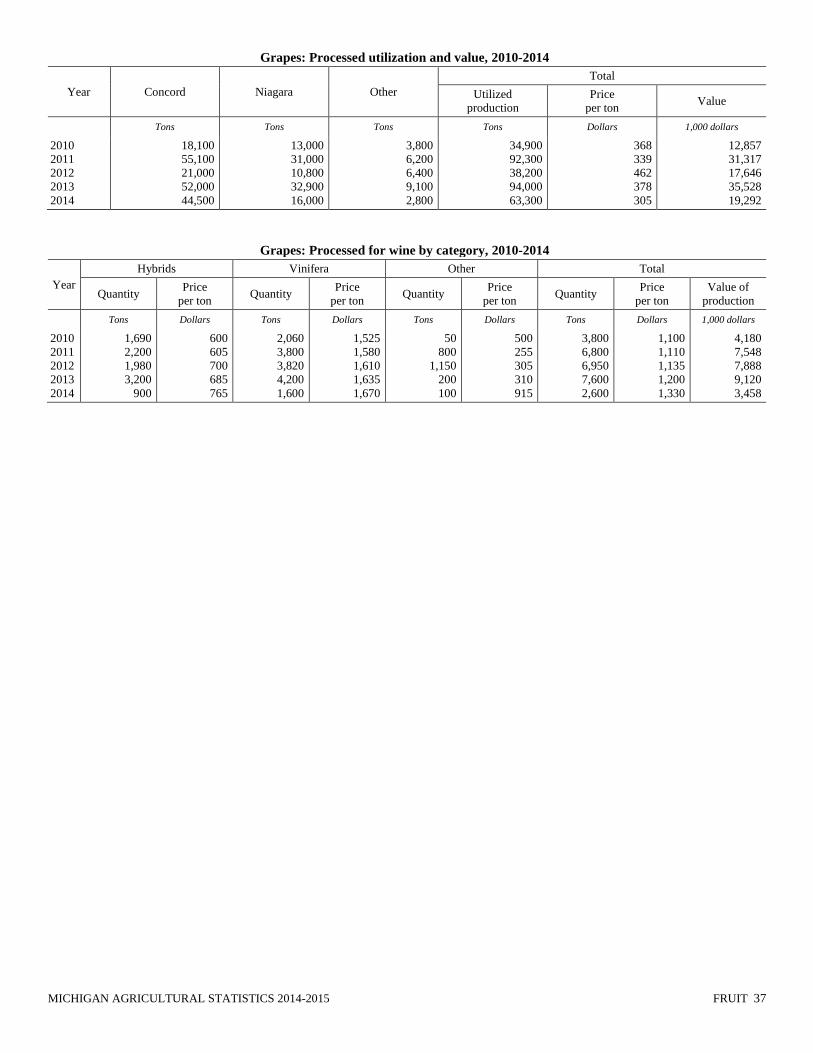
MICHIGAN AGRICULTURAL STATISTICS 2014-2015 FRUIT 37
Grapes: Processed utilization and value, 2010-2014
Year Concord Niagara Other
Total
Utilized
production
Price
per ton Value
Tons Tons Tons Tons Dollars 1,000 dollars
2010
2011
2012
2013
2014
18,100
55,100
21,000
52,000
44,500
13,000
31,000
10,800
32,900
16,000
3,800
6,200
6,400
9,100
2,800
34,900
92,300
38,200
94,000
63,300
368
339
462
378
305
12,857
31,317
17,646
35,528
19,292
Grapes: Processed for wine by category, 2010-2014
Year
Hybrids Vinifera Other Total
Quantity Price
per ton Quantity
Price
per ton Quantity
Price
per ton Quantity
Price
per ton
Value of
production
Tons Dollars Tons Dollars Tons Dollars Tons Dollars 1,000 dollars
2010
2011
2012
2013
2014
1,690
2,200
1,980
3,200
900
600
605
700
685
765
2,060
3,800
3,820
4,200
1,600
1,525
1,580
1,610
1,635
1,670
50
800
1,150
200
100
500
255
305
310
915
3,800
6,800
6,950
7,600
2,600
1,100
1,110
1,135
1,200
1,330
4,180
7,548
7,888
9,120
3,458
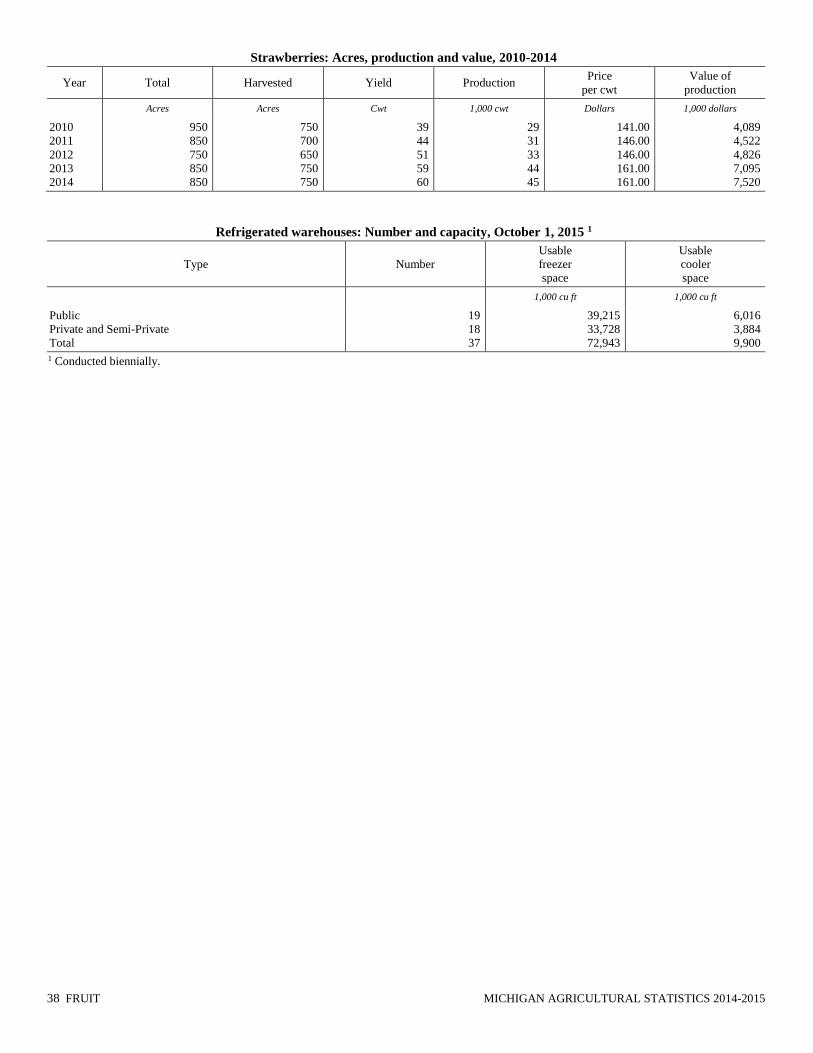
38 FRUIT MICHIGAN AGRICULTURAL STATISTICS 2014-2015
Strawberries: Acres, production and value, 2010-2014
Year Total Harvested Yield Production Price
per cwt
Value of
production
Acres Acres Cwt 1,000 cwt Dollars 1,000 dollars
2010
2011
2012
2013
2014
950
850
750
850
850
750
700
650
750
750
39
44
51
59
60
29
31
33
44
45
141.00
146.00
146.00
161.00
161.00
4,089
4,522
4,826
7,095
7,520
Refrigerated warehouses: Number and capacity, October 1, 2015 1
Type Number
Usable
freezer
space
Usable
cooler
space
1,000 cu ft 1,000 cu ft
Public
Private and Semi-Private
Total
19
18
37
39,215
33,728
72,943
6,016
3,884
9,900
1 Conducted biennially.

MICHIGAN AGRICULTURAL STATISTICS 2014-2015 VEGETABLES 39
Vegetables
Vegetables: Record highs and lows
Crop Unit
Record high Record low Year
estimates
started Quantity Year Quantity Year
Asparagus
Harvested
Yield
Production
Beans, snap (processing)
Harvested
Yield
Production
Carrots (fresh market)
Harvested
Yield
Production
Celery
Harvested
Yield
Production
Corn, sweet (fresh market)
Harvested
Yield
Production
Cucumbers (processing)
Harvested
Yield
Production
Onions
Harvested
Yield
Production
Tomatoes (fresh market)
Harvested
Yield
Production
Tomatoes (processing)
Harvested
Yield
Production
1,000 acres
Cwt
1,000 cwt
1,000 acres
Tons
Tons
1,000 acres
Cwt
1,000 cwt
1,000 acres
Cwt
1,000 cwt
1,000 acres
Cwt
1,000 cwt
1,000 acres
Tons
Tons
1,000 acres
Cwt
1,000 cwt
1,000 acres
Cwt
1,000 cwt
1,000 acres
Tons
Tons
23.0
31
317
27.0
4.33
100,970
7.7
398
2,610
7.2
580
1,915
15.2
110
1,020
46.3
6.7
198,400
12.7
370
2,833
9.4
300
797
9.7
39.0
205,000
1989
1947
2003
1999
2013
1999
1994
1995
1995
1941
2014
1941
1961
2006,2009
1994
1949
1987
2010
1935
2014
1948
1943
2009
1943
1982
2009
1982
1.0
9
17
0.8
0.60
600
0.5
155
132
1.6
174
576
8.0
42
525
9.3
0.6
8,900
2.5
120
644
1.8
60
204
1.0
2.7
5,000
1928
1981
1928
1921
1947
1921
1929
1957
1936
2005
1935
1966
2005
1949
1949
1932
1924
1932
2014
1935
2012
2001
1959
1988
1921
1943
1921
1928
1918
1929
1928
1949
1918
1928
1928
1918

40 VEGETABLES MICHIGAN AGRICULTURAL STATISTICS 2014-2015
Vegetables: Acres harvested and value of production, 2010-2014
Item Unit 2010 2011 1 2012 1 2013 1 2014 1
Acres harvested
Value of production
1,000 acres
1,000 dollars
105
252,148
105
251,544
102
257,165
98
256,759
(D)
(D)
(D) Withheld to avoid disclosing data for individual operations. 1 Processing carrots excluded to avoid disclosure of individual operations.
Principal vegetables, fresh market: Acres, production, and value, 2010-2014 1
Year Planted Harvested Production Value
Acres Acres 1,000 cwt 1,000 dollars
2010
2011
2012
2013
2014
57,800
57,500
55,900
53,100
51,700
55,400
54,400
51,900
49,400
48,500
8,430
8,445
8,479
8,015
8,153
176,860
180,343
189,042
187,289
173,562
1 Includes dual purpose vegetables.
Principal vegetables, processing: Acres, production, and value, 2010-2014 1
Year Planted Harvested Production Value
Acres Acres Tons 1,000 dollars
2010
2011 2
2012 2
2013 2
2014 2
50,300
51,800
51,300
50,300
(D)
49,300
50,700
50,000
49,000
(D)
372,810
334,520
348,680
348,300
(D)
75,288
71,201
68,123
69,470
(D)
(D) Withheld to avoid disclosing data for individual operations. 1 Excludes dual purpose vegetables. 2 Processing carrots excluded to avoid disclosure of individual operations.
Vegetables, processing: Acres, production, and value, 2010-2014
Item
and Year Planted Harvested Yield Production
Price
per ton Value
Acres Acres Tons Tons Dollars 1,000 dollars
Cucumbers
2010
2011
2012
2013
2014
Snap beans
2010
2011
2012
2013
2014
Tomatoes
2010
2011
2012
2013
2014
32,000
32,400
29,700
29,000
27,900
14,800
15,900
18,000
18,000
(D)
3,500
3,500
3,600
3,300
3,600
31,000
31,600
28,700
28,000
27,400
14,800
15,600
17,800
17,800
(D)
3,500
3,500
3,500
3,200
3,400
6.40
5.60
5.40
5.80
6.10
3.98
3.37
4.00
4.33
(D)
33.00
30.00
35.00
34.00
38.00
198,400
176,960
154,980
162,400
167,140
58,910
52,560
71,200
77,100
(D)
115,500
105,000
122,500
108,800
129,200
250.00
255.00
240.00
230.00
210.00
240.00
280.00
235.00
240.00
(D)
100.00
108.00
116.00
125.00
117.00
49,600
45,125
37,195
37,352
35,099
14,138
14,736
16,718
18,518
(D)
11,550
11,340
14,210
13,600
15,116
(D) Withheld to avoid disclosing data for individual operations. 1
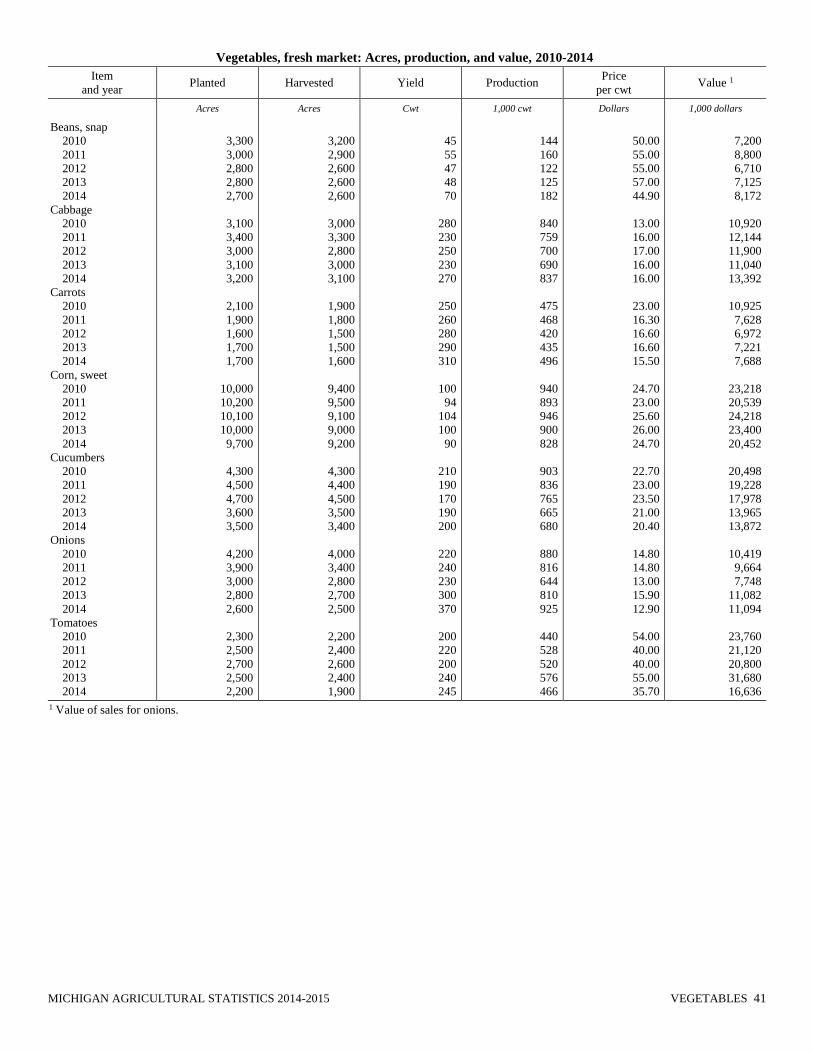
MICHIGAN AGRICULTURAL STATISTICS 2014-2015 VEGETABLES 41
Vegetables, fresh market: Acres, production, and value, 2010-2014
Item
and year Planted Harvested Yield Production
Price
per cwt Value 1
Acres Acres Cwt 1,000 cwt Dollars 1,000 dollars
Beans, snap
2010
2011
2012
2013
2014
Cabbage
2010
2011
2012
2013
2014
Carrots
2010
2011
2012
2013
2014
Corn, sweet
2010
2011
2012
2013
2014
Cucumbers
2010
2011
2012
2013
2014
Onions
2010
2011
2012
2013
2014
Tomatoes
2010
2011
2012
2013
2014
3,300
3,000
2,800
2,800
2,700
3,100
3,400
3,000
3,100
3,200
2,100
1,900
1,600
1,700
1,700
10,000
10,200
10,100
10,000
9,700
4,300
4,500
4,700
3,600
3,500
4,200
3,900
3,000
2,800
2,600
2,300
2,500
2,700
2,500
2,200
3,200
2,900
2,600
2,600
2,600
3,000
3,300
2,800
3,000
3,100
1,900
1,800
1,500
1,500
1,600
9,400
9,500
9,100
9,000
9,200
4,300
4,400
4,500
3,500
3,400
4,000
3,400
2,800
2,700
2,500
2,200
2,400
2,600
2,400
1,900
45
55
47
48
70
280
230
250
230
270
250
260
280
290
310
100
94
104
100
90
210
190
170
190
200
220
240
230
300
370
200
220
200
240
245
144
160
122
125
182
840
759
700
690
837
475
468
420
435
496
940
893
946
900
828
903
836
765
665
680
880
816
644
810
925
440
528
520
576
466
50.00
55.00
55.00
57.00
44.90
13.00
16.00
17.00
16.00
16.00
23.00
16.30
16.60
16.60
15.50
24.70
23.00
25.60
26.00
24.70
22.70
23.00
23.50
21.00
20.40
14.80
14.80
13.00
15.90
12.90
54.00
40.00
40.00
55.00
35.70
7,200
8,800
6,710
7,125
8,172
10,920
12,144
11,900
11,040
13,392
10,925
7,628
6,972
7,221
7,688
23,218
20,539
24,218
23,400
20,452
20,498
19,228
17,978
13,965
13,872
10,419
9,664
7,748
11,082
11,094
23,760
21,120
20,800
31,680
16,636
1 Value of sales for onions.

42 VEGETABLES MICHIGAN AGRICULTURAL STATISTICS 2014-2015
Vegetables, dual purpose: Acres, production, and value, 2010-2014
Item and year Planted Harvested Yield Production Price
per cwt Value
Acres Acres Cwt 1,000 cwt Dollars 1,000 dollars
Asparagus
2010
2011
2012
2013
2014
Celery
2010
2011
2012
2013
2014
Peppers, bell
2010
2011
2012
2013
2014
Pumpkins
2010
2011
2012
2013
2014
Squash
2010
2011
2012
2013
2014
10,700
10,400
10,300
10,300
10,300
2,000
2,000
2,100
1,900
1,800
1,700
1,600
1,700
1,600
1,500
7,400
7,200
6,800
6,600
6,400
6,700
6,900
7,100
6,200
6,100
10,500
9,800
9,100
9,000
9,000
1,900
1,800
2,000
1,800
1,700
1,600
1,500
1,600
1,500
1,400
6,800
6,800
6,300
6,300
6,100
6,600
6,800
7,000
6,100
6,000
16
22
21
23
24
525
490
565
575
580
230
270
260
250
260
140
145
150
155
160
200
220
240
200
200
168
216
191
206
220
1,000
882
1,130
1,035
985
368
405
416
375
364
952
986
945
978
970
1,320
1,496
1,680
1,220
1,200
83.00
80.20
90.40
90.50
93.20
17.90
14.70
19.80
19.70
19.10
33.00
36.00
38.00
37.00
37.00
14.50
17.00
14.00
11.50
11.80
9.20
13.10
14.30
14.50
15.00
13,948
17,322
17,274
18,640
20,505
17,880
12,958
22,380
20,359
18,853
12,144
14,580
15,808
13,875
13,468
13,804
16,762
13,230
11,212
11,398
12,144
19,598
24,024
17,690
18,032
U.S. Pickle stocks in tanks, barrels, and fresh pack, December 1, 2010-2014
Year
From current year crop From previous year crop
Total stocks Salt stock
including dill Fresh pack Refrigerated
Salt stock
including dill
Tons Tons Tons Tons Tons
2010
2011
2012
2013
2014
137,800
182,863
206,561
165,055
43,560
34,225
65,191
44,877
41,000
36,134
2,000
2,250
17,033
375
3,466
9,440
9,211
6,532
6,390
4,655
183,465
259,515
275,003
212,820
87,815

MICHIGAN AGRICULTURAL STATISTICS 2014-2015 HORTICULTURE 43
Horticulture
Floriculture crops: Number of growers by gross value of sales, 2010-2014
Year $10,000-
$19,999
$20,000-
$39,000
$40,000-
$49,000
$50,000-
$99,999
$100,000-
$499,999
$500,000
or more
Total
growers
Number Number Number Number Number Number Number
2010
2011
2012
2013
2014
60
47
66
78
44
83
79
83
83
47
38
38
35
35
15
125
123
111
107
60
178
174
190
175
159
137
123
121
126
129
621
584
606
604
454
Floriculture crops: Growing area by type of cover, 2010-2014
Year Glass
greenhouses
Fiberglass
and other
rigid
greenhouses
Plastic
film
greenhouses
Total
greenhouse
cover
Shade and
temporary
cover
Total
covered
area
Open
ground
1,000 square feet 1,000 square feet 1,000 square feet 1,000 square feet 1,000 square feet 1,000 square feet Acres
2010
2011
2012
2013
2014
4,551
4,345
4,640
3,890
3,605
4,894
4,896
4,101
3,856
3,580
38,252
38,732
39,202
39,355
38,947
47,697
47,973
47,943
47,101
46,132
513
732
634
484
599
48,210
48,705
48,577
47,585
46,731
3,248
3,616
3,324
3,270
3,999

44 HORTICULTURE MICHIGAN AGRICULTURAL STATISTICS 2014-2015
Floriculture crops: Wholesale value of sales by category, 2010-2014
Year
Total
cut
flowers
Total
potted
flowering
plants
Total
foliage
for indoor
or patio use
Total
bedding/
garden
plants
Total
wholesale
value of
reported
crops
Expanded
wholesale
value of
reported
crops 1
1,000 dollars 1,000 dollars 1,000 dollars 1,000 dollars 1,000 dollars 1,000 dollars
2010
2011
2012
2013
2014
9,540
5,741
5,017
4,786
5,368
32,137
27,138
25,482
34,394
37,127
7,812
( 2 )
1,915
7,085
7,289
265,936
260,626
255,483
281,737
266,177
394,618
361,486
366,407
406,631
398,755
408,133
376,135
379,020
418,931
405,671
1 Wholesale value of sales as reported by growers with $100,000 or more in sales of floriculture crops plus a calculated wholesale value of sales for
growers with sales below $100,000. The value of sales for growers below the $100,000 level was estimated by multiplying the number of growers
in each size group by the midpoint of each dollar range. 2 Not published to avoid disclosure of individual operations.
0.000 2.000 4.000 6.000 8.000 10.000 12.000 14.000 16.000
Bedding Marigolds
Hanging Basket Geraniums from Cuttings
Potted Hosta
Bedding Begonias
Potted Easter Lillies
Potted Flowering Bulbs
Potted Geraniums from Seed
Hanging Basket Petunias
Bedding Impatients
Potted Petunias
Potted Geraniums from Cuttings
Potted Poinsettias
Bedding Petunias
Potted Hardy Chrysanthemums
Million dollars
Selected Floriculture Crops: Value of Sales, 2014

MICHIGAN AGRICULTURAL STATISTICS 2014-2015 HORTICULTURE 45
Bedding plants: Producers, quantity sold, price, and value, 2010-2014
Item Producers Quantity
sold
Percent of
sales at
wholesale
Wholesale
price
Value of
sales at
wholesale
Number 1,000 flats Percent Dollars 1,000 dollars
Begonias
2010
2011
2012
2013
2014
Geraniums from cuttings
2010
2011
2012
2013
2014
Geraniums from seed
2010
2011
2012
2013
2014
Impatiens
2010
2011
2012
2013
2014
Marigolds
2010
2011
2012
2013
2014
New Guinea Impatiens
2010
2011
2012
2013
2014
Pansies/Violas
2010
2011
2012
2013
2014
Petunias
2010
2011
2012
2013
2014
Other flowering and foliar
2010
2011
2012
2013
2014
Vegetables 1
2010
2011
2012
2013
2014
199
191
199
180
178
14
12
14
12
8
25
24
26
( 1 )
30
207
195
197
165
165
206
194
204
188
185
23
25
21
27
36
186
176
185
171
167
224
210
210
196
192
205
201
208
189
172
166
153
160
136
124
828
804
768
798
742
43
41
30
24
23
174
52
56
( 1 )
65
2,079
2,011
1,567
1,602
1,274
740
723
568
731
566
44
41
30
43
110
652
630
635
515
458
1,724
1,454
1,248
1,564
1,331
3,001
3,270
2,525
3,719
3,043
971
764
755
630
563
86
85
83
81
78
78
83
79
58
87
88
48
76
( 1 )
87
86
86
84
92
90
89
87
84
87
82
80
78
76
77
92
92
92
92
90
91
90
88
87
89
86
87
88
87
92
88
85
81
82
76
73
7.54
7.44
8.27
7.8
8.57
15.48
16.07
19.97
19.54
21.92
10.02
11.51
10.34
( 1 )
7.61
7.07
7.02
8.07
6.34
7.21
7.43
7.2
8.2
6.32
8.05
7.23
7.03
6.85
7.03
8.77
6.8
7.18
7.44
7.86
9.18
8.34
7.81
8.85
8.21
9.29
7.42
7.52
8.64
6.69
6.74
7.82
9.19
9.43
7.69
8.65
6,243
5,982
6,351
6,224
6,359
666
659
599
469
504
1,743
599
579
( 1 )
495
14,699
14,117
12,646
10,157
9,186
5,498
5,206
4,658
4,620
4,556
318
288
206
302
965
4,434
4,523
4,724
4,048
4,204
14,378
11,356
11,045
12,840
12,365
22,267
24,590
21,816
24,880
20,510
7,593
7,021
7,120
4,845
4,870
1 Does not include vegetable transplants grown for commercial use.
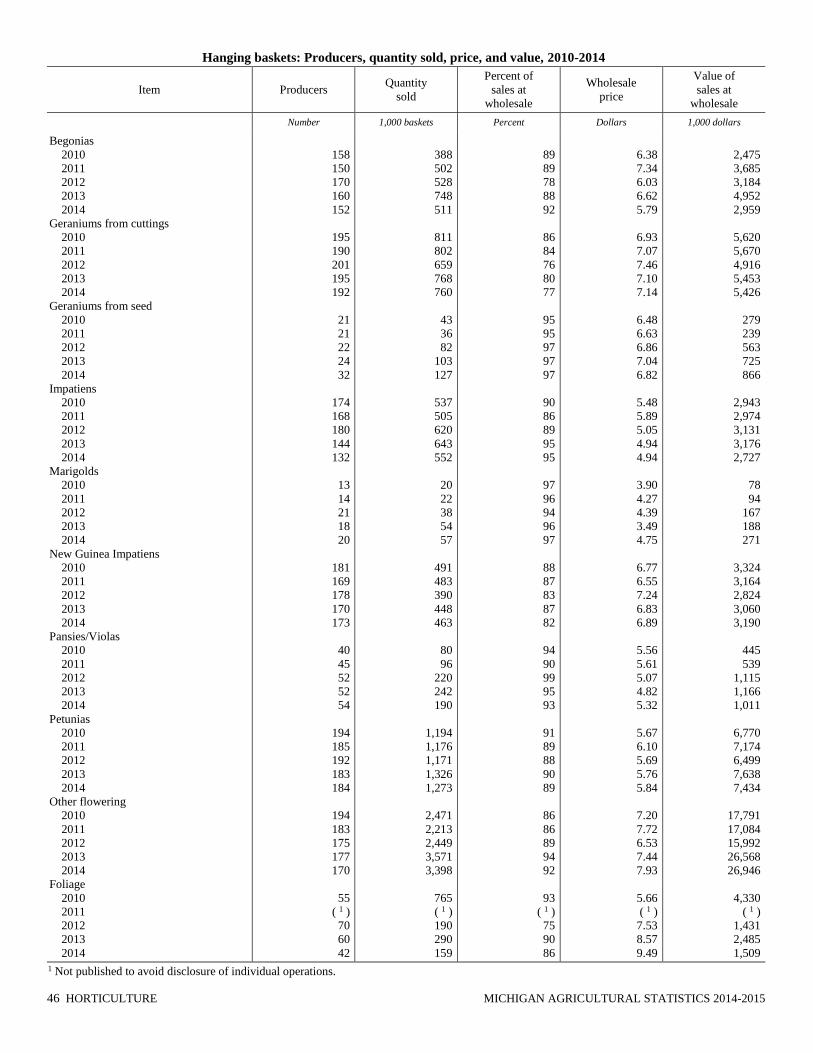
46 HORTICULTURE MICHIGAN AGRICULTURAL STATISTICS 2014-2015
Hanging baskets: Producers, quantity sold, price, and value, 2010-2014
Item Producers Quantity
sold
Percent of
sales at
wholesale
Wholesale
price
Value of
sales at
wholesale
Number 1,000 baskets Percent Dollars 1,000 dollars
Begonias
2010
2011
2012
2013
2014
Geraniums from cuttings
2010
2011
2012
2013
2014
Geraniums from seed
2010
2011
2012
2013
2014
Impatiens
2010
2011
2012
2013
2014
Marigolds
2010
2011
2012
2013
2014
New Guinea Impatiens
2010
2011
2012
2013
2014
Pansies/Violas
2010
2011
2012
2013
2014
Petunias
2010
2011
2012
2013
2014
Other flowering
2010
2011
2012
2013
2014
Foliage
2010
2011
2012
2013
2014
158
150
170
160
152
195
190
201
195
192
21
21
22
24
32
174
168
180
144
132
13
14
21
18
20
181
169
178
170
173
40
45
52
52
54
194
185
192
183
184
194
183
175
177
170
55
( 1 )
70
60
42
388
502
528
748
511
811
802
659
768
760
43
36
82
103
127
537
505
620
643
552
20
22
38
54
57
491
483
390
448
463
80
96
220
242
190
1,194
1,176
1,171
1,326
1,273
2,471
2,213
2,449
3,571
3,398
765
( 1 )
190
290
159
89
89
78
88
92
86
84
76
80
77
95
95
97
97
97
90
86
89
95
95
97
96
94
96
97
88
87
83
87
82
94
90
99
95
93
91
89
88
90
89
86
86
89
94
92
93
( 1 )
75
90
86
6.38
7.34
6.03
6.62
5.79
6.93
7.07
7.46
7.10
7.14
6.48
6.63
6.86
7.04
6.82
5.48
5.89
5.05
4.94
4.94
3.90
4.27
4.39
3.49
4.75
6.77
6.55
7.24
6.83
6.89
5.56
5.61
5.07
4.82
5.32
5.67
6.10
5.69
5.76
5.84
7.20
7.72
6.53
7.44
7.93
5.66
( 1 )
7.53
8.57
9.49
2,475
3,685
3,184
4,952
2,959
5,620
5,670
4,916
5,453
5,426
279
239
563
725
866
2,943
2,974
3,131
3,176
2,727
78
94
167
188
271
3,324
3,164
2,824
3,060
3,190
445
539
1,115
1,166
1,011
6,770
7,174
6,499
7,638
7,434
17,791
17,084
15,992
26,568
26,946
4,330
( 1 )
1,431
2,485
1,509
1 Not published to avoid disclosure of individual operations.

MICHIGAN AGRICULTURAL STATISTICS 2014-2015 HORTICULTURE 47
Potted flowering and annual bedding plants: Producers, quantity sold, price, and value, 2010-2014
Item Producers
Quantity sold Percent of
sales at
wholesale
Wholesale price Value of
sales at
wholesale
Less than
5 inch
pots
5 inch
pots or
larger
Total
Less than
5 inch
pots
5 inch
pots or
larger
Number 1,000 pots 1,000 pots 1,000 pots Percent Dollars Dollars 1,000 dollars
Begonias
2010
2011
2012
2013
2014
Chrysanthemums, florist
2010
2011
2012
2013
2014
Chrysanthemums, hardy garden
2010
2011
2012
2013
2014
Easter Lilies
2010
2011
2012
2013
2014
Geraniums from cuttings
2010
2011
2012
2013
2014
Geraniums from seed
2010
2011
2012
2013
2014
Impatiens
2010
2011
2012
2013
2014
Marigolds
2010
2011
2012
2013
2014
New Guinea Impatiens
2010
2011
2012
2013
2014
100
109
120
112
106
10
13
19
18
17
135
136
130
113
110
25
27
22
29
29
213
194
205
187
191
90
91
89
77
78
71
74
76
60
55
25
23
28
26
29
168
157
175
161
160
810
551
898
1,369
639
7
8
33
49
155
1,338
1,109
985
1,554
1,354
( 1 )
( 1 )
37
121
103
2,269
2,087
2,078
2,381
2,116
11,573
17,262
8,923
8,805
8,548
672
577
653
592
277
145
106
63
260
157
1,924
2,005
2,491
2,886
2,169
237
166
175
340
292
19
22
301
511
587
4,890
4,719
4,495
4,728
4,593
1,601
1,021
1,136
1,337
1,415
1,590
1,245
1,327
1,131
1,138
224
55
34
4
48
199
197
189
210
149
66
122
125
82
118
565
261
343
345
213
1,047
717
1,073
1,709
931
26
30
334
560
742
6,228
5,828
5,480
6,282
5,947
1,601
1,021
1,173
1,458
1,518
3,859
3,332
3,405
3,512
3,254
11,797
17,317
8,957
8,809
8,596
871
774
842
802
426
211
228
188
342
275
2,489
2,266
2,834
3,231
2,382
90
82
84
92
90
96
86
96
97
99
95
94
94
94
93
99
98
98
99
97
72
69
70
75
70
98
93
98
97
97
94
90
94
98
98
99
99
95
97
96
92
93
94
92
90
1.44
1.46
1.45
1.38
1.59
1.81
1.65
1.70
1.59
1.31
1.20
1.08
0.92
0.98
0.96
( 1 )
( 1 )
3.48
2.10
1.79
1.93
1.97
1.93
1.77
2.05
0.93
0.88
0.77
0.80
0.82
1.34
1.29
1.24
0.91
1.20
0.86
0.86
0.83
0.50
0.69
1.22
1.36
1.18
1.24
1.45
2.73
3.27
2.75
4.42
3.76
5.86
5.69
4.69
4.55
3.38
2.75
2.90
2.78
2.99
3.07
3.78
4.34
4.28
4.09
4.73
3.39
3.95
3.92
4.27
4.46
4.81
3.01
6.90
5.76
4.34
3.35
3.57
2.79
2.90
2.24
1.80
2.44
2.76
1.45
2.22
2.19
3.34
2.81
4.12
5.70
1,813
1,347
1,783
3,392
2,114
124
138
1,468
2,403
2,187
15,053
14,883
13,402
15,660
15,400
6,053
4,429
4,991
5,722
6,877
9,769
9,029
9,212
9,044
9,413
11,840
15,356
7,105
7,067
7,218
1,567
1,448
1,337
1,148
666
244
389
397
249
370
3,585
3,599
3,903
5,000
4,359
See footnote(s) at end of table. --continued

48 HORTICULTURE MICHIGAN AGRICULTURAL STATISTICS 2014-2015
Potted flowering and annual bedding plants: Producers, quantity sold, price, and value, 2010-2014 (continued)
Item Producers
Quantity sold Percent of
sales at
wholesale
Wholesale price Value of
sales at
wholesale
Less than
5 inch
pots
5 inch
pots or
larger
Total
Less than
5 inch
pots
5 inch
pots or
larger
Number 1,000 pots 1,000 pots 1,000 pots Percent Dollars Dollars 1,000 dollars
Pansies/Violas
2010
2011
2012
2013
2014
Petunias
2010
2011
2012
2013
2014
Poinsettias
2010
2011
2012
2013
2014
Flowering bulbs
2010
2011
2012
2013
2014
Other flowering plants
2010
2011
2012
2013
2014
Other flowering and foliar type
bedding plants
2010
2011
2012
2013
2014
Vegetable type 2
2010
2011
2012
2013
2014
54
56
53
55
63
113
114
109
109
116
56
56
53
58
56
32
33
28
26
22
36
40
45
54
70
154
154
156
154
157
116
122
121
110
96
1,302
1,274
1,646
1,940
1,321
2,599
2,223
2,306
2,866
3,065
567
515
520
624
766
4,101
2,549
436
395
402
763
367
772
1,141
1,488
16,705
17,013
21,675
17,301
13,731
6,264
6,120
4,070
4,533
3,744
520
366
547
371
351
1,486
1,169
2,180
1,641
1,188
1,748
1,662
1,688
1,781
1,781
2,386
1,974
1,366
1,717
1,706
526
385
422
881
1,503
5,607
3,616
7,789
7,071
4,881
1,494
500
1,139
722
652
1,822
1,640
2,193
2,311
1,672
4,085
3,392
4,486
4,507
4,253
2,315
2,177
2,208
2,405
2,547
6,487
4,523
1,802
2,112
2,108
1,289
752
1,194
2,022
2,991
22,312
20,629
29,464
24,372
18,612
7,758
6,620
5,209
5,255
4,396
99
98
98
99
95
94
92
93
92
92
94
95
93
95
96
100
100
99
99
99
90
76
88
84
90
91
87
92
93
90
93
92
90
87
81
0.85
0.86
0.74
0.79
1.07
1.42
1.70
1.68
1.21
1.28
1.98
2.00
1.97
1.76
2.08
0.82
0.89
1.73
1.79
1.80
1.33
1.47
1.46
2.10
1.88
1.37
1.31
1.17
1.41
1.64
0.92
1.42
1.10
1.33
1.22
2.34
2.70
2.59
2.47
2.56
2.13
2.06
2.19
3.61
4.60
4.50
4.52
4.42
4.88
4.74
3.40
3.47
3.38
3.52
3.64
3.84
4.74
4.58
4.61
4.43
3.42
4.25
3.32
3.70
4.47
2.87
5.57
3.80
5.23
6.52
2,324
2,084
2,635
2,449
2,312
6,856
6,187
8,648
9,392
9,388
8,989
8,542
8,485
9,790
10,035
11,475
9,118
5,371
6,751
6,933
3,035
2,364
3,060
6,458
9,456
42,062
37,655
51,219
50,557
44,337
10,051
11,475
8,805
9,805
8,819
1 Pot sizes have been combined into category with greatest production to avoid disclosure of individual operations. 2 Does not include vegetable transplants grown for commercial use.

MICHIGAN AGRICULTURAL STATISTICS 2014-2015 HORTICULTURE 49
Herbaceous perennials: Producers, quantity sold, price, and value, 2010-2014
Item Producers
Quantity sold Percent of
sales at
wholesale
Wholesale price Value of
All sales at
wholesale Less than
1 gallon
1 to 2
gallon
2 gallon
and larger Total
Less than
1 gallon
1 to 2
gallon
2 gallon
and larger
Number 1,000 pots 1,000 pots 1,000 pots 1,000 pots Percent Dollars Dollars Dollars 1,000 dollars
Hosta
2010
2011
2012
2013
2014
Other
2010
2011
2012
2013
2014
103
102
107
98
95
124
120
130
125
119
690
1,002
1,070
798
1,112
6,158
5,902
6,179
6,746
5,587
489
437
604
654
973
6,025
5,638
5,680
7,747
7,461
56
34
27
58
54
1,133
150
126
138
428
1,235
1,473
1,701
1,510
2,139
13,316
11,690
11,985
14,631
13,476
92
94
93
92
96
87
87
87
94
95
1.61
1.88
1.80
1.91
1.93
1.70
2.18
1.85
1.65
1.73
3.76
3.60
3.67
3.30
3.39
3.76
4.32
3.90
3.77
3.82
7.85
10.65
11.61
9.19
8.09
5.91
7.79
6.85
7.12
6.75
3,389
3,819
4,456
4,215
5,881
39,819
38,391
34,446
41,320
41,056

50 LIVESTOCK, DAIRY, & POULTRY MICHIGAN AGRICULTURAL STATISTICS 2014-2015
Livestock, Dairy, and Poultry
Livestock: Record highs and lows
Livestock Unit
Record high Record low Year
estimates
started Quantity Year Quantity Year
Cattle and calves
Cattle on feed
Chickens, all 1
Cows, beef
Cows, milk
Eggs 2
Hogs and pigs 1
Honey
Milk
Sheep
Wool
1,000 head
1,000 head
1,000 birds
1,000 head
1,000 head
Million eggs
1,000 head
1,000 pounds
Million pounds
1,000 head
1,000 pounds
2,036
210
16,278
239
1,080
3,867
1,397
11,780
9,609
3,100
8,424
1944
2004
2013
1977
1945
2014
1943
1939
2014
1867
1934
538
57
6,190
24
225
1,104
512
3,960
3,941
62
380
1867
1931
1997
1925,1933
1867
1929
1934
2006,2009
1927
1999
2009,2010,2014
1867
1930
1924
1920
1867
1924
1867
1921
1924
1867
1934
1 December 1. 2 December 1 previous year to November 30.
Cattle and Calves
Cattle and calves: Number on farms by class, January 1, 2011-2015
Class 2011 2012 2013 2014 2015
1,000 head 1,000 head 1,000 head 1,000 head 1,000 head
All cows that have calved
Beef cows
Milk cows
Heifers, 500 pounds and over
Beef cow replacement
Milk cow replacement
Other
Steers, 500 pounds and over
Bulls, 500 pounds and over
Calves, under 500 pounds
All cattle and calves
460
99
361
225
27
148
50
190
15
200
1,090
480
109
371
230
27
158
45
173
17
210
1,110
490
113
377
234
28
157
49
180
16
220
1,140
500
119
381
240
29
164
47
175
15
200
1,130
510
107
403
225
23
167
35
170
15
200
1,120

MICHIGAN AGRICULTURAL STATISTICS 2014-2015 LIVESTOCK, DAIRY, & POULTRY 51
Cattle and calves: Balance sheet, 2010-2014
Year
All cattle
and calves
on hand
January 1
Calf
crop Inshipments
Marketings 1
Farm slaughter
cattle and
calves 2
Deaths All cattle
and calves
on hand
following
January 1
Cattle Calves Cattle Calves
1,000 head 1,000 head 1,000 head 1,000 head 1,000 head 1,000 head 1,000 head 1,000 head 1,000 head
2010
2011
2012
2013
2014
1,100
1,090
1,110
1,140
1,130
385
390
390
395
395
61
58
58
60
60
351
318
303
344
329
36
38
42
47
45
4
3
3
3
3
22
23
24
25
23
43
46
46
46
45
1,090
1,110
1,140
1,130
1,120
1 Includes custom slaughter and State outshipments, but excludes inter-farm sales within the State. 2 Excludes custom slaughter for farmers at commercial establishments.
Cattle and calves: Production and income, 2010-2014
Year Production 1 Marketings 2 Value of
production
Cash
receipts 3
Value of
home
consumption
Gross
income
1,000 pounds 1,000 pounds 1,000 dollars 1,000 dollars 1,000 dollars 1,000 dollars
2010
2011
2012
2013
2014
447,614
425,512
415,783
457,552
434,337
483,820
437,325
418,625
478,500
452,200
348,948
418,199
464,842
518,536
630,490
381,420
433,661
473,212
552,137
664,566
9,721
12,721
13,978
16,463
20,798
391,141
446,382
487,190
568,600
685,364
1 Adjustments made for changes in inventory and for inshipments. 2 Excludes custom slaughter for use on farms where produced and inter-farm sales within the State. 3 Receipts from marketings and sale of farm slaughter.
0 200 400 600 800 1000 1200 1400 1600 1800 2000 2200 2400
Eggs
Hogs & pigs
Cattle & calves
Dairy
Million dollars
Michigan Livestock: Value of Production, 2014

52 LIVESTOCK, DAIRY, & POULTRY MICHIGAN AGRICULTURAL STATISTICS 2014-2015
Dairy
Milk: Production, utilization, marketings, and value, 2010-2014
Item Unit 2010 2011 2012 2013 2014
Production
Total milk produced on farms
Milkfat produced
Milkfat
Utilization
Milk used where produced
Fed to calves
Used for milk, cream, and butter
Milk marketed by producers
Average return per 100 pounds of milk
Average return per pound milkfat
Fluid grade
Total cash receipts
Value
Value of milk used where produced 1
Total value of milk produced
Million pounds
Million pounds
Percent
Million pounds
Million pounds
Million pounds
Dollars
Dollars
Percent
1,000 dollars
1,000 dollars
1,000 dollars
8,333
299.2
3.59
25
2
8,306
17.00
4.74
100
1,412,020
4,590
1,416,610
8,478
310.3
3.66
27
2
8,449
21.00
5.74
100
1,774,290
6,090
1,780,380
8,991
327.3
3.64
24
2
8,965
18.90
5.19
100
1,694,385
4,914
1,699,299
9,164
339.1
3.70
26
2
9,136
20.50
5.54
100
1,872,880
5,740
1,878,620
9,609
355.5
3.70
24
2
9,583
24.10
6.51
100
2,309,503
6,266
2,315,769
1 Includes value of milk fed to calves and milk used by farm households.
12000
14000
16000
18000
20000
22000
24000
26000
Po
un
ds
pe
r co
w
Year
Annual Milk per Cow, 1988-2014
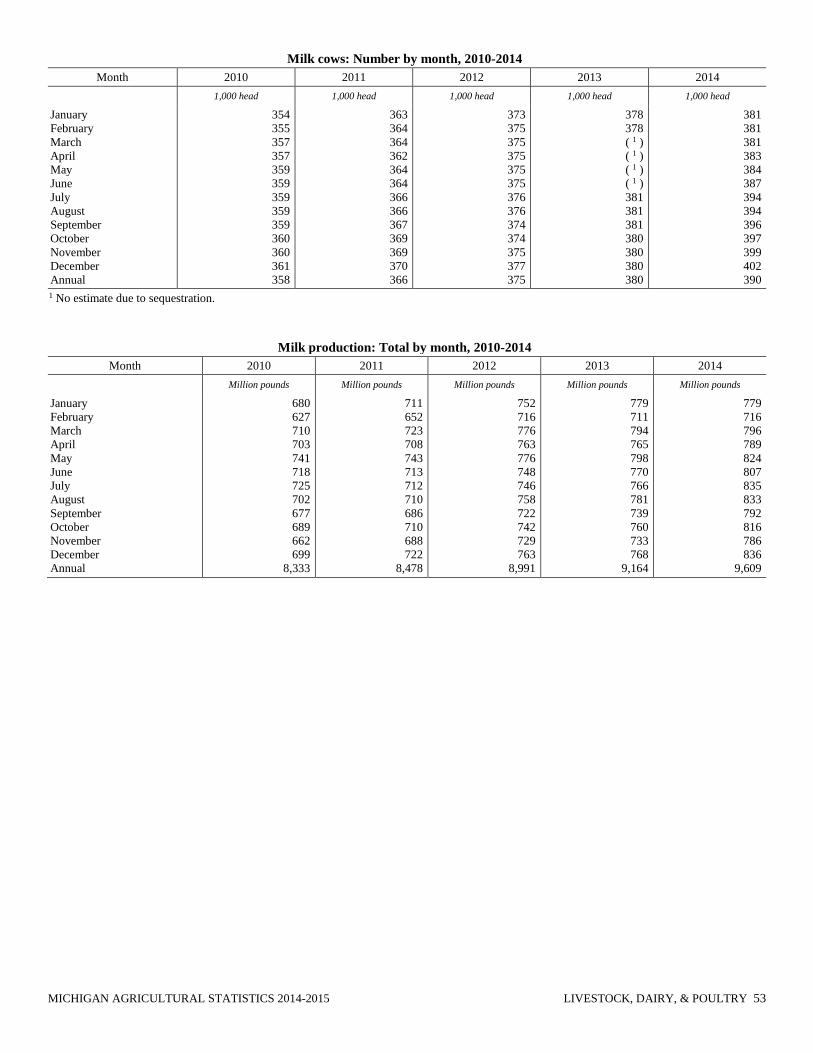
MICHIGAN AGRICULTURAL STATISTICS 2014-2015 LIVESTOCK, DAIRY, & POULTRY 53
Milk cows: Number by month, 2010-2014
Month 2010 2011 2012 2013 2014
1,000 head 1,000 head 1,000 head 1,000 head 1,000 head
January
February
March
April
May
June
July
August
September
October
November
December
Annual
354
355
357
357
359
359
359
359
359
360
360
361
358
363
364
364
362
364
364
366
366
367
369
369
370
366
373
375
375
375
375
375
376
376
374
374
375
377
375
378
378
( 1 )
( 1 )
( 1 )
( 1 )
381
381
381
380
380
380
380
381
381
381
383
384
387
394
394
396
397
399
402
390
1 No estimate due to sequestration.
Milk production: Total by month, 2010-2014
Month 2010 2011 2012 2013 2014
Million pounds Million pounds Million pounds Million pounds Million pounds
January
February
March
April
May
June
July
August
September
October
November
December
Annual
680
627
710
703
741
718
725
702
677
689
662
699
8,333
711
652
723
708
743
713
712
710
686
710
688
722
8,478
752
716
776
763
776
748
746
758
722
742
729
763
8,991
779
711
794
765
798
770
766
781
739
760
733
768
9,164
779
716
796
789
824
807
835
833
792
816
786
836
9,609
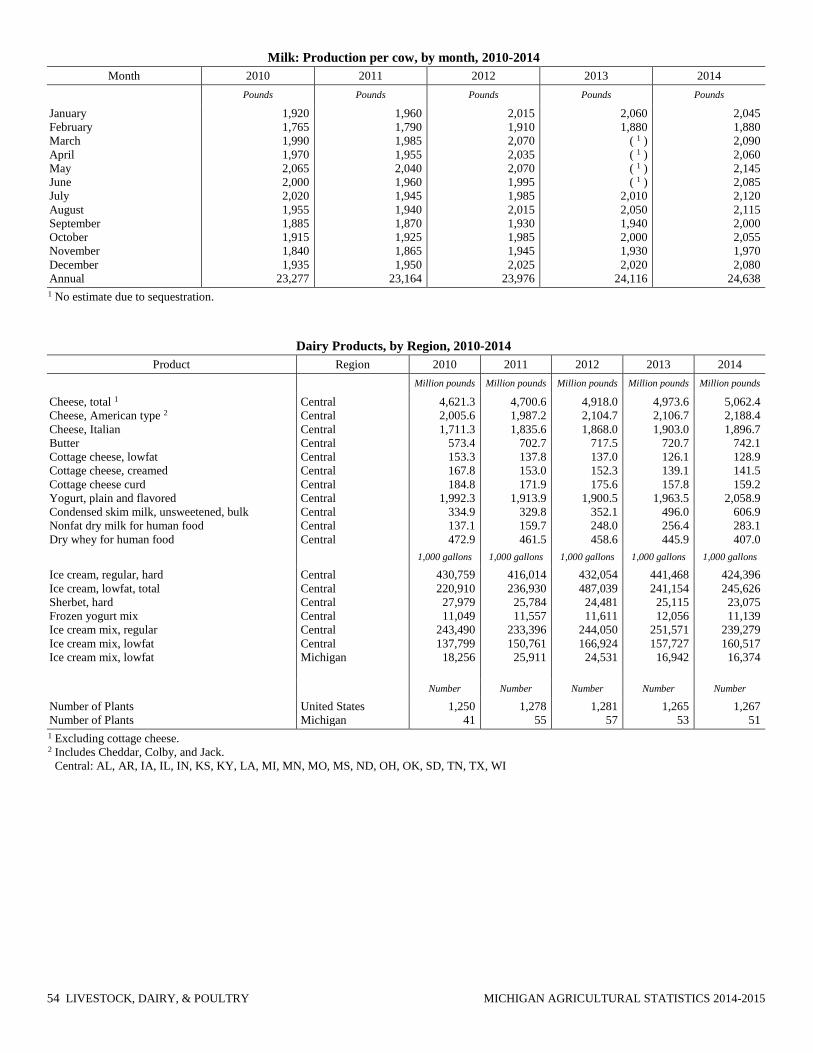
54 LIVESTOCK, DAIRY, & POULTRY MICHIGAN AGRICULTURAL STATISTICS 2014-2015
Milk: Production per cow, by month, 2010-2014
Month 2010 2011 2012 2013 2014
Pounds Pounds Pounds Pounds Pounds
January
February
March
April
May
June
July
August
September
October
November
December
Annual
1,920
1,765
1,990
1,970
2,065
2,000
2,020
1,955
1,885
1,915
1,840
1,935
23,277
1,960
1,790
1,985
1,955
2,040
1,960
1,945
1,940
1,870
1,925
1,865
1,950
23,164
2,015
1,910
2,070
2,035
2,070
1,995
1,985
2,015
1,930
1,985
1,945
2,025
23,976
2,060
1,880
( 1 )
( 1 )
( 1 )
( 1 )
2,010
2,050
1,940
2,000
1,930
2,020
24,116
2,045
1,880
2,090
2,060
2,145
2,085
2,120
2,115
2,000
2,055
1,970
2,080
24,638
1 No estimate due to sequestration.
Dairy Products, by Region, 2010-2014
Product Region 2010 2011 2012 2013 2014
Million pounds Million pounds Million pounds Million pounds Million pounds
Cheese, total 1
Cheese, American type 2
Cheese, Italian
Butter
Cottage cheese, lowfat
Cottage cheese, creamed
Cottage cheese curd
Yogurt, plain and flavored
Condensed skim milk, unsweetened, bulk
Nonfat dry milk for human food
Dry whey for human food
Central
Central
Central
Central
Central
Central
Central
Central
Central
Central
Central
4,621.3
2,005.6
1,711.3
573.4
153.3
167.8
184.8
1,992.3
334.9
137.1
472.9
4,700.6
1,987.2
1,835.6
702.7
137.8
153.0
171.9
1,913.9
329.8
159.7
461.5
4,918.0
2,104.7
1,868.0
717.5
137.0
152.3
175.6
1,900.5
352.1
248.0
458.6
4,973.6
2,106.7
1,903.0
720.7
126.1
139.1
157.8
1,963.5
496.0
256.4
445.9
5,062.4
2,188.4
1,896.7
742.1
128.9
141.5
159.2
2,058.9
606.9
283.1
407.0
1,000 gallons 1,000 gallons 1,000 gallons 1,000 gallons 1,000 gallons
Ice cream, regular, hard
Ice cream, lowfat, total
Sherbet, hard
Frozen yogurt mix
Ice cream mix, regular
Ice cream mix, lowfat
Ice cream mix, lowfat
Central
Central
Central
Central
Central
Central
Michigan
430,759
220,910
27,979
11,049
243,490
137,799
18,256
416,014
236,930
25,784
11,557
233,396
150,761
25,911
432,054
487,039
24,481
11,611
244,050
166,924
24,531
441,468
241,154
25,115
12,056
251,571
157,727
16,942
424,396
245,626
23,075
11,139
239,279
160,517
16,374
Number Number Number Number Number
Number of Plants
Number of Plants
United States
Michigan
1,250
41
1,278
55
1,281
57
1,265
53
1,267
51
1 Excluding cottage cheese. 2 Includes Cheddar, Colby, and Jack.
Central: AL, AR, IA, IL, IN, KS, KY, LA, MI, MN, MO, MS, ND, OH, OK, SD, TN, TX, WI

MICHIGAN AGRICULTURAL STATISTICS 2014-2015 LIVESTOCK, DAIRY, & POULTRY 55
Hogs and Pigs
Hogs and pigs: Inventory, 2011-2015
Month
and year
Market hogs and pigs Breeding
stock
Total hogs
and pigs Under 50
pounds
50-119
pounds
120-179
pounds
180 lbs
and over
Total
market
1,000 head 1,000 head 1,000 head 1,000 head 1,000 head 1,000 head 1,000 head
March 1
2011
2012
2013
2014
2015
June 1
2011
2012
2013
2014
2015
September 1
2011
2012
2013
2014
December 1
2011
2012
2013
2014
300
285
290
275
280
300
280
280
270
275
300
300
295
290
300
300
305
310
220
190
215
190
210
240
210
220
210
255
260
220
230
225
200
210
210
245
210
220
225
225
260
200
205
180
200
230
215
215
190
205
220
230
200
250
190
195
220
200
240
190
215
210
200
230
215
195
225
200
220
240
235
255
920
890
950
890
990
930
910
890
880
990
990
930
940
920
940
980
950
1,060
110
110
110
110
110
110
110
110
110
110
110
110
110
110
110
110
110
110
1,030
1,000
1,060
1,000
1,100
1,040
1,020
1,000
990
1,100
1,100
1,040
1,050
1,030
1,050
1,090
1,060
1,170
500
600
700
800
900
1000
1100
1200
1300
1400
19
39
19
41
19
43
19
45
19
47
19
49
19
51
19
53
19
55
19
57
19
59
19
61
19
63
19
65
19
67
19
69
19
71
19
73
19
75
19
77
19
79
19
81
19
83
19
85
19
87
19
89
19
91
19
93
19
95
19
97
19
99
20
01
20
03
20
05
20
07
20
09
20
11
20
13
Tho
usa
nd
he
ad
Year
December 1 Hog Inventory, 1939-2014

56 LIVESTOCK, DAIRY, & POULTRY MICHIGAN AGRICULTURAL STATISTICS 2014-2015
Hogs and pigs: Sows farrowing and pig crop, 2010-2015
Year
December-February 1 March-May
Sows
farrowing
Pigs per
litter
Pig
crop
Sows
farrowing
Pigs per
litter
Pig
crop
1,000 head head 1,000 head 1,000 head head 1,000 head
2011
2012
2013
2014
2015
51
49
52
48
52
9.80
9.90
10.25
9.20
10.50
500
485
543
451
536
53
50
50
52
50
10.00
10.10
10.20
8.90
10.70
530
505
510
463
535
June-August September-November
2010
2011
2012
2013
2014
52
52
52
50
51
9.90
10.00
10.10
10.10
10.10
515
520
525
505
515
52
51
53
49
53
9.90
10.00
10.20
10.15
10.20
515
510
541
497
541
1 December of previous year.
Hogs and pigs: Balance sheet, 2010-2014
Year Beginning
inventory
Dec-Nov
pig crop Inshipments Marketings 1
Farm
slaughter 2 Deaths
Number on
hand
December 1
1,000 head 1,000 head 1,000 head 1,000 head 1,000 head 1,000 head 1,000 head
2010
2011
2012
2013
2014
1,080
1,040
1,050
1,090
1,060
2,073
2,060
2,056
2,055
1,949
237
264
248
250
250
2,269
2,242
2,201
2,263
2,070
3
2
2
2
2
78
70
61
70
67
1,040
1,050
1,090
1,060
1,170
1 Includes custom slaughter and state outshipments, but excludes sales within Michigan. 2 Excludes custom slaughter for farmers at commercial establishments.
Hogs and pigs: Production and income, 2010-2014
Year Production 1 Marketings 2 Value of
production
Cash
receipts 3
Value of
home
consumption
Gross
income
1,000 pounds 1,000 pounds 1,000 dollars 1,000 dollars 1,000 dollars 1,000 dollars
2010
2011
2012
2013
2014
619,869
615,658
548,754
561,091
524,658
629,620
621,210
547,316
574,745
523,600
307,177
403,124
349,236
377,604
393,428
319,388
417,228
356,555
395,702
402,618
401
662
799
715
807
319,789
417,890
357,354
396,417
403,425
1 Adjustments made for changes in inventory and for inshipments. 2 Excludes custom slaughter for use on farms where produced and inter-farm sales within the state. 3 Receipts from marketing and sales of farm slaughter. Includes allowance for higher average price of outshipments of feeder pigs.

MICHIGAN AGRICULTURAL STATISTICS 2014-2015 LIVESTOCK, DAIRY, & POULTRY 57
Honey
Honey: Production and value, 2010-2014 1
Year
Honey
producing
colonies
Yield per
colony Production
Price per
pound
Value of
production
Stocks
Dec 15 2
Thousands Pounds 1,000 pounds Cents 1,000 dollars 1,000 pounds
2010
2011
2012
2013
2014
71
74
73
85
91
58
64
57
55
63
4,118
4,736
4,161
4,675
5,733
167
181
203
216
250
6,877
8,572
8,447
10,098
14,333
1,524
2,084
1,332
982
1,835
1 Includes only producers with 5 or more colonies. 2 Stocks held by producers.
Mink
Mink: Farms, pelts produced and females bred to produce kits, 2011-2015
Year 2011 2012 2013 2014 2015
Number Number Number Number Number
Pelts produced
Females bred to produce kits
43,200
11,750
( 2 )
13,400
56,500
( 2 )
53,200
17,500
( 1 )
17,550
1 Published in July 2016. 2 No estimate due to sequestration.

58 LIVESTOCK, DAIRY, & POULTRY MICHIGAN AGRICULTURAL STATISTICS 2014-2015
Poultry
Chickens: Layers on hand, December 1, 2010-2014
Class 2010 2011 2012 2013 2014
1,000 birds 1,000 birds 1,000 birds 1,000 birds 1,000 birds
Total layers
Pullets not of laying age
Other chickens
All chickens (excluding broilers)
10,932
2,653
2
13,587
11,499
2,709
0
14,208
12,899
2,806
3
15,708
13,195
3,080
3
16,278
13,192
2,819
0
16,011
All eggs: Production and value, 2010-2014 1
Year Eggs
produced
Value of
production
Million 1,000 dollars
2010
2011
2012
2013
2014
3,055
3,149
3,609
3,818
3,867
170,763
198,496
239,603
271,400
325,322
1 December 1 previous year through November 30.
All egg production, by month, 2010-2014
Month 2010 2011 2012 2013 2014
Million eggs Million eggs Million eggs Million eggs Million eggs
December
January
February
March
April
May
June
July
August
September
October
November
Total 1
258
254
233
264
259
255
235
257
264
255
263
258
3,055
264
258
240
274
270
267
254
269
259
250
271
273
3,149
296
298
278
300
299
314
301
311
305
291
307
309
3,609
324
325
293
333
319
316
306
320
327
317
323
314
3,818
325
310
291
343
326
323
316
330
331
326
328
318
3,867
1 December 1 previous year through November 30. Sum of months may not add to total due to rounding.

MICHIGAN AGRICULTURAL STATISTICS 2014-2015 LIVESTOCK, DAIRY, & POULTRY 59
All layers: Average number on hand during the month, 2010-2014
Month 2010 2011 2012 2013 2014
1,000 birds 1,000 birds 1,000 birds 1,000 birds 1,000 birds
December
January
February
March
April
May
June
July
August
September
October
November
Annual 1
10,732
10,725
10,825
10,773
10,716
10,632
10,621
10,599
10,629
10,574
10,406
10,650
10,657
10,769
10,707
10,798
10,922
10,996
10,852
10,787
10,675
10,573
10,811
11,231
11,470
10,883
11,653
11,740
11,877
12,258
12,644
12,641
12,431
12,423
12,581
12,566
12,613
12,872
12,358
12,811
12,824
13,003
13,130
13,090
12,887
12,844
12,962
13,103
12,892
12,828
13,131
12,959
13,025
12,708
12,962
13,282
13,123
12,991
13,097
13,082
12,974
12,982
13,103
13,200
13,044
1 December 1 previous year through November 30. Sum of months may not add to total due to rounding.
Sheep and Goats
Sheep and lambs: Number on farms by class, January 1, 2011-2015
Class 2011 2012 2013 2014 2015
1,000 Head 1,000 Head 1,000 Head 1,000 Head 1,000 Head
Breeding sheep 1 year and older
Ewes
Rams
Replacement lambs
Total market sheep and lambs
All sheep and lambs
44
3
11
16
74
43
3
12
21
79
43
3
13
23
82
43
3
13
22
81
40
3
12
21
76
Sheep and lambs: Lamb
crop, 2010-2014
Year Breeding
ewes 1
Lambs per
100 ewes 1
Lamb
crop
1,000 Head Number 1,000 Head
2010
2011
2012
2013
2014
46
44
43
43
43
130
145
151
147
140
60
64
65
63
60
1 Ewes 1 year and older January 1.
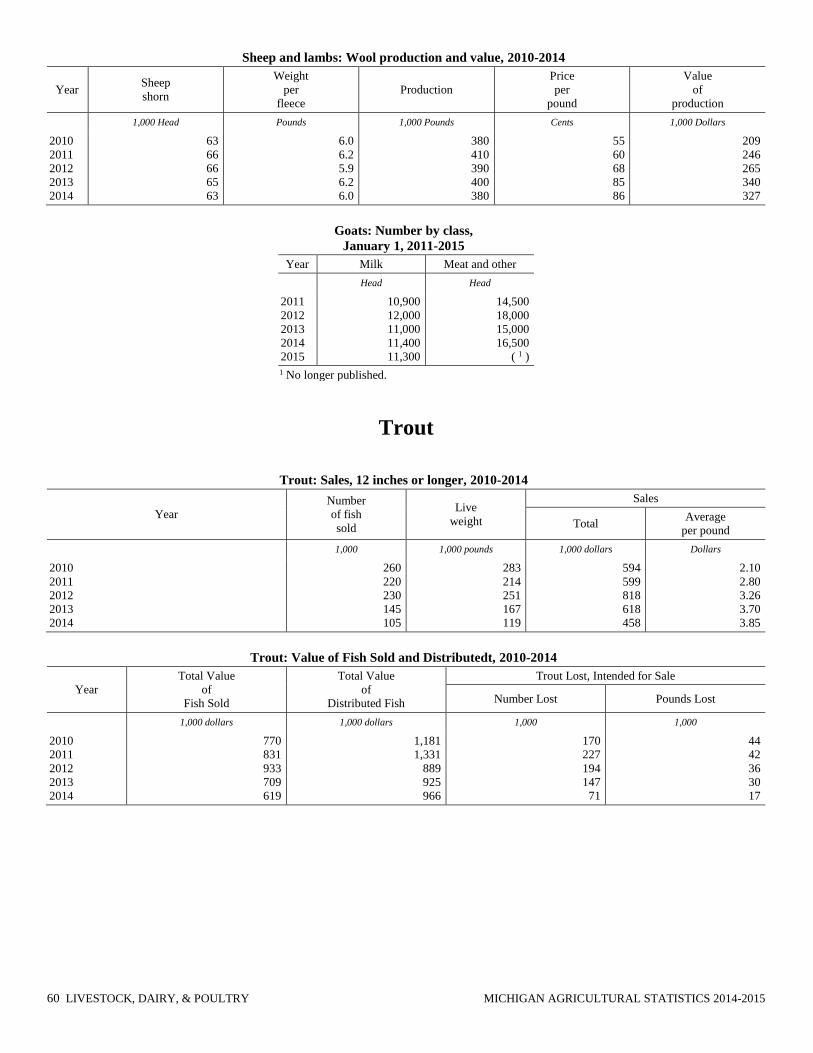
60 LIVESTOCK, DAIRY, & POULTRY MICHIGAN AGRICULTURAL STATISTICS 2014-2015
Sheep and lambs: Wool production and value, 2010-2014
Year Sheep
shorn
Weight
per
fleece
Production
Price
per
pound
Value
of
production
1,000 Head Pounds 1,000 Pounds Cents 1,000 Dollars
2010
2011
2012
2013
2014
63
66
66
65
63
6.0
6.2
5.9
6.2
6.0
380
410
390
400
380
55
60
68
85
86
209
246
265
340
327
Goats: Number by class,
January 1, 2011-2015
Year Milk Meat and other
Head Head
2011
2012
2013
2014
2015
10,900
12,000
11,000
11,400
11,300
14,500
18,000
15,000
16,500
( 1 )
1 No longer published.
Trout
Trout: Sales, 12 inches or longer, 2010-2014
Year
Number
of fish
sold
Live
weight
Sales
Total Average
per pound
1,000 1,000 pounds 1,000 dollars Dollars
2010
2011
2012
2013
2014
260
220
230
145
105
283
214
251
167
119
594
599
818
618
458
2.10
2.80
3.26
3.70
3.85
Trout: Value of Fish Sold and Distributedt, 2010-2014
Year
Total Value
of
Fish Sold
Total Value
of
Distributed Fish
Trout Lost, Intended for Sale
Number Lost Pounds Lost
1,000 dollars 1,000 dollars 1,000 1,000
2010
2011
2012
2013
2014
770
831
933
709
619
1,181
1,331
889
925
966
170
227
194
147
71
44
42
36
30
17

MICHIGAN AGRICULTURAL STATISTICS 2014-2015 COUNTY ESTIMATES 61
Agricultural Statistics Districts
The State is divided into nine Agricultural Statistics Districts to
make data comparison easier. An Agricultural Statistics District
is a contiguous group of counties having relatively similar
agricultural characteristics. Each district has within it more
homogeneous agriculture than the State as a whole. They are
numbered from north to south and west to east.

62 COUNTY ESTIMATES MICHIGAN AGRICULTURAL STATISTICS 2014-2015
Principal counties for field crops, 2014 1
Rank Corn for grain Dry beans Hay 2 Oats Soybeans Sugarbeets Wheat
1 Lenawee Huron Sanilac Presque Isle Lenawee Huron Huron
2 Saginaw Tuscola Osceola Sanilac Sanilac Sanilac Lenawee
3 Huron Sanilac Chippewa Grand Traverse Saginaw Tuscola Sanilac
4 Sanilac Montcalm Isabella Mecosta Shiawassee Saginaw Tuscola
5 Branch Arenac Lapeer Missaukee Monroe Bay Monroe
1 Based on total production. 2 Based on 2012 Census of Agriculture
Principal counties for livestock 1
Rank January 1, 2015
Cattle and Calves Hogs and pigs 2
January 1, 2015
Milk cows
1 Huron Allegan Huron
2 Sanilac Cass Clinton
3 Clinton Ionia Allegan
4 Allegan Mecosta Ionia
5 Ionia Gratiot Gratiot
1 Based on number of head. 2 Based on 2012 Census of Agriculture
Principal counties for fruits and vegetables, 2012 1
Rank Apples Blueberries Grapes Tart Cherries Asparagus Cucumbers Snap beans
1 Kent Van Buren Berrien Oceana Oceana Saginaw St. Joseph
2 Oceana Ottawa Van Buren Leelanau Mason Bay Cass
3 Ottawa Allegan Leelanau Antrim Van Buren Gratiot Kalamazoo
4 Berrien Muskegon Grand Traverse Grand Traverse Mecosta Allegan Branch
5 Van Buren Berrien Cass Mason Berrien Tuscola Mason
1 Based on acres from 2012 Census of Agriculture.

MICHIGAN AGRICULTURAL STATISTICS 2014-2015 COUNTY ESTIMATES 63
Corn: Acreage, yield, and production, by county, 2013-2014 1
County
and
district
2013 2014
Planted Harvested Yield Production Planted Harvested Yield Production
Acres Acres Bushels 1,000 Bu Acres Acres Bushels 1,000 Bu
Delta
Dickinson
Menominee
Other counties
Upper Peninsula
Antrim
Benzie
Charlevoix
Emmet
Grand Traverse
Kalkaska
Leelanau
Manistee
Missaukee
Wexford
Other counties
Northwest
Alcona
Alpena
Cheboygan
Iosco
Montmorency
Ogemaw
Presque Isle
Other counties
Northeast
Lake
Mason
Muskegon
Newaygo
Oceana
Other counties
West Central
Clare
Gladwin
Gratiot
Isabella
Mecosta
Midland
Montcalm
Osceola
Other counties
Central
Arenac
Bay
Huron
Saginaw
Sanilac
Tuscola
East Central
(D)
(D)
(D)
4,400
1,300
3,100
9,000
1,100
2,700
6,600
27,800
56,000
2,300
16,200
17,000
28,000
18,500
27,800
82,000
8,900
98,000
48,000
27,000
27,000
70,000
21,100
300,000
18,000
60,000
123,000
103,000
116,000
90,000
510,000
(D)
(D)
(D)
2,200
1,000
2,600
6,900
1,000
2,200
4,400
9,700
30,000
1,700
13,000
12,000
17,800
15,500
9,700
60,000
8,200
81,000
42,000
23,000
25,500
61,000
14,300
255,000
15,500
57,500
96,000
97,000
90,000
84,000
440,000
(D)
(D)
(D)
100.0
105.0
132.7
89.9
104.0
97.7
54.5
127.9
103.0
100.0
126.2
128.3
115.7
130.3
127.9
123.8
123.2
146.9
145.2
133.9
151.0
143.1
117.5
142.5
127.7
145.6
172.4
147.4
172.2
157.1
158.9
(D)
(D)
(D)
220
105
345
620
104
215
240
1,241
3,090
170
1,640
1,540
2,060
2,020
1,241
7,430
1,010
11,900
6,100
3,080
3,850
8,730
1,680
36,350
1,980
8,370
16,550
14,300
15,500
13,200
69,900
(D)
(D)
(D)
25,500
25,500
3,700
1,700
2,700
1,000
8,500
3,600
23,700
5,500
4,100
54,500
3,900
7,100
1,800
6,200
1,700
13,500
6,300
2,500
43,000
2,300
17,200
17,500
29,000
21,000
4,100
87,000
6,200
7,700
95,000
44,500
29,000
23,500
69,000
15,100
290,000
16,500
57,500
121,000
97,000
110,000
88,000
490,000
(D)
(D)
(D)
11,000
11,000
2,400
1,200
2,100
700
7,500
2,900
9,800
4,400
3,000
34,000
3,000
5,400
1,300
4,600
1,400
8,400
5,300
1,600
31,000
1,600
14,400
11,300
19,100
17,600
3,000
64,000
4,100
6,900
79,500
37,200
24,300
22,500
62,500
8,000
245,000
13,000
52,500
88,500
95,000
87,000
79,000
415,000
(D)
(D)
(D)
88.2
88.2
135.4
118.3
115.2
132.9
86.7
129.3
139.8
105.7
76.0
114.4
109.3
114.1
138.5
128.0
121.4
126.2
140.8
113.1
124.8
125.0
127.1
132.7
119.4
123.3
76.0
124.7
136.6
158.0
153.5
148.1
134.6
168.9
149.3
130.0
150.2
155.4
164.4
172.3
171.6
171.3
178.5
171.6
(D)
(D)
(D)
970
970
325
142
242
93
650
375
1,370
465
228
3,890
328
616
180
589
170
1,060
746
181
3,870
200
1,830
1,500
2,280
2,170
228
7,980
560
1,090
12,200
5,510
3,270
3,800
9,330
1,040
36,800
2,020
8,630
15,250
16,300
14,900
14,100
71,200
See footnote(s) at end of table. --continued

64 COUNTY ESTIMATES MICHIGAN AGRICULTURAL STATISTICS 2014-2015
Corn: Acreage, yield, and production, by county, 2013-2014 1 (continued)
County
and
district
2013 2014
Planted Harvested Yield Production Planted Harvested Yield Production
Acres Acres Bushels 1,000 Bu Acres Acres Bushels 1,000 Bu
Allegan
Berrien
Cass
Kalamazoo
Kent
Ottawa
Van Buren
Southwest
Barry
Branch
Calhoun
Clinton
Eaton
Hillsdale
Ingham
Ionia
Jackson
St Joseph
Shiawassee
South Central
Genesee
Lapeer
Lenawee
Livingston
Macomb
Monroe
Oakland
St Clair
Washtenaw
Wayne
Southeast Other districts
Michigan
78,000
49,000
80,000
61,000
45,000
47,000
50,000
410,000
48,000
90,000
85,000
76,000
63,000
73,000
56,000
85,000
62,000
99,000
63,000
800,000
32,000
39,000
110,000
22,000
13,500
66,000
3,200
37,000
45,000
2,300
370,000
72,000
2,600,000
60,000
48,000
79,000
52,000
38,000
32,000
46,000
355,000
40,000
85,000
78,000
56,000
60,000
67,000
52,000
69,000
55,000
93,000
55,000
710,000
30,500
34,500
97,500
20,500
12,000
62,500
3,000
33,000
39,500
2,000
335,000
45,000
2,230,000
156.7
151.5
160.8
178.8
154.2
145.9
156.5
158.9
165.0
164.1
155.8
140.2
170.8
168.7
161.5
163.0
156.4
157.0
155.5
159.9
141.3
150.7
181.5
153.2
152.5
152.8
153.3
151.5
155.7
130.0
160.0
119.6
155.0
9,400
7,270
12,700
9,300
5,860
4,670
7,200
56,400
6,600
13,950
12,150
7,850
10,250
11,300
8,400
11,250
8,600
14,600
8,550
113,500
4,310
5,200
17,700
3,140
1,830
9,550
460
5,000
6,150
260
53,600
5,380
345,650
49,000
85,000
64,000
45,000
46,000
420,000
43,000
92,000
82,000
77,000
59,000
77,000
57,000
87,000
59,000
96,000
56,000
785,000
29,000
37,000
109,000
22,500
12,500
64,000
2,900
33,000
43,000
2,100
355,000
2,550,000
47,900
83,700
60,400
37,000
30,200
385,000
32,000
88,500
76,000
58,500
57,500
70,000
51,500
70,000
54,500
91,000
50,500
700,000
27,300
33,000
95,000
20,300
10,800
63,000
2,800
31,300
39,500
2,000
325,000
2,210,000
176.4
172.0
188.7
146.8
152.3
167.0
151.6
167.2
158.6
163.4
176.5
155.0
175.9
161.4
155.6
152.7
156.4
161.3
142.5
149.1
174.7
171.4
160.2
175.4
139.3
151.4
172.2
150.0
165.8
161.0
8,450
14,400
11,400
5,430
4,600
64,300
4,850
14,800
12,050
9,560
10,150
10,850
9,060
11,300
8,480
13,900
7,900
112,900
3,890
4,920
16,600
3,480
1,730
11,050
390
4,740
6,800
300
53,900
355,810
(D) Withheld to avoid disclosing data for individual operations. 1 Counties not listed are not published due to insufficient data or to avoid disclosure of individual operations.

MICHIGAN AGRICULTURAL STATISTICS 2014-2015 COUNTY ESTIMATES 65
Dry edible beans, all: Acreage, yield, and production, by county, 2013-2014 1
County
and
district
2013 2014
Planted Harvested Yield Production Planted Harvested Yield Production
Acres Acres Pounds 1,000 cwt Acres Acres Pounds 1,000 cwt
Alpena
Other counties
Northeast
Gladwin
Gratiot
Midland
Montcalm
Other counties
Central
Arenac
Bay
Huron
Saginaw
Sanilac
Tuscola
Other counties
East Central
Southwest
Shiawassee
Other counties
South Central
Lapeer
Other counties
Southeast
Other districts
Michigan
2,100
4,600
6,700
1,800
3,800
2,600
7,000
4,400
19,600
4,000
(D)
62,200
21,200
30,200
22,400
140,000
2,200
2,600
2,600
1,000
1,000
2,000
1,900
175,000
2,070
4,530
6,600
1,800
3,740
2,570
6,950
4,340
19,400
3,650
(D)
61,600
20,800
29,700
22,350
138,100
2,150
2,150
2,150
990
960
1,950
1,650
172,000
1,060
1,370
1,270
1,810
1,390
1,710
1,700
1,670
1,640
1,420
(D)
2,060
2,080
1,960
1,780
1,980
2,030
1,590
1,590
1,750
1,760
1,750
1,270
1,900
22,000
62,100
84,100
32,600
51,900
43,900
118,000
72,600
319,000
52,000
(D)
1,269,000
433,000
582,000
398,000
2,734,000
43,700
34,100
34,100
17,300
16,900
34,200
20,900
3,270,000
(D)
(D)
(D)
1,800
6,400
(D)
10,000
6,100
28,900
6,500
23,100
85,000
8,300
30,000
46,100
(D)
199,000
(D)
800
2,200
3,000
2,100
1,900
4,000
13,800
230,000
(D)
(D)
(D)
1,800
6,050
(D)
9,230
6,090
27,700
6,200
22,800
84,400
8,200
29,800
45,800
(D)
197,200
(D)
760
2,040
2,800
2,100
1,900
4,000
12,530
226,000
(D)
(D)
(D)
1,290
1,390
(D)
1,430
1,640
1,500
1,710
2,200
2,100
2,200
1,740
2,110
(D)
2,050
(D)
2,050
1,420
1,590
1,200
1,160
1,190
1,440
1,940
(D)
(D)
(D)
23,300
83,800
(D)
132,000
99,700
415,000
106,000
502,000
1,775,000
180,000
520,000
967,000
(D)
4,050,000
(D)
15,600
28,900
44,500
25,300
22,100
47,400
181,000
4,375,000
(D) Withheld to avoid disclosing data for individual operations.
(D) Withheld to avoid disclosing data for individual farms 1 Counties not listed are not published due to insufficient data or to avoid disclosure of individual operations.

66 COUNTY ESTIMATES MICHIGAN AGRICULTURAL STATISTICS 2014-2015
Oats: Acreage, yield, and production, by county, 2013-2014 1
County
and
district
2013 2014
Planted Harvested Yield Production Planted Harvested Yield Production
Acres Acres Bushels 1,000 Bu Acres Acres Bushels 1,000 Bu
Chippewa
Delta
Dickinson
Mackinac
Marquette
Other counties
Upper Peninsula
Charlevoix
Grand Traverse
Missaukee
Wexford
Other counties
Northwest
Alpena
Iosco
Ogemaw
Presque Isle
Other counties
Northeast
Mason
Newaygo
Other counties
West Central
Clare
Gladwin
Isabella
Mecosta
Montcalm
Osceola
Other counties
Central
1,300
500
4,700
6,500
1,100
3,400
4,500
1,200
1,200
4,800
7,200
1,000
1,400
8,900
700
1,300
13,300
850
430
3,120
4,400
880
2,520
3,400
910
550
3,540
5,000
800
910
1,360
500
830
4,400
63.3
81.2
61.0
63.4
44.9
51.8
50.0
52.1
55.5
59.1
57.4
51.6
34.6
51.9
69.0
67.6
53.2
53.8
34.9
190.3
279.0
39.5
130.5
170.0
47.4
30.5
209.1
287.0
41.3
31.5
70.6
34.5
56.1
234.0
1,000
700
600
6,300
8,600
500
1,900
1,300
600
1,700
6,000
1,300
700
2,100
2,600
2,200
8,900
1,200
800
1,000
3,000
600
600
1,300
1,600
10,200
14,300
680
440
530
5,150
6,800
460
1,630
1,180
570
1,360
5,200
550
580
1,160
2,550
1,560
6,400
960
570
970
2,500
420
460
1,010
1,360
7,750
11,000
69.1
54.8
53.0
60.2
60.1
60.7
70.6
69.2
67.2
47.1
62.9
65.3
84.1
65.7
72.5
62.2
69.2
65.3
74.9
66.6
68.0
74.3
65.2
66.5
69.8
71.8
70.9
47.0
24.1
28.1
309.8
409.0
27.9
115.0
81.7
38.3
64.1
327.0
35.9
48.8
76.2
185.0
97.1
443.0
62.7
42.7
64.6
170.0
31.2
30.0
67.2
94.9
556.7
780.0
See footnote(s) at end of table. --continued

MICHIGAN AGRICULTURAL STATISTICS 2014-2015 COUNTY ESTIMATES 67
Oats: Acreage, yield, and production, by county, 2013-2014 1 (continued)
County
and
district
2013 2014
Planted Harvested Yield Production Planted Harvested Yield Production
Acres Acres Bushels 1,000 Bu Acres Acres Bushels 1,000 Bu
Arenac
Bay
Huron
Sanilac
Tuscola
Other counties
East Central
Kent
Other counties
Southwest
Hillsdale
Jackson
Shiawassee
Other counties
South Central
Lapeer
Washtenaw
Other counties
Southeast
Other districts
Michigan
500
1,700
500
1,700
4,400
600
800
4,200
5,600
500
900
1,600
3,000
5,500
50,000
400
1,140
340
1,320
3,200
420
540
2,940
3,900
230
640
1,130
2,000
3,700
30,000
61.5
91.2
71.8
84.1
82.5
58.1
70.6
69.6
68.5
64.3
73.4
62.1
66.0
61.4
62.0
24.6
104.0
24.4
111.0
264.0
24.4
38.1
204.5
267.0
14.8
47.0
70.2
132.0
227.0
1,860.0
1,000
500
1,000
2,000
600
5,100
600
900
1,500
1,000
3,900
4,900
500
2,200
2,700
55,000
380
290
270
1,240
520
2,700
590
610
1,200
360
2,440
2,800
440
960
1,400
40,000
63.2
82.1
99.6
94.4
79.4
86.3
64.6
60.5
62.5
91.7
75.8
77.9
71.8
76.5
75.0
69.0
24.0
23.8
26.9
117.0
41.3
233.0
38.1
36.9
75.0
33.0
185.0
218.0
31.6
73.4
105.0
2,760.0
1 Counties not listed are not published due to insufficient data or to avoid disclosure of individual operations.

68 COUNTY ESTIMATES MICHIGAN AGRICULTURAL STATISTICS 2014-2015
Soybeans: Acreage, yield, and production, by county, 2013-2014 1
County
and
district
2013 2014
Planted Harvested Yield Production Planted Harvested Yield Production
Acres Acres Bushels 1,000 Bu Acres Acres Bushels 1,000 Bu
Iosco
Montmorency
Ogemaw
Otsego
Presque Isle
Other counties
Northeast
Mason
Muskegon
Newaygo
Clare
Gladwin
Gratiot
Isabella
Mecosta
Midland
Montcalm
Osceola
Arenac
Bay
Huron
Saginaw
Sanilac
Tuscola
Allegan
Berrien
Cass
Kalamazoo
Kent
Ottawa
Van Buren
Barry
Branch
Calhoun
Clinton
Eaton
Hillsdale
Ingham
Ionia
Jackson
St Joseph
Shiawassee
4,900
6,700
5,000
6,600
78,300
46,600
23,800
22,900
1,900
17,500
42,500
55,500
100,500
120,000
69,000
36,500
39,000
40,300
25,400
21,700
21,700
20,400
28,500
68,700
71,900
63,800
73,500
74,400
51,600
60,500
40,200
45,500
78,400
4,800
6,600
4,850
6,350
77,100
46,400
23,700
22,700
1,850
17,300
42,200
55,000
100,300
119,000
68,700
36,400
38,900
40,200
25,400
21,600
21,700
20,300
28,400
68,700
71,900
63,800
73,100
74,400
51,500
60,300
40,200
45,300
78,400
38.8
39.2
39.6
39.1
41.6
41.0
40.2
34.7
36.2
36.7
42.9
47.5
43.7
45.7
44.1
43.3
41.3
41.8
50.3
43.3
38.9
41.2
50.0
45.5
49.2
41.5
48.7
47.4
48.2
47.3
46.1
45.8
42.9
186
259
192
248
3,210
1,901
953
788
67
635
1,812
2,612
4,381
5,442
3,028
1,577
1,606
1,681
1,277
935
844
836
1,421
3,123
3,534
2,650
3,559
3,524
2,480
2,851
1,852
2,077
3,361
3,300
2,500
2,400
600
9,000
9,200
27,000
7,200
7,300
6,700
5,100
8,600
80,300
58,900
5,000
25,000
25,300
2,300
64,500
122,000
147,500
85,700
32,000
41,400
47,200
39,200
26,500
21,000
22,200
34,800
74,600
70,800
67,700
70,500
77,600
47,700
63,400
46,500
54,000
92,400
3,230
2,490
2,390
560
8,800
9,130
26,600
7,130
7,290
6,590
5,090
8,460
80,200
58,800
4,960
24,900
25,300
2,290
64,300
121,500
147,000
84,900
31,900
41,300
47,100
39,100
26,400
20,900
21,800
34,600
74,400
70,600
67,500
70,300
77,400
47,600
63,200
46,400
53,800
92,200
32.2
25.1
32.1
24.8
37.0
26.2
30.9
33.9
39.9
32.3
36.9
40.3
42.4
40.9
34.7
45.8
36.0
29.7
39.0
43.7
41.4
42.5
42.8
42.9
52.0
47.2
41.1
46.0
41.1
43.1
42.6
39.4
44.9
45.1
39.3
49.7
45.2
41.6
45.9
45.6
104
62
77
14
326
239
822
242
291
213
188
341
3,404
2,404
172
1,140
911
68
2,505
5,315
6,082
3,611
1,364
1,772
2,447
1,846
1,085
962
896
1,490
3,172
2,783
3,033
3,171
3,044
2,364
2,858
1,929
2,472
4,205
See footnote(s) at end of table. --continued

MICHIGAN AGRICULTURAL STATISTICS 2014-2015 COUNTY ESTIMATES 69
Soybeans: Acreage, yield, and production, by county, 2013-2014 1 (continued)
County
and
district
2013 2014
Planted Harvested Yield Production Planted Harvested Yield Production
Acres Acres Bushels 1,000 Bu Acres Acres Bushels 1,000 Bu
Genesee
Lapeer
Lenawee
Livingston
Macomb
Monroe
Oakland
St Clair
Washtenaw
Wayne
Southeast
Other districts
Michigan
45,000
39,200
109,000
17,800
21,500
72,000
4,000
60,800
45,700
4,000
419,000
34,800
1,930,000
44,900
39,100
108,900
17,800
20,600
71,900
3,900
60,400
45,600
3,900
417,000
33,400
1,920,000
41.1
41.3
51.6
44.7
40.3
48.2
46.2
41.2
47.4
40.8
46.0
27.8
44.5
1,847
1,616
5,624
796
830
3,469
180
2,490
2,163
159
19,174
929
85,440
52,800
43,500
126,000
19,100
22,100
81,700
3,100
61,400
46,200
3,600
459,500
2,050,000
52,600
43,400
125,600
19,000
21,800
80,800
3,000
61,200
46,100
3,500
457,000
2,040,000
37.0
36.4
48.7
44.2
40.4
48.8
40.3
39.6
44.8
36.9
43.9
42.5
1,945
1,580
6,115
840
880
3,942
121
2,424
2,064
129
20,040
86,700
1 Counties not listed are not published due to insufficient data or to avoid disclosure of individual operations.

70 COUNTY ESTIMATES MICHIGAN AGRICULTURAL STATISTICS 2014-2015
Sugarbeets: Acreage, yield, and production, by county, 2013-2014 1
County
and
district
2013 2014
Planted Harvested Yield Production Planted Harvested Yield Production
Acres Acres Tons 1,000 Tons Acres Acres Tons 1,000 Tons
Other counties
Northeast
Gladwin
Gratiot
Isabella
Midland
Montcalm
Other counties
Central
Arenac
Bay
Huron
Saginaw
Sanilac
Tuscola
East Central
Shiawassee
Other counties
South Central
Genesee
Lapeer
St Clair
Other counties
Southeast
Other districts
Michigan
500
500
700
9,800
900
2,900
800
200
15,300
2,900
14,100
51,300
15,400
28,000
20,300
132,000
1,700
1,300
3,000
300
1,400
1,500
-
3,200
-
154,000
500
500
700
9,800
900
2,800
700
100
15,000
2,700
14,000
51,300
15,300
27,900
20,300
131,500
1,600
1,300
2,900
300
1,400
1,400
-
3,100
-
153,000
21.8
21.8
18.4
21.1
24.7
21.8
25.9
7.0
21.5
20.0
23.6
27.8
24.7
29.6
25.7
26.9
24.3
21.4
23.0
17.0
25.7
24.5
-
24.3
-
26.2
10.9
10.9
12.9
207.0
22.2
61.1
18.1
0.7
322.0
54.0
330.0
1,425.0
378.0
825.0
522.0
3,534.0
38.9
27.8
66.7
5.1
36.0
34.3
-
75.4
-
4,009.0
(D)
(D)
9,900
3,000
800
1,600
15,300
2,600
13,700
48,900
15,700
28,300
20,300
129,500
(D)
(D)
(D)
(D)
(D)
1,300
1,600
2,900
3,300
151,000
(D)
(D)
9,900
3,000
800
1,600
15,300
2,500
13,500
48,800
15,700
28,300
19,700
128,500
(D)
(D)
(D)
(D)
(D)
1,300
1,600
2,900
3,300
150,000
(D)
(D)
23.2
24.4
23.6
20.6
23.2
24.8
28.0
29.9
30.3
30.8
32.6
30.3
(D)
(D)
(D)
(D)
(D)
25.9
24.7
25.2
23.0
29.3
(D)
(D)
230.0
73.1
18.9
33.0
355.0
62.0
378.0
1,461.0
475.0
873.0
642.0
3,891.0
(D)
(D)
(D)
(D)
(D)
33.7
39.5
73.2
75.8
4,395.0
- Represents zero.
(D) Withheld to avoid disclosing data for individual operations.
(D) Withheld to avoid disclosing data for individual farms. 1 Counties not listed are not published due to insufficient data or to avoid disclosure of individual operations.

MICHIGAN AGRICULTURAL STATISTICS 2014-2015 COUNTY ESTIMATES 71
Wheat: Acreage, yield, and production, by county, 2013-2014 1
County
and
district
2013 2014
Planted Harvested Yield Production Planted Harvested Yield Production
Acres Acres Bushels 1,000 Bu Acres Acres Bushels 1,000 Bu
Alpena
Ogemaw
Otsego
Presque Isle
Other counties
Northeast
Mason
Muskegon
Newaygo
Oceana
Other counties
West Central
Clare
Gratiot
Isabella
Mecosta
Midland
Montcalm
Osceola
Other counties
Central
4,300
3,300
1,000
5,200
4,100
17,900
4,400
2,300
5,200
11,900
1,800
23,200
21,000
2,600
13,600
9,700
71,900
3,900
3,180
950
5,000
3,470
16,500
4,200
1,700
2,800
8,700
1,750
21,300
20,500
2,550
13,500
9,100
68,700
44.4
72.6
51.6
50.4
58.2
55.0
64.3
55.0
67.7
63.6
56.0
77.7
69.0
41.6
65.0
66.6
69.2
173.0
231.0
49.0
252.0
202.0
907.0
270.0
93.5
189.5
553.0
98.0
1,656.0
1,414.0
106.0
877.0
606.0
4,757.0
5,200
2,200
3,800
6,000
17,200
3,900
2,900
1,900
1,800
10,500
1,500
21,200
15,300
2,400
3,900
1,000
15,200
60,500
4,700
2,120
3,380
4,500
14,700
3,500
2,290
1,700
1,210
8,700
1,380
18,900
13,200
2,030
3,280
1,000
14,310
54,100
48.1
70.8
52.1
56.0
54.7
49.1
39.8
59.4
64.4
50.8
61.4
79.5
70.8
40.0
68.9
67.9
61.5
69.8
226.0
150.0
176.0
252.0
804.0
172.0
91.1
101.0
77.9
442.0
84.8
1,503.0
935.0
81.3
226.0
67.9
880.0
3,778.0
See footnote(s) at end of table. --continued

72 COUNTY ESTIMATES MICHIGAN AGRICULTURAL STATISTICS 2014-2015
Wheat: Acreage, yield, and production, by county, 2013-2014 1 (continued)
County
and
district
2013 2014
Planted Harvested Yield Production Planted Harvested Yield Production
Acres Acres Bushels 1,000 Bu Acres Acres Bushels 1,000 Bu
Arenac
Bay
Huron
Saginaw
Sanilac
Tuscola
East Central
Allegan
Berrien
Cass
Kalamazoo
Kent
Ottawa
Other counties
Southwest
Barry
Branch
Calhoun
Clinton
Eaton
Hillsdale
Ingham
Ionia
Jackson
St Joseph
Shiawassee
South Central
Genesee
Lapeer
Lenawee
Livingston
Macomb
Monroe
St Clair
Washtenaw
Other counties
Southeast
Michigan
8,000
15,800
60,600
22,600
58,000
36,000
201,000
6,800
2,300
3,200
6,300
5,400
6,500
30,500
6,300
5,100
8,900
23,000
18,500
15,900
17,200
15,000
9,000
3,600
27,500
150,000
8,100
9,100
41,200
7,500
2,900
27,200
13,100
17,200
1,700
128,000
620,000
6,500
15,300
57,400
21,700
57,500
35,600
194,000
6,700
2,200
2,900
6,100
5,300
4,300
27,500
6,200
4,900
8,500
22,100
18,000
15,400
17,100
14,000
8,700
2,500
26,100
143,500
7,800
9,000
40,700
7,400
2,800
25,200
12,700
16,400
1,500
123,500
590,000
70.9
76.2
92.7
78.5
77.4
82.8
82.7
68.5
63.2
53.4
68.9
67.5
57.7
64.7
71.9
53.3
59.4
82.6
72.4
73.9
83.9
78.9
64.0
64.0
70.2
73.7
64.6
68.9
86.1
55.7
70.7
79.8
73.8
63.6
62.7
75.5
75.0
461.0
1,166.0
5,323.0
1,704.0
4,450.0
2,948.0
16,052.0
459.0
139.0
155.0
420.0
358.0
248.0
1,779.0
446.0
261.0
505.0
1,826.0
1,304.0
1,138.0
1,434.0
1,105.0
557.0
160.0
1,833.0
10,569.0
504.0
620.0
3,505.0
412.0
198.0
2,010.0
937.0
1,043.0
94.0
9,323.0
44,250.0
7,000
13,000
59,000
22,300
47,500
31,200
180,000
6,500
2,100
3,000
5,200
4,500
9,300
30,600
6,300
3,800
5,900
19,800
15,900
12,800
16,500
12,400
7,300
3,400
27,400
131,500
6,900
6,800
36,100
6,500
3,100
24,700
10,300
15,600
1,500
111,500
550,000
6,200
11,900
48,100
19,200
33,700
26,100
145,200
6,100
1,800
2,000
4,800
4,000
1,400
20,100
6,000
3,600
5,680
17,900
15,300
12,200
15,300
12,100
6,800
2,820
20,500
118,200
5,600
6,300
32,300
6,280
2,800
23,800
9,200
14,800
1,320
102,400
470,000
73.1
74.6
90.4
74.9
72.1
79.8
80.2
69.7
67.2
59.5
68.3
67.8
64.3
67.4
79.7
61.4
57.7
81.8
77.6
71.8
83.0
77.9
62.9
67.4
61.0
73.1
62.0
62.1
84.8
69.1
54.3
78.2
71.4
78.6
52.3
76.3
74.0
453.0
888.0
4,350.0
1,438.0
2,431.0
2,082.0
11,642.0
425.0
121.0
119.0
328.0
271.0
90.0
1,354.0
478.0
221.0
328.0
1,465.0
1,188.0
876.0
1,270.0
942.0
428.0
190.0
1,250.0
8,636.0
347.0
391.0
2,739.0
434.0
152.0
1,861.0
657.0
1,163.0
69.0
7,813.0
34,780.0
1 Counties not listed are not published due to insufficient data or to avoid disclosure of individual operations.

MICHIGAN AGRICULTURAL STATISTICS 2014-2015 COUNTY ESTIMATES 73
Cropland and Pasture Cash Rents 2013-2014
County
and district
2013 2014
Non-irrigated Irrigated Pasture Non-irrigated Irrigated Pasture
Dollars per acre Dollars per acre Dollars per acre Dollars per acre Dollars per acre Dollars per acre
Chippewa
Delta
Menominee
Ontonagon
Other counties
Upper Peninsula
Antrim
Charlevoix
Emmet
Grand Traverse
Leelanau
Manistee
Missaukee
Wexford
Other counties
Northwest
Alcona
Alpena
Cheboygan
Iosco
Ogemaw
Otsego
Presque Isle
Other counties
Northeast
Mason
Newaygo
Oceana
Other counties
West Central
Clare
Gladwin
Gratiot
Isabella
Mecosta
Midland
Montcalm
Osceola
Central
24.00
24.00
24.50
22.50
23.50
23.00
20.50
37.50
61.50
60.00
35.00
45.00
17.00
24.00
26.00
29.00
34.50
28.50
31.00
23.50
27.00
55.00
67.00
64.00
83.50
66.50
58.50
86.00
131.00
86.50
50.00
129.00
84.50
43.50
94.50
179.00
173.00
18.00
28.00
24.00
29.00
25.00
24.00
22.00
37.00
20.50
35.00
55.00
29.00
59.00
42.50
28.50
44.00
19.50
31.00
25.00
29.50
37.50
36.50
30.00
31.00
58.50
66.00
67.00
85.00
69.50
56.00
105.00
130.00
85.50
47.00
105.00
83.00
45.00
91.00
80.00
80.00
125.00
125.00
178.00

74 COUNTY ESTIMATES MICHIGAN AGRICULTURAL STATISTICS 2014-2015
Cropland and Pasture Cash Rents 2013-2014
County
and district
2013 2014
Non-irrigated Irrigated Pasture Non-irrigated Irrigated Pasture
Dollars per acre Dollars per acre Dollars per acre Dollars per acre Dollars per acre Dollars per acre
Arenac
Bay
Huron
Saginaw
Sanilac
Tuscola
East Central
Allegan
Berrien
Cass
Kalamazoo
Kent
Ottawa
Van Buren
Other counties
Southwest
Barry
Branch
Calhoun
Clinton
Eaton
Hillsdale
Ingham
Ionia
Jackson
St Joseph
Shiawassee
Other counties
South Central
Genesee
Lapeer
Lenawee
Livingston
Macomb
Monroe
Oakland
St Clair
Washtenaw
Other counties
Southeast
Other Districts
Michigan
87.50
116.00
176.00
161.00
145.00
189.00
156.00
120.00
110.00
115.00
103.00
128.00
100.00
130.00
116.00
90.50
91.00
112.00
116.00
100.00
109.00
103.00
131.00
78.00
105.00
91.50
103.00
79.00
67.50
152.00
73.50
65.00
125.00
61.50
70.00
66.50
103.00
110.00
260.00
302.00
276.00
205.00
238.00
206.00
198.00
246.00
163.00
213.00
284.00
168.00
258.00
110.00
174.00
166.00
153.00
220.00
40.50
31.00
34.50
32.50
23.50
25.00
34.00
33.50
22.50
26.00
85.00
132.00
188.00
152.00
119.00
182.00
155.00
125.00
133.00
109.00
94.50
127.00
117.00
118.00
118.00
110.00
110.00
110.00
131.00
104.00
141.00
115.00
130.00
86.00
115.00
90.00
115.00
78.00
76.00
166.00
69.00
132.00
44.00
76.00
68.00
75.50
110.00
115.00
240.00
203.00
254.00
225.00
290.00
280.00
194.00
192.00
239.00
205.00
215.00
286.00
200.00
261.00
168.00
168.00
70.50
225.00
29.00
40.00
42.00
36.00
29.00
40.00
38.00
32.00
35.00
40.00
30.00
32.50
33.00
30.00
30.00
(D) Withheld to avoid disclosing data for individual farms. County rates for unpublished counties are included in 'other counties' or 'other district'
total.

MICHIGAN AGRICULTURAL STATISTICS 2014-2015 COUNTY ESTIMATES 75
Cattle: January 1, by county, 2014-2015
County All cattle and calves Milk cows
County All cattle and calves Milk cows
2014 2015 2014 2015 2014 2015 2014 2015
Head Head Head Head Head Head Head Head
Alcona
Alger
Allegan
Alpena
Antrim
Arenac
Baraga
Barry
Bay
Benzie
Berrien
Branch
Calhoun
Cass
Charlevoix
Cheboygan
Chippewa
Clare
Clinton
Crawford
Delta
Dickinson
Eaton
Emmet
Genesee
Gladwin
Gogebic
Grand Traverse
Gratiot
Hillsdale
Houghton
Huron
Ingham
Ionia
Iosco
Iron
Isabella
Jackson
Kalamazoo
Kalkaska
Kent
Keweenaw
Lake
Lapeer
Leelanau
Lenawee
Livingston
Luce
Mackinac
Macomb
5,400
2,000
48,000
10,000
4,000
7,300
(D)
29,000
5,500
1,400
4,400
12,500
13,600
5,200
3,200
6,300
7,000
11,000
50,000
(D)
8,300
2,300
9,700
4,400
6,900
6,000
(D)
3,300
46,000
24,000
1,300
130,000
17,200
50,000
8,500
1,200
27,500
17,500
11,700
1,000
32,000
(D)
2,000
17,000
2,500
32,000
9,300
(D)
2,400
4,000
5,000
2,000
49,000
9,500
4,300
7,700
(D)
30,000
5,300
1,100
4,400
12,400
14,000
4,600
3,200
5,800
6,600
10,000
53,000
(D)
7,500
2,500
10,000
4,000
6,500
6,100
(D)
3,000
48,000
27,000
1,500
140,000
16,000
49,000
8,000
1,200
27,000
16,000
12,000
800
30,000
(D)
2,000
16,500
2,200
35,000
8,000
(D)
2,700
4,500
1,500
500
20,500
3,400
(D)
3,200
(D)
14,600
1,900
1,400
3,700
4,400
500
700
1,000
1,100
2,600
26,000
1,900
600
2,000
500
1,400
1,300
(D)
200
14,800
9,000
400
36,000
6,200
17,600
2,100
8,000
4,000
5,400
(D)
9,500
(D)
3,700
300
11,400
2,000
900
700
1,400
400
21,000
3,400
(D)
3,500
(D)
15,000
1,800
1,200
3,800
4,600
500
800
800
1,000
2,700
28,000
1,800
500
2,200
400
1,400
1,100
200
16,000
11,500
400
41,000
6,000
19,000
2,100
7,800
3,900
5,800
(D)
9,400
(D)
3,500
200
13,500
2,000
800
700
Manistee
Marquette
Mason
Mecosta
Menominee
Midland
Missaukee
Monroe
Montcalm
Montmorency
Muskegon
Newaygo
Oakland
Oceana
Ogemaw
Ontonagon
Osceola
Oscoda
Otsego
Ottawa
Presque Isle
Roscommon
Saginaw
Sanilac
Schoolcraft
Shiawassee
Tuscola
Van Buren
Washtenaw
Wayne
Wexford
Other counties
Michigan
2,300
2,100
9,500
15,000
20,000
7,500
30,500
4,000
27,500
2,700
16,000
25,500
(D)
8,000
16,000
2,100
19,500
3,600
2,000
43,000
5,300
(D)
9,700
64,000
(D)
17,200
20,000
11,500
11,000
(D)
3,200
4,600
1,130,000
2,000
1,700
9,700
15,200
19,000
7,200
31,000
3,800
27,000
2,500
15,000
26,500
(D)
8,200
16,500
2,000
19,600
3,700
1,500
42,000
5,300
(D)
9,000
66,000
(D)
17,700
21,000
12,000
10,300
(D)
3,400
4,600
1,120,000
(D)
(D)
2,500
5,000
7,400
(D)
14,700
500
10,500
600
6,500
14,300
(D)
3,000
6,300
(D)
6,500
1,000
(D)
13,300
1,500
2,700
24,000
(D)
5,500
5,500
5,500
2,900
(D)
800
7,100
381,000
(D)
(D)
2,700
5,100
7,200
(D)
16,000
600
10,700
600
6,800
14,300
(D)
3,000
6,800
(D)
6,800
1,100
(D)
14,500
1,400
2,800
26,500
(D)
6,000
5,800
5,700
2,800
(D)
900
6,700
403,000
(D) Withheld to avoid disclosing data for individual operations.
(D) Withheld to avoid disclosing data for individual farms. County inventories for unpublished counties are included in 'other counties' total.

76 APPENDIX A MICHIGAN AGRICULTURAL STATISTICS 2014-2015
Useful Agriculture Internet Sites
State and Federal Agencies
AMS-Agricultural Marketing Service www.ams.usda.gov/AMSv1.0
APHIS-Animal and Plant Health Inspection Service www.aphis.usda.gov
ERS-Economic Research Service www.ers.usda.gov
FSA-Farm Service Agency www.fsa.usda.gov
MDARD-Michigan Department of Agriculture & Rural Development www.michigan.gov/mdard
MSU Extension msue.anr.msu.edu
MSU AgBio Research www.agbioresearch.msu.edu
MSU College of Agriculture & Natural Resources www.canr.msu.edu
NASS-National Agricultural Statistics Service www.nass.usda.gov
NRCS-Natural Resources Conservation Service www.nrcs.usda.gov
RD-Rural Development www.rd.usda.gov
USDA-United States Department of Agriculture www.usda.gov
USDA, NASS, Michigan Field Office www.nass.usda.gov/mi
Commodity Groups
Apples-Michigan Apple Committee www.michiganapples.com
Asparagus-Michigan Asparagus Advisory Board www.asparagus.com
Blueberries-The Blueberry People www.blueberries.com
Cattle-Michigan Beef Industry Commission www.mibeef.org
Celery-Michigan Celery Promotion Co-operative, Inc. www.michigancelery.com
Cherries-Cherry Industry Administrative Board (CIAB) www.cherryboard.org
Cherries-Cherry Marketing Institute www.choosecherries.com
Christmas Trees-Michigan Christmas Tree Association www.mcta.org
Corn-Michigan Corn www.micorn.org
Dairy-Michigan Milk Producers Association (MMPA) www.mimilk.com
Dairy-United Dairy Industry of MI www.udim.org
Dry Beans-Michigan Bean Commission www.michiganbean.org
Dry Beans-Michigan Agri-Business Association (MABA) www.miagbiz.org
Equine-Michigan Equine Partnership www.miequine.com
Floriculture-Michigan Floral Association www.michiganfloral.org
Floriculture-Michigan Floriculture Growers Council www.mifgc.org
Grapes-Michigan Grape and Wine Industry Council www.michiganwines.com
Horses-Michigan Horse Council www.michiganhorsecouncil.com
Nursery-Michigan Nursery & Landscape Association (MNLA) www.mnla.org
Peaches-Michigan Peach Sponsors www.michiganpeach.org
Pork-National Pork Producers Council (NPPC) www.nppc.org
Potatoes-Michigan Potato Industry Commission www.mipotato.com
Soybeans-Michigan Soybean Promotion Committee (MSPC) www.michigansoybean.org
Turfgrass-Michigan Turfgrass Foundation (MTF) www.michiganturfgrass.org
Turkeys-Michigan Turkey Producers Co-op, Inc. www.miturkey.com
Other Related Sites
American Farm Bureau Federation www.fb.org
GreenStone Farm Credit Services www.greenstonefcs.com
Michigan Agri-Tourism Association www.michiganfarmfun.com
Michigan Food and Farming Systems-MIFFS www.miffs.org
Michigan Market Maker http://mi.marktemaker.uiuc.edu
MSU Agricultural Weather Office www.agweather.geo.msu.edu

MICHIGAN AGRICULTURAL STATISTICS 2014-2015 APPENDIX B 77
INTERNET ACCESS
Reports, data products, and services published by the USDA, NASS, Michigan Field Office, Michigan Department of Agriculture and
Rural Development, and National Agricultural Statistics Service of the United States Department of Agriculture are available on the
Worldwide Web. There is no charge for connecting to these Internet addresses:
USDA, NASS, Michigan Field Office
From the NASS home page, www.nass.usda.gov, click on the Statistics by State dropdown to access the Michigan Internet page.
On the Michigan Internet page, you will find up-to-date data such as Crop-Weather releases, News releases, Agriculture Across
Michigan, and county estimates.
National Agricultural Statistics Service (NASS)
NASS home page at: www.nass.usda.gov
You can access national releases, 2012 Census of Agriculture data, and home pages of NASS Field Offices including Michigan from
this web site. Michigan Crop Weather and national releases by free e-mail subscription are available from this site.
AUTOFAX ACCESS
NASS Fax service is available for some reports from your fax machine. Please call 202-720-2000, using the handset attached to your
fax. Respond to the voice prompts.
PRINTED REPORTS OR DATA PRODUCTS
CALL OUR TOLL-FREE ORDER DESK: 1-800-999-6779 (U.S. and Canada)
Other areas, please call l-703-605-6220 FAX: 1-703-605-6900
(Visa, MasterCard, check, or money order acceptable for payment).
ASSISTANCE
For assistance or questions regarding Michigan agriculture, call 1-800-453-7501. Further information about NASS or its products or
services can be obtained by contacting the Agricultural Statistics HOTLINE at 1-800-727-9540, 7:30 a.m. to 4:30 p.m. ET or e-mail:

USDA, NASS, Great Lakes Region, Michigan Field Office P.O. Box 30239 Lansing, MI 48909-7739
in cooperation with the Michigan Department of Agriculture
OFFICIAL BUSINESS
NASS FACT FINDERS FOR AGRICULTURE
United States Department of Agriculture
USDA, NASS
Michigan Field Office