Michigan 21st Century - Michigan State University
54
1 Van Egeren, L. A., Wu, H-C., Yang, N-K & Michigan 21 st CCLC State Evaluation Team. (2012). Michigan 21st Century Community Learning Centers Grantee Annual Data Tables. Michigan State University, East Lansing, MI. Michigan 21 st Century Community Learning Centers Annual Data Tables 2012-2013 GRANTEE REPORT Sample Grantee Grantee Sample Grantee
Transcript of Michigan 21st Century - Michigan State University

1
Van Egeren, L. A., Wu, H-C., Yang, N-K & Michigan 21st CCLC State Evaluation Team.
(2012). Michigan 21st Century Community Learning Centers Grantee Annual Data Tables.
Michigan State University, East Lansing, MI.
RMichigan 21st
Century
Community Learning Centers
Annual Data Tables 2012-2013 GRANTEE REPORT
Sample Grantee
Grantee Sample Grantee

2
Van Egeren, L. A., Wu, H-C., Yang, N-K & Michigan 21st CCLC State Evaluation Team.
(2012). Michigan 21st Century Community Learning Centers Grantee Annual Data Tables.
Michigan State University, East Lansing, MI.
INTRODUCTION
What are the data sources for this report? The 2012-2013 Data Tables include information that MSU obtained from several sources about your program as a whole. MSU gives you data from:
EZReports (student characteristics, attendance, activities, staff, vendors/partners)
School records that you submitted (grades, tests)
Parent and student surveys from the state evaluation (change in youth developmental assets, outcomes, program satisfaction)
Teacher survey data collected as part of state and federal requirements (changes in classroom behavior)
Staff and supervisor survey data (beliefs about quality, perceptions of the working climate)
YPQA (staff activity interaction)
Grantees may also collect information from:
Other data your program collected specifically with local questions in mind, such as local surveys, interviews, or focus groups with students, parents, staff, school administrators, community members, partners, or any other data that would assist you in developing your program’s success and sustainability.
Meetings with key staff and administrators to review the program data, identify areas of strength and needs for improvement, and develop program adaptations to address problems identified.
Comparisons to the state. Most tables in this report compare data from this grantee to data across the state. Unlike Site Data Tables that compare the state average with students or sites serving the same grades, the state comparison for the grantee Data Tables includes all students in 21st CCLC programs because a grantee may be serving many different grade levels. Each of these tables indicates whether the data for your grantee is “Very high”, “High”, “Average”, “Low”, or “Very low” compared to the data for the state. To determine these cutoffs, we used standard deviations. A standard deviation (SD) is a measure of how far a score is from the average score. Scores for most grantees will fall between 1 SD above and 1 SD below the average score; a score more than 1 SD from the average score is quite different from how most of the other grantees are scoring.
"High" means that this grantee scored higher than two-thirds (67%) of the grantees across the state
"Very high" means that this grantee scored higher than 84% of grantees across the state
"Low" means that this grantee scored lower than two-thirds (67%) of grantees across the state
"Very low" means that this grantee scored lower than 84% of grantees across the state
You might see a score being considered as “Average” even though the number is quite different from the state average. That means, in practice, there is a wide range of scores in the state and therefore it might not be a meaningful difference. On the other hand, you might see your scores being very close to the state average but are noted as “Very low” or “Very high.” In that case most of the grantees would have similar scores close to the state average, and therefore slight differences in scoring might mean very different things. “ You will need to use your best judgment to decide how comparisons to the state data might be meaningful to you.
Moreover, to ensure the data represent your program, we set the reporting threshold as follows:
Parent, student and teacher surveys: at least 15 respondents for each examined question
Staff and supervior surveys: at least 3 respondents for each examined question
Data that do not meet the threshold will be identified as “Insufficient data” and excluded from the report. In addition, the note: “Data not requested” indicates that your survey data was not requested for one of

3
Van Egeren, L. A., Wu, H-C., Yang, N-K & Michigan 21st CCLC State Evaluation Team.
(2012). Michigan 21st Century Community Learning Centers Grantee Annual Data Tables.
Michigan State University, East Lansing, MI.
the following reasons: (1) you did not serve the age group of youth that was eligible for surveys, or (2) you did not serve enough youth at the survey administration period to meet the reporting threshold.

4
Van Egeren, L. A., Wu, H-C., Yang, N-K & Michigan 21st CCLC State Evaluation Team.
(2012). Michigan 21st Century Community Learning Centers Grantee Annual Data Tables.
Michigan State University, East Lansing, MI.
LEADING INDICATORS
This report is organized around a set of Leading Indicators and has been developed for Michigan 21st
CCLC programs. These indicators, which are presented within three domains, represent characteristics that contribute to high-quality programs. Here are the Leading Indicators and a brief description of each:
Domain 1: Instructional Context
Enrollment and Retention: Program serves and successfully retains high-risk students.
Academic Content: Program demonstrates that academics are a high priority.
Enrichment Content: Program has a comprehensive set of activities that facilitate achievement and development in which most students participate.
Connection to School Day: Program has structures and resources that ensure alignment between school-day and after-school learning.
Instructional Quality: Program has high levels of point-of-service engagement and interaction during activities.
Domain 2: Organizational Context
Stability: Program has consistent management, staffing, and school structure.
Grantee Program Management: Overall program management is guided by standards, has effective supervision, and is collaborative internally and externally.
Site Program Management: Site management is guided by standards, has effective supervision, and is collaborative.
Professional Development: Staff receive professional development upon hiring and on an ongoing basis in youth development and activity content.
Staff Qualifications: Staff are educated, experienced, and knowledgeable about quality standards for youth programs.
Continuous Improvement and Evaluation: Processes and quality infrastructure are in place for data-driven program improvement and evaluation
Domain 3: Positive Relationships
Relationships: Relationships among staff and participants are supportive and warm.
Climate: Program environment is safe and welcoming.
Community Partnerships: Program has relationships with community partners that contribute to sustainability and quality.
Family Communication: Family members are informed about their child and about opportunities for involvement.
All Leading Indicators have specific measures that are represented by data from the 21st CCLC
evaluation. Some are not displayed in order to maintain the confidentiality that was promised on the
supervisor survey. Data in this report that are part of the Leading Indicators are marked by .

5
Van Egeren, L. A., Wu, H-C., Yang, N-K & Michigan 21st CCLC State Evaluation Team.
(2012). Michigan 21st Century Community Learning Centers Grantee Annual Data Tables.
Michigan State University, East Lansing, MI.
Table of Contents
DOMAIN 1. INSTRUCTIONAL CONTEXT ................................................................................................. 10
1.1. LEADING INDICATOR: Enrollment and Retention ..................................................................... 10 1.1.1. All Students ....................................................................................................................... 10 1.1.2. Low-Achieving Students ................................................................................................... 11 1.1.3. Reasons for Enrollment .................................................................................................... 12
1.2. LEADING INDICATOR: Academic Content ................................................................................. 15 1.2.1. Academic Activity Participation .................................................................................... 15 1.2.2. Homework Help/Tutoring for Academically At-Risk Students ...................................... 16 1.2.3. Student Feedback on Academic Support .................................................................... 16 1.2.4. Staff Priorities.................................................................................................................... 17 1.2.5. Supervisor Connection to School-Day Content ................................................................ 17 1.2.6. Staff Connection to School-Day Content .......................................................................... 18
1.3. LEADING INDICATOR: Enrichment Content .............................................................................. 19 1.3.1. Activity Participation .......................................................................................................... 19 1.3.2. Activity Variety .............................................................................................................. 19
1.4. LEADING INDICATOR: Connection to School Day .................................................................... 20 1.4.1. Supervisor Communication with School ...................................................................... 20 1.4.2. Staff Communication with School ................................................................................ 21 1.4.3. Student Assessment Data Used in Planning .................................................................... 21 1.4.4. Staffing for Academic Activities ........................................................................................ 23
1.5. LEADING INDICATOR: Instructional Quality............................................................................... 24 1.5.1. Youth Program Quality Assessment (YPQA) Scores: Interaction and Engagement ... 24 1.5.2. Student Perceptions of Program Quality .......................................................................... 25 1.5.3. Staff Beliefs about Important Practices ............................................................................ 27
DOMAIN 2. ORGANIZATIONAL CONTEXT .............................................................................................. 29 2.1. LEADING INDICATOR: Stability .................................................................................................. 29 2.2. LEADING INDICATOR: Grantee Program Management ............................................................ 29
2.2.1. Effective Staff Meetings .................................................................................................... 30 2.2.2. Network of Sites within This Grantee ............................................................................... 30 2.2.3. Site Coordinator Job Satisfaction ..................................................................................... 31
2.3. LEADING INDICATOR: Site Program Management ................................................................... 32 2.3.1. Work Climate .................................................................................................................... 32
2.4. LEADING INDICATOR: Professional Development .................................................................... 35 2.4.1. New Staff Orientation and Training .............................................................................. 35 2.4.2. Evidence-Based Learning ............................................................................................ 36
2.5. LEADING INDICATOR: Staff Qualifications ................................................................................ 37 2.5.1. Staff Education ............................................................................................................. 37 2.5.2. Staff Experience ........................................................................................................... 37 2.5.3. Staff Familiarity with Program Standards ..................................................................... 38 2.5.4. Teaching Certificate ..................................................................................................... 38
2.6. LEADING INDICATOR: Continuous Improvement and Evaluation ............................................. 39 2.6.1. Data-Driven Continuous Quality Improvement Process – Staff ................................... 39 2.6.2. Data-Driven Continuous Quality Improvement Process – Supervisors ....................... 40
DOMAIN 3. POSITIVE RELATIONSHIPS .................................................................................................. 41 3.1. LEADING INDICATOR: Relationships ......................................................................................... 41
3.1.1. Student Perceptions of Supportive Relationships with Staff ........................................ 41 3.1.2. Student Perceptions of Supportive Relationships with Peers ...................................... 41 3.1.3. Parent Perceptions of Student Relationships with Staff .............................................. 42
3.2. LEADING INDICATOR: Climate .................................................................................................. 43 3.2.1. Youth Program Quality Assessment (YPQA) Scores: Safe Environment ................... 43 3.2.2. Parent Report of Welcoming Environment ................................................................... 43 3.2.3. Minimal Bullying ........................................................................................................... 44

6
Van Egeren, L. A., Wu, H-C., Yang, N-K & Michigan 21st CCLC State Evaluation Team.
(2012). Michigan 21st Century Community Learning Centers Grantee Annual Data Tables.
Michigan State University, East Lansing, MI.
3.2.4. Students Report Few Program Management Problems .............................................. 44 3.2.5. Program Satisfaction ........................................................................................................ 45 3.2.6. Grade That Parents Gave Program .................................................................................. 45
3.3. LEADING INDICATOR: Community Partnerships ....................................................................... 46 3.4. LEADING INDICATOR: Family Communication ......................................................................... 46
3.4.1. Staff Report of Program Communication with Parents ................................................ 46 3.4.2. Parent Report of Program Communication with Parents ............................................. 47
DOMAIN 4. STUDENT OUTCOMES .......................................................................................................... 48 4.1. Improvement in Grades ............................................................................................................... 48
4.1.1. All Regular Students (Federal Target) .............................................................................. 48 4.1.2. Regular Students with Room for Improvement................................................................. 48 4.1.3. Regular Students Compared to Non-Regular Students ................................................... 49
4.2. Teacher Ratings ........................................................................................................................... 49 4.2.1. Federal Targets ................................................................................................................ 49 4.2.2. Behaviors .......................................................................................................................... 50
4.3. Participant Perceptions of Program Impact ................................................................................. 51 4.3.1. Student Perceptions ......................................................................................................... 51 4.3.2. Parent Perceptions ........................................................................................................... 54

7
Van Egeren, L. A., Wu, H-C., Yang, N-K & Michigan 21st CCLC State Evaluation Team.
(2012). Michigan 21st Century Community Learning Centers Grantee Annual Data Tables.
Michigan State University, East Lansing, MI.
List of Tables
Table 1. EZReports Data Available ............................................................................................................... 9 Table 2. Survey Data Available ..................................................................................................................... 9 Table 3. Grade Data Available ...................................................................................................................... 9 Table 4. MEAP/MME Data Available ............................................................................................................ 9 Table 5. Enrollment/Retention for All Students ........................................................................................... 10 Table 6. Enrollment/Retention Compared to the State ............................................................................... 11 Table 7. Enrollment/Retention of Academically At-Risk Students .............................................................. 11 Table 8. Enrollment/Retention of Academically At-Risk Students Compared to the State ......................... 12 Table 9. Reasons for Enrollment: Percent of Parents Who Reported “Very Important” ............................. 12 Table 10. Percent of Students by Whose Decision It Was for Them to Attend .......................................... 14 Table 11. Percent of Students Who Participated in Each Type of Academic Activity ................................ 15 Table 12. Percent of Academically At-Risk Students Who Participated in Homework Help/Tutoring ........ 16 Table 13. Academic Support: Percent of Students Who Agreed or Strongly Agreed................................. 16 Table 14. Percent of Staff Reporting That Each Area is a Top Program Priority (First or Second Priority)
.................................................................................................................................................... 17 Table 15. Connections to the School Day: Percent of Supervisors Who Agreed or Strongly Agreed........ 17 Table 16. Connections to the School Day: Percent of Staff Who Agreed or Strongly Agreed ................... 18 Table 17. Percent of Students Who Participated in Each Type of Activity ................................................. 19 Table 18. Percent of Activities Types Offered ............................................................................................. 19 Table 19. Supervisor Communication with School: Percent of Supervisors Who Agreed or Strongly
Agreed ........................................................................................................................................ 20 Table 20. Staff Communication with School: Percent of Staff Who Agreed or Strongly Agreed ................ 21 Table 21. Using Academic Data for Activity Planning: Percent of Staff Who Reported “Use Regularly” ... 21 Table 22. Differentiated Instruction Based on Student Assessment Data: Percent of Staff Who Agreed or
Strongly Agreed .......................................................................................................................... 21 Table 23. Differentiated Instruction Based on Student Assessment Data: Percent of Supervisors Who
Agreed or Strongly Agreed ......................................................................................................... 22 Table 24. Considering Student Preferences for Activity Planning: Percent of Staff Who Reported
Frequently or Always .................................................................................................................. 22 Table 25. Percent of Academic Activities Led by School-Day or Retired Teachers ................................... 23 Table 26. YPQA Scores for Interaction and Engagement .......................................................................... 24 Table 27. Engagement: Percent of Students Who Agreed or Strongly Agreed ......................................... 25 Table 28. Opportunities for Interaction: Percent of Students Who Agreed or Strongly Agreed ................. 25 Table 29. Opportunities for Choice, Decision-Making, and Governance: Percent of Students Who Agreed
or Strongly Agreed ...................................................................................................................... 26 Table 30. Skill-Building and Mastery Orientation: Percent of Students Who Agreed or Strongly Agreed .. 26 Table 31. Practices for Engagement: Percent of Staff Who Agreed or Strongly Agreed ........................... 27 Table 32. Practices for Interaction: Percent of Staff Who Reported Agreed or Strongly Agreed ............... 27 Table 33. Practices for Creating Opportunities for Choice, Decision-Making, and Governance: Percent of
Staff Who Agreed or Strongly Agreed ........................................................................................ 28 Table 34. Perceptions of Staff Meetings: Percent of Supervisors Who Agreed or Strongly Agreed .......... 30 Table 35. The Network of Sites within this Grantee: Percent of Supervisors Who Agreed or Strongly
Agreed ........................................................................................................................................ 30 Table 36. Site Coordinator Job Satisfaction: Percent of Site Coordinators Who Agreed or Strongly Agreed
.................................................................................................................................................... 31 Table 37. Supervisor Supports for Working with Youth: Percent of Staff Reporting at Least Once Per
Month .......................................................................................................................................... 32 Table 38. Perceptions of Effective Staff Meetings: Percent of Staff Who Agreed or Strongly Agreed ....... 33 Table 39. Familiar with Standards: Percent of Supervisors Who Agreed or Strongly Agreed ................... 33 Table 40. Familiar with Objectives: Percent of Supervisors Who Agreed or Strongly Agreed ................... 33 Table 41. Staff Job Satisfaction: Percent of Staff Who Agreed or Strongly Agreed ................................... 34 Table 42. New Staff Training: Percent of Regular Staff Who Agreed or Strongly Agreed ......................... 35

8
Van Egeren, L. A., Wu, H-C., Yang, N-K & Michigan 21st CCLC State Evaluation Team.
(2012). Michigan 21st Century Community Learning Centers Grantee Annual Data Tables.
Michigan State University, East Lansing, MI.
Table 43. New Vendor Training: Percent of Vendor Staff Who Agreed or Strongly Agreed ...................... 36 Table 44. Percent of Supervisors and Staff Who Reported Discussing Research-Based Instructional
Practices at Least Once Per Month ............................................................................................ 36 Table 45. Percent of Staff with Bachelor’s Degrees or Higher ................................................................... 37 Table 46. Percent of Staff with at Least 3 Years Experience ..................................................................... 37 Table 47. Percent of Staff Who Reported Being Familiar with Standards .................................................. 38 Table 48. The table below reports the percent of staff who had a teaching certificate.Percent of Staff with
a Teaching Certificate ................................................................................................................. 38 Table 49. Data-Driven Quality Improvement Process: Percent of Staff Who Reported Practice Occurring
at Least Once Per Month ............................................................................................................ 39 Table 50. Supervision of Staff Practice: Percent of Supervisors Who Reported Practice Occurring at
Least Once Per Month ................................................................................................................ 40 Table 51. Staff Support: Percent of Students Who Agreed or Strongly Agreed ......................................... 41 Table 52. Peer Support: Percent of Students Who Agreed or Strongly Agreed ......................................... 41 Table 53. Staff and Program: Percent of Parents Who Agreed or Strongly Agreed................................... 42 Table 54. YPQA Scores for Safe Environment ........................................................................................... 43 Table 55. Welcoming Environment: Percent of Parents Who Agreed or Strongly Agreed ......................... 43 Table 56. Bullying: Percent of Students Who Agreed or Strongly Agreed ................................................. 44 Table 57. Program Management Problems: Percent of Students Who Agreed or Strongly Agreed .......... 44 Table 58. Program Satisfaction: Percent of Students Who Agreed or Strongly Agreed ............................ 45 Table 59. Percent of Parents by Grade They Gave Program ..................................................................... 45 Table 60. Parent Communication: Percent of Staff Who Reported At Least 3 to 5 Times Per Year .......... 46 Table 61. Parent Communication: Percent of Parents Who Agreed or Strongly Agreed ........................... 47 Table 62. Grade Improvement: Percent of All Regular Students Who Improved ....................................... 48 Table 63. Grade Improvement: Percent of Students with Room for Improvement Who Improved ............ 48 Table 64. Reading Grades: Percent of Regular and Non-Regular Students with Room for Improvement
Who Improved ............................................................................................................................. 49 Table 65. Math Grades: Percent of Regular and Non-Regular Students With Room for Improvement Who
Improved ..................................................................................................................................... 49 Table 66. Teacher Ratings: Percent of Regular Students Who Improved .................................................. 49 Table 67. Teacher Ratings: Percent of Regular Students Who Improved (Items) ..................................... 50 Table 68. Student Perceptions of Program Impact: Percent Who Reported Reported the Program Helped
Some or a Lot ............................................................................................................................. 51 Table 69. Student Perceptions of Program Impact on School Commitment: Percent Who Reported
Reported the Program Helped Some or a Lot ............................................................................ 51 Table 70. Healthy Food: Percent of Students Who Agreed or Strongly Agreed ......................................... 52 TABLE 71. Physical Activities: Percent of Students Who Agreed or Strongly Agreed ............................... 52 Table 72. Prosocial Skills: Percent of Students Who Reported the Program Helped Some or a Lot ......... 52 Table 73. Teamwork: Percent of Students Who Reported the Program Helped Some or a Lot ................ 53 Table 74. Leadership: Percent of Students Who Reported the Program Helped Some or a Lot ............... 53 Table 75. Social-emotional Learning: Percent of Students Who Reported the Program Helped Some or a
Lot ............................................................................................................................................... 53 Table 76. Parent Perceptions of Program Impact: Percent of Parents Reporting Some or a Lot of Student
Improvement ............................................................................................................................... 54

9
Van Egeren, L. A., Wu, H-C., Yang, N-K & Michigan 21st CCLC State Evaluation Team.
(2012). Michigan 21st Century Community Learning Centers Grantee Annual Data Tables.
Michigan State University, East Lansing, MI.
Data Available
EZREPORTS DATA
Table 1. EZReports Data Available
Student characteristic Number of students with data % Submitted
Number of students attending 1357 Not applicable
Grade 1357 100%
Sex 1357 100%
Race 1357 100%
SURVEY DATA
Table 2. Survey Data Available
Survey Number of individuals with data % Submitted
Student survey 289 91%
Parent survey 308 56%
Teacher survey 572 92%
Staff survey 50 Not applicable
SCHOOL OUTCOMES
Table 3. Grade Data Available
Outcome Number of students with data % Submitted
Reading grades 731 95%
Math grades 683 88%
Note: Grade data are presented for students who have grades reported for at least two marking periods of reading and/or math.
Table 4. MEAP/MME Data Available
Outcome Number of students with data % Submitted
MEAP/MME Reading 484 88%
MEAP/MME Math 480 87%

10
Van Egeren, L. A., Wu, H-C., Yang, N-K & Michigan 21st CCLC State Evaluation Team.
(2012). Michigan 21st Century Community Learning Centers Grantee Annual Data Tables.
Michigan State University, East Lansing, MI.
Domain 1. Instructional Context
1.1. LEADING INDICATOR: ENROLLMENT AND RETENTION
Indicator Description: Program serves and successfully retains high-risk students.
This section presents data on the specific measures related to the indicator as well as other relevant data to help you identify reasons for your enrollment/retention rates. The specific measures included in the indicator Enrollment and Retention are:
% of students who attended at least 30 days in the program year (1.1.1)
% of students served who are academically at risk (1.1.2)
% of academically at-risk students who attended at least 30 days in the program year (1.1.2)
% of academically at-risk students who attended at least 60 days in the program year (1.1.2)
% of academically at-risk students who attended at least 90 days in the program year (1.1.2)
Reasons for enrollment (1.1.3)
Since this grantee started receiving 21st CCLC funding, it has served 6110 unique students.
1.1.1. ALL STUDENTS
1.1.1.1. Past Two Years
The following table gives the numbers for enrollment and average daily attendance at this grantee for the past two years based on the data entered into EZReports. It also gives the percent who attended regularly for each year.
Table 5. Enrollment/Retention for All Students
Attendance measure 2011-2012 2012-2013
Enrollment (attended at least once)
All year 1527 1357
Summer 1095 919
School year 771 772
Average site daily attendance
Summer 97 83
School year 51 52
Retention
Percent attending at least 30 days (regulars) 55% 48%
Percent attending at least 60 days 34% 38%
Percent attending at least 90 days 25% 30%
Note. From EZReports.

11
Van Egeren, L. A., Wu, H-C., Yang, N-K & Michigan 21st CCLC State Evaluation Team.
(2012). Michigan 21st Century Community Learning Centers Grantee Annual Data Tables.
Michigan State University, East Lansing, MI.
1.1.1.2. Compared to the State
The following table gives the numbers for enrollment and retention at this grantee compared to the state.
Table 6. Enrollment/Retention Compared to the State
Attendance measure Your Grantee Statewide Grantee compared to
state
Enrollment (attended at least once)
All year 1357 489 Very high
Summer 919 190 Very high
School year 772 397 High
Average site daily attendance
Summer 83 25 Very high
School year 52 34 Very high
Retention
Percent attending at least 30 days
(regulars) 48% 52% Average
Percent attending at least 60 days 38% 33% Average
Percent attending at least 90 days 30% 18% High
Note. From EZReports.
1.1.2. LOW-ACHIEVING STUDENTS
1.1.2.1. Past Two Years
This section describes the extent to which this grantee enrolled and retained low-achieving students. The table below shows the percent of students enrolled and the percent of students who attended regularly who were low-achieving in reading and math. It also gives the percent of low-achieving students who attended this grantee regularly for each year. During the 2012-2013 school year, 89% of the total 756 students whose school outcome data were returned, comprising 677 students in your program, were
identified as academically at risk ().
Table 7. Enrollment/Retention of Academically At-Risk Students
Attendance measure 2011-2012 2012-2013
Enrollment (attended at least once)
All year 647 677
Summer 277 297
School year 647 677
Average site daily attendance
Summer 27 29
School year 43 46
Retention
Percent attending at least 30 days (regulars) 89% 86%
Percent attending at least 60 days 67% 68%
Percent attending at least 90 days 52% 56%
Note. Data are presented if available for at least 15 at-risk students based on school outcome data submission for the grantee. Because school outcome data were not collected from students who only attended the summer program, the summer attendance presented here might not best reflect your at-risk population during that period. From EZReports and school outcomes data.

12
Van Egeren, L. A., Wu, H-C., Yang, N-K & Michigan 21st CCLC State Evaluation Team.
(2012). Michigan 21st Century Community Learning Centers Grantee Annual Data Tables.
Michigan State University, East Lansing, MI.
Academically at-risk students are defined as students whose fall reading or math grades were less than 2.5 OR who did not pass MEAP/MME reading or MEAP/MME math.
1.1.2.2. Compared to the State
The following table gives the numbers for enrollment and retention of academically at-risk students at this grantee compared to the state.
Table 8. Enrollment/Retention of Academically At-Risk Students Compared to the State
Attendance measure Your grantee Statewide
Grantee compared to
state
Enrollment (attended at least once)
All year 677 302 Very high
Summer 297 43 Very high
School year 677 302 Very high
Average site daily attendance
Summer 29 7 Very high
School year 46 23 Very high
Retention
Percent attending at least 30 days (regulars) 86% 71% High
Percent attending at least 60 days 68% 49% High
Percent attending at least 90 days 56% 28% Very high
Note. Data are presented if available for at least 15 at-risk students based on school outcome data submission for the grantee. Because school outcome data were not collected from students who only attended the summer program, the summer attendance presented here might not best reflect your at-risk population during that period. Academically at-risk students are defined as students whose fall reading or math grades were less than 2.5 OR who did not pass MEAP/MME reading or MEAP/MME math. From EZReports and school outcomes data.
1.1.3. REASONS FOR ENROLLMENT
This section presents reasons for enrollment based on responses from the parent and student surveys.
1.1.3.1. Parents
The table below lists the percent of parents who thought the following statements were very important for them to enroll their children in the program.
Table 9. Reasons for Enrollment: Percent of Parents Who Reported “Very Important”
Reason for enrollment Your grantee Statewide
Grantee compared to
state
It is a safe place for my child after school. 94% 93% Average
It will help my child stay out of trouble. 82% 79% Average
It provides dependable after-school care. 76% 77% Average
It provides affordable after-school care. 72% 71% Average
School staff suggested that my child enroll. 63% 53% High
I hope it will help my child do better in school. 91% 87% Average
My child has a disability or learning problem that this program can help.
67% 46% Very high
Note. Data are presented if available for at least 15 parent respondents. From parent survey. N = 308.

13
Van Egeren, L. A., Wu, H-C., Yang, N-K & Michigan 21st CCLC State Evaluation Team.
(2012). Michigan 21st Century Community Learning Centers Grantee Annual Data Tables.
Michigan State University, East Lansing, MI.

14
Van Egeren, L. A., Wu, H-C., Yang, N-K & Michigan 21st CCLC State Evaluation Team.
(2012). Michigan 21st Century Community Learning Centers Grantee Annual Data Tables.
Michigan State University, East Lansing, MI.
1.1.3.2. Students
The table below lists the percent of students according to who they reported wanted them to come to this program.
Table 10. Percent of Students by Whose Decision It Was for Them to Attend
Who decided Your grantee Statewide
Grantee compared to
state
My parents want me to come. 37% 29% Average
My teachers, counselor or principal want me to come. 2% 4% Average
I want to come. 60% 67% Average
Note. Data are presented if available for at least 15 students. From student survey. N = 289.

15
Van Egeren, L. A., Wu, H-C., Yang, N-K & Michigan 21st CCLC State Evaluation Team.
(2012). Michigan 21st Century Community Learning Centers Grantee Annual Data Tables.
Michigan State University, East Lansing, MI.
1.2. LEADING INDICATOR: ACADEMIC CONTENT
Indicator Description: Program demonstrates that academics are a high priority.
This section presents data on the specific measures related to the indicator as well as other relevant data. The specific measures included in the indicator Academic Content are:
Academic activity participation (1.2.1)
Academic enrichment participation (1.2.1)
Homework help/tutoring participation for academically at-risk students (1.2.2)
Activities informed by grade-level content standards (not presented in Data Tables; is on ARF survey)
Student reports of academic support quality (1.2.3)
Academics is identified by staff as a top priority (1.2.4)
Supervisor connection to school-day content (1.2.5)
Staff connection to school-day content (1.2.6)
1.2.1. ACADEMIC ACTIVITY PARTICIPATION
The table below lists the percent of students who participated in each type of academic activity for this grantee and across the state out of students who attended the program for at least 10 days.
Table 11. Percent of Students Who Participated in Each Type of Academic Activity
Type of academic activity Your grantee Statewide Your grantee
compared to state
Homework help (support for homework completion)
55% 56% Average
Tutoring (remedial instruction for 1-3 students per adult)
4% Session not offered
Academic enrichment focused on specific
subjects 71% 35% Very high
Embedded learning (academic activities occurring within non-academic enrichment)
39% 42% Average
Credit recovery 2% 2% Average
STEM (Science, Technology, Engineering, Math)
73% 58% High
Did not participate in any academic activities 0% 4% Average
Note. Activities are categorized by MSU based on the activity name, description, and objectives listed in EZReports. Students are counted as having participated in an activity if they attended the program for at least 10 days and attended that type of activity for at least 10 days. From EZReports. N = 1250.

16
Van Egeren, L. A., Wu, H-C., Yang, N-K & Michigan 21st CCLC State Evaluation Team.
(2012). Michigan 21st Century Community Learning Centers Grantee Annual Data Tables.
Michigan State University, East Lansing, MI.
1.2.2. HOMEWORK HELP/TUTORING FOR ACADEMICALLY AT-RISK STUDENTS
The table below lists the percent of academically at-risk students who participated in homework help and/or tutoring for this grantee and for students across the state out of academically at-risk students who attended the program for at least 10 days.
Table 12. Percent of Academically At-Risk Students Who Participated in Homework Help/Tutoring
Type of academic activity Your grantee Statewide Your grantee
compared to state
Homework help/tutoring 94% 69% High
Note. Activities are categorized by MSU based on the activity name, description, and objectives listed in EZReports. Students are counted as having participated in an activity if they attended the program for at least 10 days and attended that type of activity for at least 10 days. Academically at-risk students are defined as students whose fall reading or math grades were less than 2.5 OR who did not pass MEAP/MME reading or MEAP/MME math. From EZReports. N = 719.
1.2.3. STUDENT FEEDBACK ON ACADEMIC SUPPORT
The table below lists the percent of students at this grantee and statewide who agreed or strongly agreed with the following statements about academic support in the program.
Table 13. Academic Support: Percent of Students Who Agreed or Strongly Agreed
Survey item Your
grantee Statewide
Your grantee
compared to state
This program helps me understand what we are doing in class. 86% 79% High
At this program, I learn school subjects in fun ways. 83% 78% High
The school work I do matches the school work we do in regular class. 75% 69% High
This program helps me get my homework done. 89% 87% Average
My grades have gotten better because of this program. 81% 76% High
Note. Data are presented if available for at least 15 students. From student survey. N = 289.

17
Van Egeren, L. A., Wu, H-C., Yang, N-K & Michigan 21st CCLC State Evaluation Team.
(2012). Michigan 21st Century Community Learning Centers Grantee Annual Data Tables.
Michigan State University, East Lansing, MI.
1.2.4. STAFF PRIORITIES
The table below provides information on what staff in this program see as the priorities. This information gives you a sense of whether the priorities of the staff are aligned with what administrators consider to be the program’s priorities. Staff ranked the following priorities from most to least important.
Table 14. Percent of Staff Reporting That Each Area is a Top Program Priority (First or Second Priority)
Program Area Your grantee Statewide
Your grantee compared to
state
Improve the academic achievement of youth 76% 67% High
Enable the lowest-performing students to achieve grade-level
proficiency 46% 46% Average
Improve the social and emotional development of youth 32% 35% Average
Help youth keep up with homework 18% 25% Low
Allow youth to relax, play, and socialize 12% 10% Average
Develop the artistic abilities of youth 4% 8% Average
Develop the sports skills of youth 2% 2% Average
Note. Data are presented if available for at least 3 regular staff. From staff survey. N = 50.
1.2.5. SUPERVISOR CONNECTION TO SCHOOL-DAY CONTENT
The table below provides information on how supervisors report connecting to school-day content so that the after-school program can support what school-day teachers are working toward. The percent of supervisors who agreed or strongly agreed with the statement is reported for your grantee and for the state.
Table 15. Connections to the School Day: Percent of Supervisors Who Agreed or Strongly Agreed
Survey item Your grantee Statewide
Your grantee compared to
state
On a week-to-week basis, we know what academic content will be covered during the school day with the students we work with in the after-school program.
11% 62% Very low
We coordinate the content of the afterschool activities we provide with our students’ school day work.
44% 66% Low
The activities we provide in the after-school program are tied to specific learning goals that are related to the school-day curriculum.
22% 68% Very low
Note. Data are presented if available for at least 3 supervisors. From supervisor survey. N = 9.

18
Van Egeren, L. A., Wu, H-C., Yang, N-K & Michigan 21st CCLC State Evaluation Team.
(2012). Michigan 21st Century Community Learning Centers Grantee Annual Data Tables.
Michigan State University, East Lansing, MI.
1.2.6. STAFF CONNECTION TO SCHOOL-DAY CONTENT
The table below provides information on how staff report connecting to school-day content so that the after-school program can support what school-day teachers are working toward. The percent of staff who agreed or strongly agreed with the statement is reported for your grantee and for the state.
Table 16. Connections to the School Day: Percent of Staff Who Agreed or Strongly Agreed
Survey item Your grantee Statewide
Your grantee compared to
state
On a week-to-week basis, I know what academic content will be covered during the school day with the students I work with in the after-school program.
39% 58% Very low
I coordinate the content of the afterschool activities I provide with my students’ school day work.
35% 55% Low
The activities I provide in the after-school program are tied to specific learning goals that are related to the school-day curriculum.
48% 65% Very low
Note. Data are presented if available for at least 3 regular staff. From staff survey. N = 50.

19
Van Egeren, L. A., Wu, H-C., Yang, N-K & Michigan 21st CCLC State Evaluation Team.
(2012). Michigan 21st Century Community Learning Centers Grantee Annual Data Tables.
Michigan State University, East Lansing, MI.
1.3. LEADING INDICATOR: ENRICHMENT CONTENT
Indicator Description: The program has a comprehensive set of activities that facilitate achievement and development in which most students participate.
This section presents data on the specific measures related to the indicator as well as other relevant data. The specific measures included in the indicator Enrichment Content are:
Arts participation (1.3.1)
Youth development participation (1.3.1)
Technology participation (1.3.1)
Activity variety (1.3.2)
1.3.1. ACTIVITY PARTICIPATION
The table below lists the percent of students who participated in each type of activity for this grantee and for students across the state out of students who attended the program for at least 10 days.
Table 17. Percent of Students Who Participated in Each Type of Activity
Type of activity Your grantee Statewide Your grantee
compared to state
Arts 56% 40% High
Health/nutrition 27% 9% High
Recreation (social events, games, free play, etc) 81% 57% High
Sports 70% 37% Very high
Technology 5% 11% Average
Youth development (character education, conflict
resolution, life skills, resistance skills, etc) 43% 39% Average
Note. Activities are categorized by MSU based on the activity name, description, and objectives listed in EZReports. Students are counted as having participated in an activity if they attended the program for at least 10 days and attended that type of activity for at
least 10 days. From EZReports. N = 1250.
1.3.2. ACTIVITY VARIETY
Programming that includes a variety of activities is considered best practice for most youth programs. The percent of different activity types (out of art, health/nutrition, sports, technology, youth development, recreation, and special events) offered by this grantee out of these possible activity types is presented below.
Table 18. Percent of Activities Types Offered
Your grantee Statewide Your grantee
compared to state
Percent of activity types offered 94% 79% Very high
Note. Activities are categorized by MSU based on the activity name, description, and objectives listed in EZReports. From EZReports.

20
Van Egeren, L. A., Wu, H-C., Yang, N-K & Michigan 21st CCLC State Evaluation Team.
(2012). Michigan 21st Century Community Learning Centers Grantee Annual Data Tables.
Michigan State University, East Lansing, MI.
1.4. LEADING INDICATOR: CONNECTION TO SCHOOL DAY
Indicator Description: Program has structures and resources that ensure alignment between school-day and after-school learning.
This section presents data on some of the measures of this indicator. It includes data on staffing patterns for academic activities and student perceptions of academic support. The specific measures included in the indicator Connection to School Day are:
Formal policies for connecting with school day (not presented in Data Tables; is on ARF survey)
Supervisor communication with school (1.4.1)
Staff communication with school (1.4.2)
School investment in program (not presented in Data Tables; is on ARF survey)
Student assessment data used in planning (1.4.3)
Staffing for academic activities (1.4.4)
1.4.1. SUPERVISOR COMMUNICATION WITH SCHOOL
The table below shows the percent of supervisors who report using the following communication strategies to bridge academic programming between the after-school program and school-day instruction.
Table 19. Supervisor Communication with School: Percent of Supervisors Who Agreed or Strongly Agreed
Survey item Your grantee Statewide
Your grantee compared to
state
We know who to contact at our students’ day-time school if we have a question about their progress or status.
100% 97% Average
I participate in regular joint staff meetings for after-school and day-time school staff where steps to discuss linkages between the school day and after-school are discussed.
33% 54% Low
We meet regularly with school-day staff not working in the after-school program to review the academic progress of individual students.
33% 59% Low
We participate in parent-teacher conferences to provide information about how individual students are doing (NOTE: If you are a school-day teacher, please answer this question in relation to student you do not have in your school-day classroom).
0% 55% Very low
I help manage a 3-way communication system that links parents, program, and day-time school information.
89% 73% High
Note. Data are presented if available for at least 3 supervisors. From supervisor survey. N =9.

21
Van Egeren, L. A., Wu, H-C., Yang, N-K & Michigan 21st CCLC State Evaluation Team.
(2012). Michigan 21st Century Community Learning Centers Grantee Annual Data Tables.
Michigan State University, East Lansing, MI.
1.4.2. STAFF COMMUNICATION WITH SCHOOL
The table below shows the percent of staff who report using the following communication strategies to bridge academic programming between the after-school program and school-day instruction.
Table 20. Staff Communication with School: Percent of Staff Who Agreed or Strongly Agreed
Survey item Your grantee Statewide
Your grantee compared to
state
I know who to contact at my students’ day-time school if I have a question about their progress or status.
88% 78% High
I participate in regular joint staff meetings for after-school and day-time school staff where steps to ensure linkages between the school day and after-school are discussed.
29% 37% Average
I meet regularly with school-day staff not working in the after-school program to review the academic progress of individual students.
18% 38% Very low
I participate in parent-teacher conferences to provide information about how individual students are doing (NOTE: If you are a school-day teacher, please answer this question in relation to a student you do not have in your school-day classroom).
2% 29% Very low
Note. Data are presented if available for at least 3 regular staff. From staff survey. N = 50.
1.4.3. STUDENT ASSESSMENT DATA USED IN PLANNING
The table below shows the percentage of staff who plan for activities using students’ academic data. The percent of staff who report using each data source regularly is reported for your grantee and for the state.
Table 21. Using Academic Data for Activity Planning: Percent of Staff Who Reported “Use Regularly”
Survey item Your grantee Statewide
Your grantee compared to
state
Individual students’ academic plans 10% 18% Low
Individual students’ standardized test scores 2% 11% Low
Individual students’ grades 28% 29% Average
Input from individual students’ school-day teachers. 34% 34% Average
Note. Data are presented if available for at least 3 regular staff. From staff survey. N = 50.
The table below provides information on how staff report connecting to school-day content so that the after-school program can support what school-day teachers are working toward. The percent of staff who agreed or strongly agreed with the statement is reported for your grantee and for the state.
Table 22. Differentiated Instruction Based on Student Assessment Data: Percent of Staff Who Agreed or Strongly Agreed
Survey item Your grantee Statewide
Your grantee compared to
state
I use student assessment data to provide different types of instruction to students attending my after-school activities
based on their achievement level.
48% 47% Average
Note. Data are presented if available for at least 3 regular staff. From staff survey. N = 48.

22
Van Egeren, L. A., Wu, H-C., Yang, N-K & Michigan 21st CCLC State Evaluation Team.
(2012). Michigan 21st Century Community Learning Centers Grantee Annual Data Tables.
Michigan State University, East Lansing, MI.
The table below provides information on how supervisors report connecting to school-day content so that the after-school program can support what school-day teachers are working toward. The percent of supervisors who agreed or strongly agreed with the statement is reported for your grantee and for the state.
Table 23. Differentiated Instruction Based on Student Assessment Data: Percent of Supervisors Who Agreed or Strongly Agreed
Survey item Your grantee Statewide
Your grantee compared to
state
We use student assessment data to provide different types of instruction to students attending my after-school activities
based on their achievement level.
33% 61% Low
Note. Data are presented if available for at least 3 supervisors. From supervisor survey. N = 9.
The table below provides information on the percent of staff who report planning for activities using intentional strategies that take into account student preferences. The percent of staff who reported frequently or always to the statement is reported for your grantee and for the state.
Table 24. Considering Student Preferences for Activity Planning: Percent of Staff Who Reported Frequently or Always
Survey item Your grantee Statewide
Your grantee compared to
state
Well-planned in advance 96% 87% High
Based on written plans for the session, assignments, and projects
94% 79% Very high
Tied to specific learning goals 81% 83% Average
Meant to build upon skills cultivated in a prior activity or lesson
67% 79% Very low
Explicitly designed to promote skill-building and mastery in relation to one or more state standard
51% 74% Very low
Explicitly meant to address a specific developmental domain (e.g., cognitive, social, emotional, civic, physical, etc.)
69% 78% Low
Structured to respond to youth feedback on what the content or format of the activity should be
45% 67% Very low
Informed by the expressed interests, preferences, and/or satisfaction of the participating youth
76% 77% Average
Note. Data are presented if available for at least 3 regular staff. From staff survey. N = 50.

23
Van Egeren, L. A., Wu, H-C., Yang, N-K & Michigan 21st CCLC State Evaluation Team.
(2012). Michigan 21st Century Community Learning Centers Grantee Annual Data Tables.
Michigan State University, East Lansing, MI.
1.4.4. STAFFING FOR ACADEMIC ACTIVITIES
The following table shows the percent of each type of academic activity led by school-day or retired teachers for this grantee and statewide.
Table 25. Percent of Academic Activities Led by School-Day or Retired Teachers
Type of academic activity Your grantee Statewide
Your grantee compared to
state
All academic activities 16% 31% Low
Homework help 9% 37% Low
Tutoring 35% Session not
offered
Academic enrichment focused on specific subjects 16% 39% Low
Embedded learning activities (academic activities occurring within non-academic enrichment)
21% 25% Average
STEM (Science, Technology, Engineering, Math) 15% 29% Average
Credit recovery 33% 50% Average
Note. All academic activities N = 215, homework help N = 37, tutoring N = 0, academic enrichment focused on specific subjects N = 67, embedded learning activities N = 83, STEM N = 116, credit recovery N = 3. From EZReports.

24
Van Egeren, L. A., Wu, H-C., Yang, N-K & Michigan 21st CCLC State Evaluation Team.
(2012). Michigan 21st Century Community Learning Centers Grantee Annual Data Tables.
Michigan State University, East Lansing, MI.
1.5. LEADING INDICATOR: INSTRUCTIONAL QUALITY
Indicator Description: Program has high levels of point-of-service engagement and interaction during activities
This section presents data on the specific measures related to the indicator as well as other relevant data. The specific measures included in the indicator Instructional Quality are:
Self-assessed observation of instructional quality (YPQA) (1.5.1)
Student-reported opportunities for engagement (1.5.2.1)
Student-reported opportunities for interaction (1.5.2.2)
Student-reported opportunities for governance, decision-making, and choice (1.5.2.3)
Student-report of program mastery focus (1.5.2.4)
Staff-reported engagement practices (1.5.3.1)
Staff-reported interaction practices (1.5.3.2)
1.5.1. YOUTH PROGRAM QUALITY ASSESSMENT (YPQA) SCORES: INTERACTION AND ENGAGEMENT
The table below tells you the Youth Program Quality Assessment (YPQA) self-assessment scores for Interaction and Engagement for your program compared to the state. To identify specific items to work on, refer to your YPQA reports. A score of at least 4 is desired. It should be noted that for the self-assessments, different sites may have different perceptions of what is necessary to get a certain score. Descriptions of the scales are listed below:
Interaction: Students have opportunities to develop a sense of belonging, participate in small groups, act as group facilitators/mentors, and manage feels and conflicts appropriately.
Engagement: Students have opportunities to set goals/make plans, reflect on activities and learning, and make choices.
Table 26. YPQA Scores for Interaction and Engagement
YPQA scale Your grantee Statewide
Your grantee compared to
state
Interaction (self assessment) 4 3.9 Average
Engagement (self assessment) 3.4 3.4 Average
Note. Scores can range from 1 to 5. From Youth Program Quality Assessment, self-assessment N = 10.

25
Van Egeren, L. A., Wu, H-C., Yang, N-K & Michigan 21st CCLC State Evaluation Team.
(2012). Michigan 21st Century Community Learning Centers Grantee Annual Data Tables.
Michigan State University, East Lansing, MI.
1.5.2. STUDENT PERCEPTIONS OF PROGRAM QUALITY
Students in 4th- to 12
th-grade reported about a variety of areas of program quality. The indicator includes
student reports of engagement and interaction. However, student reports in other areas are provided here as well for your review for potential program improvement.
1.5.2.1. Engagement
The table below lists the percent of 4th- to 12
th-grade students at this grantee and statewide who agreed
or strongly agreed with statements about their engagement in the program.
Table 27. Engagement: Percent of Students Who Agreed or Strongly Agreed
Survey item: At this program… Your grantee Statewide
Your grantee compared to
state
The activities challenge me to learn new skills. 82% 79% Average
The activities we do really make me think. 75% 74% Average
I do things that I don't get to do anywhere else. 66% 65% Average
I get to do things I like to do. 78% 81% Average
Note. Data are presented if available for at least 15 students. From student survey. N = 289.
1.5.2.2. Interaction
The table below lists the percent of 4th- to 12
th-grade students at this grantee and statewide who agreed
or strongly agreed with statements about opportunities for interaction in the program.
Table 28. Opportunities for Interaction: Percent of Students Who Agreed or Strongly Agreed
Survey item: At this program… Your grantee Statewide
Your grantee compared to
state
I get to work in small groups of just a few kids. 76% 80% Low
Kids and staff set goals for what should happen. 86% 79% High
Kids and staff have group discussions about what we learned. 73% 71% Average
I get to teach or coach other kids. 49% 54% Average
I have opportunities to be a leader. 74% 76% Average
Note. Data are presented if available for at least 15 students. From student survey. N = 289.

26
Van Egeren, L. A., Wu, H-C., Yang, N-K & Michigan 21st CCLC State Evaluation Team.
(2012). Michigan 21st Century Community Learning Centers Grantee Annual Data Tables.
Michigan State University, East Lansing, MI.
1.5.2.3. Opportunities for Choice, Decision-Making, and Governance
The table below lists the percent of 4th- to 12
th-grade students at this grantee and statewide who agreed
or strongly agreed with the following statements about the program’s opportunities for choice, decision-making, and governance.
Table 29. Opportunities for Choice, Decision-Making, and Governance: Percent of Students Who Agreed or Strongly Agreed
Survey item: At this program… Your grantee Statewide
Your grantee compared to
state
I get to decide how to complete some projects or activities. 70% 67% Average
I get to choose my activities. 67% 65% Average
I help decide what kinds of activities are offered. 59% 61% Average
My opinions matter when decisions are made about the program.
69% 67% Average
I have participated in a youth advisory committee. 42% 49% Low
I am involved in important decisions about this program. 54% 59% Average
Note. Data are presented if available for at least 15 students. From student survey. N = 289.
1.5.2.4. Skill-Building and Mastery Orientation
The table below lists the percent of 4th- to 12
th-grade students at this grantee and statewide who agreed
or strongly agreed with the following statements about the program’s orientation toward skill-building and mastery.
Table 30. Skill-Building and Mastery Orientation: Percent of Students Who Agreed or Strongly Agreed
Survey item: At this program… Your grantee Statewide
Your grantee compared to
state
It's important that we really understand the activities that we do.
89% 86% High
Trying hard is very important. 87% 88% Average
Learning new ideas and concepts is very important. 90% 86% High
How much you improve is really important. 92% 88% High
Staff notice when I have done something well. 82% 84% Average
It's ok to make mistakes as long as you're learning. 91% 90% Average
Note. Data are presented if available for at least 15 students. From student survey. N = 289.

27
Van Egeren, L. A., Wu, H-C., Yang, N-K & Michigan 21st CCLC State Evaluation Team.
(2012). Michigan 21st Century Community Learning Centers Grantee Annual Data Tables.
Michigan State University, East Lansing, MI.
1.5.3. STAFF BELIEFS ABOUT IMPORTANT PRACTICES
The next tables present staff perceptions about practices for working with youth to improve both achievement and social development. Staff were asked to rate each item on a scale of 1 (Strongly disagree) to 5 (Strongly agree). These data may provide suggestions for professional development depending on the goals of your program.
1.5.3.1. Engagement Practices
This table shows staff perceptions of the degree to which staff use practices that provide opportunities for high levels of engagement within activities. These are often difficult practices for staff to learn to do consistently and well.
Table 31. Practices for Engagement: Percent of Staff Who Agreed or Strongly Agreed
Survey item Your grantee Statewide
Your grantee compared to
state
Staff include time in activities for youth to reflect on their experiences (e.g., formal journal writing, conversational feedback)
71% 79% Low
Staff are effective at providing youth with meaningful choices during activities.
88% 89% Average
Staff provide structured and planned activities explicitly designed to help youth get to know each other.
78% 81% Average
Staff are effective at providing youth with opportunities to set goals and make plans within the program.
75% 80% Average
Staff ask for and listen to student opinions about the way things should work in the program.
75% 82% Low
Staff have youth work collaboratively with other youth in small groups.
94% 89% High
Staff have youth work on group projects that take more than one day to complete.
83% 84% Average
Note. Data are presented if available for at least 3 regular staff. From staff survey. N = 50.
1.5.3.2. Beliefs About Interaction
This table shows staff perceptions of the degree to which staff use practices that provide opportunities for high levels of interaction within activities. These are often difficult practices for staff to learn to do consistently and well.
Table 32. Practices for Interaction: Percent of Staff Who Reported Agreed or Strongly Agreed
Survey item Your grantee Statewide
Your grantee compared to
state
Staff listen to youth more than talk at them. 72% 73% Average
Staff actively and continuously consult and involve youth. 90% 89% Average
Staff facilitate youth to lead activities. 60% 71% Low
Staff have youth help or mentor other youth in completing a project or task.
90% 82% High
Staff provide opportunities for the work, achievements, or accomplishments of youth to be publicly recognized.
80% 81% Average
Staff have youth make formal presentations to the larger group of students.
48% 58% Low

28
Van Egeren, L. A., Wu, H-C., Yang, N-K & Michigan 21st CCLC State Evaluation Team.
(2012). Michigan 21st Century Community Learning Centers Grantee Annual Data Tables.
Michigan State University, East Lansing, MI.
Note. Data are presented if available for at least 3 regular staff. From staff survey. N = 50.
1.5.3.3. Beliefs About Youth Choice, Decision-Making, and Governance
This table shows staff perceptions of the degree to which staff use practices that provide students with with opportunities for choice, governance, and decision-making. These items range from letting students choose activities to partnering with students to determine the overall policies of the program.
Table 33. Practices for Creating Opportunities for Choice, Decision-Making, and Governance: Percent of Staff Who Agreed or Strongly Agreed
Practice Your grantee Statewide
Your grantee compared to
state
Youth are able to take responsibility for their own program. 63% 66% Average
Youth can set goals for what they want to accomplish in the program.
75% 75% Average
Youth help make plans for what activities are offered at the program.
66% 74% Average
Youth make choices about WHAT content is covered in program offerings.
51% 58% Low
Youth make choices about HOW content is covered in program offerings.
34% 48% Low
Youth help create rules and guidelines for the program. 55% 61% Average
Note. Data are presented if available for at least 3 regular staff. From staff survey. N = 50.
29
Van Egeren, L. A., Wu, H-C., Yang, N-K & Michigan 21st CCLC State Evaluation Team.
(2012). Michigan 21st Century Community Learning Centers Grantee Annual Data Tables.
Michigan State University, East Lansing, MI.
Domain 2. Organizational Context
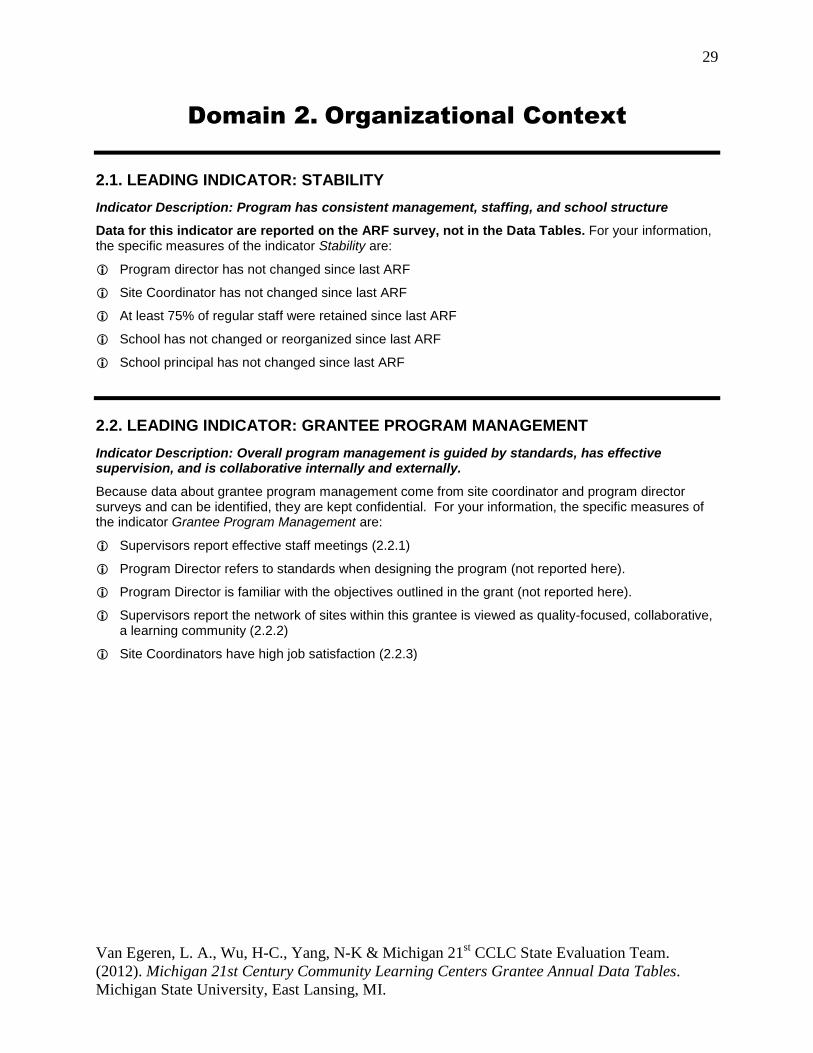
2.1. LEADING INDICATOR: STABILITY
Indicator Description: Program has consistent management, staffing, and school structure
Data for this indicator are reported on the ARF survey, not in the Data Tables. For your information, the specific measures of the indicator Stability are:
Program director has not changed since last ARF
Site Coordinator has not changed since last ARF
At least 75% of regular staff were retained since last ARF
School has not changed or reorganized since last ARF
School principal has not changed since last ARF
2.2. LEADING INDICATOR: GRANTEE PROGRAM MANAGEMENT
Indicator Description: Overall program management is guided by standards, has effective supervision, and is collaborative internally and externally.
Because data about grantee program management come from site coordinator and program director surveys and can be identified, they are kept confidential. For your information, the specific measures of the indicator Grantee Program Management are:
Supervisors report effective staff meetings (2.2.1)
Program Director refers to standards when designing the program (not reported here).
Program Director is familiar with the objectives outlined in the grant (not reported here).
Supervisors report the network of sites within this grantee is viewed as quality-focused, collaborative, a learning community (2.2.2)
Site Coordinators have high job satisfaction (2.2.3)

30
Van Egeren, L. A., Wu, H-C., Yang, N-K & Michigan 21st CCLC State Evaluation Team.
(2012). Michigan 21st Century Community Learning Centers Grantee Annual Data Tables.
Michigan State University, East Lansing, MI.
2.2.1. EFFECTIVE STAFF MEETINGS
The table below lists the percent of supervisors at this grantess and statewide who reported that they agreed or strongly agreed with the following statements about staff meetings at this grantee. Research has shown that effective staff meetings are a key way to communicate program priorities, coach staff, and build staff voice and ideas into the program. They are a key predictor of whether staff put the goals of the program into practice.
Table 34. Perceptions of Staff Meetings: Percent of Supervisors Who Agreed or Strongly Agreed
Survey item Your grantee Statewide
Your grantee compared to
state
Well organized. 100% 93% High
Open to input from staff. 100% 96% Average
Open to disagreement from staff. 100% 88% High
Able to achieve agreement from all participants when necessary.
100% 93% High
Note. Data are presented if available for at least 3 supervisors. From supervisor survey. N = 9.
2.2.2. NETWORK OF SITES WITHIN THIS GRANTEE
The table below lists the percent of supervisors at this site and statewide who agreed or strongly agreed with the following statements.
Table 35. The Network of Sites within this Grantee: Percent of Supervisors Who Agreed or Strongly Agreed
Survey item Your grantee Statewide
Your grantee compared to
state
In our network, lead administrators make sure that all staff are familiar with standards of quality. 78% 90% Very low
Our site is routinely monitored by higher-level administrators. 33% 84% Very low
Site coordinators in our network are adequately trained and prepared to manage their sites. 78% 88% Low
Sites in our network are held accountable for the quality of their services. 89% 95% Low
Staff who provide youth activities in our network are adequately trained and prepared to work with our youth. 100% 86% High
Everyone in our network is working together toward common goals. 100% 94% High
Collaboration across sites in our network is strongly encouraged by program administrators. 89% 92% Average
Within this network, most site coordinators share the same vision about the central mission of the program. 100% 93% High
Supervisors in our network use a formal process to observe their staff and provide feedback about the quality of the program as a whole. 56% 84% Very low
Note. Data are presented if available for at least 3 supervisors. From supervisor survey. N = 9.

31
Van Egeren, L. A., Wu, H-C., Yang, N-K & Michigan 21st CCLC State Evaluation Team.
(2012). Michigan 21st Century Community Learning Centers Grantee Annual Data Tables.
Michigan State University, East Lansing, MI.
2.2.3. SITE COORDINATOR JOB SATISFACTION
The table below lists the percent of supervisors at this grantee and statewide who agreed or strongly agreed with the following statement.
Table 36. Site Coordinator Job Satisfaction: Percent of Site Coordinators Who Agreed or Strongly Agreed
Survey item Your grantee Statewide
Your grantee compared to
state
I am satisfied with this job at this after-school program. 75% 82% Average
Note. Data are presented if available for at least 3 site coordinators. From supervisor survey. N = 8.

32
Van Egeren, L. A., Wu, H-C., Yang, N-K & Michigan 21st CCLC State Evaluation Team.
(2012). Michigan 21st Century Community Learning Centers Grantee Annual Data Tables.
Michigan State University, East Lansing, MI.
2.3. LEADING INDICATOR: SITE PROGRAM MANAGEMENT
Indicator Description: Site management is guided by standards, has effective supervision, and is collaborative.
This section presents data on some of the specific measures related to the indicator as well as other relevant data. Some of these measures are more appropriately dealt with at the grantee level, while others are site-level issues. The specific measures included in the indicator Site Program Management that are within the purview of grantee-level management are:
Supervisors provide effective support to staff (2.3.1.1)
Staff report of effective staff meetings (2.3.1.2)
Supervisors refer to standards when designing the program (2.3.1.3)
Supervisors are familiar with the objectives outlined in the grant (2.3.1.4)
Staff have high job satisfaction (2.3.1.5)
2.3.1. WORK CLIMATE
This section provides information on staff perceptions of support from the supervisor, supports among staff, and the effectiveness of meetings.
2.3.1.1. Supervisor Support
The table below lists the percent of staff at this grantee and statewide who reported that they received the following supports from their supervisor at least once per month.
Table 37. Supervisor Supports for Working with Youth: Percent of Staff Reporting at Least Once Per Month
Survey item: My supervisor… Your grantee Statewide
Your grantee compared to
state
Reviews my activity plans. 96% 78% Very high
Is visible during the activities. 98% 88% High
Makes sure that program goals and priorities are clear to me. 84% 76% High
Gives me positive feedback. 98% 85% Very high
Gives me useful feedback about how I work with youth. 90% 81% High
Note. Data are presented if available for at least 3 regular staff. From staff survey. N = 50.

33
Van Egeren, L. A., Wu, H-C., Yang, N-K & Michigan 21st CCLC State Evaluation Team.
(2012). Michigan 21st Century Community Learning Centers Grantee Annual Data Tables.
Michigan State University, East Lansing, MI.
2.3.1.2. Effective Staff Meetings
The table below lists the percent of staff at this grantee and statewide who “agreed or strongly agreed” about the following aspects of effective staff meetings. Research has shown that effective staff meetings are a key way to communicate program priorities, coach staff, and build staff voice and ideas into the program. They are a key predictor of whether staff put the goals of the program into practice.
Table 38. Perceptions of Effective Staff Meetings: Percent of Staff Who Agreed or Strongly Agreed
Survey item Your grantee Statewide
Your grantee compared to
state
Well organized. 80% 86% Average
Open to input from staff. 94% 94% Average
Open to disagreement from staff. 84% 84% Average
Able to achieve agreement from all participants when necessary.
88% 90% Average
Note. Data are presented if available for at least 3 regular staff. From staff survey. N = 50.
2.3.1.3. Familiar with Standards
The table below reports the percent of supervisors who are familiar with standards for after-school programs.
Table 39. Familiar with Standards: Percent of Supervisors Who Agreed or Strongly Agreed
Survey item Your grantee Statewide
Your grantee compared to
state
I would be able to describe the main points of the Michigan state standards for after-school programs to someone else.
56% 82% Very low
I would be able to describe the main points of at least one other written standard that applies to after-school or youth development work (for example, National After School Association, American Camping Association) to someone else.
44% 65% Low
I refer to the state standards or other written standards when identifying what this program should be doing with youth.
56% 84% Very low
Note. Data are presented if available for at least 3 supervisors. From supervisor survey. N = 9.
2.3.1.4. Familiar with Objectives Outlined in the Grant
The table below reports the percent of supervisors who are familiar with the program’s objectives as written in their propasl to MDE.
Table 40. Familiar with Objectives: Percent of Supervisors Who Agreed or Strongly Agreed
Survey item Your grantee Statewide
Your grantee compared to
state
I would be able to describe the specific objectives for this program, as written in the proposal that this program's organization submitted to MDE, to someone else.
78% 86% Average
Note. Data are presented if available for at least 3 supervisors. From supervisor survey. N = 9.

34
Van Egeren, L. A., Wu, H-C., Yang, N-K & Michigan 21st CCLC State Evaluation Team.
(2012). Michigan 21st Century Community Learning Centers Grantee Annual Data Tables.
Michigan State University, East Lansing, MI.
2.3.1.5. Job Satisfaction
The table below lists the percent of staff at this grantee and statewide who agreed or strongly agreed that they were satisfied with their current job in the after school program.
Table 41. Staff Job Satisfaction: Percent of Staff Who Agreed or Strongly Agreed
Survey item Your grantee Statewide
Your grantee compared to
state
I am satisfied with this job at this after-school program. 82% 83% Average
Note. Data are presented if available for at least 3 regular staff. From staff survey. N = 50.

35
Van Egeren, L. A., Wu, H-C., Yang, N-K & Michigan 21st CCLC State Evaluation Team.
(2012). Michigan 21st Century Community Learning Centers Grantee Annual Data Tables.
Michigan State University, East Lansing, MI.
2.4. LEADING INDICATOR: PROFESSIONAL DEVELOPMENT
Indicator Description: Staff receive professional development upon hiring and on an ongoing basis in youth development and activity content.
This section presents data on some of the specific measures related to the indicator as well as other relevant data. Some of these measures are more appropriately dealt with at the grantee level, while others are site-level issues. The specific measures included in the indicator Professional Development that are within the purview of grantee-level management are:
Strong orientation to program for staff (staff report; 2.4.1.2)
Strong orientation to program for vendor (vendor report; 2.4.1.4)
Ongoing professional development about how to work with youth for program director (not reported here)
Ongoing professional development in content areas for program director (not reported here)
Supervisors and staff discuss current research-based instructional practices (2.4.2)
2.4.1. NEW STAFF ORIENTATION AND TRAINING
2.4.1.1. Professional Development Opportunities for Regular Staff – Staff Report
The table below reports the percent of staff who agreed or strongly agreed that they received various forms of new staff training when they began working at the program.
Table 42. New Staff Training: Percent of Regular Staff Who Agreed or Strongly Agreed
When you began working at this program, were you: Your grantee Statewide
Your grantee compared to
state
Informed about how staff at this program are expected to work with youth.
94% 84% High
Informed about what this program is trying to accomplish with youth.
96% 89% High
Mentored by more experienced staff. 63% 61% Average
Offered a “beginners seminar” or pre-service orientation about how to work with youth.
75% 53% High
Given shared planning time with a staff member who had been here longer.
79% 58% Very high
In daily communication with your supervisor at THIS program about how things were going.
94% 83% High
Note. Data are presented if available for at least 3 regular staff. From staff survey. N = 48.

36
Van Egeren, L. A., Wu, H-C., Yang, N-K & Michigan 21st CCLC State Evaluation Team.
(2012). Michigan 21st Century Community Learning Centers Grantee Annual Data Tables.
Michigan State University, East Lansing, MI.
2.4.1.2. Professional Development Opportunities for Vendors – Vendor Report
The table below reports the percent of vendors who agreed or strongly agreed that they received various forms of new staff training when they began working at the program.
Table 43. New Vendor Training: Percent of Vendor Staff Who Agreed or Strongly Agreed
When you began working at this program, were you: Your grantee Statewide
Your grantee compared to
state
Informed about how staff at this program are expected to work with youth.
81% Insufficient
data
Informed about what this program is trying to accomplish with youth.
85% Insufficient
data
Mentored by more experienced staff. 45% Insufficient
data
Offered a “beginners seminar” or pre-service orientation about how to work with youth.
37% Insufficient
data
Given shared planning time with a staff member who had been here longer.
41% Insufficient
data
In daily communication with your supervisor at THIS program about how things were going.
70% Insufficient
data
Note. Data are presented if available for at least 3 vendor staff. From staff survey. N = 2.
2.4.2. EVIDENCE-BASED LEARNING
The table below lists the percent of supervisors and staff at this grantee and statewide who reported that they discussed research-based instructional practices at least once per month.
Table 44. Percent of Supervisors and Staff Who Reported Discussing Research-Based Instructional Practices at Least Once Per Month
How often do you do the following? Your grantee Statewide
Your grantee compared to
state
Discuss current research-based instructional practices. 15% 28% Low
Note. Data are presented if available for at least 3 supervisors and staff combined. From staff and supervisor surveys. N = 66.

37
Van Egeren, L. A., Wu, H-C., Yang, N-K & Michigan 21st CCLC State Evaluation Team.
(2012). Michigan 21st Century Community Learning Centers Grantee Annual Data Tables.
Michigan State University, East Lansing, MI.
2.5. LEADING INDICATOR: STAFF QUALIFICATIONS
Indicator Description: Staff are educated, experienced, and have sufficient professional development.
The specific measures of the indicator Staff Qualifications are:
Bachelor’s degrees or higher (2.5.1)
A minimum of 3 years experience working with youth (2.5.2)
Familiarity with state standards or other standards for working with youth (2.5.3)
Teaching Certificate (2.5.4)
2.5.1. STAFF EDUCATION
The table below reports the percent of staff who had a bachelor’s degree or higher.
Table 45. Percent of Staff with Bachelor’s Degrees or Higher
Your grantee Statewide
Your grantee compared to
state
Bachelor’s degree or higher 30% 57% Very low
Note. Data are presented if available for at least 3 regular staff. From staff survey. N = 50.
2.5.2. STAFF EXPERIENCE
The table below reports the percent of staff who had at least three years of experience working with youth.
Table 46. Percent of Staff with at Least 3 Years Experience
How often do you do the following? Your grantee Statewide
Your grantee compared to
state
At least 3 years experience working with youth. 48% 76% Very low
Note. Data are presented if available for at least 3 regular staff. From staff survey. N = 50.

38
Van Egeren, L. A., Wu, H-C., Yang, N-K & Michigan 21st CCLC State Evaluation Team.
(2012). Michigan 21st Century Community Learning Centers Grantee Annual Data Tables.
Michigan State University, East Lansing, MI.
2.5.3. STAFF FAMILIARITY WITH PROGRAM STANDARDS
The table below reports the percent of staff who are familiar with standards for after-school programs.
Table 47. Percent of Staff Who Reported Being Familiar with Standards
Survey item Your grantee Statewide
Your grantee compared to
state
I would be able to describe the main points of the Michigan state standards for after-school programs to someone else.
42% 53% Low
I would be able to describe the main points of at least one other written standard that applies to after-school or youth development work (for example, National After School Association, American Camping Association) to someone else.
34% 45% Low
I would be able to describe the specific objectives for this program, as written in the proposal that this program's organization submitted to MDE, to someone else.
56% 62% Average
Note. Data are presented if available for at least 3 regular staff. From staff survey. N = 50.
2.5.4. TEACHING CERTIFICATE
Table 48. The table below reports the percent of staff who had a teaching certificate.Percent of Staff with a Teaching Certificate
Your grantee Statewide
Your grantee compared to
state
Staff with teaching certificate who run activities. 10% 31% Low
Note. Data are presented if available for at least 3 regular staff. From staff survey. N = 50.

39
Van Egeren, L. A., Wu, H-C., Yang, N-K & Michigan 21st CCLC State Evaluation Team.
(2012). Michigan 21st Century Community Learning Centers Grantee Annual Data Tables.
Michigan State University, East Lansing, MI.
2.6. LEADING INDICATOR: CONTINUOUS IMPROVEMENT AND EVALUATION
Indicator Description: Processes and quality infrastructure are in place for data-driven program improvement and evaluation
This section presents data on some of the measures related to the indicator. The specific measures for the indicator Continuous Improvement and Evaluation are:
Data-driven continuous quality improvement process – staff (2.6.1)
Data-driven continuous quality improvement process – supervisors (2.6.2)
Local evaluator involvement (on ARF survey; not reported here)
Self assessment and improvement plan completed (YPQA; not reported here)
2.6.1. DATA-DRIVEN CONTINUOUS QUALITY IMPROVEMENT PROCESS – STAFF
The table below lists the percent of staff at this grantee and statewide who reported that they use the following processes with other staff as part of a data-driven quality improvement process at least once per month.
Table 49. Data-Driven Quality Improvement Process: Percent of Staff Who Reported Practice Occurring at Least Once Per Month
How frequently do you do the following with other staff working in the after-school program? Your grantee Statewide
Your grantee compared to
state
Get observed by other afterschool staff while I deliver programming in order to get feedback on my practice
16% 29% Low
Observe other afterschool staff delivering programming in order to provide feedback on their practice.
12% 24% Low
Review and interpret evaluation data. 22% 26% Average
Conduct program planning based on a review of data. 27% 30% Average
Use evaluation data to set program improvement goals. 31% 30% Average
Discuss progress on meeting program improvement goals. 52% 42% High
Conduct program planning in order to meet specific learning goals in coordinated ways across multiple activities.
45% 43% Average
Share ideas on how to make programming more engaging for participating students.
80% 63% High
Work with or see presentations from the local evaluator for this program.
16% 20% Average
Note. Data are presented if available for at least 3 regular staff. From staff survey. N = 50.

40
Van Egeren, L. A., Wu, H-C., Yang, N-K & Michigan 21st CCLC State Evaluation Team.
(2012). Michigan 21st Century Community Learning Centers Grantee Annual Data Tables.
Michigan State University, East Lansing, MI.
2.6.2. DATA-DRIVEN CONTINUOUS QUALITY IMPROVEMENT PROCESS – SUPERVISORS
The table below lists the percent of supervisors at this grantee and statewide who reported that they often or always use the following processes with their staff as part of a data-driven quality improvement process.
Table 50. Supervision of Staff Practice: Percent of Supervisors Who Reported Practice Occurring at Least Once Per Month
How frequently you do the following things for each staff? Your grantee Statewide
Your grantee compared to
state
Review their activity plans. 78% 80% Average
Make sure that program goals and priorities are clear to them. 56% 75% Low
Give them positive feedback. 89% 93% Average
Be visible during their activities. 89% 94% Low
Gives them useful feedback about how they work with youth. 89% 92% Average
Note. Data are presented if available for at least 3 supervisors. From supervisor survey. N = 9.

41
Van Egeren, L. A., Wu, H-C., Yang, N-K & Michigan 21st CCLC State Evaluation Team.
(2012). Michigan 21st Century Community Learning Centers Grantee Annual Data Tables.
Michigan State University, East Lansing, MI.
Domain 3. Positive Relationships
3.1. LEADING INDICATOR: RELATIONSHIPS
Indicator Description: Relationships among staff and participants are supportive and warm.
The specific measures of the indicator Relationships are:
Student report of supportive relationships with staff (3.1.1)
Student report of supportive relationships with program peers (3.1.2)
Parent report of student relationships with staff (3.1.3)
3.1.1. STUDENT PERCEPTIONS OF SUPPORTIVE RELATIONSHIPS WITH STAFF
The table below lists the percent of 4th- to 12
th-grade students at this grantee and statewide who agreed
or strongly agreed with the following statements about program staff.
Table 51. Staff Support: Percent of Students Who Agreed or Strongly Agreed
Survey item: At this program… Your grantee Statewide
Your grantee compared to
state
Staff care about me. 94% 94% Average
I trust the staff. 91% 89% Average
I can tell the staff in this program about my problems. 80% 77% Average
If a kid at this program is being mean to me, I know that staff will help me.
90% 88% Average
Note. Data are presented if available for at least 15 students. From student survey. N = 289.
3.1.2. STUDENT PERCEPTIONS OF SUPPORTIVE RELATIONSHIPS WITH PEERS
The table below lists the percent of 4th- to 12
th-grade students at this grantee and statewide who agreed
or strongly agreed with the following statements about peer support.
Table 52. Peer Support: Percent of Students Who Agreed or Strongly Agreed
At this program… Your grantee Statewide
Your grantee compared to
state
Kids make sure that other kids follow the rules. 67% 63% Average
Kids tell each other when they do a good job 67% 66% Average
Kids work together to solve problems. 71% 71% Average
Kids help me when I'm having a hard time. 76% 71% High
I trust the kids. 64% 60% Average
Note. Data are presented if available for at least 15 students. From student survey. N = 289.

42
Van Egeren, L. A., Wu, H-C., Yang, N-K & Michigan 21st CCLC State Evaluation Team.
(2012). Michigan 21st Century Community Learning Centers Grantee Annual Data Tables.
Michigan State University, East Lansing, MI.
3.1.3. PARENT PERCEPTIONS OF STUDENT RELATIONSHIPS WITH STAFF
The table below lists the percent of parents at this grantee and statewide who agreed or strongly agreed with the following statements about the staff and the program.
Table 53. Staff and Program: Percent of Parents Who Agreed or Strongly Agreed
Survey item Your grantee Statewide
Your grantee compared to
state
At least one staff in this program has a strong relationship with my child.
96% 93% Average
Staff in this program give my child individual attention. 93% 93% Average
Staff at this program do a good job of preventing bullying. 97% 95% Average
Staff in this program know how to work with a child like mine. 98% 97% Average
Note. Data are presented if available for at least 15 parents. From parent survey. N = 308.

43
Van Egeren, L. A., Wu, H-C., Yang, N-K & Michigan 21st CCLC State Evaluation Team.
(2012). Michigan 21st Century Community Learning Centers Grantee Annual Data Tables.
Michigan State University, East Lansing, MI.
3.2. LEADING INDICATOR: CLIMATE
Indicator Description: Program environment is safe and welcoming.
The specific measures for the indicator Climate are:
Program self-assessment of safe environment (3.2.1)
Parent report of welcoming environment (3.2.2)
Minimal bullying (3.2.3)
Students report few program management problems (3.2.4)
Students report satisfaction with the program (3.2.5)
Parents rating of the program (3.2.6)
3.2.1. YOUTH PROGRAM QUALITY ASSESSMENT (YPQA) SCORES: SAFE ENVIRONMENT
The table below tells you the Youth Program Quality Assessment (YPQA) scores for Safe Environment for your grantee compared to the state. To identify specific items to work on, refer to your YPQA reports. A score of at least 4 is desired. It should be noted that for the self-assessments, different grantees may have different perceptions of what is necessary to get a certain score. Descriptions of the scales are listed below:
Table 54. YPQA Scores for Safe Environment
YPQA scale Your grantee Statewide
Your grantee compared to
state
Safe environment (self assessment) 4.7 4.5 High
Note. Scores can range from 1 to 5. From Youth Program Quality Assessment, self-assessment N = 10.
3.2.2. PARENT REPORT OF WELCOMING ENVIRONMENT
The table below lists the percent of parents at this grantee and statewide who agreed or strongly agreed with the following statements about the environment created by the staff and the program.
Table 55. Welcoming Environment: Percent of Parents Who Agreed or Strongly Agreed
Survey item Your grantee Statewide
Your grantee compared to
state
I feel my child is safe in this program. 100% 99% High
When I go to the program, staff are doing things with the kids. 99% 97% Average
When I go to the program, staff greet me. 96% 96% Average
When I get to the program, staff are hanging out with other staff instead of being with the kids.(reversed, the higher the better
73% 78% Low
Staff treat me in a positive way. 99% 98% Average
Note. Data are presented if available for at least 15 parents. From parent survey. N = 308.

44
Van Egeren, L. A., Wu, H-C., Yang, N-K & Michigan 21st CCLC State Evaluation Team.
(2012). Michigan 21st Century Community Learning Centers Grantee Annual Data Tables.
Michigan State University, East Lansing, MI.
3.2.3. MINIMAL BULLYING
The table below lists the percent of 4th- to 12
th-grade students at this grantee and statewide who agreed
or strongly agreed with the following statements about bullying. Note: Low scores are good.
Table 56. Bullying: Percent of Students Who Agreed or Strongly Agreed
At this program… Your grantee Statewide
Your grantee compared to
state
At this program, other kids make fun of me for things I do. 29% 24% High
At this program, I feel left out. 18% 15% High
I feel pressured by other kids to do things I don’t want to do. 27% 21% High
I feel like I don’t belong. 18% 16% Average
there are cliques (groups of kids who stick together and leave other kids out).
44% 38% High
Kids at this program have made inappropriate sexual comments, jokes, or gestures.
36% 32% Average
I was discriminated against because of my gender, race, ethnicity, disability, or sexual orientation.
16% 13% High
Note. Data are presented if available for at least 15 students. From student survey. N = 289.
3.2.4. STUDENTS REPORT FEW PROGRAM MANAGEMENT PROBLEMS
The table below lists the percent of 4th- to 12
th-grade students at this grantee and statewide who agreed
or strongly agreed with the following statements about program management problems. Note: Low scores are good.
Table 57. Program Management Problems: Percent of Students Who Agreed or Strongly Agreed
At this program… Your grantee Statewide
Your grantee compared to
state
Staff punish kids without finding out what really happened. 33% 27% High
Things get out of control. 37% 31% Average
Kids have to wait around a lot. 34% 27% High
Staff yell a lot. 26% 29% Average
Note. Data are presented if available for at least 15 students. From student survey. N = 289.

45
Van Egeren, L. A., Wu, H-C., Yang, N-K & Michigan 21st CCLC State Evaluation Team.
(2012). Michigan 21st Century Community Learning Centers Grantee Annual Data Tables.
Michigan State University, East Lansing, MI.
3.2.5. PROGRAM SATISFACTION
The table below lists the percent of 4th- to 12th-grade students at this grantee and statewide who agreed or strongly agreed with the following statements about the program. This table is not part of the Leading Indicators, but is available for program improvement purposes.
Table 58. Program Satisfaction: Percent of Students Who Agreed or Strongly Agreed
Survey item At Your grantee Statewide
Your grantee compared to
state
At this program, I feel safe. 85% 88% Average
I miss being at this program when I don't come. 70% 71% Average
I have fun when I'm at this program. 89% 87% Average
I really like coming to this program. 83% 84% Average
Note. Data are presented if available for at least 15 students. From student survey. N = 289.
3.2.6. GRADE THAT PARENTS GAVE PROGRAM
The table below lists the percent of parents at this grantee and statewide who gave their child’s program a grade of A, B, C, D or F. This table is not part of the Leading Indicators, but is available for program improvement purposes.
Table 59. Percent of Parents by Grade They Gave Program
Grade Your grantee Statewide
Your grantee compared to
state
A Excellent 70% 64% High
B Good 24% 30% Low
C Fair 5% 6% Average
D /F Unsatisfactory or F Failing 1% 1% High
Note. Data are presented if available for at least 15 parents. From parent survey. N = 308.

46
Van Egeren, L. A., Wu, H-C., Yang, N-K & Michigan 21st CCLC State Evaluation Team.
(2012). Michigan 21st Century Community Learning Centers Grantee Annual Data Tables.
Michigan State University, East Lansing, MI.
3.3. LEADING INDICATOR: COMMUNITY PARTNERSHIPS
Indicator Description: Program has relationships with community partners that contribute to sustainability and quality.
Co-funded student opportunities (from ARF survey; not presented here)
Advisory committee represents multiple stakeholder groups (from ARF survey; not presented here)
In-kind contributions (from ARF survey; not presented here)
3.4. LEADING INDICATOR: FAMILY COMMUNICATION
Indicator Description: Family members are informed about their child and about opportunities for involvement.
The specific measures for the indicator Family Communication are:
Staff report of program communication with parents (3.4.1)
Parent report of program communication with parents (3.4.2)
3.4.1. STAFF REPORT OF PROGRAM COMMUNICATION WITH PARENTS
The table below lists the percent of staff at this grantee and statewide who communicate with parents at least three to five times per year.
Table 60. Parent Communication: Percent of Staff Who Reported At Least 3 to 5 Times Per Year
How often do you or other staff… Your grantee Statewide
Your grantee compared to
state
Send materials about program offerings home to parents. 76% 71% Average
Send information home about how the student is progressing in the program.
63% 54% Average
Hold events or meetings to which parents are invited. 68% 60% Average
Have conversations with parents over the phone. 82% 64% High
Meet with a student’s parents to talk about the student’s progress.
58% 56% Average
Ask for input from parents on what and how activities should be provided.
44% 46% Average
Note. Data are presented if available for at least 3 regular staff. From staff survey. N = 50.

47
Van Egeren, L. A., Wu, H-C., Yang, N-K & Michigan 21st CCLC State Evaluation Team.
(2012). Michigan 21st Century Community Learning Centers Grantee Annual Data Tables.
Michigan State University, East Lansing, MI.
3.4.2. PARENT REPORT OF PROGRAM COMMUNICATION WITH PARENTS
The table below lists the percent of parents at this grantee and statewide who agreed or strongly agreed with the following statements about the program’s communication and family involvement opportunities.
Table 61. Parent Communication: Percent of Parents Who Agreed or Strongly Agreed
Survey item Your grantee Statewide
Your grantee compared to
state
The program informs me about family events that I can go to. 97% 92% High
Staff keep me informed about how my child is doing. 90% 89% Average
I attend family events at this program. 82% 77% Average
Note. Data are presented if available for at least 15 parents. From parent survey. N= 308.

48
Van Egeren, L. A., Wu, H-C., Yang, N-K & Michigan 21st CCLC State Evaluation Team.
(2012). Michigan 21st Century Community Learning Centers Grantee Annual Data Tables.
Michigan State University, East Lansing, MI.
Domain 4. STUDENT OUTCOMES
Student outcomes are not part of the Leading Indicators, which focus on program components that are likely to characterize a high-quality program. The assumption is that positive student outcomes result from a high-quality program. Data on student outcomes are presented here to let you see whether your grantee is meeting the goals you have set for student outcomes and where the program stands in regard to federal targets. Please note that federal targets have not been updated for a number of years. For that reason, we include the target areas (e.g., improvement in grades), but no specific target numbers.
4.1. IMPROVEMENT IN GRADES
4.1.1. ALL REGULAR STUDENTS (FEDERAL TARGET)
The table below shows the percent of ALL students who attended at least 30 days who improved at least one-half grade in reading or math grades from fall to spring for your grantee and statewide.
Table 62. Grade Improvement: Percent of All Regular Students Who Improved
Outcome Your grantee Statewide
Your grantee compared to
state
Reading/English grades 41% 31% High
Math grades 33% 31% Average
Note. Data are presented if available for at least 15 regular students (attended at least 30 days). From school outcomes data. Reading N = 622, math N = 578.
4.1.2. REGULAR STUDENTS WITH ROOM FOR IMPROVEMENT
The table below shows the percent of students who attended at least 30 days who had room for improvement and improved at least one-half grade in reading or math grades fall to spring for your grantee and statewide.
Table 63. Grade Improvement: Percent of Students with Room for Improvement Who Improved
Outcome Your grantee Statewide
Grantee compared to
state
Reading/English grades 49% 40% High
Math grades 41% 41% Average
Note. Data are presented if available for at least 15 regular students (attended at least 30 days) who had fall grades of below 3.0. From school outcomes data. Reading N = 506, math N = 446.

49
Van Egeren, L. A., Wu, H-C., Yang, N-K & Michigan 21st CCLC State Evaluation Team.
(2012). Michigan 21st Century Community Learning Centers Grantee Annual Data Tables.
Michigan State University, East Lansing, MI.
4.1.3. REGULAR STUDENTS COMPARED TO NON-REGULAR STUDENTS
The table below shows improvement in grades for students who attended at least 30 days compared to students who attended less than 30 days. This includes only students who had room for change.
If your program might have had an impact on reading and math grades:
More regular students should have improved than non-regular students.
Fewer regular students should show no change or a decline than non-regular students
Table 64. Reading Grades: Percent of Regular and Non-Regular Students with Room for Improvement Who Improved
Outcome Regular students Non-regular students Regular compared to non-regular students
Improved 49% 41% High
No change 26% 20% High
Declined 25% 39% Very low
Note. Data are presented if available for at least 15 students who had fall grades of below 3.0 in each group. From school outcomes data. Regulars N = 506, non-regulars N = 82.
Table 65. Math Grades: Percent of Regular and Non-Regular Students With Room for Improvement Who Improved
Outcome Regular students Non-regular students Regular compared to non-regular students
Improved 41% 32% Very high
No change 26% 26% Average
Declined 33% 42% Very low
Note. Data are presented if available for at least 15 students who had fall grades of below 3.0 in each group. From school outcomes data. Regulars N = 446, non-regulars N = 78.
4.2. TEACHER RATINGS
4.2.1. FEDERAL TARGETS
The table below shows the percent of regular students whose teachers said students improved at all in the classroom.
Table 66. Teacher Ratings: Percent of Regular Students Who Improved
Outcome Your grantee Statewide
Your grantee compared to
state
Teacher ratings, behavior 76% 74% Average
Teacher ratings, homework and classroom participation 77% 73% Average
Note. Data are presented if available for at least 15 regular students (attended at least 30 days) who initially had room for improvement. From teacher survey. N = 572.

50
Van Egeren, L. A., Wu, H-C., Yang, N-K & Michigan 21st CCLC State Evaluation Team.
(2012). Michigan 21st Century Community Learning Centers Grantee Annual Data Tables.
Michigan State University, East Lansing, MI.
4.2.2. BEHAVIORS
The table below shows the percent of regular students whose teachers said they improved at all for each type of classroom behavior.
Table 67. Teacher Ratings: Percent of Regular Students Who Improved (Items)
Outcome Your grantee Statewide
Grantee compared to
state
Turning in homework on time. 68% 64% Average
Completing homework to your satisfaction. 72% 66% High
Participating in class. 61% 65% Average
Volunteering. 39% 48% Low
Attending class regularly. 37% 43% Average
Being attentive in class. 54% 58% Average
Behaving well in class. 45% 53% Low
Academic performance. 68% 68% Average
Coming to school motivated to learn. 55% 58% Average
Getting along well with other students. 52% 54% Average
Note. Data are presented if available for at least 15 regular students (attended at least 30 days) who initially had room for improvement. From teacher survey. N = 572.

51
Van Egeren, L. A., Wu, H-C., Yang, N-K & Michigan 21st CCLC State Evaluation Team.
(2012). Michigan 21st Century Community Learning Centers Grantee Annual Data Tables.
Michigan State University, East Lansing, MI.
4.3. PARTICIPANT PERCEPTIONS OF PROGRAM IMPACT
4.3.1. STUDENT PERCEPTIONS
Students were asked to rate how the program helped them improve in various areas. The ratings were from “Not at all” to “I was already great at this.” The table below shows the percent of students who perceived the program helped them improve “some or a lot” in the targeted academic and non-academic areas.Your grantee may not offer activities that would be expected to make a difference in all of these areas. In that case, improvement would be expected to be low.
Table 68. Student Perceptions of Program Impact: Percent Who Reported Reported the Program Helped Some or a Lot
Outcome Your grantee Statewide
Your grantee compared to
state
ACADEMIC AREAS
Reading, English, language arts, writing. 70% 66% High
Math. 73% 67% High
Science/technology 65% 62% Average
Other school subjects (science, social studies). 67% 62% High
NON-ACADEMIC AREAS
Sports, athletic, physical activities. 72% 66% Average
Working with computers/internet 64% 64% Average
Creative skills, like art, music, dance, drama. 69% 65% Average
Staying away from drugs and alcohol. 67% 69% Average
Making and keeping friends. 72% 69% Average
Note. Data are presented if available for at least 15 students who initially had room for improvement. From student survey. N = 289.
Students were asked to rate to what extent the program changed their feelings about school. The ratings were from “Not at all” to “I already did this a lot.” The table below shows the percent of students who believed the program helped change their perception of school commitment “some or a lot”.
Table 69. Student Perceptions of Program Impact on School Commitment: Percent Who Reported Reported the Program Helped Some or a Lot
Outcome Your grantee Statewide
Your grantee compared to
state
Care more about getting good grades. 78% 75% Average
Think that success in school would help you have a good life when you grow up.
81% 79% Average
Look forward to coming to school more because of this program.
67% 69% Average
Because of this program, I have more interest in going to college.
75% 72% Average
Because of this program, I think that doing well in school is important for having a successful career.
82% 80% Average
Note. Data are presented if available for at least 15 students. From student survey. N = 289.

52
Van Egeren, L. A., Wu, H-C., Yang, N-K & Michigan 21st CCLC State Evaluation Team.
(2012). Michigan 21st Century Community Learning Centers Grantee Annual Data Tables.
Michigan State University, East Lansing, MI.
Students were asked to rate to what extent the program helped them with getting healthy food or learning about nutrition. The table below shows the percent of students who “agreed or strongly agreed” that the program helped them in the area of health and nutrition.
Table 70. Healthy Food: Percent of Students Who Agreed or Strongly Agreed
At this program… At your grantee Statewide
Your grantee compared to
state
I eat fruits and vegetables at this program. 82% 78% Average
This program teaches me what healthy foods are. 82% 72% High
This program teaches me how to read nutrition facts on food packages.
60% 58% Average
This program teaches me that what I eat matters for my health.
83% 72% Very high
I get to learn how to make healthy food at this program. 74% 66% High
Note. Data are presented if available for at least 15 students. From student survey. N = 289.
Students were asked to rate to what extent the program helped them become physically active. The table below shows the percent of students who “agreed or strongly agreed” that the program helped them with physical activity.
TABLE 71. Physical Activities: Percent of Students Who Agreed or Strongly Agreed
At this program… At your grantee Statewide
Your grantee compared to
state
The physical activities at this program are interesting and fun. 85% 85% Average
I get to do physical activities at this program that I wouldn't get to do otherwise.
74% 69% Average
This program teaches me how to be physically active to improve my health.
87% 78% High
I don't get to do enough physical activity at this program, reversed (the higher the better)
64% 62% Average
Note. Data are presented if available for at least 15 students. From student survey. N = 289.
Students were asked to rate to what extent the program allowed them to build prosocial skills. The table below shows the percent of students who rated that the program allowed “some or a lot” of those types of experiences.
Table 72. Prosocial Skills: Percent of Students Who Reported the Program Helped Some or a Lot
At this program… At your grantee Statewide
Your grantee compared to
state
Learned about helping others. 72% 72% Average
I was able to change my school or community for the better. 59% 57% Average
Learned to stand up for something I believed was morally right.
73% 69% Average
We discussed morals and values. 59% 59% Average
Note. Data are presented if available for at least 15 students. From student survey. N = 289.

53
Van Egeren, L. A., Wu, H-C., Yang, N-K & Michigan 21st CCLC State Evaluation Team.
(2012). Michigan 21st Century Community Learning Centers Grantee Annual Data Tables.
Michigan State University, East Lansing, MI.
Students were asked to rate to what extent the program helped them build teamwork. The table below shows the percent of students who rated that the program allowed “some or a lot” of those types of experiences.
Table 73. Teamwork: Percent of Students Who Reported the Program Helped Some or a Lot
At this program… At your grantee Statewide
Your grantee compared to
state
Learned that working together requires some compromising. 77% 71% High
Became better at sharing responsibility. 73% 71% Average
Learned to be patient with other group members. 74% 74% Average
Learned how my emotions and attitude affect others in the group.
68% 68% Average
Learned that it is not necessary to like people in order to work with them.
69% 67% Average
Note. Data are presented if available for at least 15 students. From student survey. N = 289.
Students were asked to rate to what extent the program allowed them to build leadership skills. The table below shows the percent of students who rated that the program allowed “some or a lot” of those types of experiences.
Table 74. Leadership: Percent of Students Who Reported the Program Helped Some or a Lot
At this program… At your grantee Statewide
Your grantee compared to
state
Learned about the challenges of being a leader. 70% 67% Average
Others in this program counted on me. 67% 64% Average
Had an opportunity to be in charge of a group of peers. 50% 58% Low
Note. Data are presented if available for at least 15 students. From student survey. N = 289.
Students were asked to rate to what extent the program promoted their social-emotional learning. The table below shows the percent of students who rated that the program allowed “some or a lot” of those types of experiences.
Table 75. Social-emotional Learning: Percent of Students Who Reported the Program Helped Some or a Lot
At this program… At your grantee Statewide
Your grantee compared to
state
Learned about controlling my temper. 60% 53% High
Became better at dealing with fear and anxiety. 60% 54% High
Became better at handling stress. 57% 55% Average
Learned that my emotions affect how I perform. 65% 63% Average
Note. Data are presented if available for at least 15 students. From student survey. N = 289.

54
Van Egeren, L. A., Wu, H-C., Yang, N-K & Michigan 21st CCLC State Evaluation Team.
(2012). Michigan 21st Century Community Learning Centers Grantee Annual Data Tables.
Michigan State University, East Lansing, MI.
4.3.2. PARENT PERCEPTIONS
Parents were asked to rate how the program helped their child improve in various areas. The ratings were from “Not at all” to “My child was already great at this.” The table below shows the percent of parents who perceived the program helped their child improve “some or a lot” in the targeted academic and non-academic areas. Your program may not offer activities that would be expected to make a difference in all of these areas. In that case, improvement would be expected to be low.
Table 76. Parent Perceptions of Program Impact: Percent of Parents Reporting Some or a Lot of Student Improvement
Outcome Your grantee Statewide
Grantee compared to
state
ACADEMIC AREAS
Reading, English, language arts, writing. 92% 87% High
Math. 93% 86% High
Science/technology. 87% 82% High
Other school subjects (science, social studies). 87% 81% High
HELP WITH SCHOOL PERFORMANCE
Get better grades. 94% 89% High
Complete homework. 94% 90% High
ACADEMIC ENGAGEMENT
Because of this program, my child cares more about getting good grades.
93% 87% High
Because of this program, my child thinks that success in school will help them have a good life when they grow up.
91% 88% Average
My child looks forward to coming to school more because of this program.
91% 87% Average
Because of this program, my child is more interested in going to college.
80% 78% Average
Because of this program, my child thinks that doing well in school is important for having a successful career.
88% 85% Average
NON-ACADEMIC AREAS
Sports, athletic, physical activities. 90% 82% High
Working with computers/internet 89% 83% High
Creative skills, like art, music, dance, drama. 89% 86% Average
Staying away from drugs and alcohol. 89% 85% High
Making and keeping friends. 93% 91% High
Note. Data are presented if available for at least 15 parents whose child initially had room for improvement. From parent survey. N = 308.