Michigan 21st Century Community Learning … 21st Century Community Learning Centers Evaluation...
36
Michigan 21st Century Community Learning Centers Evaluation 2015-2016 Annual Report Heng-Chieh Jamie Wu, Ph.D. Laurie A. Van Egeren, Ph.D. The MSU Evaluation Team Community Evaluation and Research Collaborative University Outreach and Engagement Michigan State University March 2017
Transcript of Michigan 21st Century Community Learning … 21st Century Community Learning Centers Evaluation...

Michigan 21st Century Community Learning Centers Evaluation 2015-2016 Annual Report
Heng-Chieh Jamie Wu, Ph.D. Laurie A. Van Egeren, Ph.D. The MSU Evaluation Team Community Evaluation and Research Collaborative University Outreach and Engagement Michigan State University
March 2017

Copies of this report are available from: University Outreach and Engagement Michigan State University Kellogg Center 219 S. Harrison Rd., Rm. 93 East Lansing, Michigan 48824-1022 Phone: (517) 353-8977 Fax: (517) 432-9541 E-mail: [email protected] Web: outreach.msu.edu © 2017 Michigan State University. All rights reserved The views expressed are solely those of the authors. For more information about this report, contact Jamie Wu at the above address or phone number, or email to: [email protected]
Suggested citation: Wu, H. J., Van Egeren, L. A., & the MSU Evaluation Team (2017). Michigan 21st Century Community Learning Centers Evaluation: 2015-2016 Annual Report. East Lansing: Michigan State University.
Funding This report was supported in part by a grant from the Michigan Department of Education and University Outreach and Engagement, Michigan State University. Michigan State University is an affirmative-action, equal-opportunity employer.

Contents Highlights for the 2015-2016 Program Year ............................................................ 1 Introduction .......................................................................................................... 4 Who Participates in the Program? ......................................................................... 5
Grantees ..................................................................................................................................... 5 Participating Students .............................................................................................................. 6 Parents’ Reasons for Enrolling Their Children......................................................................... 9 Sustaining Participation of Students with Low Academic Performance ................................. 10
What Are Students Doing in the Program? ........................................................... 12 Academics ................................................................................................................................ 12 Student Engagement in the Program ...................................................................................... 16
How is the 21st CCLC Program Connected to the School Day? ............................... 19 What School or Program Factors Affected the Program? ...................................... 21
Project Director and Site Coordinator Stability ....................................................................... 21 Staff Stability ............................................................................................................................ 21
How Did Students’ Academic Performance Change? ............................................. 23 Grades ..................................................................................................................................... 23 Teacher Ratings ...................................................................................................................... 26 Student and Parent Perceptions of Program Impact ............................................................... 27
Curriculum Use and Staff Trainings Around Key Topics ...................................... 29 STEM ...................................................................................................................................... 30 Social-Emotional Learning (SEL) ........................................................................................... 30 Youth Leadership ..................................................................................................................... 31 Risk Prevention ....................................................................................................................... 32

List of Tables Table 1. Characteristics of Grantees Funded, 2012-2016 ............................................................... 6 Table 2. Parents’ Reasons for Enrollment by Grade Level: Percent who Reported “Very Important” ...................................................................................................................................... 9 Table 3. Percent of Students with Sustained Participation ........................................................... 11 Table 4. Percent of Students who Participated in Each Type of Academic Activity ...................... 12 Table 5. Percent of Sites Requiring Various Levels of Participation in Academic Activities ....... 13 Table 6. Students’ Perceptions of the Quality of the Academic Support Provided by Their 21st CCLC program ............................................................................................................................... 14 Table 7. Types of Activities Offered by Program Sites ................................................................... 15 Table 8. Percent of Students who Participated in Each Type of Enrichment Activity .................. 15 Table 9. Percent of Staff Reporting that Each Area is a Top Program Priority (First or Second Priority) .......................................................................................................................................... 16 Table 10. Opportunities for Choice, Decision-Making, and Governance: Percent of Students who Agreed or Strongly Agreed ........................................................................................................ 17 Table 11. Skill-Building and Mastery Orientation: Percent of Students who Agreed or Strongly Agreed ....................................................................................................................................... 17 Table 12. Engagement: Percent of Students who Agreed or Strongly Agreed ......................... 18 Table 13. Formal Policies for Connecting with the School Day: Percent of Sites Selecting Each Policy Option.................................................................................................................................. 19 Table 14. Staff Stability: Percent of Sites ...................................................................................... 22 Table 15. Percent of Sites Reporting School-Related Changes ..................................................... 22 Table 16. Student and Parent Perceptions of Program Impact: Percent who Reported the Program Helped “Some” or “A Lot” .............................................................................................. 28
List of Figures Figure 1. Percent of New and Returning Students ......................................................................... 8 Figure 2. Race of Student Participants ........................................................................................... 9 Figure 3. Percent Showing Improvement in Math Grades (2009-2016) ..................................... 24 Figure 4. Percent Showing Improvement in Math Grades for All Students vs. Students with Room for Improvement (2009-2016) .......................................................................................... 24 Figure 5. Percent Showing Improvement in Reading Grades (2009-2016) ................................. 25 Figure 6. Percent Showing Improvement in Reading Grades for All Students vs. Those with Room for Improvement (2009-2016) .......................................................................................... 25 Figure 7. Percent Showing Improvement in Teacher-Reported Homework Completion and Classroom Participation (2009-2016) .......................................................................................... 26 Figure 8. Percent Showing Improvement in Teacher-Reported Classroom Behavior (2009-2016) ............................................................................................................................................. 27

1
Highlights for the 2015-2016 Program Year
Michigan 21st Century Community Learning Centers (21st CCLCs)
served diverse groups of primarily low-income and low-performing
students.
Michigan 21st CCLC afterschool programs provide academic learning and
enrichment activities such as sports, arts, youth development, technology, and
health/nutrition education to youth who often do not have access to such
experiences (Afterschool Alliance, 2016).1 In 2015-16, 26,623 youth participated
in 21st CCLC programs, 80% of whom qualified for free/reduced price meals and
71% of whom were academically low performing. Enrollments were evenly
distributed across gender, with about one-third returning students and two-
thirds new participants. The majority (71%) of students participated for more
than 30 days throughout the school year.
Programs were successful in sustaining participation of both low-
performing and other students.
• Almost two-thirds (70%) of low-performing students and 76% of other
students attended at least 30 days.
• More than half of low-performing students attended at least 60 days, and
over one-third attended 90 days or more.
Students were very satisfied with the learning opportunities at the
program, but fewer mentioned that they had opportunities for
making decisions about the overall program or the activities they
participated in.
1 Afterschool Alliance (2016). Afterschool fostering student success in Michigan. Washington, D.C.: The Afterschool Alliance. http://www.afterschoolalliance.org/documents/MI-afterschool-facts.pdf

2
Students at all grade levels surveyed (4th-12th grade) expressed a high degree of
satisfaction with their learning experiences at the afterschool programs:
• 85-90% thought the program helped them develop mastery and build new
skills.
• 80-89% said programs helped them with schoolwork, provided them with
opportunities to learn in a fun way, and improved their attitudes about
school and their academic performance.
• 50%-68% expressed that they had opportunities to choose their activities,
make decisions about projects or the overall program, or participate in a
youth advisory committee.
Programs offered a wide variety of enrichment activities but
participation rates varied.
• Most students participated in sports, recreation, youth development, and
arts activities.
• Although offerings around STEM are continuously increasing, far fewer
students participated in technology activities compared to other types of
STEM activities.
• Very few students participated in health/nutrition activities; since schools
offer little in the way of health education, afterschool programs have the
opportunity to encourage participation in this area.
Turnover of program staff remains relatively high from year to year.
• Within the 2015-16 program year, almost half (45%) of the program sites
reported difficulty in maintaining a good staff retention rate (defined here
as retaining over 75% of staff during the year), and a quarter of them
(26%) lost more than half of the staff.
• Sites varied in their capacity to retain staff over the years. Approximately
40% of the sites reported that most of their staff were from the previous

3
year, while another 40% reported that more than half of their staff were
new this year, and 20% reported having ¼ of the staff being new.
• Despite the fact that some geographic locations of programs make it
easier to recruit and retain staff, programs that were successful in
retaining program staff were often the ones that offered salaries
comparable to school-day staff with reasonable yearly increases and that
maintained a healthy pipeline for staff’s professional growth.
Curriculum use and staff trainings around STEM, social-emotional
learning (SEL), youth leadership, and risk prevention varied.
• Staff have gained familiarity with the concept of social-emotional
learning; many received more than one training in 2015-16.
• A bit less than half of the staff used SEL and STEM curricula when
working with youth.
• Trainings and curriculum use on youth leadership and risk prevention
were less utilized, suggesting a need for support, especially for programs
working with at-risk populations.

4
Introduction The Michigan Department of Education website2 describes the 21st CCLC
program as follows:
The 21st Century Community Learning Centers (21st CCLC) Grant Program’s focus is to provide expanded academic enrichment opportunities for children attending low-performing schools. Tutorial services and academic enrichment activities are designed to help students meet local and state academic standards in subjects such as reading and math. In addition, 21st CCLC programs provide youth development activities, drug and violence prevention programs, technology education programs, art, music and recreation programs, counseling, and character education to enhance the academic component of the program.
This report describes the organizations that received grants, the organizations
that operated the program sites, and the types of activities that program sites
provided. It also describes who participated in the program, the types of activities
they took part in, and the outcomes that program participants have achieved.
Following the same approach used in previous years, the 2015-2016 Annual
Report continues the use of the leading indicators (with the symbol ) to
highlight program-level quality characteristics that are known from research and
practice to affect student development. Although these quality measures are
important to creating a context for overall development, they are not necessarily
directly related to academic improvement.
Curriculum use and trainings are key to program quality and staff efficiency in
preparing for activities. The last section of this report presents statewide data on
staff participation in professional development trainings and curricula use
around the following key topics: STEM, social-emotional learning (SEL), positive
youth development and risk prevention. Implications are provided for program
improvement purposes.
2 http://www.michigan.gov/mde/0,4615,7-140-6530_6809-39974--,00.html

5
Who Participates in the Program?
Participation in the 21st Century Community Learning Centers (CCLC) program
statewide is influenced by both the types of programs that receive grants
(grantees) and the characteristics of students that they recruit into their
respective programs. The Michigan Department of Education (MDE) provides
guidelines for entities applying for 21st CCLC grants, specifying: (1) types of
organizations that may apply (such as public schools, charter schools, community
organizations); (2) program factors that may qualify for priority points (such as
serving a school eligible for Title I school-wide funding, serving students in 6th-
8th grades, or having a faith-based organization as a partner); and (3) status of
students and families served by the program (such as eligibility for free/reduced
price meals and/or living in poverty). Priority is given to programs serving low-
performing schools in high-poverty areas. For details about priority points
relevant to grantees who participated in 2015-16, contact Michigan Department
of Education 21st CCLC consultants.
Grantees Table 1 shows an overview of grantees over the past four years. In the 2015-16
program year, 73 grants were awarded to 35 grantees who oversaw 278 sites.
Among the 278 sites, 275 operated during the school year and completed the
Annual Report Form. This year, there were no new grantees. The largest number
of grants were administered by local school districts (15), followed by
nonprofit/community-based organizations (13) and public school academies (4).
Two grants each were administered by intermediate school districts and
universities. This distribution of grantees has remained quite stable over the past
four years. As in past years, the majority of the 21st CCLC grantees served
elementary grades (128) or elementary and middle school combined (25).
Seventy-two served middle school students only, and 7 served both middle and
high school students. The fewest number (45) served high school students.

6
Table 1. Characteristics of Grantees Funded, 2012-2016
Characteristic 2012-13 Grantees
2013-14 Grantees
2014-15 Grantees
2015-16 Grantees
Overall Number of funded grants 89 84 80 73 Number of grantees 44 (49a) 40 (44a) 36 (41a) 35 (40a) Number of new grantees 14 3 0 0 Number of sites reporting on
the Annual Report Form 292 266 275 275
Cohorts D 30 E 89 33 F 157 155 24 G 54 56 53 53 H 69 71 68 I 157 157
Grantees’ fiduciary organizations
Local school district 22 20 16 15 Intermediate school district 2 2 2 2 Public school academy (charter
school) 5 5 4 4
Nonprofit/community-based organization
13 11 12 13
University 2 2 2 2 Sites serving students of different grades or grade combinationsb c
Elementary 135 122 139 128 Middle school 69 76 81 72 High school 60 62 47 45 Elementary and middle school 53 40 29 25 Middle and high school 11 11 8 7 Elementary, middle and high
school 2 2 1 1
a Numbers in parentheses treat the multiple subcontractors that Detroit Public Schools and Grand Rapids Public Schools used to provide their programs as grantees.
b Calculated based on the grades of students served. c Elementary (K-5), Middle school (6-8), High school (9-12).
Participating Students
Gender, Grade Level, and Family Income
In the 2015-16 program year, 26,623 students enrolled in the program. This
number is about 2,700 students fewer than the previous year, but four fewer
7
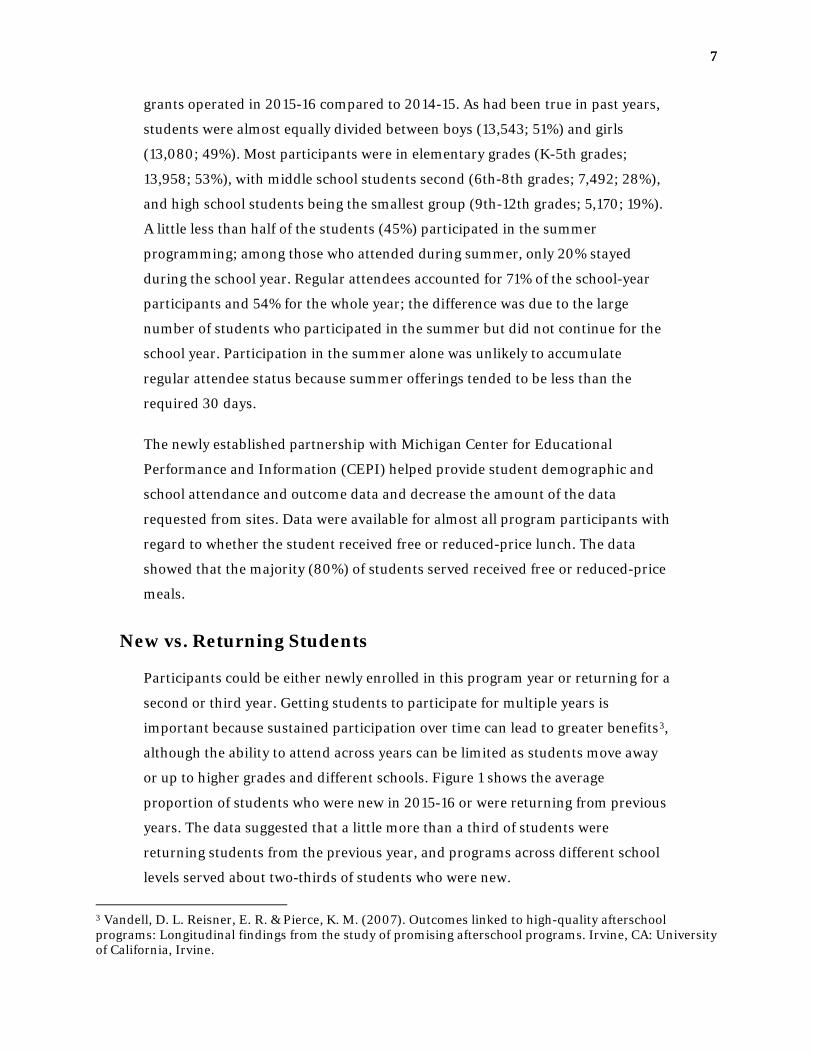
grants operated in 2015-16 compared to 2014-15. As had been true in past years,
students were almost equally divided between boys (13,543; 51%) and girls
(13,080; 49%). Most participants were in elementary grades (K-5th grades;
13,958; 53%), with middle school students second (6th-8th grades; 7,492; 28%),
and high school students being the smallest group (9th-12th grades; 5,170; 19%).
A little less than half of the students (45%) participated in the summer
programming; among those who attended during summer, only 20% stayed
during the school year. Regular attendees accounted for 71% of the school-year
participants and 54% for the whole year; the difference was due to the large
number of students who participated in the summer but did not continue for the
school year. Participation in the summer alone was unlikely to accumulate
regular attendee status because summer offerings tended to be less than the
required 30 days.
The newly established partnership with Michigan Center for Educational
Performance and Information (CEPI) helped provide student demographic and
school attendance and outcome data and decrease the amount of the data
requested from sites. Data were available for almost all program participants with
regard to whether the student received free or reduced-price lunch. The data
showed that the majority (80%) of students served received free or reduced-price
meals.
New vs. Returning Students
Participants could be either newly enrolled in this program year or returning for a
second or third year. Getting students to participate for multiple years is
important because sustained participation over time can lead to greater benefits3,
although the ability to attend across years can be limited as students move away
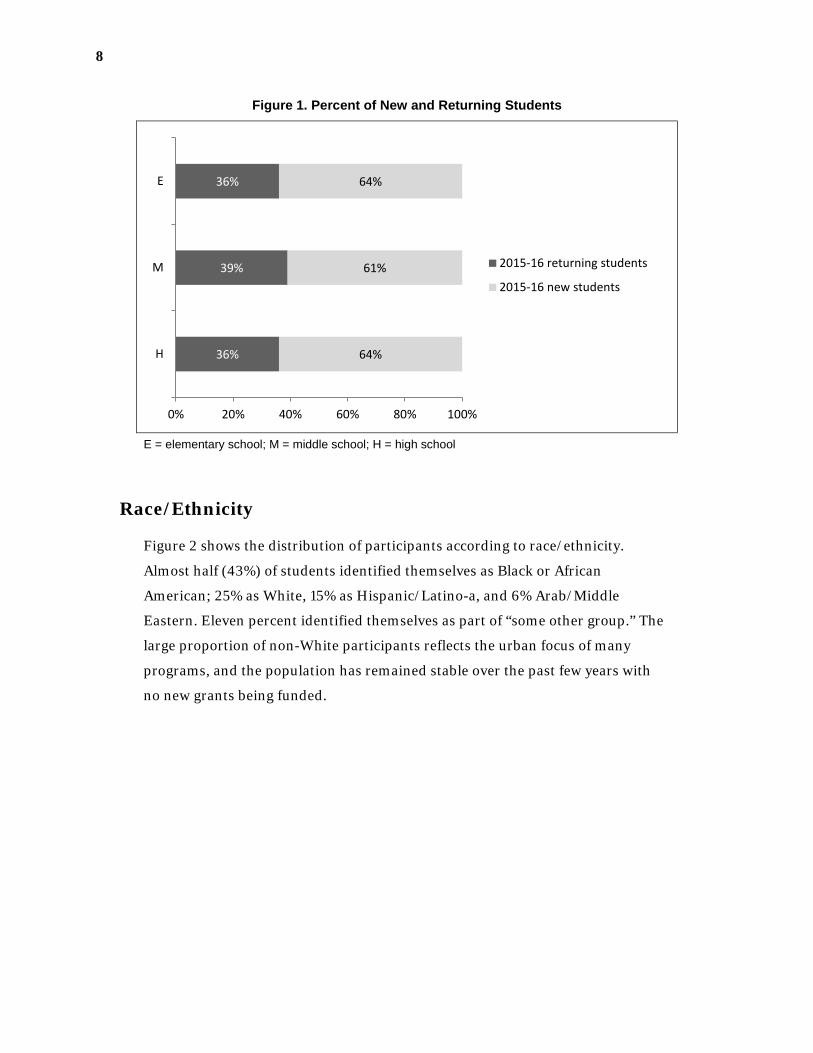
or up to higher grades and different schools. Figure 1 shows the average
proportion of students who were new in 2015-16 or were returning from previous
years. The data suggested that a little more than a third of students were
returning students from the previous year, and programs across different school
levels served about two-thirds of students who were new.
3 Vandell, D. L. Reisner, E. R. & Pierce, K. M. (2007). Outcomes linked to high-quality afterschool programs: Longitudinal findings from the study of promising afterschool programs. Irvine, CA: University of California, Irvine.
8
Figure 1. Percent of New and Returning Students
E = elementary school; M = middle school; H = high school
Race/Ethnicity
Figure 2 shows the distribution of participants according to race/ethnicity.
Almost half (43%) of students identified themselves as Black or African
American; 25% as White, 15% as Hispanic/Latino-a, and 6% Arab/Middle
Eastern. Eleven percent identified themselves as part of “some other group.” The
large proportion of non-White participants reflects the urban focus of many
programs, and the population has remained stable over the past few years with
no new grants being funded.
36%
39%
36%
64%
61%
64%
0% 20% 40% 60% 80% 100%
H
M
E
2015-16 returning students
2015-16 new students

9
Figure 2. Race of Student Participants
Parents’ Reasons for Enrolling Their Children
Parents who completed the end-of-year survey rated the importance they placed
on various reasons for enrolling their child in the program. Table 2 shows the
percent of parents at each grade level who rated each reason as “very important.”
Table 2. Parents’ Reasons for Enrollment by Grade Level:
Percent who Reported “Very Important”
GRADE LEVEL Reason E M H All
It is a safe place for my child after school. 94% 93% 89% 93% I hope it will help my child do better in school. 87% 87% 85% 87% It will help my child stay out of trouble. 81% 80% 83% 81% It provides dependable afterschool care. 82% 76% 72% 80% It provides affordable afterschool care. 77% 71% 72% 75% School staff suggested that my child enroll. 55% 55% 63% 56% My child has a disability or learning problem that this program can help. 48% 47% 56% 49% NOTE: E = elementary school; M = middle school; H = high school.
Other Groups
11%
White25%
Black or African American
43%
Hispanic/Latino-a15%
Arabic/Middle Eastern
6%

10
Reasons for enrolling children in the afterschool program have remained stable
over multiple program years. Most parents at all grade levels enrolled their child
to have a safe place for their child to go after school (93% overall). Most also
thought participation would help the child do better at school (87% overall) and
help their child stay out of trouble (81% overall). The proportion of parents who
considered these reasons important or very important were similar at all grade
levels. About three quarters of the parents also sought dependable and affordable
child care, although these reasons were most important for parents of elementary
school children. Almost half of parents at each grade level enrolled their children
to obtain help for a disability or learning problem; this was especially true for
parents of high school students. This finding suggests that programs may be
serving a substantial number of students with special learning needs.
Sustaining Participation of Students with Low Academic Performance
Students with lower academic performance at the beginning of the school year
were likely to benefit more from the additional academic support offered by 21st
CCLC programs because they had more room for improvement and may need
additional instruction to catch up with their peers. For this report, low academic
performance was defined as either having a GPA of 2.5 or below at the beginning
of the school year or on average over the year.4 Academically low-performing
students accounted for 71% of the total population served in the 2015-16 school
year. Table 3 shows the percent of low-performing students and other students
who attended for 30, 60, and 90 days. This year, programs were successful in
sustaining participation for 30 days, with 70% of low-performing students and
76% of other students attending for at least 30 days. More than half of the low-
performing students (52%) sustained participation over 60 days, and over a third
(37%) attended at least 90 days. Overall, low-performing students tended to
participate less than students who were not struggling academically.
4 There were two exceptions to this definition: (1) Students attending alternative high schools were considered to be academically low-performing regardless of GPA; (2) Students attending schools that did not give letter grades were considered to be low-performing if they received a report of “no credit” as their grade.

11
Table 3. Percent of Students with Sustained Participation
Days of Attendance Low-Performing Students Other Students
30 days 70% 76%
60 days 52% 59%
90 days 37% 43%
NOTE: Students with enough data to determine academic performance level = 16,968; low-performing students = 11,985; other students = 4,983.
12
What Are Students Doing in the Program?
The primary purpose of the 21st CCLC program is to provide opportunities for
academic enrichment to students attending low-performing schools. To enhance
the academic component of the program, grantees must also offer other
enrichment activities in various areas such as youth development, drug and
violence prevention, technology education, the arts, and recreation.
Academics
Participation in Academics
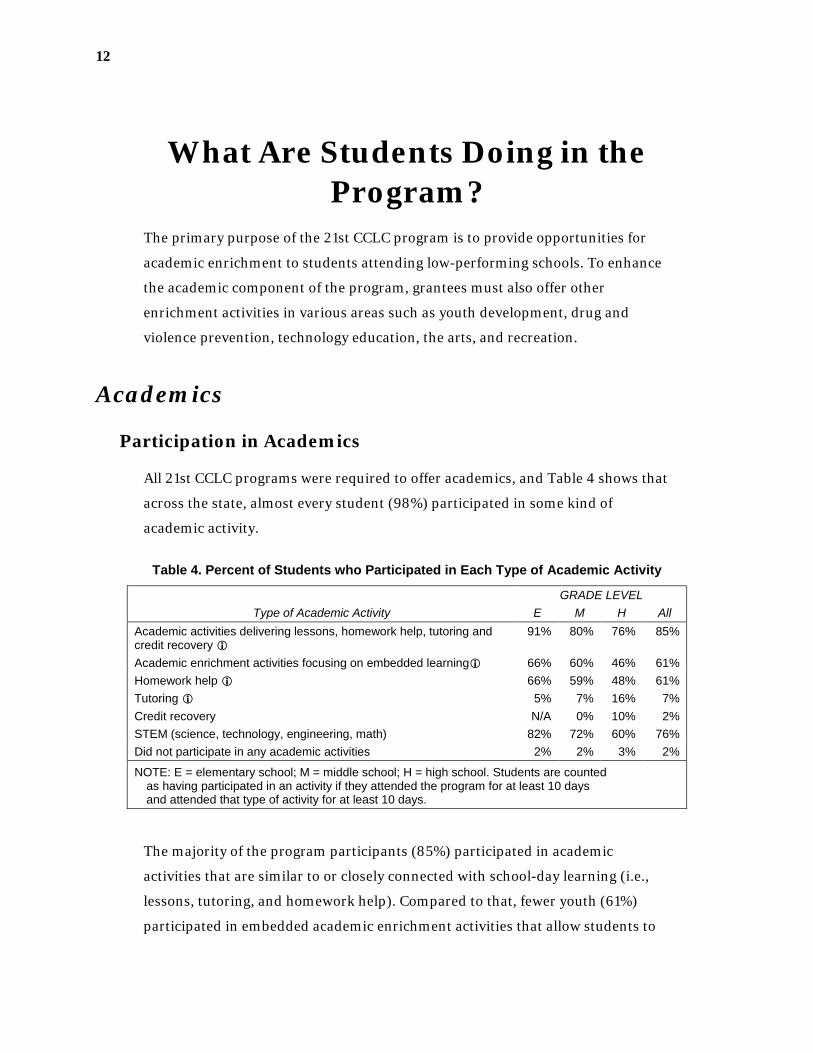
All 21st CCLC programs were required to offer academics, and Table 4 shows that
across the state, almost every student (98%) participated in some kind of
academic activity.
Table 4. Percent of Students who Participated in Each Type of Academic Activity
GRADE LEVEL Type of Academic Activity E M H All
Academic activities delivering lessons, homework help, tutoring and credit recovery
91% 80% 76% 85%
Academic enrichment activities focusing on embedded learning 66% 60% 46% 61% Homework help 66% 59% 48% 61% Tutoring 5% 7% 16% 7% Credit recovery N/A 0% 10% 2% STEM (science, technology, engineering, math) 82% 72% 60% 76% Did not participate in any academic activities 2% 2% 3% 2%
NOTE: E = elementary school; M = middle school; H = high school. Students are counted as having participated in an activity if they attended the program for at least 10 days and attended that type of activity for at least 10 days.
The majority of the program participants (85%) participated in academic
activities that are similar to or closely connected with school-day learning (i.e.,
lessons, tutoring, and homework help). Compared to that, fewer youth (61%)
participated in embedded academic enrichment activities that allow students to

13
learn academic skills through hands-on projects (i.e., science experiments or
creating a news blog) or through non-academic activities (i.e., learning math
through converting recipe measurements for cooking). To transform afterschool
programs from an extended school day/childcare model to an extended and
enriching learning environment, programs are encouraged to provide more
hands-on enrichment activities to enhance students’ academic learning.
In addition, STEM programming (science, technology, engineering and math)
was added as a new academic category in 2011-2012, and the proportion of
students participating has increased from year to year at all grade levels. This
year, 60% of high school students, 72% of middle school students and 82% of
elementary school students participated in STEM activities. The increased
participation reflected the state support and emphasis on STEM learning.
Program Policies for Academics
Table 5 shows program policies reported by administrators regarding participation in
academics. Most program sites (87%) required homework help for all of their students,
and 81% required other activities focused on academics. Seventeen percent required
tutoring for all students and an additional 18% required it for students with low
academic performance. However, 27% did not require tutoring for any student, and 23%
did not offer academic tutoring at all.
Table 5. Percent of Sites Requiring Various Levels of Participation in Academic Activities
Type of Academic Activity
Required for All
Students
Required for Students with Low Academic Performance
Required for Some Other
Group of Students but
not All
Not Required for any Student
Did not Offer
Activities of this Type
Homework help 87% 3% 3% 5% 0% Tutoring (remedial help
for specific academic subjects with no more than 1-3 students/staff)
17% 18% 14% 27% 23%
Other activities where academic learning is the main emphasis
81% 3% 6% 10% 1%
NOTE: Rows may not sum to 100% due to rounding.

14
Student Perceptions of Academic Support
Table 6 shows students’ perceptions of academic support provided by the
afterschool program and how it affected their in-school performance.
Table 6. Students’ Perceptions of the Quality of the Academic Support Provided by Their 21st CCLC program
GRADE LEVEL Item E M H All
This program helps me get my homework done. 90% 90% 89% 90% This program helps me understand what we are doing in class. 79% 78% 85% 80% At this program, I learn school subjects in fun ways. 82% 78% 82% 81% My grades have gotten better because of this program. 74% 75% 82% 76% The school work I do matches the school work we do in regular class. 66% 68% 75% 69%
NOTE: E = elementary school; M = middle school; H = high school.
Students at all grade levels were quite satisfied with the academic support
programs offered. The majority of students at all grade levels thought the
program helped them complete homework, understand classroom material,
improve their grades, and learn in fun ways. High school students were more
likely than elementary or middle school students to say the work they did in the
program matched their school work; they also reported having the most benefit
in almost all aspects of academic support than their younger peers.
Other Enrichment Activities Offered
Program sites varied in the types of activities they offered to students in addition
to academic activities. Table 7 shows the different types of activities offered by
grade level. More than 90% of program sites offered recreation, sports, art, youth
development, and special events. Although less available, technology and
health/nutrition activities were offered by more than half of the programs. The
availability of the various types of the activities suggested that Michigan 21st
CCLC programs provided enriching learning opportunities for disadvantaged
students. It should be noted that in this table, where information was reported at
the site level instead of the student level, those sites crossing elementary, middle,
and/or high school boundaries, such as a K-8 school, were omitted from both the
elementary and the middle school categories but do appear in the All category.

15
Table 7. Types of Activities Offered by Program Sites
GRADE LEVEL E
N=128 M
N=72 H
N=45 All
N=278 Recreation (social events, games, free play, etc.) 94% 90% 91% 90% Sport 95% 93% 84% 93% Art 96% 93% 84% 93% Youth development (character education, conflict
resolution, life skills, resistance skills, etc.) 96% 97% 98% 97%
Special events 95% 92% 98% 94% Technology 65% 71% 71% 68% Health/nutrition 50% 47% 67% 50% NOTE: E = elementary school; M = middle school; H = high school.
Participation in Other Enrichment Activities
Table 8 shows the percent of students at each grade level who participated in
different types of enrichment activities.
Table 8. Percent of Students who Participated in Each Type of Enrichment Activity
GRADE LEVEL Type of Activity E M H All
Recreation 73% 57% 36% 62% Sports 67% 54% 246% 56% Arts 56% 47% 27% 49% Youth development 62% 61% 51% 60% Technology 16% 16% 7% 14% Health/nutrition 8% 4% 1% 6%
NOTE: E = elementary school; M = middle school; H = high school. Students are counted as having participated in an activity if they attended the program for at least 10 days and attended that type of activity for at least 10 days.
More students participated in recreation (62%) than any other type of activity,
followed by youth development (60%), sports (56%) and arts (49%). This is not
surprising, as these activities were offered by the most programs. Fewer high
school students than elementary or middle school students participated in any
type of enrichment activity. Although quite a few sites offered technology
activities, only 7-16% of students at any level actually participated. Very few
students took part in health/nutrition-related activities.

16
Staff Priorities for Programming
Staff priorities for programming are important because they tell us where staff
are likely to focus their efforts. Table 9 shows that improving academic
achievement was most likely to be reported as the top priority, with 57% of staff
indicating it was their first or second priority. About one-third of the staff said
that helping low-performing students achieve grade-level proficiency and
allowing youth to relax, play, and socialize were top program priorities. About
28% thought improving social and emotional development was a high priority.
Table 9. Percent of Staff Reporting that Each Area is a Top Program Priority (First or Second Priority)
Program Area Percent of Staff Improve the academic achievement of youth 57% Enable the lowest-performing students to achieve grade-level
proficiency 32%
Allow youth to relax, play, and socialize 35% Improve the social and emotional development of youth 28% Help youth keep up with homework 14% Engage youth in fun leisure activities otherwise unavailable
to them (i.e., arts, music, fitness, sports, etc.) 13%
Provide opportunities for youth to learn STEM or other academic subjects in a fun way
13%
Student Engagement in the Program
Participation in Decision-Making
To keep students involved in programs, it is important for them to have
opportunities to make developmentally appropriate decisions about their
activities.5 Table 10 shows the percent of participants who said the program
offered them various opportunities for choice and decision making.
About two-thirds of students agreed that the program allowed them to make
choices about their own activities and program activities and that their opinions
matter. About 60% thought they had a voice in program decisions, and half had
5 Akiva, T., Cortina, K. S., & Eccles, J. S. (2012). Youth experience of program involvement: Belonging and cognitive engagement in organized activities. Applied Developmental Psychology, 34, 208-218.

17
participated in a youth advisory committee. As might be expected, students in the
higher grades had more voice in program decisions than did younger students.
Table 10. Opportunities for Choice, Decision-Making, and Governance: Percent of Students who Agreed or Strongly Agreed
Survey Item: At This Program… E M H All I get to decide how to complete some projects or activities. 66% 70% 77% 70% My opinions matter when decisions are made about the program. 63% 71% 81% 70% I get to choose my activities. 53% 65% 81% 64% I help decide what kinds of activities are offered. 56% 66% 76% 64% I am involved in important decisions about this program. 54% 60% 69% 60% I have participated in a youth advisory committee. 50% 50% 53% 51%
Skill Building
It is important to recognize that skill building and mastery are gradual processes
for students as they develop new practices and knowledge. Staff need to be
accomplished at creating an environment where students know that mistakes are
fine because they are learning and that staff will recognize both perseverance and
proficiency. Table 11 shows that most participants thought the programs created
an atmosphere in which students could feel free to build mastery of new skills.
Table 11. Skill-Building and Mastery Orientation: Percent of Students who Agreed or Strongly Agreed
Survey Item: At This Program… E M H All It’s ok to make mistakes as long as you’re learning. 89% 90% 94% 91% Trying hard is very important. 88% 87% 92% 89% How much you improve is really important. 87% 87% 91% 88% It’s important that we really understand the activities that we do. 87% 87% 91% 88% Learning new ideas and concepts is very important. 86% 87% 92% 88% Staff notice when I have done something well. 82% 84% 91% 85%
Sustaining Participation
Finally, being engaged helps sustain student participation (Akiva et al., 2013).6
Table 12 suggests that the majority of students were engaged with the program
6 Akiva, T., Cortina, K. S., & Smith, C. (2014). Involving youth in program decision-making: How common and what might it do for youth? Journal of Youth and Adolescence, 43(11), 1844-1860.

18
through learning new skills, practicing critical thinking, and being exposed to
new opportunities.
Table 12. Engagement: Percent of Students
who Agreed or Strongly Agreed
Survey Item: At This Program… E M H All I get to do things I like to do. 77% 81% 89% 81% The activities challenge me to learn new skills. 79% 79% 85% 81% The activities we do really make me think. 75% 76% 85% 78% I do things that I don’t get to do anywhere else. 65% 68% 77% 69%

19
How is the 21st CCLC Program Connected to the School Day?
To improve students’ school-day performance, the 21st CCLC program must be
formally connected to their school-day classes. Table 13 lists various ways that
the afterschool programs connect to the school day.
Table 13. Formal Policies for Connecting with the School Day: Percent of Sites Selecting Each Policy Option
Percent of Sites
Policy • Site coordinator responsibilities included communicating regularly with
school-day staff about student needs. 96%
• School-day staff (teachers, principal, and counselors) identified and recommended students to come to the afterschool program for academic support.
95%
• The objectives for the afterschool activities were intentionally influenced by grade-level content standards. 82%
• The curricula used during the school day were used as part of the afterschool program’s academic activities. 81%
• Someone was responsible for attending teacher staff meetings at least monthly and reporting back to the afterschool program. 61%
Program staff • Corresponded with school-day teachers at least once per week about
individual students’ academic progress and needs 76%
• Had access to and reviewed students’ grades for each marking period and standardized test scores throughout the year 70%
• Had access to and use of school data systems (one example is Powerschool) that display students’ progress and grades on school-day class work
62%
• Had a process for identifying low-achieving students within one week of their enrollment in the afterschool program 59%
• Had written policies and procedures about connecting with school-day teachers to support students’ academic learning 57%
• Conducted any assessments to monitor students’ academic learning 43% • Used written progress reports to correspond with school-day teachers about
individual students’ academic progress and needs 38%
Almost all program sites (96%) made the site coordinator responsible for
communicating with school-day staff, and 95% accepted recommendations from
school-day staff to enroll students in need of academic support. Most (82%)
reported that their afterschool activities were intentionally influenced by grade-

20
level content standards, and 81% used school-day curricula in afterschool
activities. Most program staff communicated regularly with school-day teachers
about individual students’ needs, and 61% assigned someone to attend teacher
staff meetings. Although staff in a most programs had access to and reviewed
student performance data, only 59% had a process in place to identify low-
achieving students early in the year. Fewer sites reported having written policies
for connecting with school day teachers to support their students’ learning or
using written progress reports to connect with school day teachers about
individual students’ academic progress and needs. These numbers have remained
stable over the past few years.

21
What School or Program Factors Affected the Program?
The context in which the 21st CCLC program operates influences its likelihood of
success. For example, when many changes occur, such as program administrators
or school leaders leaving or excessive turnover among the staff, a positive and
consistent learning environment can be difficult to maintain. In addition, staff
job satisfaction and opportunities for professional development contribute to
staff capacity to create a positive learning environment.
Project Director and Site Coordinator Stability
Project directors. Nine programs out of 40 (23%) grantees changed project
directors during 2015-16 (). Among the four single-site grantees, only one used
the same person as project director and site coordinator. Three grantees (8%)
reported having part-time project directors. Having a full-time project director is
important because frequently the project director needs to make contact with
school personnel and thus needs to be there during the school day.
Site coordinators. Thirty-four percent of the site coordinators did not return
for the 2015-16 program year, and 20% left during the program year ().
Staff Stability Table 14 shows site reports of staff stability. Sites reported on the percent of staff
who stayed for the program year and the percent of staff who returned from the
previous year.
Almost half (45%) of the program sites reported difficulty in maintaining a good
staff retention rate (76-100% same staff) throughout the 2015-16 program year,
and a quarter of them (26%) lost more than half of their staff. Sites varied in their
capacity to retain staff over the year; about 40% of the sites kept most of their

22
staff from the previous year, while another 40% reported that more than half of
their staff were new this year. High turnover is common in afterschool programs.
We have learned from the field that programs that are able to retain more high-
quality staff often offer salaries comparable to school-day staff, with reasonable
yearly increases, and professional development opportunities. Supervisors also
recognize staff contributions, give staff more responsibility to run the programs,
and provide them with opportunities to grow.
Table 14. Staff Stability: Percent of Sites
STAFF RETENTION RATES Staff Changes 0-25% 26-50% 51-75% 76-100%
What percent of your paid REGULAR STAFF who provided activities STAYED for most or all of the 2015-2016 school year?
14% 12% 19% 55%
What percent of this year’s REGULAR STAFF also provided activities last year? (Omits the sites that did not continue)
24% 18% 20% 39%
Sites Reporting School-Related Changes
Changes in the host school can affect awareness of and support for the 21st CCLC
program. As seen in Table 15, in 2015-16 there were few changes at the schools
served by 21st CCLC programs, with the most common change being a new
principal.
Table 15. Percent of Sites Reporting School-Related Changes
Changes Percent of Sites
Principal of the school changed 22% Superintendent changed or established 13% Host school was faced with budget cuts that affected your site 5% School reorganized 2% Program moved to a new school 1% Other major changes at the school or district that affected your program 4%

23
How Did Students’ Academic Performance Change?
We report on students’ academic performance for 21st CCLC programs in the
following categories:
• Percent of students showing improvement in mathematics and English/
language arts/reading grades of at least ½ grade (e.g., 2.5 to 3.0) from fall
to spring
• Percent of students whose teachers reported any improvement in
homework completion and class participation
• Percent of students whose teachers reported any improvement in student
classroom behavior
We also present students’ and parents’ perceptions of how the 21st CCLC
program helped students improve in various aspects of their academic and non-
academic performance and behavior.
Data for this section were collected through the EZReports program reporting
system, Excel files through which sites provided school grades from school
records, and teacher surveys collected by 21st CCLC program staff. Data were not
available on state standardized testing for 2015-16 and are not reported here.
Grades
Math Grades
Overall. Figure 3 shows the percent of participants whose math grades
improved in each year in Michigan (2009-2016). The percent showing
improvement in Michigan has increased in recent years.

24
Figure 3. Percent Showing Improvement in Math Grades (2009-2016)
NOTE: Improvement is defined as ½ grade increase from fall to spring within a year. Includes only students who participated at least 30 days.
Figure 4. Percent Showing Improvement in Math Grades for All Students vs. Students with Room for Improvement (2009-2016)
NOTE: Improvement is defined as ½ grade increase from fall to spring within a year. Includes only students who participated at least 30 days. Room for improvement is defined as having a fall grade below 3.0.
Students with room for improvement. Students who had lower grades
when they entered the program had more room for improvement during the
program year. Figure 3, above, includes all regularly attending students, both
those who started with the highest grades, as well as those who had room to
improve (defined as having a GPA in math of less than 3.0 at the beginning of the
year). When Michigan students with room for improvement were compared with
all Michigan students (Figure 4), a substantially higher percentage (about 15%) of
those with room for improvement showed gains over the past six years.
32%29% 32% 31% 31%
35% 37%
0%
10%
20%
30%
40%
50%
2009-10 2010-11 2011-12 2012-13 2013-14 2014-15 2015-16
Perc
ent s
tude
nts
47%43%
47% 45% 45%49%
52%
32%29%
32% 31% 31%35% 37%
0%
10%
20%
30%
40%
50%
60%
2009-10 2010-11 2011-12 2012-13 2013-14 2014-15 2015-16
Perc
ent s
tude
nts
MI studentswith initialmath GPAbelow 3.0All MIstudents

25
Reading Grades
Overall. Figure 5 shows the percent of participants who improved in reading
grades each year in Michigan (2009-2016). The percent who improved has been
relatively stable during this period, with about one-third showing improvement.
Figure 5. Percent Showing Improvement in Reading Grades (2009-2016)
NOTE: Improvement is defined as ½ grade increase from fall to spring within a year. Includes only students who participated at least 30 days.
Figure 6. Percent Showing Improvement in Reading Grades for All Students vs. Those with Room for Improvement (2009-2016)
NOTE: Improvement is defined as ½ grade increase from fall to spring within a year. Includes only students who participated at least 30 days. Room for improvement is defined as having a fall grade below 3.0.
Students with room for improvement. When we compare the performance
of Michigan regular participants with room for improvement to that of all regular
Michigan participants (Figure 6), a substantially higher percentage (9%-16%) of
31% 31% 30% 31%32% 35% 32%
0%
10%
20%
30%
40%
50%
60%
2009-10 2010-11 2011-12 2012-13 2013-14 2014-15 2015-16
Perc
ent s
tude
nts
45% 45% 44% 40%47% 50% 48%
31% 31% 30% 31% 32% 35% 32%
-10%
0%
10%
20%
30%
40%
50%
60%
2009-10 2010-11 2011-12 2012-13 2013-14 2014-15 2015-16
Perc
ent s
tude
nts
MI studentswith initialreading GPAbelow 3.0All MI students
26
students with room for improvement showed at least a half grade gain in reading
compared to all students over the past six years.
Teacher Ratings Each year, teachers rate participating students who attended at least 30 days on
the extent to which their performance changed over the year in homework
completion/classroom participation and classroom behavior. Teachers may rate
student performance or behavior as improved, unchanged, declined, or did not
need to improve.
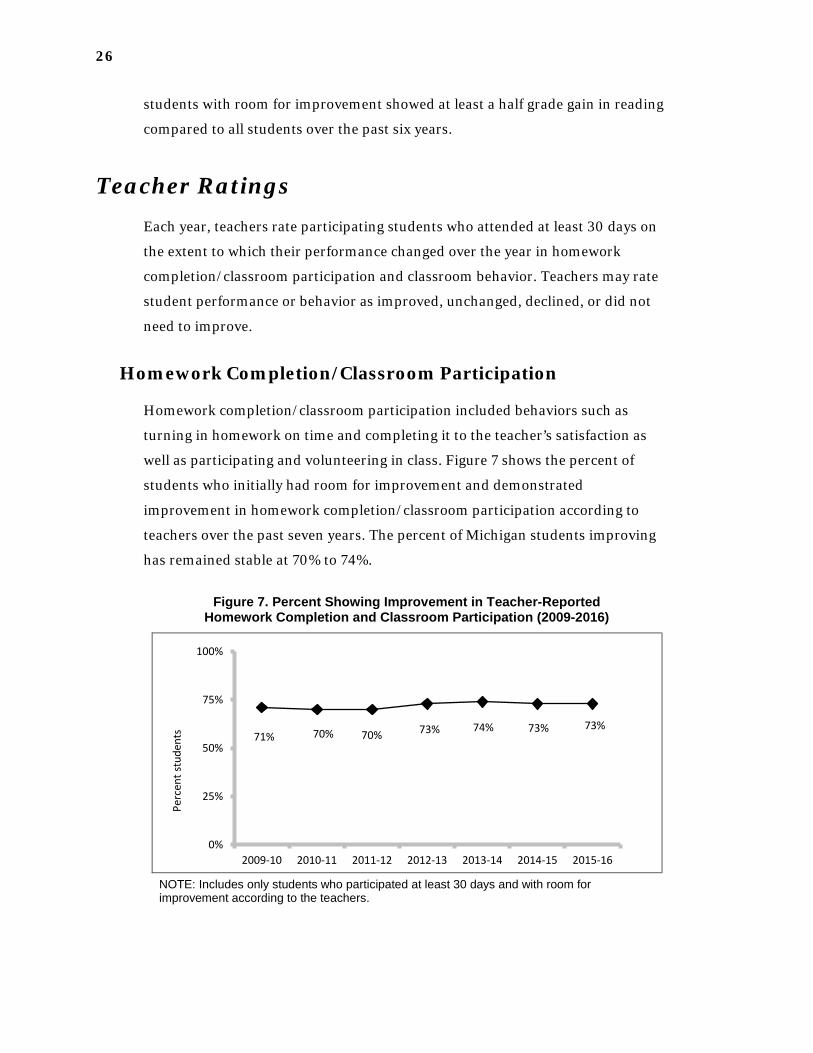
Homework Completion/Classroom Participation
Homework completion/classroom participation included behaviors such as
turning in homework on time and completing it to the teacher’s satisfaction as
well as participating and volunteering in class. Figure 7 shows the percent of
students who initially had room for improvement and demonstrated
improvement in homework completion/classroom participation according to
teachers over the past seven years. The percent of Michigan students improving
has remained stable at 70% to 74%.
Figure 7. Percent Showing Improvement in Teacher-Reported Homework Completion and Classroom Participation (2009-2016)
NOTE: Includes only students who participated at least 30 days and with room for improvement according to the teachers.
71% 70% 70% 73% 74% 73% 73%
0%
25%
50%
75%
100%
2009-10 2010-11 2011-12 2012-13 2013-14 2014-15 2015-16
Perc
ent s
tude
nts

27
Classroom Behavior
Classroom behavior included items such as behaving well in class and getting
along with other students. As shown in Figure 8, the proportion of Michigan
students who showed improvement has remained stable (71-75%). The analysis
only includes students whose teachers indicated they had room for improvement.
Figure 8. Percent Showing Improvement in Teacher-Reported Classroom Behavior (2009-2016)
NOTE: Includes only students who participated at least 30 days and with room for improvement according to the teachers.
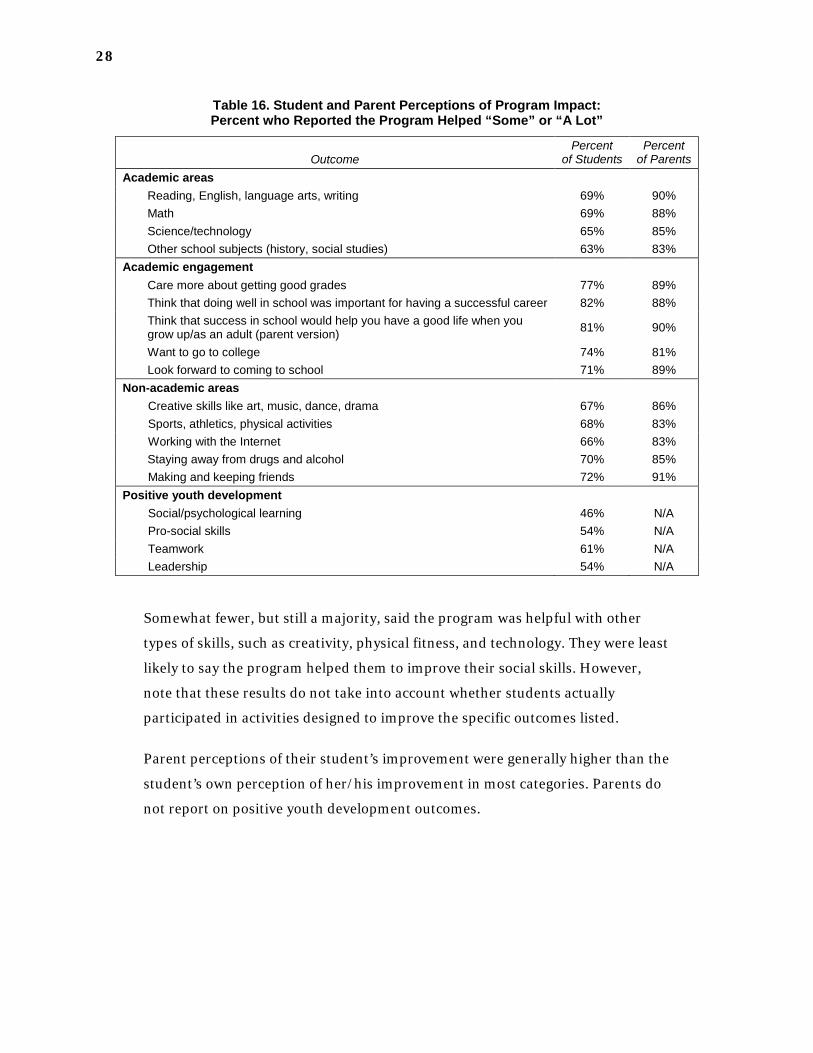
Student and Parent Perceptions of Program Impact
Students and parents reported on their perceptions of whether the 21st CCLC
program helped them/their children improve in various aspects of their academic
and non-academic performance and behavior. Note that Table 16 includes only
results from those students with room for academic improvement. About two-
thirds of students said the program helped them improve in academic areas
including reading and math, science/technology, and other subjects. Large
majorities said the program helped them to perform better academically and
improve their attitudes about school.
72% 71% 72% 74% 74% 75% 74%
0%
25%
50%
75%
100%
2009-10 2010-11 2011-12 2012-13 2013-14 2014-2015 2015-16
Perc
ent s
tude
nts
28
Table 16. Student and Parent Perceptions of Program Impact: Percent who Reported the Program Helped “Some” or “A Lot”
Outcome Percent
of Students Percent
of Parents Academic areas
Reading, English, language arts, writing 69% 90% Math 69% 88% Science/technology 65% 85% Other school subjects (history, social studies) 63% 83%
Academic engagement Care more about getting good grades 77% 89% Think that doing well in school was important for having a successful career 82% 88% Think that success in school would help you have a good life when you grow up/as an adult (parent version) 81% 90%
Want to go to college 74% 81% Look forward to coming to school 71% 89%
Non-academic areas Creative skills like art, music, dance, drama 67% 86% Sports, athletics, physical activities 68% 83% Working with the Internet 66% 83% Staying away from drugs and alcohol 70% 85% Making and keeping friends 72% 91%
Positive youth development Social/psychological learning 46% N/A Pro-social skills 54% N/A Teamwork 61% N/A Leadership 54% N/A
Somewhat fewer, but still a majority, said the program was helpful with other
types of skills, such as creativity, physical fitness, and technology. They were least
likely to say the program helped them to improve their social skills. However,
note that these results do not take into account whether students actually
participated in activities designed to improve the specific outcomes listed.
Parent perceptions of their student’s improvement were generally higher than the
student’s own perception of her/his improvement in most categories. Parents do
not report on positive youth development outcomes.

29
Curriculum Use and Staff Trainings Around Key Topics
In recent years, researchers and practitioners have emphasized the importance of
youth developing competency around STEM (science, technology, engineering,
and mathematics) areas, acquiring social-emotional and leadership skills, and
avoiding risky behaviors to enhance their chance of having a productive work life
and overall wellbeing as they move into adulthood. With supports from MDE and
TACSS coaching assistance, Michigan 21st CCLC programs are expected to move
beyond childcare service to promote exceptional learning opportunities that
fulfill the educational needs of today’s youth.
Using the staff survey, this section presents data from 974 paid staff, contractors
and vendors regarding the supports and resources they utilized in 2015-16 when
running specific activities for youth. The specific activities of focus include:
STEM, social-emotional learning, youth leadership development, and risk
prevention. Although the use of curriculum and frequency of training were not
statistically linked with improved youth outcomes7, curriculum use and trainings
are key to program quality and staff efficiency in preparing for activities.
7 Results from the Hierarchical Linear Modeling (HLM) testing the effects of curriculum use and training frequency on youth outcomes didn’t show any statistical significance. The examined youth outcomes include: teacher ratings on school behaviors and homework completion and changes on reading and math grades.

30
STEM
Need for more STEM trainings The majority of the staff who reported conducting STEM activities received no training or received training just once in 2015-16. Just under half used a STEM curriculum. This input suggests that there is room for more STEM-related professional development opportunities and curriculum support.
Social-Emotional Learning (SEL)
Staff are gaining familiarity with SEL About half of staff members who conducted SEL activities participated in SEL training multiple times in 2015-16; this reflected SEL-themed conferences and coaching supports made available in recent years. Curriculum use was 47%,
None21%
Once28%
2-4 Times36%
5+ Times15%
# of Trainings Received in 2015-2016suggesting room for utilizing more SEL curriculum resources.
47 %
0%
10%
20%
30%
40%
50%
60%
70%
80%
90%
100%
Curriculum Used
None39%
Once24%
2-4 Times26%
5+ Times11%
# of Trainings Received in 2015-2016
47%
0%
10%
20%
30%
40%
50%
60%
70%
80%
90%
100%
Curriculum Used

31
Youth Leadership
Youth leadership support varies by site Youth leadership can be promoted in various activities and in different forms; it’s an important developmental asset and often key to greater program satisfaction, especially for older youth. In 2015-16, participation in youth leadership training among staff who conducted youth development activities ranged evenly from none to several times. With 42% of staff reporting that they use a youth leadership curriculum, the data suggested staff may benefit from more trainings or curricula that give them adaptable skills in facilitating youth leadership in their own settings.
42%
0%
10%
20%
30%
40%
50%
60%
70%
80%
90%
100%
Curriculum Used
None29%
Once29%
2-4 Times30%
5+ Times12%
# of Trainings Received in 2015-2016

32
Risk Prevention
Less risk prevention professional development and curricula Michigan 21st CCLC programs serve a large population of youth who face multiple risks including family and community poverty, crime, teen pregnancy, and substance abuse. Data showed that 41% of staff providing risk prevention activities did not receive training related to risk prevention, and use of curricula was below 30%. Potentially, training focused more on positive youth development. Nonetheless, risk prevention training may be important in working with high-risk populations.
28%
0%
10%
20%
30%
40%
50%
60%
70%
80%
90%
100%
Curriculum Used
None41%
Once29%
2-4 Times23%
5+ Times7%
# of Trainings Received in 2015-2016