Michael Mackie and Paul Lewis - fish.wa.gov.au investigate basic fish biology, stock identity and...
48
FISHERIES RESEARCH REPORT NO. 136, 2001 Assessment of gonad staging systems and other methods used in the study of the reproductive biology of narrow-barred Spanish mackerel, Scomberomorus commerson, in Western Australia Michael Mackie and Paul Lewis Fisheries Research Division WA Marine Research Laboratories PO Box 20 NORTH BEACH Western Australia 6920 Department of Fisheries Cover picture: Mackerel drawing adapted from Collette and Nauen (1983), FAO Fisheries Synopsis No. 125, Vol. 2. Scombrids of the world, with permission of the Food and Agriculture Organisation of the United Nations (ref. no. A47/2000).
Transcript of Michael Mackie and Paul Lewis - fish.wa.gov.au investigate basic fish biology, stock identity and...

FISHERIES RESEARCH REPORT NO. 136, 2001
Assessment of gonad staging systems and other methods used in the study of the reproductive
biology of narrow-barred Spanish mackerel,Scomberomorus commerson, in Western Australia
Michael Mackie and Paul Lewis
Fisheries Research DivisionWA Marine Research Laboratories
PO Box 20 NORTH BEACHWestern Australia 6920
Department of Fisheries
Cover picture: Mackerel drawing adapted from Collette and Nauen (1983), FAO Fisheries Synopsis No. 125, Vol. 2. Scombrids of the world, with permission of
the Food and Agriculture Organisation of the United Nations (ref. no. A47/2000).
Fisheries Research ReportTitles in the fisheries research series contain technical and scientificinformation that represents an important contribution to existing knowledge,but which may not be suitable for publication in national or internationalscientific journals.
Fisheries Research Reports may be cited as full publications. The correctcitation appears with the abstract for each report.
Numbers 1-80 in this series were issued as Reports. Numbers 81-82 wereissued as Fisheries Reports, and from number 83 the series has been issuedunder the current title.
EnquiriesDepartment of Fisheries3rd floor SGIO Atrium168-170 St George’s TerracePERTH WA 6000Telephone (08) 9482 7333Facsimile (08) 9482 7389Website: http://www.wa.gov.au/westfish/res
Published by Department of Fisheries Perth, Western Australia November 2001ISSN: 1035 - 4549 ISBN: 0 7309 8468 0
An electronic copy of this report will be available at the above websitewhere parts may be shown in colour where this is thought to improveclarity.
Fisheries research in Western AustraliaThe Fisheries Research Division of the Department of Fisheries is based at theWestern Australian Marine Research Laboratories, P.O. Box 20, North Beach(Perth), Western Australia, 6020. The Marine Research Laboratories serve asthe centre for fisheries research in the State of Western Australia.
Research programs conducted by the Fisheries Research Division andlaboratories investigate basic fish biology, stock identity and levels,population dynamics, environmental factors, and other factors related tocommercial fisheries, recreational fisheries and aquaculture. The FisheriesResearch Division also maintains the State data base of catch and effortfisheries statistics.
The primary function of the Fisheries Research Division is to provide scientificadvice to government in the formulation of management policies fordeveloping and sustaining Western Australian fisheries.
Contents
PageAbstract ...................................................................................................... 1
1.0 Introduction ...................................................................................................... 2
1.1 Research on S. commerson in Western Australia .................................... 2
1.2 Aims of this Report ................................................................................ 3
2.0 Methods ...................................................................................................... 4
2.1 Collection of samples .............................................................................. 4
2.2 Processing of samples ............................................................................ 6
2.2.1 Comparison of gamete development throughout the gonad ........ 6
2.2.2 Estimates of batch fecundity and comparison of oocyte hydration throughout the ovary.................................................... 6
2.2.3 Comparison of fresh, frozen and preserved ovarian weights .... 7
2.2.4 Microscopic staging system ........................................................ 7
2.2.5 Staging of post-ovulatory follicles .............................................. 8
2.2.6 Oocyte atresia .............................................................................. 9
3.0 Results ...................................................................................................... 9
3.1 Staging system for microscopic analysis of formalin preserved,
histologically prepared gonad sections .................................................. 11
3.1.1 Ovaries ........................................................................................ 11
3.1.2 Testes............................................................................................ 13
3.2 Staging system for macroscopic analysis of whole gonads.................... 16
3.2.1 Ovaries ........................................................................................ 16
3.2.1.1 Assessment of the accuracy of macroscopic staging ...... 16
3.2.1.2 Development of a more accurate macroscopic staging system ................................................................ 17
3.2.2 Testes............................................................................................ 18
3.3 Pictorial guide to staging S. commerson ovaries .................................... 20
4.0 Discussion ...................................................................................................... 22
4.1 Staging systems ...................................................................................... 22
4.2 Other assessments.................................................................................... 23
4.3 Problems associated with analysis of histologically prepared gonad sections ........................................................................................ 24
5.0 Acknowledgements .......................................................................................... 25
i
6.0 References ...................................................................................................... 25
7.0 Appendices ...................................................................................................... 27
List of plates ..................................................................................see insert booklet
List of tables
Table 1: Number of fresh and frozen samples of S. commersonovaries obtained from each region between 1988 and 2000. ............................ 5
Table 2: Descriptions used to categorise post-ovulatory follicles in S. commerson ovaries according to relative age................................................. 9
Table 3: Definitions and criteria used to categorise S. commerson ovaries according to the amount of oocyte atresia. ........................................................ 9
Table 4: Results of t-tests for dependent samples to compare the circumferences of 25 of the most mature stage oocytes within three locations of one ovarian lobe. ............................................................................ 10
Table 5: Results of t-tests for dependent samples to compare the circumferences of 25 of the most mature stage oocytes within the mid-region of each ovarian lobe. ........................................................................ 11
Table 6: Results of t-tests for dependent samples to compare estimates of batch fecundity for S. commerson ovaries. ........................................................ 11
Table 7: Microscopic staging system used in the histological analysis of S. commerson gonads. ........................................................................................ 14
Table 8: Simplified macroscopic staging systems for S. commerson gonads. .. 19
List of figures
Figure 1: Sampling locations used in the study of S. commerson biology. ...... 5
Figure 2: Comparison of fresh and formalin preserved ovary weights of S. commerson. .................................................................................................... 13
Figure 3: Comparison of fresh and frozen ovary weights of S. commerson. .... 13
Figure 4: Developmental and maturation cycle of S. commerson ovaries showing the relative reproductive status of each ovarian stage through time. .. 16
Figure 5: Proportion of S. commerson ovaries that were given the same macroscopic and histological stage. .................................................................. 20
Figure 6: Macroscopic stage composition of each histological stage for S. commerson ovaries collected between July and December 2000. ................ 21
Figure 7: Proportion of S. commerson ovaries that were given the same macroscopic and histological stage using the simplified staging system. ........ 21
Figure 8: Macroscopic stage composition of each histological stage for S. commerson ovaries collected between July and December 2000. ................ 22
ii

Fish. Res. Rep. West. Aust. 12001, 136, 1-32
Assessment of gonad staging systems andother methods used in the study of thereproductive biology of narrow-barred Spanishmackerel, Scomberomorus commerson, inWestern Australia.
Michael Mackie and Paul LewisWestern Australian Marine Research LaboratoriesPO Box 20, North Beach WA 6920
Abstract
Recent research by the Department of Fisheries in Western Australia into thereproductive biology of narrow-barred Spanish mackerel has required the use ofvarious field and laboratory techniques. This report documents the procedures andadaptations of some of these techniques. Assessment and development of illustrated,relevant macroscopic and microscopic staging systems were of particular focusbecause both have been essential components of the research. The simplified andmore reliable macroscopic staging system we developed allowed full use of all gonadsamples and a more complete (albeit less distinct) overview of the seasonal pattern ofgonad reproductive development. This macroscopic staging system will be useful forongoing, low budget monitoring of Spanish mackerel stocks in Western Australia.More detailed and accurate (but less complete) data were provided by themicroscopic staging system, allowing specific information about spawning and otherreproductive characteristics of this species. Methods used in the collection andprocessing of samples and in the estimation of batch fecundity of females are alsodocumented along with conversion factors between weights of fresh, frozen andformalin-fixed gonads.
2 Fish. Res. Rep. West. Aust.2001, 136, 1-32
1.0 Introduction
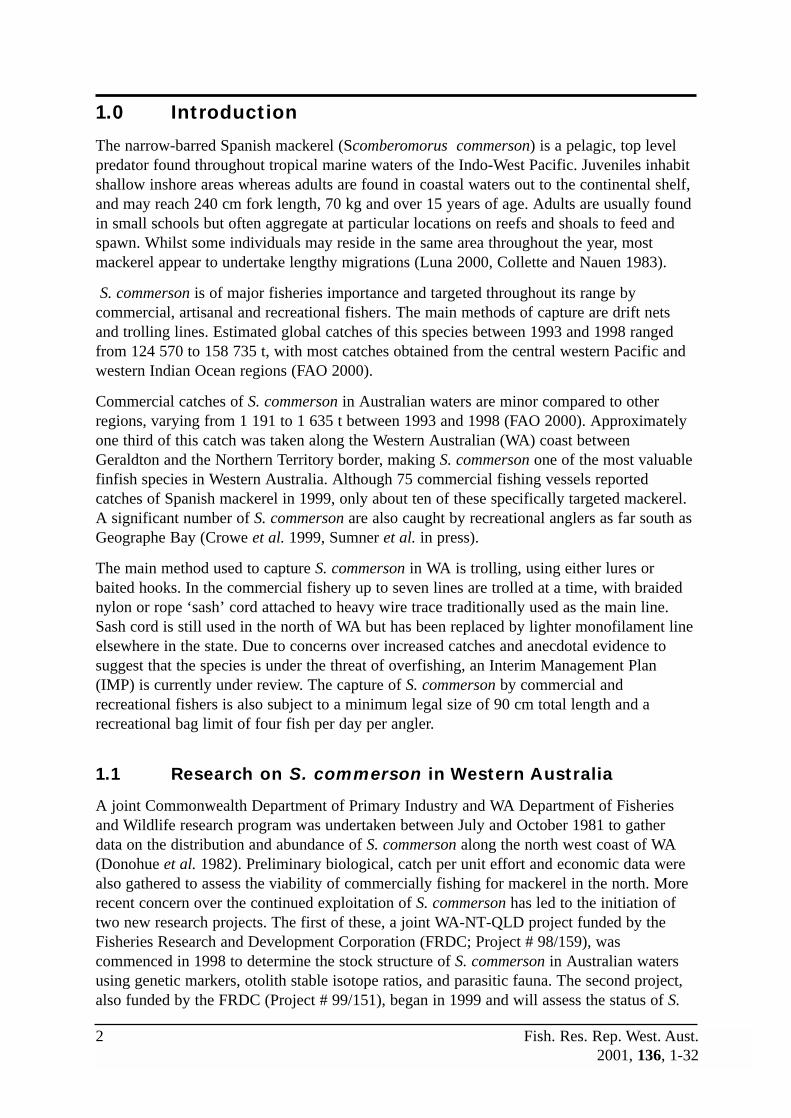
The narrow-barred Spanish mackerel (Scomberomorus commerson) is a pelagic, top levelpredator found throughout tropical marine waters of the Indo-West Pacific. Juveniles inhabitshallow inshore areas whereas adults are found in coastal waters out to the continental shelf,and may reach 240 cm fork length, 70 kg and over 15 years of age. Adults are usually foundin small schools but often aggregate at particular locations on reefs and shoals to feed andspawn. Whilst some individuals may reside in the same area throughout the year, mostmackerel appear to undertake lengthy migrations (Luna 2000, Collette and Nauen 1983).
S. commerson is of major fisheries importance and targeted throughout its range bycommercial, artisanal and recreational fishers. The main methods of capture are drift netsand trolling lines. Estimated global catches of this species between 1993 and 1998 rangedfrom 124 570 to 158 735 t, with most catches obtained from the central western Pacific andwestern Indian Ocean regions (FAO 2000).
Commercial catches of S. commerson in Australian waters are minor compared to otherregions, varying from 1 191 to 1 635 t between 1993 and 1998 (FAO 2000). Approximatelyone third of this catch was taken along the Western Australian (WA) coast betweenGeraldton and the Northern Territory border, making S. commerson one of the most valuablefinfish species in Western Australia. Although 75 commercial fishing vessels reportedcatches of Spanish mackerel in 1999, only about ten of these specifically targeted mackerel.A significant number of S. commerson are also caught by recreational anglers as far south asGeographe Bay (Crowe et al. 1999, Sumner et al. in press).
The main method used to capture S. commerson in WA is trolling, using either lures orbaited hooks. In the commercial fishery up to seven lines are trolled at a time, with braidednylon or rope ‘sash’ cord attached to heavy wire trace traditionally used as the main line.Sash cord is still used in the north of WA but has been replaced by lighter monofilament lineelsewhere in the state. Due to concerns over increased catches and anecdotal evidence tosuggest that the species is under the threat of overfishing, an Interim Management Plan(IMP) is currently under review. The capture of S. commerson by commercial andrecreational fishers is also subject to a minimum legal size of 90 cm total length and arecreational bag limit of four fish per day per angler.
1.1 Research on S. commerson in Western Australia
A joint Commonwealth Department of Primary Industry and WA Department of Fisheriesand Wildlife research program was undertaken between July and October 1981 to gatherdata on the distribution and abundance of S. commerson along the north west coast of WA(Donohue et al. 1982). Preliminary biological, catch per unit effort and economic data werealso gathered to assess the viability of commercially fishing for mackerel in the north. Morerecent concern over the continued exploitation of S. commerson has led to the initiation oftwo new research projects. The first of these, a joint WA-NT-QLD project funded by theFisheries Research and Development Corporation (FRDC; Project # 98/159), wascommenced in 1998 to determine the stock structure of S. commerson in Australian watersusing genetic markers, otolith stable isotope ratios, and parasitic fauna. The second project,also funded by the FRDC (Project # 99/151), began in 1999 and will assess the status of S.

Fish. Res. Rep. West. Aust. 32001, 136, 1-32
commerson stocks within WA waters. Integral to this second project is the gathering ofbiological information which, along with commercial catch and effort data, will be used inthe development and interpretation of stock assessment models and in determining how theWA Spanish mackerel fishery may be sustainably managed.
Information on the reproductive biology of S. commerson is an essential component of thebiological research. The data required to provide such information is typically gatheredthrough the examination and classification of gonads into developmental stages so thatparameters such as reproductive period, spawning frequency, size at sexual maturity and sexratios can be determined. The most accurate and detailed means of staging gonads is bymicroscopic examination of histologically prepared sections of each specimen, although thismethod is costly and time consuming. Macroscopic staging of gonads based on their colourand general appearance is a cheaper and faster method, and may be more appropriate if thesamples are not fresh enough to be fixed in preservative for histological examination.Consequently gonads are routinely staged this way during reproductive studies, although theinformation so gained is limited in detail and often unreliable (West 1990, McPherson 1992,Garcia-Diaz et al. 1997).
1.2 Aims of this report
Because of the uncertainty associated with macroscopically staging gonads, the data is oftennot utilised. However, few attempts are made to assess and improve the accuracy of thistechnique so that it might be used in situations where histological methods are not practical -for instance, when funds are limited and a cheap, rapid technique for ongoing biologicalmonitoring is required, when time and space do not permit sampling of the whole catch amidthe chaos of a busy fishing deck, or when the samples are frozen or have been on ice forseveral days after capture. These were considerations in the study of S. commerson biology,thereby prompting the development and validation of an unambiguous and accuratemacroscopic staging system. The aims of this report were, therefore, to:
• Develop an illustrated, relevant macroscopic staging system for S. commerson gonads,
which can be reliably used by personnel in the field.
• Develop an illustrated, relevant microscopic staging system for S. commerson gonads that
enables maximum information about gonad development and spawning.
• Further aims of this report were to detail other methods required in the study of S.
commerson reproductive biology, including:
• Determine conversion factors between the weights of fresh, frozen, and formalin-fixed
whole gonads, thus allowing for standardisation of methods such as gonado-somatic ratios.
• Detail the methods used in the collection and processing of samples used in the
estimation of batch fecundity in females.
The study focuses on ovaries since the developmental stages of these are easier todistinguish than in testes, and because ovarian development usually defines the spawningseason and number of offspring produced during spawning (De Martini and Fountain 1981).It is important to note that S. commerson has a prolonged spawning season during which

4 Fish. Res. Rep. West. Aust.2001, 136, 1-32
eggs are spawned by females in multiple batches (McPherson 1993), and oocytes of varyingdevelopmental stages are present within the ovary at the same time (pers. obs.). Thisasynchronous development of the ovary (Wallace and Selman 1981) is common in otherexploited species of fish that inhabit tropical marine waters, and the staging systemsdescribed in this report may also be relevant to these. However, for species of fish withovaries in which oocytes develop and are spawned as one single group (synchronousdevelopment) or as two or more homogenous groups (group synchronous development), thestaging systems for S. commerson may be inappropriate.
2.0 Methods
2.1 Collection of samples
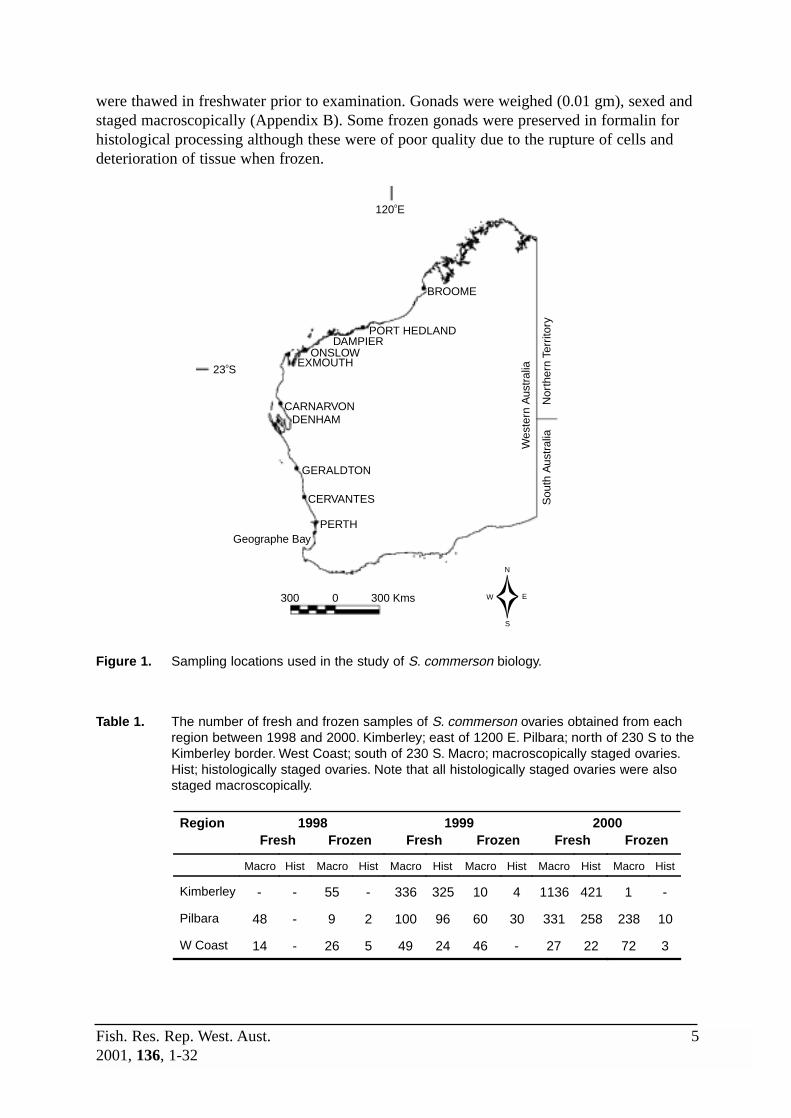
Fresh gonad samples were collected by Fisheries WA personnel onboard commercial andrecreational vessels and from recreational fishing competitions. Frozen samples were alsoobtained from commercial and recreational fishers. Most of these samples came from thevicinity of Broome, Port Hedland, Dampier and Carnarvon, with others collected lessfrequently from Exmouth, Denham, Geraldton and Cervantes (Figure 1, Table 1).
Fresh samples
Length and weight (kg) were obtained for each fish. Fork length (FL) of all fish and, wherepossible, total length (TL) were measured (all lengths in this study are mm). Total lengthswere measured to the tip of the dorsal fork of the tail, with the tail laid flat in the normalswimming position and the forks compressed slightly towards each other to remove ‘play’ inthe tail. If the dorsal tip was damaged then TL was taken to the ventral tip, although this isusually shorter and required appropriate adjustment to the equivalent dorsal forkmeasurement. Note that TL is not as precise a measure as FL in S. commerson.Measurements of the head (tip of the mouth to the firm edge of the operculum) and of thejaw (tip of the mouth to the posterior edge of the upper jaw (premaxilla)) were also taken.Where possible, the whole weight, clean weight (viscera and gonads removed), and headweight (including gills) of each fish were also obtained (body weight to 0.1 kg, head weightto 0.1 gm). Refer to the Appendix A for detail of the data sheet used to record informationwhilst in the field.
Fresh gonads were usually removed from the fish within a few hours of capture, and theirsex and stage of reproductive maturity determined using a macroscopic staging system(Appendix B). Gonads obtained from recreational fishers could usually be weighed fresh(0.01 gm). Two or three transverse cuts were then made through each gonad to ensure properfixation before placing them into a perforated cellophane bag and then into plastic drumscontaining 10% formalin in seawater. If space permitted, the whole gonad was preserved,otherwise an 8 cm long mid-section of one lobe was saved.
Frozen samples
Frozen samples obtained from commercial fishers comprised the head, gut and gonad ofeach fish, whereas frames (fillets removed) were obtained from recreational fishers. Samples
Fish. Res. Rep. West. Aust. 52001, 136, 1-32
were thawed in freshwater prior to examination. Gonads were weighed (0.01 gm), sexed andstaged macroscopically (Appendix B). Some frozen gonads were preserved in formalin forhistological processing although these were of poor quality due to the rupture of cells anddeterioration of tissue when frozen.
Figure 1. Sampling locations used in the study of S. commerson biology.
Table 1. The number of fresh and frozen samples of S. commerson ovaries obtained from eachregion between 1998 and 2000. Kimberley; east of 1200 E. Pilbara; north of 230 S to theKimberley border. West Coast; south of 230 S. Macro; macroscopically staged ovaries.Hist; histologically staged ovaries. Note that all histologically staged ovaries were alsostaged macroscopically.
1998 1999 2000 Region Fresh Frozen Fresh Frozen Fresh Frozen
Macro Hist Macro Hist Macro Hist Macro Hist Macro Hist Macro Hist
Kimberley - - 55 - 336 325 10 4 1136 421 1 -
Pilbara 48 - 9 2 100 96 60 30 331 258 238 10
W Coast 14 - 26 5 49 24 46 - 27 22 72 3
BROOME
PORT HEDLANDDAMPIER
ONSLOWEXMOUTH
CARNARVONDENHAM
GERALDTON
CERVANTES
PERTHGeographe Bay
23oS
120oE
Wes
tern
Aus
tral
ia
Sou
th A
ustr
alia
Nor
ther
n Te
rrito
ry
300 0 300 Kms
N
E
S
W
6 Fish. Res. Rep. West. Aust.2001, 136, 1-32
2.2 Processing of samples
Preserved gonad samples were removed from the formalin solution after several weeks.Whole samples were blotted dry and re-weighed (0.01 gm). A transverse portion of eachgonad was then removed and processed using standard histological techniques to provide 5 –7 µm sections that were stained using Harris’s haematoxylin and eosin (H&E) formicroscopic examination. The transverse portion was removed from the middle region ofone lobe following an investigation to determine whether development of gametes wasuniform throughout the gonad (described below). A sample data sheet used in the analysis ofthe histologically prepared gonad specimens is provided in Appendix C.
2.2.1 Comparison of gamete development throughout the gonad
The investigation of gamete development was made using histologically prepared material,with the circumference of 25 latest-stage oocytes measured from the anterior, middle, andposterior regions of either the left or right ovary of 7 females (Yoshida, 1964). Thereproductive stage of these ovaries was either mature resting, developing, or developed (referto Results, Table 7). Oocytes sectioned through the nucleus were randomly selected formeasurement by moving the microscope field of view (x4 or x10 objective magnification)horizontally back and forth across the section so that new oocytes could be measured. Usingthe same technique, comparison was made of oocyte development within the middle regionof the left and right ovary (n = 9), using ovaries from mature-resting to pre-spawning stages.These data were compared using a one-way Analysis of Variance in order to determinewhether samples taken from mid-section of the gonad of either lobe were representative ofgamete development throughout the ovaries. Development of sperm tissue throughout thetestes was compared visually by microscopic examination of sections cut from anterior,middle and posterior sections of each lobe (n = 5).
2.2.2 Estimates of batch fecundity and comparison of oocytehydration throughout the ovary
To determine whether hydration of oocytes occurred at a similar rate throughout the ovary,batch fecundity estimates of 6 pre-spawning (Stage 5a) ovaries taken from anterior, middleand posterior regions of both lobes were compared. Prior to estimating batch fecundity, thefixed ovaries were removed from the formalin solution and cellophane bag and placed in asieve (mesh size 0.5 mm). The bag and ovary were rinsed with fresh water in order toremove loose oocytes and to rinse the sample of excess formalin. Both ovarian lobes wereslit to allow excess liquid to drain, and the outer membrane dried using paper towel beforethe ovary was weighed to 0.1 mg. Tissue samples were taken from the middle region andone-fifth of the distance from each end of one lobe. These samples were cut to include a 3 x3 mm square of outer membrane plus the connected ovarian tissue (since membrane weightis also included in the whole gonad weight), and weighed between 130 - 200 mg so that 150- 200 hydrated oocytes could be counted.
A transverse section of ovary approximately 3 mm thick was also removed from the centralregion of the lobe in which the above tissue samples were obtained. This section wasprocessed using histological techniques to confirm whether the ovary was suitable forfecundity estimates. For instance, if not all oocytes from the batch to be spawned were fullyhydrated (eg still in the migratory nucleus stage) or if some had already been released from

Fish. Res. Rep. West. Aust. 72001, 136, 1-32
the lamellae the estimate of batch fecundity is likely to be incorrect. Each tissue sample wasweighed to 0.1 mg, and as evaporation caused a steady decrease in tissue weight all threesamples from a particular lobe were weighed in quick succession. Each sample was thenplaced on a glass slide and covered with several drops of glycerin. After 10-15 minutes theoocytes were loosened by gently teasing apart the tissue with forceps, 3-4 more drops ofglycerin were added, and the sample spread over the slide. Hydrated oocytes were thencounted using a dissecting microscope (x 10). These were easily distinguishable from otheroocytes by their large size (usually greater than 0.8 mm along the major axis), wrinkledappearance compared to other non-hydrated oocytes when preserved in formalin, and bytheir translucence (non-hydrated oocytes are relatively opaque). In the case of damagedhydrated oocytes, only fragments judged to be a major portion of the oocyte were counted.Batch fecundity for each female was subsequently calculated from the product of the numberof hydrated oocytes per unit weight in the tissue sample and the ovary weight (both lobescombined). Note that batch fecundity is an estimate of the potential number of eggs releasedduring one spawning event and not an estimate of the total number spawned throughout thespawning season. Refer to Appendix D for details of the data sheet used to record fecundity.
2.2.3 Comparison of fresh, frozen and preserved ovarian weights
The affects of freezing and preservation on ovary weight were assessed using samplesobtained from recreational fishing competitions. The two lobes of each gonad were separatedand individually weighed while fresh (0.01 gm). One lobe was then frozen and the otherfixed in 10% formalin solution. After several weeks, the frozen lobe was thawed infreshwater, blotted dry, and again weighed and macroscopically staged whilst the fixed lobewas blotted dry, weighed and processed using histological techniques. These weights wereused to determine conversion ratios between fresh gonad weight and both fixed and frozenweights. The stages were used to compare the accuracy of macroscopically staging fresh andfrozen gonads with the microscopically staged fixed gonads (the latter regarded as the truestage).
2.2.4 Microscopic staging system
Nomenclature for stages of oogenesis followed that of Wallace and Sellman (1981) and West(1990), as described below (H&E stain):
1. Pre-vitellogenic Growth
Chromatin-Nucleolus Stage: 10 - 35µm in diameter (mean ≈ 18µm). Cytoplasm stronglybasophilic (dark staining). The nucleus is about half the size of the oocyte and clear staining,with conspicuous chromatin strands and a single large nucleolus.
Perinucleolus Stage: 15-120µm in diameter (mean ≈ 80µm). Thin follicular layer andirregular shape (spherical to elongate and often angular). Cytoplasm strongly basophilic witha large nucleus about a third of the area of the oocyte. Chromatin strands are conspicuousthroughout the clear staining nucleus and nucleoli are prominent around the periphery.
Cortical Alveoli (Yolk Vesicle) Stage: 110-320µm in diameter (mean ≈ 225µm). Distinctthecal layer and zona radiata. The nucleus is about half the size of the oocyte and thecytoplasm is less basophilic (lighter staining) and grainier than in previous stages. Smallclear staining yolk vesicles appear throughout the mid and outer regions of the cytoplasm,
8 Fish. Res. Rep. West. Aust.2001, 136, 1-32
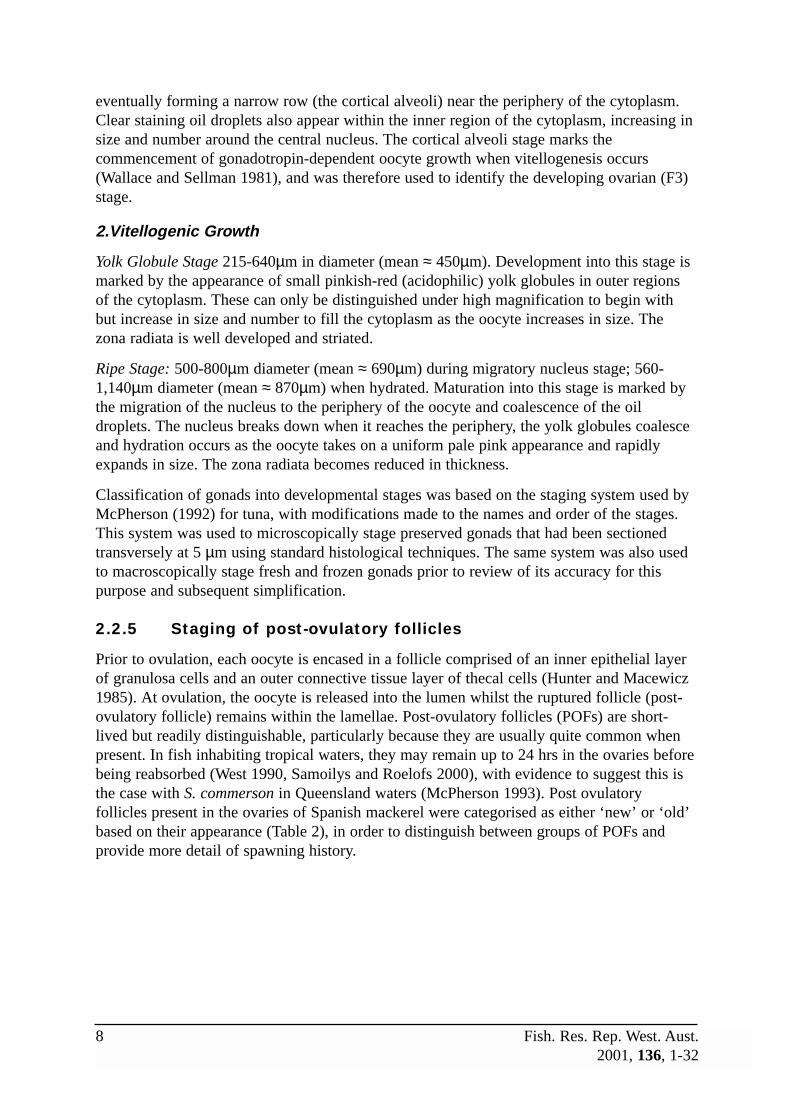
eventually forming a narrow row (the cortical alveoli) near the periphery of the cytoplasm.Clear staining oil droplets also appear within the inner region of the cytoplasm, increasing insize and number around the central nucleus. The cortical alveoli stage marks thecommencement of gonadotropin-dependent oocyte growth when vitellogenesis occurs(Wallace and Sellman 1981), and was therefore used to identify the developing ovarian (F3)stage.
2.Vitellogenic Growth
Yolk Globule Stage 215-640µm in diameter (mean ≈ 450µm). Development into this stage ismarked by the appearance of small pinkish-red (acidophilic) yolk globules in outer regionsof the cytoplasm. These can only be distinguished under high magnification to begin withbut increase in size and number to fill the cytoplasm as the oocyte increases in size. Thezona radiata is well developed and striated.
Ripe Stage: 500-800µm diameter (mean ≈ 690µm) during migratory nucleus stage; 560-1,140µm diameter (mean ≈ 870µm) when hydrated. Maturation into this stage is marked bythe migration of the nucleus to the periphery of the oocyte and coalescence of the oildroplets. The nucleus breaks down when it reaches the periphery, the yolk globules coalesceand hydration occurs as the oocyte takes on a uniform pale pink appearance and rapidlyexpands in size. The zona radiata becomes reduced in thickness.
Classification of gonads into developmental stages was based on the staging system used byMcPherson (1992) for tuna, with modifications made to the names and order of the stages.This system was used to microscopically stage preserved gonads that had been sectionedtransversely at 5 µm using standard histological techniques. The same system was also usedto macroscopically stage fresh and frozen gonads prior to review of its accuracy for thispurpose and subsequent simplification.
2.2.5 Staging of post-ovulatory follicles
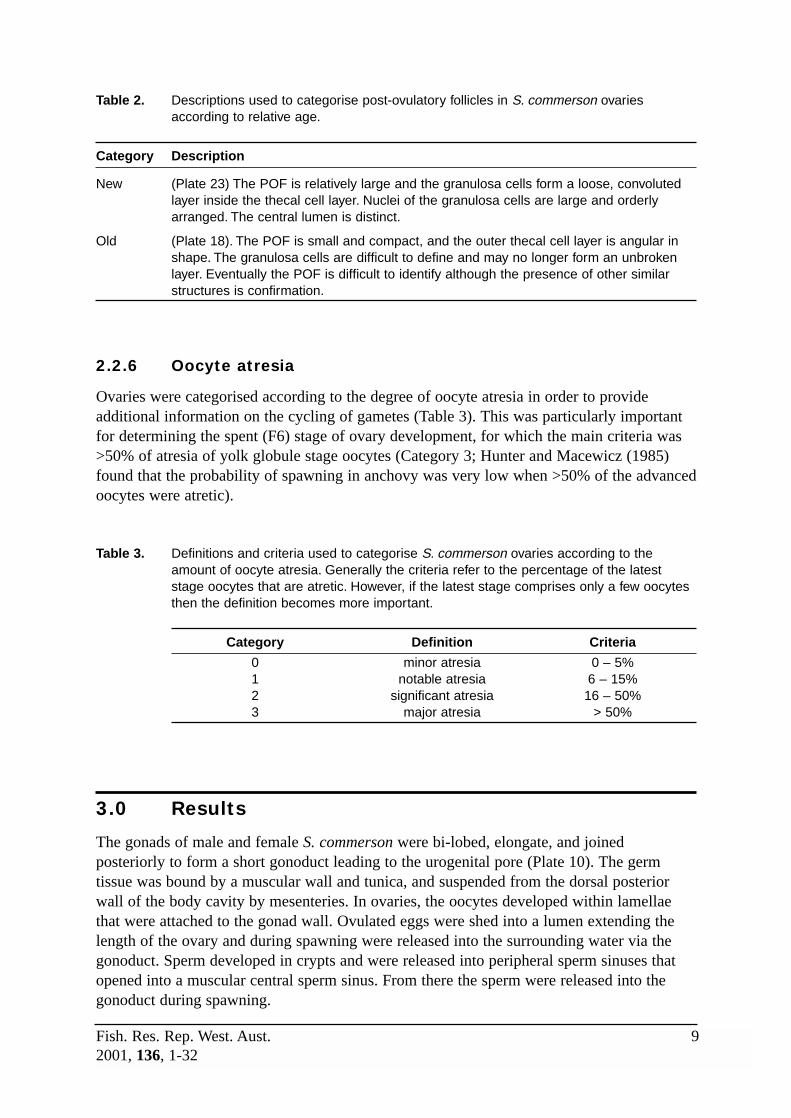
Prior to ovulation, each oocyte is encased in a follicle comprised of an inner epithelial layerof granulosa cells and an outer connective tissue layer of thecal cells (Hunter and Macewicz1985). At ovulation, the oocyte is released into the lumen whilst the ruptured follicle (post-ovulatory follicle) remains within the lamellae. Post-ovulatory follicles (POFs) are short-lived but readily distinguishable, particularly because they are usually quite common whenpresent. In fish inhabiting tropical waters, they may remain up to 24 hrs in the ovaries beforebeing reabsorbed (West 1990, Samoilys and Roelofs 2000), with evidence to suggest this isthe case with S. commerson in Queensland waters (McPherson 1993). Post ovulatoryfollicles present in the ovaries of Spanish mackerel were categorised as either ‘new’ or ‘old’based on their appearance (Table 2), in order to distinguish between groups of POFs andprovide more detail of spawning history.
Fish. Res. Rep. West. Aust. 92001, 136, 1-32
Table 2. Descriptions used to categorise post-ovulatory follicles in S. commerson ovariesaccording to relative age.
Category Description
New (Plate 23) The POF is relatively large and the granulosa cells form a loose, convoluted layer inside the thecal cell layer. Nuclei of the granulosa cells are large and orderly arranged. The central lumen is distinct.
Old (Plate 18). The POF is small and compact, and the outer thecal cell layer is angular in shape. The granulosa cells are difficult to define and may no longer form an unbroken layer. Eventually the POF is difficult to identify although the presence of other similar structures is confirmation.
2.2.6 Oocyte atresia
Ovaries were categorised according to the degree of oocyte atresia in order to provideadditional information on the cycling of gametes (Table 3). This was particularly importantfor determining the spent (F6) stage of ovary development, for which the main criteria was>50% of atresia of yolk globule stage oocytes (Category 3; Hunter and Macewicz (1985)found that the probability of spawning in anchovy was very low when >50% of the advancedoocytes were atretic).
Table 3. Definitions and criteria used to categorise S. commerson ovaries according to theamount of oocyte atresia. Generally the criteria refer to the percentage of the lateststage oocytes that are atretic. However, if the latest stage comprises only a few oocytesthen the definition becomes more important.
Category Definition Criteria
0 minor atresia 0 – 5%1 notable atresia 6 – 15%2 significant atresia 16 – 50%3 major atresia > 50%
3.0 Results
The gonads of male and female S. commerson were bi-lobed, elongate, and joinedposteriorly to form a short gonoduct leading to the urogenital pore (Plate 10). The germtissue was bound by a muscular wall and tunica, and suspended from the dorsal posteriorwall of the body cavity by mesenteries. In ovaries, the oocytes developed within lamellaethat were attached to the gonad wall. Ovulated eggs were shed into a lumen extending thelength of the ovary and during spawning were released into the surrounding water via thegonoduct. Sperm developed in crypts and were released into peripheral sperm sinuses thatopened into a muscular central sperm sinus. From there the sperm were released into thegonoduct during spawning.
10 Fish. Res. Rep. West. Aust.2001, 136, 1-32
Ovarian weight was reduced by 6.3% when preserved in 10 % formalin solution. The affectsof freezing were negligible, resulting in a slight increase of 0.14 % in weight (Figures 2 and3). Relationships between fresh, preserved and frozen gonads were:
Fresh weight (g) = 1.0452 x formalin preserved weight (g) (r2 = 0.9985, n = 144)
Fresh weight (g) = 0.9986 x frozen weight (g) (r2 = 0.9973, n = 45)
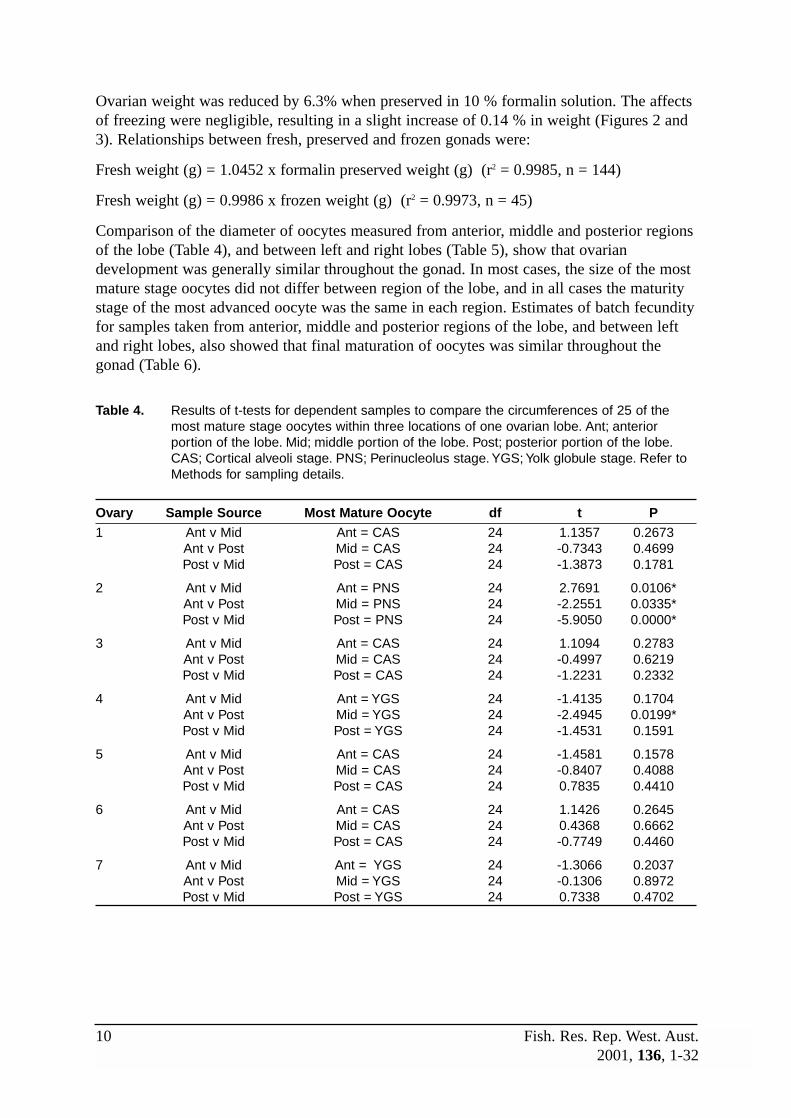
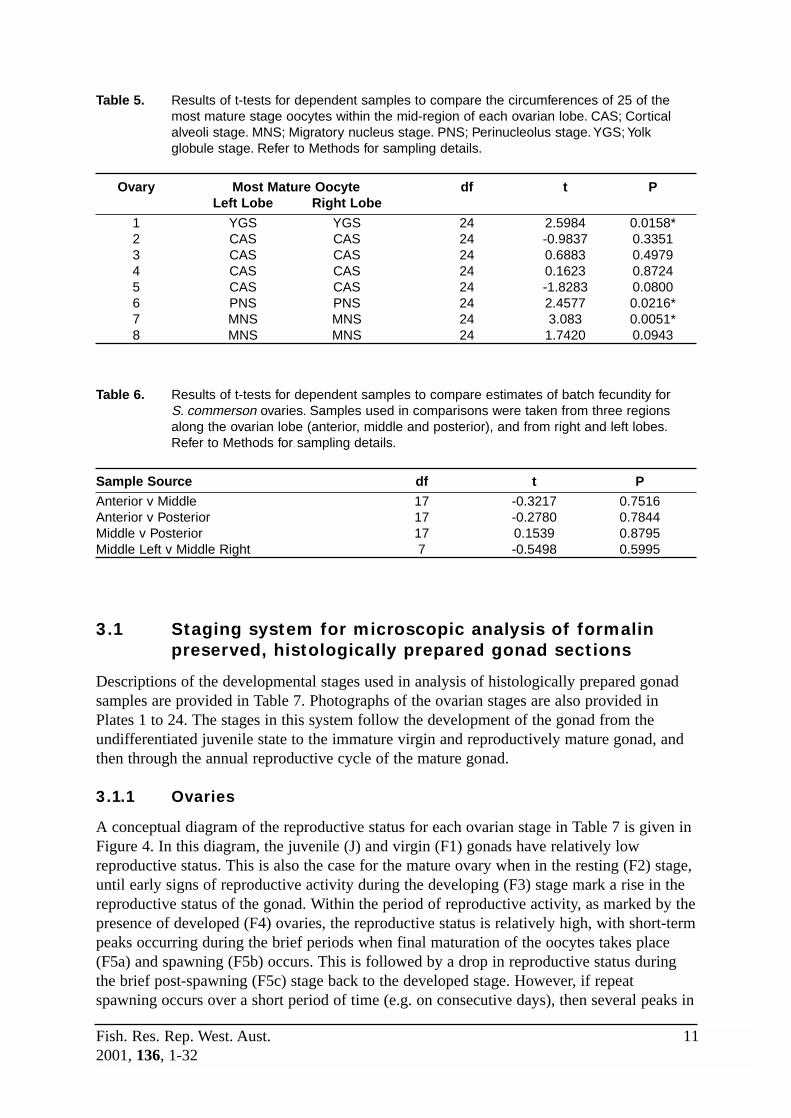
Comparison of the diameter of oocytes measured from anterior, middle and posterior regionsof the lobe (Table 4), and between left and right lobes (Table 5), show that ovariandevelopment was generally similar throughout the gonad. In most cases, the size of the mostmature stage oocytes did not differ between region of the lobe, and in all cases the maturitystage of the most advanced oocyte was the same in each region. Estimates of batch fecundityfor samples taken from anterior, middle and posterior regions of the lobe, and between leftand right lobes, also showed that final maturation of oocytes was similar throughout thegonad (Table 6).
Table 4. Results of t-tests for dependent samples to compare the circumferences of 25 of themost mature stage oocytes within three locations of one ovarian lobe. Ant; anteriorportion of the lobe. Mid; middle portion of the lobe. Post; posterior portion of the lobe.CAS; Cortical alveoli stage. PNS; Perinucleolus stage. YGS; Yolk globule stage. Refer toMethods for sampling details.
Ovary Sample Source Most Mature Oocyte df t P1 Ant v Mid Ant = CAS 24 1.1357 0.2673
Ant v Post Mid = CAS 24 -0.7343 0.4699Post v Mid Post = CAS 24 -1.3873 0.1781
2 Ant v Mid Ant = PNS 24 2.7691 0.0106*Ant v Post Mid = PNS 24 -2.2551 0.0335*Post v Mid Post = PNS 24 -5.9050 0.0000*
3 Ant v Mid Ant = CAS 24 1.1094 0.2783Ant v Post Mid = CAS 24 -0.4997 0.6219Post v Mid Post = CAS 24 -1.2231 0.2332
4 Ant v Mid Ant = YGS 24 -1.4135 0.1704Ant v Post Mid = YGS 24 -2.4945 0.0199*Post v Mid Post = YGS 24 -1.4531 0.1591
5 Ant v Mid Ant = CAS 24 -1.4581 0.1578Ant v Post Mid = CAS 24 -0.8407 0.4088Post v Mid Post = CAS 24 0.7835 0.4410
6 Ant v Mid Ant = CAS 24 1.1426 0.2645Ant v Post Mid = CAS 24 0.4368 0.6662Post v Mid Post = CAS 24 -0.7749 0.4460
7 Ant v Mid Ant = YGS 24 -1.3066 0.2037Ant v Post Mid = YGS 24 -0.1306 0.8972Post v Mid Post = YGS 24 0.7338 0.4702
Fish. Res. Rep. West. Aust. 112001, 136, 1-32
Table 5. Results of t-tests for dependent samples to compare the circumferences of 25 of themost mature stage oocytes within the mid-region of each ovarian lobe. CAS; Corticalalveoli stage. MNS; Migratory nucleus stage. PNS; Perinucleolus stage. YGS; Yolkglobule stage. Refer to Methods for sampling details.
Ovary Most Mature Oocyte df t PLeft Lobe Right Lobe
1 YGS YGS 24 2.5984 0.0158*2 CAS CAS 24 -0.9837 0.33513 CAS CAS 24 0.6883 0.49794 CAS CAS 24 0.1623 0.87245 CAS CAS 24 -1.8283 0.08006 PNS PNS 24 2.4577 0.0216*7 MNS MNS 24 3.083 0.0051*8 MNS MNS 24 1.7420 0.0943
Table 6. Results of t-tests for dependent samples to compare estimates of batch fecundity for S. commerson ovaries. Samples used in comparisons were taken from three regionsalong the ovarian lobe (anterior, middle and posterior), and from right and left lobes.Refer to Methods for sampling details.
Sample Source df t P
Anterior v Middle 17 -0.3217 0.7516Anterior v Posterior 17 -0.2780 0.7844Middle v Posterior 17 0.1539 0.8795Middle Left v Middle Right 7 -0.5498 0.5995
3.1 Staging system for microscopic analysis of formalinpreserved, histologically prepared gonad sections
Descriptions of the developmental stages used in analysis of histologically prepared gonadsamples are provided in Table 7. Photographs of the ovarian stages are also provided inPlates 1 to 24. The stages in this system follow the development of the gonad from theundifferentiated juvenile state to the immature virgin and reproductively mature gonad, andthen through the annual reproductive cycle of the mature gonad.
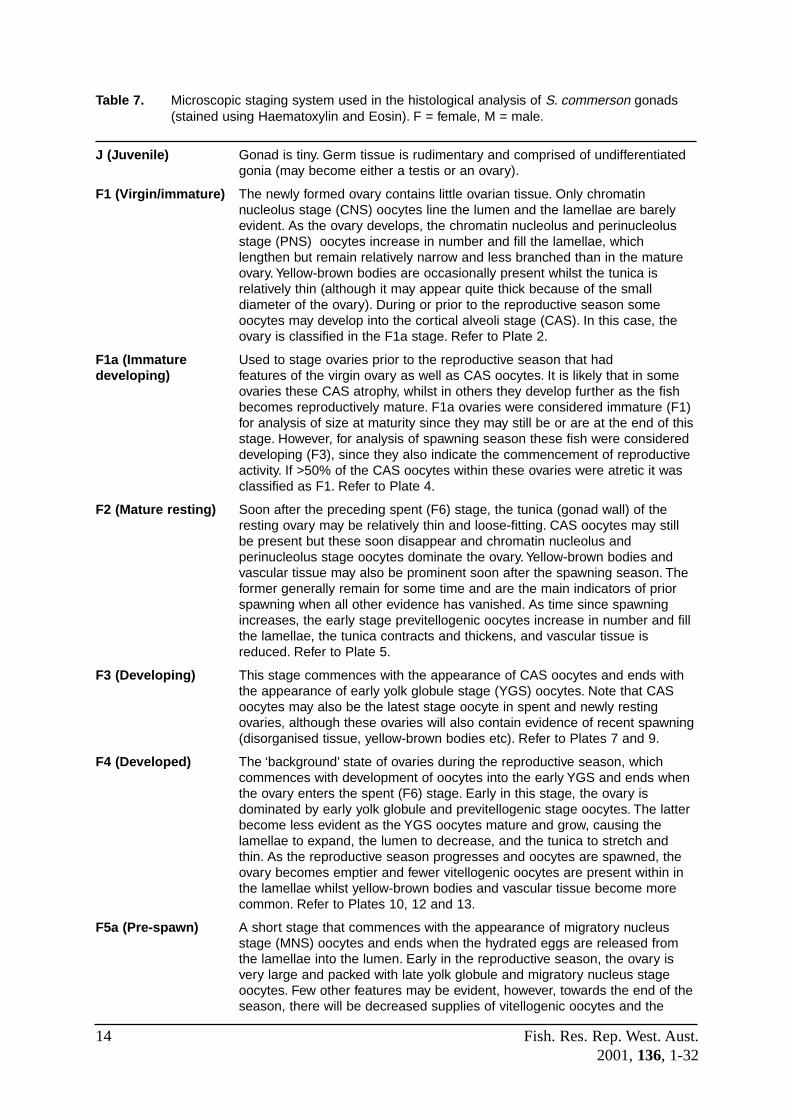
3.1.1 Ovaries
A conceptual diagram of the reproductive status for each ovarian stage in Table 7 is given inFigure 4. In this diagram, the juvenile (J) and virgin (F1) gonads have relatively lowreproductive status. This is also the case for the mature ovary when in the resting (F2) stage,until early signs of reproductive activity during the developing (F3) stage mark a rise in thereproductive status of the gonad. Within the period of reproductive activity, as marked by thepresence of developed (F4) ovaries, the reproductive status is relatively high, with short-termpeaks occurring during the brief periods when final maturation of the oocytes takes place(F5a) and spawning (F5b) occurs. This is followed by a drop in reproductive status duringthe brief post-spawning (F5c) stage back to the developed stage. However, if repeatspawning occurs over a short period of time (e.g. on consecutive days), then several peaks in
12 Fish. Res. Rep. West. Aust.2001, 136, 1-32
reproductive status will be overlayed. This will be indicated by the presence of migratorynucleus stage oocytes, hydrated oocytes and early/late stage POFs within the same gonad(the number of peaks depending on how many of these stages are present). Finally, at theend of the spawning season, the ovary enters the spent (F6) stage when residual vitellogenicoocytes are resorbed, marking a decrease in reproductive status back to that of the restingovary. Note that S. commerson ovaries in the spent (F6) stage also occur at other timesduring the annual cycle, indicating ovarian regression due to environmental, social orbiological factors.
Further, note the shaded area in Figure 4, which indicates the period prior to reproductiveactivity when immature (F1) and mature resting (F2) ovaries may look quite similar and cantherefore be confused. In contrast, these two stages are quite distinct soon after thereproductive period whilst the mature ovary still retains evidence of previous spawning. Thisevidence may include a loose, relatively thin tunica, misshapen lamellae with loose stromaand few previtellogenic oocytes, large amounts of vascular and muscular tissue, atreticvitellogenic oocytes, and yellow-brown bodies. As time since last spawning increases, thisevidence is lost as the ovary tightens up and fills with previtellogenic oocytes. The bestevidence to distinguish a mature resting from an immature ovary immediately prior to thestart of the spawning season is the presence of yellow-brown bodies (melanomacrophagecentres). These are distinctive, yellow-brown coloured masses that are repositories for theend products of cell breakdown (Ferguson 1989), and provide evidence that a particularovary has undergone oocyte atresia and cell breakdown associated with spawning. Althoughreduced in size from those present in the ovary soon after spawning, the yellow-brownbodies present in mature ovaries prior to the spawning season are generally quite common.Immature ovaries may also contain yellow-brown bodies, but these are usually small anduncommon. The lamellae of mature ovaries also tend to be more branched than those in theimmature ovary.
The F1a stage was used to identify ovaries that were probably immature but containedcortical alveoli stage oocytes. In some of these ovaries, the oocytes continue development asthe fish becomes sexually mature and spawns. However, given the number of small femaleswell below the estimated size at sexual maturity that had developing (but not developed)ovaries, it is likely that in some cases the cortical alveoli stage oocytes eventually atrophybecause the fish is not physiologically ready to spawn. Classifying these ovaries as F3 wouldfalsely inflate the number of mature fish in the samples as ovaries in this stage are generallyregarded as moving from the mature resting to the mature developed stage. Ovariesclassified as F1a were considered immature (F1) for analysis of size at maturity since theyare either still in this stage or are at the end of it. This stage also enables comparison of earlyovarian reproductive activity (as indicated by the appearance of cortical alveoli oocytes) inimmature and mature fish.

Fish. Res. Rep. West. Aust. 132001, 136, 1-32
3.1.2 Testes
S. commerson testes are difficult to categorise into stages because maturation of sperm tissuedoes not occur in distinct steps, but as a gradual change in the relative proportion ofspermatocytes, spermatids and spermatozoa. There can also be considerable variation in theappearance of the sperm tissue for each staging category. For instance, in some ripe testesthe tissue was dominated by late stage sperm in the peripheral sperm sinuses and outerregions of the gonad, whilst in others the late stage sperm dominated the inner regions andcentral sperm sinus. Staging of testes is therefore more prone to error than is the staging ofovaries. As with the ovarian cycle depicted in Figure 4, the immature (M1) and immaturedeveloping (M1a) stages have lowest reproductive status. A developing stage is notrecognised in males because there is no clear demarcation in the transition from the matureresting (M2) to the mature ripe (M3) stage. For similar reasons a spent stage is notrecognised. The ripe stage is the background state of the testis during the reproductiveperiod, with peaks in reproductive status during spawning (M4), as shown for females inFigure 4. However, the testis holds no evidence to identify whether a particular male is justabout to or has recently spawned – only that it is in the process of doing so.
Figure 2. Comparison of fresh and formalin preserved ovary weights of S. commerson. Note thatweights are of only one lobe of each ovary.
Figure 3. Comparison of fresh and frozen ovary weights of S. commerson. Note that weights areof only one lobe of each ovary.
r2 = 0.9973, n = 450
100
200
300
400
500
600
0 100 200 300 400 500 600
Frozen Weight (g)
Fre
sh W
eig
ht
(g)
r2 = 0.9985, n = 144
0
250
500
750
1000
1250
1500
1750
2000
0 250 500 750 1000 1250 1500 1750 2000
Fixed Weight (g)
Fre
sh W
eig
ht
(g)
14 Fish. Res. Rep. West. Aust.2001, 136, 1-32
Table 7. Microscopic staging system used in the histological analysis of S. commerson gonads(stained using Haematoxylin and Eosin). F = female, M = male.
J (Juvenile) Gonad is tiny. Germ tissue is rudimentary and comprised of undifferentiated gonia (may become either a testis or an ovary).
F1 (Virgin/immature) The newly formed ovary contains little ovarian tissue. Only chromatinnucleolus stage (CNS) oocytes line the lumen and the lamellae are barelyevident. As the ovary develops, the chromatin nucleolus and perinucleolusstage (PNS) oocytes increase in number and fill the lamellae, whichlengthen but remain relatively narrow and less branched than in the matureovary. Yellow-brown bodies are occasionally present whilst the tunica isrelatively thin (although it may appear quite thick because of the smalldiameter of the ovary). During or prior to the reproductive season someoocytes may develop into the cortical alveoli stage (CAS). In this case, theovary is classified in the F1a stage. Refer to Plate 2.
F1a (Immature Used to stage ovaries prior to the reproductive season that had developing) features of the virgin ovary as well as CAS oocytes. It is likely that in some
ovaries these CAS atrophy, whilst in others they develop further as the fishbecomes reproductively mature. F1a ovaries were considered immature (F1)for analysis of size at maturity since they may still be or are at the end of thisstage. However, for analysis of spawning season these fish were considereddeveloping (F3), since they also indicate the commencement of reproductiveactivity. If >50% of the CAS oocytes within these ovaries were atretic it wasclassified as F1. Refer to Plate 4.
F2 (Mature resting) Soon after the preceding spent (F6) stage, the tunica (gonad wall) of theresting ovary may be relatively thin and loose-fitting. CAS oocytes may stillbe present but these soon disappear and chromatin nucleolus andperinucleolus stage oocytes dominate the ovary. Yellow-brown bodies andvascular tissue may also be prominent soon after the spawning season. Theformer generally remain for some time and are the main indicators of priorspawning when all other evidence has vanished. As time since spawningincreases, the early stage previtellogenic oocytes increase in number and fillthe lamellae, the tunica contracts and thickens, and vascular tissue isreduced. Refer to Plate 5.
F3 (Developing) This stage commences with the appearance of CAS oocytes and ends withthe appearance of early yolk globule stage (YGS) oocytes. Note that CASoocytes may also be the latest stage oocyte in spent and newly restingovaries, although these ovaries will also contain evidence of recent spawning(disorganised tissue, yellow-brown bodies etc). Refer to Plates 7 and 9.
F4 (Developed) The ‘background’ state of ovaries during the reproductive season, whichcommences with development of oocytes into the early YGS and ends whenthe ovary enters the spent (F6) stage. Early in this stage, the ovary isdominated by early yolk globule and previtellogenic stage oocytes. The latterbecome less evident as the YGS oocytes mature and grow, causing thelamellae to expand, the lumen to decrease, and the tunica to stretch andthin. As the reproductive season progresses and oocytes are spawned, theovary becomes emptier and fewer vitellogenic oocytes are present within inthe lamellae whilst yellow-brown bodies and vascular tissue become morecommon. Refer to Plates 10, 12 and 13.
F5a (Pre-spawn) A short stage that commences with the appearance of migratory nucleusstage (MNS) oocytes and ends when the hydrated eggs are released fromthe lamellae into the lumen. Early in the reproductive season, the ovary isvery large and packed with late yolk globule and migratory nucleus stageoocytes. Few other features may be evident, however, towards the end of theseason, there will be decreased supplies of vitellogenic oocytes and the

Fish. Res. Rep. West. Aust. 152001, 136, 1-32
ovary will begin to appear disorganised. Yellow-brown bodies and vasculartissue will become more prominent at this time, and post-ovulatory follicles(POFs) may be present if the fish has previously spawned. Refer to Plates17, 18 and 19.
F5b (Spawning/ A short (and rarely observed) stage at the time of spawning when ovulated Running Ripe) eggs are found in the ovarian lumen and new POFs are present in the
periphery of the lamellae. The occasional unspawned hydrated oocyte maystill be present in the lamellae, as may be MNS oocytes if the fish ispreparing for further spawning and older POFs if the fish has recentlyspawned. General appearance of the ovary through the reproductive seasonwill change in a similar manner to the pre-spawning (F5a) ovary. Note thatovulated eggs may not be evident in the lumen after histological processing.Refer to Plates 22 and 23.
F5c (Post-spawn) A short stage defined by the presence of old and/or new POFs. Occasionally,a hydrated oocyte not released during the recent spawning may still bepresent within the stroma. The general appearance of the ovary through thereproductive season will change in a similar manner to the pre-spawning(F5a) ovary. Refer to Plates 18 and 23 for views of new and old POFs(although the ovary shown in Plate 18 has POFs it is considered pre-spawning due to the presence of hydrated oocytes).
F6 (Spent) A short stage between the developed and resting stages. The main criteria is> 50% atresia of the late YGS oocytes. Late in this stage, only previtellogenicoocytes (including CAS oocytes) and remnants of atrophied YGS oocytesremain. Once the latter are gone, the fish is classified as resting (F2). Thegonad tissue is disorganised with yellow-brown bodies, muscle, and vasculartissue usually prominent. The lamellae are thin, the lumen is large, and thetunica thickens as the gonad enters the resting state.
M1 (Virgin/immature) The newly differentiated testis contains spermatogonia and isolated pocketsof spermatocrypts. These mainly contain spermatocytes although crypts oflater stage sperm soon appear. Closer to maturity, the testis is similar to themature resting testis. Peripheral sperm sinuses may contain spermatazoaalthough generally the testis is dominated by connective tissue and littlesperm tissue is present. The central sperm sinus is small and empty.
M1a (Immature Used to stage testis that had features of both the virgin and mature developing) testes.
M2 (Mature resting) Soon after spawning, the peripheral sperm sinuses are present but containlittle sperm. Yellow-brown bodies, connective and muscle tissue areprominent but sperm tissue is uncommon. Spermatocytes are the dominantsperm tissue.
M3 (Developed) Appearance of the ripe testis varies, with the main criteria being abundanceof spermatozoa and/or spermatids in the outer portions of the gonad. In sometestes (notably prior to or at the start of the reproductive season), the centralsperm sinus may be small with a thick muscular wall and contain little or nosperm. However the peripheral sperm sinuses are conspicuous and filled withspermatozoa. Crypts of spermatozoa and spermatids are confined to theouter portion of the testis, and in some cases may be uncommon (althoughspermatogonia are common). In other testes, early stage spermatic tissue(particularly 1 and 2 spermatocytes) are abundant, although peripheralsperm sinuses are well developed, and spermatozoa and spermatidsdominate the inner regions of the testes (occupying more than half of thegametic tissue mass). The central sperm sinus may contain sperm.
M4 (Spawning) Running ripe. Testis is large in size and dominated by large peripheral andcentral sperm sinuses that are filled with spermatozoa. Crypts ofspermatocytes are uncommon and confined to the most outer region of each lobe.
16 Fish. Res. Rep. West. Aust.2001, 136, 1-32
Figure 4. Developmental and maturation cycle of S. commerson ovaries showing the relativereproductive status of each ovarian stage through time. J; juvenile stage. 1 to 6; ovarianstages as detailed in Table 7 (without the ‘F’). The cross-hatched area indicates theperiod when immature (stage 1) and mature resting (stage 2) ovaries are most difficultto tell apart. Note that the duration of the non-spawning period (as indicated by stage 2ovaries) will be longer than depicted here.
3.2 Staging system for macroscopic analysis of wholegonads
Description of the initial macroscopic staging system used in the analysis of whole gonads(ovaries and testes) is provided in Appendix B. Photographs of these stages are provided inPlates 1 to 24.
3.2.1 Ovaries
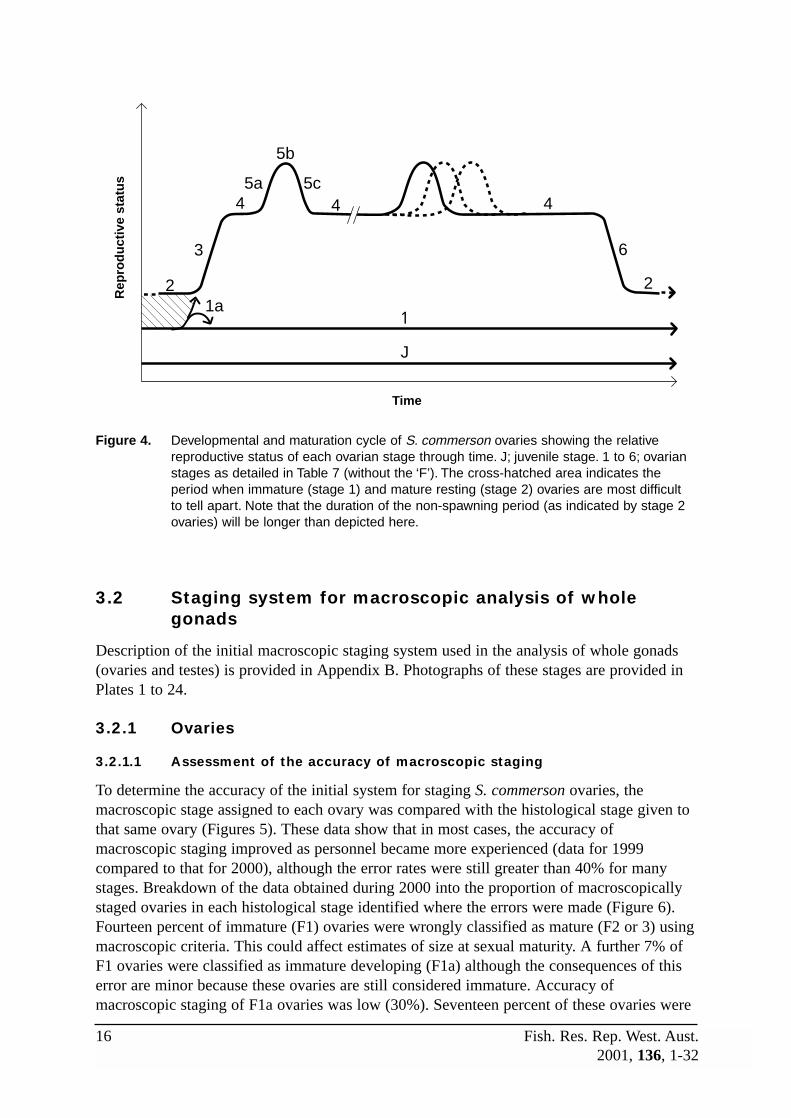
3.2.1.1 Assessment of the accuracy of macroscopic staging
To determine the accuracy of the initial system for staging S. commerson ovaries, themacroscopic stage assigned to each ovary was compared with the histological stage given tothat same ovary (Figures 5). These data show that in most cases, the accuracy ofmacroscopic staging improved as personnel became more experienced (data for 1999compared to that for 2000), although the error rates were still greater than 40% for manystages. Breakdown of the data obtained during 2000 into the proportion of macroscopicallystaged ovaries in each histological stage identified where the errors were made (Figure 6).Fourteen percent of immature (F1) ovaries were wrongly classified as mature (F2 or 3) usingmacroscopic criteria. This could affect estimates of size at sexual maturity. A further 7% ofF1 ovaries were classified as immature developing (F1a) although the consequences of thiserror are minor because these ovaries are still considered immature. Accuracy ofmacroscopic staging of F1a ovaries was low (30%). Seventeen percent of these ovaries were
2 2
3
5a
5b
5c4
6
1
J
Time
Rep
rod
uct
ive
stat
us
1a
44

Fish. Res. Rep. West. Aust. 172001, 136, 1-32
wrongly called F1, mainly because cortical alveoli stage oocytes were too small to be seenby eye. This would be of little consequence, however the erroneous classification 52% ofF1a ovaries as either F2 or F3 could affect estimates of size at sexual maturity.
Mature resting (F2) ovaries were uncommon during the periods selected for comparison ofstaging systems and were correctly identified macroscopically, although some ovaries inother stages of development were incorrectly staged as F2. Examination of data obtainedduring other periods when F2 ovaries were more common suggests a 29% error rate for thisstage. Most of this error occurs when the ovaries are wrongly classed as F3, indicating thatlate perinucleolus stage oocytes are sometimes mistaken for early cortical alveoli stageoocytes. Errors in classification of mature developing (F3) ovaries may also be due todifficulties in identification of cortical alveoli oocytes – either because they were too smallto detect or because they were wrongly considered to be in the yolk globule stage. Thesemistakes are always likely to occur but should have minor affect on conclusions drawn fromthe data, except for those wrongly classified as F1a (9%) as these could influence estimatesof size at sexual maturity.
The accuracy of macroscopically classifying F4 ovaries was reasonable (81%). Most errorwas again due to misidentifying yolk globule as cortical alveoli stage oocytes, leading to 7%of the F4 ovaries being called F3. As before, this is likely to occur regularly in a smallnumber of cases but should have minimal effect on general conclusions. Five percent of F4ovaries were designated as F1a, perhaps because they were reaching sexual maturity for thefirst time and the yolk globule stage oocytes were wrongly thought to be in the corticalalveoli stage. Again, this could affect estimates of size at sexual maturity. Most (91%) F5aovaries were properly identified. Difficulty in macroscopically distinguishing oocytes in themigratory nucleus stage of development will always lead to some error in identifying thesefrom F4 ovaries (4% in this case), whilst a further 4% were classified as F5c. These errorsshould be of minor consequence for general description of spawning patterns.
Spawning (F5b) ovaries were rare but unmistakable when present. Post-spawning (F5c)ovaries were difficult to reliably identify macroscopically because POFs cannot usually bedetected by eye. As a consequence, 18, 26 and 11% of F5c ovaries were called F4, F5a andF6, respectively. Identification of F6 ovaries is very unreliable because at the end of thespawning season many gonads are flaccid and bloody even if they are still reproductivelyactive. Only in a few cases can mass atresia of the yolk globule stage oocytes be detectedmacroscopically.
Data concerning the accuracy of macroscopically staging ovaries that have been frozen or onice for several days is limited (n = 80 for all stages combined), and confounded by the factthat histological analysis of frozen ovaries is also prone to error. Generally though, this dataindicates that breakdown of oocytes leads to confusion between stages 1a, 2 and 3, andbetween stages 4, 5a-c and 6.
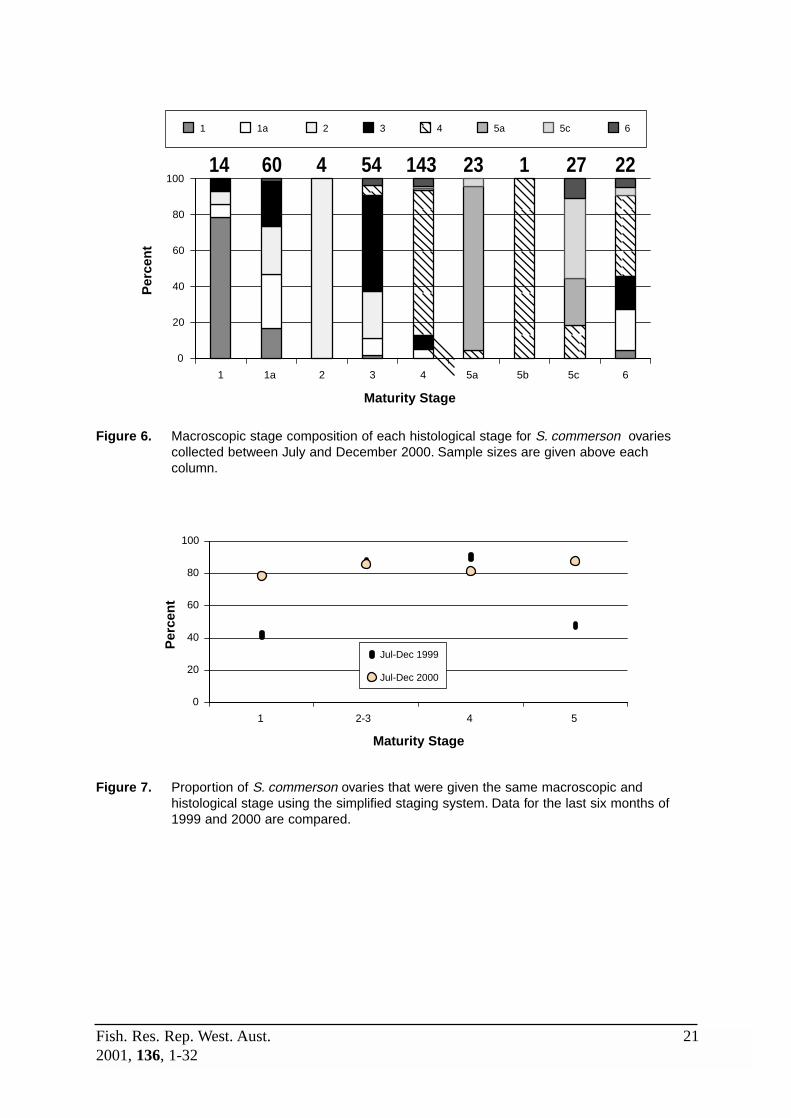
3.2.1.2 Development of a more accurate macroscopic staging system
Given the above assessment of error sources, accuracy of the macroscopic staging systemwas improved by pooling stages 1a, 2 and 3 together (as F2-3), stages 4, 5c and 6 together(as F4), and stages 5a and b together (as F5; Figure 7). Stage 1 was retained as previous (asF1). This resulted in a simpler and more reliable macroscopic staging system that provides aquick and cheap means of determining sex and general maturation cycle of the ovary (Table 8).

18 Fish. Res. Rep. West. Aust.2001, 136, 1-32
Because stage 1 has not been pooled with other stages, the accuracy of macroscopicallydetecting it remains at 79% (Figures 8). Stage 2-3 now defines the non-reproductive period,with the accuracy of macroscopic staging improved to 86%. Some error is inevitable inclassification of ovaries into this stage because late cortical alveoli stage oocytes willsometimes be identified as yolk globule stage (and the ovary wrongly classed F4). With theinclusion of F1a ovaries, some stage 2-3 ovaries that look immature will also be consideredF1. However these errors will have little affect on general analyses such as reproductivecycle. Note that this stage could simply be called F2, but leaving out the ‘3’ may causeconfusion since there is a jump to F4 in the new macroscopic staging to retain compatibilitywith the microscopic staging system. The combined stages of 4, 5c and 6 (as F4) now definethe period when the ovary is reproductively developed, with an accuracy of 81% usingmacroscopic criteria. Again, some error is inevitable if yolk globule stage oocytes areincorrectly called cortical alveoli stage. Finally, stages 5a and b indicate spawning peakswithin the reproductive period (as F5), with the macroscopic criteria accurate 88% of thetime. Some detail about spawning is lost with the exclusion of post-spawning (F5c) ovaries,again highlighting the requirement for histological sampling if more complete informationon spawning is required. The main source of error in macroscopically identifying the newstage 5 lies in mistakenly calling them F4 because oocytes in the migratory nucleus stagecannot be identified by eye.
3.2.2 Testes
Accuracy of the macroscopic staging system for S. commerson testes was not assessed dueto the focus on ovarian development as the more reliable and relevant descriptor ofspawning. Nevertheless, during the course of this study many male testes were examinedmacroscopically (n = 1906) and a number of these were processed histologically (n = 236).These histological samples were used to confirm the appearance of the macroscopic stagesgiven to testes so that they could be described (Table 8). Note that freezing of testes is likelyto create more errors in macroscopic staging than freezing of ovaries, because rupture ofspermatic tissue usually produces a milt-like appearance regardless of the true gonad stage.
Fish. Res. Rep. West. Aust. 192001, 136, 1-32
Table 8. Simplified macroscopic staging system for S. commerson gonads. F = female, M = male.
J (Juvenile) Gonad is a small, translucent pink ribbon lying imperceptibly along the dorsal wall of the peritoneal cavity. Sex of the fish cannot be determined.Refer to Plate 1A.
F1 (Virgin) Ovaries are small and usually translucent pink, apricot or ivory in colour(more opaque and red in unbled fish). In smaller females, the ovaries areflattened, flaccid, and relatively inconspicuous, but they become rounded andfirmer with a distinct lumen as the fish approaches maturity. The oocytes aremicroscopic resulting in a smooth, uniform appearance to the ovarian tissue.Yellow-brown bodies are uncommon. Refer to Plates 1B, 2 and 3.
F2-3 (Mature resting) Soon after completion of spawning activity, the resting ovaries appear flaccidwith prominent exterior blood vessels. Internally, the lumen is large. Few, ifany, oocytes can be seen, whilst yellow-brown bodies are distinct(sometimes very common) and blood clots may also be present. As timesince spawning increases, the ovaries become progressively rounder andfirmer as the gonad wall contracts and thickens and the ovarian tissuedevelops. Yellow-brown bodies may be evident for sometime and are themain feature used to distinguish mature resting from virgin ovaries. Colour istypically semi-translucent rose, pink or ivory, although in unbled fish theovaries are often red. Refer to Plates 4 – 9.
F4 (Developed) Early in this stage, the ovaries appear semi-translucent and speckledbecause of the many pre-vitellogenic oocytes. As more oocytes develop andturn opaque, the ovaries become large, rotund and opaque with prominentblood vessels. The opaque oocytes are visible through the thin gonad walland the colour is typically pale yellow or apricot. Towards the end of thereproductive period, the ovaries become more bloodied and flaccid as oocytereserves are depleted during spawning, and yellow-brown bodies maybecome more common and the lumen larger. Refer to Plates 10 – 16A.
F5 (Spawning) Ovaries are very large and swollen, although towards the end of thereproductive season they may become somewhat flaccid. Colour is apricot topeach with a prominent network of external blood vessels. The presence oftranslucent hydrated oocytes gives the ovaries a distinctive speckled orgranular appearance through the thin gonad wall. Eggs may also be releasedfrom the gonoduct when pressure is applied to the abdomen and may be present within the ovarian lumen. Refer to Plates 16B, 17, 20 – 22, 24.
M1 (Virgin) Testes are small and straplike with a smooth appearance and opaque, ivoryor bone colour (red if unbled). No milt is present in the transverse section. Itis difficult to distinguish testes early in this stage from juvenile gonads, andtestes late in this stage from mature resting (M2) testes.
M2 (Mature resting) Testes are small, opaque and straplike. Little or no milt is extruded from thetransverse section when squeezed (unless the sample has been frozen). Thesection is quite angular in shape, with the central tissue often browner thanthe bone or ivory coloured peripheral tissue. Sometimes the testes may alsobe tinged in red.
M3 (Developed) Testes are large, opaque, and ivory or bone in colour. The exterior dorsalblood vessel is large and small blood vessels are usually present. Internally,white sperm (milt) can usually be squeezed from the central sperm sinus. Insome cases this may not be possible, although milt should be visible in theouter areas of the transverse section.
M4 (Spawning) Running ripe. Similar to the ripe testis but more swollen and with largerexterior blood vessels. Milt is released with little or no pressure on the abdomen or when the testis is cut.

20 Fish. Res. Rep. West. Aust.2001, 136, 1-32
3.3 Pictorial guide to staging S. commerson ovaries
An insert booklet designed as a convenient field guide provides photographs (Plates 1 to 24)of S. commerson ovaries to complement the descriptive macroscopic and microscopicstaging systems given above. These photographs show the range in shape and colour ofovaries within each stage, as well as the close-up macroscopic appearance of the ovariantissue and histological features of the ovaries.
Figure 5. Proportion of S. commerson ovaries that were given the same macroscopic andhistological stage. Note that the 1a stage was not used in 1999.
0
20
40
60
80
100
1 1a 2 3 4 5a 5b 5c 6
Maturity Stage
Per
cen
t
Jul-Dec 1999
Jul-Dec 2000
Fish. Res. Rep. West. Aust. 212001, 136, 1-32
Figure 6. Macroscopic stage composition of each histological stage for S. commerson ovariescollected between July and December 2000. Sample sizes are given above eachcolumn.
Figure 7. Proportion of S. commerson ovaries that were given the same macroscopic andhistological stage using the simplified staging system. Data for the last six months of1999 and 2000 are compared.
0
20
40
60
80
100
1 2-3 4 5
Maturity Stage
Per
cen
t
Jul-Dec 1999
Jul-Dec 2000
0
20
40
60
80
100
1 1a 2 3 4 5a 5b 5c 6
Maturity Stage
Per
cen
t1 1a 2 3 4 5a 5c 6
14 60 4 54 143 23 1 27 22

22 Fish. Res. Rep. West. Aust.2001, 136, 1-32
Figure 8. Macroscopic stage composition of each histological stage for S. commerson ovariescollected between July and December 2000. Sample sizes are given above eachcolumn.
4.0 Discussion
4.1 Staging systems
Studies of fish reproduction are typically based on the microscopic examination ofhistologically prepared gonad sections because of the accuracy and detail this methodprovides. In contrast, data obtained using macroscopic staging is less frequently usedbecause it is less reliable and only appropriate for analyses of group statistics such as sexratios and general patterns of gonad development through the season. Macroscopic stagingdoes, however, have the advantage of speed and low cost, and is therefore ideal for routinemonitoring of exploited fish stocks. In some circumstances, such as when samples arefrozen, macroscopic staging may also be the most appropriate method to use.
Depending on the nature of the study, advantages of the macro- and microscopic stagingsystems can be exploited to provide the best possible use of the available resources andsamples. This was pertinent in the present study of S. commerson, where the sampling areawas large (> 1200 km of coastline), personnel and funding were limited, and a variety offresh, iced and frozen samples were the best that could be practically obtained. Using thestaging systems detailed in this study, all of these samples were staged macroscopically toprovide a general picture of S. commerson reproduction, whilst as many fresh samples astime, space and budget allowed were histologically processed in order to validate themacroscopic method and to gather information requiring detailed microscopic scrutiny ofindividual gonads. This combination of data subsequently led to a more complete picture ofreproduction than would have otherwise been possible.
In the present study, accuracies of 86, 81 and 88% for the resting, developed and ripe stages,respectively, were obtained for the macroscopic staging system. When compared with
0
20
40
60
80
100
1 2-3 4 5
Histological Stage
Per
cen
t
1 2-3 4 5
14 118 192 24
Fish. Res. Rep. West. Aust. 232001, 136, 1-32
similar data for the tropical snapper, Lutjanus vittus, in which accuracies for comparablestages of 92, 93 and 61% were recorded (West, 1990), there is clearly some room forimprovement. Nevertheless, some errors with the use of the macroscopic staging system areinevitable because of the difficulty at times in distinguishing between oocyte maturationstages, especially between the late cortical alveoli and early yolk globule stage ofdevelopment. Mistakes will also occur in distinguishing between immature and matureresting females, particularly prior to the onset of reproductive activity when mature ovarieshave lost evidence of spawning. This is why size at sexual maturity should ideally bedetermined for fish obtained during the spawning season. Further, information aboutspawning at the individual level will always be incomplete because post-ovulatory folliclesand migratory nucleus stage oocytes cannot generally be identified by eye (McPherson1992). Such problems can be minimised with the use of a magnifying glass, appropriatelighting and experience. The latter only comes with time, but the comprehensive written andpictorial description presented here should speed the learning process and improve theaccuracy of all personnel involved with staging gonads. As long as accuracy is optimised inthis way the data obtained from macroscopic staging will be a valid and useful adjunct toreproductive studies.
Whether the staging systems presented here are appropriate for other species of fish shouldbe critically assessed before usage because there are many such systems and few may begenerally applicable among species (Hay and Outram 1981). Macroscopic systems requireparticular assessment as they often include too many poorly defined stages (Hilge 1977). Incontrast, microscopic staging systems are sometimes too simplistic and do not allow all theinformation available in histological slides to be gathered. We believe that the stagingsystems developed here for Spanish mackerel adequately address these points and will beappropriate with minor modification to a wide variety of other species that are gonochoristicand have asynchronous ovarian development.
4.2 Other assessments
The 6% decrease in weight of formalin preserved ovaries is greater than that for preservedalbacore ovaries (1%; Ramon and Bartoo, 1997), and should be considered in analyses usingboth fresh and preserved ovary weights. For instance, description of S. commersongonadosomatic indices may require adjustment of the preserved ovary weights to make themcomparable with fresh ovary weights when both data sets are used. In contrast, the affect offreezing on S. commerson ovaries was negligible (slight increase) whereas the weight ofalbacore ovaries was decreased by 6% after freezing (Ramon and Bartoo, 1997). Given the rupture of cells and flaccid appearance of ovaries that have been frozen, there is littledoubt that freezing does result in fluid and hence weight loss as found in albacore. However,this appears to be negated in the case of S. commerson by uptake of the water used to thawthe gonads, even though they are drained prior to being weighed. Thus under normalprocedures used in this mackerel study, the weight of frozen ovaries is a close indication oftheir fresh weight.
The occasional difference in the mean size of the most mature stage oocytes measured indifferent areas of the gonad is likely to have negligible influence on the stage given to theovary, since the most mature oocyte stage did not differ between areas. Nevertheless, thedifference in mean size suggests that at times the oocytes in one region of the gonad may

24 Fish. Res. Rep. West. Aust.2001, 136, 1-32
mature into the next stage before the oocytes in other regions. Therefore the samplinglocation within the ovaries should be standardised. Comparison of fecundity estimatesindicates that final oocyte maturation is uniform throughout the gonad. The procedure usedin determining the fecundity of female S. commerson is therefore appropriate.
4.3 Problems associated with analysis of histologicallyprepared gonad sections
The microscopic staging of gonads inevitably involves a degree of subjectivity whenchoosing between stages. Experience plays a key role in limiting uncertainty associated withthis technique, particularly in being aware of the following sources of error:
• The presence of foreign gamete material on the histology slide: This can occur when thethinly cut sections are floated in the water bath before placement on the slide. Tinyportions of the sections sometimes break away in the bath and may be picked up onanother slide. It can be difficult to identify this foreign material, although it usuallycontrasts with the rest of the section.
• The use of a blunt blade when cutting the thin sections: This may drag gonad material andcan sometimes give a false impression of migratory nuclei in yolk globule stage oocytes.This problem is usually easy to identify because all the migratory nuclei will be travellingin the same direction and parts of the tissue will have a torn appearance.
• Inadequate preservation: If the gonad samples are not placed in preservative soon enough,if not enough preservative is used, or if the samples are frozen before preservation theresulting histological sections can be easily be misinterpreted. For instance, yolk globulestage oocytes in frozen samples may look hydrated or atretic due to rupture andcoalescence of the yolk globules and presence of vacuoles.
• Categorising ovaries based on latest stage oocyte: This is the accepted criteria forassigning stages and is usually appropriate. However, on occasion the latest stage is notrepresentative of the true ovarian state. An example of this is the presence of a hydratedoocyte that for some reason was not ovulated and remains embedded in the tissue despitethe fact that the fish is no longer spawning.
• Yellow-brown bodies as an indicator of sexual maturity: These structures are generallymore common in the gonads of mature fish due to atresia and breakdown of tissue duringand at the end of the reproductive season. However, they can also occur in the gonads ofimmature fish as a result of tissue breakdown for reasons other than spawning (eg diseaseand stress).

Fish. Res. Rep. West. Aust. 252001, 136, 1-32
5.0 Acknowledgements
The assistance of numerous commercial and recreational fishers who assisted in thecollection of samples is greatly appreciated. In particular we wish to acknowledge thesupport of Hayden and Karen Webb, John and Doreen Higgins, Andy Gilchrist, RonGoodlad, Jeff and Tony Westerberg, Ian Lew and Pam Canney, The KAI Fresh Fish Cocrew, Peter, Phil and Shane Moore, Dion Hipper, Barry Paxman, Eric Mustoe, the MackerelIslands crew, Ian Turner and the King Bay Game Fishing Club, Jamie Waite, and Snookyand the Exmouth Game Fishing Club. We would also like to thank Department of Fisheriesstaff who came on field trips, including Rod Lenanton, Dan Gaughan, Steve Newman, JustinKing, Graeme Baudains, Tim Leary, Ron Mitchell, Craig Skepper, Fiona Webster and JeffNorriss. The methods included in this Report will be utilised in research on Spanishmackerel in WA waters that is funded by the Fisheries Research and DevelopmentCorporation. Thanks to Rod Lenanton, Dan Gaughan, Gary Jackson, Glen Hynde and GlenYoung for reviewing the draft manuscript and providing many useful comments.
6.0 References
Collette, B. B. and Nauen, C. E. (1983) FAO Species catalogue. Vol 2: Scombrids of theworld. FAO Fisheries Synopsis 125, 137pp.
Crowe, F., Lehre, W., and Lenanton, R. (1999) A study into Western Australia’s open accessand wetline fisheries. Fisheries Research Report 118, 139pp.
DeMartini, E. E. and Fountain, R. (1981) Ovarian cycling frequency and batch fecundity inthe queenfish, Seriphus politus: Attributes representative of serial spawning fishes.Fisheries Bulletin 79 (3), 547-559.
Donohue, K., Edsall, P., Robins, J., and Tregonning, R. (1982) Exploratory fishing forSpanish mackerel in waters off Western Australia during the period June 16 to October16, 1981. Fisheries Research Report 57, 46pp.
Ferguson, H.W. (1989). Systemic pathology of fish. Iowa State University Press, Ames. 263pp.
Food and Agriculture Organisation (2000) FAO Yearbook 1998 Fishery Statistics. Captureproduction. 713pp FAO, Rome.
Garcia-Diaz, M. M., Tuset, V. M., Gonzalez, J. A., and Socorro, J. (1997) Sex andreproductive aspects in Serranus cabrilla (Osteichthyes: Serranidae): Macroscopic andhistological approaches. Marine Biology 127, 379-386.
Hay, D. E. and Outram, D. N. (1981) Assessing and monitoring maturity and gonaddevelopment in Pacific herring. Canadian Technical Report of Fisheries and AquaticSciences 998, 31p.

26 Fish. Res. Rep. West. Aust.2001, 136, 1-32
Hilge, V. (1977) On the determination of the stages of gonad ripeness in female bony fishes.
Meeresforsch 25, 149-155.
Hunter, J. R and Macewicz, B. J. (1985) Measurement of spawning frequency in multiple
spawning fishes. In: Lasker, R. (Eds) An egg production method for estimating
spawning biomass of pelagic fish: Application to the northern anchovy, Engraulis
mordax. 79-94, U.S. Dep. Commer.
Luna, S.M. (2000) Species information sheet-Scomberomorus. commerson. In Froese, R. and
Pauly, D. (eds) Fish Base (online)http://www.fishbase.org/Summary/SpeciesSummary.cfm?ID=121&genusname=Scomberomorus&specie
sname=commerson. [Date accessed 22/05/2001]
McPherson, G. R. (1992) Assessing macroscopic and histological stageing of yellowfin tuna
ovaries in the north-western Coral Sea. Information Series of the Department of
Primary Industries, Queensland Q192021,19 pp.
McPherson, G. R. (1993) Reproductive biology of the narrow-barred Spanish mackerel
(Scomberomorus commerson Lacepede, 1800) in Queensland waters. Asian Fisheries
Science 6, 169-182.
Ramon, D. and Bartoo, N. (1997) The effects of formalin and freezing on ovaries of
albacore, Thunnus alalunga. Fisheries Bulletin 95, 869-872.
Samoilys, M. A. and Roelofs, A. (2000) Defining the reproductive biology of a large
serranid, Plectropomus leopardus. CRC Reef Research Technical Manual 31, 36pp.
Sumner, N. R., Williamson, P. C., and Malseed, B. E. In press. A 12 month survey of coastal
recreational fishing in the Gascoyne region of Western Australia during 1998/99.
Fisheries Research Report, Fisheries WA.
Wallace, R. A. and Selman, K. (1981) Cellular and dynamic aspects of oocyte growth in
teleosts. American Zoology 21, 325-343.
West, G. (1990) Methods of assessing ovarian development in fishes: A review. Australian
Journal of Marine and Freshwater Research. 41, 192-222.
Yoshida, H. O. (1964) Skipjack tuna spawning in the Marquesas Islands and Tuamotu
Archipelago. Fisheries Bulletin 65 (2), 479-488.
Fish. Res. Rep. West. Aust. 272001, 136, 1-32
7.0 Appendices
APPENDIX A. Field sampling sheet used in the study of S. commerson biology.

28 Fish. Res. Rep. West. Aust.2001, 136, 1-32
APPENDIX B. Initial macroscopic staging system used in the analysis of S. commersongonads. F = female, M = male.
J (Juvenile) Gonad is a small, translucent pink ribbon lying imperceptibly along the dorsal wall of the peritoneal cavity. Sex of the fish cannot be determined.
F1 (Virgin/immature) Ovaries are small and usually translucent pink, apricot or ivory in colour(more opaque and red in unbled fish). In smaller females the ovaries areflattened, flaccid, and relatively inconspicuous, but they become roundedand firmer with a distinct lumen as the fish approaches maturity. Theoocytes are microscopic resulting in a smooth, uniform appearance to theovarian tissue. Yellow-brown bodies are uncommon.
F1a (Immature Used to stage ovaries immediately prior to the spawning period Developing) which have the features of a virgin (F1) ovary but which also contain
cortical alveoli stage oocytes.
F2 (Mature resting) Soon after completion of spawning activity the resting ovaries appearflaccid with prominent exterior blood vessels. Internally the lumen is large.Few if any oocytes can be seen whilst yellow-brown bodies are distinct(sometimes very common) and blood clots may also be present. As timesince spawning increases, the ovaries become progressively rounder andfirmer as the gonad wall contracts and thickens and the ovarian tissuedevelops. Yellow-brown bodies may be evident for sometime and are themain feature used to distinguish mature resting from virgin ovaries. Colouris typically semi-translucent rose, pink or ivory, although in unbled fish theovaries are often red.
F3 (Developing) Ovaries may still have a semi-translucent, rose or pinkish colour (red ifunbled), but become larger and lose translucency as the oocytes becomeopaque. This gives the ovarian tissue a slightly speckled or granularappearance. Exterior blood vessels become more prominent during thisstage. It is often difficult to distinguish late developing from earlydeveloped ovaries.
F4 (Developed) Early in this stage the ovaries appear semi-translucent and speckledbecause there are still many translucent immature oocytes. As moreoocytes develop and turn opaque the ovaries become large, rotund andopaque with prominent blood vessels. The opaque oocytes are visiblethrough the thin gonad wall and the colour is typically pale yellow orapricot. Towards the end of the reproductive period the ovaries becomemore bloodied and flaccid as oocyte reserves are depleted duringspawning, and yellow brown bodies may become more common and thelumen larger.
F5a (Pre-spawn) Ovaries are very large and swollen, although towards the end of thereproductive season they may become somewhat flaccid. Colour is apricotto peach with a prominent network of external blood vessels. Thepresence of translucent hydrated oocytes gives the ovaries a distinctivespeckled or granular appearance through the thin gonad wall. However, ifthe oocytes are still in the migratory nucleus stage of development theovary may be difficult to distinguish from the developed stage. This stageis distinguished from the next (5b) by the lack of hydrated oocytes withinthe lumen.

Fish. Res. Rep. West. Aust. 292001, 136, 1-32
F5b (Spawning) Running ripe. External appearance is similar to that of the pre-spawning(F5a) ovary, although eggs may be released from the gonoduct whenpressure is applied to the abdomen of the fish. This may not be possible if spawning was not imminent, but eggs should still be present within the lumen.
F5c (Post-spawn) Usually difficult to distinguish from developed ovaries except for a moreflaccid appearance. May also be confused with pre-spawning ovaries ifunspawned hydrated oocytes are still present.
F6 (Spent) Difficult to distinguish from developed ovaries late in the reproductiveseason that are also flaccid and bloodied, with a large lumen and relativelyfew opaque oocytes present within the ovarian tissue. Yellow-brown bodiesmay also be common and the external blood vessels prominent. Thisstage may also be difficult to identify from ovaries that have recentlyentered the non-spawning period.
M1 (Virgin) Testes are small and straplike with a smooth appearance and opaque,ivory or bone colour (red if unbled). No milt is present in the transversesection. It is difficult to distinguish testes early in this stage from juvenilegonads, and testes late in this stage from mature resting (M2) testes.
M1a (Immature Used to stage testes that are small with features of the virgin (M1) developing) testes but which also produce milt when squeezed.
M2 (Mature resting) Testes are small, opaque and straplike. Little or no milt is extruded fromthe transverse section when squeezed (unless the sample has beenfrozen). The section is quite angular in shape, with the central tissue oftenbrowner than the bone or ivory coloured peripheral tissue. Sometimes thetestes may also be tinged in red.
M3 (Developed) Testes large, opaque, and ivory or bone in colour. The exterior dorsalblood vessel is large and small blood vessels are usually present.Internally, white sperm (milt) can usually be squeezed from the centralsperm sinus. In some cases this may not be possible, although milt shouldbe visible in the outer areas of the transverse section. In the case of thelatter, the testes may be misidentified as a resting or virgin stage.
M4 (Spawning) Running ripe. Similar to the ripe testis but more swollen and with largerexterior blood vessels. Milt is released with little or no pressure on the abdomen or when the testis is cut.
30 Fish. Res. Rep. West. Aust.2001, 136, 1-32
APPENDIX C. Reproductive analysis worksheet used in the study of S. commerson biology.
Fish. Res. Rep. West. Aust. 312001, 136, 1-32
APPENDIX D. Fecundity analysis worksheet used in the study of S. commerson biology.

32 Fish. Res. Rep. West. Aust.2001, 136, 1-32

Fish. Res. Rep. West. Aust. 12001, 136, 1-12 Insert
List of Plates
Plate 1. In situ views of a juvenile gonad (A) and an immature ovary (B) (both arrowed), showing the positionof the gonad along the dorsal posterior wall of the visceral cavity. Note that viscera have beenremoved so the gonad can be viewed. Fork lengths of fish: 400 and 580 mm (respectively).
Plate 2. Whole and sectioned views of an immature (F1) ovary. La; lamellae. Lu; lumen. T; tunica. Scale bar =1 mm. Fork length of fish: 669 mm.
Plate 3. Whole immature (F1) ovaries. Note that the first ovary is the same as shown in Plate 1(B). Fork lengthof fish: 580 and 826 mm, respectively.
Lu La
T
BA

2 Fish. Res. Rep. West. Aust.2001, 136, 1-12 Insert
2 Fish. Res. Rep. West. Aust.2001, 136, 1-12 Insert
Plate 4. Whole and sectioned views of an ovary classified as F1a because it is probably an immature (F1)ovary in which oocytes have developed into the cortical alveoli stage (CA). The CA stage precedesvitellogenesis and is used to identify ovaries that are showing early signs of reproductive development(F3). It is likely that some F1a ovaries will continue developing and become reproductive whilst otherswill regress back to the immature (F1) state. Note: this ovary is classified as F2-3 using the simplifiedmacroscopic staging system. Scale bar = 300 mm. Fork length of fish: 884 mm.
Plate 5. Whole and sectioned views of a mature resting (F2) ovary (F2-3 using the simplified macroscopicstaging system). Note the red colour of the whole ovary, which is probably due to the fish not beingbled after capture. Scale bar = 300 mm. Fork length of fish: 1500 mm.
Plate 6. Whole mature resting (F2) ovaries (F2-3 using the simplified macroscopic staging system). Forklength of fish: 1021 and 1077 mm, respectively.
CA
CA
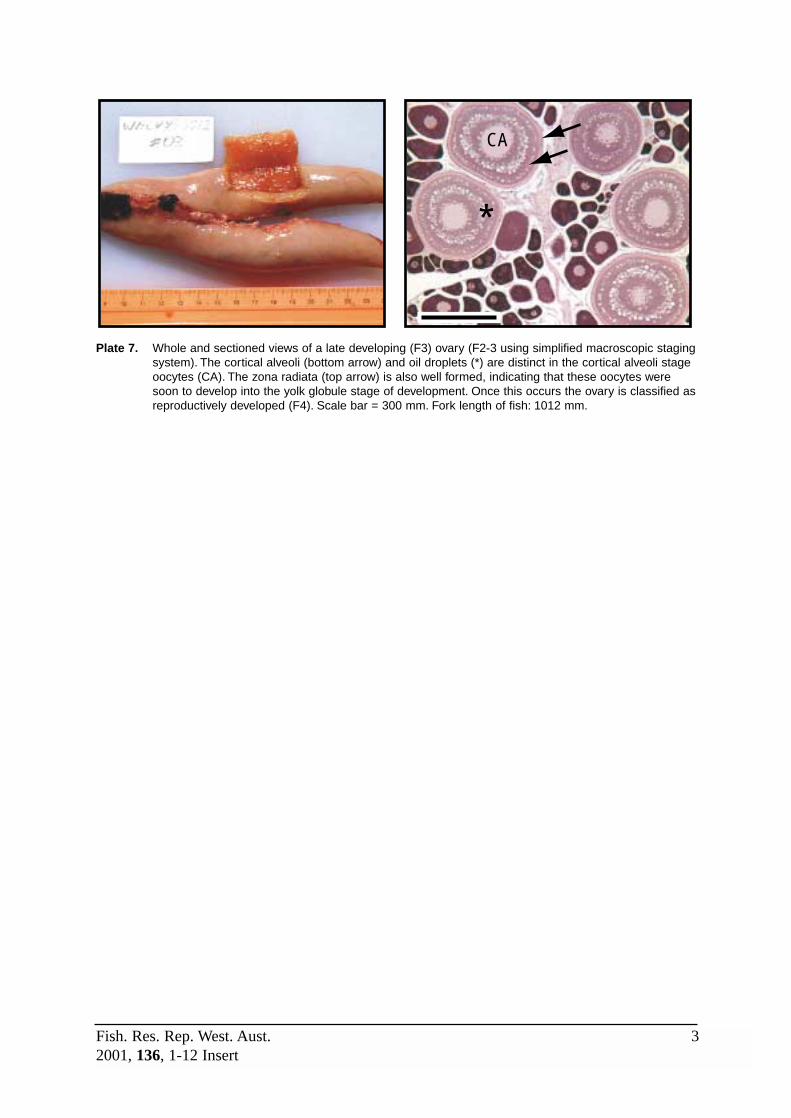
Fish. Res. Rep. West. Aust. 32001, 136, 1-12 InsertFish. Res. Rep. West. Aust. 32001, 136, 1-12 Insert
Plate 7. Whole and sectioned views of a late developing (F3) ovary (F2-3 using simplified macroscopic stagingsystem). The cortical alveoli (bottom arrow) and oil droplets (*) are distinct in the cortical alveoli stageoocytes (CA). The zona radiata (top arrow) is also well formed, indicating that these oocytes weresoon to develop into the yolk globule stage of development. Once this occurs the ovary is classified asreproductively developed (F4). Scale bar = 300 mm. Fork length of fish: 1012 mm.
CA
*
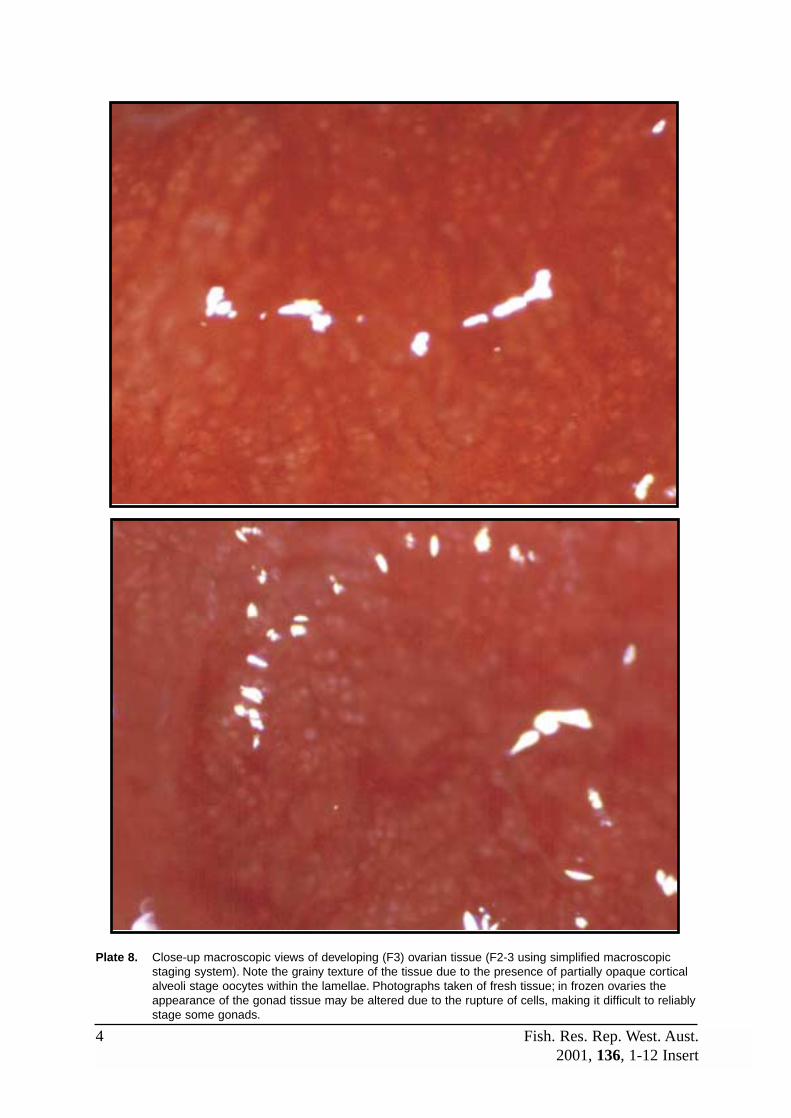
4 Fish. Res. Rep. West. Aust.2001, 136, 1-12 Insert
Plate 8. Close-up macroscopic views of developing (F3) ovarian tissue (F2-3 using simplified macroscopicstaging system). Note the grainy texture of the tissue due to the presence of partially opaque corticalalveoli stage oocytes within the lamellae. Photographs taken of fresh tissue; in frozen ovaries theappearance of the gonad tissue may be altered due to the rupture of cells, making it difficult to reliablystage some gonads.

Fish. Res. Rep. West. Aust. 52001, 136, 1-12 Insert
Plate 9. Whole and sectioned views of a developing (F3) ovary that was frozen after capture (F2-3 using thesimplified macroscopic staging system). CA; cortical alveoli stage oocyte. Scale bar = 300 mm. Forklength of fish: 1180 mm.
Plate 10. Whole and sectioned views of a fully developed (F4) ovary. The whole ovary is shown in situ (arrows)and fills most of the visceral cavity of the fish (note that the fish has been filleted). The sectioned viewshows larger yolk globule stage oocytes (YG) alongside cortical alveoli stage oocytes (CA). Scale bar= 300 mm. Fork length of fish: 1026 mm.
YG
CA
CA

6 Fish. Res. Rep. West. Aust.2001, 136, 1-12 Insert
Plate 11. Close-up macroscopic views of developed (F4) ovarian tissue. The top photograph shows bloodvessels and opaque yolk globule stage oocytes viewed through the ovarian wall. In the bottomphotograph the ovary has been cut to expose the tightly packed yolk globule stage oocytes within thelamellae.
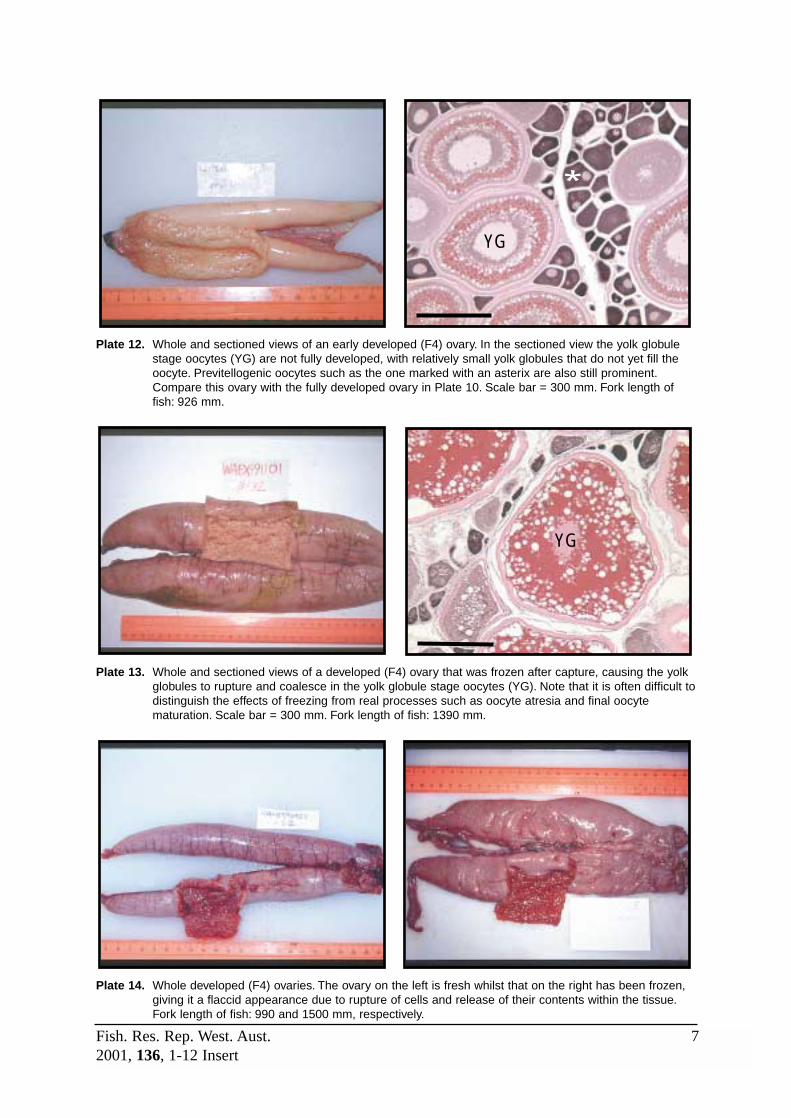
Fish. Res. Rep. West. Aust. 72001, 136, 1-12 Insert
Plate 12. Whole and sectioned views of an early developed (F4) ovary. In the sectioned view the yolk globulestage oocytes (YG) are not fully developed, with relatively small yolk globules that do not yet fill theoocyte. Previtellogenic oocytes such as the one marked with an asterix are also still prominent.Compare this ovary with the fully developed ovary in Plate 10. Scale bar = 300 mm. Fork length offish: 926 mm.
Plate 13. Whole and sectioned views of a developed (F4) ovary that was frozen after capture, causing the yolkglobules to rupture and coalesce in the yolk globule stage oocytes (YG). Note that it is often difficult todistinguish the effects of freezing from real processes such as oocyte atresia and final oocytematuration. Scale bar = 300 mm. Fork length of fish: 1390 mm.
Plate 14. Whole developed (F4) ovaries. The ovary on the left is fresh whilst that on the right has been frozen,giving it a flaccid appearance due to rupture of cells and release of their contents within the tissue.Fork length of fish: 990 and 1500 mm, respectively.
YG
YG
*

8 Fish. Res. Rep. West. Aust.2001, 136, 1-12 Insert
Plate 15. Whole developed (F4) ovaries (both fresh). Note the difference in colour. The ovary on the right isbeginning to look somewhat flaccid, indicating that this fish had spawned previously and the ovarywas becoming deplete of oocytes. Fork length of fish: 1181and 1213 mm, respectively.
Plate 16. Whole views of (A) a developed (F4) and (B) a pre-spawning (F5a) ovary (F5 using the simplifiedmacroscopic staging system). Both ovaries were frozen after capture.
Plate 17. Whole and sectioned views of a pre-spawning (F5a) ovary in which the oocytes have becomehydrated (Hy) prior to ovulation and spawning (F5 using the simplified macroscopic staging system).Note the size of the hydrated oocyte in comparison to the previtellogenic oocytes (arrow). Scale bar =1mm. Fork length of fish: 1063 mm.
Hy
A B

Fish. Res. Rep. West. Aust. 92001, 136, 1-12 Insert
Plate 18. Sectioned views of the ovary in Plate 17. The left photograph shows a hydrated oocyte (Hy) with alarge clear staining oil droplet. The yolk globules have not fully coalesced to produce a uniform yolkmass. A ‘late’ stage post-ovulatory follicle is arrowed, and is shown in magnified view in the rightphotograph. Note the granulosa cell layer (bottom arrow) that has become detached from the hydratedegg in the bottom left hand corner of the right photograph. When the oocyte is released into the lumenat ovulation this follicle (comprising the granulosa and thecal cell layers) will be left behind as thepost- ovulatory follicle. Scale bars: left = 300 mm, right = 60 mm.
Plate 19. Final maturation of the oocyte prior to spawning. (A) Migratory nucleus stage in which the nucleus(arrowed) has moved to the periphery of the oocyte prior to it breaking down. The large oil droplet isevident and some yolk globules are still intact. (B) Hydrated stage showing the fairly uniform yolkmass which stains pale pink but is translucent when viewed macroscopically. Scale bars in bothphotographs = 300 mm.
A B
HyHy
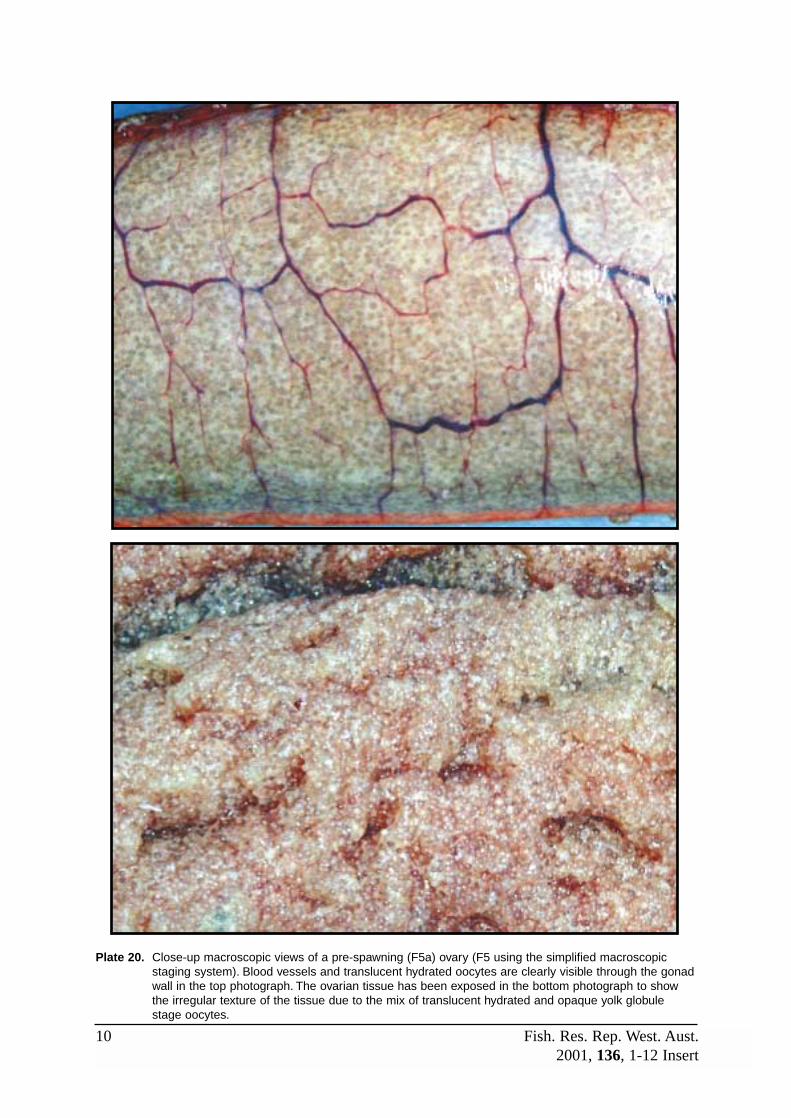
10 Fish. Res. Rep. West. Aust.2001, 136, 1-12 Insert
Plate 20. Close-up macroscopic views of a pre-spawning (F5a) ovary (F5 using the simplified macroscopicstaging system). Blood vessels and translucent hydrated oocytes are clearly visible through the gonadwall in the top photograph. The ovarian tissue has been exposed in the bottom photograph to showthe irregular texture of the tissue due to the mix of translucent hydrated and opaque yolk globulestage oocytes.

Fish. Res. Rep. West. Aust. 112001, 136, 1-12 Insert
Plate 21. Whole views of pre-spawning (F5a) ovaries (F5 using the simplified macroscopic staging system).Fork length of fish: 1027 and 1112 mm, respectively.
Plate 22. Macroscopic and sectioned views of a spawning (F5b) ovary (F5 using the simplified macroscopicstaging system). Hydrated oocytes fill the ovarian lumen (arrows) and readily flow out of the ovarywhen cut (more easily seen in Plate 24). The sectioned view shows the hydrated oocytes within thelumen (Lu) whilst yolk globule and earlier stage oocytes remain within the lamellae (La). The ovulatedoocyte is termed an egg. Scale bar = 1 mm. Fork length of fish: 1011 mm.
Lu
La
La

12 Fish. Res. Rep. West. Aust.2001, 136, 1-32
Plate 23. Section views of the spawning (F5b) ovary shown in Plate 22. (A) A hydrated oocyte (Hy) in the lumenof the ovary adjacent to ‘new’ post-ovulatory follicles (arrows) that remain embedded in the tissue atthe edge of the lamella. A yolk globule stage oocyte (YG) is also present in the tissue. Scale bar =300 mm. (B) A ‘new’ post-ovulatory follicle showing the outer thecal (top arrow) and inner granulosa(bottom arrow) cell layers. Note the linear arrangement of cells and convoluted appearance of thepost-ovulatory follicle soon after spawning (compare with the ‘old’ post-ovulatory follicle shown in Plate17). Scale bar = 100 mm.
Plate 24. Close-up macroscopic view of the spawning (F5b) ovary shown in Plate 22 (F5 using the simplifiedmacroscopic staging system). Arrows point to hydrated oocytes flowing out of the lumen.
Hy
YG
A B