Michael J. Bedzyk and Likwan Cheng, X-ray Standing Wave...
47
Michael J. Bedzyk and Likwan Cheng, "X-ray Standing Wave Studies of Minerals and Mineral Surfaces: Principles and Applications" in Applications of Synchrotron Radiation in Low-Temperature Geochemistry and Environmental Science, Edited by P. Fenter, M. Rivers, N. C. Sturchio and S. Sutton (Reviews in Mineralogy and Geochemistry, Vol. 49), Geochemical Society 221-266 (2002).
Transcript of Michael J. Bedzyk and Likwan Cheng, X-ray Standing Wave...

Michael J. Bedzyk and Likwan Cheng,
"X-ray Standing Wave Studies of Minerals and Mineral Surfaces: Principles and Applications"
in Applications of Synchrotron Radiation in Low-Temperature Geochemistry and EnvironmentalScience,
Edited by P. Fenter, M. Rivers, N. C. Sturchio and S. Sutton
(Reviews in Mineralogy and Geochemistry, Vol. 49),Geochemical Society 221-266 (2002).

1529-6466/00/0049-0004$05.00
X-ray Standing Wave Studies of Minerals and Mineral Surfaces: Principles and Applications
Michael J. Bedzyk1,2 and Likwan Cheng3 1Department of Materials Science and Engineering
Northwestern University Evanston, Illinois, 60208, U.S.A.
2Materials Science Division 3Environmental Research Division
Argonne National Laboratory Argonne, Illinois, 60439, U.S.A.
INTRODUCTION With a penetration depth ranging from microns to millimeters, Ångstrom-
wavelength X-rays are an ideal probe for studying atomic-scale buried structures found in the natural environment, such as impurities in minerals and adsorbed ions at mineral-water interfaces. But this penetration depth also makes an X-ray beam inherently less useful as a spatially localized probe. Using the superposition of two coherently coupled X-ray beams, however, makes it possible to localize the X-ray intensity into interference fringes of an X-ray standing wave (XSW) field, as illustrated in Figure 1, and thereby attain a spatially localized periodic probe with a length scale equivalent to the XSW period. The XSW period is
12sin
DQ
λθ
= = (1)
where λ is the X-ray wavelength and 2θ is the scattering angle or angle separation between the two coherently coupled wave vectors KR and K0. In reciprocal space, the
444
Figure 1. Top: A standing wave field formed from the superposition of two traveling plane waves of wavelength λ and intersection angle (scattering angle) 2θ . The standing wave period is D as defined in Equation (1). Bottom: The two traveling planes waves are represented in reciprocal space by wave vectors K0 and KR. K0 = KR = 1/λ. The standing wave is defined by standing-wave vector Q defined in Equation (2).

222 Bedzyk & Cheng
scattering vector, or wave vector transfer, is defined as
0R= −Q K K (2)
Q is in the direction perpendicular to the equal-intensity planes of the XSW and has a magnitude that is the reciprocal of D. Thus, Q is also referred to as the standing wave vector.
An X-ray standing wave can be used as an atom-specific probe via the photoelectric effect, which can be observed by photoelectron emission, fluorescence, or Auger electron emission. There are a number of mechanisms for generating an XSW. The simplest and perhaps most practical method for producing an XSW is by reflection, in which case the superposition of the reflected and incident X-ray plane waves gives rise to the standing wave. This two-beam reflection condition can be produced by (1) strong Bragg diffraction from a single crystal, (2) strong Bragg diffraction from a periodically layered synthetic microstructure, (3) total external reflection (TER) from an X-ray mirror, or (4) weak kinematical Bragg diffraction from a single-crystal thin film.
As an element-sensitive high-resolution structural probe, the XSW technique has been used in the past two decades to investigate a wide range of surface, interface, and thin film structures. These include semiconductor, metal, and oxide surfaces; electrochemical interfaces; and organic membranes. In this article, we present an introduction to the basic principles of the major types of XSW techniques. We will discuss how the XSW phase is directly linked to the substrate reflecting lattice planes or interfaces and can thereby be used to directly determine the positions of the selected elements relative to these substrate planes. We will discuss the experimental aspects of the XSW method, focusing on single-crystal diffraction XSW at a synchrotron radiation source. We will then describe advances in XSW applications in geochemistry and environmental science. These include four areas of structural investigations: impurity structures in minerals, aqueous ion adsorption and incorporation at mineral surfaces, metal distribution in organic membranes and organic matter at solid surfaces, and the electrical double-layer structure at water-solid interfaces.
X-RAY STANDING WAVES BY BRAGG DIFFRACTION FROM A SINGLE CRYSTAL
The most commonly used means for generating an X-ray standing wave is the use of strong Bragg diffraction from a single-crystal. In 1964, using Bragg diffraction from a Ge crystal, Batterman (1964) made the first observation of the XSW effectan angularly modulated Ge fluorescence yield across the reflection. He then used this fluorescence anomaly to locate As impurity atom sites within a Si crystal (Batterman 1969). Later, Golovchenko and coworkers realized that the XSW field generated inside the crystal extended above the crystal surface and used the XSW to determine the crystallographic registration of adsorbate atoms with respect to the underlying substrate lattice (Cowan et al. 1980; Golovchenko et al. 1982). These experiments are the early demonstrations of what has now become an established technique for atomic-resolution surface science. The X-ray standing wave field
Following the observations of Batterman, a quantitative explanation of the fluorescence yield has been based on the dynamical diffraction theory of von Laue and Ewald (Laue 1960). The formal theory for the Bragg diffraction XSW technique has been described by Afanas’ev et al. (1978), Takahashi and Kikuta (1979), Hertel et al. (1985) and Bedzyk and Materlik (1985), as well as in a review by Zegenhagen (1993). The theory of dynamical X-ray diffraction has been reviewed by Laue (1960), Batterman and

X-ray Standing Wave Studies 223
Cole (1964) and Authier (2001). Consider the two-beam Bragg diffraction condition described in Figure 2; the
incident and the Bragg-diffracted X-ray plane waves are as follows
( )( )
0 0 0( , ) exp 2
( , ) exp 2H H H
t i t
t i t
π ν
π ν
= − − = − −
i
i
r E K r
r E K r
E
E (3)
Here E0 and EH are the complex amplitudes associated with the incident and diffracted X-ray plane-waves, K0 and KH are the respective complex wave vectors inside the crystal, and ν is the X-ray frequency. The two wave vectors are coupled according to the Laue condition, with
0H= −H K K (4)
where H = ha* + kb* + lc* is the reciprocal lattice vector. The scalar equivalent of the Laue condition reduces to Bragg's law
2 sinH Bdλ θ= (5)
where dH is the lattice spacing of the hkl crystal diffraction planes and θB is the geometrical Bragg angle. The interference between the incident and diffracted plane
Figure 2. X-ray standing wave field formed in a crystal and above its surface by the interference of incident and Bragg-diffracted monochromatic X-ray plane waves. The inset shows the reciprocal space diagram for the Laue condition described by Equation (4).

224 Bedzyk & Cheng
waves results in a standing-wave field. The normalized intensity of the total E-field that gives rise to the XSW field is
( )
20
20
( )
,
1 , above the surface1 ( ) 2 ( ) cos( ( ) 2 )
, at depth below surface
H
zz
I rE
R R vze µ θ
θ
θ θ θ π −
+=
= + + − × i
E E
H r
(6)
where the reflectivity R is related to the E-field amplitude ratio as
2
0
HERE
= (7)
and the XSW phase, v, is identical to the relative phase between the two E-field amplitudes
( )0 0
expH HE E ivE E
= (8)
From Equations (1) and (5), one can conclude that for Bragg diffraction the XSW periodicity is equal to the lattice d-spacing of the H = hkl diffraction planes; that is, D = dH.
In the following discussion, we will assume the most common case of σ-polarized symmetrical Bragg diffraction from a semi-infinite crystal with 1° < θB < 89°. Figure 2 shows the case of σ-polarization with the vector directions of the two E-fields pointing perpendicular to the scattering plane defined by the two wave vectors. The incident and exit angles of the two wave vectors with respect to the surface are equivalent for a symmetric reflection.
From dynamical diffraction theory (Batterman and Cole 1964), the E-field amplitude ratio is defined as
( )2
0
1H H
H
E FE F
η η= − ± − (9)
where FH and HF are the H and −H structure factors (see chapter by Fenter, in this volume, for a definition of FH), and η is a normalized, dimensionless complex angular parameter defined as
0sin(2 )B
H H
FF F
θ θη
−∆ + Γ=
Γ (10)
In this equation, ∆θ = θ – θB is the relative incident angle. Γ = (reλ2)/(πVc) is a scaling factor, where re = 2.818×10⁻⁵ Å is the classical electron radius and Vc is the volume of the unit cell (uc). (To separate the real and the imaginary parts of a complex quantity A, we use the notation A = A′ + iA″, where A′ and A″ are real quantities.) From Equations (7), (9), and (10), it can be shown that the reflectivity approaches unity over a very small arc-second angular width ω, defined as
2
01 1
2sin 2
H HH H
B
F F F F Fη ηω θ θ
θ′=− ′=
′ ′ ′′ ′′ ′′Γ + −= ∆ − ∆ = (11)

X-ray Standing Wave Studies 225
This is the “Darwin width” of the reflectivity curve or “rocking curve.” From dynamical diffraction theory, the relative phase, v, of the standing wave field
decreases by π radians as the incident angle is scanned from the low-angle side to the high-angle side of the rocking curve (i.e., from η′ = 1 to η′ = −1 ). According to Equation (6), this causes the standing-wave antinodal planes to move by a distance of 1
2 dH in the −H direction, as illustrated in Figure 3. Also from Equation (6), if R = 1, the intensity at the antinode is four-times the incident intensity, |E0|2, and there is zero intensity at the node. The case of I = 4 at the antinode assumes that the field is being examined above the surface or at a shallow depth where exp(−µ zz) ≈ 1.
The Darwin width, ω, is dependent on both the structure factors and the wavelength (or energy Eγ) of the incident X-ray beam. For a typical low-index strong Bragg reflection from a mineral crystal ω is within the range of 5 to 100 microradians (µrad) for X-rays within the range of Eγ = 5 keV to 20 keV. The bottom portion of Figure 4 shows a calculated rocking curve R(θ ) (according to Eqn. 7, 9 and 10) and the corresponding phase v (according to Eqn. 8) for the calcite (1014) Bragg reflection at Eγ = 13.8 keV. In this case, ω = 20.0 µrad = 4.12 arc-sec. Semi-empirically the full-width at half-maximum is FWHM = 1.2ω. Notice that the center of the rocking curve is shifted slightly above the geometrical Bragg angle θB by ~22 µrad. This shift is the result of refraction at the crystal-air interface. In general, this shift is 0 / sin 2 BFθ θ′∆ = Γ . The asymmetry in the reflectivity curve, namely the slight diminishing from R = 1 as the angle is increased through the strong Bragg condition, is due to the movement of the XSW. On the high-angle side the XSW antinodes align with the strong X-ray absorption planes in the crystal. Therefore absorption is higher than average on the high-angle side and weaker on the low-angle side.
Figure 3. A schematic illustration depicting the spatial relationship between the Bragg diffraction generated XSW and the diffraction planes. The XSW antinodal planes are parallel to the diffraction planes and have the same periodicity. Advancing in angle through the strong Bragg diffraction condition (Bragg band-gap) causes the XSW to phase shift inward by / 2Hd . (a) On the low-angle side of the Bragg reflection, the XSW nodal planes are aligned with the diffraction planes. (b) On the high-angle side of the Bragg reflection, the antinodal planes are aligned with the diffraction planes. The position of the diffraction planes relative to the bulk lattice are defined by the maxima in the real part of the Hth Fourier component of the effective electron density (see, for example, Bedzyk and Materlik, 1985).

226 Bedzyk & Cheng
The exponential damping factor in Equation (6) accounts for attenuation effects within the crystal, in which case the effective absorption coefficient is defined as
( ) 0
0 0 0
1sin
H H H Hz
B
F FE EF E F E
µµ θθ
′′ ′′ ′′ = + + ′′ ′′
(12)
where
0 02 Fπµλ
′′= Γ
is the linear absorption coefficient. The second and third terms in Equation (12) account for the extinction effect that strongly limits the X-ray penetration depth 1/µz for a strong Bragg reflection. For example, the penetration depth for 13.8 keV X-rays at the calcite (1014) Bragg reflection goes from 35 µm at off-Bragg conditions to 0.71 µm at the center of the Bragg rocking curve. This minimum penetration depth or extinction length is
Figure 4. Bottom: The ideal theoretical angular dependence of the reflectivity R and XSW phase v (in radians) for the calcite (1014) Bragg reflection at Eγ = 13.8 keV. Top: The corresponding theoretical normalized fluorescence yields (Eqn. 15) for coherent positions 1014P = 0.0, 0.2, 0.4, 0.6, and 0.8 with coherent fraction
1014 1f = and Z(θ) = 1. The curves labeled 0.2 through 0.8 are given vertical offsets for purposes of clarity.

X-ray Standing Wave Studies 227
( ) 11
ext 0Min 4e c H e H HV d r F F Fµ−
− ′′ Λ = = + (13)
XSW-induced yields from photo-effect The XSW field established inside the crystal and above the crystal surface induces
photoelectron emission from atoms within the field. The excited atoms (ions), in turn, emit characteristic fluorescence X-rays and Auger electrons. In the dipole approximation, the photoelectric effect cross section is proportional to the E-field intensity at the center of the atom. (It is necessary to consider higher-order multi-pole terms in the photoelectric cross-section under special conditions, as discussed by Fischer et al. (1998) and Schreiber et al. (2001). For this review, we will assume the dipole approximation.) Therefore, with the XSW intensity from Equation (6), the normalized X-ray fluorescence yield is defined as
( ) ( ) ( ) ( ), exp fY I z dθ θ ρ µ α = − ∫ r r r (14)
where ρ(r) is the normalized fluorescent atom distribution, and µf (α) is the effective
absorption coefficient for the emitted fluorescent X-rays which is dependent on their takeoff angle, α. Upon integration, the normalized XSW yield is given as
( ) ( ) ( ) ( )( ) ( )1 2 cos 2H HY R R f v P Zθ θ θ θ π θ = + + − (15)
where the parameters fH and PH are the coherent fraction and coherent position, respectively. They are the amplitude and phase of the Hth-order Fourier component of the normalized distribution function
( ) ( ) ( )exp 2 exp 2H H Huc
r i d f iPρ π π= =∫ iH r rF (16)
Z(θ) is the effective-thickness factor, which will be discussed below. Z(θ) = 1 for atoms above the surface of the crystal. Z(θ) ~ 1 at a depth much less than the extinction depth.
Equation (15) is the working equation for the Bragg diffraction XSW technique. In an XSW experiment, the reflectivity rocking curve R(θ ) and the fluorescence yield Y(θ) are acquired simultaneously while scanning through the desired Bragg reflection of the sample crystal. Then, a rocking curve calculated according to dynamical diffraction theory is fitted to the experimentally measured R(θ ) to calibrate the angle scale. The best-fit rocking curve is then used for fitting Equation (15) to the measured Y(θ ). From this fit, the coherent fraction fH and the coherent position PH are obtained. The off-Bragg yield, which is also obtained from the fit to the measured data, is used for overall normalization of the yield, which gives the fluorescent atom concentration or surface coverage. In the top portion of Figure 4, calculated Y(θ ) curves are shown for Z(θ ) = 1; fH = 1; and PH = 0.0, 0.2, 0.4, 0.6, and 0.8, respectively. These calculated curves are for the calcite (1014) reflection at Eγ = 13.8 keV. The marked change in the functional form of Y(θ ) for each increment of 0.2 in d-spacing is the basis for the reliability of the Bragg diffraction XSW as a high-resolution structural probe.
The XSW structural information about the fluorescent atom is contained in fH and PH, which, as they are obtained from Equation (15), are model-independent quantities. If a set of fH and PH values is acquired up to a sufficiently high order of H, based on Equation (16), the distribution ρ(r) of each fluorescent atomic species can be synthesized directly by the Fourier summation
( ) ( ) ( )0
exp 2 1 2 cos 2H H H HH H H
H
f i P f Pρ π π≠−≠
= − = + − ∑ ∑i ir H r H r (17)

228 Bedzyk & Cheng
The above simplification to a summation of cosine terms makes use of the following: f0 = 1; HHf f= ; and HHP P= − .
Unlike conventional diffraction methods, the XSW method does not lose phase information and can therefore be used directly to map the direct-space structure from the set of Fourier coefficients collected in reciprocal space. The XSW measurement does not lose phase information, because the detector of the E-field is the fluorescent atom itself, lying within the spatial region where the fields interfere coherently with each other. In contrast, in conventional diffraction measurements the relative phase between the diffracted and incident fields is lost, because the intensities of the fields are detected far from this region of coherent spatial overlap.
Obtaining real-space ρ(r) by direct Fourier inversion (Eqn. 17) has recently been experimentally demonstrated with the case of lattice and impurity atoms in muscovite (Cheng et al. 2002). This newly developed XSW direct-space imaging method, when combined with the high intensity and special optics available at the APS stations described later in this chapter, should prove to be very powerful when trying to resolve 3D multiple-site bulk atom and surface adsorbate structures. Although fH and PH are model independent, up until now the XSW analysis has relied on simple models to interpret the small set of fH and PH values. If the model is inconsistent and/or the surface structure proves to be more complicated, it is now practical to make more hkl measurements, apply this XSW direct-space method and skip over the simple model interpretation step. From the ~1 Å resolution 3D image a new more complicated model should emerge that when fitted to the data should give high-resolution (± 0.02Å) adsorbate-site positions.
In the typical practice of the XSW technique, however, only a limited set of hkl measurements is taken, and the analysis resorts to comparing the measured fH and PH values to those predicted by various competing structural models. The procedures of structural analysis using fH and PH will be described in more detail in a later section of this chapter. It should be stressed that the Bragg XSW positional information acquired is in the same absolute coordinate system as used for describing the substrate unit cell. This unit cell and its origin were previously chosen when the structure factors FH and HF where calculated and used in Equations (9), (10), and (12). As previously derived and experimentally proven (Bedzyk and Materlik 1985), the phase of the XSW is directly linked to the phase of the structure factor. This is an essential feature of the XSW method that makes it unique; namely, it does not suffer from the well known “phase problem” of X-ray diffraction. Extinction effect and evanescent-wave emission
The effective-thickness factor Z(θ ) in Equation (15) accounts for the θ dependence of the penetration depth of the primary X-ray field (extinction effect) in conjunction with the escape depth, Λ, of the out-going secondary fluorescence X-rays. For atoms at the crystal surface (e.g., adsorbates) or at a depth much smaller than the extinction depth, the effective-thickness factor is constant at Z(θ ) = 1. For atoms evenly distributed throughout the semi-infinite crystal
( ) ( ) ( )( ) ( )
10 sin B f
z f
Zµ θ µ α
θµ θ µ α
− +=
+ (18)
where µz (θ ) is the effective absorption coefficient of the incident X-rays (Eqn. 12) and
µ f (α ) is the effective absorption coefficient of the outgoing fluorescence X-rays from
the crystal at takeoff angle α. To achieve surface sensitivity of substrate atoms, it is

X-ray Standing Wave Studies 229
possible to reduce α to a value approaching the critical angle of the fluorescence X-rays. Under such conditions, µ f
(α ) dominates over µ z (θ ) in Equation (18) and therefore the
effective thickness factor is constant at Z(θ ) = 1. This is the evanescent-wave emission effect observed by Becker et al. (1983). The value of µ f
(α ) is dependent on the wavelength λf of the fluorescence and the index of refraction calculated at λ = λf. The index of refraction is
1n iδ β= − − (19)
where
20
0 0
1 12 21 1
4 2
e eN r F
F
δ λπ
β µ λπ
′= = Γ
′′= = Γ (20)
and Ne is the effective electron density of the refractive medium. From the index of refraction, µ f
(α ) can be obtained as
1
2 2 2 2 22 2( ) (2 ) 4 2ff
πµ α δ α β δ αλ
= − + + − (21)
At takeoff angles much greater than the critical angle (i.e., 2α δ>> ), 0 / sinfµ µ α= . Below the critical angle, the escape depth 1
fµ −Λ = approaches 1 214 ( )e eN r − .
The evanescent-wave emission effect can be used to remove the extinction effect of bulk fluorescence in XSW experiments (Lee et al. 1996). Consider the case of 3.69-keV Ca Kα fluorescence X-rays emitted from calcite. For CaCO3 at this energy δ = 3.97×10⁻⁵, β = 6.84×10⁻⁶, and the critical angle αc = 0.51°. Figure 5a shows the corresponding takeoff angle dependence of the escape depth Λ. At takeoff angles below αc, the escape depth is ~33 Å. Figure 5b shows the angle θ dependence of the reflectivity and Ca Kα signals that were collected while scanning through the CaCO3 (1014) Bragg peak. The standing wave effect in the bulk Ca Kα signal is compared to calculated yield curves (Eqn. 15) for takeoff angles 0.25°, 1.3°, 7°, and 15°, respectively. To completely eliminate the extinction effect, one would ideally acquire the fluorescence at α < αc, but this requires high-precision apparatus. Alternatively, one may acquire data just above the sharp rise in the escape curve, for example at 1.3°, as the data were taken for this example. At much higher α, for example 15°, the extinction effect begins to dominate over the standing wave effect and one begins to lose phase (positional) sensitivity. Structure determination using coherent fraction and coherent position
The coherent fraction fH is a measure of the spatial distribution of the fluorescent atoms. For simplicity, it is useful to subdivide fH into three factors:
H H Hf Ca D= . (22)
In this definition, C is the ordered fraction, aH is the geometrical factor, and DH is the Debye-Waller factor. All three factors range in value from 0 to 1.
To explain these quantities, consider the general case of a discrete atom distribution with N different unit cell position vectors rj = xja + yjb + zjc for the same fluorescent atom, plus an added random distribution of the same atoms. The ordered fraction C is the fraction of the atoms in the distribution that are coherently located or are crystallographically registered with the substrate crystal lattice. If the atoms’ occupation fractions for the ordered positions are c1, c2, …, cN, respectively, the ordered fraction is

230 Bedzyk & Cheng
1
N
jj
C c=
= ∑ (23)
The geometrical factor aH is the modulus of the normalized geometrical structure factor SH for the ordered fluorescent-selected atoms:
( )1
1 exp 2N
H j jj
S c iC
π=
= ∑ iH r (24)
Therefore, the geometrical factor is
( )1
1 exp 2N
H j jj
a c iC
π=
= ∑ iH r (25)
Figure 5. (a) The escape depth 1/ fµΛ = (Eqn. 21) for 3.69 keV
(Ca Kα fluorescence) X-rays from calcite as a function of takeoff angle α. This illustrates the surface sensitivity of the evanescent-wave emission technique. (b) For the calcite (1014) Bragg reflection at an incident energy of Eγ = 13.5 keV, the angular dependence of the experimental and theoretical reflectivity R and the Ca Kα normalized fluorescence yields at various take-off angles. (See Eqn. 15 and 18.) The theory curves in (b) are convoluted with the angular emittance reflectivity curve from the upstream Si(111) monochromator and are hence smeared-out in comparison to the curves shown in Figure 4.

X-ray Standing Wave Studies 231
The coherent position PH is the phase of SH:
( )1
1 Arg exp 22
N
H j jj
P c iππ =
= ∑ iH r (26)
Note that the origin for the set of rj (and therefore the origin of PH) in the unit cell is the same origin that was arbitrarily chosen for generating the structure factor FH used in Equations (9) through (12). Consider the simplest case of one atom site, N = 1. In this case, aH = 1, and PH is the projected H•r fractional d-spacing position of the atom site (Fig. 6). For the case of two atom sites of equal occupancy, where N = 2 and c1 = c2, the geometrical factor reduces to
[ ]1 2 cos ( ) Ha π= −iH r r (27)
The coherent position in this case is the averaged fractional d-spacing position of the two sites (Fig. 6). If the two equally occupied sites have a separation of exactly one-half of a d-spacing along a particular H, then aH = 0 for that particular H; this is analogous to a forbidden reflection in crystallography.
In XSW analysis, the Debye-Waller factor DH accounts for the time-averaged spatial distribution due to thermally induced vibrations of the fluorescence-selected ordered atoms about their average lattice positions. In general, individual DH factors can be inserted into the sum that is used to define the geometrical factor (Eqn. 24). In addition to including the dynamic (thermal vibration) distribution, one can also include the static (spatial disordering) distribution. (Kazimirov et al. 1988) Generally, DH can be expressed in terms of the mean-square vibrational amplitude along the H direction 2
Hu , as
( ) ( )2 2 2exp exp 2H H HD M u dπ= − = − (28)
The sensitivity of the Bragg diffraction XSW method for determining atomic
Figure 6. Comparison of two simple crystal adsorbate models: (Left) one adsorbate site and (Right) two equally occupied adsorbate sites on a crystal surface. Also shown are the corresponding calculations for the coherent positions and the geometrical factors. Both models have the same average adsorbate height relative to the bulk-like diffraction plane. The two-site model has a height difference of 2∆h.

232 Bedzyk & Cheng
positions is illustrated in Figure 4, where the fluorescence yields are calculated for a set of coherent positions that differ by a two-tenths of the d-spacing. This particular case is for an angle scan through the calcite (1014) Bragg reflection at Eγ = 13.8 keV. For calcite, 1014d = 3.04 Å, and therefore each 0.2 increment in PH is equivalent to 0.61 Å. We have for convenience chosen to locate the origin of the calcite unit cell at the carbon atom site of the lattice. This illustration demonstrates the sensitive dependence of the functional form of Y(θ ) on the value of PH. This large change in Y(θ ) is caused by the change in the standing wave phase v(θ ). This phase sensitivity is the basis of the sub-Ångstrom spatial resolution of the Bragg diffraction XSW technique.
The XSW measurements are not restricted to being made along the surface-normal direction (i.e., H perpendicular to the crystal surface). They can be performed with respect to any sufficiently strong Bragg reflection of a crystal. A three-dimensional triangulation of the atom site can be obtained by combining XSW measurements by using three mutually non-collinear diffraction vectors. XSW triangulation was first demonstrated by Golovchenko et al. (1982). This is a powerful feature of the XSW technique in uniquely determining the lattice sites of a surface adsorbate or a bulk impurity. In triangulating an atom site, the point symmetry of the surface can often be used to reduce the number of required XSW measurements from three to two.
The Bragg diffraction XSW method has been used in many areas, perhaps most extensively in obtaining high-resolution adsorbate structures at semiconductor surfaces; much of this work is documented in the review by Zegenhagen (1993). In a later section of this chapter, we describe in detail the use of Bragg diffraction XSW in determining the surface structures of aqueous ions incorporated at the calcite (1014) surface. “Ideal crystals” vs. “real crystals” in Bragg diffraction XSW
According to Equation (11), the intrinsic Darwin width for a typical strong Bragg diffraction peak in the reflection geometry is between 5 to 100 µrad. To produce useful quantitative information from an XSW measurement, the measured reflectivity curve should reasonably match the theory. Only a few exceptionally high quality crystals qualify as ideal crystals according this criterion; among them are Si, Ge, and calcite. Most real single crystals (such as orthoclase and muscovite) contain internal imperfections that result in mosaic spreads in their Bragg rocking curves that exceed their intrinsic Darwin widths. These mosaic spreads can reduce the reflected intensity and subsequently smear out the standing wave effect. For these real crystals, the reflectivity curves cannot be fitted directly to the ideal theoretical reflectivity described by Equation (15).
To make the Bragg diffraction XSW technique adaptable to applications on real crystals, a number of theoretical and experimental methods have been developed. The most formal method is the modification of the XSW theory to include the effect of crystal imperfection on Bragg diffraction. Such theories, however, involve additional complexity beyond the theory for ideal crystals and are beyond the scope of this article. Readers are referred to an updated review on this topic by Vartanyants and Kovalchuk (2001) for details.
On the other hand, one can make XSW applications under certain conditions where the stringent requirements of the conventional theory are relaxed. One of such condition is when a Bragg reflection occurs near the back-reflection geometry, typically when 87° < θB < 90°. Under this condition, Equation (11) breaks down, and the intrinsic Darwin width is magnified to milliradians. Another condition is when the crystal is very thin; under this condition the kinematical theory can replace the dynamical theory in calculating Bragg reflection. Both of these special-cases, which will be discussed briefly below, are important alternatives when the conventional XSW technique cannot be applied.

X-ray Standing Wave Studies 233
An additional practical method for applying XSW to real crystals takes advantage of the high-brilliance of X-ray undulators at third-generation synchrotron sources. With such a source, sufficiently high X-ray intensities can be delivered with beams slitted down to as small as a 10 microns in cross section. Thus making it possible to illuminate one isolated perfect grain at the sample surface. With angular divergence matching the intrinsic Darwin width, this eliminates or significantly reduces the smearing effect of mosaic spread. Figure 7 compares the rocking curves of the muscovite (006) reflection taken at a conventional laboratory source and at an undulator synchrotron beamline. The laboratory data, taken with a larger beam size because of limited beam intensity, are not suitable for XSW analysis. The undulator data, taken with the beam dimension reduced by roughly an order of magnitude, is suitable for XSW analysis. Although the X-ray parameters are not identical for the two cases, it is clear that with reduced beam size many crystals can be suitable for XSW experiments. The special case of back-reflection XSW
To produce XSW data that can be analyzed quantitatively by X-ray diffraction theory, it is necessary to achieve an analytically well-defined XSW field. A first test of meeting this condition is to determine if the angular dependence of the measured reflectivity curve closely matches the ideal reflectivity calculated with dynamical diffraction theory. This, of course, includes a convolution with the emittance function
Figure 7. Comparison of two measured muscovite rocking curves for the (006) Bragg reflection acquired by using (a, open circles) an undulator synchrotron beamline with a Si(111) monochromator at Eγ = 7.4 keV, and (b, solid circles) Cu Kα1 X-rays from a Cu fixed-anode source (Eγ = 8.04 keV ) followed by a Si(111) four-bounce high-resolution monochromator and high-resolution diffractometer. The difference between the two-curves is primarily due to the size of the incident beam slit, which is 0.2 mm × 0.05 mm for (a) and 2 mm × 1 mm for (b). Only a source with the brightness of the undulator could be slitted down to such a small size as for (a) and still has sufficient flux on the sample for XSW measurements. Also shown is the best fit to the rocking curve of (a) (solid line). At 7.4 keV, the Darwin width of Si(111) is ~37 µrad and that of the muscovite (006) is ~20 µrad.

234 Bedzyk & Cheng
from the upstream optics. The level of difficulty in meeting this challenge can be realized by noting that the natural Darwin width of 5 to 100 µrad is typically much smaller than the mosaic spread of typical crystals. One means of circumventing this problem is to use dynamical diffraction at Bragg angles approaching 90°. In this back-reflection geometry, the angular Darwin width is measured in milliradians instead of microradians.
For θB > 88°, the conventional dynamical diffraction theory breaks down. This is due to an approximation in the conventional theory that treats the spherical asymptotes of the dispersion surface in reciprocal space as planes. With an extended dynamical diffraction theory (Kohra and Matsushita 1972; Caticha and Caticha-Ellis 1982), the Bragg reflectivity and the standing wave E-field intensity can be properly described for 87°<θB < 90°. In this regime, the Bragg reflectivity has a much smaller energy width and a much broader angle width. The largest angle width occurs at a wavelength of
( )02 12
Hb
F Fdλ
′ ′Γ − = −
(29)
In this case, Γ = 4redH2(πVc)−1. For wavelengths slightly smaller, the angular width can be
expressed as
1 1y yω θ θ= =−= ∆ − ∆ (30)
where ∆θy=1 and ∆θy=−1 are the angular displacements from 90º of the low- and high-angle side of the strong Bragg diffraction condition, respectively. For a symmetric reflection,
( ) ( )y= 1 02 1 sin B HF Fθ θ± ′ ′∆ = − − Γ ∓ (31)
The back-reflection XSW technique has been used mostly on metal and oxide crystals, whose rocking curves often have angular mosaicity up to ~0.1°. In application to mineral surfaces, the technique has also been used by Kendelewicz et al. (1998b) to study the exchange between Na and Pb in a Na overlayer on the PbS(100) surface. A review of the BRXSW technique was given by Woodruff (1998). Since the BRXSW method is employed at soft X-ray energies (typically from Eγ = 1 keV to 4 keV), it is not useful for in situ studies of the mineral-fluid interface. However, the BRXSW is a very useful probe for UHV surface science measurements of adsorbed molecules on metal single crystal surfaces (Jones et al. 2002) and for site-specific valence-band photoemission studies developed by Woicik and coworkers (Woicik et al. 2001; Kim et al. 2002). The special case of thin-film Bragg diffraction XSW
The development of Bragg diffraction XSW from thin films is partially driven by the fact that many crystals can be grown as high quality µm-thick films but not as large-size crystals. Similar to Bragg diffraction from a bulk crystal, Kazimirov et al. (1997) showed that Bragg diffraction from a crystalline thin film also generates an X-ray standing wave field. Because the thickness of the film is much less than the extinction depth of the incident X-rays, kinematical diffraction theory can be used as a good approximation to calculate the intensity of the field. The analytical procedure is fully analogous to that for bulk-reflection XSW. However, the small thickness also results in very weak reflectivity and consequently very weak angular modulation of the fluorescence yield from an atom within or above the film. Examples of the applications of the thin-film XSW applications include that of Kazimirov et al. (2000) in investigating rare-earth element positions in superconducting films and that of Bedzyk et al. (2000) in probing the polarity of ferroelectric PbTiO3 films deposited by chemical-vapor deposition on a SrTiO3(001) substrate. One of the PbTiO3 films was only 100 Å thick which gave the theoretically

X-ray Standing Wave Studies 235
predicted peak reflectivity of only 0.02%. Consequently, the relative modulation in the XSW yield was 1%. To observe this very weak modulation and use it to quantify the polarity of the film required the collection of approximately 106 Pb Lα fluorescents counts at each of fifty different angle positions of the scan through the (002) PbTiO3 Bragg peak. It was possible to effectively produce this measurement by using a very intense X-ray undulator beam at the APS. This technique can be applied to high purity synthetic minerals, such as, hematite α-Fe2O3 grown epitaxially on sapphire Al2O3(001).
X-RAY STANDING WAVES GENERATED BY TOTAL EXTERNAL REFLECTION
While a single-crystal XSW provides a high-resolution probe well-suited for atomic-scale structural determination, this XSW period is too small to profile larger, nanoscale structuressuch as the diffuse ion distribution at the solid-liquid interface, where the Debye length is measured on a nanometer length scale. To extend the XSW technique to the nanoscale and beyond, two new, long-period XSW techniques were developed by Bedzyk and coworkers. These are XSW generated by total external reflection (TER) from a mirror surface (Bedzyk et al. 1989), which will be described in this section, and XSW generated by Bragg diffraction from a periodically layered synthetic microstructure (LSM) (Bedzyk et al. 1990), which will be described in the following section. Because the reflection condition in these two cases occurs at much smaller angles, the XSW period, D, is much longer. For TER, in particular, D varies from 1 µm to 10 nm as θ increases through the TER condition. XSW generated by total external reflection
During total external reflection the interference between the incident and the specularly reflected X-ray plane waves produces an X-ray standing wave above the mirror surface (Fig. 8). The nodal (and antinodal) planes of this periodic E-field intensity pattern are parallel to the surface and have a variable period of D = λ/(2sinθ ), as defined in Equation (1). The TER condition occurs between θ = 0 and θ = θc, the critical angle. The corresponding XSW periods are very long, ranging from D = ∞ to D = Dc = λ/2θc, the critical period. From Equation (19) and θc = 2δ , the critical period can be written as
12c
e e
DN rπ
= (32)
Aside from small anomalous dispersion effects, the critical period is wavelength independent. Dc is a materials property dependent on the electron density, Ne. For a Au mirror Dc = 80 Å and for a Si mirror Dc = 200 Å.
The TER condition is the zeroth-order Bragg diffraction condition, or the condition when H = 0 and dH = ∞. Therefore, the derivations from dynamical diffraction theory for Bragg diffraction can be applied to the case of TER by substituting F0 for FH. In which case, Equation (10) becomes
2
0
0
2 FiF
θη η η − + Γ′ ′′= + =Γ
(33)
with the substitutions
2 21 2 and 2x x yη η′ ′′= − = (34)
where x = θ /θc is the normalized angle parameter and y = β/δ = 0 0/ 1F F′′ ′ is the absorption factor. From Equation (9), the complex E-field amplitude ratio becomes

236 Bedzyk & Cheng
( )2
22
0 0
11 exp( )
1R Rx x iyE E iv
E Ex x iyη η
− − −= − ± − = =
+ − − (35)
where ER is the complex amplitude of the reflected plane wave. This amplitude ratio is identical to that derived from classical Fresnel theory (Born et al. 1999). For the simple case of no absorption, where β = 0, the reflectivity is
2
4 3 2 2 20
1, 0 1
8 8 1 4 1 8 1, 1R
xERE x x x x x x x
≤ ≤= = − − + − − + >
(36)
and the phase is
1 2cos (2 1), 0 1
0, 1x x
vx
− − ≤ ≤=
> (37)
Figure 9a shows the angular dependence of the reflectivity R and phase v based on Equations (36) and (37). The phase at the mirror surface decreases from π to 0 as the mirror is tilted through the total reflection condition. Thus, at the mirror surface, where z = 0, the reflected plane wave is completely out of phase with the incident plane wave when θ = 0. As the incident angle is increased, the phase decreases smoothly until it is completely in phase at θ = θc. Therefore, at θ = 0, a standing wave node is at the mirror surface, and the first antinode is at infinity. As θ increases, the first antinode moves in from infinity toward the mirror surface, until it coincides with the mirror surface upon reaching θ = θc. At the same time, the second, third, and higher-order antinodes of the standing wave also move toward the surface, as the period D decreases based on Equation (1).
The normalized E-field intensity above the mirror surface can be expressed as
2
02
0
( , ) 1 2 cos(v 2 )RI z R R QzE
θ π+
= = + + −E E
(38)
Figure 8. Schematic of XSW field formed above a mirror surface by the interference between an incident and a total-external-reflected X-ray plane wave.

X-ray Standing Wave Studies 237
Figure 9b shows the angular dependence of the E-field intensity at z = 0 (the mirror surface) and at z = 2Dc. The fluorescence signal for an ideally narrow single atomic plane fixed at these heights would have the same angular dependence.
The normalized fluorescence yield from an arbitrary distribution of atoms ρ(z) above the mirror surface can be obtained by integrating over all values of z:
0
( ) ( , ) ( )Y I z z dzθ θ ρ∞
= ∫ (39)
With I(θ,z) calculated with Equation (38), the atom distribution profile ρ(z) can be obtained by assuming a modeled distribution and fitting it to the measured yield Y(θ ). For the specific cases of δ-function atom distributions in a plane at z = xDc, there are x + 12 modulations between θ = 0 and θ = θc. The extra 1
2 modulation is due to the π phase shift in v.
With TER-XSW, we measure the Fourier transform of an atom distribution over a continuous range in Q = 1/D, with variable period D ranging from roughly 100 Å to 1 µm. Therefore, TER-XSW is ideally suited to measure surface and interface structures of length scales in the range of 10 to 2000 Å.
The above treatment accurately describes the X-ray E-fields at and above the mirror surface for the simple case of one interface with vacuum (or air). To apply TER-XSW as a probe for studying liquid-solid interfacial structures or organic films deposited on a solid surface, it is necessary to include reflection, refraction, and absorption effects from the layers that lie between the substrate surface and the vacuum (or air). This can be accomplished by making use of the Parratt’s recursion formulation (Parratt 1954) to calculate the transmitted and reflected fields at any interface. These same fields can then
Figure 9. Under the condition of no absorption (β = 0): (a) The angular dependence of the reflectivity R and relative phase v of the reflected X-ray plane wave; (b) the angular dependence of the normalized E-field intensity at the mirror surface (z = 0) and at a distance z = 2Dc. Reprinted with permission from Bedzyk et al. 1989. Copyright 1989 by the American Physical Society.

238 Bedzyk & Cheng
be calculated at any point within the slab by appropriately accounting for the X-ray absorption and refraction effects on the fields as they travel from the interface to the point.
The TER-XSW method opens the possibility of using XSW to profile nanoscale metal structures and ion distributions above solid surfaces and at fluid-solid interfaces. Applications of TER-XSW have included direct observation of the diffuse electrical double layer at the charged membrane and electrolyte interfaces (Bedzyk et al. 1990; Wang et al. 2001), structural characterization of self-assembled organic monolayers (Lin et al. 1997), and determining metal ion partitioning at oxide-biofilm interfaces (Templeton et al. 2001). These applications are discussed later in this chapter.
X-RAY STANDING WAVES FROM LAYERED SYNTHETIC MICROSTRUCTURES
For Bragg diffraction purposes, a layered synthetic microstructure (LSM) is fabricated (typically by sputter deposition) to have a depth-periodic layered structure consisting of 10 to 200 layer pairs of alternating high- and low-electron density materials, such as W and Si (Bilderback et al. 1983). Sufficient uniformity in layer thickness is obtainable in the range between 10 and 100 Å (d-spacing of fundamental diffraction planes from 20 Å to 200 Å). Because of the rather low number of layer pairs that affect Bragg diffractions, these optical elements have a significantly wider energy band pass and angular reflection width than do single crystals. The required quality of a LSM is that experimental reflection curves compare well with dynamical diffraction theory, and peak reflectivities are as high as 80%. Therefore, a well-defined XSW can be generated and used to probe structures deposited on an LSM surface with a periodic scale equivalent to the rather large d-spacing. To a good approximation, the first-order Bragg diffraction planes coincide with the centers of the high-density layers of the LSM. Above the surface of the LSM, the XSW period is again defined by Equation (1). The reflectivity can be calculated by using Parratt’s recursion formulation (Parratt 1954). This same optical theory can be extended to allow the calculation of the E-field intensity at any position within any of the slabs over an extended angular range that includes TER. Then, Equation (39) is used to calculate the fluorescence yield. Later in this chapter, we describe the use of LSM-XSW method in determining ion distributions in organic films (Bedzyk et al. 1988). This technique was also used by for studies of electrochemical interfaces (Abruna et al. 1988; Bedzyk et al. 1986).
EXPERIMENTAL CONSIDERATIONS OF X-RAY STANDING WAVE MEASUREMENTS
The XSW technique is not exclusively a synchrotron-based technique; it can be performed with use of a conventional fixed-tube X-ray source or rotating anode. However, several practical considerations make it far more advantageous, and often essential, to perform these experiments at a synchrotron source. Some of these considerations are generally true for any X-ray experiment, while others are specific to the XSW techniques. These considerations are often of great practical importance in carrying out XSW experiments. We briefly discuss some of these factors, which include X-ray source brightness, tunability, and polarization.
The first factor has to do with the quality of the crystal for dynamical diffraction experiments. In the previous section we discussed the issue that most single crystals are not ideal but have defects that make them unsuitable for dynamical diffraction studies. To reduce the adverse smearing effect (angle averaging and therefore XSW phase averaging)

X-ray Standing Wave Studies 239
of mosaicity, one may use a micrometer-size beam so that only a single grain at the surface of the entire crystal is probed. With such a highly collimated, small beam, reasonable intensities are typically achievable only at undulator X-ray sources at third-generation synchrotrons. Another frequently essential property that a synchrotron source offers is the capability of tuning the incident X-rays to a desirable energy, so that in the X-ray fluorescence spectrum the emissions from the atoms of interest are clearly pronounced, while those that could detrimentally saturate the solid-state pulse-counting fluorescence detector can be excluded. A third synchrotron advantage is its high degree of linear polarization in the orbital plane. By aligning the fluorescence detector in the polarization direction, one strongly reduces the unwanted Compton and thermal diffuse scattering components from the fluorescence spectrum. XSW setup at the Advanced Photon Source
In view of the considerations discussed above and in earlier sections, the primary qualities of an X-ray beam suitable for XSW experiments are its brilliance, energy tunability, and polarization. The XSW experiment with a submonolayer adsorbate coverage on a less than perfect single crystal is an experiment that can take full advantage of a high-brilliance undulator source because of the requirement to produce a very intense beam on a small spot with very high vertical angular collimation.
Zegenhagen (1993) gave detailed description of a bending magnet X-ray beamline dedicated to XSW experiments at the National Synchrotron Light Source. Many of the XSW experiments described later in this chapter were performed at this beamline. Most of the optical and detection elements, and the data acquisition procedures in this setup are typical of XSW experiments in general.
Here, we describe the setup for undulator beamlines 5ID-C and 12ID-D at the Advanced Photon Source (APS). (See Fig. 10) The undulator is an insertion device composed of a linear array of magnets with alternating polarities. The electron bunches circulating inside the synchrotron storage ring undergo horizontal oscillations while passing through the undulator. The radiation given off in successive oscillations interferes. This leads to peaks approximately 100 eV wide in the radiation spectrum, which are typically 103 times more intense than the flux of a bending magnet beamline (Rivers, this volume). The peaks in the undulator spectrum can be tuned in energy conveniently by adjusting the undulator gap. Because of the high power density of the undulator beam, the Si(111) double-crystal beamline monochromator is cooled with liquid nitrogen. To filter out photons from higher-order harmonics (i.e., (333), (444), etc.) the angle of the second crystal of the Si(111) monochromator is typically detuned to 80% transmission. These harmonics can also be eliminated by an X-ray mirror set at an incident angle to reflect X-rays below a desired cutoff energy. At 5ID-C, for example, a pair of horizontally deflecting mirrors [just downstream of the high-heat load Si(111) monochromator] is used for harmonic rejection and for horizontal focusing. For single-crystal XSW measurements vertical focusing of the incident beam can introduce an unwanted vertical divergence, which will extend beyond the acceptance angle of the postmonochromator optics. The postmonochromator for XSW experiments
The purpose of the postmonochromator optics for single-crystal Bragg XSW measurements is to ensure that the standing wave has a sufficiently high fringe visibility for making a high-resolution measurement of the coherent position. This is achieved by reducing angle-averaging and wavelength-averaging effects. The function of the postmonochromator is to prepare the incident beam with an angular emittance width that is 10% to 30% of the angular acceptance width of the sample, and to prevent (or dramatically

240 Bedzyk & Cheng
reduce) any wavelength spread from coupling into the angular acceptance of the sample. There are three typical postmonochromator solutions: (1) use of a grazing-incidence, asymmetric Bragg diffraction crystal with d-spacing matching the sample crystal reflection; (2) use of a dispersive pair of channel-cut crystals; and (3) use of a nondispersive pair of channel-cut crystals with d-spacing closely matching the sample crystal reflection.
The third option is used at 5ID-C and 12ID-D. The key components of the postmonochromator are shown in the design drawing in Figure 11. This design allows for remote controlled switching between three Si channel-cut pairs with (hhh), (hh0), and (h00) reflections. Four ion chambers are used to monitor the X-ray beam intensity as it passes down the line through each optical element. The sample is held in the center of a four-circle diffractometer. The reflected beam intensity from the sample can be monitored by a fifth ion chamber (not shown in Fig. 11) or by a pulse-counting detector (such as a photodiode detector) mounted on the 2θ arm of the diffractometer. Angular motion for each channel-cut crystal at sub-µrad precision is achieved by a piezo-driven rotary stage with a flex-pivot torsion bearing. Each channel-cut crystal is stabilized by an error-integrating feedback loop of an electronic stabilizer unit (MOSTAB) (Krolzig et al. 1984). The MOSTAB unit allows the angular detuning between the two channel-cut crystals to be fixed at a desired setting. At 100% tuning (maximum transmission), the angular emittance width from the postmonochromator will be equivalent to the Darwin width of the selected hkl reflection from Si, as defined in Equation (11). For a 25% tuning, the emittance width will be 25% as wide.
With the above setup, along with microstepping motions for the sample, it is possible to obtain reflectivity curves that are as narrow as 5 µrad. Achieving this
Figure 10. Schematic layout of the X-ray source, optical components, beam intensity monitors and detectors for an undulator beamline for XSW experiments at the Advanced Photon Source (from Lee 1999).

X-ray Standing Wave Studies 241
performance requires highly perfect postmonochromator and sample crystals in strain-free mounts. It is also necessary to reduce mechanical vibrations and electronic noise. Usually, XSW data are acquired by accumulating repetitive scans through the rocking curve of the sample. A typical scan has 32 angle steps with a dwell time of 1 sec at each step. Long-term angular drift in the system is easily corrected within the XSW computer control program by measuring the centroid of the rocking curve after each XSW scan and adding this as an offset to the next scan. To perform the XSW scan, one can either scan the angle of the sample or scan the energy of the incident beam by scanning the angles of the postmonochromator channel cuts in unison. The latter method should be used only when the Darwin width of the sample is much smaller than that of the high-heat-load monochromator, in this case Si(111). The fluorescence slit shown in Figure 10 is an option that can be used to limit the emission takeoff angle, which can be crucial if surface sensitivity is required. The fluorescence detector is a Canberra multi-element Ultra LEGe array detector with a 25 µm Be window and a UHV interface option. An XIA DXP-4T digital X-ray processor spectroscopy system is used to pulse-height analyze the fluorescence emission. For a desired precision in the coherent position of ± 0.03 Å at a reasonably high coherent fraction, it is necessary to collect fluorescence counts until a relative counting statistical error of roughly 2% is achieved. If the background counts under the fluorescence peak are very low, this would correspond to collecting 2500 counts at each step of the scan or roughly 8×10⁴ counts. As an example, for 1 ML or 5×1014 cm−2 of Zn at Eγ = 10 keV with only the Si(111) monochromator and no postmonochromator, the Zn Kα fluorescence count rate would be 10 cps at an unfocussed bend magnet and 10 kcps at the APS undulator.
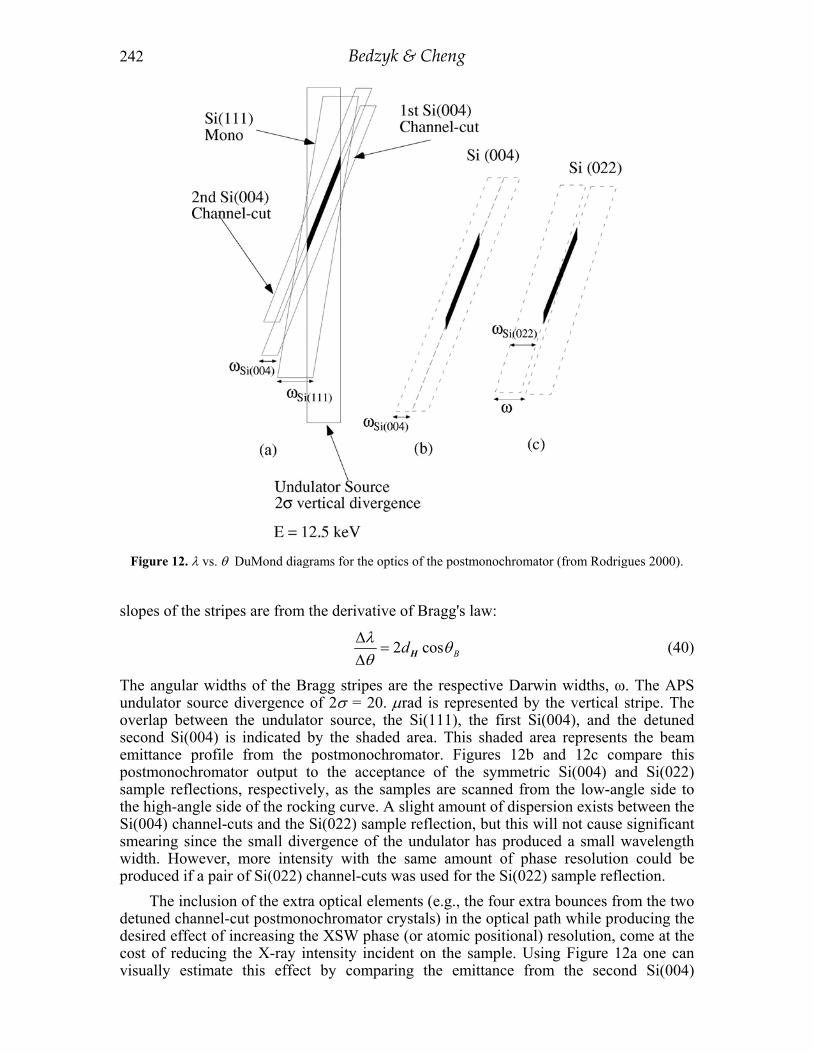
As stated earlier, the postmonochromator optics should prepare the incident beam in a way that avoids angle and wavelength averaging effects that would smear (or reduce the fringe visibility of) the XSW. Figure 12a shows the λ vs. θ DuMond diagram for the APS undulator source at Eγ = 12.50 keV, the Si(111) monochromator, and the pair of Si(004) postmonochromator reflections. The slanted stripes represent the conditions where Bragg diffraction is allowed on the basis of dynamical diffraction theory. The
Figure 11. Side-view schematic of optical table setup used for XSW experiments at undulator beamlines 5ID-C and 12ID-D at the Advanced Photon Source (Bedzyk et al., unpublished). The postmonochromator used for single-crystal XSW experiments has two separate rotary stages for tuning the Bragg reflections of the Si channel-cut (CC) crystals, and ion chambers (IC) for monitoring the X-ray intensities.
242 Bedzyk & Cheng
slopes of the stripes are from the derivative of Bragg's law:
2 cos Bdλ θθ
∆=
∆ H (40)
The angular widths of the Bragg stripes are the respective Darwin widths, ω. The APS undulator source divergence of 2σ = 20. µrad is represented by the vertical stripe. The overlap between the undulator source, the Si(111), the first Si(004), and the detuned second Si(004) is indicated by the shaded area. This shaded area represents the beam emittance profile from the postmonochromator. Figures 12b and 12c compare this postmonochromator output to the acceptance of the symmetric Si(004) and Si(022) sample reflections, respectively, as the samples are scanned from the low-angle side to the high-angle side of the rocking curve. A slight amount of dispersion exists between the Si(004) channel-cuts and the Si(022) sample reflection, but this will not cause significant smearing since the small divergence of the undulator has produced a small wavelength width. However, more intensity with the same amount of phase resolution could be produced if a pair of Si(022) channel-cuts was used for the Si(022) sample reflection.
The inclusion of the extra optical elements (e.g., the four extra bounces from the two detuned channel-cut postmonochromator crystals) in the optical path while producing the desired effect of increasing the XSW phase (or atomic positional) resolution, come at the cost of reducing the X-ray intensity incident on the sample. Using Figure 12a one can visually estimate this effect by comparing the emittance from the second Si(004)
Figure 12. λ vs. θ DuMond diagrams for the optics of the postmonochromator (from Rodrigues 2000).
X-ray Standing Wave Studies 243
channel-cut (black area) to the emittance from the upstream Si(111) monochromator where it overlaps the undulator source divergence. Comparing the two areas gives an estimated transmission of 7% through the pair of detuned channel-cuts.
LOCATING IMPURITY LATTICE SITES IN MINERALS WITH X-RAY STANDING WAVES
Impurities in minerals Impurities incorporated into minerals are important indicators of the
geochronological history of the minerals and the environmental conditions during formation and growth (Ludwig et al. 1992; Brannon et al. 1996). Particularly important is the selective nature of atom or molecule incorporation, and how such selectivity is related to the lattice structure of the host mineral. Because the Bragg diffraction XSW technique gives the lattice position of an atom projected in the substrate unit cell, this technique is ideally suited for determining the lattice sites of bulk-incorporated impurities in a crystal. Combining this technique with polarization-dependent extended X-ray absorption fine structure spectroscopy (EXAFS), which probes the local structure surrounding the impurity, gives a complete picture of the impurity structure at atomic resolution. Mn2+ lattice sites in calcite
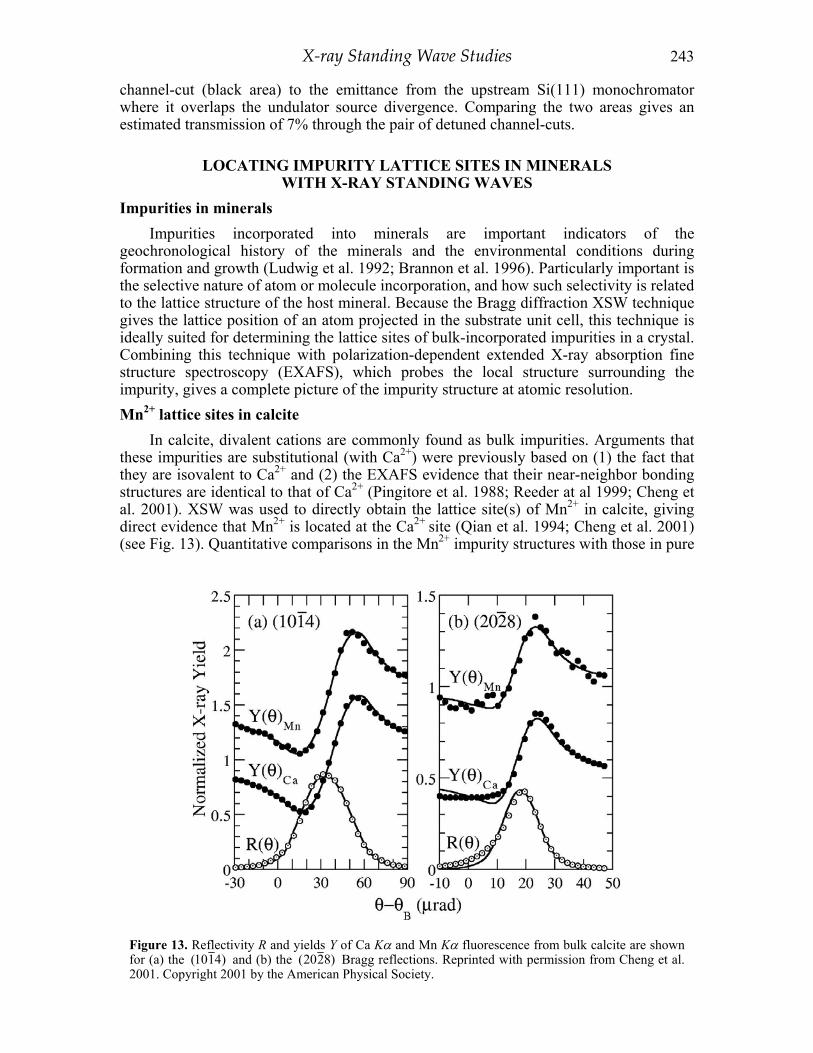
In calcite, divalent cations are commonly found as bulk impurities. Arguments that these impurities are substitutional (with Ca2+) were previously based on (1) the fact that they are isovalent to Ca2+ and (2) the EXAFS evidence that their near-neighbor bonding structures are identical to that of Ca2+ (Pingitore et al. 1988; Reeder at al 1999; Cheng et al. 2001). XSW was used to directly obtain the lattice site(s) of Mn2+ in calcite, giving direct evidence that Mn2+ is located at the Ca2+ site (Qian et al. 1994; Cheng et al. 2001) (see Fig. 13). Quantitative comparisons in the Mn2+ impurity structures with those in pure
Figure 13. Reflectivity R and yields Y of Ca Kα and Mn Kα fluorescence from bulk calcite are shown for (a) the (1014) and (b) the (2028) Bragg reflections. Reprinted with permission from Cheng et al. 2001. Copyright 2001 by the American Physical Society.

244 Bedzyk & Cheng
ionic (i.e., KCl) and pure covalent (GaAs) crystals suggests that the large relaxations at the calcite impurity sites can be attributed to the flexibility in intramolecular relaxation of the first-neighbor CO3
2− anions. This implies that the calcite structure possesses a high flexibility, or compliance, for accommodating impurities and it makes ion adsorption on the calcite surface an important process, because such a surface impurity could in fact be the initial stage in potential incorporation of impurities into the crystal bulk. Phengitic ion sites in muscovite
Phengitic cations substituted at the octahedral sites of muscovite are the principal elemental variations from end-member muscovite. The major phengitic cations include Mg, Mn, Fe, and Ti. Their presence and concentrations as impurities in muscovite are considered evidence of metamorphic conditions during rock formation (Guidotti 1984). In addition to the octahedral sites, these and other ions are expected to substitute at other sites of muscovite to achieve bulk charge balance. The determination of impurity ion sites in muscovite has traditionally relied on optical spectroscopy. Although much is known, many details are not fully resolved.
By locating the lattice sites, the Bragg diffraction XSW technique offers an entirely different, structurally more direct approach for determining the lattice-sites of the impurities. In a recent experiment, a set of (00l) XSW measurements were made of a muscovite sample to locate the positions of Mn, Fe, and Ti substituting ions within the tetrahedral-octahedral-tetrahedral layer and the interlayer space (Cheng et al. 2002). All three impurity ions were found to be located at the position of the octahedral site.
ION ADSORPTION STRUCTURES AT MINERAL SURFACES WITH X-RAY STANDING WAVES
Ion adsorption at the calcite-water interface The adsorption of trace aqueous ions at the calcite-water interface is one of the most
intensely studied mineral-water interfacial processes. A goal of these studies is to achieve a molecular-scale understanding of the interfacial transport process and the factors that control it. Such understanding has great implications for a wide range of geochemical and environmental processes, most notably in toxic metal transport in groundwater and soils. Traditional methods for studying aqueous ion adsorption rely mostly on solution concentration measurements on batch powder samples. These methods address the issue of adsorption through its dependence on solution thermodynamics, but they are unable to probe adsorption in relation to mineral surface structures. The structural dependence of ion incorporation in calcite and other minerals is a well-accepted concept that is explained quantitatively, for example, in the case of Mn2+ in calcite (Cheng et al. 2001; see discussion in previous section). Surface selectivity in ion adsorption based on structural compatibility is now recognized as a key criterion determining whether adsorption will occur.
The coherently adsorbed ionsthose crystallographically registered with the surface latticeare of primary importance in an adsorption event. This is because these ions, initially incorporated as a part of a surface solid solution, have the potential through subsequent overlayer growth to become a part of a bulk solid solution. The otavite-calcite solid-solution growth on calcite (1014) observed with X-ray diffraction by Chiarello et al. (1997) is an example of such growth. This growth leads to the retention of ions as bulk impurities, with the potential for future release if the chemistry of the solution undergoes substantial change.
To address the issue of coherent adsorption at the calcite-water interface, a series of
X-ray Standing Wave Studies 245
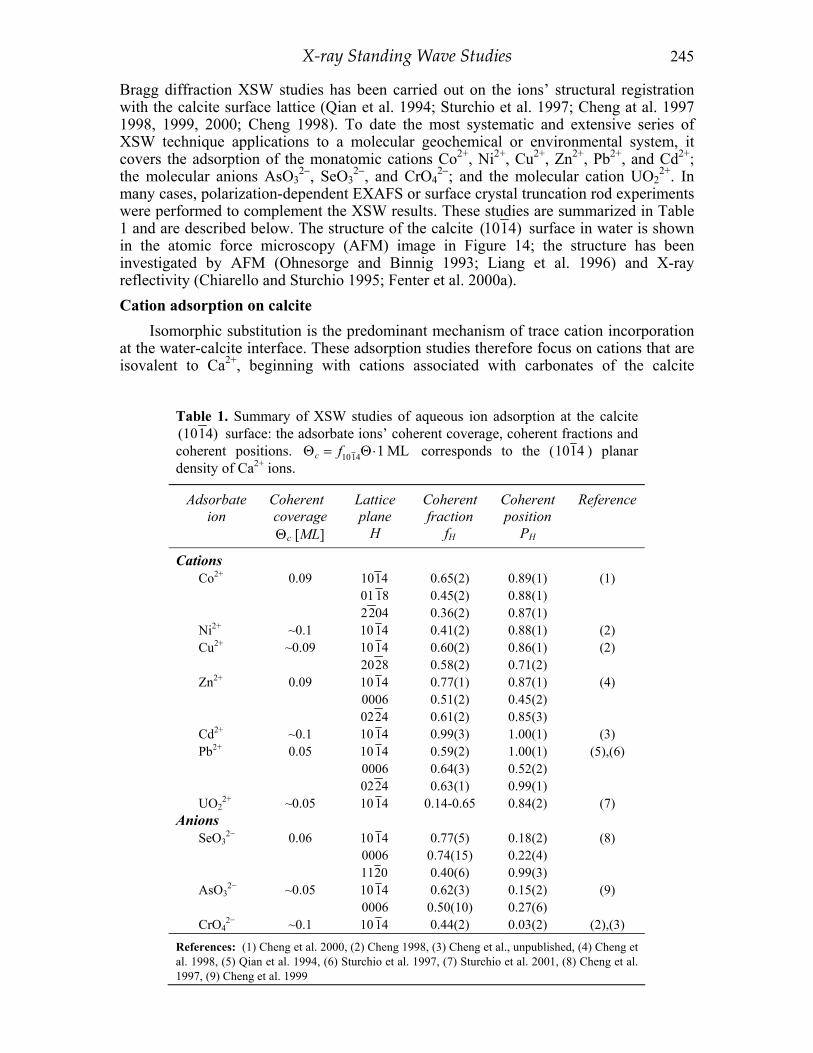
Bragg diffraction XSW studies has been carried out on the ions’ structural registration with the calcite surface lattice (Qian et al. 1994; Sturchio et al. 1997; Cheng at al. 1997 1998, 1999, 2000; Cheng 1998). To date the most systematic and extensive series of XSW technique applications to a molecular geochemical or environmental system, it covers the adsorption of the monatomic cations Co2+, Ni2+, Cu2+, Zn2+, Pb2+, and Cd2+; the molecular anions AsO3
2−, SeO32−, and CrO4
2−; and the molecular cation UO22+. In
many cases, polarization-dependent EXAFS or surface crystal truncation rod experiments were performed to complement the XSW results. These studies are summarized in Table 1 and are described below. The structure of the calcite (1014) surface in water is shown in the atomic force microscopy (AFM) image in Figure 14; the structure has been investigated by AFM (Ohnesorge and Binnig 1993; Liang et al. 1996) and X-ray reflectivity (Chiarello and Sturchio 1995; Fenter et al. 2000a). Cation adsorption on calcite
Isomorphic substitution is the predominant mechanism of trace cation incorporation at the water-calcite interface. These adsorption studies therefore focus on cations that are isovalent to Ca2+, beginning with cations associated with carbonates of the calcite
Table 1. Summary of XSW studies of aqueous ion adsorption at the calcite (1014) surface: the adsorbate ions’ coherent coverage, coherent fractions and coherent positions. 1014 1 MLc fΘ = Θ⋅ corresponds to the (1014 ) planar density of Ca2+ ions.
Adsorbate ion
Coherent coverage Θc [ML]
Lattice plane
H
Coherent fraction
fH
Coherent position
PH
Reference
Cations Co2+
Ni2+ Cu2+
Zn2+
Cd2+ Pb2+
UO22+
Anions SeO3
2−
AsO32−
CrO4
2−
0.09
~0.1 ~0.09
0.09
~0.1 0.05
~0.05
0.06
~0.05
~0.1
1014 01 18 2204 10 14 10 14 2028 10 14 0006 0224 10 14 10 14 0006 0224 10 14
10 14 0006 1120 10 14 0006 10 14
0.65(2) 0.45(2) 0.36(2) 0.41(2) 0.60(2) 0.58(2) 0.77(1) 0.51(2) 0.61(2) 0.99(3) 0.59(2) 0.64(3) 0.63(1)
0.14-0.65
0.77(5) 0.74(15) 0.40(6) 0.62(3)
0.50(10) 0.44(2)
0.89(1) 0.88(1) 0.87(1) 0.88(1) 0.86(1) 0.71(2) 0.87(1) 0.45(2) 0.85(3) 1.00(1) 1.00(1) 0.52(2) 0.99(1) 0.84(2)
0.18(2) 0.22(4) 0.99(3) 0.15(2) 0.27(6) 0.03(2)
(1)
(2) (2)
(4)
(3) (5),(6)
(7)
(8)
(9)
(2),(3)
References: (1) Cheng et al. 2000, (2) Cheng 1998, (3) Cheng et al., unpublished, (4) Cheng et al. 1998, (5) Qian et al. 1994, (6) Sturchio et al. 1997, (7) Sturchio et al. 2001, (8) Cheng et al. 1997, (9) Cheng et al. 1999

246 Bedzyk & Cheng
structure and extending to cations associated with carbonates of the aragonite structure. Cobalt (II). XSW measurements on Co2+ adsorbed at the calcite (1014) surface
were made with respect to the (1014) , (2204) and (0118) Bragg reflections of calcite (Cheng et al. 2000). The XSW results are shown in Figure 15. The crystallographic ordering of the adsorbed Co2+ is revealed by the relatively high coherent-fraction values measured in all three (non-colinear) directions. Each of the three coherent positions gives the Co2+ lattice site(s) viewed in that direction as hH = dH × PH. For example, with respect to the (1014) lattice, the Co2+ ion is located at a height 3.04 Å × 0.89 = 2.70 Å above the plane. The intersection of the three positions gives the three-dimensional location of the Co2+ adsorbate relative to the calcite lattice. These XSW data provide an atomic-scale structural model of the Co2+ adsorbate structure, as shown in Figure 16. The model shows that Co2+ is located at the Ca2+ site, giving quantitative structural evidence that this adsorption is substitutional. The model further reveals that the Co2+ adsorbate is slightly relaxed from the ideal Ca2+ position. This relaxation can be explained quantitatively as being along the vertical Co-O direction. Accordingly, this relaxation is attributed to the result of surface truncation and to the smaller size of Co2+ in comparison to Ca2+. (The Co-O distance in CoCO3 is 2.11 Å, while the Ca-O distance in calcite is 2.35 Å).
Additionally, polarization-dependent surface EXAFS reveals that the Co2+ adsorbate maintains an octahedral coordination with neighboring oxygen atoms. This observation suggests that, in addition to the four CO3
2− in the plane and the one below, another species is bonded to the surface Co2+ above the plane. The Co-O nearest-neighbor distance is 2.11 Å, as in CoCO3. Putting together XSW and EXAFS data, while maintaining an octahedral coordination, reduces the radius of the Co2+ coordination sphere compared to that of Ca2+, and relaxes its center, as shown in Figure 17. The Co2+ ions are incorporated in the calcite (1014) surface lattice, forming a dilute two-dimensional solid solution of Ca0.9Co0.1CO3.
Nickel(II). From similarity in the sizes of Ni2+ to Co2+, one expects these cations to have similar adsorption structures on calcite. XSW made with respect to the (1014) planes showed that the Ni2+ adsorbate is located 2.7 Å above the (1014) plane. In-plane surface EXAFS measurements on the Ni2+ adsorbates showed a first-neighbor Ni-O distance identical to that in NiCO3 (Cheng 1998).
Copper(II). The Cu2+ ion has a unique electronic structure that causes its nearest-neighbor coordination structure to undergo Jahn-Teller distortion, splitting the usually equidistant octahedral neighbors into four closer equatorial neighbors and two more
Figure 14. A 7 µm × 7 µm area of the calcite (1014) surface in water under typical conditions for XSW experiments, as imaged by AFM in an in situ solution cell (from archive of L. Cheng and H. Teng).

X-ray Standing Wave Studies 247
distant axial neighbors (e.g., Goodenough 1998). The distinction of the Cu2+ structure from that of the other common divalent metals is reflected in both the amorphous phase and the bulk crystalline phase of Cu2+ salts. However, the effect of the distorted nearest-neighbor shell of the Cu2+ ion on its incorporation at the calcite surface and the ordering and local bonding structure of the resultant incorporation structure are not known. XSW measurements on Cu2+ adsorbed at the calcite (1014) surface were made respect to the (1014) and (2028) lattice planes (Cheng 1998). The results reveal that the Cu2+ adsorbate is located at a height of 2.7 Å above the (1014) lattice, an incorporation
Figure 15. XSW data for Co2+ adsorbed on the calcite (1014) surface. Experimental data (dots) and theoretical fits (solid-line curves) of the normalized X-ray reflectivity R and Co Kα fluorescence yield Y are shown for the (a) (1014) , (b) (0118) , and (c) (2204) Bragg reflections of calcite. Reprinted with permission from Cheng et al. (2000). Copyright 2000 by the American Physical Society.

248 Bedzyk & Cheng
structure very similar to that of other divalent cations of similar size. This observation indicates that the distorted near-neighbor structure of Cu2+ does not noticeably affect its incorporation into the calcite surface or the site of incorporation.
Zinc (II). XSW triangulation on Zn2+ ion adsorption site at the calcite (1014) surface was made with respect to the (1014) , (0006), and (0224) Bragg reflections (Cheng et al. 1997). As for Co2+, the high coherent fractions indicate that the Zn2+ adsorbates are well registered with the calcite surface lattice. And again, the structural model based on the coherent positions reveals that the adsorbed Zn2+ is located at the surface Ca2+ site, with its center slightly displaced from that of the ideal Ca2+ along the vertical Zn-O direction. The height of Zn2+ measured from the (1014) lattice plane, for
Figure 16. Structural model of Co2+ adsorbed on calcite. Side views of the calcite (1014) surface show the averaged height of the Co2+ adsorbate relative to the each of three lattice planes with respect to which the XSW measurements are made. Note that there are two crystallographically nonequivalent Co2+ sites per surface unit cell. Reprinted with permission from Cheng et al. (2000). Copyright 2000 by the American Physical Society.

X-ray Standing Wave Studies 249
example, is h = 2.64 ± 0.03 Å. In-plane EXAFS measurements made on the Zn2+ adsorbate showed that the Zn-O nearest-neighbor distance is 2.11 ± 0.01 Å, as in ZnCO3, and the in-plane coordination number is 3.8 ± 0.7. Therefore, the local bonding structure of the Zn2+ adsorbate is also similar to that of Co2+.
Cadmium(II). In ionic size, Cd2+ is most similar to Ca2+ among divalent cations with carbonates of the calcite structure. XSW measurements on Cd2+ adsorbed at the calcite (1014) surface were made with respect to the (1014) reflection (Cheng et al., unpublished). This result reveals a highly ordered adsorbate at a position identical to that of ideal Ca2+. This high degree of ordering is perhaps related to the close size similarity between Cd2+ and Ca2+ (ionic radii: Cd2+, r = 0.97 Å; Ca2+, r = 0.99 Å) , which makes the incorporation structurally more compatible. This adsorbate structure is the initial stage of the three-dimensional CdxCa1−xCO3 solid solution phase observed in the X-ray diffraction studies of Chiarello et al. (1997).
Lead(II). XSW triangulation of Pb2+ adsorbed at the calcite (1014) surface was performed with respect to the (1014) , (0006), and (0224) Bragg reflections (Qian et al. 1994; Sturchio et al. 1997). Again, high coherent fractions were observed in all three directions, indicating that the Pb2+, despite the fact that its carbonate is of the aragonite structure, can become incorporated at the calcite surface lattice. From the triangulation based on the coherent positions, the site of Pb2+ is within uncertainties that of the ideal Ca2+. This exact matching in the site initially appears to be surprising. However, the absence of noticeable relaxation of the Pb2+ position can be explained by a likely structural scenario in which a vertical expansion due to the larger size of the Pb2+ ion (Pb2+: r = 1.21 Å; Ca2+: r = 0.99 Å) almost exactly cancels the relaxation due to surface truncation.
Several additional measurements were made on the Pb2+ adsorption surface. First, comparison between in situ and ex situ XSW show identical results (Sturchio et al. 1997). Second, in-plane EXAFS measurements of the Pb2+ adsorbate showed that its nearest-neighbor Pb-O distance is 2.69 ± 0.03 Å, as in PbCO3 (Cheng 1998). Finally, specular X-ray crystal truncation rod measurements were also made to determine independently at
Figure 17. Side view of the structural model describing the site and the local bonding structure of Co2+ incorporated at the calcite (1014) surface according to XSW and polarization-dependent EXAFS results. Reprinted with permission from Cheng et al. (2000). Copyright 2000 by the American Physical Society.

250 Bedzyk & Cheng
which surface lattice layer (or layers) the Pb2+ ions are incorporated. The analysis concluded that the Pb2+ ions are mostly incorporated within the topmost monolayer of the calcite (1014) surface lattice (Sturchio et al. 1997). Molecular anion adsorption on calcite
For adsorption of monatomic cations, the factor of structural compatibility can be described by a single parameterthe ionic radii. In contrast, structural compatibility for molecular anions involves consideration of the geometric shape of the ions. Oxyanions having the stoichiometric forms BO3
2− and BO42− are among the principal aqueous-phase
species containing environmentally and geochemically important elements (e.g., National Research Council 1983). In order of increasing difference in molecular geometry from the CO3
2− ion are the planar triangular anions (i.e., NO32−, PO3
2−), the pyramidal anions (i.e., AsO3
2−, SeO32−), and the tetrahedral anions (i.e., AsO4
2−, SeO42−, and CrO4
2−) (Evans 1964).
Arsenite. The XSW measurements on AsO32− adsorbed at the calcite (1014) surface
were made with respect to the (1014) and (0006) reflections of calcite (Cheng et al. 1999). The data are shown in Figure 18. High coherent fractions of the As atom were observed in both directions. From the coherent positions, the projected heights of the As atom relative to the (1014) and the (0006) planes are 0.46 ± 0.06 Å and 0.76 ± 0.17 Å, respectively. (The ideal position of C in CO3
2− projects zero length in both directions.) According to these projected heights of the As atom, a molecular structural model
was constructed for AsO32− adsorbed on the calcite surface, as shown in Figure 19. In the
model, the intersecting point of the two projected positions gives the As site. Because the calcite (1014) surface has twofold symmetry in the direction normal to the plane of view of the model, the projected height of the As atom in the direction perpendicular to the plane of view is zero. This model gives quantitative structural evidence that the adsorbed AsO3
2− substitutes at the CO32− site. Furthermore, the measured height of the As position
above the CO32− plane is roughly consistent with the projected height of the As apex
above the O basal plane in the pyramidal AsO32− anion. Therefore, it can be further
inferred that the AsO32− substitution has the specific molecular orientation that the basal
O plane overlaps that of CO32−, with the apical As pointing in the +[0001] direction of
calcite. After AsO32− incorporation, the calcite surface can be described as a dilute two-
dimensional solid solution of the chemical form Ca(AsO3)x(CO3)1−x. Selenite. The XSW measurements of the adsorption of SeO3
2− on the calcite (1014) surface were made with respect to the (1014) , (0006), and (1120) reflections of calcite (Cheng et al. 1997). The result of SeO3
2− adsorption is analogous to that of AsO32−.
Considering the geometric similarity of these two oxyanions, their similar adsorption structures are quite expected. The exact position of the Se atom located by the intersection of these three heights is displaced from the ideal C position along the +[0001] direction by 0.63 ± 0.11 Å, similar to the AsO3
2− model. A similar explanation based the molecular geometry applies. For the SeO3
2− anions, the distance between the apical Se and the O basal plane is typically 0.75 Å. This is within uncertainty in agreement with the measured value. Therefore, as for AsO3
2−, a plausible adsorption structure of SeO3
2− derived from the XSW measurements indicates that SeO32− substitutes
for CO32−, with a preferred orientation such that the Se apex points outward from the
crystal. Chromate. The XSW measurements of CrO4
2− adsorption on the calcite (1014) surface were made with respect to the (1014) and (0006) reflections (Cheng 1998). From the average measured coherent positions, the Cr atom is located with a displacement relative to the ideal C position of −0.12 Å normal to the (1014) plane. This position is

X-ray Standing Wave Studies 251
consistent with a CrO42− substituting at the CO3
2− site. Although the CrO42−
ion is relatively large in volume, its O basal plane (side length: 2.61 Å) is only moderately larger than the CO3
2− plane (side length: 2.22 Å). Therefore, the substitution structure is not surprising. Uranyl adsorption on calcite
The UO22+ ion has a O-U-O linear geometry, with a U-O distance of 1.8 Å. Unlike
the monatomic cations and molecular anions whose structural conformities with their respective counterpart in calcite lead to substitutional incorporation, the UO2
2+ ion does not fit in size and shape to the Ca2+ site. Despite this structural dissimilarity, recent EXAFS analyses suggest that UO2
2+ substitutes at the Ca2+ site (Kelly et al. 2002). These findings support the notion that calcite, as a molecular ionic crystal, possesses large structural flexibility in accommodating ions of dissimilar geometries (Cheng et al. 2001).
Figure 18. XSW data for AsO32-
adsorbed at the calcite (1014) surface. Experimental data (dots) and theoretical fits (solid-line curves) of the normalized X-ray reflectivity R and As Kα fluorescence yield Y are shown for (a) the (1014) , and (b) the (0006) Bragg reflections of calcite. Used by permission of Elsevier Science, from Cheng et al. (1999) Geochim Cosmochim Acta, 63, p 3153-3157.

252 Bedzyk & Cheng
Bragg diffraction XSW measurements were made of uranyl adsorbed on calcite (1014) from a pH ~ 10.5 solution (Sturchio et al. 2001). The coherent fractions obtained range from 0.14 to 0.65. The lower values of the coherent fractions may imply adsorption at multiple sites, although the highest value indicates a high probability of adsorption at a single dominant site. The mean value of the measured coherent position in all measurements was 0.84 ± 0.02. This position was independent of dissolved U(VI) concentration, and corresponds to a distance between the U atom and the calcite (1014) plane of 2.55 ± 0.06 Å. These results are consistent with U(VI) adsorption at the calcite surface mainly as a monodentate inner-sphere uranyl-carbonate surface complex. Steric considerations imply that the observed U(VI) surface complex may occur both at edge sites ( < 441>_ and < 481 >_ ) and on terrace areas adjacent to Ca vacancies.
PROBING METAL DISTRIBUTIONS IN ORGANIC FILMS WITH X-RAY STANDING WAVES
Metal in organic films at mineral surfaces Natural organic matter from biosynthesis and biodegradation is ubiquitous in natural
aqueous environments. Common examples of natural organic materials are extracellular polymeric matrices (biofilms) generated by bacteria, hydrocarbons from industrial effluents and fossil fuel products, and numerous humic substances. Because of their hydrophobicity, natural organic materials have low solubility in water and tend to accumulate at solid surfaces. As a result, in groundwater and soils, mineral surfaces are commonly coated with organic films.
The presence of organic films at the mineral-water interface complicates the
Figure 19. Structural model of AsO3
2− adsorbed on calcite. Side views of the calcite (1014) surface show the averaged height of the As position of the AsO3
2− adsorbate relative to each lattice plane with respect to which the XSW measurement is made. Used by permission of Elsevier Science, from Cheng et al. (1999), Geochim Cosmochim Acta, 63, p 3153-3157.

X-ray Standing Wave Studies 253
interactions of metal ions with mineral surfaces. The organic films may in some cases inhibit metal-mineral interactions by blocking the reactive surface sites of the mineral surfaces. Certain functional groups in the organic films may form stable complexes with aqueous metals, causing the films to act as sinks for certain geochemically and environmentally critical trace elements, very much as minerals do.
In a sense, metal-mineral surface interactions and metal-organic film interaction compete at natural mineral-water interfaces. The first-order information needed to understand the role of the organic films in mineral-aqueous metal interactions is a map of the partitioning of metals at the organic-mineral interface.
The capabilities of TER-XSW and LSM-XSW in profiling metal distribution from 50 to 1000 Å above a surface offer a unique method for directly determining metal ion partitioning at mineral-organic film-aqueous interfaces. In this section, we discuss experiments using long-period XSW to locate the metal distribution in model organic films on solid surfaces, including Langmuir-Blodgett trilayers and self-assembled monolayers and multilayers (SAMs). These model film systems are analogous to organic films on mineral surfaces, and the approaches employed in these studies are directly applicable to mineral-organic film studies. We also discuss recent experiments in which TER-XSW techniques were applied to investigate the Pb2+ distribution at metal oxide-biofilm interfaces. Zn2+ in a Langmuir-Blodgett multilayer
Bedzyk et al. (1989) used TER-XSW to locate the Zn atom layer in a Langmuir-Blodgett (LB) multilayer. The Zn atom layer was embedded in the top bilayer of the LB multilayer deposited on a gold mirror surface (Fig. 20). In this experiment, three full oscillations in the Zn Kα fluorescence yield (Fig. 20b) occurred before the gold critical angle was reached (Fig. 20a). As described above in the TER-XSW section this indicates that the Zn layer was at z = 2.5 Dc = 200 Å. This was more precisely determined to be 218 Å by using a χ2 fit of the data to theoretical yields based on a layered model. From this fit, it was determined that the 2σ thickness of the Zn layer was 24 Å. After annealing to 105°C the Zn oscillations (Fig. 20c) were substantially smeared out, indicating that the Zn layer was no longer confined to such a narrow layer.
Thermally induced dynamical behavior of the Zn layer in the same membrane system was studied with long-period XSW generated by Bragg diffraction from LSM (Bedzyk et al. 1988) (see Fig. 21). In this case, the LB trilayer of Zn and Cd arachidate was deposited on an LSM consisting of 200 W/Si layer pairs with periodicity of 25 Å. Bragg-reflection and TER-XSW scans for Zn fluorescence were made at temperatures between 35°C and 140°C. Figure 22 shows the Bragg reflectivity and Zn K fluorescence modulations. The measured coherent positions for the Cd layer indicated that the thickness of the top Si layer of the LSM had been reduced from 18.75 Å to 9.8 Å by a surface-cleaning process. The Cd position in the LB film was unaffected by heating and cooling. This was, however, not the case for Zn. Initially, at 34°C, the Zn layer was located 53.4 Å above the LSM surface. Figure 22 shows the evolution of the Zn fluorescence as temperature was raised from 34°C to 100°C. Over this temperature change, the peak of the Zn fluorescence signal shifted progressively from the low-angle side to the high-angle side of the Bragg reflection. This corresponds to a movement of the Zn layer by almost one-half of the 25-Å LSM d-spacing. As the temperature was raised further, from 100°C to 110°C, the peak in Zn fluorescence shifted back toward the low-angle side, indicating that the Zn layer had moved either farther from the surface by ~ 1
4 d or toward the surface by ~ 3
4 d. The TER-XSW measurement showed that the latter was the case.

254 Bedzyk & Cheng
Br− location and ordering in self-assembled multilayers Long-period XSW has been applied by Lin et al. (1997) to locate the position and
ordering of Br− ions within the self-assembled organic monolayers and multilayers (SAMs). In these studies, three sets of SAM samples were examineda (3-bromopropyl)trichlorosilane monolayer, an octachlorotrisiloxane-capped (3-bromopropyl)trichlorosilane monolayer, and a trilayer-coupled multilayer (Fig. 23). These organic structures were adsorbed on a surface of a Si/Mo LSM, and both TER-XSW and LSM-XSW measurements were made. The results are shown in Figure 24. For the monolayer sample, the LSM-XSW coherent position and fraction reveal that the Br− ions were located at a mean height of 10 Å above the surface, with a Gaussian distribution width of 7.3 Å. This height is in agreement with the thickness of the monolayer (~10 Å), and the distribution width is attributed to the surface roughness (~6 Å). For the capped trilayer sample, the coherent fraction and position remain unchanged, indicating that the self-assembly produces ordered superlattice structures. For the coupled
Figure 20. The angular dependence of (a) the reflectivity at Eγ = 9.8 keV for a Langmuir-Blodgett film deposited on a Au surface (see inset), (b) the Zn Kα fluorescence yield at 44°C and (c) the Zn Kα fluorescence yield at 105°C. The data are shown as circles, and the fits are solid lines. Reprinted with permission from Bedzyk et al. (1989). Copyright 1989 by the American Physical Society.

X-ray Standing Wave Studies 255
trilayer sample, the XSW results showed that the Br− ion in the upper layer is located at a height of 48.8 Å with a Gaussian width of 10.4 Å.
These direct structural measurements using TER-XSW and LSM-XSW provide quantification to the location and ordering of the Br− ions in the SAMs in the surface-normal direction to a precision of 0.1 Å. Pb2+ partitioning at biofilm-oxide interfaces
The TER-XSW method has recently been applied by Templeton et al. (2001) to (1) investigate the partitioning of Pb2+ sorbed at the biofilm-hematite (α-Fe2O3) and the biofilm-corundum (α-Al2O3) interfaces and (2) determine how surface-bound bacteria affect the adsorption of metal ions at oxide surfaces. The TER-XSW measurements were made on α-Fe2O3 (0001) and on α-Al2O3 (0001) and (1102) surfaces coated with a gram-negative chemo-organotrophic bacterium and exposed to pH 6 solutions having dilute Pb2+ concentrations.
The data were interpreted by assuming a simple two-component model for Pb2+ distribution, in which Pb2+ occurs at the crystal surface and within the biofilm. The fit to the XSW fluorescence yield allows differentiation between Pb2+ located at the crystal
Figure 21. Left: Schematic of Zn/Cd arachidate Langmuir-Blodgett layers deposited on the Si surface of a W/Si layered synthetic microstructure with 25-Å period. Right: The intensities of the XSW on the low-angle side (dashed line) and high-angle side (solid line) of the Bragg diffraction. Reprinted with permission from Bedzyk et al. (1988). Copyright 1988 by the American Association for the Advancement of Science.
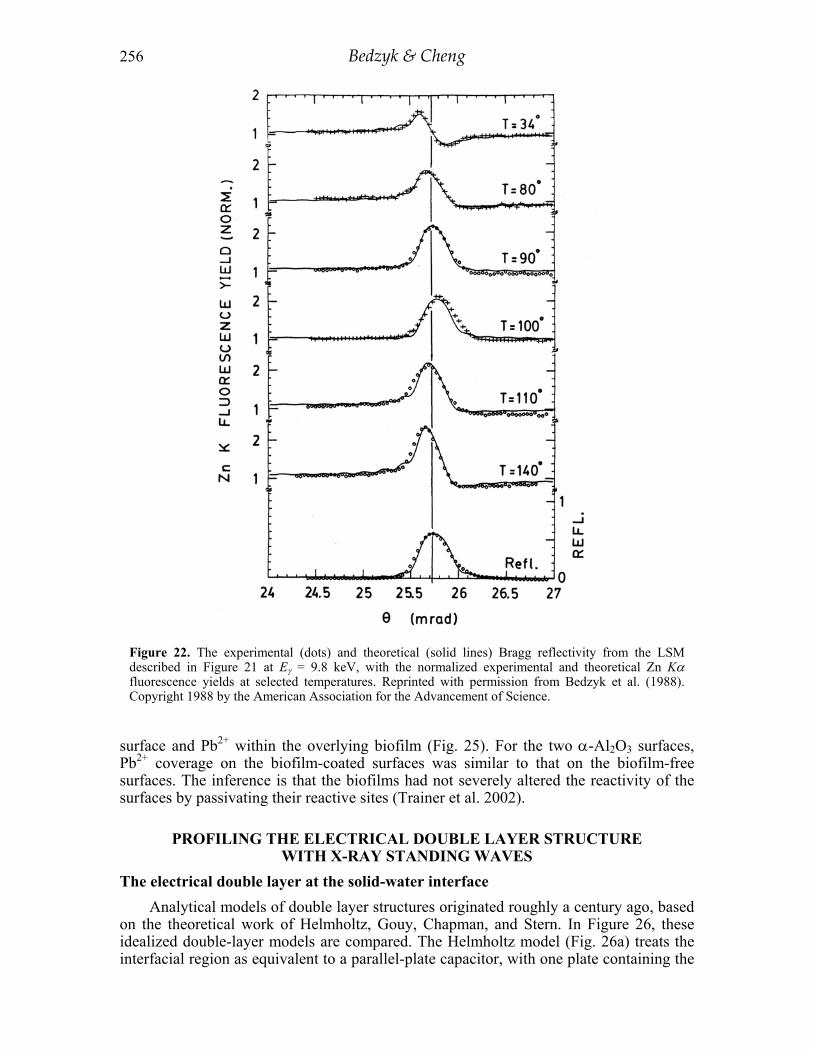
256 Bedzyk & Cheng
surface and Pb2+ within the overlying biofilm (Fig. 25). For the two α-Al2O3 surfaces, Pb2+ coverage on the biofilm-coated surfaces was similar to that on the biofilm-free surfaces. The inference is that the biofilms had not severely altered the reactivity of the surfaces by passivating their reactive sites (Trainer et al. 2002).
PROFILING THE ELECTRICAL DOUBLE LAYER STRUCTURE WITH X-RAY STANDING WAVES
The electrical double layer at the solid-water interface Analytical models of double layer structures originated roughly a century ago, based
on the theoretical work of Helmholtz, Gouy, Chapman, and Stern. In Figure 26, these idealized double-layer models are compared. The Helmholtz model (Fig. 26a) treats the interfacial region as equivalent to a parallel-plate capacitor, with one plate containing the
Figure 22. The experimental (dots) and theoretical (solid lines) Bragg reflectivity from the LSM described in Figure 21 at Eγ = 9.8 keV, with the normalized experimental and theoretical Zn Kα fluorescence yields at selected temperatures. Reprinted with permission from Bedzyk et al. (1988). Copyright 1988 by the American Association for the Advancement of Science.

X-ray Standing Wave Studies 257
surface charge and the other plate, referred to as the outer Helmholtz plane, containing electrostatically attracted ions from the solution. This simplified rigid model of the interface neglects a number of important physical properties of the ions. The Gouy-Chapman model (Fig. 26b) takes into account the thermal motion of the ions, and thus it describes the ion distribution as a diffuse double layer. The Stern model (Fig. 26c) extends the Gouy-Chapman model by including specifically adsorbed ions at the interface. In this model the first layer of ions is constrained to lie in a Helmholtz plane with a thickness defined by the ionic radii. In general, this condensed ion layer does not completely neutralize the surface charge, and a diffuse layer exists beyond the interface electrostatically attracted to the residual net surface charge.
Lack of suitable experimental tools had in the past prevented direct verification of these models. Understanding of the double layer structure was gained mainly through analytical and simulation studies. Although certain experimental methods, such as, the surface force apparatus method (Israelachivilli 1991), are capable of probing the double-layer structure and confirming its existence, their poor lateral spatial resolution and pervasive nature prevent them from obtaining molecular-scale structural data. The diffuse layer profiled with long-period X-ray standing waves
The development of the long-period XSW techniques led to the first direct, in situ observation of the electrical double layer structure by Bedzyk et al. (1990). These investigators examined a double layer structure of Zn2+ ions at the interface of a dilute ZnCl2 aqueous solution and a charged phospholipid membrane. In this interface system, illustrated in Figure 26, the 27-nm-thick ordered membrane rests on a Si/W LSM. At the
Figure 23. Ideal structures of self-assembled organic monolayers on the surface of a Mo/Si LSM. Sample 1 is a (3-bromopropyl)trichlorosilane monolayer. Sample 2 is an octachlorotrisiloxane-capped (3-bromopropyl)trichlorosilane monolayer. Sample 3 is a trilayer-coupled multilayer. Reprinted with permission from Lin et al. (1997). Copyright 1997 by the American Chemical Society.

258 Bedzyk & Cheng
top portion of the membrane, a negatively charged sheet of PO42− ions was in contact
with a 0.1 mM ZnCl2 solution. At different solution pH levels, XSW measurements were then made under the TER condition. These measurements allowed derivation of the Debye length of the electrostatically attracted diffuse Zn2+ layer, as well as the coverage of the condensed Zn2+ layer as a function of solution pH.
Distribution structure and Debye length of the diffuse layer; condensed concentration. Figure 27 shows the TER-XSW results of these studies at pH 6.8, 4.4, and 2.0. In all three cases, the maximum of the Zn fluorescence yield appears at angle below the substrate critical angle. Because the first antinodal plane moves toward the
Figure 24. Experimental (open and filled circles) and theoretical (solid lines) reflectivity and Br Kα fluorescence yields as a function of incident angle. Parts (a), (c), and (e) are the results from TER-XSW on samples 1, 2, and 3, respectively (in Fig. 23). Parts (b), (d), and (f) are the results from LSM-XSW measurements on samples 1, 2, and 3, respectively. Reprinted with permission from Lin et al. (1997). Copyright 1997 by the American Chemical Society.
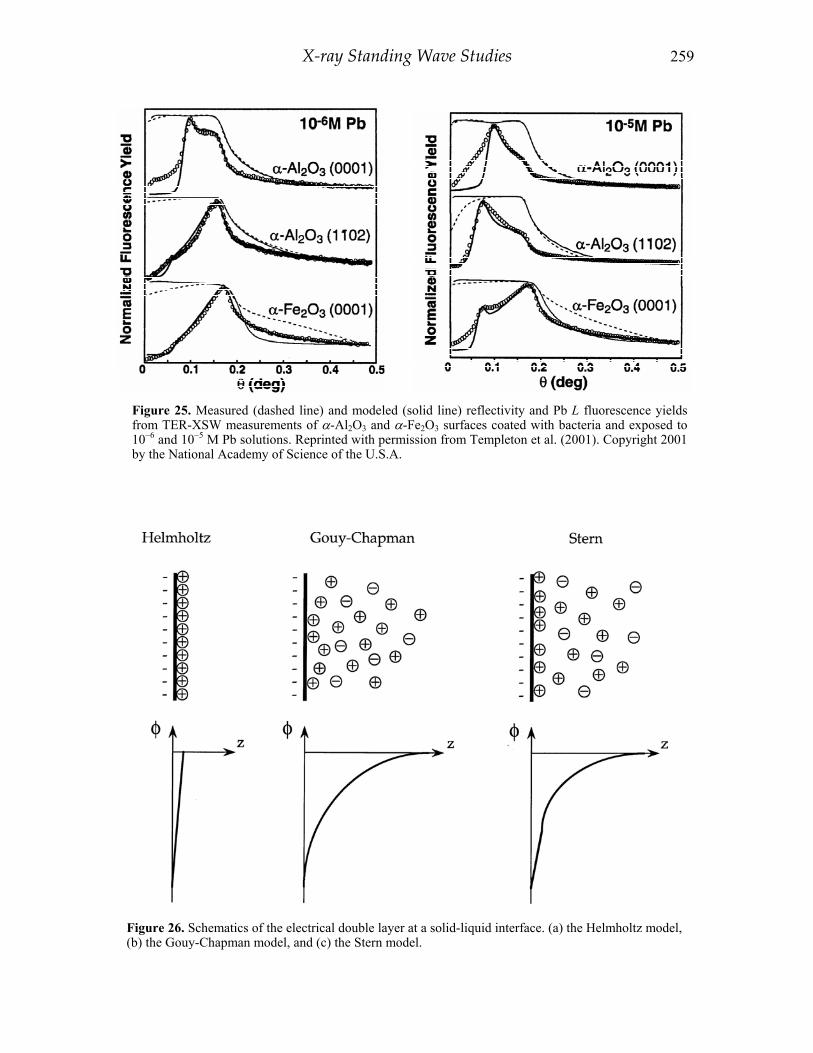
X-ray Standing Wave Studies 259
Figure 25. Measured (dashed line) and modeled (solid line) reflectivity and Pb L fluorescence yields from TER-XSW measurements of α-Al2O3 and α-Fe2O3 surfaces coated with bacteria and exposed to 10−6 and 10−5 M Pb solutions. Reprinted with permission from Templeton et al. (2001). Copyright 2001 by the National Academy of Science of the U.S.A.
Figure 26. Schematics of the electrical double layer at a solid-liquid interface. (a) the Helmholtz model, (b) the Gouy-Chapman model, and (c) the Stern model.

260 Bedzyk & Cheng
Figure 27 Reflectivity and Zn Kα fluorescence yields as a function of incident angle for three different pH values from TER-XSW measurements of the diffuse double layer at the water-charged membrane surface. Reprinted with permission from Bedzyk et al. (1990). Copyright 1990 by the American Association for the Advancement of Science.

X-ray Standing Wave Studies 261
surface as the angle is increased toward the critical angle, the angular position of this maximum indicates that a concentrated layer of Zn2+ is located at some displaced distance above the substrate surface. For the case of pH 6.8, the results show that a calculated model based on the Helmholtz double layer structure of Zn2+ distribution cannot satisfactorily fit the data (Fig. 27b, dashed line). On the other hand, a model assuming an exponential decay distribution of Zn2+, qualitatively based on the Gouy-Chapman-Stern model, agrees well with the data (Fig. 27b, solid line). In this model, the two model parameters are the Zn2+ concentration (i.e., coverage) in the condensed layer and the Debye length of the exponential decay. For the pH 6.8 solution, the Zn2+ surface concentration in the condensed layer is 7.7×1012 cm−2, and the Debye length of the diffuse distribution is 58 Å. As the pH is decreased from 6.8 to 4.4 to 2.0, the Debye length decreases from 58 to 8 to 3 Å. At the same time, the condensed Zn2+ surface concentration changes from 7.7 to 7.7 to 4.4×1012 cm−2. This change in the Debye length of the Zn ions represents a weakening of the electrostatic attraction of the charged interface due to protonation of the phosphate head groups of the lipid membrane.
Thermodynamic reversibility. Further investigation of the structural properties of the diffuse layer focused on its thermodynamic reversibility (Wang et al. 2001). In this study, TER-XSW was used on a similar aqueous interface system but that was supported by a Au mirror substrate. Originally set at pH 5.8, the solution (0.1 mM ZnCl2) was titrated through a cycle of pH levels, first to pH 4.2 and then to pH 2.0, and then back to pH 4.2 and then to pH 5.8. The Zn data were fitted with the same exponential decay model. During the titrations downward in pH, the condensed layer surface concentration decreased from 2.2 to 0.67 to 0.34×10⁻¹² cm−2, and the Debye length decreased from 20 to 18 to 9 Å. During the subsequent titration upward in pH, both the condensed layer concentration and the Debye length tracked the corresponding values for the downward titration. These experiments proved the reversibility of the electric double layer structure. The condensed layer measured with Bragg-diffraction X-ray standing waves
The pH dependence of the condensed Zn2+ concentration revealed in the TER-XSW studies is direct proof that the condensed layer is an integral part of the double layer system. However, in addition to being sensitive to solution conditions, the ions in the condensed layer, as a surface phase, must also depend on the properties of the solid surface. Thus, investigations of the condensed layer require understanding the bonding relationship between the aqueous ions and the surface atoms. Ideally, this can be gained by surface-polarized EXAFS measurements in the interface system. However, at least for oxides and many other surfaces, the first-neighbor atoms bonded to the ions in the condensed layer are often oxygen atoms, which cannot be distinguished from oxygen atoms in an aqueous hydration shell. Alternatively, one may use Bragg diffraction XSW to locate the three-dimensional surface sites of the condensed ions, as in the ion adsorption experiments on calcite described in an earlier section of this chapter. These sites give information on the possible bonding structure of the ions in the condensed layer.
Specific adsorption at electrochemical interfaces. Bragg diffraction XSW has been used to probe the structures of specifically adsorbed ions at metal-electrolyte and semiconductor-electrolyte interfaces under controlled electrochemical conditions. Among the earliest work in this category is the study of Tl adsorption from a dilute solution (mM) on Cu(111) through underpotential deposition (Materlik et al. 1987; Zegenhagen et al. 1990).
Condensed structures of Sr2+ and Cu2+on rutile. To address condensed layer structures more directly related to mineral-aqueous interfaces, the adsorption of dilute divalent cations (~µM) on the TiO2(110) surface was investigated. The studies addressed

262 Bedzyk & Cheng
the structure of specifically adsorbed Sr2+ on TiO2(110) (Fenter et al. 2000b) and the structure of specifically adsorbed Cu2+ on TiO2(110) (Cheng et al. unpublished; Fig. 28). To prove that the condensed ions are directly bonded to surface atoms, XSW measurements in the surface-normal direction were made after the solutions had been removed (without allowing precipitation). Ordered adsorbates were found for both Sr2+ and Cu2+, even with some surface roughness. For Sr2+, the typical ex situ coherent fraction is ~0.3, and the coherent position is ~0.9. For Cu2+, the coherent fraction is 0.36, the coherent position is 0.91. In situ measurements also made on the Sr2+ adsorption surface gave slightly higher coherent fractions than the ex situ measurements. Polarization-dependent EXAFS measurements were also taken on the Sr2+ interface in in-plane and surface-normal directions. A structural model based on the XSW coherent position and the EXAFS nearest-neighbor distances revealed that the condensed Sr2+ ion is coordinated with the surface by tetradentate bridging in octahedral coordination.
Comparison of Sr2+ and Zn2+ adsorption structures on rutile. The Sr2+ tetradentate adsorption structure on TiO2 derived above is supported by recent in situ XSW triangulation measurement (Zhang et al., unpublished). A similar measurement of Zn2+ on TiO2, however, suggests a monodendate surface site (Zhang et al., unpublished). These contrasting surface adsorption structures for the two isovalent cations can be explained by the difference in their hydration energies. For the larger Sr2+ ion (r = 2.36 Å), the hydration energy is lower, and the ion can be relatively easily dehydrated and thus coordinated at the most favorable surface site in tetradentate coordination. For the smaller Zn2+ ion (r = 2.11 Å), it is more difficult to remove hydration molecules. These results demonstrate the important competing effects between hydration structures and surface sites in aqueous ion adsorption.
CONCLUSION While the X-ray standing wave technique has been actively used over the past two
decades for investigating adsorbate structures on semiconductor surfaces, it has only seen recent use in molecular geochemistry and environmental sciences. The primary attraction of
Figure 28 XSW standing wave data for Cu2+ adsorbed at the TiO2 (110) surface from a dilute aqueous solution (Cheng et al. unpublished).

X-ray Standing Wave Studies 263
XSW to this area is its ability to uniquely produce high-resolution element-specific surface structural information at the mineral-fluid interface and impurity point-defect structures in minerals. The recent success in the geochemical and environmental sciences is partially due to the availability of new higher-intensity synchrotron facilities and developments of the XSW technique that allow its applicability to a larger class of crystalline substrates. It is worthwhile to emphasize the directness of the XSW method as a structural probe that comes from its elemental and phase sensitivities, and the subsequent reliability of the results. It is also important to note that no one method solves all problems, especially complex problems that deal with realistic environments. Better insights in any system are often achieved when the XSW methods are used in combination with other, complementary techniques, such as EXAFS, X-ray reflectivity and diffraction, as exemplified in a number of the example applications reviewed in this chapter. The in situ atomic-scale quantitative structural information from such a combined X-ray experimental approach, in correlation with scanning probe microscopy and theoretical calculations, will greatly aid in refining the knowledge base presently in place for describing the mineral-fluid interface and impurity point-defect structures in minerals.
ACKNOWLEDGMENTS The authors thank Paul Fenter, Neil Sturchio and two anonymous reviewers for
critical reviews of this chapter. This work was supported by the U. S. Department of Energy, BES under contract W-31-109-ENG-38 to Argonne National Laboratory and by the U. S. National Science Foundation under contract CHE-9810378 to the Institute of Environmental Catalysis at Northwestern University.
REFERENCES Abruna HD, White JH, Albarelli MJ, Bommarito GM, Bedzyk MJ, McMillan M (1988) Uses of
synchrotron radiation in the in situ study of electrochemical interfaces. J Phys Chem 92:7045-7052 Afanas’ev AM, Kohn VG (1978) External photoeffect in the diffraction of X-rays in a crystal with a
perturbed layer. Sov Phys JETP 47: 154-161 Authier A (2001) Dynamical Theory of X-ray Diffraction. Oxford University Press, New York Batterman BW (1964) Effect of dynamical diffraction in X-ray fluorescence scattering. Phys Rev
133:A759-764 Batterman BW, Cole H (1964) Dynamical diffraction of X-rays by perfect crystals. Rev Mod Phys 36:681-
717 Batterman BW (1969) Detection of foreign atom sites by their X-ray fluorescence scattering. Phys Rev
Lett 22:703-705 Becker RS, Golovchenko JA, Patel JR (1983) X-ray evanescent-wave absorption and emission. Phys Rev
Lett 50:153-156. Bedzyk MJ and Materlik G (1985) Two-beam dynamical diffraction solution of the phase problem: A
determination with X-ray standing waves. Phys Rev B 32:6456-6463 Bedzyk MJ, Bilderback D, White J, Abruna HD, Bommarito GM (1986) Probing electrochemical
interfaces with X-ray standing waves. J Phys Chem 90:4926-4928 Bedzyk MJ, Bilderback D, Bommarito GM, Caffrey M, Schildkraut JS (1988) X-ray standing waves; A
molecular yardstick for biological membranes. Science 241:1788-1791 Bedzyk MJ, Bommarito GM, Schildkraut JS (1989) X-ray standing waves at a reflecting mirror surface.
Phys Rev Lett 62:1376-1379 Bedzyk MJ, Bommarito GM, Caffrey M, Penner TA (1990) Diffuse-double layer at a membrane-aqueous
interface measured with X-ray standing waves. Science 248:52-56 Bedzyk MJ (1992) X-ray standing wave studies of the liquid/solid interface and ultrathin organic films. In
Springer Proceedings in Physics. Vol 61: Surface X-ray and Neutron Scattering. Zabel H, Robinson IK (eds) Springer-Verlag, Berlin, p 113-117
Bedzyk MJ, Kazimirov A, Marasco DL, Lee TL, Foster CM, Bai GR, Lyman, PF, Keane DT (2000) Probing the polarity of ferroelectric thin films with X-ray standing waves. Phys Rev B 61:R7873-R7876
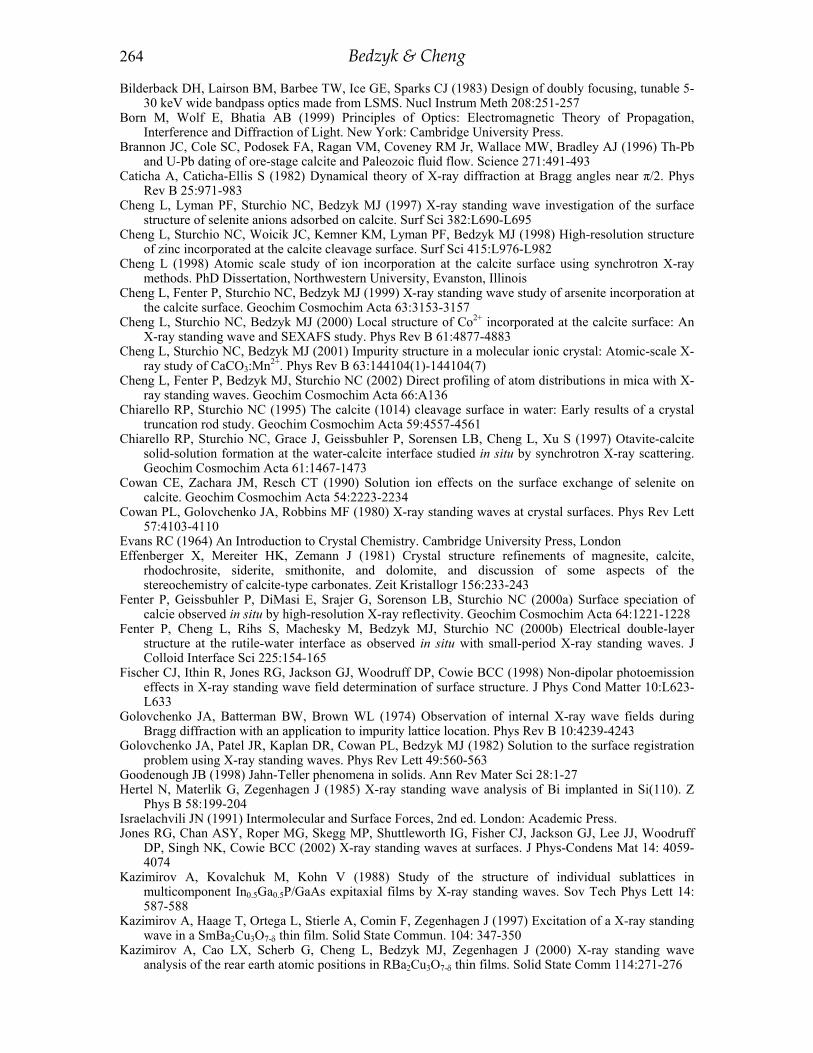
264 Bedzyk & Cheng
Bilderback DH, Lairson BM, Barbee TW, Ice GE, Sparks CJ (1983) Design of doubly focusing, tunable 5-30 keV wide bandpass optics made from LSMS. Nucl Instrum Meth 208:251-257
Born M, Wolf E, Bhatia AB (1999) Principles of Optics: Electromagnetic Theory of Propagation, Interference and Diffraction of Light. New York: Cambridge University Press.
Brannon JC, Cole SC, Podosek FA, Ragan VM, Coveney RM Jr, Wallace MW, Bradley AJ (1996) Th-Pb and U-Pb dating of ore-stage calcite and Paleozoic fluid flow. Science 271:491-493
Caticha A, Caticha-Ellis S (1982) Dynamical theory of X-ray diffraction at Bragg angles near π/2. Phys Rev B 25:971-983
Cheng L, Lyman PF, Sturchio NC, Bedzyk MJ (1997) X-ray standing wave investigation of the surface structure of selenite anions adsorbed on calcite. Surf Sci 382:L690-L695
Cheng L, Sturchio NC, Woicik JC, Kemner KM, Lyman PF, Bedzyk MJ (1998) High-resolution structure of zinc incorporated at the calcite cleavage surface. Surf Sci 415:L976-L982
Cheng L (1998) Atomic scale study of ion incorporation at the calcite surface using synchrotron X-ray methods. PhD Dissertation, Northwestern University, Evanston, Illinois
Cheng L, Fenter P, Sturchio NC, Bedzyk MJ (1999) X-ray standing wave study of arsenite incorporation at the calcite surface. Geochim Cosmochim Acta 63:3153-3157
Cheng L, Sturchio NC, Bedzyk MJ (2000) Local structure of Co2+ incorporated at the calcite surface: An X-ray standing wave and SEXAFS study. Phys Rev B 61:4877-4883
Cheng L, Sturchio NC, Bedzyk MJ (2001) Impurity structure in a molecular ionic crystal: Atomic-scale X-ray study of CaCO3:Mn2+. Phys Rev B 63:144104(1)-144104(7)
Cheng L, Fenter P, Bedzyk MJ, Sturchio NC (2002) Direct profiling of atom distributions in mica with X-ray standing waves. Geochim Cosmochim Acta 66:A136
Chiarello RP, Sturchio NC (1995) The calcite (1014) cleavage surface in water: Early results of a crystal truncation rod study. Geochim Cosmochim Acta 59:4557-4561
Chiarello RP, Sturchio NC, Grace J, Geissbuhler P, Sorensen LB, Cheng L, Xu S (1997) Otavite-calcite solid-solution formation at the water-calcite interface studied in situ by synchrotron X-ray scattering. Geochim Cosmochim Acta 61:1467-1473
Cowan CE, Zachara JM, Resch CT (1990) Solution ion effects on the surface exchange of selenite on calcite. Geochim Cosmochim Acta 54:2223-2234
Cowan PL, Golovchenko JA, Robbins MF (1980) X-ray standing waves at crystal surfaces. Phys Rev Lett 57:4103-4110
Evans RC (1964) An Introduction to Crystal Chemistry. Cambridge University Press, London Effenberger X, Mereiter HK, Zemann J (1981) Crystal structure refinements of magnesite, calcite,
rhodochrosite, siderite, smithonite, and dolomite, and discussion of some aspects of the stereochemistry of calcite-type carbonates. Zeit Kristallogr 156:233-243
Fenter P, Geissbuhler P, DiMasi E, Srajer G, Sorenson LB, Sturchio NC (2000a) Surface speciation of calcie observed in situ by high-resolution X-ray reflectivity. Geochim Cosmochim Acta 64:1221-1228
Fenter P, Cheng L, Rihs S, Machesky M, Bedzyk MJ, Sturchio NC (2000b) Electrical double-layer structure at the rutile-water interface as observed in situ with small-period X-ray standing waves. J Colloid Interface Sci 225:154-165
Fischer CJ, Ithin R, Jones RG, Jackson GJ, Woodruff DP, Cowie BCC (1998) Non-dipolar photoemission effects in X-ray standing wave field determination of surface structure. J Phys Cond Matter 10:L623-L633
Golovchenko JA, Batterman BW, Brown WL (1974) Observation of internal X-ray wave fields during Bragg diffraction with an application to impurity lattice location. Phys Rev B 10:4239-4243
Golovchenko JA, Patel JR, Kaplan DR, Cowan PL, Bedzyk MJ (1982) Solution to the surface registration problem using X-ray standing waves. Phys Rev Lett 49:560-563
Goodenough JB (1998) Jahn-Teller phenomena in solids. Ann Rev Mater Sci 28:1-27 Hertel N, Materlik G, Zegenhagen J (1985) X-ray standing wave analysis of Bi implanted in Si(110). Z
Phys B 58:199-204 Israelachvili JN (1991) Intermolecular and Surface Forces, 2nd ed. London: Academic Press. Jones RG, Chan ASY, Roper MG, Skegg MP, Shuttleworth IG, Fisher CJ, Jackson GJ, Lee JJ, Woodruff
DP, Singh NK, Cowie BCC (2002) X-ray standing waves at surfaces. J Phys-Condens Mat 14: 4059-4074
Kazimirov A, Kovalchuk M, Kohn V (1988) Study of the structure of individual sublattices in multicomponent In0.5Ga0.5P/GaAs expitaxial films by X-ray standing waves. Sov Tech Phys Lett 14: 587-588
Kazimirov A, Haage T, Ortega L, Stierle A, Comin F, Zegenhagen J (1997) Excitation of a X-ray standing wave in a SmBa2Cu3O7-δ thin film. Solid State Commun. 104: 347-350
Kazimirov A, Cao LX, Scherb G, Cheng L, Bedzyk MJ, Zegenhagen J (2000) X-ray standing wave analysis of the rear earth atomic positions in RBa2Cu3O7-δ thin films. Solid State Comm 114:271-276

X-ray Standing Wave Studies 265
Kelly S, Newville M. Cheng L, Kemner K, Sutton S, Fenter P, Sturchio NC (2002) Uranyl incorporation in natural calcite. Environmental Science and Technology (in review)
Kendelewicz T, Liu P, Brown GE, Nelson EJ (1998a) Atomic geometry of the PbS(100) surface. Surf Sci 395:229-238
Kendelewicz T, Liu P, Brown GE, Nelson EJ (1998b) Interaction of sodium overlayers with the PbS(100) (galena) surface: Evidence for a Na-Pb exchange reaction. Surf Sci 411:10-22
Kim CY, Bedzyk MJ, Nelson EJ, Woicik JC, Berman LE (2002) Site -specific valence band photoemission study of α-Fe2O3, Phys Rev B 66:085115(1)-085115(4)
Kohra K, Matsushita T (1972) Some characteristics of dynamical diffraction at a Bragg angle of about π/2. Z Naturforsch A 27:484-487
Krolzig A, Materlik G, Swars M, Zegenhagen J (1984) A feedback control system for synchrotron radiation double crystal instruments. Nucl Instrum Method Phys Rev A 219:430-436
Lamble GM, Reeder RJ, Northrup PA (1997) Characterization of heavy metal incorporation in calcite by XAFS spectroscopy. J Phys IV 7:793-797
Laue M (1960) Roentgenstrahl-Interferenzen, Akademische-Verlagsgeslellschaft, Frankfurt Lee TL, Qian Y, Lyman PF, Woicik JC, Pellegrino JG, Bedzyk MJ (1996) The use of X-ray standing
waves and evanescent-wave emission to study buried strained-layer heterostructures. Physica B 221:437-440
Lee, TL (1999) High-Resolution Analysis of Adsorbate-Induced GaAs(001) Surface Structures and Strain in Buried III-V Semiconductor Heterolayers by X-ray Standing Waves. PhD Dissertation, Northwestern University, Evanston, Illinois
Liang Y, Lea AS, Baer DR, Engelhard MH (1996) Structure of the cleaved CaCO3 (1014) surface in an aqueous environment. Surf Sci 351:172-182
Lin W, Lee TL, Lyman PF, Lee JJ, Bedzyk MJ, Marks TJ (1997) Atomic resolution X-ray standing wave microstructural characterization of NLO-active self-assembled chromophoric superlattices. J Am Chem Soc 119:2205-2211
Liu P, Kendelewicz T, Nelson EJ, Brown GE (1998) Reaction of water with MgO(100) surfaces: Part III. X-ray standing wave studies. Surf Sci 415:156-169
Ludwig KR, Simmons KR, Szabo BJ, Winograd IJ, Landwehr JM, Riggs AC, Hoffman RJ (1992) Mass-spectrometric thorium-230-uranium-234-uranium-238 dating of the Devils Hole calcite vein. Science 258:284-287
Materlik G, Schmaeh M, Zegenhagen J, Uelhoff W (1987) Structure determination of adsorbates on single crystal electrodes with X-ray standing waves. Ber Bunsen-Ges Phys Chem 91:292-296
Mucci A, Morse JW (1983) The incorporation of Mg2+ and Sr2+ into calcite overgrowths: Influences of growth rate and solution composition. Geochim Cosmochim Acta 47:217-233
Masel MI (1996) Principles of adsorption and reaction on solid surfaces. Wiley, New York National Research Council Subcommittee on Selenium (1983) Selenium in Nutrition. National Academy
Press, Washington Ohnesorge F, Binnig G (1993) True atomic resolution by atomic force microscopy through repulsive and
attractive forces. Science 260:1451-1456 Parratt LG (1954) Surface studies of solids by total reflection of X-rays. Phys Rev 95:359-369 Pingitore NE Jr, Eastman MP, Sandidge M, Oden K, Freiha B (1988) The coprecipitation of manganese(II)
with calcite: an experimental study. Mar Chem 25:107-120 Qian Y, Sturchio NC, Chiarello RP, Lyman PF, Lee TL, Bedzyk MJ (1994) Lattice location of trace
elements within minerals and at their surfaces with X-ray standing waves. Science 265:1555-1557 Reeder RJ, Lamble GM, Northrup PA (1999) XAFS study of the coordination and local relaxation around
Co2+ ,Zn2+, Pb2+, and Ba2+ trace elements in calcite. Am Min 84:1049-1060 Rodrigues WP (2000) Growth and characterization of Si/Ge heterostructures on Si(001) surface and Ge
nano-dots on Si(001) surface. PhD Dissertation, Northwestern University, Evanston, Illinois Schreiber F, Ritley KA, Vartanyants IA, Dosch H, Zegenhagen J, Cowie BCC (2001) Non-dipolar
contributions in XPS detection of X-ray standing waves. Surf Sci 486:L519-L523 Stipp SL, Hochella MF (1991) Structure and bonding environments at the calcite surface as observed with
X-ray photoelectron spectroscopy and low-energy electron diffraction. Geochim Cosmochim Acta 55:1723-1736
Stumm W (1992) Chemistry of the solid-water interface. Wiley, New York Sturchio NC, Chiarello RP, Cheng L, Lyman PF, Yee D, Geissbuhler P, Bedzyk MJ, Sorensen LB, Liang
Y, Baer DR, Qian Y, You H (1997) Lead sorption at the calcite-water interface: Synchrotron X-ray standing wave and reflectivity studies. Geochim Cosmochim Acta 61(2):251-263
Sturchio NC, Rihs S, Cheng L, Fenter P, Orlandini KA (2001) Uranyl adsorption on calcite observed with X-ray standing waves. Abstr Pap Am Chem S 222:23

266 Bedzyk & Cheng
Takahashi T, Kikuta S (1979) Variation of the yield of photoelectrons emitted from a silicon single crystal under the asymmetric diffraction condition of X-rays. J Phys Soc Japan 46:1608-1615
Tasker PW (1979) The stability of ionic crystal surfaces. J Phys C 12:4977-4984 Templeton AS, Trainor TP, Traina SJ, Spormann AM, Brown GE (2001) Pb(II) distributions at biofilm-
metal oxide interfaces. Proc Nat Acad Sci 98:11897-11902 Trainor TP, Templeton AS, Brown GE, Parks GA (2002) Application of the long-period X-ray standing
wave technique to the analysis of surface reactivity: Pb(II) sorption at α-Al2O3/aqueous solution interfaces in the presence and absence of Se(VI). Langmuir 18:5782-5791
Vartanyants IA, Kovalchuk MV (2001) Theory and applications of X-ray standing waves in real crystals. Rep Prog Phys 64:1009-1084
Wang J, Bedzyk MJ, Thomas LP, Caffrey M (1991) Structural studies of membranes and surface layers up to 1,000 Å thick using X-ray standing waves. Nature 354:377-380
Wang J, Bedzyk MJ, Caffrey M (1992) Resonance-enhanced X-rays in thin films: A structure probe for membranes and surface layers. Science 258:775-778
Wang J, Caffrey M, Bedzyk MJ, Penner TL (2001) Direct profiling and reversibility of ion distribution at a charged membrane/aqueous interface: An X-ray standing wave study. Langmuir 17:3671-3681
Woicik JC, Nelson EJ, Heskett D, Warner J, Berman LE, Karlin BA, Vartanyants IA, Hasan MZ, Kendelewicz T, Shen ZX, and Pianetta P (2001) X-ray standing wave investigations of valence electronic structure. Phys Rev B 64:125115
Woodruff DP (1998) Normal incidence X-ray standing wave determination of adsorbate structures. Prog Surf Sci 57:1-60
Zegenhagen J (1993) Surface structure determination with X-ray standing waves. Surf Sci Rep18:199-271 Zegenhagen J, Materlik G, Uelhoff W (1990) X-ray standing wave analysis of highly perfect Cu crystals
and electrodeposited submonolayers of Cd and Tl on Cu surfaces. J X-ray Sci Tech 2:214-239