Michael Drury - Monterrey 2016
33
0 Past Performance Is Not Necessarily Indicative Of Future Results. McVEAN Trading & Investments, LLC GLOBAL ECONOMIC OUTLOOK February 1, 2016 Michael Drury Chief Economist McVean Trading and Investments, LLC Global Interdependence Center Monterrey, Mexico
-
Upload
global-interdependence-center -
Category
Documents
-
view
231 -
download
2
description
Â
Transcript of Michael Drury - Monterrey 2016

0 Past Performance Is Not Necessarily Indicative Of Future Results.
McVEAN Trading & Investments, LLC
GLOBAL ECONOMIC OUTLOOK
February 1, 2016
Michael Drury
Chief Economist McVean Trading and Investments, LLC
Global Interdependence Center
Monterrey, Mexico

2015 GLOBAL GDP
$73.6 TRILLION (-3.6% Y/Y)
1 Past Performance Is Not Necessarily Indicative Of Future Results.
EUROPE
$17.5T
-10.9% NAFTA
$20T
+2.4%
Japan+South
Korea+Taiwan
$6.2T
-5.9%
Australia+Brazil+
Argentina+Russia+
OPEC
$7.9T
-17.7%
China
$11.5T
+8.0% Other
$10.5T
+0.8%
-4.1%
-9.7%
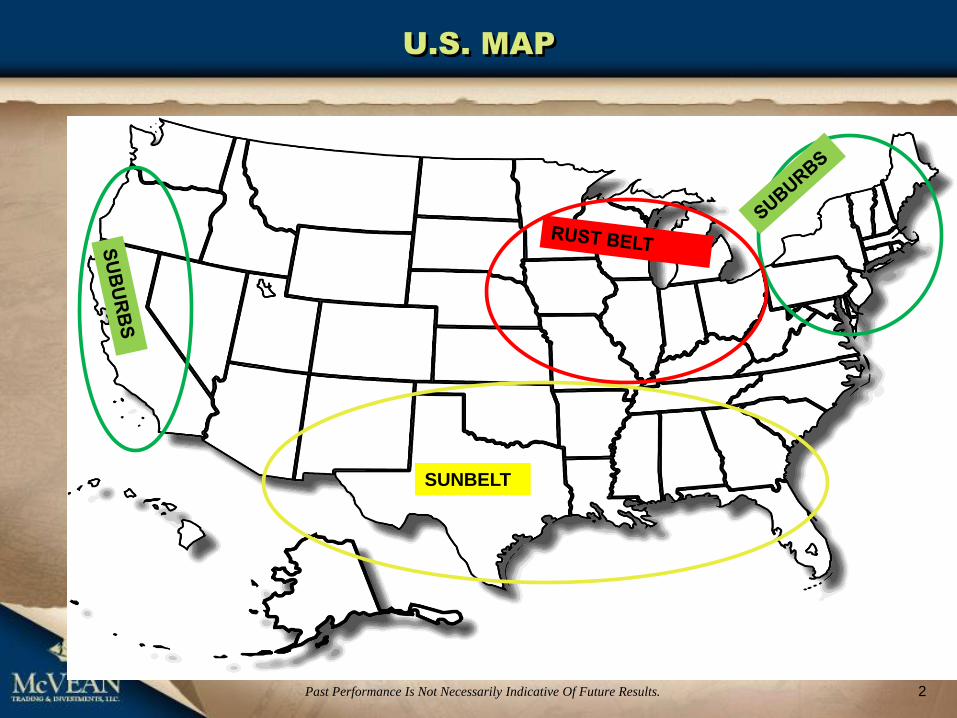
U.S. MAP
2 Past Performance Is Not Necessarily Indicative Of Future Results.
SUNBELT
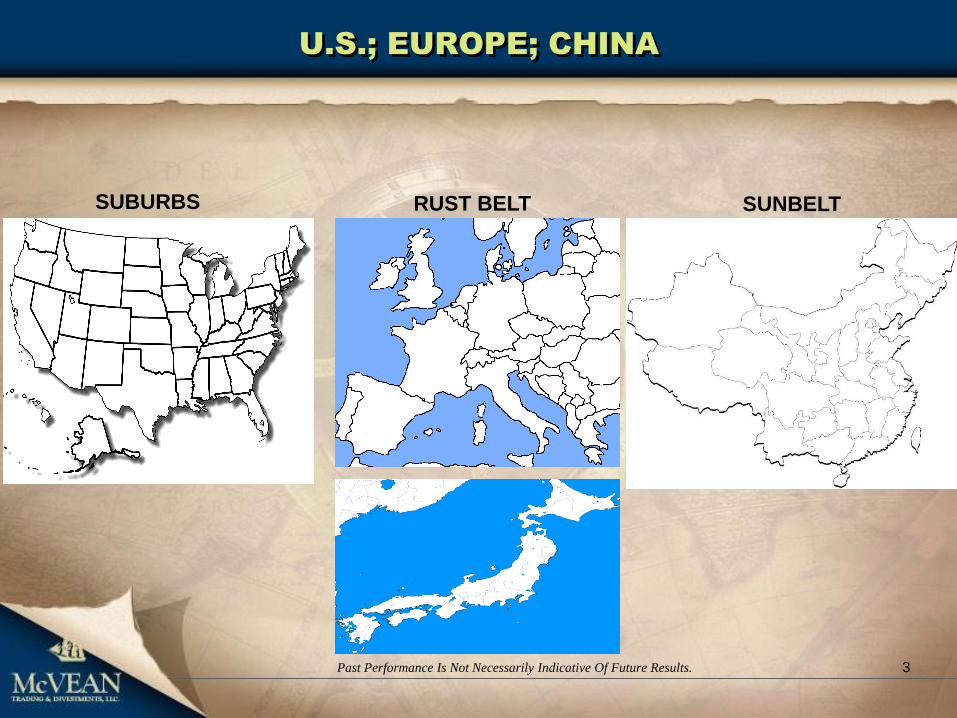
U.S.; EUROPE; CHINA
3 Past Performance Is Not Necessarily Indicative Of Future Results.
SUBURBS RUST BELT SUNBELT

-6%
-4%
-2%
0%
2%
4%
6%
8%
10%
12%
14%
Jan-49 Jan-55 Jan-61 Jan-67 Jan-73 Jan-79 Jan-85 Jan-91 Jan-97 Jan-03 Jan-09 Jan-15
Q3 2015
REAL GDP
CURRENT QTR % CHANGE FROM YEAR AGO
4 Past Performance Is Not Necessarily Indicative Of Future Results.
RTC
CRISIS
NASDAQ
BUBBLE
LEHMAN

REAL GDP
CURRENT QTR % CHANGE FROM YEAR AGO
5 Past Performance Is Not Necessarily Indicative Of Future Results.
NIKKEI
BUBBLE
ASIAN
CRISIS
LEHMAN
-6%
-4%
-2%
0%
2%
4%
6%
8%
10%
12%
14%
16%
Jan-49 Jan-55 Jan-61 Jan-67 Jan-73 Jan-79 Jan-85 Jan-91 Jan-97 Jan-03 Jan-09 Jan-15
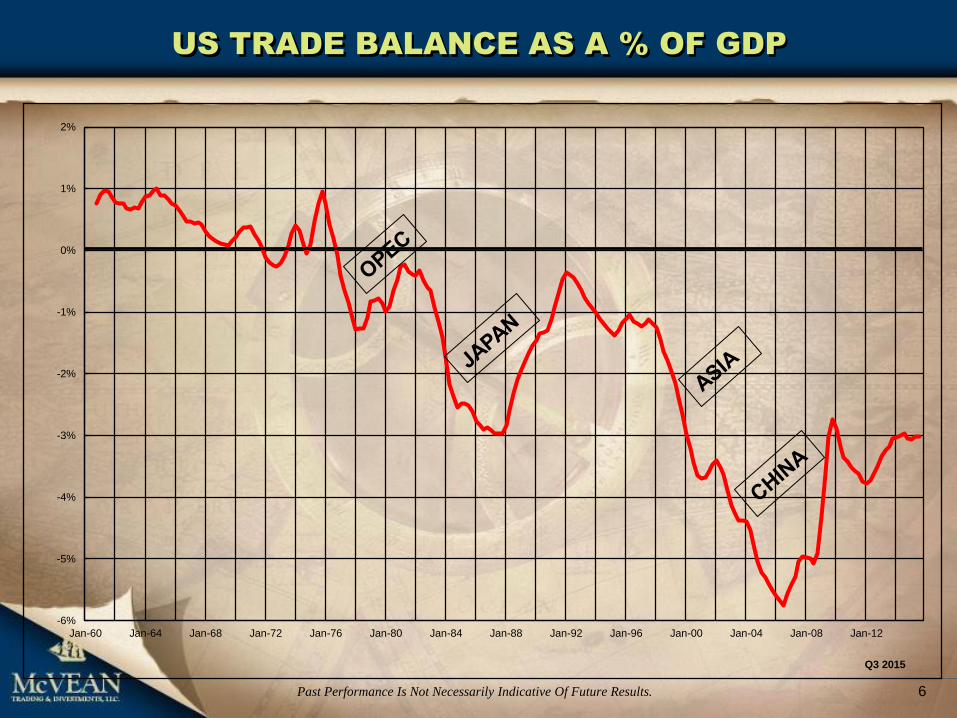
-6%
-5%
-4%
-3%
-2%
-1%
0%
1%
2%
Jan-60 Jan-64 Jan-68 Jan-72 Jan-76 Jan-80 Jan-84 Jan-88 Jan-92 Jan-96 Jan-00 Jan-04 Jan-08 Jan-12
Q3 2015
US TRADE BALANCE AS A % OF GDP
6 Past Performance Is Not Necessarily Indicative Of Future Results.
7 Past Performance Is Not Necessarily Indicative Of Future Results.
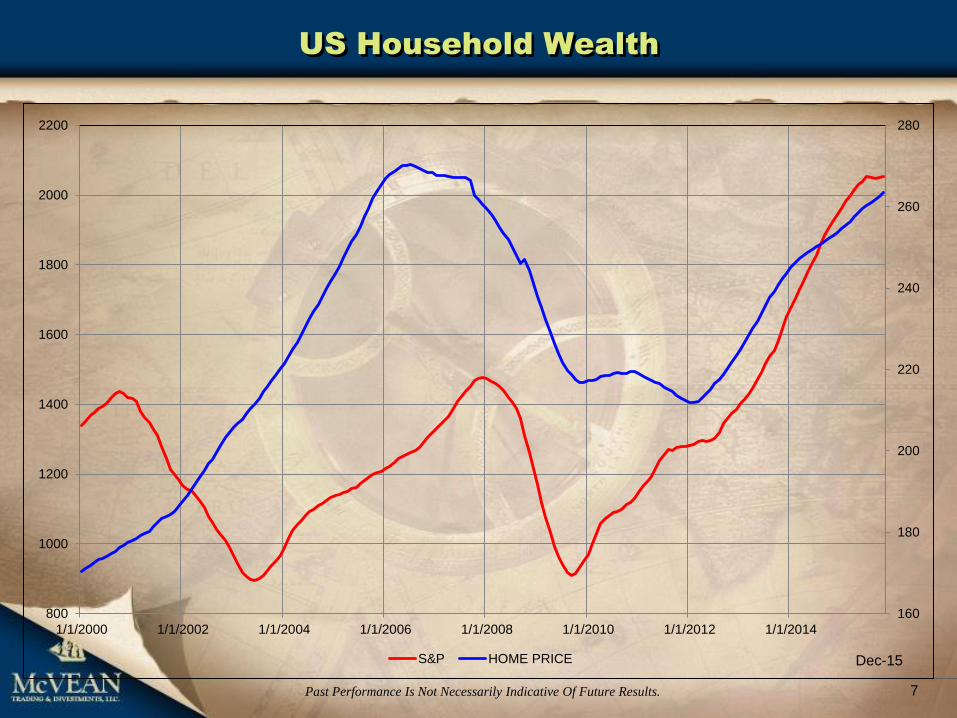
160
180
200
220
240
260
280
800
1000
1200
1400
1600
1800
2000
2200
1/1/2000 1/1/2002 1/1/2004 1/1/2006 1/1/2008 1/1/2010 1/1/2012 1/1/2014
S&P HOME PRICE Dec-15
US Household Wealth
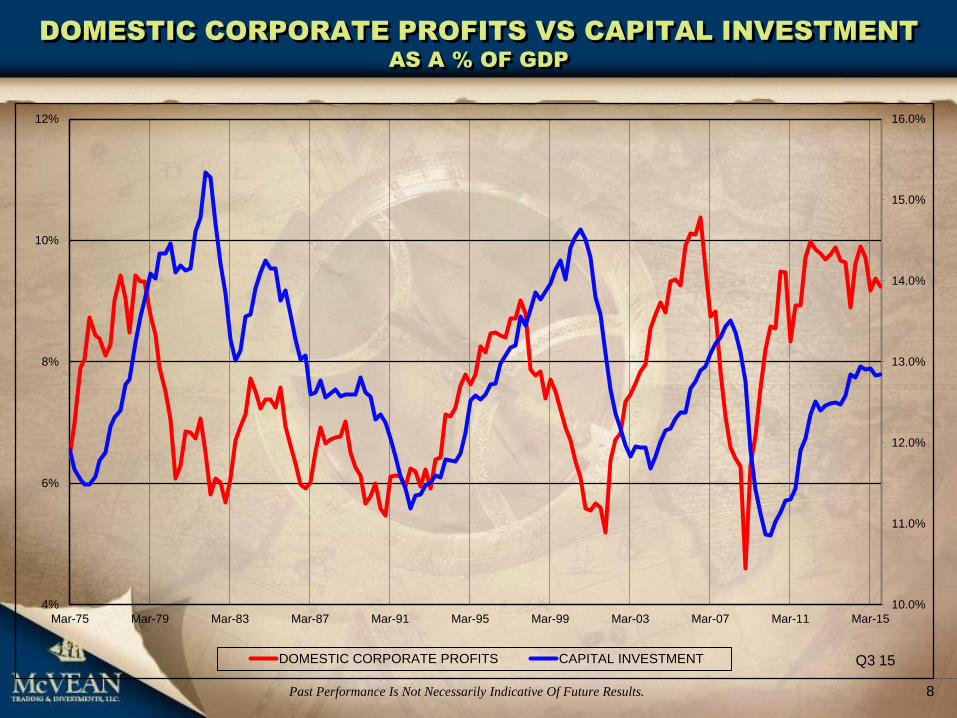
DOMESTIC CORPORATE PROFITS VS CAPITAL INVESTMENT
AS A % OF GDP
8 Past Performance Is Not Necessarily Indicative Of Future Results.
10.0%
11.0%
12.0%
13.0%
14.0%
15.0%
16.0%
4%
6%
8%
10%
12%
Mar-75 Mar-79 Mar-83 Mar-87 Mar-91 Mar-95 Mar-99 Mar-03 Mar-07 Mar-11 Mar-15
DOMESTIC CORPORATE PROFITS CAPITAL INVESTMENT Q3 15
POLICY LEVERS
• 1) Monetary Policy
• 2) Fiscal Policy
• 3) Regulation
• 4) Exchange Rates
9 Past Performance Is Not Necessarily Indicative Of Future Results.
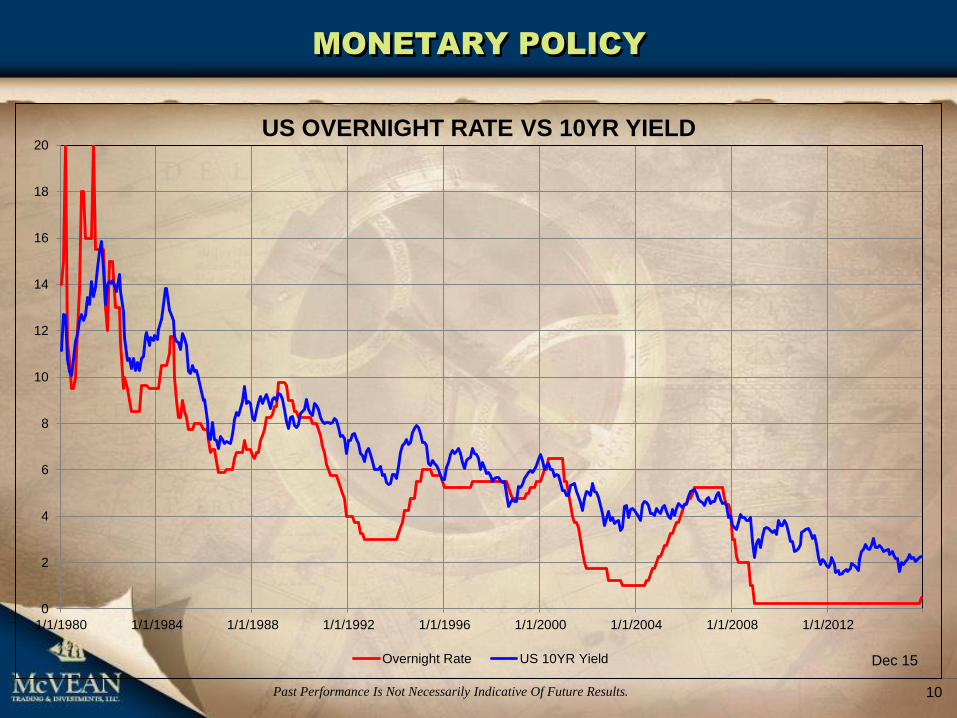
MONETARY POLICY
10 Past Performance Is Not Necessarily Indicative Of Future Results.
0
2
4
6
8
10
12
14
16
18
20
1/1/1980 1/1/1984 1/1/1988 1/1/1992 1/1/1996 1/1/2000 1/1/2004 1/1/2008 1/1/2012
US OVERNIGHT RATE VS 10YR YIELD
Overnight Rate US 10YR Yield Dec 15

5 YR TREASURY YIELD CHANGE FROM 5 YEARS AGO
11 Past Performance Is Not Necessarily Indicative Of Future Results.
-6
-5
-4
-3
-2
-1
0
1
2
Jan-89 Jan-91 Jan-93 Jan-95 Jan-97 Jan-99 Jan-01 Jan-03 Jan-05 Jan-07 Jan-09 Jan-11 Jan-13 Jan-15 Jan-17 Jan-19
ACTUAL PROJECTION AT CURRENT RATE
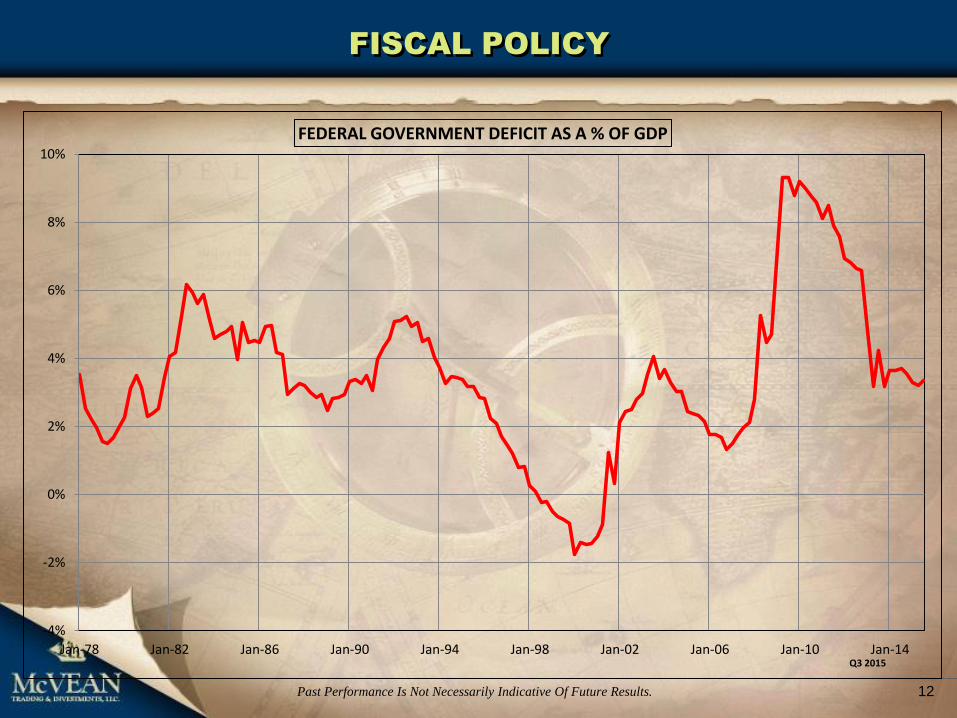
FISCAL POLICY
12 Past Performance Is Not Necessarily Indicative Of Future Results.
-4%
-2%
0%
2%
4%
6%
8%
10%
Jan-78 Jan-82 Jan-86 Jan-90 Jan-94 Jan-98 Jan-02 Jan-06 Jan-10 Jan-14
FEDERAL GOVERNMENT DEFICIT AS A % OF GDP
Q3 2015
REGULATION
• Exclusion of Utility Operations-Related Swaps with Utility Special Entities from De
Minimis Threshold for Swaps with Special Entities
• Prohibitions and Restrictions on Proprietary Trading and Certain Interests in, and
Relationships with, Hedge Funds and Private Equity Funds
• Derivatives Clearing Organizations and International Standards
• Protection of Collateral of Counterparties to Uncleared Swaps; Treatment of Securities
in a Portfolio Margining Account in a Commodity Broker Bankruptcy
• Swap Dealers and Major Swap Participants; Clerical or Ministerial Employees
• Clearing Exemption for Certain Swaps Entered Into by Cooperatives
• Harmonization of Compliance Obligations for Registered Investment Companies
Required To Register as Commodity Pool Operators
• Enhanced Risk Management Standards for Systemically Important Derivatives
Clearing Organizations
• Interpretive Guidance and Policy Statement Regarding Compliance With Certain Swap
Regulations
• Exemptive Order Regarding Compliance With Certain Swap Regulations
• Process for a Designated Contract Market or Swap Execution Facility To Make a Swap
Available to Trade, Swap Transaction Compliance and Implementation Schedule, and
Trade Execution Requirement Under the Commodity Exchange Act
• Core Principles and Other Requirements for Swap Execution Facilities
• Core Principles and Other Requirements for Swap Execution Facilities; Correction
• Procedures To Establish Appropriate Minimum Block Sizes for Large Notional Off-
Facility Swaps and Block Trades
• Procedures To Establish Appropriate Minimum Block Sizes for Large Notional Off-
Facility Swaps and Block Trades
• Procedures To Establish Appropriate Minimum Block Sizes for Large Notional Off-
Facility Swaps and Block Trades; Correction
• Reassignment of Commission Staff Responsibilities and Delegations of Authority
• Delegation of Authority To Disclose Confidential Information to a Contract Market,
Registered Futures Association or Self-Regulatory Organization
• Clearing Exemption for Swaps Between Certain Affiliated Entities
13 Past Performance Is Not Necessarily Indicative Of Future Results.
• DODD FRANK
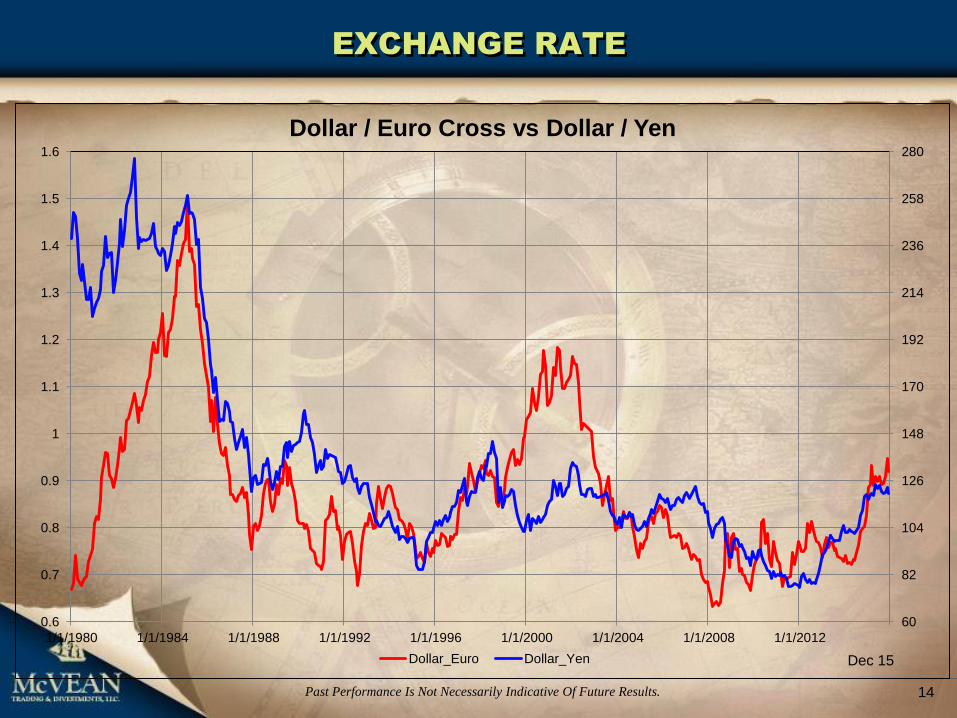
EXCHANGE RATE
14 Past Performance Is Not Necessarily Indicative Of Future Results.
60
82
104
126
148
170
192
214
236
258
280
0.6
0.7
0.8
0.9
1
1.1
1.2
1.3
1.4
1.5
1.6
1/1/1980 1/1/1984 1/1/1988 1/1/1992 1/1/1996 1/1/2000 1/1/2004 1/1/2008 1/1/2012
Dollar / Euro Cross vs Dollar / Yen
Dollar_Euro Dollar_Yen Dec 15

AGGREGATE HOURS WORKED VS AVERAGE HOURLY EARNINGS
THREE MO AVG % CHANGE FROM 3 MO AVG YEAR AGO
15 Past Performance Is Not Necessarily Indicative Of Future Results.
1.0%
1.5%
2.0%
2.5%
3.0%
3.5%
4.0%
4.5%
-8.0%
-6.0%
-4.0%
-2.0%
0.0%
2.0%
4.0%
6.0%
Jan-85 Jan-89 Jan-93 Jan-97 Jan-01 Jan-05 Jan-09 Jan-13
AGGREGATE HOURS WORKED AVERAGE HOURLY EARNINGS (right) Dec-15
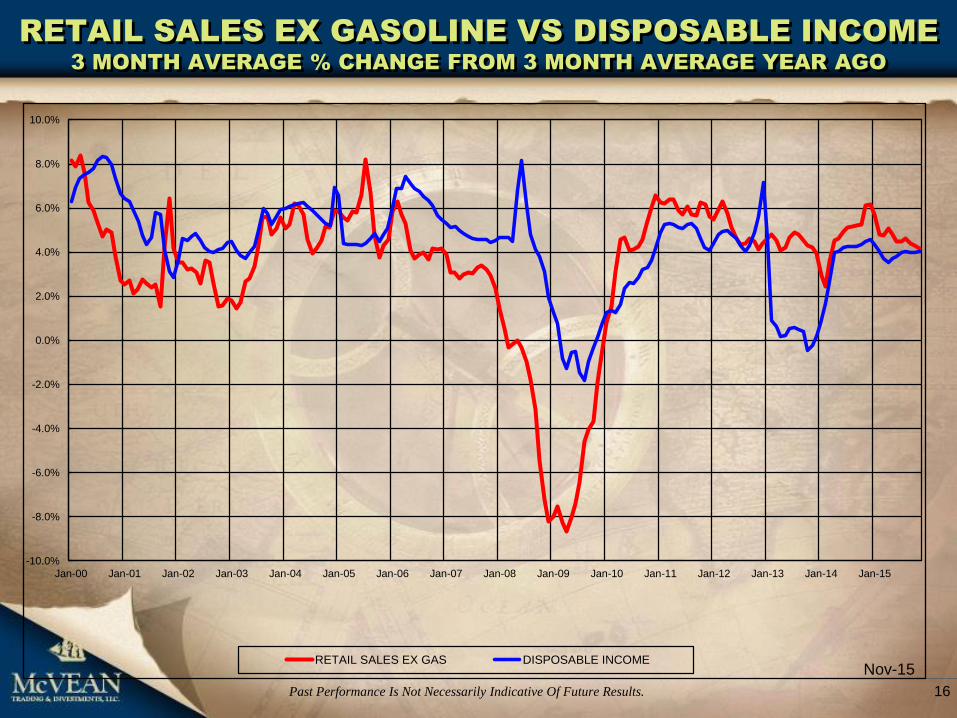
RETAIL SALES EX GASOLINE VS DISPOSABLE INCOME
3 MONTH AVERAGE % CHANGE FROM 3 MONTH AVERAGE YEAR AGO
16 Past Performance Is Not Necessarily Indicative Of Future Results.
Nov-15
-10.0%
-8.0%
-6.0%
-4.0%
-2.0%
0.0%
2.0%
4.0%
6.0%
8.0%
10.0%
Jan-00 Jan-01 Jan-02 Jan-03 Jan-04 Jan-05 Jan-06 Jan-07 Jan-08 Jan-09 Jan-10 Jan-11 Jan-12 Jan-13 Jan-14 Jan-15
RETAIL SALES EX GAS DISPOSABLE INCOME
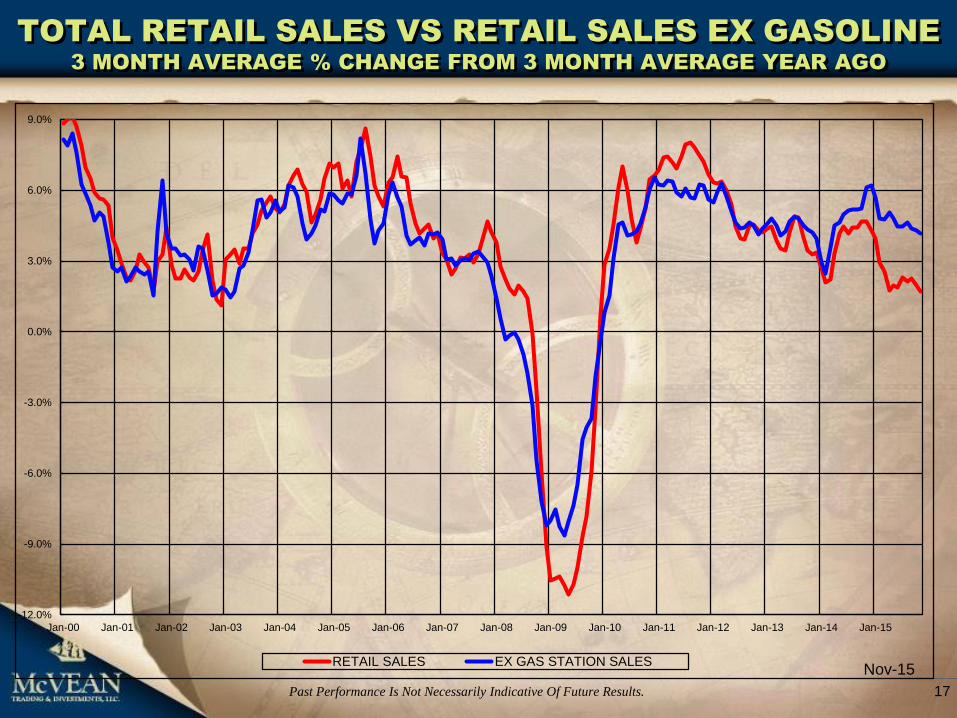
TOTAL RETAIL SALES VS RETAIL SALES EX GASOLINE
3 MONTH AVERAGE % CHANGE FROM 3 MONTH AVERAGE YEAR AGO
17 Past Performance Is Not Necessarily Indicative Of Future Results.
Nov-15
-12.0%
-9.0%
-6.0%
-3.0%
0.0%
3.0%
6.0%
9.0%
Jan-00 Jan-01 Jan-02 Jan-03 Jan-04 Jan-05 Jan-06 Jan-07 Jan-08 Jan-09 Jan-10 Jan-11 Jan-12 Jan-13 Jan-14 Jan-15
RETAIL SALES EX GAS STATION SALES
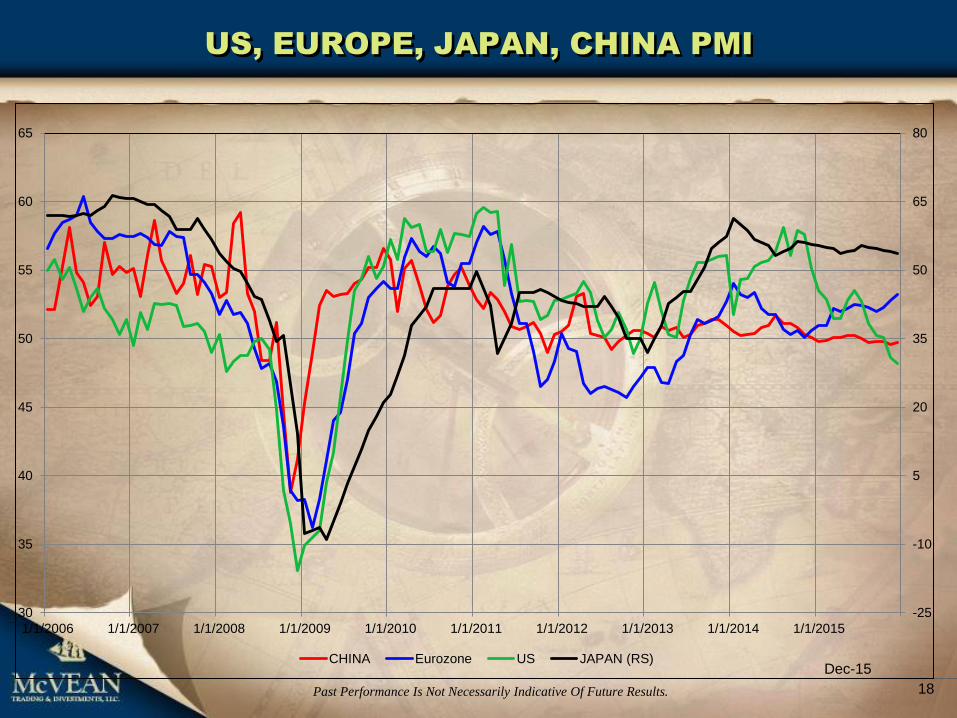
US, EUROPE, JAPAN, CHINA PMI
18 Past Performance Is Not Necessarily Indicative Of Future Results.
-25
-10
5
20
35
50
65
80
30
35
40
45
50
55
60
65
1/1/2006 1/1/2007 1/1/2008 1/1/2009 1/1/2010 1/1/2011 1/1/2012 1/1/2013 1/1/2014 1/1/2015
CHINA Eurozone US JAPAN (RS)Dec-15
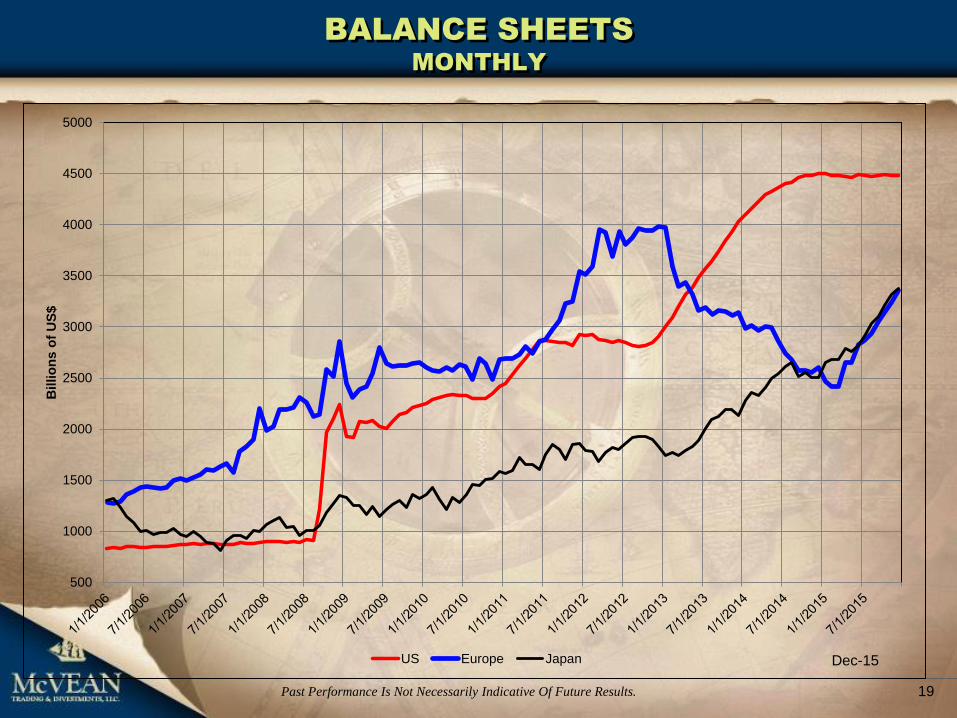
BALANCE SHEETS
MONTHLY
19 Past Performance Is Not Necessarily Indicative Of Future Results.
Dec-15
500
1000
1500
2000
2500
3000
3500
4000
4500
5000
Billio
ns o
f U
S$
US Europe Japan
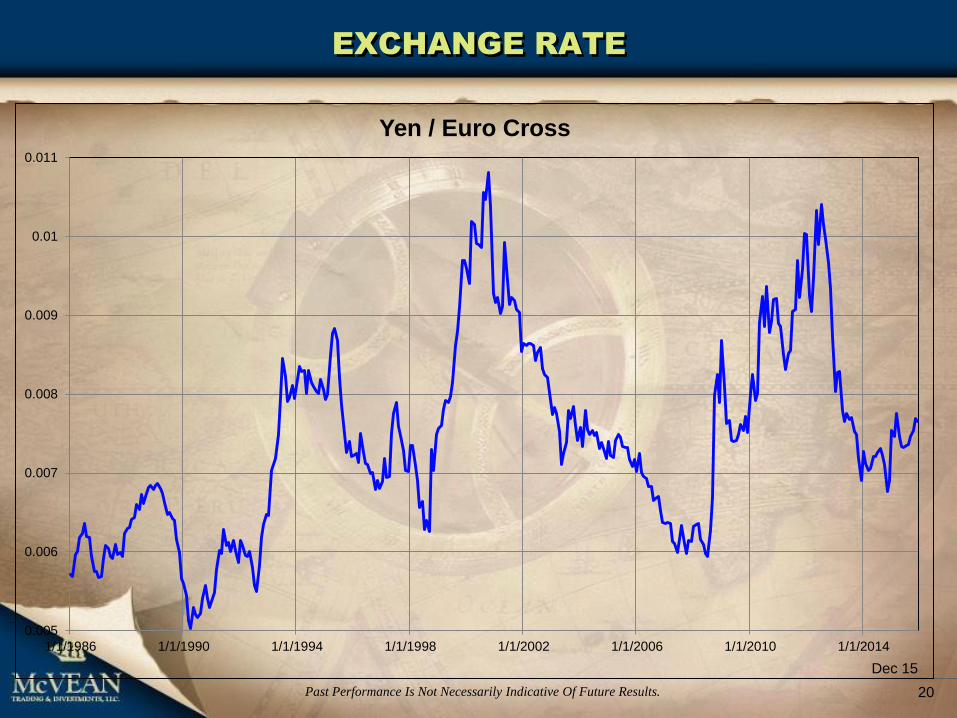
EXCHANGE RATE
20 Past Performance Is Not Necessarily Indicative Of Future Results.
0.005
0.006
0.007
0.008
0.009
0.01
0.011
1/1/1986 1/1/1990 1/1/1994 1/1/1998 1/1/2002 1/1/2006 1/1/2010 1/1/2014
Yen / Euro Cross
Dec 15

U.S., EUROPE AND JAPAN GDP
21 Past Performance Is Not Necessarily Indicative Of Future Results.
-10%
-8%
-6%
-4%
-2%
0%
2%
4%
6%
8%
10%
Jan-95 Jan-97 Jan-99 Jan-01 Jan-03 Jan-05 Jan-07 Jan-09 Jan-11 Jan-13 Jan-15
US Europe JapanQ1 2015
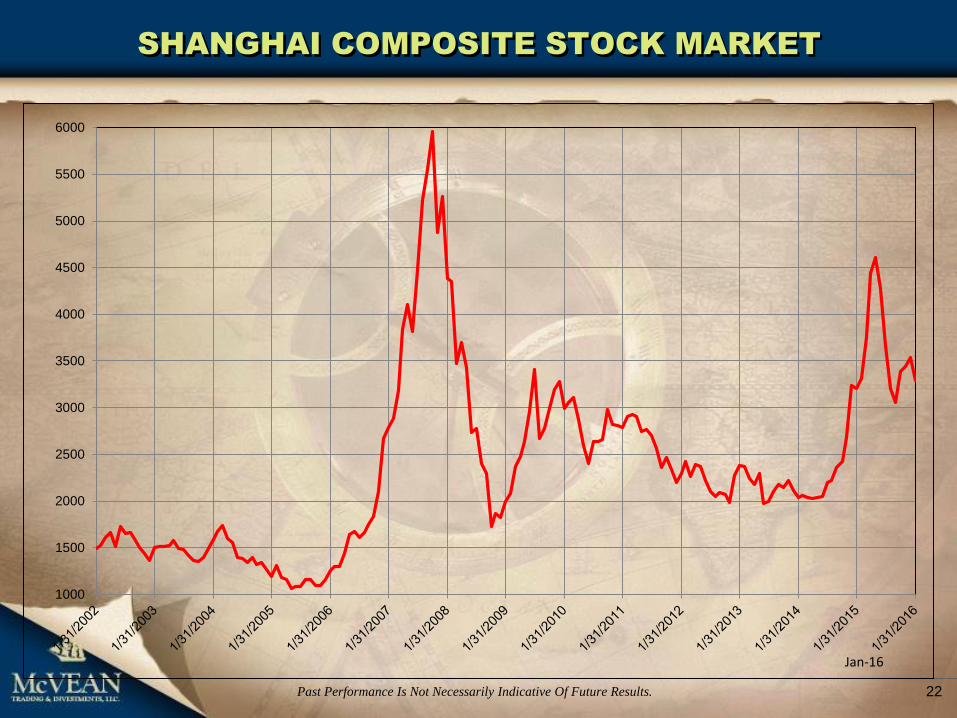
SHANGHAI COMPOSITE STOCK MARKET
22 Past Performance Is Not Necessarily Indicative Of Future Results.
1000
1500
2000
2500
3000
3500
4000
4500
5000
5500
6000
Jan-16
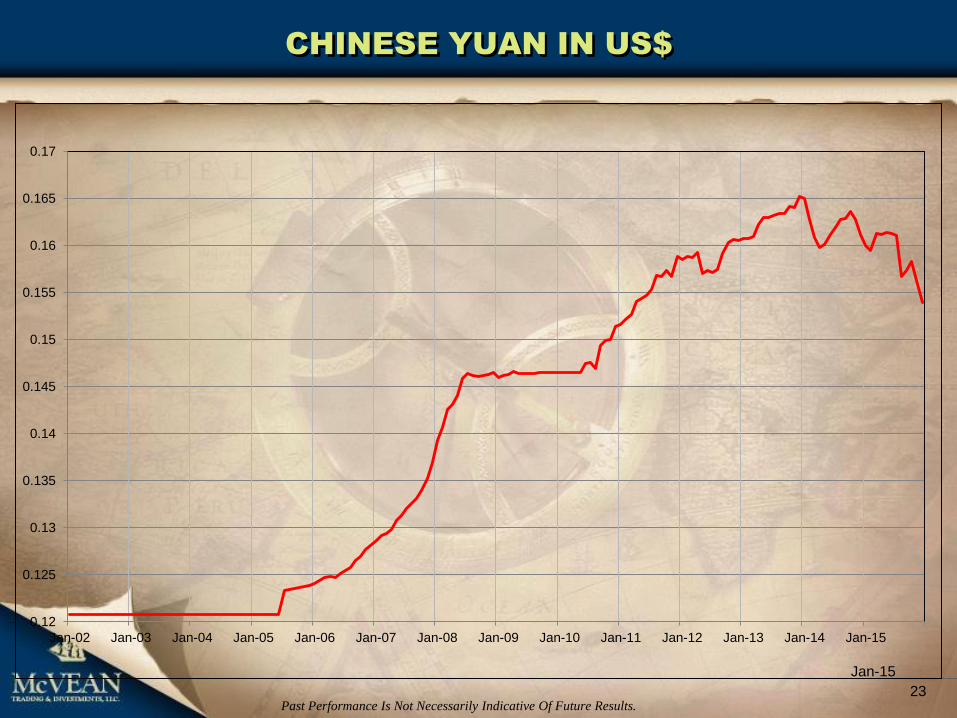
CHINESE YUAN IN US$
23 Past Performance Is Not Necessarily Indicative Of Future Results.
0.12
0.125
0.13
0.135
0.14
0.145
0.15
0.155
0.16
0.165
0.17
Jan-02 Jan-03 Jan-04 Jan-05 Jan-06 Jan-07 Jan-08 Jan-09 Jan-10 Jan-11 Jan-12 Jan-13 Jan-14 Jan-15
Jan-15
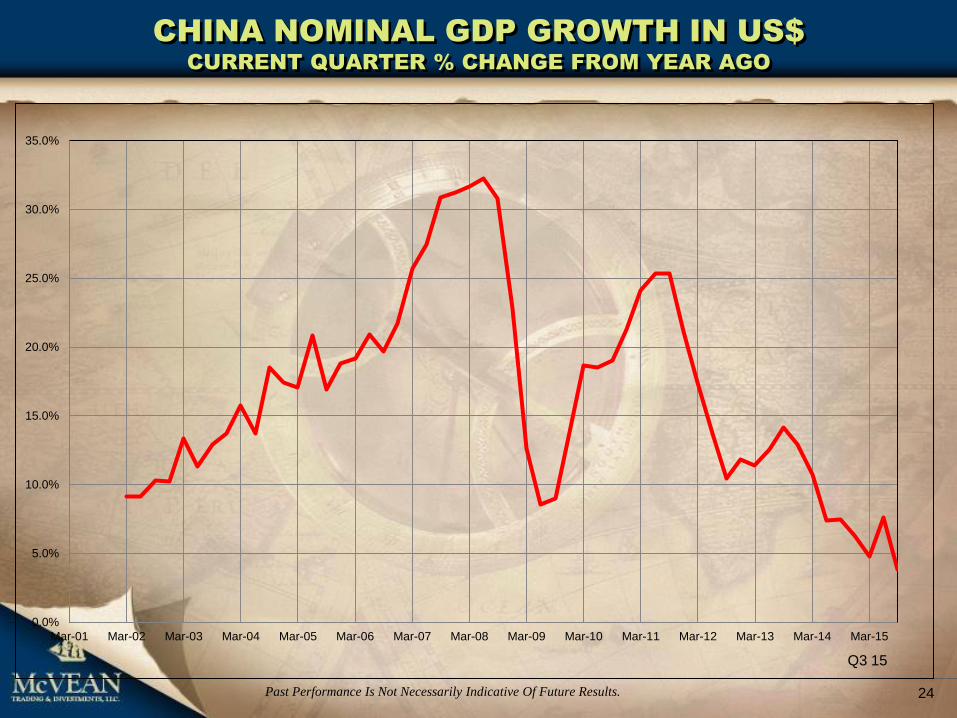
CHINA NOMINAL GDP GROWTH IN US$
CURRENT QUARTER % CHANGE FROM YEAR AGO
24 Past Performance Is Not Necessarily Indicative Of Future Results.
0.0%
5.0%
10.0%
15.0%
20.0%
25.0%
30.0%
35.0%
Mar-01 Mar-02 Mar-03 Mar-04 Mar-05 Mar-06 Mar-07 Mar-08 Mar-09 Mar-10 Mar-11 Mar-12 Mar-13 Mar-14 Mar-15
Q3 15
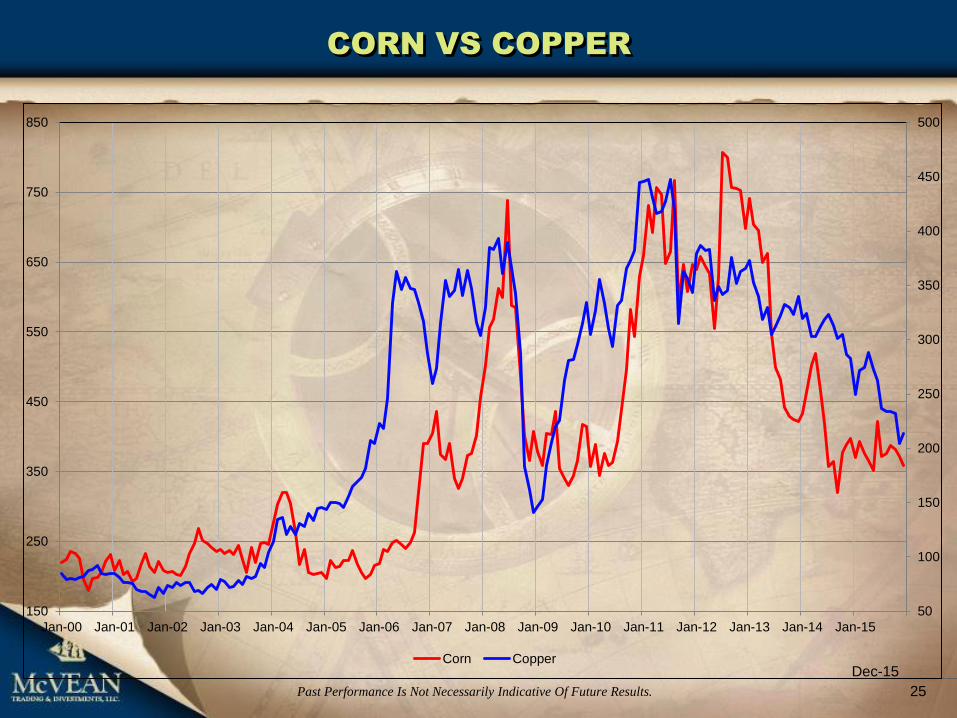
CORN VS COPPER
25 Past Performance Is Not Necessarily Indicative Of Future Results.
50
100
150
200
250
300
350
400
450
500
150
250
350
450
550
650
750
850
Jan-00 Jan-01 Jan-02 Jan-03 Jan-04 Jan-05 Jan-06 Jan-07 Jan-08 Jan-09 Jan-10 Jan-11 Jan-12 Jan-13 Jan-14 Jan-15
Corn CopperDec-15
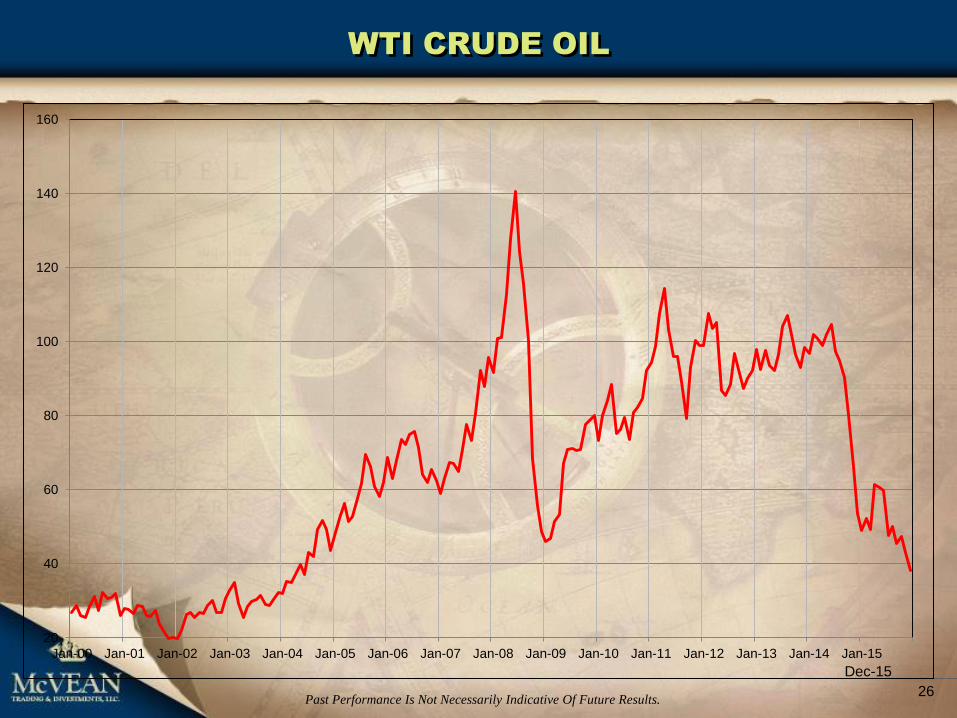
WTI CRUDE OIL
26 Past Performance Is Not Necessarily Indicative Of Future Results.
20
40
60
80
100
120
140
160
Jan-00 Jan-01 Jan-02 Jan-03 Jan-04 Jan-05 Jan-06 Jan-07 Jan-08 Jan-09 Jan-10 Jan-11 Jan-12 Jan-13 Jan-14 Jan-15
Dec-15
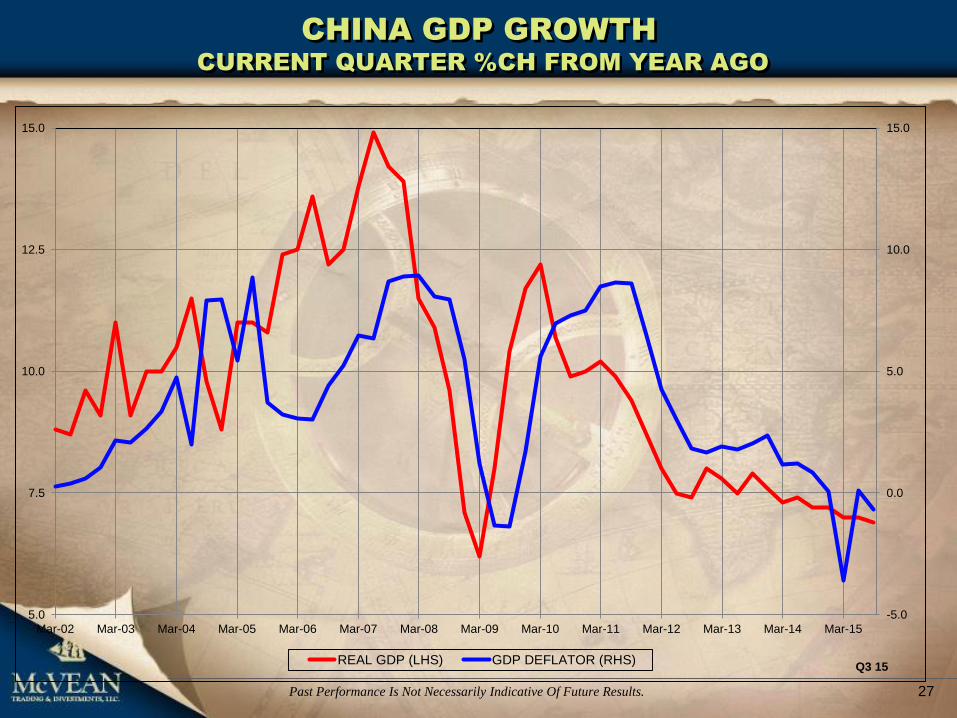
-5.0
0.0
5.0
10.0
15.0
5.0
7.5
10.0
12.5
15.0
Mar-02 Mar-03 Mar-04 Mar-05 Mar-06 Mar-07 Mar-08 Mar-09 Mar-10 Mar-11 Mar-12 Mar-13 Mar-14 Mar-15
REAL GDP (LHS) GDP DEFLATOR (RHS)
CHINA GDP GROWTH
CURRENT QUARTER %CH FROM YEAR AGO
27 Past Performance Is Not Necessarily Indicative Of Future Results.
Q3 15
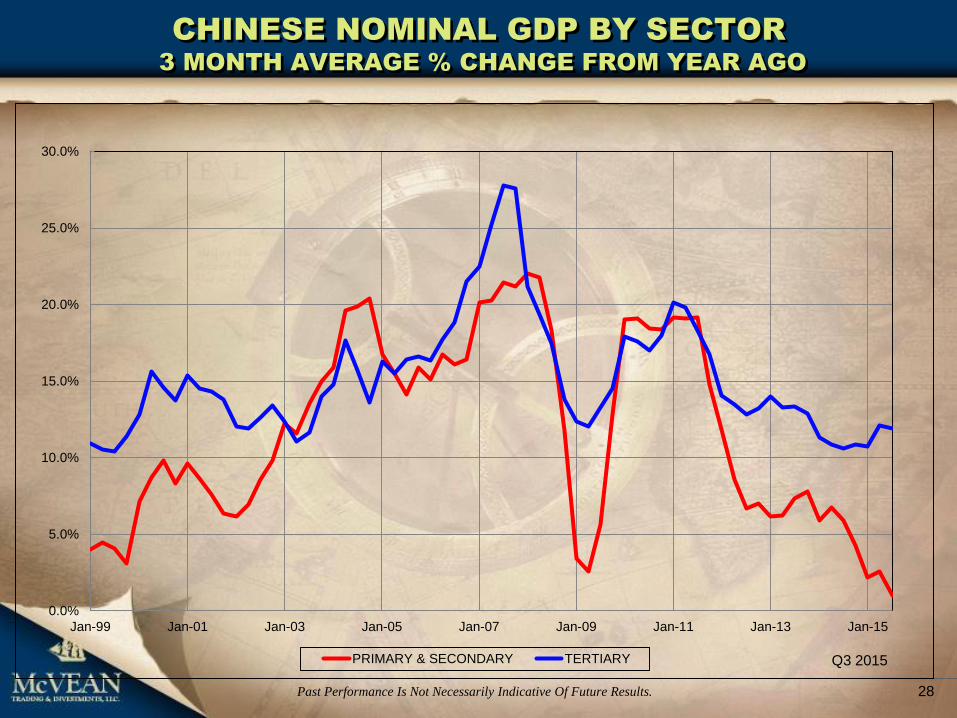
CHINESE NOMINAL GDP BY SECTOR
3 MONTH AVERAGE % CHANGE FROM YEAR AGO
28 Past Performance Is Not Necessarily Indicative Of Future Results.
0.0%
5.0%
10.0%
15.0%
20.0%
25.0%
30.0%
Jan-99 Jan-01 Jan-03 Jan-05 Jan-07 Jan-09 Jan-11 Jan-13 Jan-15
PRIMARY & SECONDARY TERTIARY Q3 2015
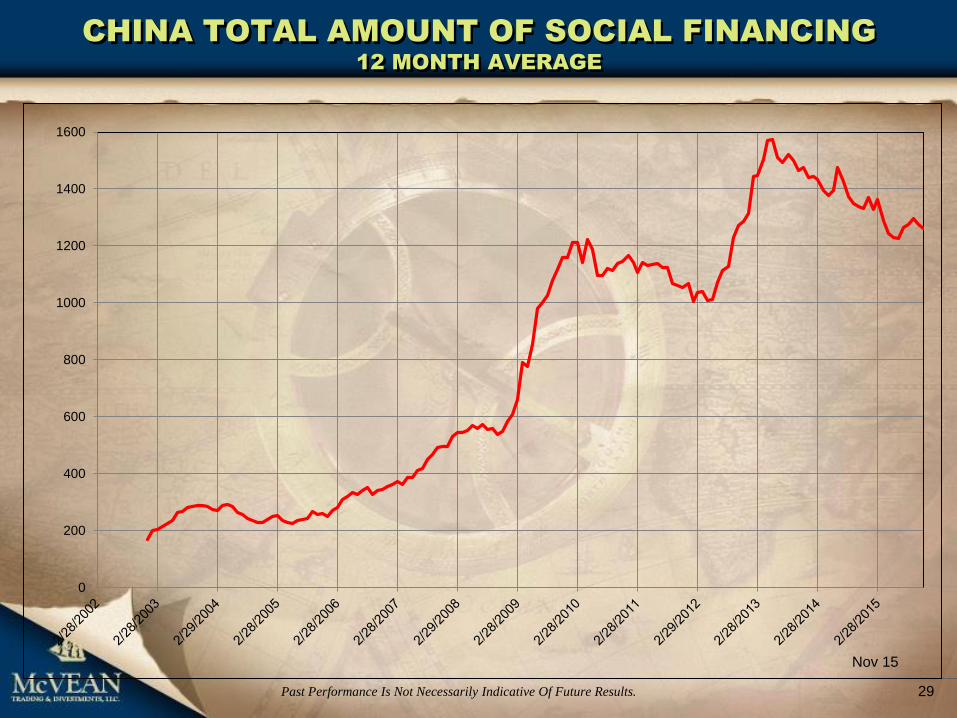
CHINA TOTAL AMOUNT OF SOCIAL FINANCING
12 MONTH AVERAGE
29 Past Performance Is Not Necessarily Indicative Of Future Results.
0
200
400
600
800
1000
1200
1400
1600
Nov 15
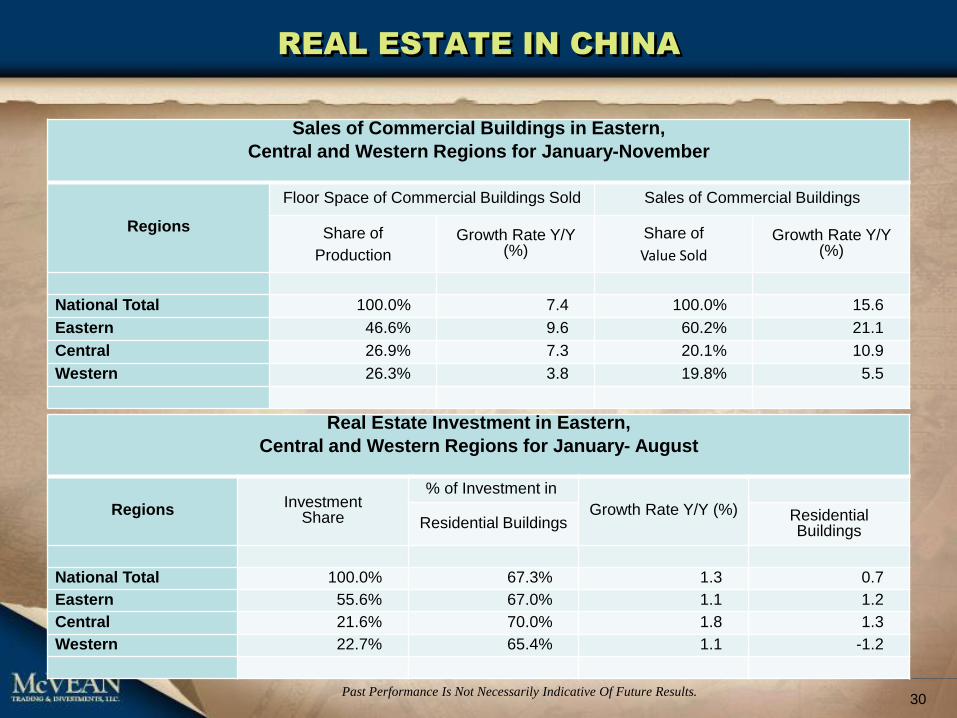
REAL ESTATE IN CHINA
Real Estate Investment in Eastern,
Central and Western Regions for January- August
Regions Investment Share
% of Investment in
Growth Rate Y/Y (%)
Residential Buildings Residential Buildings
National Total 100.0% 67.3% 1.3 0.7
Eastern 55.6% 67.0% 1.1 1.2
Central 21.6% 70.0% 1.8 1.3
Western 22.7% 65.4% 1.1 -1.2
30 Past Performance Is Not Necessarily Indicative Of Future Results.
Sales of Commercial Buildings in Eastern,
Central and Western Regions for January-November
Regions
Floor Space of Commercial Buildings Sold Sales of Commercial Buildings
Share of
Production
Growth Rate Y/Y (%)
Share of
Value Sold
Growth Rate Y/Y (%)
National Total 100.0% 7.4 100.0% 15.6
Eastern 46.6% 9.6 60.2% 21.1
Central 26.9% 7.3 20.1% 10.9
Western 26.3% 3.8 19.8% 5.5
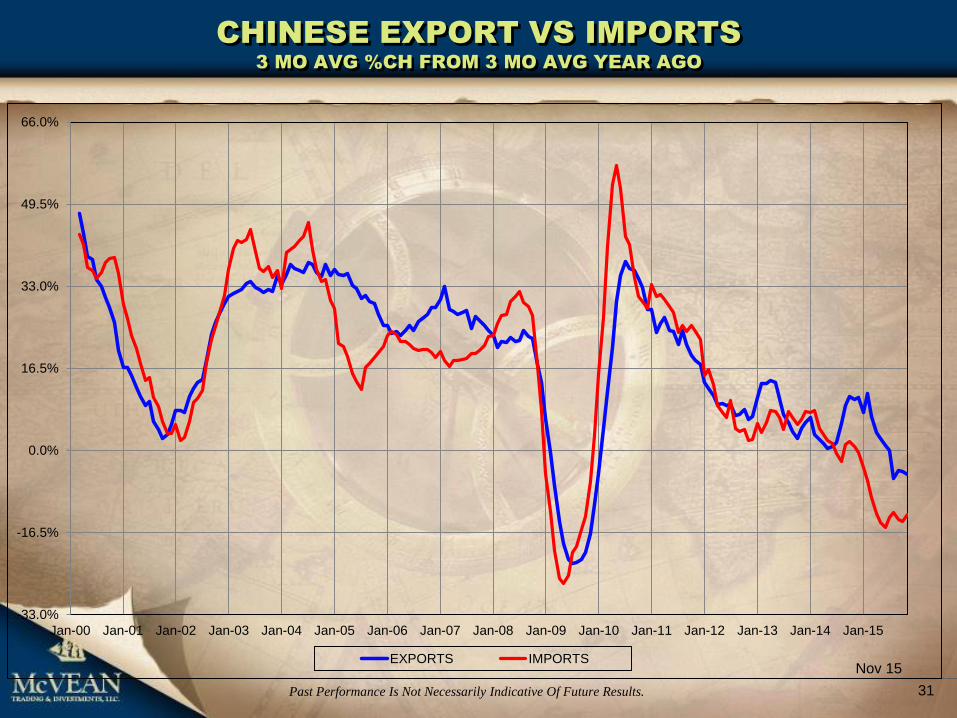
CHINESE EXPORT VS IMPORTS
3 MO AVG %CH FROM 3 MO AVG YEAR AGO
31 Past Performance Is Not Necessarily Indicative Of Future Results.
-33.0%
-16.5%
0.0%
16.5%
33.0%
49.5%
66.0%
Jan-00 Jan-01 Jan-02 Jan-03 Jan-04 Jan-05 Jan-06 Jan-07 Jan-08 Jan-09 Jan-10 Jan-11 Jan-12 Jan-13 Jan-14 Jan-15
EXPORTS IMPORTSNov 15

CHINESE GLOBAL TRADE SURPLUS
BILLIONS OF US$ - 3 MONTH AVERAGE
32 Past Performance Is Not Necessarily Indicative Of Future Results.
-100.0
0.0
100.0
200.0
300.0
400.0
500.0
600.0
700.0
800.0
900.0
Jan-00 Jan-01 Jan-02 Jan-03 Jan-04 Jan-05 Jan-06 Jan-07 Jan-08 Jan-09 Jan-10 Jan-11 Jan-12 Jan-13 Jan-14 Jan-15
Nov-15