
MICEX Group Derivatives Market
39
MICEX Group Derivatives Market MICEX Group Derivatives Market Directing the Derivative Directing the Derivative Market Boom Market Boom – – Trends and New Projects Trends and New Projects Zhanna Smirnova Zhanna Smirnova MICEX Vice President MICEX Vice President
-
Upload
laura-kane -
Category
Documents
-
view
42 -
download
1
description
MICEX Group Derivatives Market. Directing the Derivative Market Boom – Trends and New Projects. Zhanna Smirnova MICEX Vice President. World exchange derivatives market: trends. World exchange derivatives market: products. World exchange derivatives market: regions. - PowerPoint PPT Presentation
Transcript of MICEX Group Derivatives Market

MICEX Group Derivatives MICEX Group Derivatives Market Market
Directing the Derivative Market Directing the Derivative Market BoomBoom – –
Trends and New ProjectsTrends and New Projects
Zhanna SmirnovaZhanna Smirnova
MICEX Vice PresidentMICEX Vice President
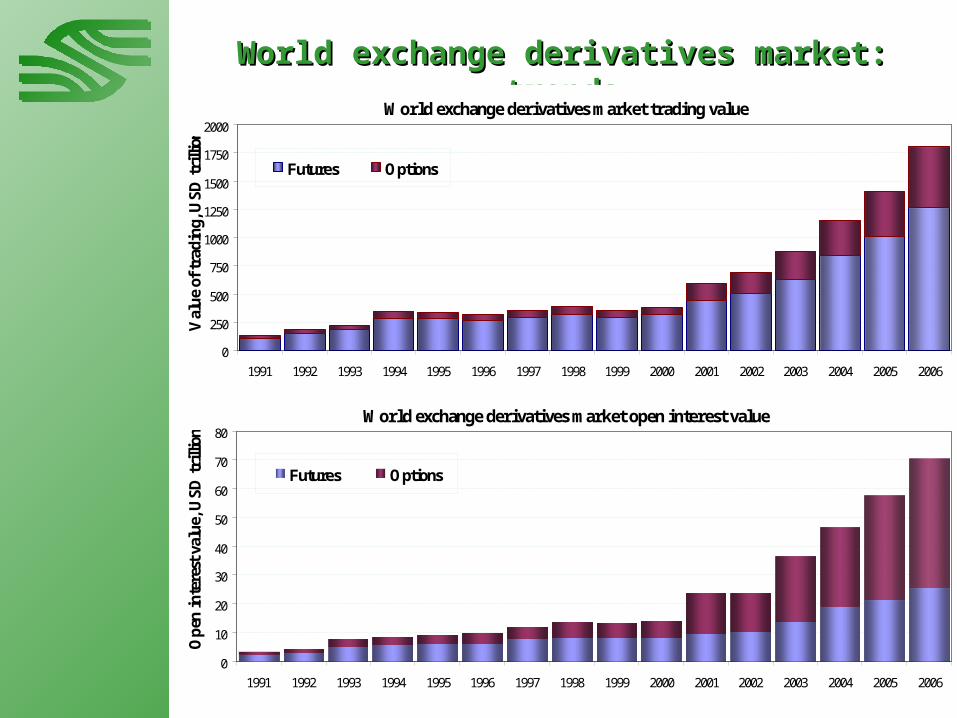
World exchange derivatives market: World exchange derivatives market: trendstrends
World exchange derivatives market trading value
0
250
500
750
1000
1250
1500
1750
2000
1991 1992 1993 1994 1995 1996 1997 1998 1999 2000 2001 2002 2003 2004 2005 2006
Val
ue
of t
rad
ing,
US
D t
rilli
on
Futures Options
World exchange derivatives market open interest value
0
10
20
30
40
50
60
70
80
1991 1992 1993 1994 1995 1996 1997 1998 1999 2000 2001 2002 2003 2004 2005 2006
Op
en in
tere
st v
alu
e, U
SD
tri
llion
Futures Options

World exchange derivatives market: World exchange derivatives market: productsproducts
World trading valueproduct structure in 2006
(Total value - 1,809.5 USD trillion)
EQ9,8%
FX0,9%
IR89,3%
World open interestproduct structure in 2006 (Total value - 70.5 USD trillion)
FX0,3%
IR88,8%
EQ10,9%
World exchange derivatives market open interest value growth (to 1996, %)
0%
280%
560%
840%
1120%
1400%
1996 1997 1998 1999 2000 2001 2002 2003 2004 2005 2006
Interest rate Currency Equity index
World exchange derivatives market trading value growth (to 1996, %)
0%
200%
400%
600%
800%
1000%
1996 1997 1998 1999 2000 2001 2002 2003 2004 2005 2006
Interest rate Currency Equity index

Regional structure of the trading value
North America
59%
Europe32%
Asia and Pacific8%
Other1%
Regional structure of the open interest
Other1%
Asia and Pacific6%
Europe33%
North America
60%
World exchange derivatives market: World exchange derivatives market: regionsregions

Russian derivatives market: history and Russian derivatives market: history and factsfacts
1990s: Start as it was… 2000s: And what’s now
October 1992
Products (by underlying)
Derivatives trading starts in Russia
1994 1996 1998 2001 2006
GKO
Stocks,indices
Stock indices
FX
STIR
2002
CM
Exchanges 1992 – Moscow Commodity Exchange No activity since 1998 1993 – Russian Exchange No activity since 1998 1994 – Moscow Central Stock Exchange No activity since 1998 1994 – The Exchange “Saint-Petersburg” Till FORTS foundation 2001 1996 – MICEX Suspended 1998;
Restarted 2000 2000 – SPCEX Trading now 2001 – FORTS (based on SPBEX market) Trading now
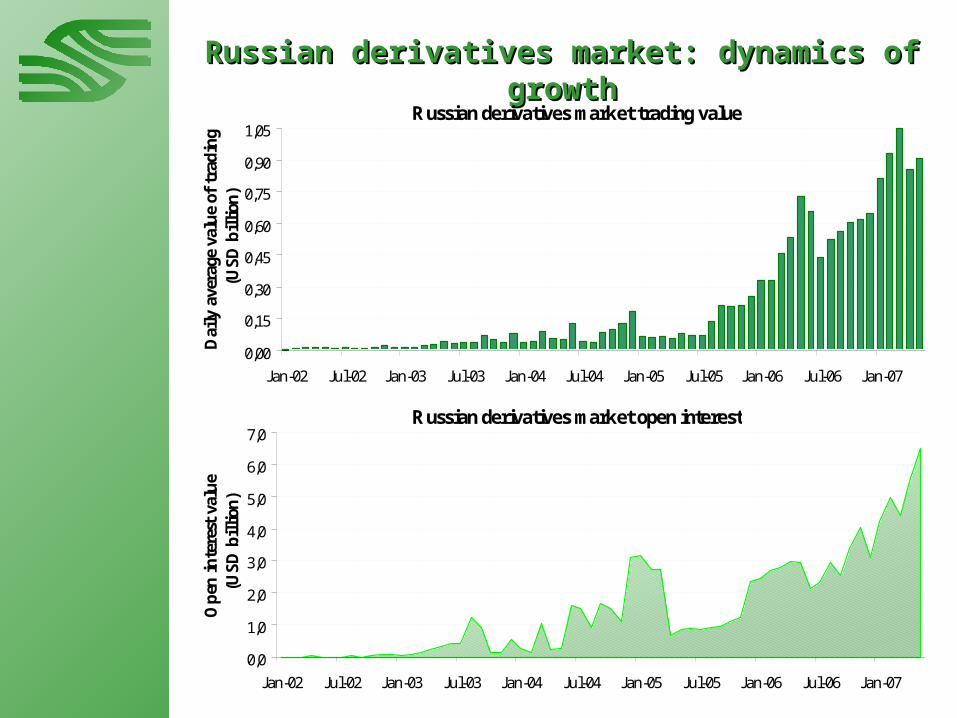
Russian derivatives market: dynamics of Russian derivatives market: dynamics of growthgrowth
Russian derivatives market trading value
0,00
0,15
0,30
0,45
0,60
0,75
0,90
1,05
Jan-02 Jul-02 Jan-03 Jul-03 Jan-04 Jul-04 Jan-05 Jul-05 Jan-06 Jul-06 Jan-07
Dai
ly a
vera
ge v
alu
e of
tra
din
g(U
SD
bil
lion
)
Russian derivatives market open interest
0,0
1,0
2,0
3,0
4,0
5,0
6,0
7,0
Jan-02 Jul-02 Jan-03 Jul-03 Jan-04 Jul-04 Jan-05 Jul-05 Jan-06 Jul-06 Jan-07
Op
en i
nte
rest
val
ue
(US
D b
illi
on)

MICEX cash markets value of trading
0
250
500
750
1000
1250
1500
1750
2000
2000 2001 2002 2003 2004 2005 2006
USD billion
Currency market Government bonds market Corporate securities market
15-times growth of the MICEX cash markets
Russian derivatives market: underlying Russian derivatives market: underlying dynamicsdynamics

MICEX RTS SPCEX
SPBEX
FX futures + + + +FX options + +STIR futures + +STIR options +LTIR futures Q3 2007 +Stock Index futures Q2 2007 +Stock Index Options Q3 2007 +EQ futures 2008 +EQ options Q4 2007 +CM futures Q3 2007 + + +CM options + +
Russian derivatives market: traded Russian derivatives market: traded instrumentsinstruments

Value of trading in 2006 by underlying
FX25,8%
EQ72,6%
CM0,8%
IR0,9%
Average open interest in 2006 by underlying
FX57,0%
CM0,5%
IR2,6%
EQ39,9%
Value of trading in 2006 by exchanges
MICEX24,7%
RTS74,6%
SPBEX0,4%SPCEX
0,3%
Average open interest in 2006 by exchanges
MICEX53,6%
SPBEX0,2%
SPCEX2,6%
RTS43,7%
Russian derivatives market: structureRussian derivatives market: structure
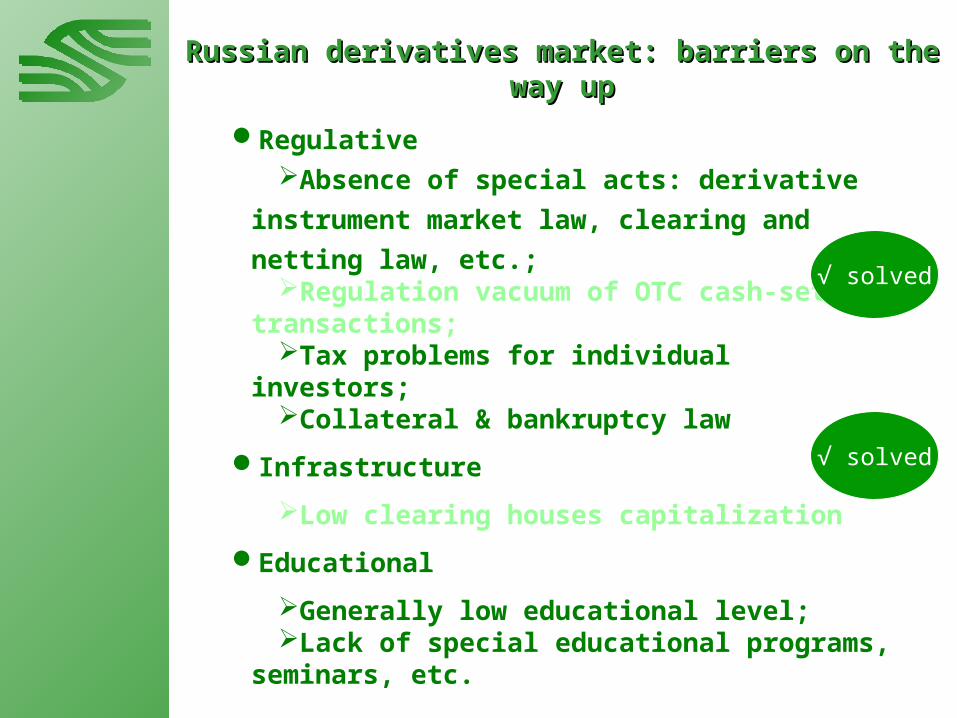
RegulativeAbsence of special acts: derivative
instrument market law, clearing and
netting law, etc.;Regulation vacuum of OTC cash-settled
transactions;Tax problems for individual investors;Collateral & bankruptcy law
Infrastructure
Low clearing houses capitalization
Educational
Generally low educational level;Lack of special educational programs,
seminars, etc.
Russian derivatives market: barriers on the Russian derivatives market: barriers on the way upway up
√ solved
√ solved

Russian derivatives market: potential of Russian derivatives market: potential of growthgrowth
Average annual exchange derivatives market trading volume growth, 2004-06
34,93%
85,77%
-2,19%
27,92%
97,66%
3,29%
51,59%
16,22%
16,78%
153,88%
23,95%
14,37%
-20% 0% 20% 40% 60% 80% 100% 120% 140% 160% 180%
USA
Western Europe
Japan
Australia
Brazil
Russia
India
China
Mexico
Korea
Hungary
Poland

Derivatives / cash financial instruments trading value ratio (organized markets), times
0,071,01
30,84
15,76
1,382,12
4,70
0,00
3,00
6,00
9,00
12,00
15,00
18,00
21,00
24,00
27,00
30,00
33,00
North America Western Europe India China Poland Hungary Russia
Russian derivatives market: potential of Russian derivatives market: potential of growthgrowth

Russian derivatives market: potential of Russian derivatives market: potential of growthgrowth
Exchange derivatives market trading value / GDP ratio, times60,26
25,77
2,03 1,29 0,72 0,25 0,24 0,170,00
10,00
20,00
30,00
40,00
50,00
60,00
70,00
North America WesternEurope
India Mexico China Poland Hungary Russia

Exchange
Clearing organization
Exchange
Clearing organization
MICEXMICEX
SettlementorganizationSettlement
organization
MICEX SHMICEX SH
Remote access via Internetfor MICEX derivatives market participants
and their clients
SCIEXSCIEX
NCSEXNCSEX
URCEXURCEX
SICEXSICEX
MICEX derivatives market: infrastructureMICEX derivatives market: infrastructure

MICEX derivatives market members (as of 01.05.07)
All GCM ICM ACM GTM ITM
182 28 72 20 48 14
MICEX derivatives market: membershipMICEX derivatives market: membership
General ClearingMembers
Individual ClearingMembers
CLientsTrading (non-clearing)
Members Clients
ClientsBanks
Non-banks
MICEX Derivatives MarketMICEX Derivatives Market
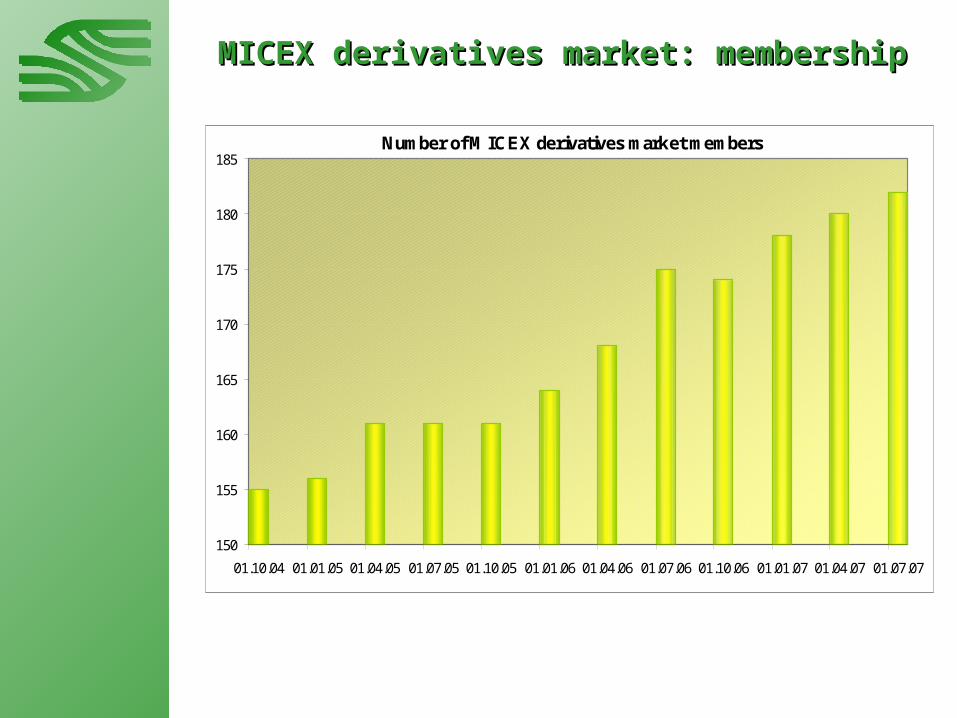
MICEX derivatives market: membershipMICEX derivatives market: membership
Number of MICEX derivatives market members
150
155
160
165
170
175
180
185
01.10.04 01.01.05 01.04.05 01.07.05 01.10.05 01.01.06 01.04.06 01.07.06 01.10.06 01.01.07 01.04.07 01.07.07
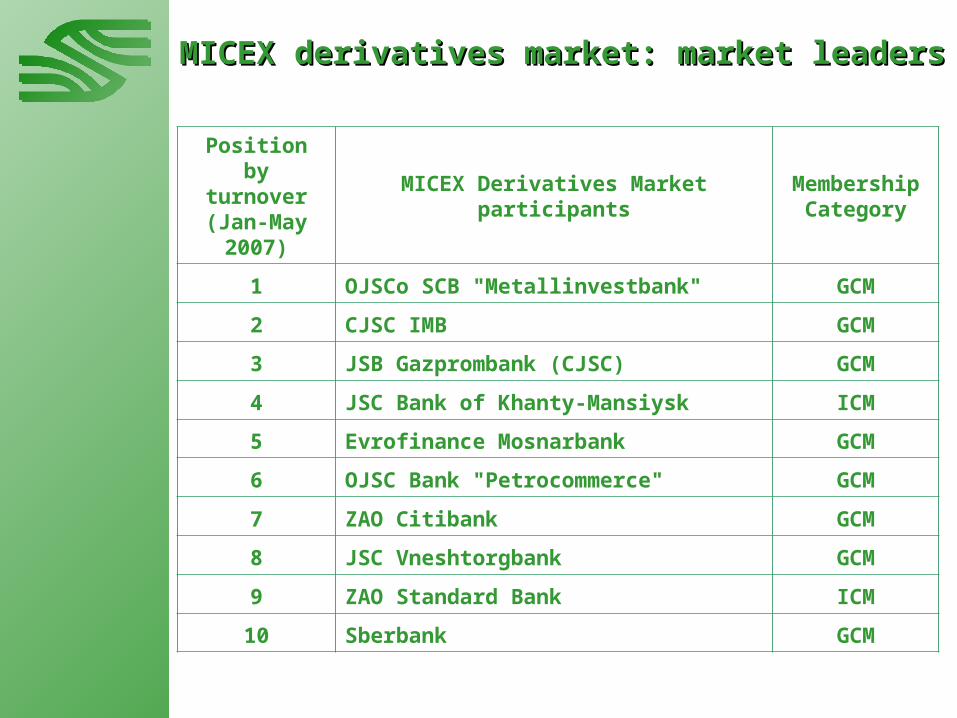
MICEX derivatives market: market leaders MICEX derivatives market: market leaders
Position by turnover (Jan-May
2007)
MICEX Derivatives Market participants
Membership Category
1 OJSCo SCB "Metallinvestbank" GCM
2 CJSC IMB GCM
3 JSB Gazprombank (CJSC) GCM
4 JSC Bank of Khanty-Mansiysk ICM
5 Evrofinance Mosnarbank GCM
6 OJSC Bank "Petrocommerce" GCM
7 ZAO Citibank GCM
8 JSC Vneshtorgbank GCM
9 ZAO Standard Bank ICM
10 Sberbank GCM

MICEX GroupMICEX GroupDerivativesDerivatives
marketmarket
€€/$/$€€/$/$ EUR/USDEUR/USD
€€€€ EUR/RUBEUR/RUB
$$$$ USD/RUBUSD/RUB
FX futuresFX futures::
o/no/no/no/n Overnight MosIBOR Overnight MosIBOR
33-M-M33-M-M 3 3 month MosPrime Rate month MosPrime Rate
STIR futuresSTIR futures::
MICEX derivatives market: instrumentsMICEX derivatives market: instruments
Forthcoming:Forthcoming:
MICEXMICEXMICEXMICEX MICEX Index futuresMICEX Index futures

MICEX USD/RUB futures: trading statisticsMICEX USD/RUB futures: trading statisticsMICEX USD/RUB futures: trading statistics
0,0
1,0
2,0
3,0
4,0
5,0
6,0
Jul-
04
Sep
-04
Nov
-04
Jan-
05
Mar
-05
May
-05
Jul-
05
Sep
-05
Nov
-05
Jan-
06
Mar
-06
May
-06
Jul-
06
Sep
-06
Nov
-06
Jan-
07
Mar
-07
May
-07
Mon
thly
vol
um
e of
tra
din
g (m
ln c
ontr
.)
0,0
0,5
1,0
1,5
2,0
2,5
3,0
3,5
Mon
th-e
nd
op
en in
tere
st (
mln
con
tr.)
Monthly volume of trading
Month-end open interest
Open interest distribution of USD/RUB futures series, end-of-May'07
Mar-0810,3%
Aug-077,0%
Jul-0713,1% Nov-07
2,8%
Oct-078,9%
Dec-0724,2%Jun-07
17,4%
Sep-0716,4%
2 666 190contracts
Open interest distribution of USD/RUB futures series, end-of-May'07
Mar-0810,3%
Aug-077,0%
Jul-0713,1% Nov-07
2,8%
Oct-078,9%
Dec-0724,2%Jun-07
17,4%
Sep-0716,4%
2 666 190contracts2 666 190contracts
Turnover distribution of USD/RUB futures series,Jan'07-May'07
12 months13,0%
3 months15,8%
2 months17,5%
6 months9,5%
5 months3,0%
9 months6,0%
1 month25,1%
4 months10,1%
21 234 643contracts
Turnover distribution of USD/RUB futures series,Jan'07-May'07
12 months13,0%
3 months15,8%
2 months17,5%
6 months9,5%
5 months3,0%
9 months6,0%
1 month25,1%
4 months10,1%
21 234 643contracts
21 234 643contracts

MICEX USD/ RUB futures: daily average bid-ask spread
0,01
0,02
0,03
0,04
0,05
0,06
07.0
7.06
14.0
7.06
21.0
7.06
28.0
7.06
04.0
8.06
11.0
8.06
18.0
8.06
25.0
8.06
01.0
9.06
08.0
9.06
15.0
9.06
22.0
9.06
29.0
9.06
06.1
0.06
13.1
0.06
20.1
0.06
27.1
0.06
03.1
1.06
10.1
1.06
17.1
1.06
24.1
1.06
01.1
2.06
08.1
2.06
15.1
2.06
22.1
2.06
29.1
2.06
05.0
1.07
12.0
1.07
19.0
1.07
26.0
1.07
02.0
2.07
09.0
2.07
16.0
2.07
23.0
2.07
02.0
3.07
09.0
3.07
16.0
3.07
Spre
ad (
RU
B)
1 month 3 months 6 months 12 months
MICEX USD/ RUB futures: average spread volume and its duration within trading session
0%
10%
20%
30%
40%
50%
60%
70%
80%
90%
100%
07.0
7.20
06
14.0
7.20
06
21.0
7.20
06
28.0
7.20
06
04.0
8.20
06
11.0
8.20
06
18.0
8.20
06
25.0
8.20
06
01.0
9.20
06
08.0
9.20
06
15.0
9.20
06
22.0
9.20
06
29.0
9.20
06
06.1
0.20
06
13.1
0.20
06
20.1
0.20
06
27.1
0.20
06
03.1
1.20
06
10.1
1.20
06
17.1
1.20
06
24.1
1.20
06
01.1
2.20
06
08.1
2.20
06
15.1
2.20
06
22.1
2.20
06
29.1
2.20
06
05.0
1.20
07
12.0
1.20
07
19.0
1.20
07
26.0
1.20
07
02.0
2.20
07
09.0
2.20
07
16.0
2.20
07
23.0
2.20
07
02.0
3.20
07
09.0
3.20
07
16.0
3.20
07
Ave
rage
bid
-ask
spre
ad d
ura
tion
(% o
f tr
adin
g s
essi
on)
0
500
1000
1500
2000
2500
3000
3500
4000
4500
5000
Ave
rage
bid
-ask
spre
ad v
olum
e per
futu
res
seri
es (
contr
.)
Average spread duration Average spread volume
MICEX USD/RUB futures: liquidityMICEX USD/RUB futures: liquidity
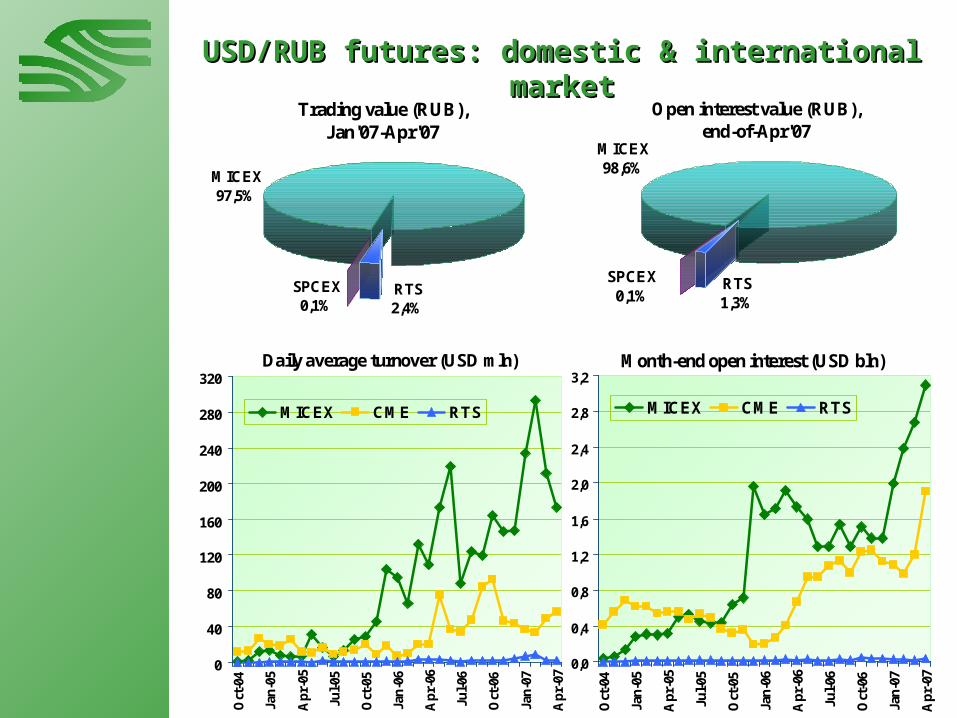
USD/RUB futures: domestic & international USD/RUB futures: domestic & international marketmarket
Trading value (RUB),Jan'07-Apr'07
MICEX97,5%
RTS2,4%
SPCEX0,1%
Open interest value (RUB),end-of-Apr'07
SPCEX0,1%
RTS1,3%
MICEX98,6%
Daily average turnover (USD mln)
0
40
80
120
160
200
240
280
320
Oct
-04
Jan
-05
Ap
r-05
Jul-
05
Oct
-05
Jan
-06
Ap
r-06
Jul-
06
Oct
-06
Jan
-07
Ap
r-07
MICEX СМЕ RTS
Month-end open interest (USD bln)
0,0
0,4
0,8
1,2
1,6
2,0
2,4
2,8
3,2
Oct
-04
Jan-
05
Apr
-05
Jul-0
5
Oct
-05
Jan-
06
Apr
-06
Jul-0
6
Oct
-06
Jan-
07
Apr
-07
MICEX СМЕ RTS

STIR futures: trading statistics
0
20
40
60
80
100
120
140
May
-06
Jun-
06
Jul-
06
Aug
-06
Sep
-06
Oct
-06
Nov
-06
Dec
-06
Jan-
07
Feb
-07
Mar
-07
Apr
-07
May
-07
Mon
thly
vol
um
e of
tra
din
g (c
ontr
.)
0
10
20
30
40
50
60
70
80
90
Mon
th-e
nd
op
en in
tere
st (
con
tr.)
Monthly volume of trading
Month-end open interest
MICEX STIR futures: trading statisticsMICEX STIR futures: trading statistics
MICEX 3-m MosPrime Rate futures: daily average bid-ask spread
0,10%
0,15%
0,20%
0,25%
0,30%
0,35%
0,40%
29.09.06 14.10.06 29.10.06 13.11.06 28.11.06 13.12.06 28.12.06 12.01.07 27.01.07 11.02.07 26.02.07
Spre
ad
1 month 2 months 3 months

Long interest rate products
Futures-type settlement options M
arke
t-mak
ing
prog
ram
s
Aut
omat
ic q
uotin
g
Com
bina
tion
trad
ing
Wid
enin
g trad
ing
opportuniti
es
Incr
easi
ng liquid
ity
New
type
s of
ord
ers
Synthetic products
MICEX FX & STIR futures: nearest plansMICEX FX & STIR futures: nearest plans
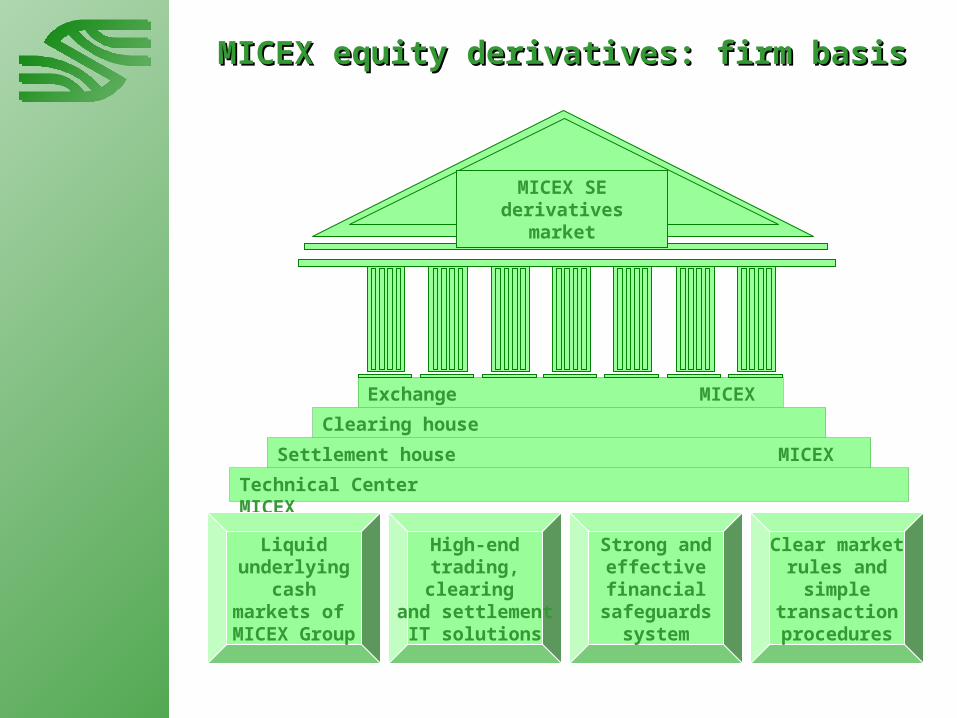
MICEX equity derivatives: firm basisMICEX equity derivatives: firm basis
Exchange MICEX SEClearing house
MICEX Settlement house MICEX SH
MICEX SE derivatives
market
Technical Center MICEX
Liquidunderlying
cashmarkets of
MICEX Group
High-endtrading,clearing
and settlementIT solutions
Strong andeffectivefinancial
safeguardssystem
Clear marketrules and
simpletransactionprocedures

MICEX SE derivatives market: coming MICEX SE derivatives market: coming instrumentsinstruments
Single
stock
options
Bond-
relate
d
futu
res
options
MICEX
Index
futu
res
options
Bond-
relate
d
futu
res
MICEX
Index
futu
res
…
Proposed in
struments
list
Proposed in
struments
list

«Blue chips»
CapitalizationCapitalization
Sectoral
MICEX IndexMICEX IndexMICEX IndexMICEX Index
MICEX O&GMICEX O&GMICEX O&GMICEX O&G
MICEX PWRMICEX PWRMICEX PWRMICEX PWR
MICEX TLCMICEX TLCMICEX TLCMICEX TLC
…………
MICEX10 indexMICEX10 indexMICEX10 indexMICEX10 index
MICEX Large CapsMICEX Large CapsMICEX Large CapsMICEX Large Caps
MICEX Middle CapsMICEX Middle CapsMICEX Middle CapsMICEX Middle Caps
MICEX Small CapsMICEX Small CapsMICEX Small CapsMICEX Small Caps
MICEX indices familyMICEX indices family

80%80%80%80% capitalization
9595%%9595%% trading value
30303030 shares
10101010 sectors
RFRFIndex Index
InvestmentInvestmentfundsfunds
EUEUUCITSUCITS
requirementsrequirements
USAUSABroad-basedBroad-based
securitysecurityindexindex
3 3 monthmonth3 3 monthmonth watch list
6 month6 month6 month6 month calculation base
15%15%15%15% max issuers’ weight
5%5%5%5% min free-float
Capitalization
Liquidity
Weighted price of 10 last trades
ComplianceComplianceWithWith
regulationsregulations
StructureStructure
MICEX Index: diversification and liquidityMICEX Index: diversification and liquidity
On average 5.5 ticks per second
CalculationCalculation

2,57%
0,41%0,25%
0,34%
5,61%10,11%11,62%15,55%
53,54%
Oil and Gas Banks Metallurgy
Energy IT and mass media Telecommunication
Machinery Transport Consumer
MICEX Index: economic sectorsMICEX Index: economic sectors
MICEX Index structure reflects exchange equity market distribution
MICEX Index structure reflects exchange equity market distribution

LSE25%
MICEX SE63%
RTS7,0%
DBAG2,3%
NYSE3,2%
MICEX IndexMICEX IndexRTSRTS
FTSE Russia IOB Index
FTSE Russia IOB Index
……
RTXRTX
DJ Titans
Russia…
DJ Titans
Russia…MSCI
Russia
MSCI Russia
DAXglobal Russia
DAXglobal Russia
Russian equity market in 2006: how many indices the market needs?
Russian equity market in 2006: how many indices the market needs?
MICEX Index: Russian EQ market MICEX Index: Russian EQ market benchmarkbenchmark

MICEX Index: key indicator of Russian EQ MICEX Index: key indicator of Russian EQ marketmarket
National exchange equity market turnover
MICEX SE (MICEX Index) - 95,85%MICEX SE (the rest stocks) - 2,47%RTS Classic Stock Market -1,47%RTS Exchange Stock Market - 0,08%SE "Saint-Petersburg" (Gazprom stocks) - 0,13%
Russian equity market in 2007: strengthening positions of MICEX SE Russian equity market in 2007: strengthening positions of MICEX SE

MICEX Index: basis for index investment MICEX Index: basis for index investment fundsfunds
Index funds net asset value
MICEX Index - 93,12% RTS Index - 6,28% Other Indices - 0,61%
Russian collective investments in 2007: investors choose MICEX Index Russian collective investments in 2007: investors choose MICEX Index

100%
300%
500%
700%
900%
Dec
-05
Jan-
06
Feb
-06
Mar
-06
Apr
-06
May
-06
Jun-
06
Jul-
06
Aug
-06
Sep-
06
Oct
-06
Nov
-06
Dec
-06
Jan-
07
Feb
-07
Mar
-07
MICEX Index funds All funds
Net asset value growthNet asset value growthMICEX Index fundsMICEX Index funds
MICEX Index: basis for index investment MICEX Index: basis for index investment fundsfunds
2121FormedFormed
Under formationUnder formation 22
Total numberTotal number 2828
RegistrationRegistration 55

MICEX Index futures: analogies from MICEX Index futures: analogies from abroadabroadCountry Key index
(national currency)
Futures & options
availability
Key index (foreign
currency)
Futures & options
availability
Brazil IBovespa;IBrX-50 (BRL) (BRL)
Hong Kong
Hang Seng Index (HKD) (HKD)
India S&P CNX Nifty (INR) (INR)
S&P CNX DEFTY (USD)
Korea KOSPI 200 (KRW) (KRW)
Malaysia KLCI(MYR) (MYR)
FTSE Bursa Malaysia 100 Index (USD)
Mexico IPC Index(MXN) (MXN)

MICEX Index: analogies from abroadMICEX Index: analogies from abroad
Russian currency is a stable one – there is no need to use another
Russian currency is a stable one – there is no need to use another
Foreign exchange rates dynamics
40%
50%
60%
70%
80%
90%
100%
110%
Jan-00 Oct-00 Jul-01 Apr-02 Jan-03 Oct-03 Jul-04 Apr-05 Jan-06 Oct-06
BRL/USD MXN/USDINR/USD IDR/USDJPY/USD RUB/USD

MICEX Index futures: contract MICEX Index futures: contract specificationspecification
Underlying MICEX Index
Trading Unit RUB 20 times MICEX Index
Contract Months2 nearest months in the March quarterly
cycle:Mar, Jun, Sep, Dec
Final Settlement Day The 15th calendar day of the contract month
Settlement Method Cash-settled
Price Quoting MICEX Index times 100
Minimum Price Fluctuation
25 price points or RUB 5 per contract
Final Settlement Price
MICEX Index determined on the final settlement day times 100
Fee RUB 1 per contract
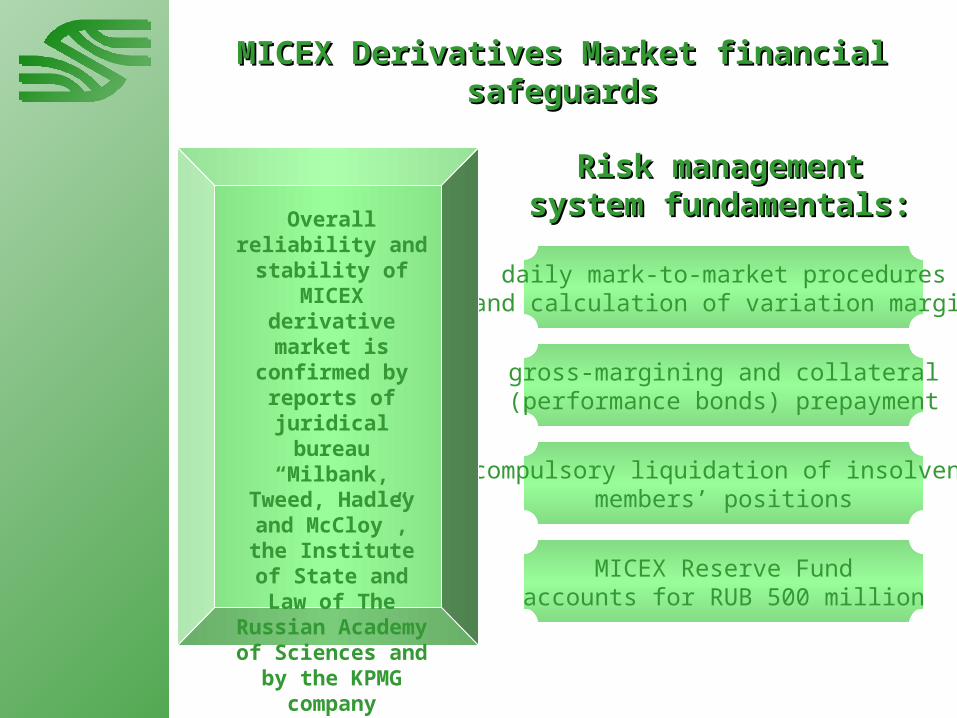
MICEX Derivatives Market financial MICEX Derivatives Market financial safeguardssafeguards
Risk management Risk management system system fundamentals:fundamentals:
daily mark-to-market proceduresand calculation of variation margin
gross-margining and collateral(performance bonds) prepayment
compulsory liquidation of insolventmembers’ positions
MICEX Reserve Fundaccounts for RUB 500 million
Overall reliability and stability of
MICEX derivative market is
confirmed by reports of juridical bureau “Milbank,
Tweed, Hadley and McCloy”, the
Institute of State and Law of The
Russian Academy of Sciences and by
the KPMG company

MICEX Derivatives Market financial MICEX Derivatives Market financial safeguardssafeguards
Current Current limitationslimitations::
Coming flexibilityComing flexibility::
Gross-margining
Cash collateral
Strict liquidationprocedures
SPAN basedportfolio margining
Variety of financialcollateral
Market procedures ofsettling insolvency
situations
Collective clearing fund
Net-margining of CMs

MICEX Derivatives MarketMICEX Derivatives Market
IT’S TIMEIT’S TIMETO SERIOUSLY CONSIDERTO SERIOUSLY CONSIDER
JOININGJOININGTHE RAPIDLY EVOLVINGTHE RAPIDLY EVOLVING
RUSSIAN MARKETRUSSIAN MARKETOF LARGE POTENTIALOF LARGE POTENTIAL

PhonePhone:: +7 (495) 705-96-12
+7 (495) 705-96-27
+7 (495) 705-96-03
FaxFax:: +7 (495) 202-75-04
e-mail:e-mail: [email protected]
WebWeb:: www.micex.ru
PhonePhone:: +7 (495) 705-96-12
+7 (495) 705-96-27
+7 (495) 705-96-03
FaxFax:: +7 (495) 202-75-04
e-mail:e-mail: [email protected]
WebWeb:: www.micex.ru
ContactsContacts
MICEX Derivatives Market DivisionMICEX Derivatives Market DivisionTh
an
k Y
ou
Th
an
k Y
ou!!


