
Mi bioinformática para el IBIMA
17
Análisis masivo de expresión, SNP, CNV y biomarcadores M. Gonzalo Claros Rocío Bautista, Pedro Seoane, Hicham Benzekri, Isabel González Gayte, Rosario Carmona, Darío Guerrero-Fernández, Rafael Larrosa, Macarena Arroyo Noé Fernández-Pozo, David Velasco
-
Upload
m-gonzalo-claros -
Category
Science
-
view
170 -
download
2
Transcript of Mi bioinformática para el IBIMA
Análisis masivo de expresión, SNP, CNV y biomarcadores
M. Gonzalo Claros Rocío Bautista, Pedro Seoane, Hicham Benzekri, Isabel González Gayte, Rosario
Carmona, Darío Guerrero-Fernández, Rafael Larrosa, Macarena Arroyo Noé Fernández-Pozo, David Velasco
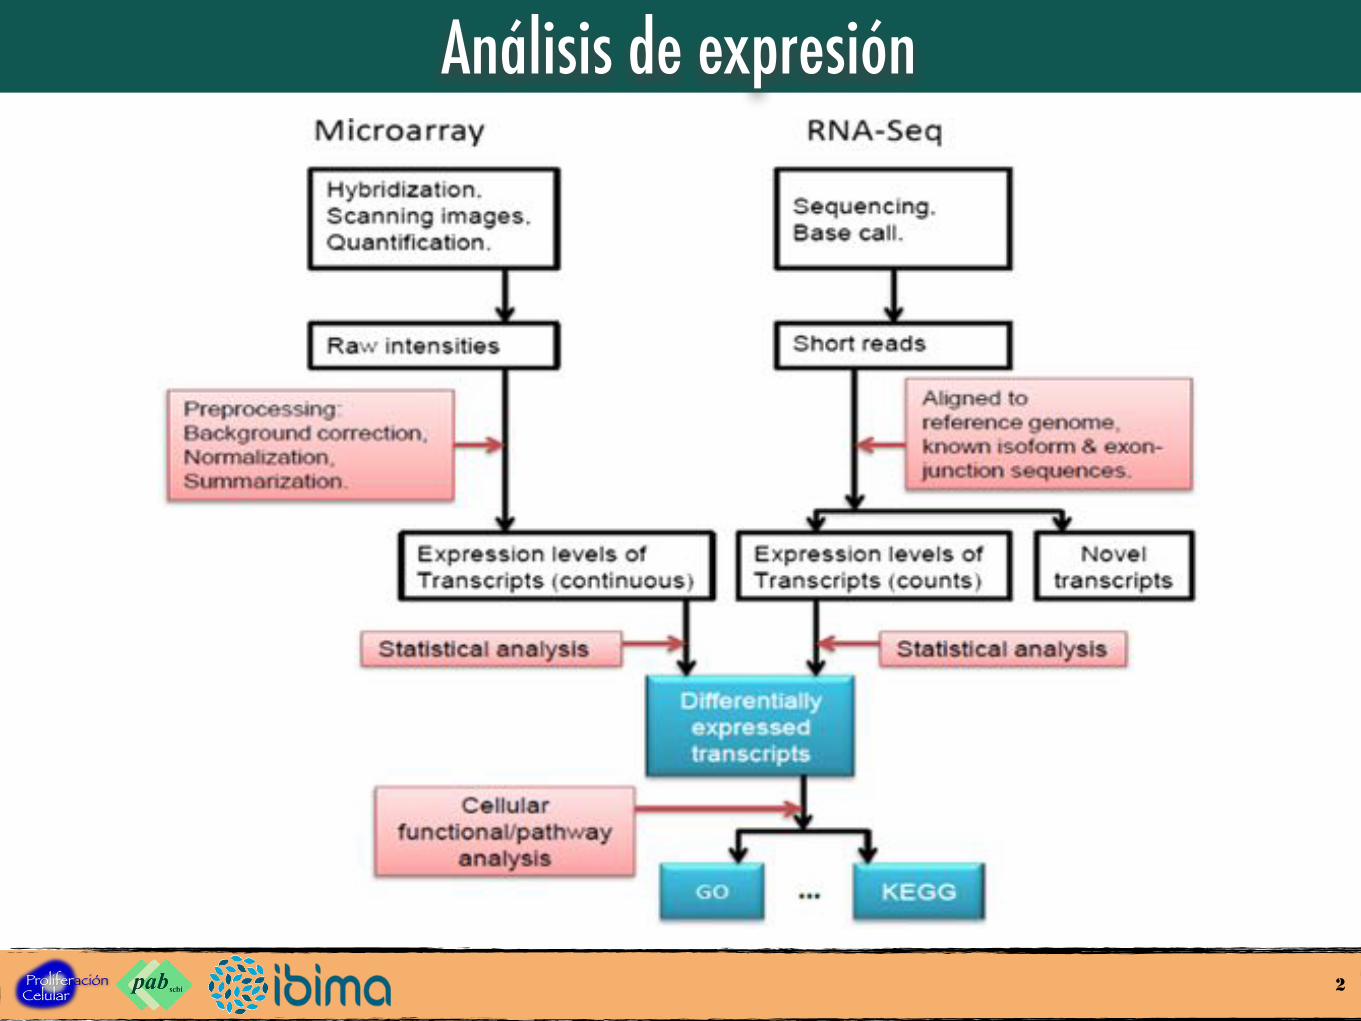
Análisis de expresión
2

Micromatrices de dos colores
3
BioMed Central
Page 1 of 13(page number not for citation purposes)
BMC Bioinformatics
Open AccessSoftwarePreP+07: improvements of a user friendly tool to preprocess and analyse microarray dataVictoria Martin-Requena1, Antonio Muñoz-Merida1, M Gonzalo Claros2 and Oswaldo Trelles*1
Address: 1Computer Architecture department, University of Málaga, Málaga, Spain and 2Molecular Biology and Biochemistry department, University of Málaga, Málaga, Spain
Email: Victoria Martin-Requena - [email protected]; Antonio Muñoz-Merida - [email protected]; M Gonzalo Claros - [email protected]; Oswaldo Trelles* - [email protected]* Corresponding author
AbstractBackground: Nowadays, microarray gene expression analysis is a widely used technology thatscientists handle but whose final interpretation usually requires the participation of a specialist. Theneed for this participation is due to the requirement of some background in statistics that mostusers lack or have a very vague notion of. Moreover, programming skills could also be essential toanalyse these data. An interactive, easy to use application seems therefore necessary to helpresearchers to extract full information from data and analyse them in a simple, powerful andconfident way.
Results: PreP+07 is a standalone Windows XP application that presents a friendly interface forspot filtration, inter- and intra-slide normalization, duplicate resolution, dye-swapping, errorremoval and statistical analyses. Additionally, it contains two unique implementation of theprocedures – double scan and Supervised Lowess-, a complete set of graphical representations –MA plot, RG plot, QQ plot, PP plot, PN plot – and can deal with many data formats, such astabulated text, GenePix GPR and ArrayPRO. PreP+07 performance has been compared with theequivalent functions in Bioconductor using a tomato chip with 13056 spots. The number ofdifferentially expressed genes considering p-values coming from the PreP+07 and BioconductorLimma packages were statistically identical when the data set was only normalized; however, a slightvariability was appreciated when the data was both normalized and scaled.
Conclusion: PreP+07 implementation provides a high degree of freedom in selecting andorganizing a small set of widely used data processing protocols, and can handle many data formats.Its reliability has been proven so that a laboratory researcher can afford a statistical pre-processingof his/her microarray results and obtain a list of differentially expressed genes using PreP+07without any programming skills. All of this gives support to scientists that have been using previousPreP releases since its first version in 2003.
Published: 12 January 2009
BMC Bioinformatics 2009, 10:16 doi:10.1186/1471-2105-10-16
Received: 29 August 2008Accepted: 12 January 2009
This article is available from: http://www.biomedcentral.com/1471-2105/10/16
© 2009 Martin-Requena et al; licensee BioMed Central Ltd. This is an Open Access article distributed under the terms of the Creative Commons Attribution License (http://creativecommons.org/licenses/by/2.0), which permits unrestricted use, distribution, and reproduction in any medium, provided the original work is properly cited.
9.2. MADE4-2C: AUTOMATIZACIÓN DEL ANÁLISIS DE MICROMATRICES DE DOS COLORES69
sido capaz de medir con fiabilidad. Suelen corres-ponder a puntos vacíos, puntos donde se despegósonda después de imprimirla, o donde la sonda noha mostrado una hibridación suficientemente buenacon las dianas del experimento.
En conclusión MADE4-2C es capaz de detectarerrores en la intensidad de la señal, en el lavado, lahibridación, el marcaje con el fluoróforo, las agujasde impresión y la calidad de las sondas impresas.Esto ayuda a evitar que los resultados se basen enlas variaciones técnicas en lugar de en las variacio-nes biológicas. Además, ofrece toda la informaciónen un informe denso pero comprensible para el in-vestigador, lo que permite una buena evaluación delexperimento sin tener unos conocimientos avanza-dos sobre micromatrices.
9.2.3. Descarte de sondas fallidas
Una vez que se proporciona información al usua-rio sobre la calidad de los datos originales que quie-re analizar, MADE4-2C procede a la corrección delruido de fondo utilizando normexp ([184]) y generalas gráficas MA que muestran cómo quedan los da-tos tras corregir el fondo (figuras 2.10 y 2.11, apén-dice B).
A continuación se muestran las sondas que se uti-lizarán en el experimento y las que se descartarán.Una sonda se descartará siempre cuando su puntoestá vacío según la información del fichero GAL, ocuando la sonda contiene una secuencia artefactualo mal caracterizada (información que se incorporódesde el fichero BadSpots.txt). Existen dos moti-vos de rechazo que solo afectan a algunas sondas enuna micromatriz, pero no tiene por qué afectar a lasdemás réplicas:
El punto correspondiente a la sonda no se im-primió o es de baja calidad, lo que viene indica-do por su peso específico a partir de los camposflags y area.
La corrección del ruido de fondo con normexpha marcado la sonda como descartable.
La tolerancia a estos fallos es controlable median-te un parámetro del fichero de configuración (véaseel apéndice D) que indica el número de réplicas fa-llidas permitidas para cada sonda en el experimentoque se analiza. Lo recomendable es que se retire lasonda en todas las micromatrices en cuanto falleuna de las réplicas por cualquiera de los motivosanteriores, aunque teóricamente el análisis se pue-de realizar con tal que una sonda tenga dos o másréplicas valores de intensidad válidos. En el caso delos experimentos analizados sobre la expresión gé-
nica de pino se descartaron las sondas en cuantofallaban en una réplica técnica o biológica.
Con toda esta información, MADE4-2C generauna figura en la que se marcan con un recuadro ne-gro los puntos que serán descartados para el análi-sis (figura 2.12, apéndice B). Es de esperar que estefiltro no retire más del 15% de las sondas [184] co-mo se muestra en la figura 2.12 del apéndice B. Encambio, es recomendable repetir el experimento sise acaban descartando más del 15% de las sondas,como se muestra en la figura 9.4.
Figura 9.4: Ejemplo de figura generada porMADE4-2C para indicar que se han descarta-do demasiadas sondas impresas para el análisisposterior.
9.2.4. Normalización
La normalización de los datos tiene en cuentalas réplicas técnicas para confirmar que los valo-res de expresión no introducen más variabilidad dela que había antes de la normalización, y que nin-guno de los marcajes con fluoróforos añade nin-gún tipo de sesgo a los datos. Aunque son mu-chos los métodos de normalización que se han pro-puesto, todavía no hay un consenso claro de queun método sea el mejor frente a las diferentescondiciones experimentales posibles [45], y pues-to que el método de normalización utilizado esuno de los factores que más afectará posteriormen-te a la detección de GED [187, 98, 45], y es po-sible obtener mejores resultados combinando dosde ellos [187], MADE4-2C lleva a cabo la norma-lización de modo independiente con varios méto-dos: Print-tip loess [207], Print-tip loess +scale, Print-tip loess + quantile [28], con lafunción normalizeBetweenArrays de limma, y porúltimo, VSN [62] y VSN + Print-tip loess [45].
9.3. IDENTIFICACIÓN DE UNA MUESTRA PROBLEMÁTICA 77
Figura 9.9: Correlación negativa de las réplicasdetectada en los experimentos de brotes y hojas depinsapo.
naturales de Sierra Bermeja (Málaga), que se hi-bridaron con el Pinarray1 y con una micromatrizcon secuencias de pino obtenidas por hibridaciónsustractiva por supresión, llamada SSH-Ma (apar-tado 8.1). A continuación se presenta el diseño delexperimento y los datos obtenidos al hibridrar conSSH-Ma por ser donde se observó este comporta-miento originalmente. Las réplicas del experimentose organizan del siguiente modo:
Individuo 1-Sur, hibridado en la micromatriz10a marcando la muestra de madera maduracon Cy3 y la de madera juvenil con Cy5. Lamicromatriz se dividió en dos réplicas técnicas10a-A y 10a-Z.
Individuo 1-Norte, hibridado en la microma-triz 22a marcando la muestra de madera madu-ra con Cy3 y la de madera juvenil con Cy5. Lamicromatriz se dividió en dos réplicas técnicas22a-A y 22a-Z.
Individuo 2-Norte, hibridado en la micro-matriz 23a, con intercambio de fluoróforos enrelación a las hibridaciones anteriores, marcan-do la muestra de madera madura con Cy5 y lade madera juvenil con Cy3. La micromatriz sedividió en dos réplicas técnicas 23a-A y 23a-Z.
Individuo 3-Sur, hibridado en la micromatriz24a, con intercambio de fluoróforos en relacióna las dos primeras micromatrices, marcando lamuestra de madera madura con Cy5 y la de
madera juvenil con Cy3. La micromatriz se di-vidió en dos réplicas técnicas 24a-A y 24a-Z.
Distancias Euclídeas Distancias Manhattan
Correlación Pearson Correlación Spearman
Figura 9.10: Dendrogramas con las distintas dis-tancias y correlaciones de las diferentes hibridacio-nes realizadas. Las micromatrices 10a-A, 10a-Z sonréplicas técnicas del individuo 1-Sur (más detallesen el texto).
En el análisis realizado con MADE4-2C (resul-tados no mostrados), al evaluar la correlación y dis-tancias entre las muestras, se comprobó que las ré-plicas técnicas se agrupaban adecuadamente (figu-ra 9.10), lo que sugería que el experimento estabanbien hecho. Pero en el caso de las réplicas biológicasse observó que el individuo 1-Sur (10a), en lugar dequedar emparejado con el individuo 1-Norte (22a)que llevaba el mismo marcaje, aparecía separadodel resto de individuos en los cuatro dendrogramas(figura 9.10). Estos resultados nos hicieron plan-tearnos si cada gen candidato presentaba el mismocomportamiento en los distintos individuos. Comola búsqueda de GED que se realiza con MADE4-2C permite únicamente la comparación de dos si-tuaciones se decidió realizar un análisis de varianzacon la librería maSigPro [50], que agrupa genes conpatrones de expresión similares en una serie tempo-ral, aunque también puede utilizarse cambiando lasmediciones de tiempo por otras condiciones (MaríaJosé Nueda, comunicación personal), que en nues-
ORIGINAL PAPER
Gene expression profiling in the stem of young maritime pinetrees: detection of ammonium stress-responsive genes in the apex
Javier Canales • Concepcion Avila • Francisco R. Canton • David Pacheco-Villalobos •
Sara Dıaz-Moreno • David Ariza • Juan J. Molina-Rueda • Rafael M. Navarro-Cerrillo •
M. Gonzalo Claros • Francisco M. Canovas
Received: 25 May 2011 / Revised: 30 August 2011 / Accepted: 12 September 2011! Springer-Verlag 2011
Abstract The shoots of young conifer trees represent aninteresting model to study the development and growth of
conifers from meristematic cells in the shoot apex to dif-
ferentiated tissues at the shoot base. In this work, micro-array analysis was used to monitor contrasting patterns of
gene expression between the apex and the base of maritime
pine shoots. A group of differentially expressed genes wereselected and validated by examining their relative expres-
sion levels in different sections along the stem, from the
top to the bottom. After validation of the microarray data,additional gene expression analyses were also performed in
the shoots of young maritime pine trees exposed to dif-
ferent levels of ammonium nutrition. Our results show thatthe apex of maritime pine trees is extremely sensitive to
conditions of ammonium excess or deficiency, as revealed
by the observed changes in the expression of stress-responsive genes. This new knowledge may be used to
precocious detection of early symptoms of nitrogen
nutritional stresses, thereby increasing survival and growthrates of young trees in managed forests.
Keywords Conifers ! Pine development ! Nitrogen !Ammonium nutrition ! Transcriptional regulation
Introduction
Forests are essential components of the ecosystems, and
they play a fundamental role in the regulation of terrestrial
carbon sinks. Coniferous forests dominate large ecosys-tems in the Northern Hemisphere and include a broad
variety of woody plant species, some ranking as the largest,
tallest, and longest living organisms on Earth (Farjon2010). Conifers are the most important group of gymno-
sperms and have evolved very efficient physiological
adaptation systems after the separation from angiosperms,which occurred more than 300 million years ago. Conifer
trees are also of great economic importance, as they are
major sources for timber, oleoresin, and paper production.Maritime pine (Pinus pinaster Aiton) stands are dis-
tributed in the southwestern area of the Mediterraneanregion. P. pinaster dominates the forest scenario in France,
Spain and Portugal, where this is the most widely planted
species in about 4 million hectares. The maritime pine isparticularly tolerant to abiotic stresses showing relatively
high-levels of intra-specific variability (Aranda et al.
2010). The maritime pine is also the most advanced conifermodel species for genomic research in Europe, and a large
number of genomic resources and phenotypic data have
been generated in the last few years and are available forthe conifer research community (http://www.scbi.uma.
es/pindb/; https://www4.bordeaux-aquitaine.inra.fr/biogeco/
Ressources/BDD). Furthermore, results on this conifer
Communicated by K. Klimaszewska.
Electronic supplementary material The online version of thisarticle (doi:10.1007/s00468-011-0625-z) contains supplementarymaterial, which is available to authorized users.
J. Canales ! C. Avila ! F. R. Canton ! D. Pacheco-Villalobos !S. Dıaz-Moreno ! J. J. Molina-Rueda ! M. G. Claros !F. M. Canovas (&)Departamento de Biologıa Molecular y Bioquımica,Facultad de Ciencias, Instituto Andaluz de Biotecnologıa,Campus Universitario de Teatinos, Universidad de Malaga,s/n, 29071 Malaga, Spaine-mail: [email protected]
D. Ariza ! R. M. Navarro-CerrilloDepartment of Forestry Engineering, School of Forestry,Campus Universitario de Rabanales, University of Cordoba,14071 Cordoba, Spain
123
Trees
DOI 10.1007/s00468-011-0625-z
30 s at 72!C). The fluorescence signal was captured at the
end of each extension step and melting curve analysis wasperformed from 60 to 95!C. The PCR products were ver-
ified by melting point analysis at the end of each experi-
ment, and, during protocol development, by gelelectrophoresis.
The baseline calculation and starting concentration (N0)
per sample of the amplification reactions were estimateddirectly from raw fluorescence data using the LinReg 11.3
program (Ruijter et al. 2009). The relative expressionlevels were obtained from the ratio between the N0 of the
target gene and the normalisation factor. We used the
geometric mean of three control genes (actin, 40S ribo-somal protein and elongation factor 1 alpha) to calculate
the normalisation factor (Vandesompele et al. 2002). Ref-
erence genes were selected based on their stable expressionin the microarrays. Furthermore, these genes were stably
expressed in all conditions and tissue portions examined as
determined by statistical analysis using Normfinder(Andersen et al. 2004).
Results and discussion
Differential gene expression between the apexand the base of maritime pine shoots
The differential gene expression was analysed in maritimepine stems using microarrays. Intact total RNA was
extracted from the apex and the basal part of the stems,
labelled with CyDye and hybridised to slides of PINAR-RAY, a maritime pine microarray constructed in our lab-
oratory. Microarray data were lowess normalised to
account for intensity-dependent differences betweenchannels. After normalisation, the dye-swap replicates did
not show strong deviations from linearity, proving a low
dye bias. The comparisons between replicates showed ahigh degree of reproducibility, with Pearson’s correlation
coefficients of approximately 0.98. Similar transcriptomic
analyses have been previously performed in Sitka spruce(Friedmann et al. 2007). Microarray analyses were also
used for transcript profiling in differentiating xylem of
loblolly pine and white spruce (Yang et al. 2004; Pavyet al. 2008).
Genes differentially expressed at the apical and the basal
parts of the maritime pine stem were identified by bioin-formatic analysis of hybridisation signals in the microarray,
using a cut-off t test p value \ 0.05 and a fold change
[1.5, as shown in a volcano plot (Fig. 1). With theseparameters, 44 and 26 unigenes were identified as differ-
entially expressed in the apex and the base, respectively.
A list of selected genes with enhanced gene expressionlevels in the apex is shown in Table 1. Transcripts for
genes encoding photosynthetic proteins, including those
located in the thylakoid membranes involved in thephotosystems I and II, light-harvesting complexes, as well
as soluble proteins of the plastid stroma such as the small
subunit of ribulose-1,5-bisphosphate carboxylase/oxygen-ase (Rubisco SSU; EC 4.1.1.39), were particularly abun-
dant. This part of the stem contains the shoot apical
meristem which drives stem growth and develops newneedles requiring the biosynthesis of proteins for the pho-
tosynthetic machinery. Also abundant were transcripts forlipid transfer proteins (LPT), metallothionein-like proteins
(MT) and stress proteins such as an antimicrobial peptide
(AMP), a putative dehydrin and a late embryogenesisabundant protein. The expression of stress-related genes
has also been reported in the apical shoot meristem of Sitka
spruce where they may be involved in the protection ofmeristematic cells against mechanical wounding or insect
attack (Ralph et al. 2006). Interestingly, a number of genes
involved in lignin biosynthesis and cell wall formationwere also upregulated in the apical part of the maritime
pine stem. These included a putative cinnamoyl-CoA
reductase (EC 1.2.1.44), a serine-hydroxymethyltransferase(EC 2.1.2.1), xyloglucan endotransglycosylases (EC
2.4.1.207), an endo-1,4-b-mannosidase (EC 3.2.1.78), a
putative proline-rich arabinogalactan and a germin-like
Fig. 1 Graphical representation of the microarray data analysis.Microarray normalised data were analysed by moderate t teststatistics. Logarithms of the probability of the t test were representedas a function of the logarithm of the fold change for each gene.Horizontal and vertical dot lines represent the p value and foldchange cuts-off, respectively, for the selection of differentiallyexpressed genes, represented as black circles
Trees
123
ammonium excess. We have previously reported thatammonium excess and deficiency trigger changes in the
transcriptome of maritime pine roots (Canales et al.
2010). The differential expression patterns of a numberof representative genes suggested the existence of
potential links between ammonium-responsive genes and
genes involved in amino acid metabolism, particularly inasparagine biosynthesis and utilisation (Canales et al.
2010). The results reported here indicate that the meta-
bolic changes observed in roots are transmitted to thestem apex. This fact implies the existence of a systemic
signal that may represent a part of the response of
maritime pine seedlings to nutritional stress by ammo-nium. The nature of this systemic signal is presently
unknown; however, we can speculate that altered levels
of organic nitrogen in the form of asparagine may beinvolved. High-levels of this amino acid accumulate in
pine hypocotyls and a role of asparagine in nitrogen re-
allocation has been proposed (Canas et al. 2006). In fact,asparagine is a vehicle for nitrogen transport in plants
and it is well known that there is a stress-induced
asparagine accumulation in response to mineral defi-ciencies, drought or pathogen attack (Lea et al. 2007).
Fig. 4 Expression patternsalong the maritime pine stem ofsix genes that were identified asdifferentially expressed in thebase. The relative abundance ofeach transcript was quantified incomparison to the expressionlevels of three genes ofreference (EF1a, 40S and actin).The histograms represent themean values of threeindependent experiments withstandard deviations. PALphenylalanine ammonia-lyase,4CL 4-coumarate: CoA ligase,SuSy sucrose synthase, CLScellulose synthase, small HSPsmall heat-shock protein,PEPCK phosphoenolpyruvate-carboxykinase
Fig. 5 Genes differentially expressed in maritime pine stems inresponse to ammonium excess (E) or deficiency (D) identified bymicroarray analysis. Log expression ratio values from each treatmentwere represented as heatmaps
Trees
123
RESEARCH ARTICLE Open Access
Reprogramming of gene expression duringcompression wood formation in pine: Coordinatedmodulation of S-adenosylmethionine, lignin andlignan related genesDavid P Villalobos1,2, Sara M Díaz-Moreno1,3, El-Sayed S Said1, Rafael A Cañas1, Daniel Osuna1,4,Sonia H E Van Kerckhoven1, Rocío Bautista1, Manuel Gonzalo Claros1, Francisco M Cánovas1 andFrancisco R Cantón1*
Abstract
Background: Transcript profiling of differentiating secondary xylem has allowed us to draw a general picture of thegenes involved in wood formation. However, our knowledge is still limited about the regulatory mechanisms thatcoordinate and modulate the different pathways providing substrates during xylogenesis. The development ofcompression wood in conifers constitutes an exceptional model for these studies. Although differential expressionof a few genes in differentiating compression wood compared to normal or opposite wood has been reported, thebroad range of features that distinguish this reaction wood suggest that the expression of a larger set of geneswould be modified.
Results: By combining the construction of different cDNA libraries with microarray analyses we have identified atotal of 496 genes in maritime pine (Pinus pinaster, Ait.) that change in expression during differentiation ofcompression wood (331 up-regulated and 165 down-regulated compared to opposite wood). Samples fromdifferent provenances collected in different years and geographic locations were integrated into the analyses tomitigate the effects of multiple sources of variability. This strategy allowed us to define a group of genes that areconsistently associated with compression wood formation. Correlating with the deposition of a thicker secondarycell wall that characterizes compression wood development, the expression of a number of genes involved insynthesis of cellulose, hemicellulose, lignin and lignans was up-regulated. Further analysis of a set of these genesinvolved in S-adenosylmethionine metabolism, ammonium recycling, and lignin and lignans biosynthesis showedchanges in expression levels in parallel to the levels of lignin accumulation in cells undergoing xylogenesis in vivoand in vitro.
Conclusions: The comparative transcriptomic analysis reported here have revealed a broad spectrum ofcoordinated transcriptional modulation of genes involved in biosynthesis of different cell wall polymers associatedwith within-tree variations in pine wood structure and composition. In particular, we demonstrate the coordinatedmodulation at transcriptional level of a gene set involved in S-adenosylmethionine synthesis and ammoniumassimilation with increased demand for coniferyl alcohol for lignin and lignan synthesis, enabling a betterunderstanding of the metabolic requirements in cells undergoing lignification.
* Correspondence: [email protected] de Biología Molecular y Bioquímica, Facultad de Ciencias,Universidad de Málaga, Campus Universitario de Teatinos, 29071, Málaga,SpainFull list of author information is available at the end of the article
© 2012 Villalobos et al. This is an Open Access article distributed under the terms of the Creative Commons AttributionLicense (http://creativecommons.org/licenses/by/2.0), which permits unrestricted use, distribution, and reproduction in anymedium, provided the original work is properly cited.
Villalobos et al. BMC Plant Biology 2012, 12:100http://www.biomedcentral.com/1471-2229/12/100
and Ox (Figure 4). The differential expression patternsin Cx and Ox observed in microarrays analyses werevalidated for all selected genes. In particular, northernblot analysis suggested that our strategy allowed us toidentify some genes that may be specifically induced athigh levels in Cx whereas are not expressed or expressedat very low levels in Ox (Figure 4, EFE, GST, GLP, XGT,LHT). As a control, the expression pattern was also con-firmed for a gene that is expressed at similar levels inboth types of differentiating xylem according to micro-array analysis (Figure 4b, panel labeled 13-7XLA6).
Trancriptome changes in functional categories related tocell wall during compression wood formation in pineThe complete set of unigenes was functionally annotatedusing BlastX analysis [33] against GenBank and BlastN
using the Pine Gene Index database (Additional file 3).Sequences that matched with the same entry in the data-base were assumed to represent the same gene. There-fore, the final numbers of unigenes were reduced to 331for Cx and 165 for Ox. Most of these genes showed sig-nificant similarities to sequences in databases (293 in Cxand 145 in Ox), although some of them were similar tosequences with unknown function (49 in Cx and 45 inOx). The number of unigenes with no significant simi-larity was low in both cases (38 in Cx and 20 in Ox).The genes with assigned function were grouped into
functional categories using the Arabidopsis thaliana Mun-ich Information Centre for Protein Sequences (MIPS)database, and suppression of redundancy in MIPS funcatassignations by decision according to their most probablerole in xylem development (Additional file 3). In keepingwith the greater number of genes identified as up-regulated in Cx, most of the functional categories includedmore genes in this tissue (Figure 5 and Additional file 3for details). The most represented categories were “C-compound and carbohydrate metabolism” (30 in Cx/9 inOx), “cellular transport” (25 in Cx/8 in Ox), “protein syn-thesis” (18 in Cx/12 in Ox), “amino acid metabolism” (26in Cx/2 in Ox), “secondary metabolism” (24 in Cx/2 inOx), “cell rescue, defense and virulence” (11 in Cx/15 inOx) “protein fate” (14 in Cx/11 in Ox), “biogenesis of cellwall components” (13 in Cx/8 in Ox), “energy” (17 in Cx/0in Ox), “biogenesis of cytoskeleton” (10 in Cx/2 in Ox),and “cellular communication/signal transduction mechan-ism” (8 in Cx/3 in Ox).The functional categories with larger numbers of up-
regulated genes in Cx compared to Ox are consistent withstructural and chemical modifications of the cell wall, and
Figure 3 Volcano plots of microarray analyses to identify genesdifferentially expressed during compression and oppositewood formation. The common logarithm of the p-value wasrepresented as a function of the binary logarithm of thebackground-corrected and normalized opposite:compressionfluorescence ratio (log2 Fold Change) for each spot. Vertical barsdelimit the spots showing up-regulation in developing compressionxylem by at least 1.5-fold compared to developing opposite xylem(Up-regulated in Cx) or spots showing up-regulation in developingopposite xylem by at least 1.5-fold compared to developingcompression xylem (Up-regulated in Ox). The horizontal line delimitsthe spots showing significant up-regulation under the criteria of anadjusted p-value≤ 0.001. Therefore, the upper left and right sectorsdelimited by the horizontal and vertical lines include the spots (inred) containing probes for genes significantly up-regulated indeveloping compression or opposite xylem respectively. Thenumber of spots corresponding with genes significantly up-regulated in Cx or Ox are shown in the top side of the sector. (a)Results from the analysis of microarray 1 constructed with cDNAclones from the composite library. (b) Results from the analysis ofmicroarray 2 constructed with cDNA clones from subtractivelibraries.
Villalobos et al. BMC Plant Biology 2012, 12:100 Page 5 of 17http://www.biomedcentral.com/1471-2229/12/100
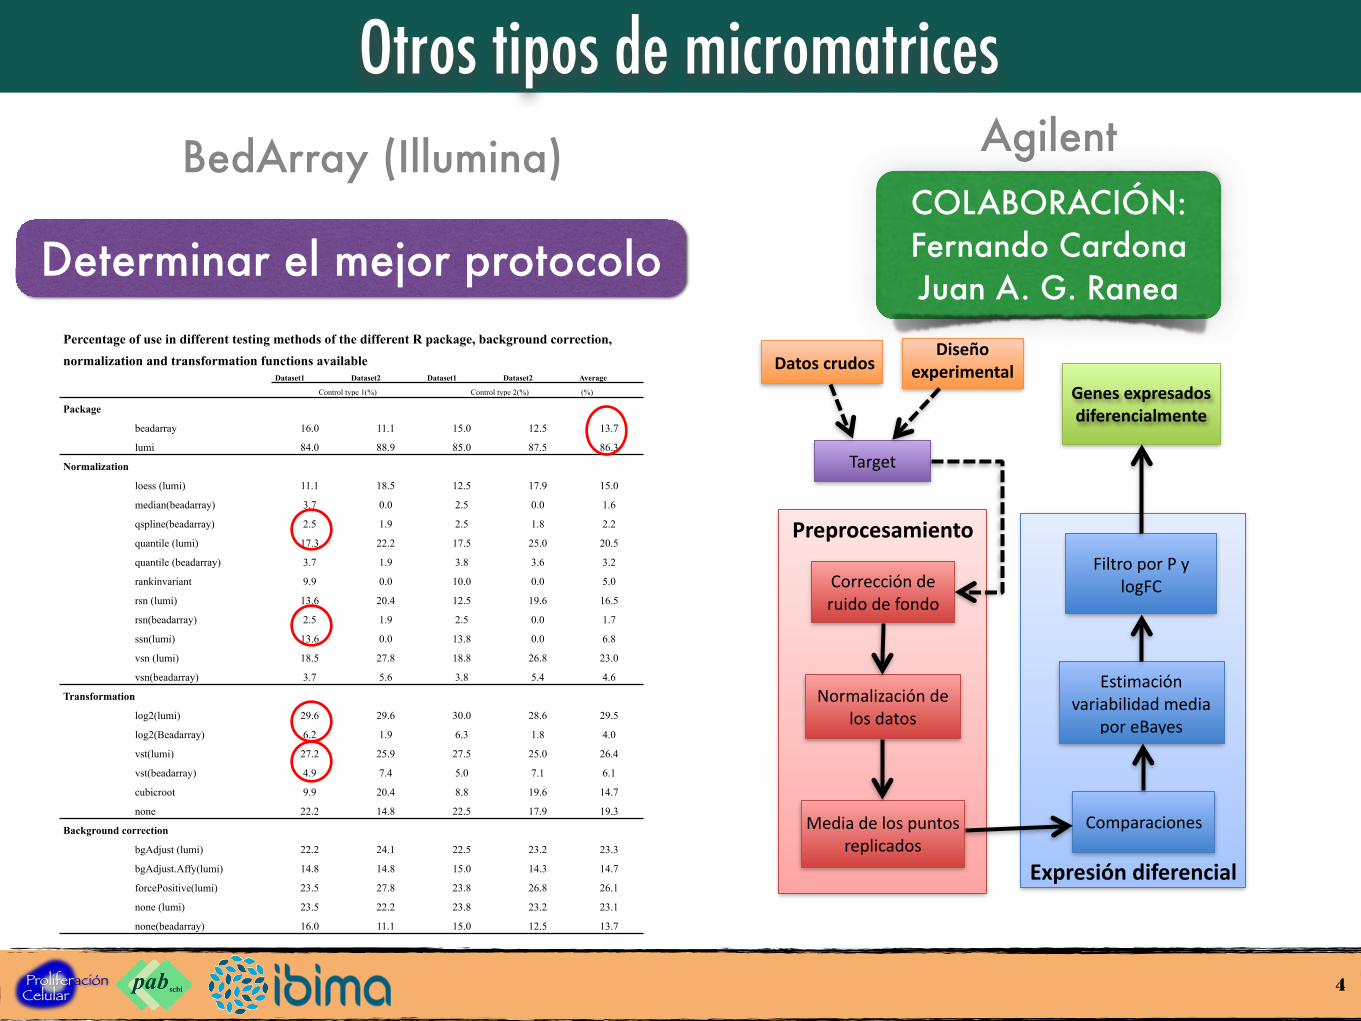
Otros tipos de micromatrices
4
Percentage of use in different testing methods of the different R package, background correction,
normalization and transformation functions availableDataset1 Dataset2 Dataset1 Dataset2 Average
Control type 1(%) Control type 2(%) (%)
Package
beadarray 16.0 11.1 15.0 12.5 13.7
lumi 84.0 88.9 85.0 87.5 86.3
Normalization
loess (lumi) 11.1 18.5 12.5 17.9 15.0
median(beadarray) 3.7 0.0 2.5 0.0 1.6
qspline(beadarray) 2.5 1.9 2.5 1.8 2.2
quantile (lumi) 17.3 22.2 17.5 25.0 20.5
quantile (beadarray) 3.7 1.9 3.8 3.6 3.2
rankinvariant 9.9 0.0 10.0 0.0 5.0
rsn (lumi) 13.6 20.4 12.5 19.6 16.5
rsn(beadarray) 2.5 1.9 2.5 0.0 1.7
ssn(lumi) 13.6 0.0 13.8 0.0 6.8
vsn (lumi) 18.5 27.8 18.8 26.8 23.0
vsn(beadarray) 3.7 5.6 3.8 5.4 4.6
Transformation
log2(lumi) 29.6 29.6 30.0 28.6 29.5
log2(Beadarray) 6.2 1.9 6.3 1.8 4.0
vst(lumi) 27.2 25.9 27.5 25.0 26.4
vst(beadarray) 4.9 7.4 5.0 7.1 6.1
cubicroot 9.9 20.4 8.8 19.6 14.7
none 22.2 14.8 22.5 17.9 19.3
Background correction
bgAdjust (lumi) 22.2 24.1 22.5 23.2 23.3
bgAdjust.Affy(lumi) 14.8 14.8 15.0 14.3 14.7
forcePositive(lumi) 23.5 27.8 23.8 26.8 26.1
none (lumi) 23.5 22.2 23.8 23.2 23.1
none(beadarray) 16.0 11.1 15.0 12.5 13.7
BedArray (Illumina) Agilent
Determinar el mejor protocolo
Preprocesamiento
Corrección)de)ruido)de)fondo
Normalización)de)los)datos
Media)de)los)puntos)replicados
Expresión0diferencial
Comparaciones)
Estimación)variabilidad)media)
por)eBayes
Filtro)por)P)y)logFC
Target
Datos0crudosDiseño0
experimentalGenes0expresados0diferencialmente
COLABORACIÓN: Fernando CardonaJuan A. G. Ranea
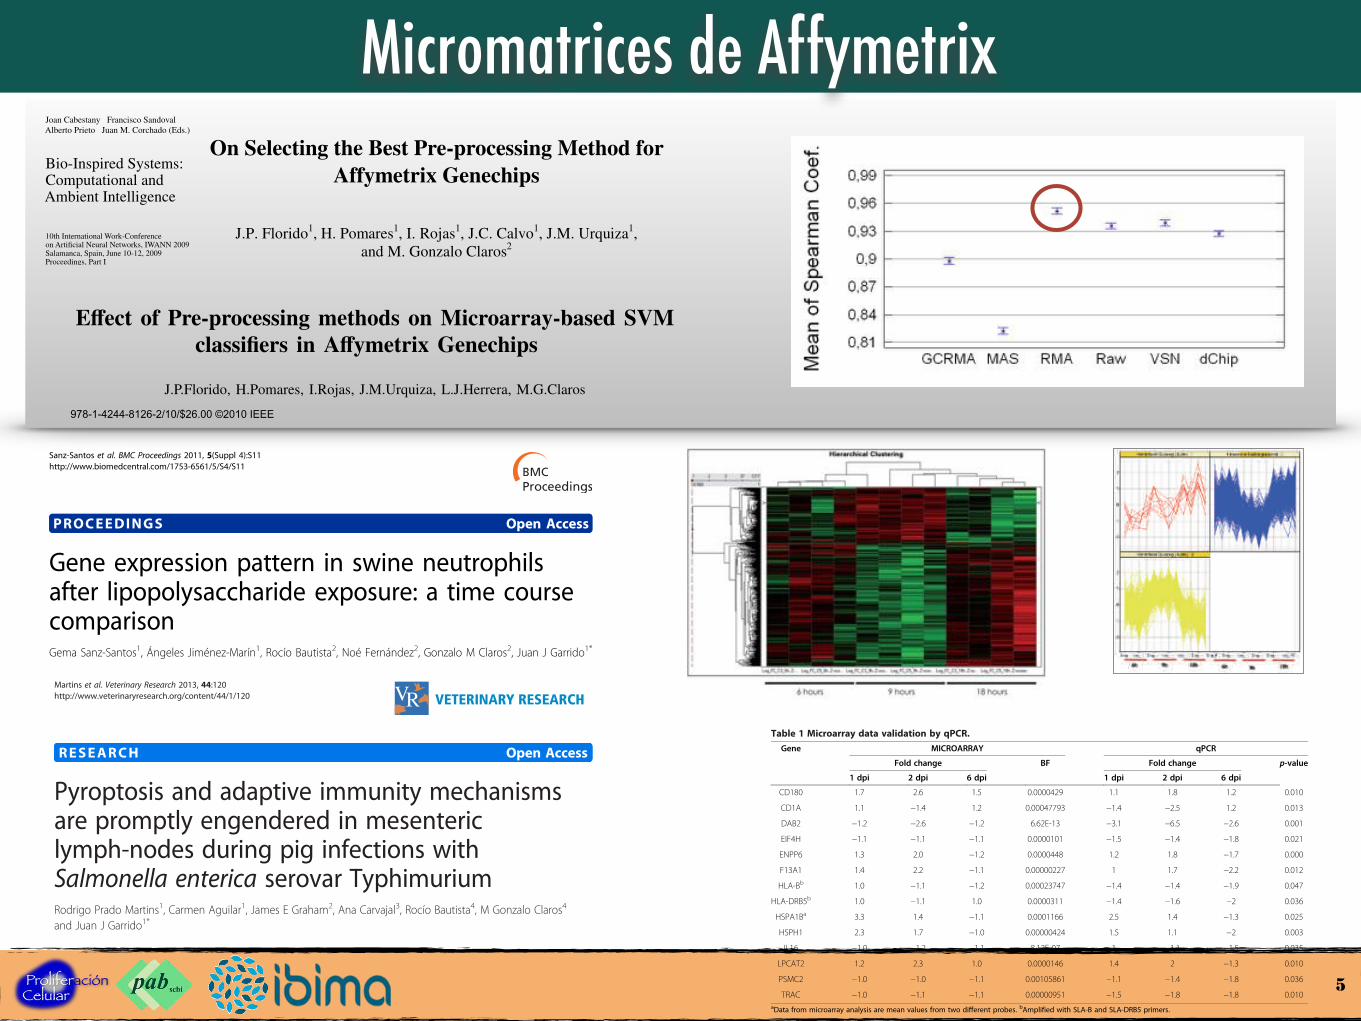
Micromatrices de Affymetrix
5
J. Cabestany et al. (Eds.): IWANN 2009, Part I, LNCS 5517, pp. 845–852, 2009. © Springer-Verlag Berlin Heidelberg 2009
On Selecting the Best Pre-processing Method for Affymetrix Genechips
J.P. Florido1, H. Pomares1, I. Rojas1, J.C. Calvo1, J.M. Urquiza1, and M. Gonzalo Claros2
1 Department of Computer Architecture and Computer Technology, University of Granada, Granada, Spain
{jpflorido,hector}@ugr.es, {irojas,jccalvo,jurquiza}@atc.ugr.es 2 Department of Molecular Biology and Biochemistry, University of Málaga, Málaga, Spain
Abstract. Affymetrix High Oligonucleotide expression arrays, also known as Affymetrix GeneChips, are widely used for the high-throughput assessment of gene expression of thousands of genes simultaneously. Although disputed by several authors, there are non-biological variations and systematic biases that must be removed as much as possible before an absolute expression level for every gene is assessed. Several pre-processing methods are available in the literature and five common ones (RMA, GCRMA, MAS5, dChip and VSN) and two customized Loess methods are benchmarked in terms of data variability, similarity of data distributions and correlation coefficient among replicated slides in a variety of real examples. Besides, it will be checked how the variant and invariant genes can influence on preprocessing performance.
1 Introduction
Microarray technology is a powerful tool used for the high-throughput assessment of gene expression of thousands of genes simultaneously which can be used to infer metabolic pathways, to characterize protein-protein interactions or to extract target genes for developing therapies for various diseases [1]. Several platforms are currently available, including the commonly used high oligonucleotide-based Affymetrix GeneChip® arrays.
As described in [1], an Affymetrix GeneChip contains probe sets of 10-20 probe pairs representing unique genes. Each probe pair consists of two oligonucleotides of 25 bp in length, namely perfect match (PM) probes (the exact complement of an mRNA) and the mismatch (MM) probes (which are identical to the perfect match except that one base is changed at the center position). The MM probe is supposed to distinguish noise caused by non-specific hybridization from the specific hybridization signal, although some researchers recommend avoiding its use [17].
A typical microarray experiment has biological and technical sources of variation [2]. Biological variation results from tissue heterogeneity, genetic polymorphism, and changes in mRNA levels within cells and among individuals due to sex, age, race, genotype-environment interactions and other “living” factors. Biological variation is of interest to researchers as it reflects true variation among experiments. On the other
Joan Cabestany Francisco SandovalAlberto Prieto Juan M. Corchado (Eds.)
Bio-Inspired Systems:Computational andAmbient Intelligence
10th International Work-Conferenceon Artificial Neural Networks, IWANN 2009Salamanca, Spain, June 10-12, 2009Proceedings, Part I
13
E↵ect of Pre-processing methods on Microarray-based SVMclassifiers in A↵ymetrix Genechips
J.P.Florido, H.Pomares, I.Rojas, J.M.Urquiza, L.J.Herrera, M.G.Claros
Abstract— A↵ymetrix High Oligonucleotide expressionarrays are widely used for the high-throughput assessmentof gene expression of thousands of genes simultaneously.Although disputed by several authors, there are non-biologicalvariations and systematic biases that must be removed asmuch as possible through the pre-processing step before anabsolute expression level for every gene is assessed. It isimportant to evaluate microarray pre-processing proceduresnot only to the detection of di↵erentially expressed genes,but also to classification, since a major use of microarraysis the expression-based phenotype classification. Thus, inthis paper, we use several cancer microarray datasets toassess the influence of five di↵erent pre-processing methodsin Support Vector Machine-based classification methodologieswith di↵erent kernels: linear, Radial Basis Functions (RBFs)and polynomial.
I. Introduction
Microarray technology is a powerful tool used for the high-throughput assessment of gene expression of thousands ofgenes simultaneously which can be used to infer metabolicpathways, to characterize protein-protein interactions or toextract target genes for developing therapies for various dis-eases [1]. Several platforms are currently available, includingthe commonly used high oligonucleotide-based A↵ymetrixGeneChip R� arrays. As described in [1], an A↵ymetrixGeneChip contains probe sets of 10-20 probe pairs re-presenting unique genes. Each probe pair consists of twooligonucleotides of 25 bp in length, namely perfect match(PM) probes (the exact complement of an mRNA) and themismatch (MM) probes (which are identical to the perfectmatch except that one base is changed at the center position).The MM probe is supposed to distinguish noise caused bynon-specific hybridization from the specific hybridizationsignal, although some researchers recommend avoiding itsuse [2]. A typical microarray experiment has biologicaland technical sources of variation [3]. Biological variationresults from tissue heterogeneity, genetic polymorphism, andchanges in mRNA levels within cells and among individualsdue to sex, age, race, genotype-environment interactions andother ”living” factors. Biological variation is of interest toresearchers as it reflects true variation among experiments.On the other hand, sample preparation, labeling, hybridiza-tion and other steps of microarray experiment can contributeto technical variation, which can significantly impact the
J.P.Florido, H.Pomares, I.Rojas, J.M.Urquiza and L.J.Herrera are withthe Department of Computer Architecture and Computer Technol-ogy, CITIC-UGR, University of Granada, Spain (corresponding author:[email protected])
M.G.Claros is with the Department of Molecular Biology and Bioche-mistry, University of Malaga, Spain
quality of array data. Therefore, since those systematic non-biological sources of variation mask real biological variation,significant pre-processing is required and involves four stepsfor A↵ymetrix GeneChips: background correction, normal-ization, PM correction and summarization [4].
Assessment of the e↵ectiveness of pre-processing hasmainly been confined to the ability to detect di↵erentially ex-pressed genes [5] [6] or in terms of data variability, similarityin data distributions and correlation among replicates [7].However, a major use of microarrays is phenotype classi-fication via expression-based classifiers: given a collectionof gene expression profiles for tissue samples belonging tovarious cancer types, the goal is to build a classifier toautomatically determine the cancer type of a new sampleat high precision. Classifying cancer tissues based on theirgene expression profiles has the promise of providing morereliable means to diagnose and predict various types ofcancers [8], but the accuracy of these predictions may dependon the pre-processing method selected.
Thus, in this work, several cancer microarray data setsare used to assess the e↵ect of di↵erent pre-processingmethods (RMA, GCRMA, VSN, dChip and MAS5) in high-order analytical tasks such as classification using SupportVector Machines (SVMs) with three di↵erent kernels: Linear,Radial Basis Functions (RBFs) and polynomial. SVMs areusually preferred in microarray-based classification due toits outperformance compared to other paradigms, namely, k-Nearest Neighbors, backpropagation and probabilistic neuralnetworks, weighted voting methods and decision trees [9]due to two special aspects of microarray data: high dimen-sionality and small sample size. Kernel methods representone way to cope with the curse of dimensionality [8].
Previous related work about the e↵ect of pre-processingmethods relative to classification has been focused oncDNA microarrays using k-Nearest Neighbor classi-fiers [10], [11], [12], Support Vector Machines [11], [12]and linear discriminant analysis, regular histogram, Gaussiankernel, perceptron and multiple perceptron with majorityvoting [12]. Instead, our study is related to A↵ymetrixGenechips microarray technology.
Section II describes the main pre-processing methodsexisting in the literature for A↵ymetrix Genechips, sectionIII introduces SVMs classifiers and section IV states experi-mental results. Conclusions are drawn in section V.
II. Pre-processing Affymetrix GenechipsInstead of describing how every pre-processing method
(RMA, GCRMA, VSN, dChip and MAS5) works, they will
978-1-4244-8126-2/10/$26.00 ©2010 IEEE
VSN performs statistically better (P < 0.05) than the others.So, these results suggest that RMA, VSN and dChip methodsare the preferred ones, which is consistent with the resultsgiven in [7] and in terms of classification rate (Fig.1).
Fig. 4. Means and 95% LSD intervals of the di↵erent pre-processingmethods through the mean of Spearman Coe�cient quality metric
From Figs.2 and 4 and focusing on the RMA and GCRMApre-processing methods, it can be observed the influence ofthe background correction step employed (Table I). In thiscase, there are statistical di↵erences (P < 0.05) in terms ofdata variability and Spearman correlation coe�cient qualitymetrics between RMA and GCRMA preprocessing methods.These statistical di↵erences were also present in terms ofmisclassification rate (Fig.1).
Although this work studies the e↵ect of pre-processingmethods in terms of classification rate, it would be alsointeresting to study whether the number of genes selectedin the feature selection step and the kernel method used inthe SVM classifier a↵ect the results.
From Fig.5, it can be observed that the accuracy of SVMis a↵ected by the number of genes selected by t-test. Thereare no statistical di↵erences (P > 0.05) when the number ofgenes selected varies from 10 to 400. On the other hand,when very few genes (5) are selected or the number islarge (600-2000 and the whole chip) SVM’s performancegets worse. In the first case, the data does not containenough discriminative information and, in the second case,a large number of irrelevant genes may be harmful for theclass discrimination, acting as ”noise” and a↵ecting SVM’saccuracy [8].
Fig. 5. Means and 95% LSD intervals of the di↵erent number of genesselected prior to classification through the misclassification rate
According to the kernel used (Fig.6), polynomial kernel
performs statistically worse (P < 0.05) than linear andradial kernels, whereas there are no statistical di↵erences(P > 0.05) between the latter. These results suggest thatthe problems are intrinsically linear and, therefore, the radialkernel chooses parameters gamma that make the learneddecision boundary almost linear. This conclusion is alsoconsistent with the one given in a benchmark study [42]in which well-tuned RBF kernels achieve results as good astheir linear counterparts.
Fig. 6. Means and 95% LSD intervals of the linear, radial and polynomialkernels through the misclassification rate
V. Conclusion
In this paper, we performed a comparison of some ofthe most well known pre-processing methods for A↵ymetrixGenechips microarrays (RMA, GCRMA, VSN, dChip andMAS5) in terms of classification using Support VectorMachines. Seven real cancer data sets obtained from theliterature, with di↵erent design, di↵erent number of classes,di↵erent number of genes and di↵erent diseases were em-ployed, which provide a strong support for the conclusionssince they are not linked to particular data. According toour results, there are no statistical di↵erences among RMA,VSN, dChip and MAS5 pre-processing methods in terms ofmisclassification rate, but GCRMA method shows the sameperformance, statistically speaking, as raw data. Moreover, ithas been shown that the SVM classifier is sensitive to bothfeature selection and kernel function: when very few/largenumber of genes are selected or the polynomial kernel ischosen, SVM’s accuracy goes down. On the other hand, well-tuned RBF kernels give similar results to the linear ones.
This was a preliminary work, so, more investigation isneeded as a future work to understand the interplay be-tween pre-processing (which improves data quality), featureselection (which improves the classifier by throwing awaynon-informative data), kernel function (linear vs nonlinear)and their optimized parameters to ascertain pre-processingstrategies to produce an optimal classifier. On the other hand,it must be noticed that it is di�cult to compare our studyfocused on A↵ymetrix technology with the ones describedfor cDNA microarrays [10] [11] [12], due to the di↵erencesin array structure, labeling scheme and the steps involved inthe pre-processing procedure [43].
PROCEEDINGS Open Access
Gene expression pattern in swine neutrophilsafter lipopolysaccharide exposure: a time coursecomparisonGema Sanz-Santos1, Ángeles Jiménez-Marín1, Rocío Bautista2, Noé Fernández2, Gonzalo M Claros2, Juan J Garrido1*
From International Symposium on Animal Genomics for Animal Health (AGAH 2010)Paris, France. 31 May – 2 June 2010
Abstract
Background: Experimental exposure of swine neutrophils to bacterial lipopolysaccharide (LPS) represents a modelto study the innate immune response during bacterial infection. Neutrophils can effectively limit the infection bysecreting lipid mediators, antimicrobial molecules and a combination of reactive oxygen species (ROS) without newsynthesis of proteins. However, it is known that neutrophils can modify the gene expression after LPS exposure. Weperformed microarray gene expression analysis in order to elucidate the less known transcriptional response ofneutrophils during infection.
Methods: Blood samples were collected from four healthy Iberian pigs and neutrophils were isolated and incubatedduring 6, 9 and 18 hrs in presence or absence of lipopolysaccharide (LPS) from Salmonella enterica serovar Typhimurium.RNA was isolated and hybridized to Affymetrix Porcine GeneChip®. Microarray data were normalized using RobustMicroarray Analysis (RMA) and then, differential expression was obtained by an analysis of variance (ANOVA).
Results: ANOVA data analysis showed that the number of differentially expressed genes (DEG) after LPS treatment varywith time. The highest transcriptional response occurred at 9 hr post LPS stimulation with 1494 DEG whereas at 6 and18 hr showed 125 and 108 DEG, respectively. Three different gene expression tendencies were observed: genes incluster 1 showed a tendency toward up-regulation; cluster 2 genes showing a tendency for down-regulation at 9 hr;and cluster 3 genes were up-regulated at 9 hr post LPS stimulation. Ingenuity Pathway Analysis revealed a delay ofneutrophil apoptosis at 9 hr. Many genes controlling biological functions were altered with time including thosecontrolling metabolism and cell organization, ubiquitination, adhesion, movement or inflammatory response.
Conclusions: LPS stimulation alters the transcriptional pattern in neutrophils and the present results show that therobust transcriptional potential of neutrophils under infection conditions, indicating that active regulation of geneexpression plays a major role in the neutrophil-mediated- innate immune response.
BackgroundNeutrophils play a key role in innate immune response.They initiate phagocytosis, degranulation and killingwithout new synthesis of proteins. However, it has beendemonstrated that new gene transcription and proteinsynthesis are required to maintain full capacity for
human neutrophil phagocytosis and associated bacterici-dal activity [1,2].LPS treatment enhances neutrophil bactericidal activ-
ity, with an alteration in adhesion, respiratory burst,degranulation and motility [3,4]. Thus kinetic study ofswine neutrophil response to LPS represents an in vitromodel to investigate the innate immune response duringbacterial infection.To test the neutrophil transcriptional potential, global
gene expression analysis was performed and the resultsindicated that the LPS-treated neutrophils increase their
* Correspondence: [email protected] de Genómica y Mejora Animal, Departamento de Genética, Facultadde Veterinaria, Universidad de Córdoba, Campus de Rabanales, EdificioGregor Mendel C5, 14071 Córdoba, SpainFull list of author information is available at the end of the article
Sanz-Santos et al. BMC Proceedings 2011, 5(Suppl 4):S11http://www.biomedcentral.com/1753-6561/5/S4/S11
© 2011 Sanz-Santos et al; licensee BioMed Central Ltd. This is an open access article distributed under the terms of the CreativeCommons Attribution License (http://creativecommons.org/licenses/by/2.0), which permits unrestricted use, distribution, andreproduction in any medium, provided the original work is properly cited.
Finally, cluster 3 consists of 335 up-regulated genes.Functions associated with these molecules are relatedto cellular assembly and reorganization, cellular main-tenance and gene expression. Canonical pathways arerelated to protein ubiquitination signaling, PDGF sig-naling and IL-3 signaling which is involved in cell sur-vival by activation of JAK/STAT signaling and BCL2[10]. Network 2 (Additional file 4) highlights NF-!Binteractions and covers several canonical pathwayssuch as acute phase response signaling and interferonsignaling.
Inhibition of spontaneous apoptosis at 9 hrsTurnover of aging neutrophils occurs in the absence ofactivation through a process known as spontaneous
Figure 2 Differentially expressed genes grouped into three different clusters. Cluster 1 contains 8 genes with up-regulation tendencythrough the time course. 747 genes belonging the cluster 2, with a down-regulation tendency at 9 hr. Opposite tendency can be observed inthe cluster 3, where 335 genes show an up-regulation at 9 hr and down-regulation at 18 hr.
UP DOWNhours 61 64hours 388 11068 hours 50 58
61
388
5064
1106
580
200
400
600
800
1000
1200
1400
1600
6 hours 9 hours 18 hours
DOWNUP
Figure 3 Differentially expressed genes in each time point. 125and 108 genes were altered at 6 and 18 hr respectively, with asimilar number of up and down-regulated genes. Most significanttranscriptional changes were observed at 9 hr post LPS stimulation.1106 genes were down-regulated and 388 were up-regulated.
Sanz-Santos et al. BMC Proceedings 2011, 5(Suppl 4):S11http://www.biomedcentral.com/1753-6561/5/S4/S11
Page 4 of 6
RESEARCH Open Access
Pyroptosis and adaptive immunity mechanismsare promptly engendered in mesentericlymph-nodes during pig infections withSalmonella enterica serovar TyphimuriumRodrigo Prado Martins1, Carmen Aguilar1, James E Graham2, Ana Carvajal3, Rocío Bautista4, M Gonzalo Claros4
and Juan J Garrido1*
Abstract
In this study, we explored the transcriptional response and the morphological changes occurring in porcinemesenteric lymph-nodes (MLN) along a time course of 1, 2 and 6 days post infection (dpi) with SalmonellaTyphimurium. Additionally, we analysed the expression of some Salmonella effectors in tissue to complete our viewof the processes triggered in these organs upon infection. The results indicate that besides dampening apoptosis,swine take advantage of the flagellin and prgJ expression by Salmonella Typhimuriun to induce pyroptosis in MLN,preventing bacterial dissemination. Furthermore, cross-presentation of Salmonella antigens was inferred as amechanism that results in a rapid clearance of pathogen by cytotoxic T cells. In summary, although the SalmonellaTyphimurium strain employed in this study was able to express some of its major virulence effectors in porcineMLN, a combination of early innate and adaptive immunity mechanisms might overcome virulence strategiesemployed by the pathogen, enabling the host to protect itself against bacterial spread beyond gut-associatedlymph-nodes. Interestingly, we deduced that clathrin-mediated endocytosis could contribute to mechanisms ofpathogen virulence and/or host defence in MLN of Salmonella infected swine. Taken together, our results are usefulfor a better understanding of the critical protective mechanisms against Salmonella that occur in porcine MLN toprevent the spread of infection beyond the intestine.
IntroductionInfections by Salmonella are a major health problem in thedeveloping and developed world. In the European Union,despite the current decreasing trend of human cases,Salmonella persists as the main cause of food-borne out-breaks [1]. Pork is considered to be a significant source ofSalmonella to humans next to eggs and poultry meat [2].Indeed, according to the European food safety authority(EFSA), Salmonella enterica serovar Typhimurium (hereinSalmonella Typhimurium) is the second serovar mostfrequently reported in human salmonellosis and infection
by this pathogen is mostly associated with the consump-tion of contaminated pork [1].Since the food industry and direct contact with infected
animals represent the main sources of non-typhoidSalmonella [3], prevention of human salmonellosisdepends significantly on decreasing the prevalence ofinfection in livestock hosts [4]. Salmonella Typhimuriuminfected pigs generally carry this serotype asymptomati-cally in the tonsils, intestines and gut-associated lymph-oid tissue, posing an important threat to animal andhuman health [5]. Epidemiological studies assert thatSalmonella prevalence in slaughter swine lymph nodesvaries widely at the country level, ranging from0 to 29%[2]. Although salmonellosis in pigs has been the subjectof intensive research [5], a thorough knowledge of thepathogenesis of porcine infections with broadhost rangeSalmonella serotypes is still necessary. A combination of
* Correspondence: [email protected] de Genómica y Mejora Animal, Departamento de Genética, Facultadde Veterinaria, Universidad de Córdoba, Campus de Rabanales, EdificioGregor Mendel C5, 14071, Córdoba, SpainFull list of author information is available at the end of the article
VETERINARY RESEARCH
© 2013 Martins et al.; licensee BioMed Central Ltd. This is an open access article distributed under the terms of the CreativeCommons Attribution License (http://creativecommons.org/licenses/by/2.0), which permits unrestricted use, distribution, andreproduction in any medium, provided the original work is properly cited.
Martins et al. Veterinary Research 2013, 44:120http://www.veterinaryresearch.org/content/44/1/120
node in the network diagram represented a gene and itsrelationship with other molecules was represented by aline (solid and dotted lines represent direct and indirectassociation respectively). Nodes with a red backgroundwere input genes detected in this study while greynodes were molecules inserted by IPA based upon theIngenuity Knowledge Base to produce a highly connectednetwork. The score estimated the probability that acollection of genes equal to or greater than the numberin a network could be achieved by chance alone. Scoresof 3 or higher were considered to have a 99.9% confi-dence of not being generated by random chance alone.For statistical analysis of enriched functions/pathways, anIPA Knowledge Base was used as a reference set and theFisher’s exact test was employed to estimate the signifi-cance of association. P-values below 0.05 were consideredstatistically significant. For graphical representation ofthe canonical pathways, the ratio indicates the percentageof genes taking part in a pathway that could be found inan uploaded data set and –log(p-value) means the levelof confidence of association. The threshold line repre-sented a p-value of 0.05.
Relative gene expression analysis by qPCRReal-time quantitative PCR (qPCR) assays were per-formed as previously described [11]. Fold change valueswere calculated by the 2−ΔΔCq method [17] using beta-actin as the reference gene. Afterwards, data were stan-dardized as proposed by Willems et al. [18] and analyzedby Kruskal–Wallis and Mann–Whitney tests using thesoftware SPSS 15.0 for Windows (SPSS Inc, Chicago, IL,
USA). Fold changes of 1 denoted no change in geneexpression. Values lower and higher than 1 denoteddown and up-regulation respectively. To be representedin Table 1, a fold change of down-regulated geneswas calculated as −1/2−ΔΔCq. Primer pairs used foramplifications can be found as supporting information(see Additional file 1).
Western blot analysisFor protein extractions, MLN samples from all experi-mental animals were separately homogenized on ice withlysis buffer (7 M urea, 2 M thiourea, 4% w/v CHAPS,0.5 mM PMSF) using a glass tissue-lyser and proteinlysate concentration was determined using a BradfordProtein Assay (Bio-Rad). Subsequently, protein from in-dividual replicates belonging to the same group waspooled (30 ug total), electrophoretically fractionated in12% (w/v) SDS-PAGE gels and transferred onto a PVDFmembrane (Millipore, Bedford, MA, USA). Western blotassays were carried out as described by Martins et al.[10] employing the following primary antibodies: 4B7/8for swine histocompatibility class I antigen (SLAI) detec-tion [19], 1 F12 for swine histocompatibility class IIantigen (SLAII) detection [19], anti-CTLA4 (Epitomics,Burlingame, CA, USA) and anti-Clathrin light chain(ab24579, Abcam, Cambridge, UK). To confirm equalsample loading, membranes were reblotted with anti-GAPDH monoclonal antibody (GenScript, Picastaway,NJ, USA) and no statistical differences for GAPDHabundance were observed between groups in all assays.Membranes were scanned in an FLA-5100 imager
Table 1 Microarray data validation by qPCR.Gene MICROARRAY qPCR
Fold change BF Fold change p-value
1 dpi 2 dpi 6 dpi 1 dpi 2 dpi 6 dpi
CD180 1.7 2.6 1.5 0.0000429 1.1 1.8 1.2 0.010
CD1A 1.1 −1.4 1.2 0.00047793 −1.4 −2.5 1.2 0.013
DAB2 −1.2 −2.6 −1.2 6.62E-13 −3.1 −6.5 −2.6 0.001
EIF4H −1.1 −1.1 −1.1 0.0000101 −1.5 −1.4 −1.8 0.021
ENPP6 1.3 2.0 −1.2 0.0000448 1.2 1.8 −1.7 0.000
F13A1 1.4 2.2 −1.1 0.00000227 1 1.7 −2.2 0.012
HLA-Bb 1.0 −1.1 −1.2 0.00023747 −1.4 −1.4 −1.9 0.047
HLA-DRB5b 1.0 −1.1 1.0 0.0000311 −1.4 −1.6 −2 0.036
HSPA1Ba 3.3 1.4 −1.1 0.0001166 2.5 1.4 −1.3 0.025
HSPH1 2.3 1.7 −1.0 0.00000424 1.5 1.1 −2 0.003
IL16 −1.0 −1.2 −1.1 8.12E-07 1 −1.1 −1.5 0.035
LPCAT2 1.2 2.3 1.0 0.0000146 1.4 2 −1.3 0.010
PSMC2 −1.0 −1.0 −1.1 0.00105861 −1.1 −1.4 −1.8 0.036
TRAC −1.0 −1.1 −1.1 0.00000951 −1.5 −1.8 −1.8 0.010aData from microarray analysis are mean values from two different probes. bAmplified with SLA-B and SLA-DRB5 primers.
Martins et al. Veterinary Research 2013, 44:120 Page 3 of 14http://www.veterinaryresearch.org/content/44/1/120
A miRNA Signature Predictive of Early Recurrence
PLOS ONE | www.plosone.org 5 March 2014 | Volume 9 | Issue 3 | e91884
Microarray de miRNA de Affymetrix
6
A microRNA Signature Associated with Early Recurrencein Breast CancerLuis G. Perez-Rivas1., Jose M. Jerez2., Rosario Carmona3, Vanessa de Luque1, Luis Vicioso4,
M. Gonzalo Claros3,5, Enrique Viguera6, Bella Pajares1, Alfonso Sanchez1, Nuria Ribelles1,
Emilio Alba1, Jose Lozano1,5*
1 Laboratorio de Oncologıa Molecular, Servicio de Oncologıa Medica, Instituto de Biomedicina de Malaga (IBIMA), Hospital Universitario Virgen de la Victoria, Malaga,
Spain, 2 Departamento de Lenguajes y Ciencias de la Computacion, Universidad de Malaga, Malaga, Spain, 3 Plataforma Andaluza de Bioinformatica, Universidad de
Malaga, Malaga, Spain, 4 Servicio de Anatomıa Patologica, Instituto de Biomedicina de Malaga (IBIMA), Hospital Universitario Virgen de la Victoria, Malaga, Spain,
5 Departmento de Biologıa Molecular y Bioquımica, Universidad de Malaga, Malaga, Spain, 6 Departmento of Biologıa Celular, Genetica y Fisiologıa Animal, Universidad de
Malaga, Malaga, Spain
Abstract
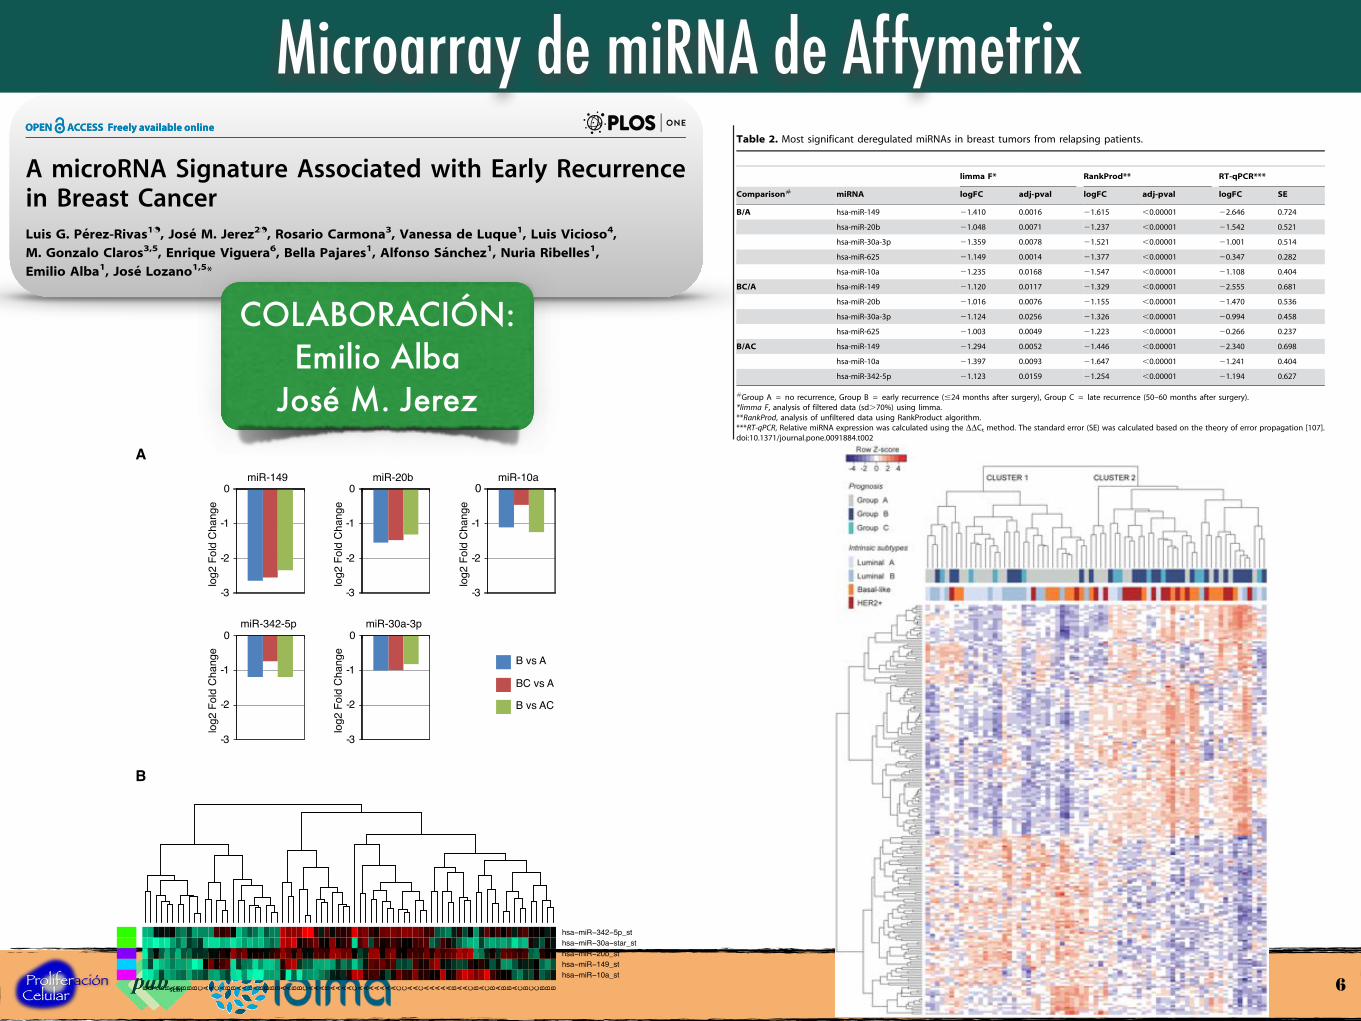
Recurrent breast cancer occurring after the initial treatment is associated with poor outcome. A bimodal relapse patternafter surgery for primary tumor has been described with peaks of early and late recurrence occurring at about 2 and 5 years,respectively. Although several clinical and pathological features have been used to discriminate between low- and high-riskpatients, the identification of molecular biomarkers with prognostic value remains an unmet need in the currentmanagement of breast cancer. Using microarray-based technology, we have performed a microRNA expression analysis in71 primary breast tumors from patients that either remained disease-free at 5 years post-surgery (group A) or developedearly (group B) or late (group C) recurrence. Unsupervised hierarchical clustering of microRNA expression data segregatedtumors in two groups, mainly corresponding to patients with early recurrence and those with no recurrence. Microarraydata analysis and RT-qPCR validation led to the identification of a set of 5 microRNAs (the 5-miRNA signature) differentiallyexpressed between these two groups: miR-149, miR-10a, miR-20b, miR-30a-3p and miR-342-5p. All five microRNAs weredown-regulated in tumors from patients with early recurrence. We show here that the 5-miRNA signature defines a high-riskgroup of patients with shorter relapse-free survival and has predictive value to discriminate non-relapsing versus early-relapsing patients (AUC = 0.993, p-value,0.05). Network analysis based on miRNA-target interactions curated by publicdatabases suggests that down-regulation of the 5-miRNA signature in the subset of early-relapsing tumors would result inan overall increased proliferative and angiogenic capacity. In summary, we have identified a set of recurrence-relatedmicroRNAs with potential prognostic value to identify patients who will likely develop metastasis early after primary breastsurgery.
Citation: Perez-Rivas LG, Jerez JM, Carmona R, de Luque V, Vicioso L, et al. (2014) A microRNA Signature Associated with Early Recurrence in Breast Cancer. PLoSONE 9(3): e91884. doi:10.1371/journal.pone.0091884
Editor: Sonia Rocha, University of Dundee, United Kingdom
Received November 11, 2013; Accepted February 14, 2014; Published March 14, 2014
Copyright: ! 2014 Perez-Rivas et al. This is an open-access article distributed under the terms of the Creative Commons Attribution License, which permitsunrestricted use, distribution, and reproduction in any medium, provided the original author and source are credited.
Funding: This work was supported by a grant from the Spanish Society of Medical Oncology (SEOM, to NR) and by grants from the Spanish Ministerio deEconomıa, (SAF2010-20203 to J.L and TIN2010-16556 to J.J) and from the Junta de Andalucıa (TIN-4026, to JJ). The funders had no role in study design, datacollection and analysis, decision to publish, or preparation of the manuscript.
Competing Interests: The authors have declared that no competing interests exist.
* E-mail: [email protected]
. These authors contributed equally to this work.
Introduction
Breast cancer comprises a group of heterogeneous diseases thatcan be classified based on both clinical and molecular features [1–5]. Improvements in the early detection of primary tumors and thedevelopment of novel targeted therapies, together with thesystematic use of adjuvant chemotherapy, has drastically reducedmortality rates and increased disease-free survival (DFS) in breastcancer. Still, about one third of patients undergoing breast tumorexcision will develop metastases, the major life-threatening eventwhich is strongly associated with poor outcome [6,7].
The risk of relapse after tumor resection is not constant overtime. A detailed examination of large series of long-term follow-upstudies over the last two decades reveals a bimodal hazard functionwith two peaks of early and late recurrence occurring at 1.5 and 5
years, respectively, followed by a nearly flat plateau in which therisk of relapse tends to zero [8–10]. A causal link between tumorsurgery and the bimodal pattern of recurrence has been proposedby some investigators (i.e. an iatrogenic effect) [11]. According tothat model, surgical removal of the primary breast tumor wouldaccelerate the growth of dormant metastatic foci by altering thebalance between circulating pro- and anti-angiogenic factors[9,11–14]. Such hypothesis is supported by the fact that the twopeaks of relapse are observed regardless other factors than surgery,such as the axillary nodal status, the type of surgery or theadministration of adjuvant therapy. Although estrogen receptor(ER)-negative tumors are commonly associated with a higher riskof early relapse [15], the bimodal distribution pattern is observedwith independence of the hormone receptor status [16]. Otherstudies also suggest that the dynamics of tumor relapse may be a
PLOS ONE | www.plosone.org 1 March 2014 | Volume 9 | Issue 3 | e91884
clinical outcome intermediate between no recurrence (group A)and early recurrence (group B), the wide distribution of tumorsfrom group C within clusters 1 and 2 could reflect that variation atthe molecular level. An alternative explanation is that group Ccannot not be identified by a distinct miRNA expression profiledue to either its intrinsic molecular nature or the lower samplesize. Of note, tumors tend to cluster according to their ER statusand thus, most luminal tumors (ER+) were grouped in cluster 1while cluster 2 mainly included HER2+ and basal-like tumors,which are both ER- (Figure 1). Multiple pairwise comparison testsshowed that the largest expression differences occurred betweenluminal A and basal-like tumors. Consequently, the largest list ofcandidate miRNAs was obtained after comparing luminal A versusbasal-like or basal-like versus the other subtypes (SupplementaryTable S1). Overall, these results suggest that the three groups oftumors (A, B and C) represent distinct biological entities. They arealso in accordance with accumulating evidence indicating thatmiRNA signatures can be associated to intrinsic molecularsubtypes, supporting its use as a valuable tool for cancer diagnosisand prognosis [3,43,70,71].
In order to select the statistically significant and differentiallyexpressed miRNAs from Fig. 1, paired and multiple comparisonsamong the prognosis groups A, B and C were performed. Twodifferent approaches, limma and RankProd Bioconductor, wereemployed. Only those candidates with a fold change (FC).2(either up- or down-regulated) and an adjusted p-value,0.05 wereselected (Table 2). Thus, comparison of the logFC and p-valuesobtained with both limma and RankProd libraries led to theidentification of miR-149, miR-20b, miR-30a-3p, miR-342-5p,
miR-625 and miR-10a as the miRNAs that most significantlychanged their expression when comparing tumors from disease-free patients versus relapsing patients, i.e. group B vs A or BC vs A(Table 2). As we had observed in the hierarchical clustering(Figure 1), the largest differences in expression of the six miRNAswere again detected when comparing B vs A (Table 2). In contrast,paired comparisons of either group A or B with the group C didnot result in any statistically significant miRNA. Notably, therelative levels of all the candidate miRNAs were lower in samplesfrom group B compared to the others, suggesting that thesemiRNAs could act, directly or indirectly, as suppressors ofmetastasis. Other researchers have also observed a generaldown-regulation of miRNA levels in breast cancer [72].
Regarding the intrinsinc subtypes, we found lower levels ofmiR-149, miR-30a-3p and miR-342-5p in ER- tumors (Supple-mentary Table S1). In that respect, others have shown repressionof miR-149 levels in basal-like and HER2+ tumors [70,73,74]. andoverexpression of miR-342-5p in ER+ breast tumors [75]. Jansenet al. found an association between miR-342-5p and ERexpression in lymph node negative breast disease, with a strongdownregulation in basal-like tumors. They also showed an inverserelationship between the mitotic index and both miR-30a-3p andmiR-342-5p [76].
Differential expression of all six miRNAs were also determinedby RT-qPCR in the three prognosis groups (Table 2). With theexception of miR-625, which could not be validated, miR-149,miR-20b, miR10a, miR-30a-3p and miR-342-5p (the ‘‘5-miRNAsignature’’, from now on) were all confirmed to be down-regulatedin tumors from relapsing patients (groups B or C) when compared
Figure 1. MicroRNA expression profiles in primary breast tumors from patients with different prognosis. Total RNA was obtained from71 breast tumors, converted to cDNA and hybridized to Affymetrix miRNA Chip Array 2.0. After normalization, differential miRNA expression data wasanalysed by unsupervised hierarchical clustering. Color bars on top of the heatmap refer to the prognostic group and intrinsic subtype of each tumor.Group A included tumors from patients who were disease-free $60 months after surgery, group B included tumors from early-relapsing patients(#24 months) and group C included tumors from late-relapsin patients (50–60 months after surgery). Tumors grouped in two main clusters (cluster 1and cluster 2), showing opposite expression profiles and strongly associated with prognosis groups. Thus, cluster 1 included most luminal and/ornon-relapsing tumors while cluster 2 mostly included basal-like and/or early-relapsing tumors.doi:10.1371/journal.pone.0091884.g001
Table 2. Most significant deregulated miRNAs in breast tumors from relapsing patients.
limma F* RankProd** RT-qPCR***
Comparison# miRNA logFC adj-pval logFC adj-pval logFC SE
B/A hsa-miR-149 21.410 0.0016 21.615 ,0.00001 22.646 0.724
hsa-miR-20b 21.048 0.0071 21.237 ,0.00001 21.542 0.521
hsa-miR-30a-3p 21.359 0.0078 21.521 ,0.00001 21.001 0.514
hsa-miR-625 21.149 0.0014 21.377 ,0.00001 20.347 0.282
hsa-miR-10a 21.235 0.0168 21.547 ,0.00001 21.108 0.404
BC/A hsa-miR-149 21.120 0.0117 21.329 ,0.00001 22.555 0.681
hsa-miR-20b 21.016 0.0076 21.155 ,0.00001 21.470 0.536
hsa-miR-30a-3p 21.124 0.0256 21.326 ,0.00001 20.994 0.458
hsa-miR-625 21.003 0.0049 21.223 ,0.00001 20.266 0.237
B/AC hsa-miR-149 21.294 0.0052 21.446 ,0.00001 22.340 0.698
hsa-miR-10a 21.397 0.0093 21.647 ,0.00001 21.241 0.404
hsa-miR-342-5p 21.123 0.0159 21.254 ,0.00001 21.194 0.627
#Group A = no recurrence, Group B = early recurrence (#24 months after surgery), Group C = late recurrence (50–60 months after surgery).*limma F, analysis of filtered data (sd.70%) using limma.**RankProd, analysis of unfiltered data using RankProduct algorithm.***RT-qPCR, Relative miRNA expression was calculated using the DDCt method. The standard error (SE) was calculated based on the theory of error propagation [107].doi:10.1371/journal.pone.0091884.t002
A miRNA Signature Predictive of Early Recurrence
PLOS ONE | www.plosone.org 6 March 2014 | Volume 9 | Issue 3 | e91884
B B A B B A B B B B C A A C A B B A A B A B B B B A A B B C A A A B A A A A C A A A A A A A C C A A C A A A A A B A A C B A C B A B B A C B C C B B B
hsa−miR−10a_sthsa−miR−149_sthsa−miR−20b_sthsa−miR−30a−star_sthsa−miR−342−5p_st
Pérez-Rivas et al., Figure 2
-3
-2
-1
0miR-10a
log2
Fol
d C
hang
e
-3
-2
-1
0miR-149
log2
Fol
d C
hang
e
-3
-2
-1
0miR-20b
log2
Fol
d C
hang
e
-3
-2
-1
0miR-30a-3p
log2
Fol
d C
hang
e
-3
-2
-1
0miR-342-5p
log2
Fol
d C
hang
e
B vs A
BC vs A
B vs AC
A
B
COLABORACIÓN: Emilio Alba
José M. Jerez
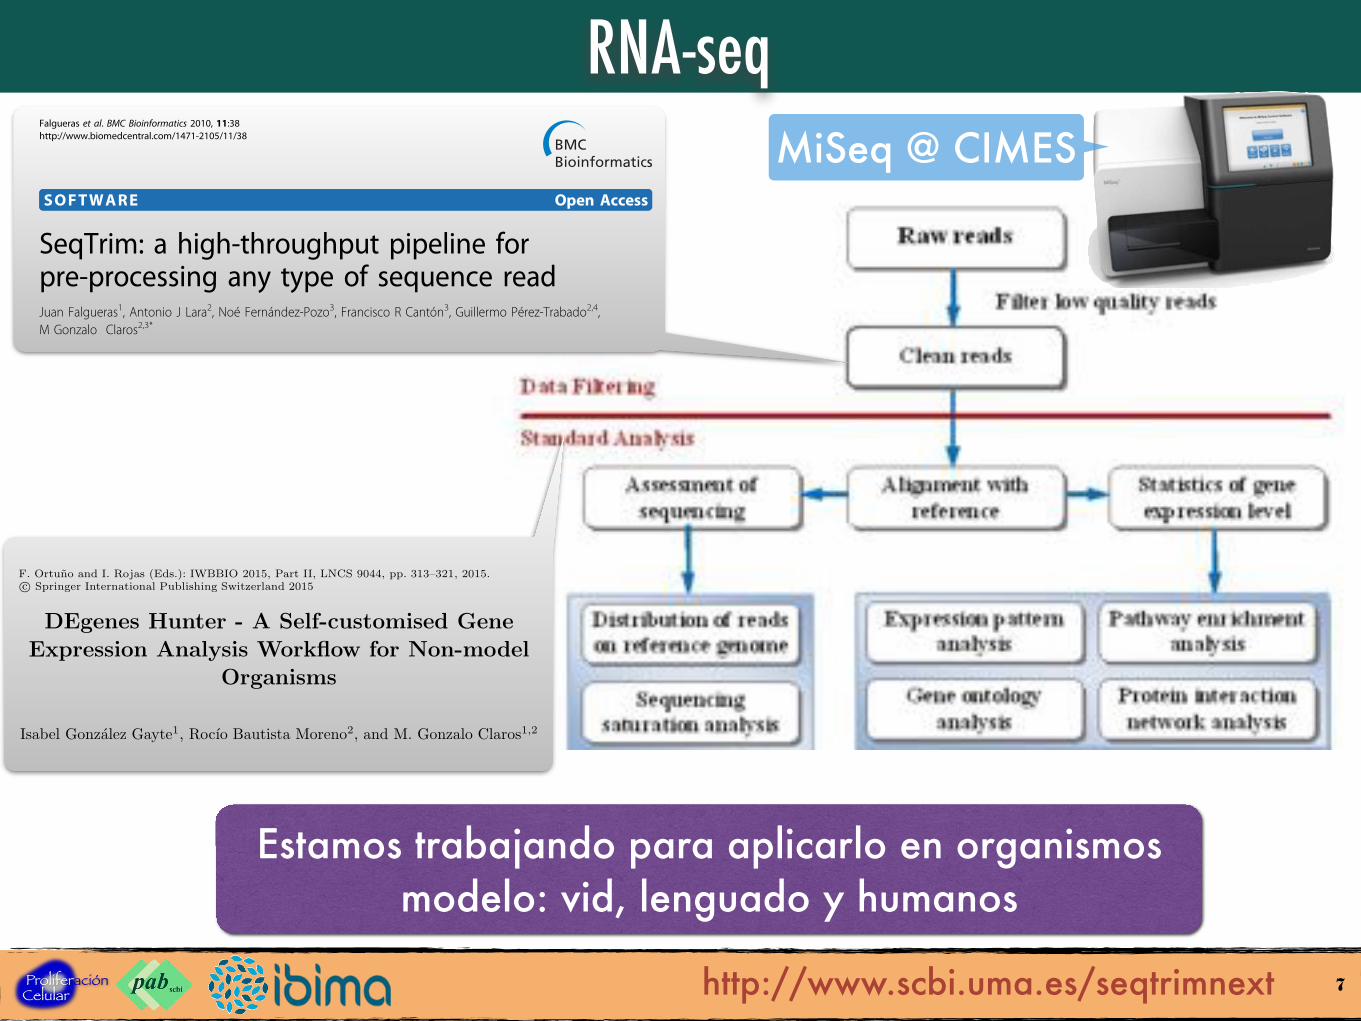
RNA-seq
7
SOFTWARE Open Access
SeqTrim: a high-throughput pipeline forpre-processing any type of sequence readJuan Falgueras1, Antonio J Lara2, Noé Fernández-Pozo3, Francisco R Cantón3, Guillermo Pérez-Trabado2,4,M Gonzalo Claros2,3*
Abstract
Background: High-throughput automated sequencing has enabled an exponential growth rate of sequencingdata. This requires increasing sequence quality and reliability in order to avoid database contamination withartefactual sequences. The arrival of pyrosequencing enhances this problem and necessitates customisable pre-processing algorithms.
Results: SeqTrim has been implemented both as a Web and as a standalone command line application. Already-published and newly-designed algorithms have been included to identify sequence inserts, to remove low quality,vector, adaptor, low complexity and contaminant sequences, and to detect chimeric reads. The availability ofseveral input and output formats allows its inclusion in sequence processing workflows. Due to its specificalgorithms, SeqTrim outperforms other pre-processors implemented as Web services or standalone applications. Itperforms equally well with sequences from EST libraries, SSH libraries, genomic DNA libraries and pyrosequencingreads and does not lead to over-trimming.
Conclusions: SeqTrim is an efficient pipeline designed for pre-processing of any type of sequence read, includingnext-generation sequencing. It is easily configurable and provides a friendly interface that allows users to knowwhat happened with sequences at every pre-processing stage, and to verify pre-processing of an individualsequence if desired. The recommended pipeline reveals more information about each sequence than previouslydescribed pre-processors and can discard more sequencing or experimental artefacts.
BackgroundSequencing projects and Expressed Sequence Tags(ESTs) are essential for gene discovery, mapping, func-tional genomics and for future efforts in genome anno-tations, which include identification of novel genes, genelocation, polymorphisms and even intron-exon bound-aries. The availability of high-throughput automatedsequencing has enabled an exponential growth rate ofsequence data, although not always with the desiredquality. This exponential growth is enhanced by the socalled “next-generation sequencing”, and efforts have tobe made in order to increase the quality and reliabilityof sequences incorporated into databases: up to 0.4% ofsequences in nucleotide databases contain contaminantsequences [1,2]. The situation is even worse in the ESTdatabases, where vector contamination rate reach 1.63%
of sequences [3]. Hence, improved and user friendlybioinformatic tools are required to produce more reli-able high-throughput pre-processing methods.Pre-processing includes filtering of low-quality
sequences, identification of specific features (such aspoly-A or poly-T tails, terminal transferase tails, andadaptors), removal of contaminant sequences (from vec-tor to any other artefacts) and trimming the undesiredsegments. There are some bioinformatic tools that canaccomplish individual pre-processing aspects (e.g. Trim-Seq, TrimEST, VectorStrip, VecScreen, ESTPrep [4],crossmatch, Figaro [5]), and other programs that copewith the complete pre-processing pipeline such asPreGap4 [6] or the broadly used tools Lucy [7,8] andSeqClean [9]. Most of these require installation, are dif-ficult to configure, environment-specific, or focused onspecific needs (like a design only for ESTs), or require achange in implementation and design of either the pro-gram or the protocols within the laboratory itself.
* Correspondence: [email protected] Andaluza de Bioinformática, Universidad de Málaga, 29071Málaga, Spain
Falgueras et al. BMC Bioinformatics 2010, 11:38http://www.biomedcentral.com/1471-2105/11/38
© 2010 Falgueras et al; licensee BioMed Central Ltd. This is an Open Access article distributed under the terms of the CreativeCommons Attribution License (http://creativecommons.org/licenses/by/2.0), which permits unrestricted use, distribution, andreproduction in any medium, provided the original work is properly cited.
DEgenes Hunter - A Self-customised GeneExpression Analysis Workflow for Non-model
Organisms
Isabel Gonzalez Gayte1, Rocıo Bautista Moreno2, and M. Gonzalo Claros1,2
1 Departamento de Biologıa Molecular y Bioquımica, Universidad de Malaga,29071 Malaga, Spain
2 Plataforma Andaluza de Bioinformatica, Centro de Supercomputacion yBioinnovacion, Universidad de Malaga,
29071 Malaga, Spain
Abstract. Data from high-throughput RNA sequencing require the de-velopment of more sophisticate bioinformatics tools to perform optimalgene expression analysis. Several R libraries are well considered for differ-ential expression analyses but according to recent comparative studies,there is still an overall disagreement about which one is the most appro-priate for each experiment. The applicable R libraries mainly depend onthe presence or not of a reference genome and the number of replicatesper condition. Here it is presented DEgenes Hunter, a RNA-seq analysisworkflow for the detection of differentially expressed genes (DEGs) inorganisms without genomic reference. The first advantage of DEgenesHunter over other available solutions is that it is able to decide the mostsuitable algorithms to be employed according to the number of biologicalreplicates provided in the sample. The different workflow branches allowits automatic self-customisation depending on the input data, when usedby users without advanced statistical and programming skills. All appli-cable libraries served to obtain their respective DEGs and, as anotheradvantage, genes marked as DEGs by all R packages employed are consid-ered ‘common DEGs’, showing the lowest false discovery rate comparedto the ‘complete DEGs’ group. A third advantage of DEgenes Hunter isthat it comes with an integrated quality control module to discard ordisregard low quality data before and after preprocessing. The ‘commonDEGs’ are finally submitted to a functional gene set enrichment analysis(GSEA) and clustering. All results are provided as a PDF report.
Keywords: RNA-seq, R, pipeline, workflow, differential expression,bioinformatic tool, functional analysis.
1 Introduction
Nowadays, high-throughput technologies are well considered for genetic stud-ies. For the analysis of gene expression profiles, data are obtained from RNAsequencing (RNA-seq) experiments. RNA-seq provides precise measurements of
F. Ortuno and I. Rojas (Eds.): IWBBIO 2015, Part II, LNCS 9044, pp. 313–321, 2015.c⃝ Springer International Publishing Switzerland 2015
http://www.scbi.uma.es/seqtrimnext
MiSeq @ CIMES
Estamos trabajando para aplicarlo en organismos modelo: vid, lenguado y humanos
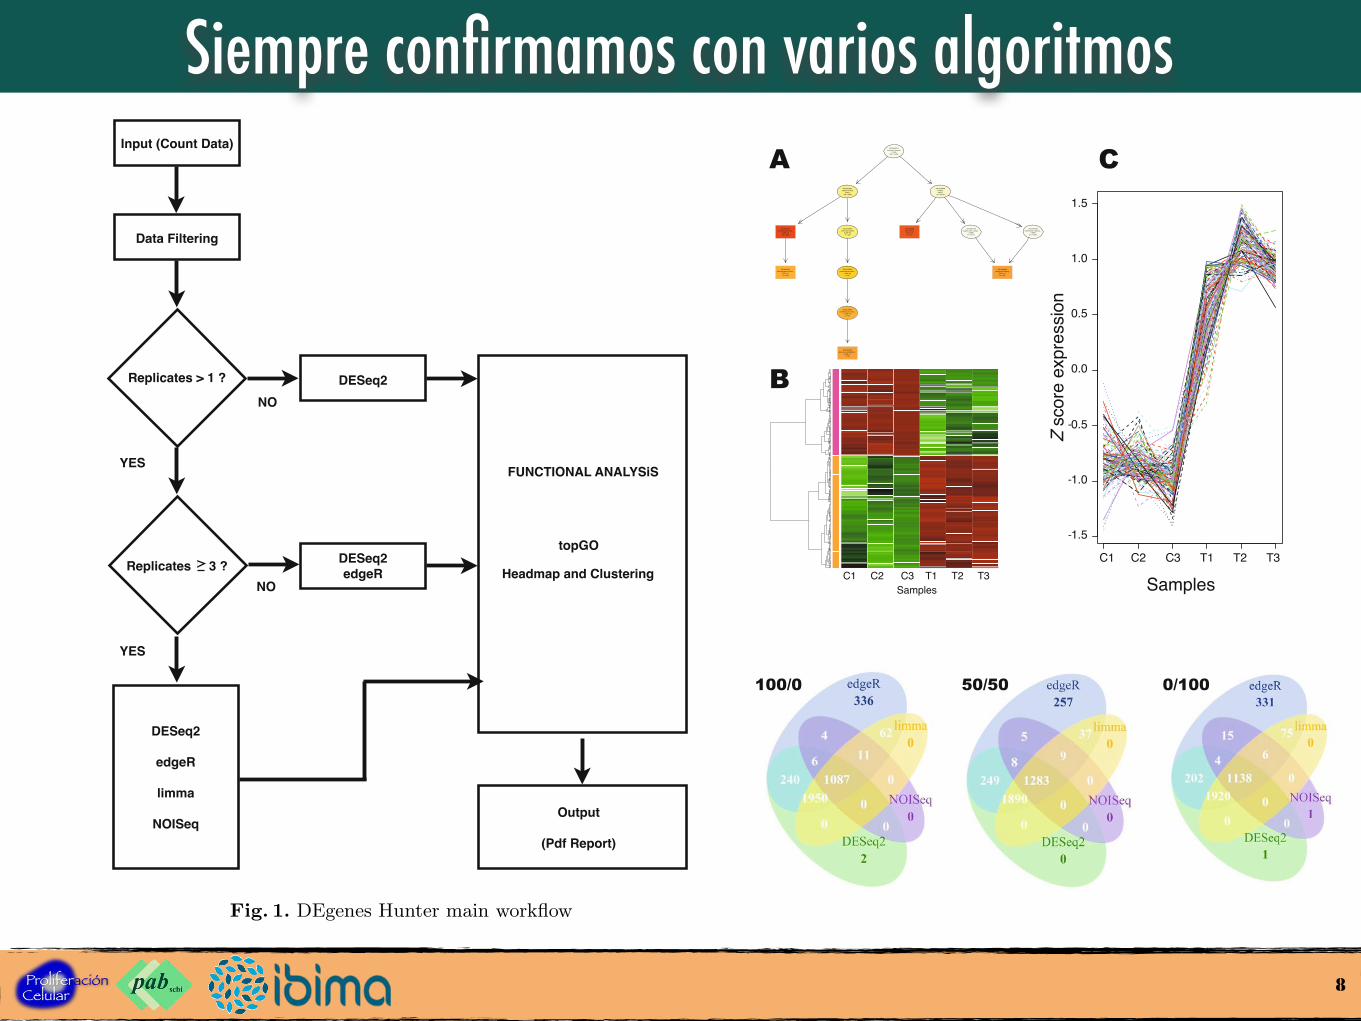
Siempre confirmamos con varios algoritmos
8
DEgenes Hunter - A Self-customised Gene Expression Analysis Workflow 315
Input (Count Data)
Data Filtering
Replicates > 1 ?
Replicates 3 ?
DESeq2
edgeR
limma
NOISeq
DESeq2
DESeq2edgeR
FUNCTIONAL ANALYSiS
topGO
Headmap and Clustering
Output
(Pdf Report)
YES
YES
NO
NO
Fig. 1. DEgenes Hunter main workflow
2 Methods
2.1 Data Import
DEgenes Hunter requires as input data the matrix count. Raw counts of se-quencing reads can be imported in a tab-delimited file in the form of a matrixof integer values, but a BAM file would be used in a near future. For the GSEAanalysis, an annotation file as well as a file containing the mapping that asso-ciates gene ontology (GO) terms for each gene are required as tab-delimited files.Gene name or COG rows can also be present for more complete GSEA analyses.
DEgenes Hunter - A Self-customised Gene Expression Analysis Workflow 317
GO:0003674molecular_function
1.0000225 / 41433
GO:0003824catalytic activity
0.0012128 / 19303
GO:0004347glucose−6−phosphate ...
2.02e−117 / 22
GO:0004497monooxygenase activi...
9.77e−1115 / 294
GO:0005488binding0.9677
127 / 25778
GO:0008289lipid binding8.45e−1629 / 797
GO:0016491oxidoreductase activ...
3.08e−1950 / 2066
GO:0016853isomerase activity
3.28e−0511 / 440
GO:0016860intramolecular oxido...
1.68e−088 / 82
GO:0016861intramolecular oxido...
4.79e−108 / 53
GO:0046906tetrapyrrole binding
6.07e−1116 / 335
GO:0097159organic cyclic compo...
0.998257 / 14111
GO:1901363heterocyclic compoun...
0.998157 / 14093
1 2 3 4 5 6
−1.5
−1.0
−0.5
0.0
0.5
1.0
1.5
sampleSamples
1.5
1.0
0.5
0.0
–0.5
–1.0
–1.5
Z sc
ore
expr
essio
n
C1 C2 C3 T1 T2 T3
A
B
C
SamplesC1 C2 C3 T1 T2 T3
Fig. 2. Example analyses that can be performed with DEgenes Hunter on the ‘commonDEGs’ group. A: A GSEA analysis performed with topGO, where rectangle colourrepresents the relative significance, ranging from dark red (most significant) to brightyellow (least significant). B: A typical heatmap that can also be used as a qualitycontrol to verify that control samples (C1, C2 and C3) and treatment samples (T1, T2and T3) are grouped together. C: Expression clustering performed using cluster wherethe genes have similar expression levels among control samples, and a clearly highervalue in treatment samples.
3.2 Performance Testing
Utility of ‘common DEGs’ group was confirmed comparing their FDR values.Figure 3 shows that the FDR for ‘common DEGs’ is considerably lower thanfor ‘complete DEGs’ and ‘non-common DEGs’ using separately any R package.Since there is no clear way to set the threshold for qNOISeq [15], it is very highin all cases.
DEgenes Hunter - A Self-customised Gene Expression Analysis Workflow 319
100/0 50/50 0/100
Fig. 4. Venn diagrams showing the numbers of DEGs found in synthetic data whendifferent DEG ratios are used. 100/0 corresponds to all over-expressed/none repressed,50/50 is the balanced ratio, and 100/0 corresponds to none over-expressed/all re-pressed.
� ���� �� � �� �� � ��� �� ���� �� � ��� �� ����� �� � �� � �� ���� � ���� �� ���� �� �� ���� � ��
�
� ��� � ������ �� �� ��� �� ��� �� ��� �� ��� � �� �� ���� �� ����� �� �� �� ���� ���� �� �� �� ��� ���� � �� ��� � �� � ����� ������ �� �� � ����� ��� �� � ��� �� ���� �� �� ����� � ��� �� ��� �� �
�
�� ��� ��� � �� �� ���� � ��� �� �� � �� �� ���� ��� �� �� � ��� �� �� � � ��� �� �� ���� ��� �� � �� ��� ������� ��� ��� �� � �� ����� ���� ���� �� � �� ���� ����� � � ��� �� � �� � �� �� � �� �� �������� �� �� � �� ���� �� � ��� � ����� ���� � ���� � ��� ������ � �� � ��� �� ��� �� ���� ��� � ��� ��� ��� ��� � ��� ��� �� ��� � ����� ��� � ��� �� � �� �� � ����� � �� � ��� � �� �� ��� ��� � �� ��� ��� ��� �� ���� � �� ����� � ��� �� �� ��� � ������ �� �� ��� �� ����� �� ��� ���� �� �� � �� � �� ���� �� ��� �� ��� � ���� �� �� � �� �� �� ���� � � �� ��� ��� ��� �� ��� ����� ���� �� �� � ���� ��� � ��� �� �� �� � �� �� � � ��� �� �� �� ���� � �� � �� �� ����� ��� �� �� � �� � �� ��� �� ��� ��� ��
�
� �� �� � ����� � ���� �� �� � �� �� � �� �� ���� �� ��� ��� �� �� ��� �� �� � ��� �� �� � ��� �
�
�� �� � ��� �� �� �� ���� ��� � � �� ���� � ��
�
��� ���� ��� ���� � � ��� �� �� �� �� ��� �� ���� �� ��� �� ��� �� ���� ����� �� ���� ��� ��� ������ �� � ���� ���� �� ��� �� � ������� ���� � �� ��������� �� ��� � � �� � �� �� � � �� ��� � ��� � �� �� � ��� ��� �� �� � ��� ��� ���� � �� �� �� �� � ��� � ����� ���� �� ��� ����� � ���� ��� � ���� ���� ���� �� ��� ��� �� � �� �� ���� � ���� ��� �� � �� �� �� �� ��� ��� � � ��� �� ��� � ���� ��� �� �� � ���� �� �� ��� � ��� �� � ���� �� �� � � �� �� �� �� ��� � �� ���� �� � ��� �� � � ��� � �� �� � � ��� ��� � ��� ��� � ��� ��� � � ���� ��� � ��� ��� � ��� �� � � �� ���� ��� � �� � �� � ��� ��� �� � ���� � � ��� � ��� �� ���� � ������ ��� �� �� � � �� �� ��� ������ �� ��� �� ������ �� ��� � �� ���� � ��� � � �� ��� �� �� ��� �� �� ���� � ����� �� �� ��� �� �� �� ����� ��� ��� �� �� ��� �� �� ��� � �� � ���� �� ���� �� � ���� �� � ���� ��� �� �� ����� ��� � �� ��� � ��� ����� � ������ �� � �� �� ��� ���� �� ���� ���� � �� ��� ��� ��� �� ��� � �� ���� �� �� ��� �� ��� ��� � � �� �� �� ��� �� ���� �� ��� � ��� �� ���� ���� �� ��� ��� �� ��� � �� ��� �� � �� �� �� �� ��� �� �� � ���� � ��� �� ���� ���� ���� ���� � ��� ��� � �� � �� ��� ��� � �� � �� � ��� ���� � ��� � � �� ��� � ��� �� ��� ��� �� � ���� ��� ��� � �� ��� ���� ��� �� ��� ��� �� �� ����� � �� �� �� ���� � �������� �� �� ���� �� �� �� �� �� � ���� � ������ � � � � ��� �� �� ������ �� � ��� �� � ���� �� ��� �������� ��� ��� ��� �� ��� � ��� �� � �� �� � ��� �� �� ��� �� ��� � ��� �� ��� � � ���� ���� �� � � ��� �� �� � �� �� ���� ����� �� ��� ��� ��� � ��� ��� ����� ���� � �� �� �� �� �� �� ���� ��� �� � ���� �� � ���� �� �� � �� ���� �� � �� ��� �� �� ���� ��� � ��� ��� �� ��� � ����� �� � � ������ � �� � �� �� �� ���� �� ����� ��� �� ����� �� �� ��� �� ���� �� �� � ��� � ����� ��� �� ��� �� ���� ��� �� ���� � ����� � �� �� ��� ��� ��� � ��� �� �� �� �� �� � ����� �� �� �� � ����� ���� � �� ��� ��� �� �� �� �� � �� ������� � �� ��� � ��� � ����� �� � ��� �� ����� �� �� ���� �� ���� �� � ��� ���� ��� ��� �� � ���� ��� � ����� � ���� ��� �� ��� ��� ���� �� ��� �� �� � �� ��� ����� �� ��� � �� �� ��� � ����� �� �� � �� � �� �� �� � �� � ��� ���� �� �� ��� ��� � �� �� �� ����� � �� �� �� ��� ��� � �� �� �� �� ���� � �� ���� � ��� �� � ��� ��� � � ��� � ���� �� ��� ���� � ������ ��� ��� �� ��� � ������� �� �� �� ��� �� �� �� ����� ��� ���� � � ��� � �� �� ��� �� ����� �� ��� � ��� �� ������ ��� ���� �� �� �� ��� � �� �� �� �� �� �� � ��� �� �� �� � �� ��� � ���� �� ���� � �� � �� �� �� ����� �� �� ��� ���� � ��� �� �� ��� ��� � �� ��� ��� ��� �� ��� ������ �� � ��� ������� �� � �� � ��� ��� ��� �� �� ��� �� �� ������ ��� ��� ��� �� � ���� � �� �� � �� ��� ������ � �� ��� �� �� ��� ���� �� ��� �� ��� �� ��� �� �� �� ��� � � � �� � ���� ��� �� �� ����� �� � ��� �� � ���� �� � �� � ���� �� �� �� �� � ���� �� � ��� ����� �� ��� ����� �� ���� � ��� �� �� �� ��� � �� �� ���� ���� �� �� �� ���� ��� � ��� �� �� ��� �� �� �� ���� ��� � �� �� ���� �� �� � �� ��� ��� � ��� � �� ��� � ���� �� ����� �� � �� �� �� �� ��� �� � �� �� ��� �� �� ��� ��� �� � ������ � ��� �� �� ��� �� ��� �� �� � ��� � �� ��� � �� � �� ��� � ��� �� ��� � �� � �� � ���� ���� �� ��� �� �� � � �� ��� �� �� � �� � �� �� �� �� �� ��� �� ��� � �� ��� � ��� �� � � ���� ��� �� �� ��� ��� �� �� ��� ��� � ��� �� � ������ ������ �� ��� � �� �� ��� �� �� ��� ��� ���� �� ��� � �� ��� �� �� �� �� �� �� � �� � �� ��� ��� �� �� � �� ��� � ��� � �� � � � �� �� � �� �� � � ��� ��� �� �� �� ����� �� ������ ��� � � �� �� ��� �� � �� ��� � ���� ��� �� �� �� � ��� �� � �� �� ���� �� �� �� ��� �� �� �� � ��� �� �� � �� ���� �� �� ������ ���� ��� ���� � ���� �� � �� �� ����� ��� ���� ��� ��� �� �� �� � �� ���� ��� ��� � �� �� � �� � �� � ��� � �� ��� ���� ��� �� �� �� �� ���� � �� ��� � �� � �� � �� �� �� ��� ����� � � ��� � � �� ����� ��� �� � �� ���� �� ��� ��� �� � �� ��� � �� �� ��� ��� � �� ���� ��� � � ���� � ��� �� ��� ��� �� ��� �� �� �� � ��� ���� �� � ��� �� �� � ��� �� �� �� � ����� �� ������ � �� �� �� ��� �� � �� �� � �� � ��� �� �� � �� �� � ��� ��� ���� ����� ��� � �� �� � �� �� � �� �� �� �� ��� ��� ��� �� �� ��� � �� ��� � � ���� � �� ���� ��� ��� ��� ��� ���� ��� ���� �� ���� � �� � ������ � �� �� ��� �� � �� � ��� � � �� �� �� ��
� ��� ���� � ����
��
���
��
�� �
�
�
�� ��� � �
�
�
���
�
��
����
�
��
���
�
�� �
�
�
��
�
�
��
�
�
�
�
�
�
�
�
�
�
�
�
�
�� � ��
��
����
�� ���
�� �
� �� ������
��� ��� � ��� � �� �� ����� � �� � �� �� ��� �� ��� � �� ��� ��� ���� �� ������� �� � � ���� ���� ���� � � ��� � ���� ����� �� �� ��� ��� � �� �� � ��
������ �� � ��� � ��� �� � �� ��� ���� �� ��� � �� �� �� ��� ��� ��� ��� � ��� �� �� ����� ���� �� � �� ���� � ����� �� � ��� �� �� �� �� ��� �� �� ����� �� ���� �� � ���� �� �� � �� � ���� �� ��� �� �� �� � �� ��� ��� � � �� ��� �� �� �� ��� �� ��� �� ��� ��� �� ���� �� �� ��� � �� � �� � ��� ��� ����� ��� ���� � ���� � �� ����� ��� �� �������� ����� �� � �� � �� � ���� ��� ���� ��� �� �� ����� �� ���� � �� ��� �� � �� � � ����� � �� ����� ���� ��� ��� �� �� ���� � �� ��� ��� �� ��� �� � ��� �� � � ���� ��� ����� ��� �� ��� ��� �� ��� ��� ��� ���� ��� � �� � ���� �� �� ����� �� �� ���� ���� �� �� ��� �� ������ � �� �� �� �� � �� �� � ����� �� ����� � ������ � � � �� � ��� �� �� ��� �� ���� �� �� ����
�
�
�
�
�
����
��
��� �
�� ��
�� �� �� ������ ���� �� �� � ����� ������ �� �� �� ��� � �� ���� � ��
� �� � ���� ���� ��� � ���� ��� � �� � ���� �� ��� ��� �� ��� �� ��� ����� � � �� �� ������� � ��� ��� ���� �� �� � ��� ���� ��� ����� � � �� �� ��� � �� ��� � ��� �� ���� ��� �� �� ���� � ��� � �� � ��� � �� �� �� �� � � �� �� �� � �� �� �� ��� � �� ��� �� �� �� ����� ������ ������ �� ������ ��� �� ��� ��� �� � ����� � �� ��� �� � �� � �� � � ��� �� � �� � ��� �� ��� �� ��� ���� �� � ����� � �� �� �� � ���� �� ����� �� ���� ��� �� ���� �� � �� ��� � �� �� �� � � ��� ��� ���� ������ ��� ��� � ��� ��� �� � ��� ��� ��� � ��� ���� ������ � �� �� ��� � �� ��� �� � ��� ��� � �� ��� � �� ��� ��� ���� ��� ��� ��� �� �� �� ��� � ������ ���� ���� �� ��� �� �� �� �� ��� �� �� ���� ����� �� �� ��� �� � ���� � ���� �� ��� ��� �� �� �� �� �� � ���� � �� �� ��� ��� �� �� ������ � �� � �� �� ���
0.00
0.01
0.02
0.03
0.04
0.05
edgeR
DESeq2 limma
NOISeq
1 −
prec
ision
(FDR
)
��� �� ������ ���� � � �� �� ���� ���� �� ��� � �� ���� ��� ��� �� �� �� ��� � �� �� �� � � ����� � � ���� ���� �� �� �� �� ��� �� �� �� �� ��� �� � ����� � ������ �� ��� ��� ��� �� �� �� ����� �� ���� �� ����� ��� ����� �� �� � �� � �� ��� � ��� ��� � �� ��� � �� ����� ������ � �� �� ��� �� �� ���� ��� ��� �� � �� ��� �� �� � ��
�
�� � � ��� ��� ������ �� � ��� ��� ��� ��� � �� � ����� ��� �� � � �� � �� � ��� ���� � ��� � �� � ���� ���� �� �� ���� ����� �� �� �� �� � ��� � �� �� ���� � �� ��� � ��� ��� � � �� ��� ���� �� �� ��� � ���� �� �� � ��� ��� �� �� � �� �� � �� ��� �� �� ��� � �� ��� ��� �� � ��� � ��� �� ����� ��� �� �� � � � ���� ��� ������ �� ���� � � ��� ����� �� � ���� � ��� � �� ��� ���� � �� � �� �� �� �� � �� ������
�
�� ��� ������ �� ���� ���� �� ���� ��� ��� ���� �� ��� ��� �� ��� ���� ��� ���� � ��� �� ��� �� ��� �� ��� ��� ���� ���� �� ��� ���� � ���� � ������ ���� � �� �� ��� ����� �� � �� � ��� � ����� �� �� ���� � ����� ��� �� ��� ��� � � ���� ���� � ��� ��� ��� � ������ ���� ��� �� ���� � ��� ���� � ��
�
� ���� � � �� ��� �� � ���� ��� �� �� �������� �� � ��� � ��� �� � �� �� �� ��� ���� �� ��� �� ��� �� ��� �� ��� �� �� �� �� � ���� � ������ �� ��� �� ��� ��� �� ��� � �� � ������ � �� ���� � ���� ��� ��� ��� ��� �� �� �� �� ������ ��� ��� �� ��� �� ���� � �� ��� �� ��� � �� ��� �� � ���� � � ���� ���� �� �� ���� �� �� ���� ��� �� �� �������� � �� ���� � ��� � ����� �� �� ���� �� �� � ���� � ����� ��� � �� ��� �� �� �� ��� ��� ��� ������� � ����� ��� ���� ����� �� ��� ��� �� �� �� ��� �� � ��� �� �� � �� ��� ��� �� ��� � � ��� �� � �� ����� �� � ��� �� ��� ��� � ��� ��� �� ��� �� �� �� ��� � �� �� � ���� ��� � ��� � �� � �� � ���� �� �� �� �� � ����� � ��� ��� ���� � �� � ����� ���� �� �� �� �� �� ��� �� �� �� �� �� ��� �� �� � �� ���� ��� � ��� ��� � ��� �� � �� ��� � ��� �� � ���� � ����� � ��� ��� �� �� ������� � ��� � ���� � �� � ��� �� ��� ���� �� ��� �� ����� ��� ��� �� �� ��� ��� �� ���� �� �� �� � ��� �� � � ��� �� ��� ��� ��� � �� �� ��� �� ��� � ����� ��� � �� ��� � ���� �� �� ��� ��� �� �� �� � � ��� ��� ��� � ��� �� �� �� � �� � ��� �� ��� � ��� �� �� ����� � ��� �� ����� �� ���� � ��� ��� �� ���� ��� � ��� �� �� �� ���� �� ���� ��� �� ��� �� � �� �� �� � � �� �� �� � ��� � �� � ���� ��� �� ��� � ��� �� � ���� ����� �� � ��� �� � �� �������� �� � ��� ���� �� ���� � ���� ����� �� ��� � �� ����� ��� � ��� � �� � ��� �� � ��� ������ � ������ �� � �� �� � �� �� � ��� ��� � �� ���� ��� ��� � ��� �� � �� ��� ��� �� ��� �� � �� �� ��� � ��� ��� ���� ���� ��� �� ���� � �� ��� ��� �� � ��� �� �� � ��� ��� ��� � � ������ �� ��� � �� ��� �������� �� � � ���� � ��� �� � ��� � ��� �� �� � �� � �� �� �� ��� �� �� ��� � �� ���� � �� ��� �� � � ��� ���� ��� � �� � �� ��� �� �� � ���� ��� �� � �� � �� ������� � ��� ��� �� � �� �� �� ��� � �� �� ����� ��� �� ��� �� � �� �� ��� �� �� � ��� ���� ���� ��� �� �� �� � �� ��� ��� ��� ���� �� ���� � ��� �� ��� ��� ����� �� ��� �� � �� � ���� ��� � �� �� ���� � ��� �� ������� �� �� �� � �� � ��� � �� ��� ���� �� � ���� � ��� �� �� ��� � ��� � �� �� � � ��� �� � ���� ���� � ��� � ����� � �� �� �� ��� �� �� �� ��� �� ���� �� �� �� ���� ���� ��� � �� ��� �� ���� ��� � � ��� � ��� ��� �� � �� � �� �� ���� �� �� ���� �� � ����� � �� �� �� ��� ���� �� ��� �� ������� ��� � ������� �� �� � �� ��� � �� � �� ���� �� ��� � �� �� � ��� �� �� � � ����� �� � �� ��� � ���� ���� � � � �� � �� �� ��� ���� �� ��� � �� �� ��� �� � ���� � �� �� ���� � ���� �� �� ��� � ��� �� � ��� ������ � ��� �� �� ���� � ��� � �� �� ��� �� � ���� �� ��� � �� �� �� ���� �� � �� �� � �� �� � ���� ���� ���� �� �� ��� � ������ � ���� ��� � �� �� ����� ��� �� �� �� ��� ���� � ���� �� ��� � �� ���� �� � � ���� �� ��� �� �� ���� ����� ��� � ��� ���� ���� � �� ����� �� ���� �� � �� �� �� �� �� �� � ��� �� ������� �� �� ���� � ���� � �� �� �� ��� ���� �� ���� � �� �� � �� �� �� �� � ��� �� �� � ���� ��� �� �� ����� ���� ���� �� �� ��� ��� ������ �� �� ����� ��� � ���� ��� � � ��� �� ��� � ����� ��� �� � �� � �� ���� �� �� ��� ��� � ��� � �� �� � ��� �� ��� ��� �� �� �� ��� ���� �� �� ��� ��� ���� �� ���� �� � ��� �� � ��� ��� � ��� ��� ����� � ���� �� �� �� �� ����� � ���� �� �� ��� �� �� ����� ���� � �� �� ��� � � �� �� � �� � ���� �� �� � ��� ���� � �� ��� � �� � �� ��� �� ��� � �� �� ���� ��� �� �� ���� � ��� ��� ��� �� �� ��� � � �� �� �� ����� �� �� �� � ��� � �� ��� �� ��� ��� � ��� ��� � ��� ���� � � �� �� ������ � �� �� �� � ��� ���� ��� ��� � ��� �� �� ���� �� �� ��� ��� ��� �� �� � �� �� � ���
�� �� ��� ��� ��
�� ���� �� � �� ��� ��� ��
� ����� ��� �
��
�� � �
�
��
��
��
��
�
� ��
�
��
�
�
��
��
�
�
�
�
�
�
�
��
��
�� ���
��
��� ����� ��� �� � ��
� �� � �� �� ��� �� ��� � � ������ �� � ��� �� �� �� �� ���� �� ��� �� �� ��� � � �� �� ������ ���� ���� �� �� � �� ���� � �� ���� � ��� � ��� � �� ���� � ������ � � ��� �� � ���� �� �� ��� �� ���� �� � ���� � � ��� ��� �� ���� �� � ��� �� � ��� ���� �� �� ��� �� ���� � ��� � �� � ��� �� ���� � �� � �� ����� �� � ���� � ��� ���� �� ��� � � ������ ���� �� �� �� ����� � ��� ���� � �� ����� ����� �� ��� � ��� � ��� � ��� ��� �� �� ���� �� �� ����� ��� �� �� �� � ��� � ����� ���� ���� �� �� �� � �� ��� ����� �� �� � �� � ���� ������ �� �� � ��� ��� � ����� � ����� ��� �� �� � � ��� �� ���� �� ��� � �� ��� �� ����� ��� ��� � � ��� �� �� �� ���� ������ � � ��� �� �� �� ��� �� ��� �� � � �� ��� � �� ���� �� �� �� �� �� ��� ��� ���� ���� � ����� �� ��� ��� ����� ��� ����� ������ �� �� ��� � � �� ��� � �� � ��� ��� � ��� ���� � ��� �� �� �� ��� ������ � ��� �� � � �� ��� ����� ��� �� �� �� ��� � ���� �� �� �� ���� ����� � �� �� �� � ����� �� ���� ��� ���� ��� ���� �� � � ��� � ����� � �� ��� � �� ������ ��� � �� ��� ��� ��� �� ��� ��� �� ������ �� � ��� ��� �� ������ � ��� � ������ �� �� �� �� � ��� � ��� ��� � �� �� � �� �� � ���� � � �� � ���� �� �� ����� ��� ��� �� ��� �� ���� �� � ���� � �� ��� �� ���� � �� �� �� �� �� ���� ��� �� � ���� � ����� � �� �� ��� ���� �� ��� �� � �� �� ��� ��� �� ��� �� ��� �� �� � �� � ��� ��� ��� ��� ��� �� � ���� ��� � ����� ���� ��� �� �� � ���� � �� � ��� �� �� � ��� � ��� �� �� ���� ���� ���� �� �� ��� � � ��� � � �� � ��� �� � �� � ��
�
0.00
0.01
0.02
0.03
0.04
0.05
edgeR
DESeq2 limma
NOISeq
1 −
prec
ision
(FDR
)
�� � � ����� � ����� �� �� ���� �� ��� ��� ��� �� �� �� ��� �� � � ��� ���� �� �� ��� ��� ���� � � ��� ���� ��� ���� � ���� ����� �� �� �� �� ���� �� �� �� �� �� ���� �� � ��� �� �� ��� �� � ��� ������ ����� ��� ���� �� ��� � ������ � �� ���� � �� �� ��� � ���� �� �� �� �� �� ������ �� � ����� � �� �� � ���� � �� � �� � ��� ��� ��� ��� �� �� � �� �� �� � ��� � ��� �� � ���� � ����� � �� �� ���� �� ���� ��� �� �� � ��� ���� ��� � ��� �� �� �� �� ��� �� �� ������ ��� �� � �� �� �� ��� �� ��� ��� ��� �� � ����� ��
�
���� �
�
� �� ��� �� � ���� �� �� �� �� � �� ���� �� �� ���� � � ���� � �� �� ��� � �� ���� �� �� �� ��� ��� ���� �� ��� �� ���� �� �� ��� ��� �� ��� �� ��� ��
�
�� �� �� �� ��� �� �� �� � �� ��� � ��� �� �� �� � �� � �� �� � �� ��� ���� �� �� ��� � ���� � �� ���� � �� �� �� �� � �� ��� ��� �� �� ��� ���� ��� ��� ����� �� �� ��� ��� � �� � ��� � ��� ������ �� � ���� �� �� � ��� �� �� � ���� ������ �� �� �� �� � ���� � �� ����� ��� �� �� � ���� � � ��� ���� �� ��
�
� ��� �� ��� �� ��� � ��� ���� � � �� ��� �� �� � �� �� �� ��� � �� � � �� � ��� ������� ��� �� �� � ������ �� ��� �� �� � �� �� �� � ��� ��� ��� �� �� � �� �� ��� � �� �� ��� � ���� �� ���� � �� ��� �� �� � ���� � � �� ��� �� � ����� � ���� �� � ���� �� ����� �� �� �� �� � ������� �� � �� �� �� �� �� ��� � �� �� �� ��� ���� �� �� ��� ��� � �� �� ��� �� ����� ���� � ����� � �� � �� �� � ��� ��� �� ���� ���� ��� ���� �� ��� �� � ��� �� �� �� �� ���� � ����
���� ���� � ��� �� �� �� ��� ��� �� � ��� � ��� �� ��� ���� �� � � ������� � � �� �
�
� ��� ��� � �� �������� �� �� �� �� �� ��� ��� ��� � ���� � �� �� � �� ���� � ��� � ���� �� ���� ��� � � ���� �� �� ��� ��� �� � �� ��� ��� �� ��� ��� ����� ��� �� ��� � ��� ��� ���� �� � ����� �� �� � � �� ��� �� � �� ��� ��� ����� �� ���� ��� �� ��� ���� ���� �� �� ���� � ���� �� ���� �� ����� ��� � � ��� �� � ��� ���� �� �� �� ���� ���� ��� ���� ���� �� � �� � ����� �� � ��� �� ��� ����� �� ���� ��� ��� �� � �� � �� �� ��� ������ �� �� ���� �� � �� �� ����� � ������ ��� �� � ���� �� �� ��� � �� �� ��� �� �� ��� ��� �� �� �� ���� � ��� ��� ���� ���� � �� ��� ��� � ��� ��� ��� �� �������� ���� �� � �� � ��� � �� �� �� � �� ��� ��� ��� �� �� ��� ��� ��� �� �� � � ���� � �� �� �� �� �� ��� ��� �� ����� �� ����� � � ��� ����� � �� ��� ���� �� �� ��� ��� �� ��� ������ �� �� ��� �� �� ��� ������� �� �� � �� ��� �� ��� �� ���� � �� ��� � ���� �� �� ��� ��� ��� �� �� �� ���� �� � �� �� �� � ������ �� � ��� ��� � ��� ��� �� � �� ��� � ��� �� � ����� �� �� � �� ���� � ��� �� �� ������ ��� � �� � ��� ��� � ���� � �� � ���� �� �� � ��� ����� �� ��� ���� �� � ��� �� ��� ��� � ���� ���� ����� �� ��� � ��� ��� ��� ��� �� �� �� � ���� �� � �� �� �� �� ��� ��� ��� �� �� �� � �� � ��� �� � �� � ���� �� �� �� � �� �� � �� ��� ��� ��� ���� ���� ��� ��� � ��� � �� ��� �� � ��� � � � � �� �� � ����� � �� �� ����� � ��� �� �� �� ���� � ���� �� �� �� ��� �� � ��� � � �� ��� � ����� � � �� �� ��� � �� �� ��� �� �� ��� �� ��� ��� �� ��� � ���� ��� �� � ��� ��� �� ���� � ��� � �� �� ��� � ��� ��� ��� ��� � � �� � �� �� ����� �� � �� ����� � �� � � � �� ���������� �� �� ��� � ��� �� ��� ��� �� �� �� ����� �� ���� �� �� ������ �� ������ �� � ���� �� ���� �� �� �� � �� ���� ��� �� ��� �� � �� ��� � ��� � �� �� ��� ������ �� ��� �� �� � ���� �� ��� ��� ��� ����� � �� � ��� �� ���� � ������ �� ��� �� ������� ������ �� �� � �� � �� ��� � ��� �� ��� ���� ��� ���� � ���� ��� ���� �� � �� �� ��� �� � ���� � � �� ���� � ������ ���� ��� � �� �� � ��� ������� �� �� ��� ���� �� �� �� � �� � � �� ���� ����� � � ���� �� ���� ���� � �� ���� � � �� ���� �� � ���� ��� ��� ��� �� ��� �� ���� ���� ������ ���� �� � �� �� � �� �� � �� � � ��� � �� � ��� �� ���� �� � � �� �� � �� � ���� �� �� �� �� � �� � � �� ����� ��� � ��� �� ��� �� � ����� ��� �� �� �� � ���� � ���� �� � ��� ��� �� ����� �� �� ��� ��� � �� ��� �� �� � �� �� ��� �� � � ���� ��� � � � ���� �� ��� �� ��� � �� �� �� �� �� ��� ��� � � � �� �� �� ��� ��� ���� �� ��� �� ��� ��� � �� ��� � ��� ��� ��� � �� �� ���� �� �� ���� � � ���� ����� � ���� �� �� � ��� ��� �� � ���� � ����� ���� �� ��� �� � �� � ���� ��� �� ��� � �� �� ��� �� ��� � � ����� � �� �� �� � �� �� ��� �� �� ��� ��� �� �� �� ��� �� �� ��� � �� �� ��� � ��� ��� �� �� ��� ������ � �� ���� ����� � � ��� ��� ����� � �� � ���� �� �� ���� �� �� �� �� �� � �� � ��� �� ����� ��� �� ��� �� ���� �� ��� �� ��� � �� ������� ���� � � ��� �� �� �� �� ��� ��� �� �� ��� �� � ����� �� ���� � ��� ��� � � �� �� ��� ������� ���� ��� �� �� ��� � �� ����� �� �� �� � �� � �� ���� � ��� ������ ���� � ��� �� � �� �� � �� � �� �� �� � ��� � �� �� �� � �� � �� ��� �� ��� � � �� �� ���� �� �� ��� ���� � �� �� �� �� ��� � � ��� ���� �� ���� �� ���� �� ��� �� � ��� ��� � � �� ���� �� ��
����� ��� � �� �� �
������ � � �� �� ��
�� ��
���
��� ����
�
� ��
�
�
� �
� ��
�
�
��
��
�
�
�
�
�
�
��
�
�
�
��
�
�
�
�
� ��
��
��
��
���
��� �� �� � �� � �� ��� ��� ������
�� ��� �� ��� � � � ���� ��� ���� � ��� �� �� ��� �� ��� ��� � �� �� �� ����� ���� �� �� �� �� �� � � ��� ���� �� ���� �� �� � � �� ��� �� �� ��� ���� ��� ���� ���� �� �� � �� � ��� ��� �� � � ����� ��� ���� ��� � ��� � � ��� �� �� �� ��� ������� �� ���� ���� ��� � ��� ���� � � �� ��� �� � ��� � �� � ���� �� ����� ��� �� ���� ����� � �� ���� �� �� �� �� � � �� ���� ��� � �� � �� ��� � ��� ��� � ���� � � ��� �� �� �� � ����� ��� � �� � ��� ���� � ��� �� � �� ��� � �� ������ � ������ � �� �� �� ����� ��� ��� ���� ��� �� �� �� �� ��� ��� �� �� � �� � ���� � �� ��� �� �� � ��� ��� �� ��� ���� ��� ��� �� � � � ��� �� � ��� �� � ���� �� �� ��� � �� ���� �� ���� �� ��� � ����� ��� � ��� ��� ���� �� ���� �� ���� �� � ��� �� �� ���� ����� �� �� �� ��� �� ��� ��� �� ��� ����� � �� �� �� �� � ����� � � ��� �� �� ���� �� �� ��� � � ��� �� ��� �� �� ��� �� �� ��� �� �� ��� � ��� � ��� ������� �� � ��� �� ��� � �� � ��� ��� � �� �� �� �� �� �� � ��� � �� �� �� �� ��� � �� ���� �� � �� ������ ��� �� ��� �� � ���� ��� � �� �� ��� �� ���� ��� �� ��� ��� ���� ���� �� �� ��� ����� ��� � �� ���� ���� � ���� �� ��� � ��� ��� � � � ���� � �� �� ����� ���� ��� ����� � � ���� �� ����� � �� ���� � ��� ���� �� � �� �� � � �� ��� � ��� ���� �� �� ��� �� �� �� ����� �� � �� � ������ �� ���� � ���� � �� �� ��� � � ���� � �� �� �� ������� � �� �� �� ��� � ��� ���� �� ��� � ��� ��� �� ��� �� �� �� ���� �� ���� �� �� �� �� � ������ � ������ �� �� � ��� � ���� ��� ��� ���� �� �� ���� �� ��� �� ��� ��� �� �� �� �� �� � �� ������ ���� ��� �� �� ���� � �� � �� �
0.00
0.01
0.02
0.03
0.04
0.05
edgeR
DESeq2 limma
NOISeq
1 −
prec
ision
(FDR
)
1 - p
recis
ion (F
DR)
1 - p
recis
ion (F
DR)
100/0 50/50
0/100
Fig. 5. Plots of FDR values of ‘common DEGs’ detected by packages (DESeq2, edgeR,limma and NOISeq) with synthetic data in different expression ratios. 100/0 corre-sponds to all over-expressed/none repressed, 50/50 is the balanced ratio, and 100/0corresponds to none over-expressed/all repressed.

of a Pinus pinaster gene, one from photosynthetic tissueand one from non-photosynthetic tissue (Table 1) wereanalysed. Sequences were aligned with MultAlin usingdefault settings. The resulting alignment was loaded intoAlignMiner and divergent regions were identified withthe Weighted score in obtain a small list of the mostdivergent regions. This enabled the design of specificprimers for the photosynthetic and non-photosyntheticisoforms (Figure 8A, Table 2). PCR amplification withthese primers using different DNAs as template (Figure8B) confirmed that each primer pair amplified only theisoform for which it was designed, without any cross-amplification, using as template either total cDNA (Fig-ure 8B, lanes 3) or specific cDNA inserted into a plas-mid (Figure 8B, lanes 1 and 2). Since primers pairs areexpected to span exon-exon junctions, no amplificationwas observed using genomic DNA (Figure 8B, lanes 4).These results suggested that the algorithm had correctly
identified a divergent region, and that the primers werecorrectly designed and worked as predicted by thesoftware.
ConclusionsAlignMiner serves to fill the gap in bioinformaticfunction for the study of sequence divergence inMSAs containing closely-related sequences. In con-trast to other software [15,18,39], it is not intendedfor the design of primers for high-throughput analysisbut for the of study particular cases where very clo-sely-related sequences must be distinguished in orderto avoid cross-reaction. AlignMiner is able to identifyconserved/divergent regions with respect to a consen-sus sequence or to a “master” sequence. It can evenbe used to identify putative DNA probes for blottinghybridisation that correspond to the hyper-variableregions at each MSA end. Our tests demonstrate that
Figure 6 Use of AlignMiner for designing several specific primer pairs for PCR amplification of the different isoforms of the AtGS1nucleotide sequence (A) The 5’ and 3’ divergent regions obtained with Entropy that were selected for primer design including thecharacteristic parameters of each region. (B) Results of the in silico “PCR amplification” with BioPHP [34] using the different primer pairs. Note thatthe actual 3’ primers are complementary to the sequences shown on the right.
Guerrero et al. Algorithms for Molecular Biology 2010, 5:24http://www.almob.org/content/5/1/24
Page 12 of 16
¿Qué región es más variable en un alineamiento?
9
SOFTWARE ARTICLE Open Access
AlignMiner: a Web-based tool for detection ofdivergent regions in multiple sequencealignments of conserved sequencesDarío Guerrero1, Rocío Bautista1, David P Villalobos2, Francisco R Cantón2, M Gonzalo Claros1,2*
Abstract
Background: Multiple sequence alignments are used to study gene or protein function, phylogenetic relations,genome evolution hypotheses and even gene polymorphisms. Virtually without exception, all available tools focuson conserved segments or residues. Small divergent regions, however, are biologically important for specificquantitative polymerase chain reaction, genotyping, molecular markers and preparation of specific antibodies, andyet have received little attention. As a consequence, they must be selected empirically by the researcher.AlignMiner has been developed to fill this gap in bioinformatic analyses.
Results: AlignMiner is a Web-based application for detection of conserved and divergent regions in alignments ofconserved sequences, focusing particularly on divergence. It accepts alignments (protein or nucleic acid) obtainedusing any of a variety of algorithms, which does not appear to have a significant impact on the final results.AlignMiner uses different scoring methods for assessing conserved/divergent regions, Entropy being the methodthat provides the highest number of regions with the greatest length, and Weighted being the most restrictive.Conserved/divergent regions can be generated either with respect to the consensus sequence or to one mastersequence. The resulting data are presented in a graphical interface developed in AJAX, which provides remarkableuser interaction capabilities. Users do not need to wait until execution is complete and can.even inspect theirresults on a different computer. Data can be downloaded onto a user disk, in standard formats. In silico andexperimental proof-of-concept cases have shown that AlignMiner can be successfully used to designing specificpolymerase chain reaction primers as well as potential epitopes for antibodies. Primer design is assisted by amodule that deploys several oligonucleotide parameters for designing primers “on the fly”.
Conclusions: AlignMiner can be used to reliably detect divergent regions via several scoring methods that providedifferent levels of selectivity. Its predictions have been verified by experimental means. Hence, it is expected that itsusage will save researchers’ time and ensure an objective selection of the best-possible divergent region whenclosely related sequences are analysed. AlignMiner is freely available at http://www.scbi.uma.es/alignminer.
BackgroundSince the early days of bioinformatics, the elucidation ofsimilarities between sequences has been an attainablegoal to bioinformaticians and other scientists. In fact,multiple sequence alignments (MSAs) stand at a cross-road between computation and biology and, as a result,long-standing programs for DNA or protein MSAs arenowadays widely used, offering high quality MSAs. Inrecent years, by means of similarities between sequences
and due to the rapid accumulation of gene and genomesequences, it has been possible to predict the functionand role of a number of genes, discern protein structureand function [1], perform new phylogenetic tree recon-struction, conduct genome evolution studies [2], anddesign primers. Several scores for quantification of resi-due conservation and even detection of non-strictly-con-served residues have been developed that depend on thecomposition of the surrounding residue sequence [3],and new sequence aligners are able to integrate highlyheterogeneous information and a very large number ofsequences. Without exception, the sequence similarity of
* Correspondence: [email protected] Andaluza de Bioinformática (Universidad de Málaga), SeveroOchoa, 34, 29590 Málaga, Spain
Guerrero et al. Algorithms for Molecular Biology 2010, 5:24http://www.almob.org/content/5/1/24
© 2010 Guerrero et al; licensee BioMed Central Ltd. This is an Open Access article distributed under the terms of the CreativeCommons Attribution License (http://creativecommons.org/licenses/by/2.0), which permits unrestricted use, distribution, andreproduction in any medium, provided the original work is properly cited.
Table 2 Details of primers designed with AlignMiner to identify specifically by PCR the five A. thaliana GS1 genes aswell as the two primer pairs that identify the photosynthetic and non-photosynthetic isoforms of P. pinaster; notethat the 3’ (reverse) primer is complementary to the sequence appearing in Figures 6 and 8.
Isoform Primer Length %GC Tm (°C) Amplicon size (bp)
GS1.1 5’-GGTCTTTAGCAACCCTGA-3’ 18 50 54.6 740
5’-ATCATCAAGGATTCCAGA-3’ 18 39 48.7
GS1.2 5’-GATCTTTGCTAACCCTGA-3’ 18 44 51.3 739
5’-CTTTCAAGGGTTCCAGAG-3’ 18 50 53.6
GS1.3 5’-AATCTTCGATCATCCCAA-3’ 18 39 50 739
5’-AAAGTCTAAAGCTTAGAG-3’ 18 33 46
GS1.4 5’-GATCTTCAGCCACCCCGA-3’ 18 61 59.4 739
5’-AATGTGTCATCAACCGAG-3’ 18 44 51.5
GS1.5 5’-GATCTTTGAAGACCCTAG-3’ 18 44 48.8 740
5’-TCTTTCATGGTTTCCAAA-3’ 18 33 50.1
Photosyntetic isoform 5’-AGTGCGCATTAAGGACCCATCA-3’ 22 50 61 177
5’-ACACACTGGCTTCCACAATAGG-3’ 22 50 59.4
Non-photosynthetic isoform 5’-ACAGATGATCTAGGACATGC-3’ 20 45 52 169
5’-CACTTATTTGCACTTGAAGG-3’ 20 40 52.6
Figure 7 Correlation between the most divergent amino acid sequences and antigenicity of the AtGS1 protein MSA. (A) Similarity plotobtained using the Entropy method; the most divergent regions being are highlighted. (B) Aligned sequences for the two divergent regionstogether (underlined in black) and their score in relation to other divergent regions. (C) Localisation of each divergent region in the alignmentwhere: (i) nucleotides in bold are the predicted epitopes for B-cells; (ii) an “e” denotes predicted solvent accessibility for this position; and (iii)red-boxed amino acids correspond to the sequence of the matching divergent region. It is clearly seen that divergent sequences overlap withthe predicted epitopes and the solvent-accessible amino acids.
Guerrero et al. Algorithms for Molecular Biology 2010, 5:24http://www.almob.org/content/5/1/24
Page 13 of 16
Cebadores capaces de distinguir alelos
Epítopos específicos
http://www.scbi.uma.es/alignminer
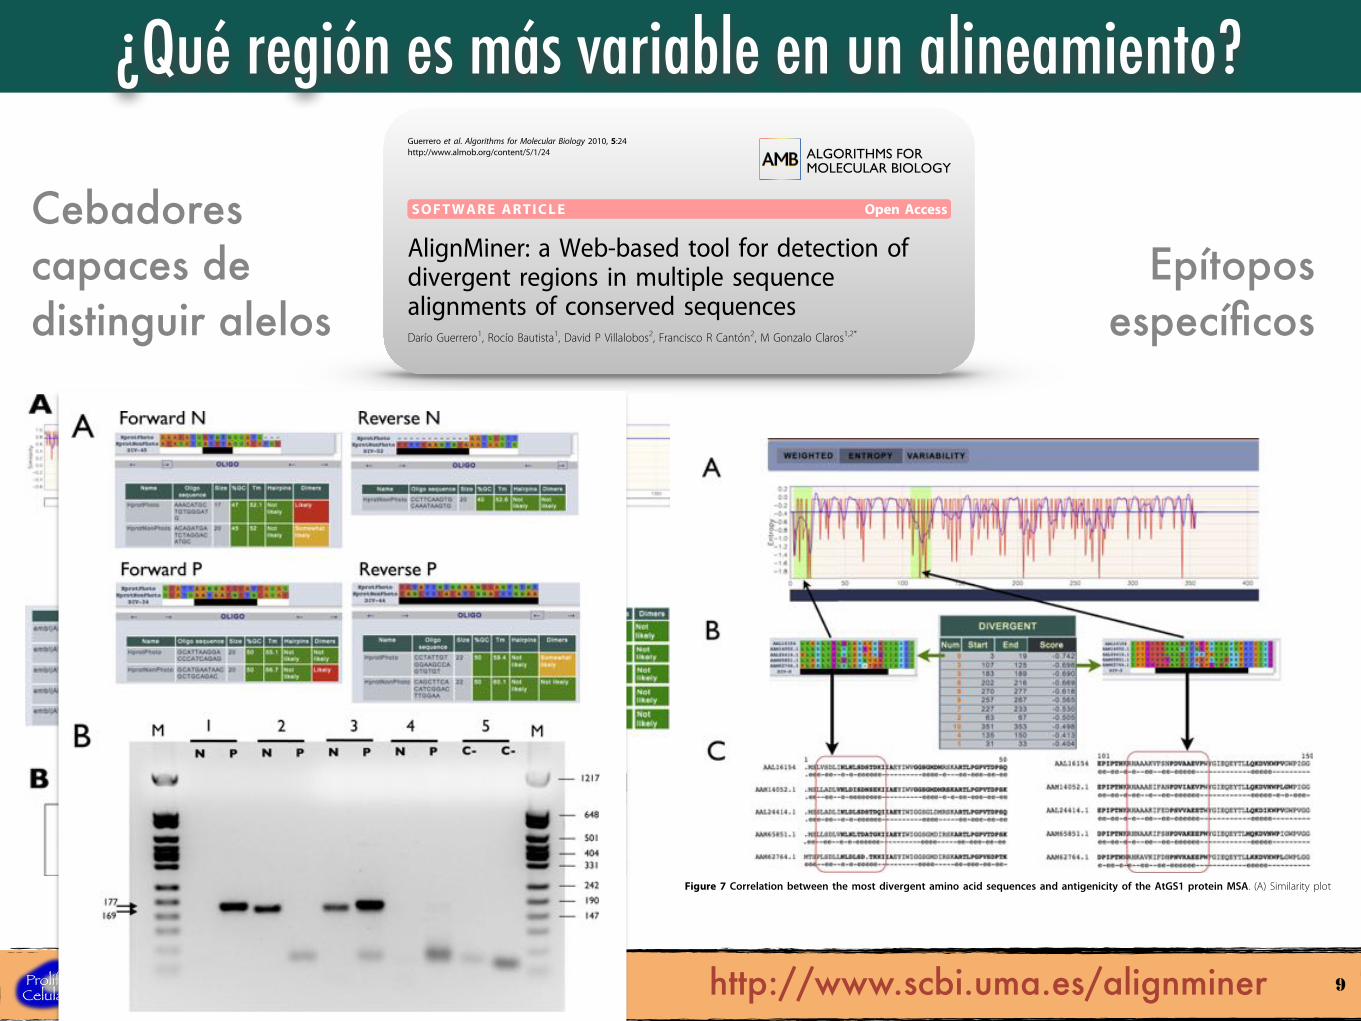
of a Pinus pinaster gene, one from photosynthetic tissueand one from non-photosynthetic tissue (Table 1) wereanalysed. Sequences were aligned with MultAlin usingdefault settings. The resulting alignment was loaded intoAlignMiner and divergent regions were identified withthe Weighted score in obtain a small list of the mostdivergent regions. This enabled the design of specificprimers for the photosynthetic and non-photosyntheticisoforms (Figure 8A, Table 2). PCR amplification withthese primers using different DNAs as template (Figure8B) confirmed that each primer pair amplified only theisoform for which it was designed, without any cross-amplification, using as template either total cDNA (Fig-ure 8B, lanes 3) or specific cDNA inserted into a plas-mid (Figure 8B, lanes 1 and 2). Since primers pairs areexpected to span exon-exon junctions, no amplificationwas observed using genomic DNA (Figure 8B, lanes 4).These results suggested that the algorithm had correctly
identified a divergent region, and that the primers werecorrectly designed and worked as predicted by thesoftware.
ConclusionsAlignMiner serves to fill the gap in bioinformaticfunction for the study of sequence divergence inMSAs containing closely-related sequences. In con-trast to other software [15,18,39], it is not intendedfor the design of primers for high-throughput analysisbut for the of study particular cases where very clo-sely-related sequences must be distinguished in orderto avoid cross-reaction. AlignMiner is able to identifyconserved/divergent regions with respect to a consen-sus sequence or to a “master” sequence. It can evenbe used to identify putative DNA probes for blottinghybridisation that correspond to the hyper-variableregions at each MSA end. Our tests demonstrate that
Figure 6 Use of AlignMiner for designing several specific primer pairs for PCR amplification of the different isoforms of the AtGS1nucleotide sequence (A) The 5’ and 3’ divergent regions obtained with Entropy that were selected for primer design including thecharacteristic parameters of each region. (B) Results of the in silico “PCR amplification” with BioPHP [34] using the different primer pairs. Note thatthe actual 3’ primers are complementary to the sequences shown on the right.
Guerrero et al. Algorithms for Molecular Biology 2010, 5:24http://www.almob.org/content/5/1/24
Page 12 of 16
¿Qué región es más variable en un alineamiento?
9
SOFTWARE ARTICLE Open Access
AlignMiner: a Web-based tool for detection ofdivergent regions in multiple sequencealignments of conserved sequencesDarío Guerrero1, Rocío Bautista1, David P Villalobos2, Francisco R Cantón2, M Gonzalo Claros1,2*
Abstract
Background: Multiple sequence alignments are used to study gene or protein function, phylogenetic relations,genome evolution hypotheses and even gene polymorphisms. Virtually without exception, all available tools focuson conserved segments or residues. Small divergent regions, however, are biologically important for specificquantitative polymerase chain reaction, genotyping, molecular markers and preparation of specific antibodies, andyet have received little attention. As a consequence, they must be selected empirically by the researcher.AlignMiner has been developed to fill this gap in bioinformatic analyses.
Results: AlignMiner is a Web-based application for detection of conserved and divergent regions in alignments ofconserved sequences, focusing particularly on divergence. It accepts alignments (protein or nucleic acid) obtainedusing any of a variety of algorithms, which does not appear to have a significant impact on the final results.AlignMiner uses different scoring methods for assessing conserved/divergent regions, Entropy being the methodthat provides the highest number of regions with the greatest length, and Weighted being the most restrictive.Conserved/divergent regions can be generated either with respect to the consensus sequence or to one mastersequence. The resulting data are presented in a graphical interface developed in AJAX, which provides remarkableuser interaction capabilities. Users do not need to wait until execution is complete and can.even inspect theirresults on a different computer. Data can be downloaded onto a user disk, in standard formats. In silico andexperimental proof-of-concept cases have shown that AlignMiner can be successfully used to designing specificpolymerase chain reaction primers as well as potential epitopes for antibodies. Primer design is assisted by amodule that deploys several oligonucleotide parameters for designing primers “on the fly”.
Conclusions: AlignMiner can be used to reliably detect divergent regions via several scoring methods that providedifferent levels of selectivity. Its predictions have been verified by experimental means. Hence, it is expected that itsusage will save researchers’ time and ensure an objective selection of the best-possible divergent region whenclosely related sequences are analysed. AlignMiner is freely available at http://www.scbi.uma.es/alignminer.
BackgroundSince the early days of bioinformatics, the elucidation ofsimilarities between sequences has been an attainablegoal to bioinformaticians and other scientists. In fact,multiple sequence alignments (MSAs) stand at a cross-road between computation and biology and, as a result,long-standing programs for DNA or protein MSAs arenowadays widely used, offering high quality MSAs. Inrecent years, by means of similarities between sequences
and due to the rapid accumulation of gene and genomesequences, it has been possible to predict the functionand role of a number of genes, discern protein structureand function [1], perform new phylogenetic tree recon-struction, conduct genome evolution studies [2], anddesign primers. Several scores for quantification of resi-due conservation and even detection of non-strictly-con-served residues have been developed that depend on thecomposition of the surrounding residue sequence [3],and new sequence aligners are able to integrate highlyheterogeneous information and a very large number ofsequences. Without exception, the sequence similarity of
* Correspondence: [email protected] Andaluza de Bioinformática (Universidad de Málaga), SeveroOchoa, 34, 29590 Málaga, Spain
Guerrero et al. Algorithms for Molecular Biology 2010, 5:24http://www.almob.org/content/5/1/24
© 2010 Guerrero et al; licensee BioMed Central Ltd. This is an Open Access article distributed under the terms of the CreativeCommons Attribution License (http://creativecommons.org/licenses/by/2.0), which permits unrestricted use, distribution, andreproduction in any medium, provided the original work is properly cited.
Table 2 Details of primers designed with AlignMiner to identify specifically by PCR the five A. thaliana GS1 genes aswell as the two primer pairs that identify the photosynthetic and non-photosynthetic isoforms of P. pinaster; notethat the 3’ (reverse) primer is complementary to the sequence appearing in Figures 6 and 8.
Isoform Primer Length %GC Tm (°C) Amplicon size (bp)
GS1.1 5’-GGTCTTTAGCAACCCTGA-3’ 18 50 54.6 740
5’-ATCATCAAGGATTCCAGA-3’ 18 39 48.7
GS1.2 5’-GATCTTTGCTAACCCTGA-3’ 18 44 51.3 739
5’-CTTTCAAGGGTTCCAGAG-3’ 18 50 53.6
GS1.3 5’-AATCTTCGATCATCCCAA-3’ 18 39 50 739
5’-AAAGTCTAAAGCTTAGAG-3’ 18 33 46
GS1.4 5’-GATCTTCAGCCACCCCGA-3’ 18 61 59.4 739
5’-AATGTGTCATCAACCGAG-3’ 18 44 51.5
GS1.5 5’-GATCTTTGAAGACCCTAG-3’ 18 44 48.8 740
5’-TCTTTCATGGTTTCCAAA-3’ 18 33 50.1
Photosyntetic isoform 5’-AGTGCGCATTAAGGACCCATCA-3’ 22 50 61 177
5’-ACACACTGGCTTCCACAATAGG-3’ 22 50 59.4
Non-photosynthetic isoform 5’-ACAGATGATCTAGGACATGC-3’ 20 45 52 169
5’-CACTTATTTGCACTTGAAGG-3’ 20 40 52.6
Figure 7 Correlation between the most divergent amino acid sequences and antigenicity of the AtGS1 protein MSA. (A) Similarity plotobtained using the Entropy method; the most divergent regions being are highlighted. (B) Aligned sequences for the two divergent regionstogether (underlined in black) and their score in relation to other divergent regions. (C) Localisation of each divergent region in the alignmentwhere: (i) nucleotides in bold are the predicted epitopes for B-cells; (ii) an “e” denotes predicted solvent accessibility for this position; and (iii)red-boxed amino acids correspond to the sequence of the matching divergent region. It is clearly seen that divergent sequences overlap withthe predicted epitopes and the solvent-accessible amino acids.
Guerrero et al. Algorithms for Molecular Biology 2010, 5:24http://www.almob.org/content/5/1/24
Page 13 of 16
Cebadores capaces de distinguir alelos
Epítopos específicos
Figure 8 Analysis of two Pinus pinaster gene isoforms. The specific primer pair for the photosynthetic isoform is identified by a “P”and for the non-photosynthetic isoform by an “N” (A) Predicted sequence and properties of the two primer pairs designed for specificidentification of each isoform. (B) PCR analysis using the previously-predicted primers. Table 2 includes the expected amplicon size using theseprimer pairs. The template in the different lanes is: cDNA for the photosynthetic isoform (lanes 1), cDNA for the non-photosynthetic isoform(lanes 2), cDNA synthesised from total mRNA extracted from Pinus pinaster (lanes 3), Pinus pinaster genomic DNA (lanes 4), and negative controls(lines 5), which do not contain any DNA. Lanes M are molecular weight markers (vector pFL61 digested with Hpa II). Arrows indicate the specificamplification bands. DNA sizes are given in base pairs.
Guerrero et al. Algorithms for Molecular Biology 2010, 5:24http://www.almob.org/content/5/1/24
Page 14 of 16
http://www.scbi.uma.es/alignminer
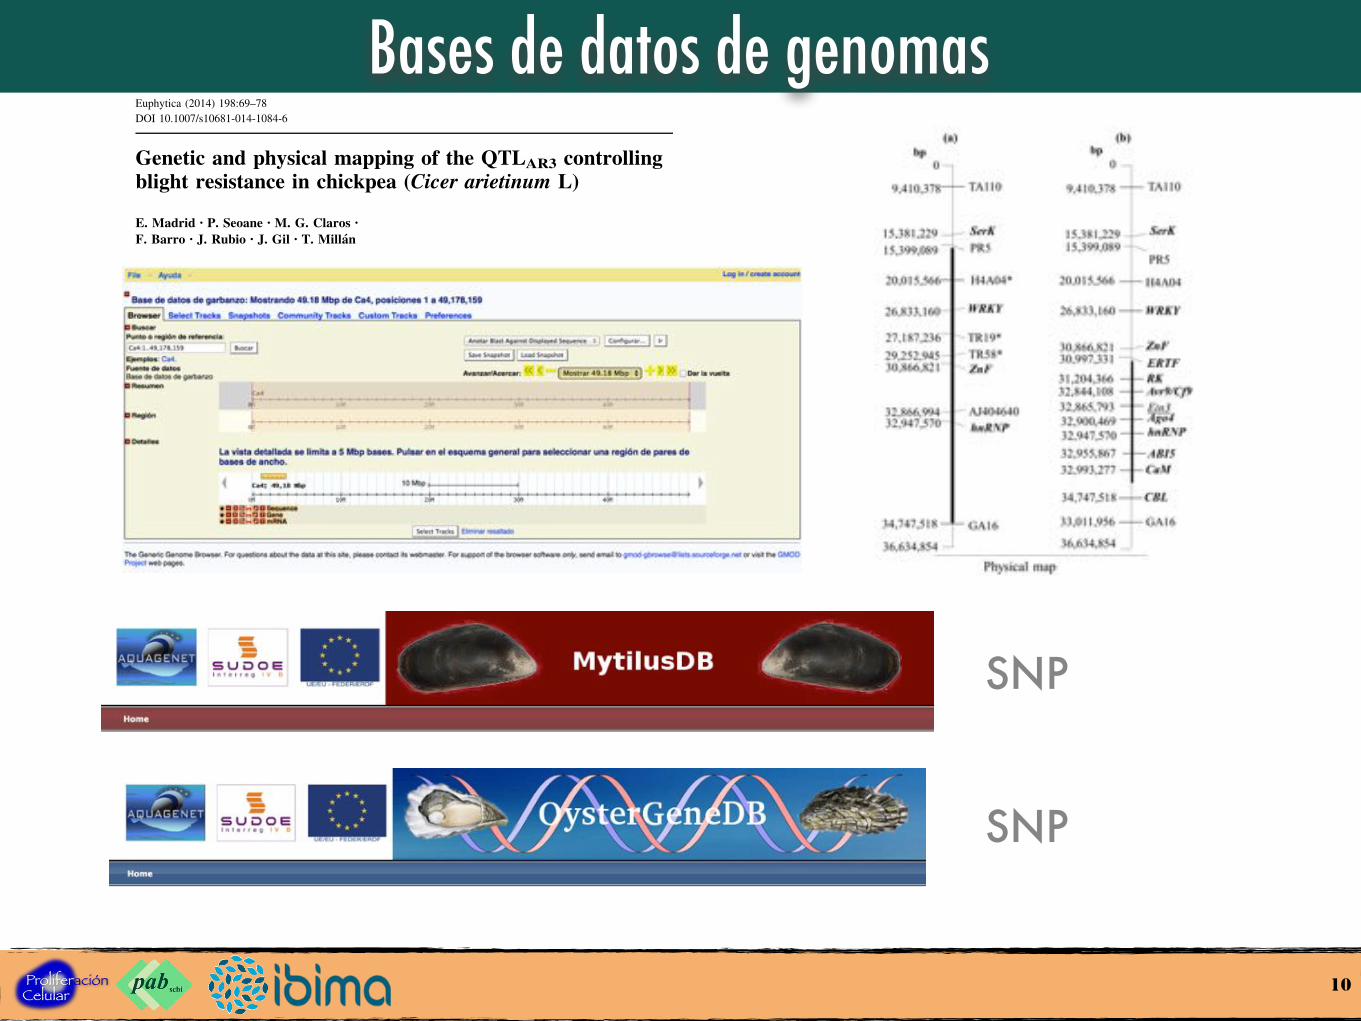
Bases de datos de genomas
10
Genetic and physical mapping of the QTLAR3 controllingblight resistance in chickpea (Cicer arietinum L)
E. Madrid • P. Seoane • M. G. Claros •
F. Barro • J. Rubio • J. Gil • T. Millan
Received: 14 January 2014 / Accepted: 14 February 2014 / Published online: 26 February 2014! Springer Science+Business Media Dordrecht 2014
Abstract Physical and genetic maps of chickpea a
QTL related to Ascochyta blight resistance andlocated in LG2 (QTLAR3) have been constructed.
Single-copy markers based on candidate genes located
in the Ca2 pseudomolecule were for the first timeobtained and found to be useful for refining the QTL
position. The location of the QTLAR3 peak was linkedto an ethylene insensitive 3-like gene (Ein3). The Ein3
gene explained the highest percentage of the total
phenotypic variation for resistance to blight (44.3 %)with a confidence interval of 16.3 cM. This genomic
region was predicted to be at the Ca2 physical position
32–33 Mb, comprising 42 genes. Candidate genes
located in this region include Ein3, Avr9/Cf9 andArgonaute 4, directly involved in disease resistance
mechanisms. However, there are other genes outside
the confidence interval that may play a role in theblight resistance pathway. The information reported in
this paper will facilitate the development of functionalmarkers to be used in the screening of germplasm
collections or breeding materials, improving the
efficiency and effectiveness of conventional breedingmethods.
Keywords Ascochyta blight !Candidate genes !Physical map ! Molecular markers
Introduction
Chickpea (Cicer arietinum L.) is a self-pollinateddiploid (2n = 2x = 16) annual grain legume widely
grown in arid and semi-arid areas across the six
continents. Together with other pulse crops, such aslentil (Lens culinaris Medik.), dry pea (Pisum sativum
L.) and dry bean (Phaseolus vulgaris L.), chickpea is a
major source of protein in human diets, particularly inlow-income countries. In addition, chickpea crops
play an important role in the maintenance of soil
fertility, particularly in dry, rain-fed areas (Berradaet al. 2007).
One of the most important factors contributing to
instability in chickpea yields is Ascochyta blight,
Electronic supplementary material The online version ofthis article (doi:10.1007/s10681-014-1084-6) contains supple-mentary material, which is available to authorized users.
E. Madrid (&) ! F. BarroInstitute for Sustainable Agriculture, CSIC, Apdo 4084,14080 Cordoba, Spaine-mail: [email protected]
P. Seoane ! M. G. ClarosDepartamento de Biologıa Molecular y Bioquımica, yPlataforma Andaluza de Bioinformatica, Universidad deMalaga, 29071 Malaga, Spain
J. RubioArea de Mejora y Biotecnologıa, IFAPA Centro Alamedadel Obispo, Apdo 3092, 14080 Cordoba, Spain
J. Gil ! T. MillanDepartamento de Genetica, Universidad de Cordoba,Campus Rabanales, Edif. C5, 14071 Cordoba, Spain
123
Euphytica (2014) 198:69–78
DOI 10.1007/s10681-014-1084-6
SNP
SNP
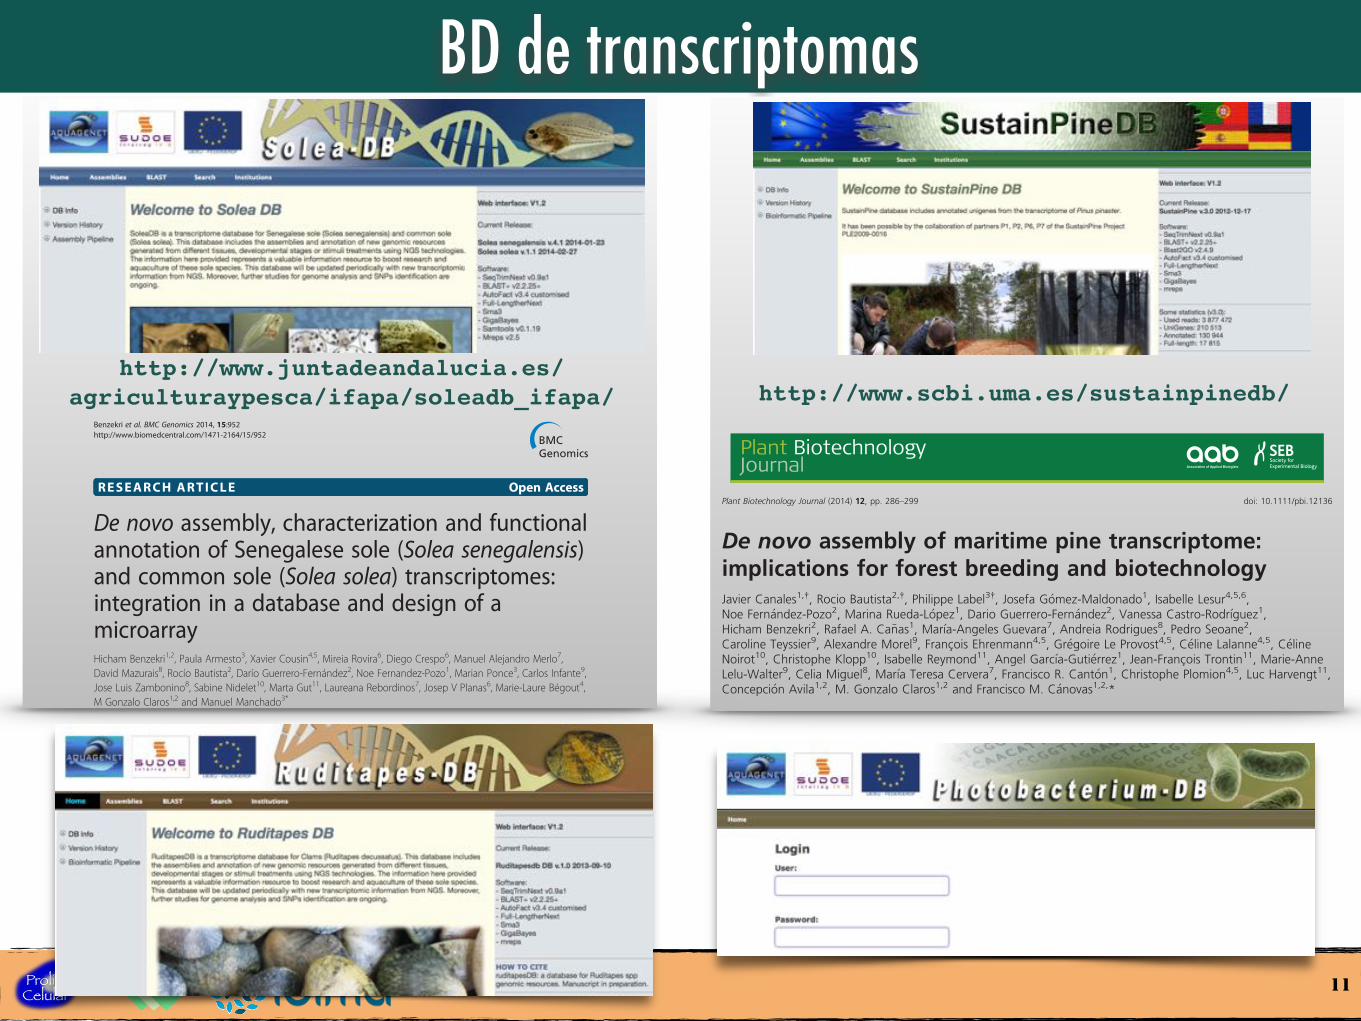
BD de transcriptomas
11
De novo assembly of maritime pine transcriptome:implications for forest breeding and biotechnologyJavier Canales1,†, Rocio Bautista2,†, Philippe Label3†, Josefa G!omez-Maldonado1, Isabelle Lesur4,5,6,Noe Fern!andez-Pozo2, Marina Rueda-L!opez1, Dario Guerrero-Fern!andez2, Vanessa Castro-Rodr!ıguez1,Hicham Benzekri2, Rafael A. Ca~nas1, Mar!ıa-Angeles Guevara7, Andreia Rodrigues8, Pedro Seoane2,Caroline Teyssier9, Alexandre Morel9, Franc!ois Ehrenmann4,5, Gr!egoire Le Provost4,5, C!eline Lalanne4,5, C!elineNoirot10, Christophe Klopp10, Isabelle Reymond11, Angel Garc!ıa-Guti!errez1, Jean-Franc!ois Trontin11, Marie-AnneLelu-Walter9, Celia Miguel8, Mar!ıa Teresa Cervera7, Francisco R. Cant!on1, Christophe Plomion4,5, Luc Harvengt11,Concepci!on Avila1,2, M. Gonzalo Claros1,2 and Francisco M. C!anovas1,2,*
1Departamento de Biolog!ıa Molecular y Bioqu!ımica, Facultad de Ciencias, Universidad de M!alaga, M!alaga, Spain2Plataforma Andaluza de Bioinform!atica, Edificio de Bioinnovaci!on, Parque Tecnol!ogico de Andaluc!ıa, M!alaga, Spain3INRA, Universit!e Blaise Pascal, Aubi"ere Cedex, France4INRA, Cestas, France5Universit!e de Bordeaux, Talence, France6HelixVenture, M!erignac, France7Departamento de Ecolog!ıa y Gen!etica Forestal, INIA-CIFOR, Madrid, Spain8Forest Biotech Lab, IBET/ITQB, Oeiras, Portugal9INRA, Unit!e Am!elioration, G!en!etique et Physiologie Foresti"eres, Orl!eans Cedex 2, France10INRA de Toulouse Midi-Pyr!en!ees, Auzeville, Castanet Tolosan cedex, France11FCBA, Pole Biotechnologie et Sylviculture, Cestas, France
Received 20 July 2013;
revised 24 September 2013;
accepted 26 September 2013.
*Correspondence (Tel: +34 952131942;
fax: +34 952132376;
email: [email protected])†These authors contributed equally to work.
Keywords: conifers, transcriptome
sequencing, next-generation
sequencing, full-length cDNA,
transcription factors, single nucleotide
polymorphism.
SummaryMaritime pine (Pinus pinaster Ait.) is a widely distributed conifer species in SouthwesternEurope and one of the most advanced models for conifer research. In the current work,comprehensive characterization of the maritime pine transcriptome was performed using acombination of two different next-generation sequencing platforms, 454 and Illumina.De novo assembly of the transcriptome provided a catalogue of 26 020 unique transcripts inmaritime pine trees and a collection of 9641 full-length cDNAs. Quality of the transcriptomeassembly was validated by RT-PCR amplification of selected transcripts for structural andregulatory genes. Transcription factors and enzyme-encoding transcripts were annotated.Furthermore, the available sequencing data permitted the identification of polymorphisms andthe establishment of robust single nucleotide polymorphism (SNP) and simple-sequence repeat(SSR) databases for genotyping applications and integration of translational genomics inmaritime pine breeding programmes. All our data are freely available at SustainpineDB, theP. pinaster expressional database. Results reported here on the maritime pine transcriptomerepresent a valuable resource for future basic and applied studies on this ecological andeconomically important pine species.
Introduction
Forests are essential components of the ecosystems coveringapproximately one-third of the Earth’s land area and playing afundamental role in the regulation of terrestrial carbon sinks.Trees represent nearly 80% of the plant biomass (Olson et al.,1983) and 50%–60% of annual net primary production interrestrial ecosystems (Field et al., 1998).
Conifers are the most important group of gymnosperms.Having diverged from a common ancestor more than 300million years ago (Bowe et al., 2000), gymnosperms andangiosperms have evolved very efficient and distinct physiolog-ical adaptations (Leitch and Leitch, 2012). Coniferous forestsdominate large ecosystems in the Northern Hemisphere andinclude a broad variety of woody plant species, some of whichare the largest, tallest and longest living organisms on Earth
(Farjon, 2010). Conifer trees are also of great economicimportance, as they are the primary source for timber andpaper production worldwide. Total timber production in theEuropean Union in 2011 was 427 million m3 (UNECE, 2013).Approximately 22% was used to produce energy, while therest was used to supply industrial demands. A study of UnitedNations Economic Commission for Europe/Food and AgricultureOrganization (UNECE/FAO) point out that the future needs inforest biomass to meet the demands of industrial wood as anenergy source will exceed production by 2020. The develop-ment of a more productive and sustainable forest plantation isessential to meet the increasing demand of wood worldwidetogether with minimizing environmental impacts (e.g. decreas-ing pressure on natural forests).
The extant conifers comprise 615 species classified into eightfamilies within the division Pinophyta (Farjon, 2010). Some of the
286 ª 2013 Society for Experimental Biology, Association of Applied Biologists and John Wiley & Sons Ltd
Plant Biotechnology Journal (2014) 12, pp. 286–299 doi: 10.1111/pbi.12136
http://www.scbi.uma.es/sustainpinedb/
RESEARCH ARTICLE Open Access
De novo assembly, characterization and functionalannotation of Senegalese sole (Solea senegalensis)and common sole (Solea solea) transcriptomes:integration in a database and design of amicroarrayHicham Benzekri1,2, Paula Armesto3, Xavier Cousin4,5, Mireia Rovira6, Diego Crespo6, Manuel Alejandro Merlo7,David Mazurais8, Rocío Bautista2, Darío Guerrero-Fernández2, Noe Fernandez-Pozo1, Marian Ponce3, Carlos Infante9,Jose Luis Zambonino8, Sabine Nidelet10, Marta Gut11, Laureana Rebordinos7, Josep V Planas6, Marie-Laure Bégout4,M Gonzalo Claros1,2 and Manuel Manchado3*
Abstract
Background: Senegalese sole (Solea senegalensis) and common sole (S. solea) are two economically andevolutionary important flatfish species both in fisheries and aquaculture. Although some genomic resources andtools were recently described in these species, further sequencing efforts are required to establish a completetranscriptome, and to identify new molecular markers. Moreover, the comparative analysis of transcriptomes will beuseful to understand flatfish evolution.
Results: A comprehensive characterization of the transcriptome for each species was carried out using a large setof Illumina data (more than 1,800 millions reads for each sole species) and 454 reads (more than 5 millions readsonly in S. senegalensis), providing coverages ranging from 1,384x to 2,543x. After a de novo assembly, 45,063 and38,402 different transcripts were obtained, comprising 18,738 and 22,683 full-length cDNAs in S. senegalensis and S.solea, respectively. A reference transcriptome with the longest unique transcripts and putative non-redundant newtranscripts was established for each species. A subset of 11,953 reference transcripts was qualified as highly reliableorthologs (>97% identity) between both species. A small subset of putative species-specific, lineage-specific andflatfish-specific transcripts were also identified. Furthermore, transcriptome data permitted the identification of singlenucleotide polymorphisms and simple-sequence repeats confirmed by FISH to be used in further genetic and expressionstudies. Moreover, evidences on the retention of crystallins crybb1, crybb1-like and crybb3 in the two species of soles arealso presented. Transcriptome information was applied to the design of a microarray tool in S. senegalensis that wassuccessfully tested and validated by qPCR. Finally, transcriptomic data were hosted and structured at SoleaDB.
Conclusions: Transcriptomes and molecular markers identified in this study represent a valuable source for futuregenomic studies in these economically important species. Orthology analysis provided new clues regarding solegenome evolution indicating a divergent evolution of crystallins in flatfish. The design of a microarray and establishmentof a reference transcriptome will be useful for large-scale gene expression studies. Moreover, the integration oftranscriptomic data in the SoleaDB will facilitate the management of genomic information in these important species.
Keywords: Soles, Transcriptome, Microarray, Orthology, Molecular markers, SoleaDB
* Correspondence: [email protected] Centro El Toruño, IFAPA, Consejeria de Agricultura y Pesca, 11500 ElPuerto de Santa María, Cádiz, SpainFull list of author information is available at the end of the article
© 2014 Benzekri et al.; licensee BioMed Central Ltd. This is an Open Access article distributed under the terms of the CreativeCommons Attribution License (http://creativecommons.org/licenses/by/4.0), which permits unrestricted use, distribution, andreproduction in any medium, provided the original work is properly credited. The Creative Commons Public DomainDedication waiver (http://creativecommons.org/publicdomain/zero/1.0/) applies to the data made available in this article,unless otherwise stated.
Benzekri et al. BMC Genomics 2014, 15:952http://www.biomedcentral.com/1471-2164/15/952
http://www.juntadeandalucia.es/agriculturaypesca/ifapa/soleadb_ifapa/
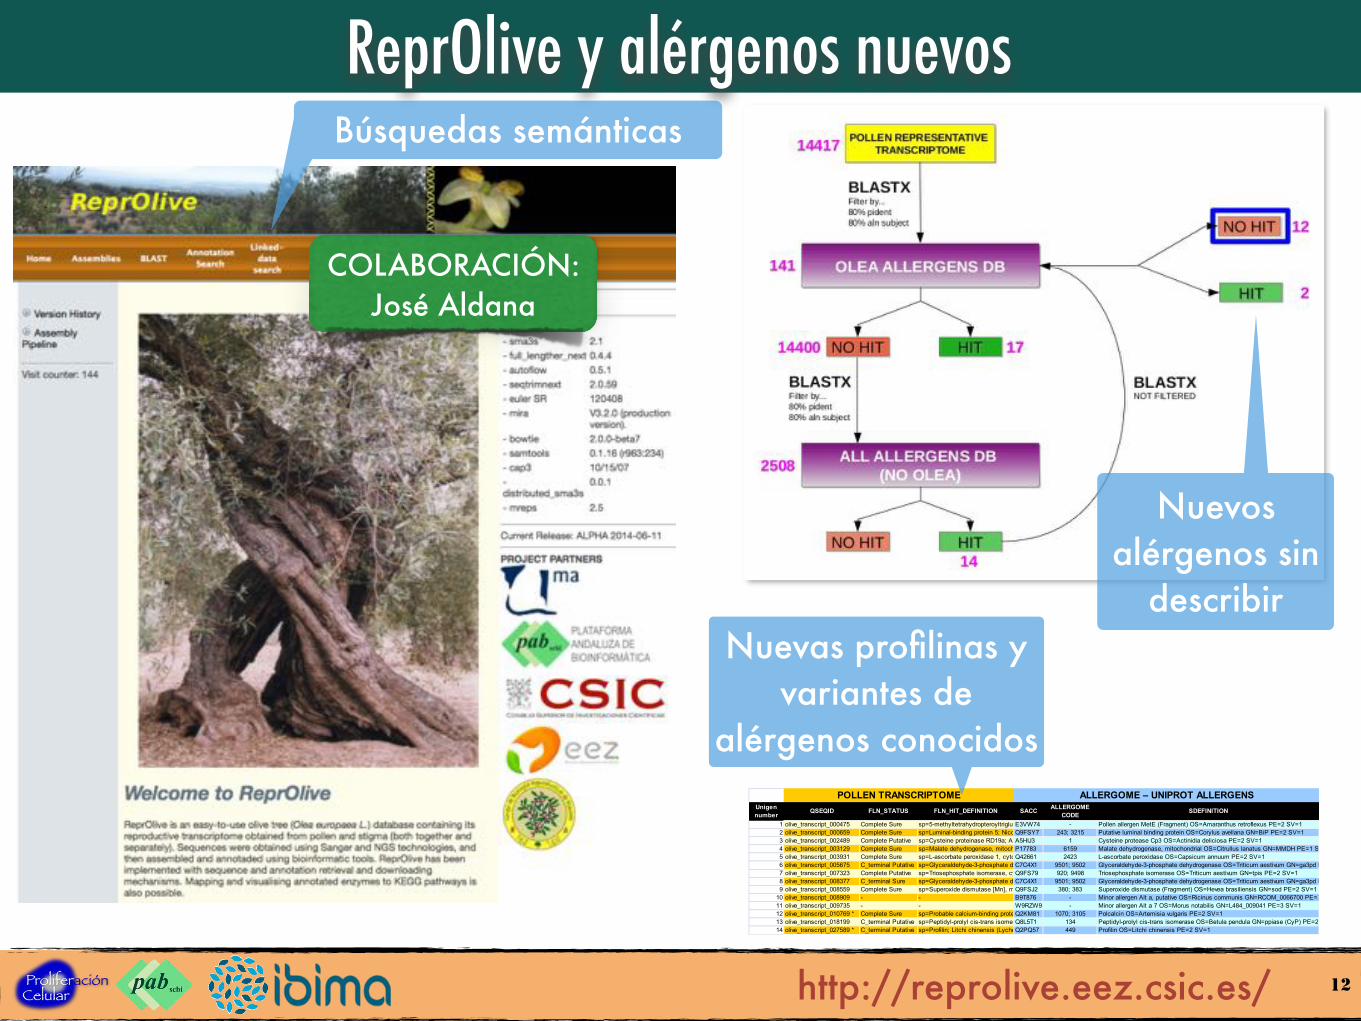
ReprOlive y alérgenos nuevos
12
Unigen number QSEQID FLN_STATUS FLN_HIT_DEFINITION SACC ALLERGOME
CODE SDEFINITION
1 olive_transcript_000475 Complete Sure sp=5-methyltetrahydropteroyltriglutamate--homocysteine methyltransferase; Catharanthus roseus (Madagascar periwinkle) (Vinca rosea).E3VW74 - Pollen allergen MetE (Fragment) OS=Amaranthus retroflexus PE=2 SV=12 olive_transcript_000659 Complete Sure sp=Luminal-binding protein 5; Nicotiana tabacum (Common tobacco).Q9FSY7 243; 3215 Putative luminal binding protein OS=Corylus avellana GN=BiP PE=2 SV=13 olive_transcript_002489 Complete Putative sp=Cysteine proteinase RD19a; Arabidopsis thaliana (Mouse-ear cress).A5HIJ3 1 Cysteine protease Cp3 OS=Actinidia deliciosa PE=2 SV=14 olive_transcript_003129 Complete Sure sp=Malate dehydrogenase, mitochondrial; Fragaria ananassa (Strawberry).P17783 6159 Malate dehydrogenase, mitochondrial OS=Citrullus lanatus GN=MMDH PE=1 SV=15 olive_transcript_003931 Complete Sure sp=L-ascorbate peroxidase 1, cytosolic; Arabidopsis thaliana (Mouse-ear cress).Q42661 2423 L-ascorbate peroxidase OS=Capsicum annuum PE=2 SV=16 olive_transcript_005675 C_terminal Putative sp=Glyceraldehyde-3-phosphate dehydrogenase, cytosolic; Petroselinum crispum (Parsley) (Petroselinum hortense).C7C4X1 9501; 9502 Glyceraldehyde-3-phosphate dehydrogenase OS=Triticum aestivum GN=ga3pd PE=2 SV=17 olive_transcript_007323 Complete Putative sp=Triosephosphate isomerase, cytosolic; Petunia hybrida (Petunia).Q9FS79 920; 9498 Triosephosphate isomerase OS=Triticum aestivum GN=tpis PE=2 SV=18 olive_transcript_008377 C_terminal Sure sp=Glyceraldehyde-3-phosphate dehydrogenase, cytosolic; Antirrhinum majus (Garden snapdragon).C7C4X1 9501; 9502 Glyceraldehyde-3-phosphate dehydrogenase OS=Triticum aestivum GN=ga3pd PE=2 SV=19 olive_transcript_008559 Complete Sure sp=Superoxide dismutase [Mn], mitochondrial; Nicotiana plumbaginifolia (Leadwort-leaved tobacco) (Tex-Mex tobacco).Q9FSJ2 380; 383 Superoxide dismutase (Fragment) OS=Hevea brasiliensis GN=sod PE=2 SV=1
10 olive_transcript_008909 - - B9T876 - Minor allergen Alt a, putative OS=Ricinus communis GN=RCOM_0066700 PE=3 SV=111 olive_transcript_009735 - - W9RZW9 - Minor allergen Alt a 7 OS=Morus notabilis GN=L484_009041 PE=3 SV=112 olive_transcript_010769 * Complete Sure sp=Probable calcium-binding protein CML13; Arabidopsis thaliana (Mouse-ear cress).Q2KM81 1070; 3105 Polcalcin OS=Artemisia vulgaris PE=2 SV=113 olive_transcript_018199 C_terminal Putative sp=Peptidyl-prolyl cis-trans isomerase 1; Glycine max (Soybean) (Glycine hispida).Q8L5T1 134 Peptidyl-prolyl cis-trans isomerase OS=Betula pendula GN=ppiase (CyP) PE=2 SV=114 olive_transcript_027589 * C_terminal Putative sp=Profilin; Litchi chinensis (Lychee).Q2PQ57 449 Profilin OS=Litchi chinensis PE=2 SV=1
POLLEN TRANSCRIPTOME ALLERGOME – UNIPROT ALLERGENS
Nuevos alérgenos sin
describirNuevas profilinas y
variantes de alérgenos conocidos
http://reprolive.eez.csic.es/
Búsquedas semánticas
COLABORACIÓN: José Aldana
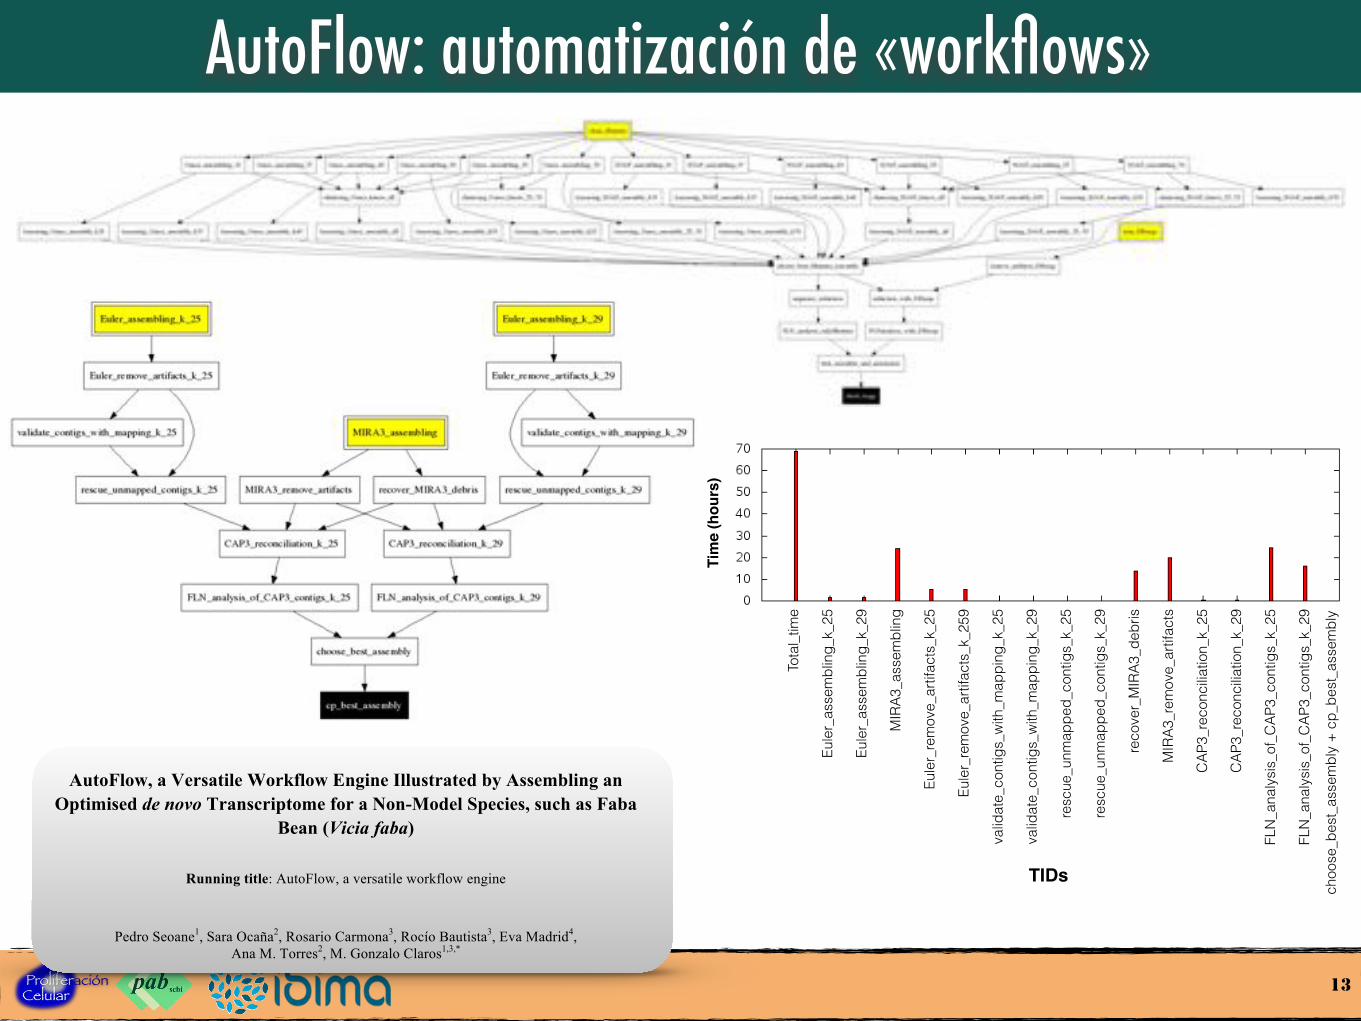
AutoFlow: automatización de «workflows»
13
Figure 4
Tim
e (h
ours
)
Tota
l_tim
e
Eule
r_as
sem
blin
g_k_
25
Eule
r_as
sem
blin
g_k_
29
MIR
A3_a
ssem
blin
g
Eule
r_re
mov
e_ar
tifac
ts_k
_25
Eule
r_re
mov
e_ar
tifac
ts_k
_259
valid
ate_
cont
igs_
with
_map
ping
_k_2
5
valid
ate_
cont
igs_
with
_map
ping
_k_2
9
resc
ue_u
nmap
ped_
cont
igs_
k_25
resc
ue_u
nmap
ped_
cont
igs_
k_29
reco
ver_
MIR
A3_d
ebris
MIR
A3_r
emov
e_ar
tifac
ts
CAP
3_re
conc
iliatio
n_k_
25
CAP
3_re
conc
iliatio
n_k_
29
FLN
_ana
lysi
s_of
_CAP
3_co
ntig
s_k_
25
FLN
_ana
lysi
s_of
_CAP
3_co
ntig
s_k_
29
TIDs
choo
se_b
est_
asse
mbl
y +
cp_b
est_
asse
mbl
y
AutoFlow, a Versatile Workflow Engine Illustrated by Assembling an Optimised de novo Transcriptome for a Non-Model Species, such as Faba
Bean (Vicia faba)
Running title: AutoFlow, a versatile workflow engine
Pedro Seoane1, Sara Ocaña2, Rosario Carmona3, Rocío Bautista3, Eva Madrid4, Ana M. Torres2, M. Gonzalo Claros1,3,*
1 Departamento de Biología Molecular y Bioquímica, Universidad de Málaga, E-29071, Malaga, Spain
2 Área de Mejora y Biotecnología, IFAPA Centro “Alameda del Obispo”, Apdo 3092, E-14080 Cordoba, Spain
3 Plataforma Andaluza de Bioinformática, Universidad de Málaga, E-29071 Malaga, Spain
4 Institute for Sustainable Agriculture, CSIC, Apdo 4084, E-14080 Cordoba, Spain
* Corresponding author
Manuel Gonzalo Claros Díaz
Departamento de Biología Molecular y Bioquímica,
Facultad de Ciencias, Universidad de Málaga,
E-29071, Malaga (Spain)
Fax: +34 95 213 20 41
Tel: +34 95 213 72 84
E-mail: [email protected]
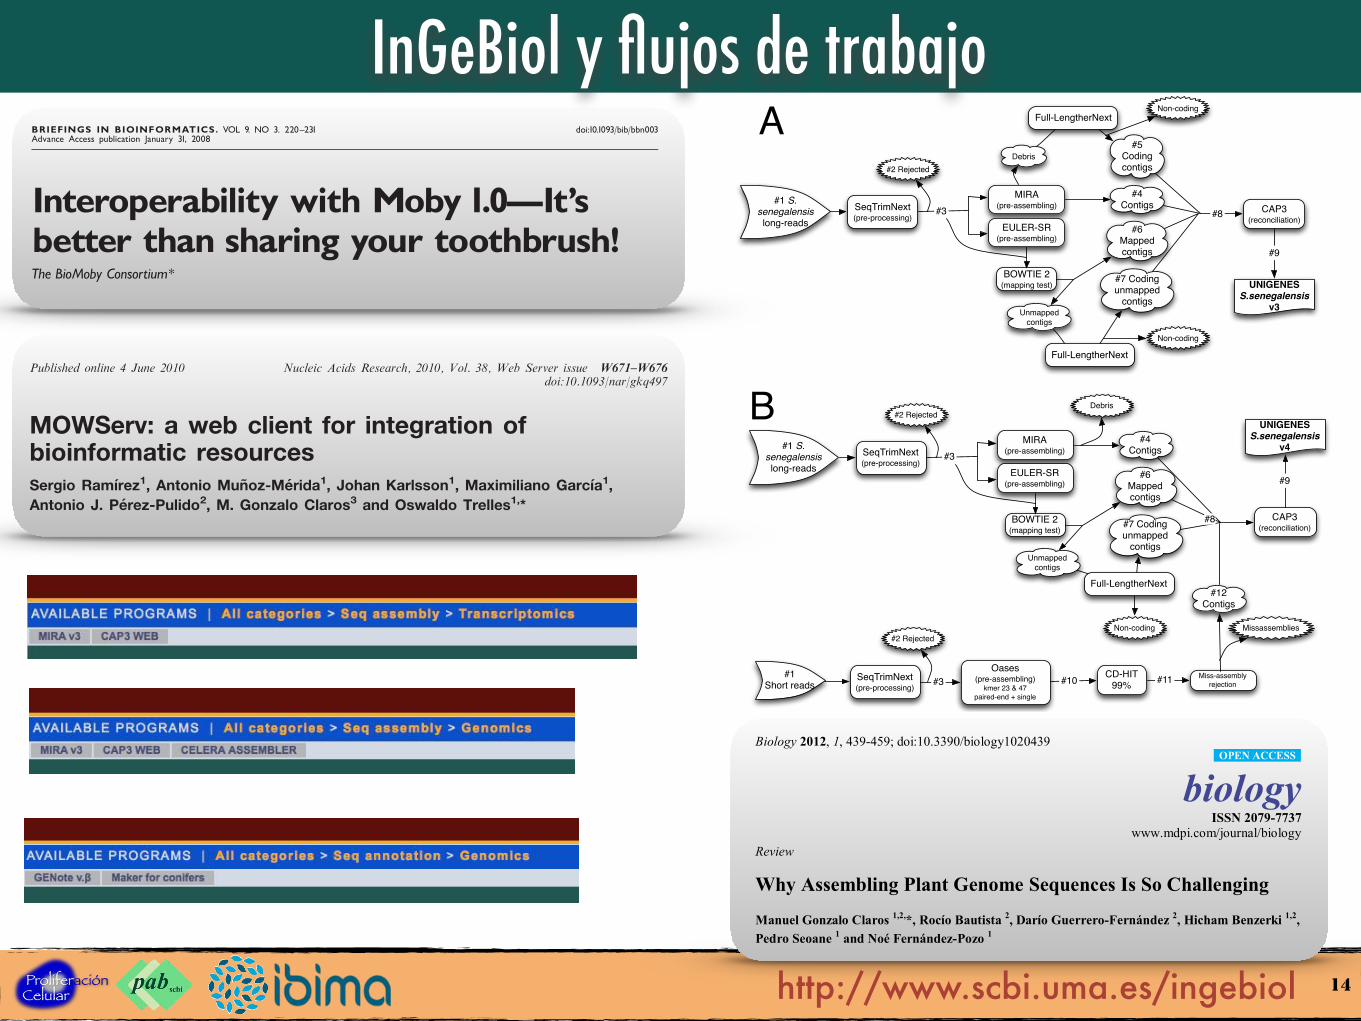
#1 S. senegalensis
long-readsSeqTrimNext(pre-processing)
MIRA(pre-assembling)
EULER-SR(pre-assembling)
Debris
CAP3(reconciliation)
Unmapped contigs
Full-LengtherNext
UNIGENESS.senegalensis
v3
#6 Mapped contigs
#4 Contigs
#5 Coding contigs
Non-coding
Non-coding
#7 Coding unmapped
contigs
BOWTIE 2(mapping test)
#3
A#2 Rejected
Full-LengtherNext
#8
#9
#1Short reads
SeqTrimNext(pre-processing)
Oases(pre-assembling)
kmer 23 & 47paired-end + single
CD-HIT 99%
Miss-assembly rejection#3
#2 Rejected
#1 S. senegalensis
long-readsSeqTrimNext(pre-processing)
MIRA(pre-assembling)
EULER-SR(pre-assembling)
CAP3(reconciliation)
Unmapped contigs
UNIGENESS.senegalensis
v4
#6 Mapped contigs
#4 Contigs
Debris
Non-coding
#7 Coding unmapped
contigs
BOWTIE 2(mapping test)
#3
B #2 Rejected
#9
#10 #11
Full-LengtherNext
Missassemblies
#12 Contigs
#8
InGeBiol y flujos de trabajo
14
MOWServ: a web client for integration ofbioinformatic resourcesSergio Ramırez1, Antonio Munoz-Merida1, Johan Karlsson1, Maximiliano Garcıa1,Antonio J. Perez-Pulido2, M. Gonzalo Claros3 and Oswaldo Trelles1,*
1Departamento Arquitectura de Computadores, Escuela Tecnica Superior de Ingenierıa Informatica,Universidad de Malaga, Malaga, 2Centro Andaluz de Biologıa del Desarrollo (CSIC-UPO), Universidad Pablode Olavide, Sevilla and 3Departamento de Biologıa Molecular y Bioquımica, Facultad de Ciencias,Universidad de Malaga, Malaga, Spain
Received February 5, 2010; Revised May 12, 2010; Accepted May 18, 2010
ABSTRACT
The productivity of any scientist is affected by cum-bersome, tedious and time-consuming tasks that tryto make the heterogeneous web services compat-ible so that they can be useful in their research.MOWServ, the bioinformatic platform offered bythe Spanish National Institute of Bioinformatics,was released to provide integrated access to data-bases and analytical tools. Since its release, thenumber of available services has grown dramatical-ly, and it has become one of the main contributors ofregistered services in the EMBRACE Biocatalogue.The ontology that enables most of the web-servicecompatibility has been curated, improved andextended. The service discovery has been greatlyenhanced by Magallanes software and biodataSF.User data are securely stored on the main serverby an authentication protocol that enables the moni-toring of current or already-finished user’s tasks, aswell as the pipelining of successive data processingservices. The BioMoby standard has been greatlyextended with the new features included in theMOWServ, such as management of additional infor-mation (metadata such as extended descriptions,keywords and datafile examples), a qualified registry,error handling, asynchronous services and servicereplication. All of them have increased the MOWServservice quality, usability and robustness. MOWServ isavailable at http://www.inab.org/MOWServ/ and hasa mirror at http://www.bitlab-es.com/MOWServ/.
INTRODUCTION
Diversity, heterogeneity and geographical dispersion ofbiological data constitute problems that hinder the poten-tial integration of such information. Therefore, research-er’s productivity is affected by tedious, time-consumingand prone-to-error tasks such as searching for the appro-priate web services, collecting URLs, familiarizing them-selves with the different service interfaces, transferringdata from one service to another, formatting data forcompatibility purposes or copy/paste data in web-formswith different interfaces, to mention a few. The develop-ment of systems for interprocess communication has beenpreviously carried out with different goals: gatheringmultiple services with reliable access (1), providingaccess to a collection of independent analysis tools (2,3)or enabling the communication between a reduced set oftools (4–7). Standardization of bioinformatics services hasalso been largely analysed (8–15), standing-up over themthe use of web-services designed to support automaticmachine-to-machine interaction over a network, repre-senting BioMoby (16) the more successful case. In fact,the development of low-level data-interchange methodsbased on a specific ontology, together with the abilityfor wiring services to build powerful bioinformaticmachines, has been revealed as the most promisingsolution (17) as the growing number of web-basedservices for integrating bioinformatic tools demonstrates.MOWServ (18), the bioinformatic platform offered by theSpanish National Institute of Bioinformatics (INB),provides an integrated access to databases and analyticaltools and has strongly contributed to the development ofthe standard BioMoby protocol (17). In this article, the
*To whom correspondence should be addressed. Tel: +34 952 13 2823; Fax: +34 952 13 2790; Email: [email protected]
The authors wish it to be known that, in their opinion, the first two authors should be regarded as joint First Authors.
Published online 4 June 2010 Nucleic Acids Research, 2010, Vol. 38, Web Server issue W671–W676doi:10.1093/nar/gkq497
! The Author(s) 2010. Published by Oxford University Press.This is an Open Access article distributed under the terms of the Creative Commons Attribution Non-Commercial License (http://creativecommons.org/licenses/by-nc/2.5), which permits unrestricted non-commercial use, distribution, and reproduction in any medium, provided the original work is properly cited.
by on July 20, 2010 http://nar.oxfordjournals.org
Dow
nloaded from
Interoperability with Moby 1.0çIt’sbetter than sharing your toothbrush!The BioMoby Consortium*Submitted: 16th November 2007; Received (in revised form): 2nd January 2008
AbstractThe BioMoby project was initiated in 2001 from within the model organism database community. It aimed tostandardize methodologies to facilitate information exchange and access to analytical resources, using a consensusdriven approach. Six years later, the BioMoby development community is pleased to announce the release of the1.0 version of the interoperability framework, registry Application Programming Interface and supporting Perl andJava code-bases. Together, these provide interoperable access to over 1400 bioinformatics resources worldwidethrough the BioMoby platform, and this number continues to grow. Here we highlight and discuss the features ofBioMoby that make it distinct from other Semantic Web Service and interoperability initiatives, and that have beeninstrumental to its deployment and use by a wide community of bioinformatics service providers. The standard,client software, and supporting code libraries are all freely available at http://www.biomoby.org/.
Keywords: semantic web; web services; interoperability; data integration; biomoby; schema
INTRODUCTIONDiscovery of, and easy access to, biological data andbioinformatics software is the critical bottleneck forsystems biologists, resulting in missed scientificopportunities and lost productivity due to expensiveand unsustainable efforts in data warehousing, or thedesign of ad hoc and transient Web-based analyticalworkflows. Workflow-design itself is neither trivialnor reliable for most systems biology researchers since,often, a high level of prior-knowledge and under-standing of available Web-based resources is requiredfrom the biologist. Indeed, in his article ‘Creatinga Bioinformatics Nation’ [1], Lincoln Stein suggeststhat it is the lack of interoperable standards thathas hindered the integration of scientific datasetsworldwide. Conversely, in her keynote address tothe EGEE ‘06 conference, Carole Goble purposely
misquoted Michael Ashburner [2] when she stated‘Scientists would rather share their toothbrush thantheir data!’ These statements highlight the twosomewhat opposing requirements that must beconsidered when designing interoperable systems forthe bioinformatics domain. On one hand, thebioinformatics service provider community is com-posed of individuals with a wide variety of differentexpertise, thus any interoperability proposal must belimited in complexity and must focus on comprehen-sibility to non-computer-scientists; on the otherhand, the functionality gained by participating inthe interoperability framework must be sufficientlycompelling for individual providers to be willing toopenly share data that is, in some cases, personallyprecious. These considerations were key in establish-ing the technologies and practices defined by
*Full authorship: Mark D Wilkinson, Martin Senger, Edward Kawas, Richard Bruskiewich, Jerome Gouzy, Celine Noirot, PhilippeBardou, Ambrose Ng, Dirk Haase, Enrique de Andres Saiz, Dennis Wang, Frank Gibbons, Paul M.K. Gordon, Christoph W. Sensen,
Jose Manuel Rodriguez Carrasco, Jose M. Fernandez, Lixin Shen, Matthew Links, Michael Ng, Nina Opushneva, Pieter B.T.Neerincx, Jack A.M. Leunissen, Rebecca Ernst, Simon Twigger, Bjorn Usadel, Benjamin Good, Yan Wong, Lincoln Stein, WilliamCrosby, Johan Karlsson, Romina Royo, Ivan Parraga, Sergio Ramırez, Josep Lluis Gelpi, Oswaldo Trelles, David G. Pisano, NataliaJimenez, Arnaud Kerhornou, Roman Rosset, Leire Zamacola, Joaquin Tarraga, Jaime Huerta-Cepas, Jose Marıa Carazo, Joaquin
Dopazo, Roderic Guigo, Arcadi Navarro, Modesto Orozco, Alfonso Valencia, M. Gonzalo Claros, Antonio J. Perez, Jose Aldana,M. Mar Rojano, Raul Fernandez-Santa Cruz, Ismael Navas, Gary Schiltz, Andrew Farmer, Damian Gessler, Heiko Schoof, AndreasGroscurth.
Corresponding author. Dr Mark Wilkinson, Room 166, 1081 Burrard St. The Heart and Lung Research Institute at St. Paul’sHospital, Vancouver, BC, Canada, V6G 1Y3. Tel: +1 604 682 2344 !62129; Fax: +1 604 806 9274; E-mail: [email protected]
BioMoby is a project within the larger Open Bioinformatics Foundation. The BioMoby Consortium consists of more than 40
participants spanning 13 nations, and participation is free and open to all.
BRIEFINGS IN BIOINFORMATICS. VOL 9. NO 3. 220^231 doi:10.1093/bib/bbn003Advance Access publication January 31, 2008
! The Author 2008. Published by Oxford University Press. For Permissions, please email: [email protected]
Biology 2012, 1, 439-459; doi:10.3390/biology1020439
biologyISSN 2079-7737
www.mdpi.com/journal/biology Review
Why Assembling Plant Genome Sequences Is So Challenging Manuel Gonzalo Claros 1,2,*, Rocío Bautista 2, Darío Guerrero-Fernández 2, Hicham Benzerki 1,2, Pedro Seoane 1 and Noé Fernández-Pozo 1
1 Department of Molecular Biology and Biochemistry, Faculty of Sciences, University of Malaga, 29071 Málaga, Spain; E-Mails: [email protected] (H.B.); [email protected] (P.S.); [email protected] (N.F.-P.)
2 Bioinformatics Andalusian Platform, Bio-innovation Building, University of Malaga, 29590 Málaga, Spain; E-Mails: [email protected] (R.B.); [email protected] (D.G.-F.)
* Author to whom correspondence should be addressed; E-Mail: [email protected]; Tel.: +34-951-952-787; Fax: +34-952-132-041.
Received: 16 July 2012; in revised form: 5 September 2012 / Accepted: 6 September 2012 / Published: 18 September 2012
Abstract: In spite of the biological and economic importance of plants, relatively few plant species have been sequenced. Only the genome sequence of plants with relatively small genomes, most of them angiosperms, in particular eudicots, has been determined. The arrival of next-generation sequencing technologies has allowed the rapid and efficient development of new genomic resources for non-model or orphan plant species. But the sequencing pace of plants is far from that of animals and microorganisms. This review focuses on the typical challenges of plant genomes that can explain why plant genomics is less developed than animal genomics. Explanations about the impact of some confounding factors emerging from the nature of plant genomes are given. As a result of these challenges and confounding factors, the correct assembly and annotation of plant genomes is hindered, genome drafts are produced, and advances in plant genomics are delayed.
Keywords: plant sequencing; NGS; complexity; repeats; assemblers; polyploidy; bioinformatics
OPEN ACCESS
http://www.scbi.uma.es/ingebiol
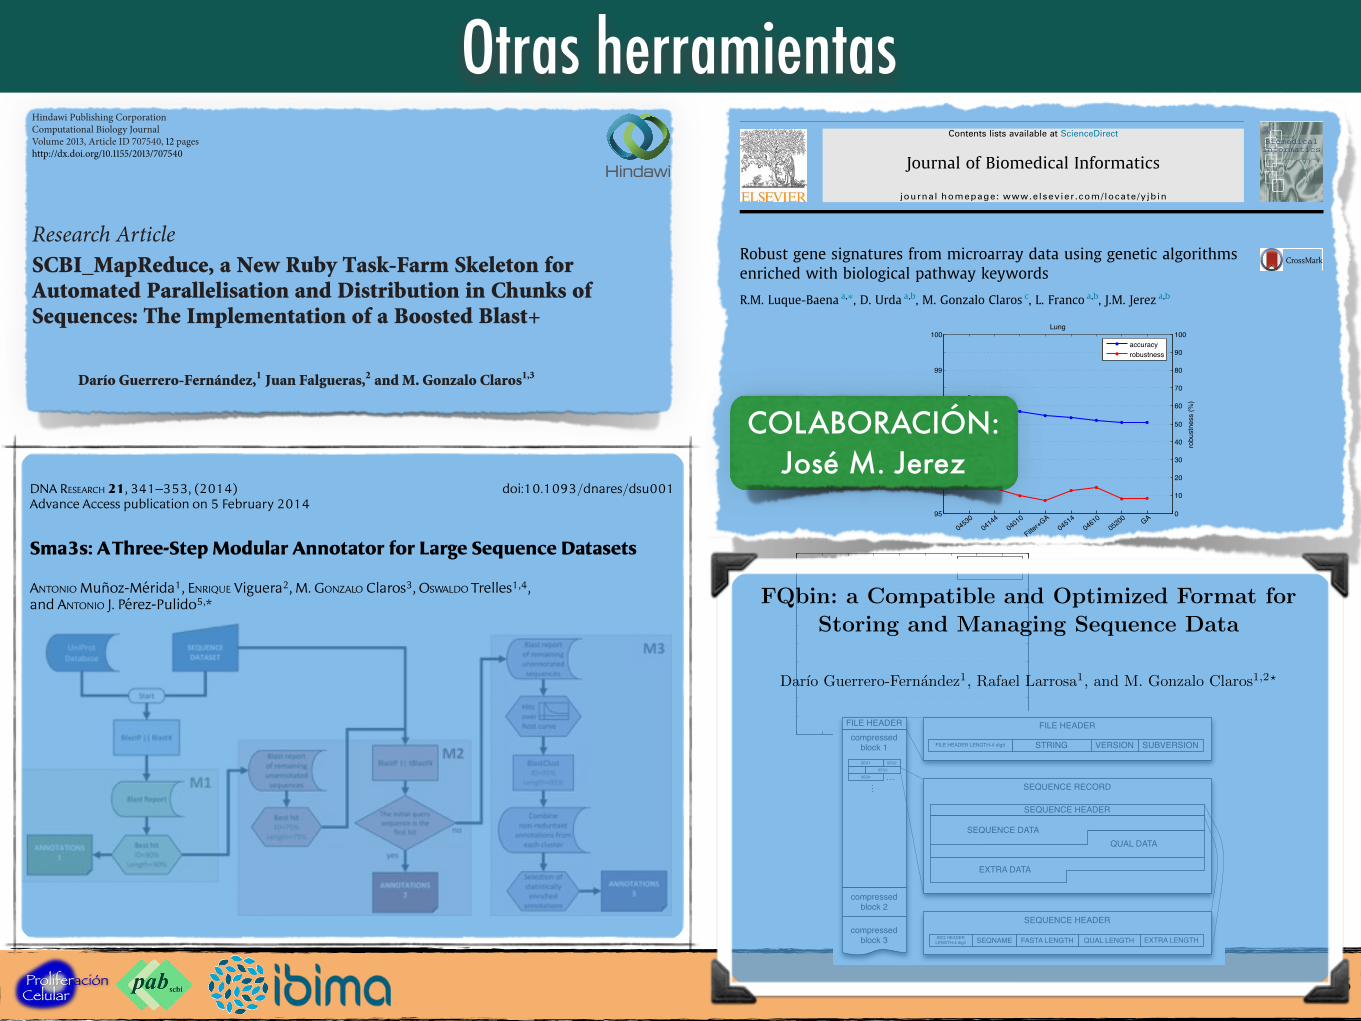
Otras herramientas
15
Hindawi Publishing CorporationComputational Biology JournalVolume 2013, Article ID 707540, 12 pageshttp://dx.doi.org/10.1155/2013/707540
Research ArticleSCBI_MapReduce, a New Ruby Task-Farm Skeleton forAutomated Parallelisation and Distribution in Chunks ofSequences: The Implementation of a Boosted Blast+
Darío Guerrero-Fernández,1 Juan Falgueras,2 and M. Gonzalo Claros1,3
1 Supercomputacion y Bioinformatica-Plataforma Andaluza de Bioinformatica (SCBI-PAB), Universidad de Malaga,29071Malaga, Spain
2Departamento de Lenguajes y Ciencias de la Computacion, Universidad de Malaga, 29071Malaga, Spain3Departamento de Biologıa Molecular y Bioquımica, Universidad de Malaga, 29071Malaga, Spain
Correspondence should be addressed to M. Gonzalo Claros; [email protected]
Received 21 June 2013; Revised 18 September 2013; Accepted 19 September 2013
Academic Editor: Ivan Merelli
Copyright © 2013 Darıo Guerrero-Fernandez et al. This is an open access article distributed under the Creative CommonsAttribution License, which permits unrestricted use, distribution, and reproduction in any medium, provided the original work isproperly cited.
Current genomic analyses often require the managing and comparison of big data using desktop bioinformatic software that wasnot developed regarding multicore distribution.The task-farm SCBI MapReduce is intended to simplify the trivial parallelisationand distribution of new and legacy software and scripts for biologists who are interested in using computers but are not skilledprogrammers. In the case of legacy applications, there is no need of modification or rewriting the source code. It can be used frommulticore workstations to heterogeneous grids. Tests have demonstrated that speed-up scales almost linearly and that distributionin small chunks increases it. It is also shown that SCBI MapReduce takes advantage of shared storage when necessary, is fault-tolerant, allows for resuming aborted jobs, does not need special hardware or virtualmachine support, and provides the same resultsthan a parallelised, legacy software. The same is true for interrupted and relaunched jobs. As proof-of-concept, distribution of acompiled version of Blast+ in the SCBI Distributed Blast gem is given, indicating that other blast binaries can be used whilemaintaining the same SCBI Distributed Blast code. Therefore, SCBI MapReduce suits most parallelisation and distributionneeds in, for example, gene and genome studies.
1. Introduction
The study of genomes is undergoing a revolution: the produc-tion of an ever-growing amount of sequences increases yearby year at a rate that outpaces computing performance [1].This huge amount of sequences needs to be processed withthe well-proven algorithms that will not run faster in newcomputer chips since around 2003 chipmakers discoveredthat they were no longer able to sustain faster sequential exe-cution except for generating themulticore chips [2, 3].There-fore, the only current way to obtain results in a timelymanneris developing software dealing with multicore CPUs or clus-ters of multiprocessors. In such a context, “cloud computing”is becoming a cost-effective and powerful resource of multi-core clusters for task distribution in bioinformatics [1, 2].
Sequence alignment and comparison are themost impor-tant topics in bioinformatic studies of genes and genomes. It isa complex process that tries to optimise sequence homologyby means of sequence similarity using the algorithm ofNeedleman-Wunsch for global alignment, or the one ofSmith-Waterman for local alignments. Blast and Fasta [4]are the most widespread tools that have implemented them.Paired sequence comparison is inherently a parallel pro-cess in which many sequence pairs can be analysed at thesame time by means of functions or algorithms that are iter-atively performed over sequences. This is impelling the par-allelisation of sequence comparison algorithms [5–9] as wellas other bioinformatic algorithms [10, 11].
In most cases, the parallelised versions need to be rewrit-ten from scratch, including explicit parallel programming
93
94
95
96
97
98Leukemia
accu
racy
(%)
0
10
20
30
40
50
60
70
80
90
100
robu
stne
ss (%
)
0534004640
04662
Filter+GA
0467005200 GA
04062
accuracyrobustness
95
96
97
98
99
100Lung
accu
racy
(%)
0
10
20
30
40
50
60
70
80
90
100
robu
stne
ss (%
)
0453004144
04010
Filter+GA
0451404610
05200 GA
accuracyrobustness
88
89
90
91
92
93Prostate
accu
racy
(%)
0
10
20
30
40
50
60
70
80
90
100
robu
stne
ss (%
)
0098005215 GA
0004004610
00480
Filter+GA
04512
accuracyrobustness
Figure 3: Accuracy and robustness obtained for the selected pathways for each considered database(Leukemia, Lung and Prostate). The graphs include the results obtained when using a strategy basedonly on genetic algorithms (GA) and on genetic algorithms plus the filtering approach (Filter + GA)(see text for more details).
(prostacyclin) synthase, a protein of cytochrome P450 superfamily of enzymes, involvedin the synthesis of prostacyclin, a potent vasodilator and inhibitor of platelet aggregationthat is also related to myocardial infarction, stroke, and atherosclerosis, and thus couldbe also involved in lung cancer.
As an overall conclusion, the results obtained suggest the important role that theincorporation of biological information might play for carrying out a robust feature se-lection procedure for cancer (and may be any other disease) diagnostic. Moreover, thismay open the way to use GA for the prognosis of cancer diseases in a near future, aclinical aspect that is still concerning most oncologist and cancer patients.
Acknowledgements
The authors acknowledge support through grants TIN2010-16556 from MICINN-SPAIN and P08-TIC-04026 (Junta de Andalucıa), all of which include FEDER funds.
17
FQbin: a compatible, optimized sequence format 3
2.1 FQbin container format
The FQbin container gathers individual Fasta, Qual and Extras fields com-pressed in separate chunks for each sequence. Compressed chunks are then savedto disk interleaved with a header field for each sequence that will facilitate therandom access to any sequence. The simplified scheme of the FQbin containeris shown in Fig. 1. It starts with a file header, in which the first 4 bytes define itsvariable length, followed by a variable string containing a format identifier, andthen version and subversion fields to deal with future upgrades and improve-ments. Next, the first compressed block of data contains a maximum of 10 000sequence records, compressed as a unique zLib stream. The number of recordsin the block is not a↵ected by the sequence length. Every sequence record inthe compressed block contains a sequence header and the remaining data (basecalls, QV, Extras). The sequence header starts with 4 bytes that define itsvariable length. This is followed by four string-fields indicating the name (thatserves as an identifier [ID] for random access), the sequence length, the num-ber of QVs, if any, and the length of Extras, if available. Once the block isfull of records, the stream is closed and a new one is created. Organization inblocks requires decompression only of a single block—instead of the whole file—to gain access to a particular sequence, saving time and disk usage. As it willbe explained later (section 3.3), this separation in blocks also serves as a kind offirewall against data corruption. Compatibility with current and legacy softwareis guaranteed since the FQbin contents can be streamed to another programthat reads Fasta/Qual and FastQ formats (see section 2.4 below).
SEQUENCE HEADER
SEQUENCE RECORD
FILE HEADERcompressed
block 1
compressed block 2
compressed block 3
FILE HEADER
FILE HEADER LENGTH-4 digit STRING VERSION SUBVERSION
SEQNAME FASTA LENGTHSEQ HEADER LENGTH-4 digit QUAL LENGTH EXTRA LENGTH
SEQUENCE HEADER
SEQUENCE DATA QUAL DATA
EXTRA DATA
SEQ1
SEQ3
SEQ2
SEQ4 ……
Fig. 1. Scheme of FQbin container. The general format structure is shown on the left.Detailed description of every block is on the right. See text for details.
FQbin: a Compatible and Optimized Format forStoring and Managing Sequence Data
Darıo Guerrero-Fernandez1, Rafael Larrosa1, and M. Gonzalo Claros1,2?
1 Plataforma Andaluza de Bioinformatica-SCBI, Universidad de Malaga,C/ Severo Ochoa 34, 29590 Malaga, Spain
2 Departamento de Biologıa Molecular y Bioquımica, Facultad de Ciencias,Universidad de Malaga, 29071 Malaga, Spain {dariogf,rlarrosa,claros}@uma.es,
http://www.scbi.uma.es
Abstract. Existing hardware environments may be stressed when stor-ing and processing the enormous amount of data generated by next-generation sequencing technology. Here, we propose FQbin, a novel andversatile tool in C for compressing, storing and reading such sequencingdata in a new and Fasta/FastQ-compatible format that outperformsthe existing proposals. It is based on the general-purpose zLib libraryand o↵ers up to 10X compression. The compressed file is read and de-compressed up to three times faster than a FastQ file is read, and anearly ‘instant’ random access to every entry in the FQbin container isallowed. Fast file reading is maintained even in shared storage environ-ments, where di↵erent processes are simultaneously accessing the sameFQbin file. Slow networks can take even more advantage from FQbin.Therefore, FQbin o↵ers an equilibrium between compression, random ac-cess and compatibility by means of widely-used compression algorithmsand sequence formats.
Keywords: compression, FastQ, NGS, pipeline, workflow, zLib
? Corresponding author
used as an input seed in a blastp or tblastn searchagainst the initial set of query sequences. If thissecond BLAST identifies the starting query sequenceas the best hit, then an orthology relationship is estab-lished, and consequently, the annotation recovered.As in the previous step, Sma3s uses Swiss-Prot annota-tions in preference to TrEMBL (Table 1, see the nextsection for details).
Module 3: Module 3 recovers annotation informa-tion from multiple homologous sequences using anovel multi-step approach. The first step is to determinewhich homologues have sufficient similarity to thequery sequence. Work by Sander22 and Rost23 foundthat minimum alignment length was a better criterionthan overall percentage sequence identity for estimat-ing sequence and structural homology, especiallywhen comparing pairs of structurally matched proteinswith lower levels of similarity. Intuitively, for short se-quence alignments, a high percentage identity is
needed to establish statistically significant relation-ships. Conversely, long pairwise alignments requirelower identity to be qualified as significant. In thecontext of protein structure, a minimum threshold of!20%was foundtobeagoodpredictorofprotein struc-ture,providedthatthealignmenthada lengthofat least150 residues. Function is less well conserved than struc-ture, but further studies have reported that biologicalfunction is typically conserved when two sequencesexhibit 40% sequence identity.24 Thus, based on thehypothesis that function conservation is also relatedto sequence alignment length, we have used a modifiedform of Rost’s equation (see Materials and Methods fordetails) that only selects sequences whose alignmentshave at least 40% identity at any alignment length.
Although the sequences selected by this method canhave significantly lower similarities to those identifiedby Modules 1 and 2, the combined analyses of multiplesequences can be used to increase annotation reliabil-ity. This is based on the hypothesis that annotationsshared by several homologous sequences are morelikely to reflect functions shared by the query sequence.Module 3 uses biological enrichment to only selectthose terms which appear more frequently in the iden-tified homologues than would be expected by chance inthe source database (see ‘Statistical significance assess-ment of annotations’ in the Materials and Methodssection for details).
The presence of several redundant sequences in thesearch results could bias the term enrichment
Figure 1. Sma3s workflow. The first M1 module derives annotations from highly similar sequences stored in the database, choosing sequencesusing the Top-BLAST method, which selected the highest similarity homologue from each BLAST search that meets the minimum similaritycriteria. The remaining sequencesare passed to the secondmodule (M2),which performs reciprocal BLAST searchesto identifyorthologoussequences as annotation sources, also using the Top-BLAST method. Finally, the M3 module obtains annotations from a set of relatedsequences whose similarity is supported by statistically significant concentrations of similar annotations, filtered by clusteringtechniques to avoid over-representation from duplicated gene families. This figure appears in colour in the online version of DNA Research.
Table 1. Sma3s results with different source databases
Sn Sp REQ SCSwiss-Prot
0.83+0.13 0.87+0.07 0.19+0.15 0.87+0.13
TrEMBL 0.61+0.15 0.86+0.08 0.45+0.25 0.94+0.06
UniProt 0.68+0.09 0.87+0.07 0.32+0.14 0.94+0.05
Sequence coverage (SC), specificity (Sp), sensitivity (Sn) andREQ values are shown together with the corresponding stand-ard deviation.
No. 4] A. Munoz-Merida et al. 345
by guest on August 21, 2014
http://dnaresearch.oxfordjournals.org/D
ownloaded from
Sma3s: AThree-Step Modular Annotator for Large Sequence Datasets
ANTONIO Munoz-Merida1, ENRIQUE Viguera2, M. GONZALO Claros3, OSWALDO Trelles1,4,and ANTONIO J. Perez-Pulido5,*
Integrated Bioinformatics, National Institute for Bioinformatics, University of Malaga, Campus de Teatinos, Spain1;Cellular Biology, Genetics and Physiology Department, University of Malaga, Campus de Teatinos, Spain2; MolecularBiology and Biochemistry Department, University of Malaga, Campus de Teatinos, Spain3; Computer ArchitectureDepartment, University of Malaga, Campus de Teatinos, Spain4 and Centro Andaluz de Biologıa del Desarrollo (CABD,UPO-CSIC-JA), Facultad de Ciencias Experimentales (Area de Genetica), Universidad Pablo de Olavide, Sevilla 41013,Spain5
*To whom correspondence should be addressed. Tel. þ34 954-348-652. Fax. þ34 954-349-376.E-mail: [email protected]
Edited by Prof. Kenta Nakai(Received 29 October 2013; accepted 6 January 2014)
AbstractAutomatic sequence annotation is an essential component of modern ‘omics’ studies, which aim to extract
information from large collections of sequence data. Most existing tools use sequence homology to establishevolutionary relationships and assign putative functions to sequences. However, it can be difficult to define asimilarity threshold that achieves sufficient coverage without sacrificing annotation quality. Defining thecorrect configuration is critical and can be challenging for non-specialist users. Thus, the development ofrobust automatic annotation techniques that generate high-quality annotations without needing expertknowledge would be very valuable for the research community. We present Sma3s, a tool for automaticallyannotating very large collections of biological sequences from any kind of gene library or genome. Sma3sis composed of three modules that progressively annotate query sequences using either: (i) very similarhomologues, (ii) orthologous sequences or (iii) terms enriched in groups of homologous sequences. Wetrained the system using several random sets of known sequences, demonstrating average sensitivityand spe-cificity values of ∼85%. In conclusion, Sma3s is a versatile tool for high-throughput annotation of a widevariety of sequence datasets that outperforms the accuracy of other well-established annotation algorithms,and it can enrich existing database annotations and uncover previously hidden features. Importantly, Sma3shas already been used in the functional annotation of two published transcriptomes.Key words: functional annotation; genome annotation; transcriptome annotation; bioinformatic tool
1. Introduction
Sequenceannotation is theprocessofassociatingbio-logical informationtosequencesof interest.Annotationscan include the potential function, cellular localization,biological process or protein structure of a given se-quence.1 Some sequences are annotated using direct ex-perimental evidence, but most annotations are inferredfrom sequence similarities or conserved patterns asso-ciated with known characteristics.2–5 Large publicallyaccessible databases of annotated sequences make itpossible to automatically annotate large collections of
unknown sequences. This is especially valuable for theinterpretation of large sequence datasets generated bygenome and expressed sequence tag (EST) sequencingprojects as well as gene and protein expression experi-ments, such as DNA microarrays, and many other emer-ging research areas.6
Sequence annotation is also important in transcrip-tomic experiments that aim to identify gene clusterswith similarexpression patterns that are linked to a par-ticular biological process or experimental condition.Biological function can then be inferred from annota-tions shared within these clusters.7
# The Author 2014. Published by Oxford University Press on behalf of Kazusa DNA Research Institute.This is an Open Access article distributed under the terms of the Creative Commons Attribution License (http://creativecommons.org/licenses/by-nc/
.0/), which permits non-commercial use, distribution, and reproduction in any medium, provided the original work is properly cited.For commercial re-use, please contact [email protected].
DNA RESEARCH 21, 341–353, (2014) doi:10.1093/dnares/dsu001Advance Access publication on 5 February 2014
4
by guest on August 21, 2014
http://dnaresearch.oxfordjournals.org/D
ownloaded from
Robust gene signatures from microarray data using genetic algorithmsenriched with biological pathway keywords
R.M. Luque-Baena a,⇑, D. Urda a,b, M. Gonzalo Claros c, L. Franco a,b, J.M. Jerez a,b
a Departmento de Lenguajes y Ciencias de la Computación, University of Málaga, Bulevar Louis Pasteur, 35, 29071 Málaga, Spainb Instituto de Investigación Biomédica de Málaga (IBIMA), Málaga, Spainc Supercomputing and Bioinformatics Centre, University of Málaga, C/ Severo Ochoa, 34, 29590 Málaga, Spain
a r t i c l e i n f o
Article history:Received 24 July 2013Accepted 16 January 2014Available online 27 January 2014
Keywords:DNA analysisEvolutionary algorithmsBiological enrichmentFeature selection
a b s t r a c t
Genetic algorithms are widely used in the estimation of expression profiles from microarrays data. How-ever, these techniques are unable to produce stable and robust solutions suitable to use in clinical and bio-medical studies. This paper presents a novel two-stage evolutionary strategy for gene feature selectioncombining the genetic algorithm with biological information extracted from the KEGG database. A com-parative study is carried out over public data from three different types of cancer (leukemia, lung cancerand prostate cancer). Even though the analyses only use features having KEGG information, the resultsdemonstrate that this two-stage evolutionary strategy increased the consistency, robustness and accuracyof a blind discrimination among relapsed and healthy individuals. Therefore, this approach could facilitatethe definition of gene signatures for the clinical prognosis and diagnostic of cancer diseases in a nearfuture. Additionally, it could also be used for biological knowledge discovery about the studied disease.
! 2014 Elsevier Inc. All rights reserved.
1. Introduction
The term cancer encompasses more than 100 potentially life-threatening diseases affecting nearly every part of the body. Canceris a complex, multifactorial, genetic disease involving structuraland expression abnormalities of both coding and non-codinggenes. In this sense, gene expression profiling plays an importantrole in a wide range of areas in biological science for handling can-cer diseases [1–4]. The analysis of DNA microarray data requires aselection of features (genes) due to the small number of samplesavailable (mostly less than a hundred) and the large number offeatures (in the order of thousands). This problem is well-knownin the literature as the ‘‘large-p-small-n’’ paradigm or the curseof dimensionality [5].
Evolutionary models have been proposed in several works[6–12] and constitute one of the most widely used techniques forfeature selection and prognosis analysis in microarray datasets.Despite all the variety of feature selection techniques proposedin the literature, it still remains a problematic intrinsic to the
domain of DNA microarrays. Genetic algorithms (GAs) [13–18],as a particular case of evolutionary models, use classification tech-niques within the algorithm to evaluate and evolve the population.Producing stable or robust solutions is a desired property of featureselection algorithms, in particular for clinical and biomedical stud-ies. Nevertheless, robustness is a property difficult to be analyzedand is often overlooked. In [19–21] different approaches are pro-posed, addressing the main drawbacks related to overfitting androbustness, through a modified GA that includes an early-stoppingcriteria and establishing a feature ranking method that leads tomore robust solutions. Although some proposals use biologicalinformation to analyze DNA microarray data [22], none of them in-cludes it into the mechanisms that guide the searching procedurein the GA. In our opinion, this strategy would, on one hand, pro-duce more robust feature subset selections and, on the other hand,permit to obtain signatures more relevant for clinicians and bio-medical researchers.
In this approach, a two-stage procedure is proposed in order toobtain robust feature subset selections with good performancerates in test future data. Bootstrap Cross-Validation (BCV) is usedsince its good behavior related to misclassification error with smallsamples has been previously demonstrated [23,24], including DNAmicroarray datasets. A novel feature scoring method within the GAis also proposed, taking into account biological information relatedto the studied disorders. One widely used source of biologicalinformation is the Gene Ontology (GO) database [25] since it
http://dx.doi.org/10.1016/j.jbi.2014.01.0061532-0464/! 2014 Elsevier Inc. All rights reserved.
⇑ Corresponding author. Address: Department of Computer Languages andComputer Science, University of Málaga, Bulevar Louis Pasteur, 35, 29071 Málaga,Spain. Fax: +34 952131397.
E-mail addresses: [email protected] (R.M. Luque-Baena), [email protected](D. Urda), [email protected] (M. Gonzalo Claros), [email protected] (L. Franco),[email protected] (J.M. Jerez).
Journal of Biomedical Informatics 49 (2014) 32–44
Contents lists available at ScienceDirect
Journal of Biomedical Informatics
journal homepage: www.elsevier .com/locate /y jb in
COLABORACIÓN:José M. Jerez
GonzaloIsabel
ElenaRosario
PedroDavid
P10-CVI-6075 BIO267
RTA2013-00068-C03 RTA2013-00023-C02
Rafa
Gonzalo Rocío
Noé
Darío


