MHC Annual-Cover en
204
Transcript of MHC Annual-Cover en


I. Spokesman: Ho, Jhi-Wu / Corporate President Acting Spokesperson: Huang, Hsiu-Ling / Vice President of Finance Center Tel: +886 2 328-9000 E-mail: [email protected]
II. Headquarters : MiTAC Holdings Corporation.
Address:8th floor, Building B, No.209, Sec. 1, Nangang Rd., Nangang Dist., Taipei,Taiwan, R.O.C. Tel: +886 2 2652-5858 Branch and factory: none Subsidiaries : 1. MiTAC International Corp. Address: No.1, R&D Road 2, HsinChu Science Park, HsinChu, Taiwan, R.O.C. Tel: +886 3 577-9250 Lin Kou Office Address: No.200, Wen Hwa 2nd Rd., Kuei Shan Dist., Taoyuan City, Taiwan R.O.C. Tel: +886 3 328-9000 Nangang Office Address:Building B, No.209, Sec. 1, Nangang Rd., Nangang Dist., Taipei, Taiwan, R.O.C. Tel: +886 2 2652-5888 2. MiTAC Computing Technology Corporation Address: 3F.,No.1, R&D Road 2, HsinChu Science Park, HsinChu, Taiwan, R.O.C. Tel: +886 3 577-9088
III. Stock Agency (the Company’s stock transfer agent) Name: China Trust Commercial Bank - Stock Agency Department Address: 5F., No.83, Sec. 1, Chongqing S. Rd., Zhongzheng Dist., Taipei, Taiwan, R.O.C. Tel: +886 2 6636-5566 Website: http:// www.ctbcbank.com
IV. CPAs for the most recent Independent Auditor’s Report CPA: Liu Yin-Fe, Wen Fang-Yu Name of CPA firm: Pricewaterhouse Coopers Address: 27F., No.333, Sec. 1, Keelung Rd., Xinyi Dist., Taipei Taipei, Taiwan, R.O.C. Tel: +886 2 2729-6666 Website: http://www.pwc.tw/
V. Foreign securities listing: None
VI. Company Website: www.mic-holdings.com
Content Pages
One. Letter to Shareholders .......................................................................................................... 1
Two. Company profile ................................................................................................................... 4
I. Date of incorporation ....................................................................................................... 4
II. Company milestones ........................................................................................................ 4
Three. Corporate Governance ...................................................................................................... 6
I. Organizational system ...................................................................................................... 6
II. Information on directors, supervisors, presidents, vice presidents, assistant
presidents, and managers of each department and division ............................................. 7
III. Remunerations to the directors, supervisors, presidents, and vice presidents ................ 15
IV. Information on Corporate Governance ........................................................................... 20
V. Details of shares transferred or pledged by directors, supervisors, managers,
or shareholders with more than 10% ownership interest in the last year up till
the publication date of this annual report ........................................................................ 46
VI. Information on the relationship of top 10 shareholders by proportion of
shareholding, related parties, spouse, or kindred within the 2nd tier .............................. 47
VII. The shareholders of the company, the company’s directors, supervisors,
managers, and the business entity directly or indirectly controlled by the
company on the same invested company and also, the consolidated
comprehensive shareholding ratio .................................................................................. 48
Four. Status of Capital .................................................................................................................. 49
I. Capital and Shares ........................................................................................................... 49
II. Employee Stock Options ................................................................................................. 55
Five. Operation Overview ............................................................................................................ 58
I. Business Activities .......................................................................................................... 58
II. Market and an overview of production and sales ........................................................... 69
III. Employee information in the last two years up till the publication date of this
annual report ................................................................................................................... 75
IV. Expenditure on Environmental Protection ...................................................................... 75
V. Employer and employee relationships ............................................................................ 79
VI. Major Contracts............................................................................................................... 82

Six. Financial Position................................................................................................................... 83
I. Summary balance sheet and statement of comprehensive income for the last 5
years ................................................................................................................................ 83
II. Financial analysis for the last 5 years ............................................................................. 87
III. Latest financial statements .............................................................................................. 89
IV. The company and its affiliated companies should state any financial
difficulties occurred during the most recent year up to the date of printing of
this annual report and disclose the associated impact on the finances of the
company .......................................................................................................................... 89
Seven. Review and Analysis of Financial Status and Performance and Associated Risks ................ 90
I. Review and Analysis of Financial Status ........................................................................ 90
II. Review and Analysis of Financial Performance ............................................................. 90
III. Review and Analysis of Cash Flow ................................................................................ 91
IV. Impact of major capital expenditure in the year on the financial operations of
the company .................................................................................................................... 91
V. The main causes of profit or loss from reinvestment policies in the most
recent year, improvement plan and investment plans in the next year ........................... 91
VI. Risk management issues ................................................................................................. 92
VII. Other significant events .................................................................................................. 95
Eight. Important Notice ................................................................................................................ 96
I. Information on subsidiaries/affiliates.............................................................................. 96

1
One. Letter to Shareholders
Dear shareholders,
On behalf of MiTAC and staff, I would like to extend my appreciation to our shareholders for your continued support and encouragement.
Impacts of external competition, regulatory environment and the overall business
environment
There is a continuous lackluster condition in global markets. Gartner data show that the total IT spending in 2015 was USD3.517 trillion worldwide. The main reasons that cause this declining market condition, in addition to a continuous appreciation in strong USD, include an economic stagnation in emerging markets and the saturated smartphone market. These factors all lead to an obvious slowdown in the IT spending.
The forecasted worldwide IT spending can reach USD3.536 trillion in 2016, with an annual growth rate of 0.6%. That is, even though the IT spending in China market has shown a downtrend signal for the first time, but the data center system market that focuses on the server storage facility is still able to maintain its growth momentum due to the trend of the mega data concept. Under the situations that the traditional ICT information communication products have gradually reached their maturity stages and the growth power of the emerging industries has yet to be shown, most companies in the IT industry are actively engaging in the development of and market planning for the new products and their applications, such as, IoT and wearables.
The Analyses of Operation Performance, Budgetary Performance, and Profitability of
2015
Comparing to those of in 2014, there are improvements in both sales and profitability of the Company in 2015. They are evidenced by the benefits of the growth and transformation in the areas of the cloud-end and client-end businesses. The consolidated sales revenue of MiTAC Holdings Corp. is NTD50.055 billion in 2015, with an annual growth rate of 19%. The earnings before tax is NTD2.014 billion, with an annual growth rate of 92%, and the earnings per share after tax is NTD2.32. There is no reports on the budgetary performance because the Company did not disclose its financial forecast in 2015.
Business Operation Performance, R&D, Innovations, Applications, and Awards in 2015
1. Health management bracelet, Mio MiVue™ 540 event data recorder (EDR), and MioCARE™/MioWORK™ A335 professional grade tablet all receive 2015 iF design awards, Germany.
2. Presentation of the medical grade health management bracelet with the function of ECG.
3. Mio MiVue™ 658WIFIevent data recorder (EDR) and Classic 630 Traffic, a patterned dynamic early warning real-time traffic GPS receive 2015 ITmonth100 innovative products awards.
4. Introduction of Mio MiVue™ 658WIFIevent data recorder, riding with WIFI, and the exclusive one-stroke uploading and backup functions.
5. Introduction of MiVue™ 688D forward/backward double camera lens and high quality resolution event data recorder.

2
6. Announcement of eXplorist TRX7 project, a navigation system exclusively for all terrain vehicles.
7. The point of sales (POS) equipment for professional pharmacy retailers now has in production and in demand.
8. Announcement of the first-ever one of its kind OpenPOWER 2U server system for data center usage, based on IBM POWER8 structure.
9. Introduction of integrated computer cabinet project designed for the need of the cloud data center.
10.Receiving the Fujitsu Supplier Excellence Award.

3
Perspective of 2016 Business Operation
MiTAC Holdings Corp. actively engages in innovation and masters the trend of market development. In the growing area of data center of cloud computing business, MiTAC Computing Technology Corp., focusing on the cloud data and computing equipment business, continuously dedicates its R&D efforts in the product and service segmentations, enhances relationship of the existing clients, and explores potential market opportunities as well. Its goals are to achieve a superior growth rate and profit improvement among the industrial peers. In another aspects, MiTAC International Corp. devotes its mobile smart apparatus and cloud service businesses into the new areas of internet of things (IoT), internet of vehicles (IoV), and wearables. Based on the existing GPS products, it participates in the integration of IoV and health sports businesses. Starting from user improvement, through internal product innovation and external industrial alliance, it develops market competitive products and services, and hence generates a pattern of stable growth and profitability.
MiTAC Computing Technology Corp. is a spin-off from MiTAC International Corp. a year ago. It has a good business performance last year. In 2016 CES Exhibition, our SmartGPS cloud navigation system has been designated by the world-class automobile manufactures as the navigation equipment of information entertainment platform. This acknowledgement shows that the accumulated software service contribution of the Company has been recognized by the industry. On the way of industrial transformation, the Company follows the Company’s integrated operation strategy, step by step enhances its foundation, We thank you for your long-term support, and will continue to devote ourselves to create a brighter future for our shareholders, customers and employees.
Best regards
Miau, Matthew Feng Chiang, Chairman Ho, Jhi-Wu, President

4
Two. Company profile
I. Date of incorporation: September 12, 2013
II. Company milestones
2013 ‧ For the implementation of the industry holding operation and independent development policy aiming at the upgrade of overall performance and fortifying the competitiveness in market, the company listed in TWSE under a resolution of the shareholders meeting of MiTAC International Corp. on June 24, 2013, through share swap in accordance with applicable laws. The stock code is 3706.
‧ The Mio MiVue R25 rear car DVR won the “IT Month Top 100 Innovative Products – Gold Award”. The MiVue M300, the DVR exclusively designed for the motorcyclists, also won the “IT Month Top 100 Innovative Products”.
‧ Magellan Echo smart sports watch won the “Summer Exhibition of USA with two best products”.
2014 ‧ Magellan® Echo smart sports watch won the 2014 CES Innovations, Design and Engineering Award.
‧ Mio won the championship again in 2014 as the number one consumer ideal brand in GPS.
‧ MioCARE™/MioWORK™ L135 professional tablet PC products, Cyclo™ 500 outdoor navigation, MiVue™ 568 car recorder and MiVue™ M350 outdoor activity recorder won the 2014 iF Product Design Award.
‧ Mio MiVue™ R25 rearview mirror car recorder and MioCARE™ drug information management system won the 2014 Taiwan Excellence Award.
‧ Won Pioneer Supplier Excellence Award.
‧ Won the 2013 Fujitsu Supplier Award.
‧ Mio has been rated the No. 1 Consumer Ideal Brand for seven consecutive years.
‧ The Group pushed forward professional job-division in aims to achieve the goals of organizational upgrade and enhance the Company’s overall competitiveness. As part of the organizational restructuring plan, MiTAC International Corp span off the Cloud Computing Business Group to MiTAC Computing Technology Corp.(MCT) and MCT was formally established and operated in September 1, 2014.
2015 ‧ Wellness Band, Mio MiVue™ 540 Drive Video Recorder, MioCARE™ / MioWORK™ A335 industrial tablet got “iF Design Award 2015”.
‧ Mio MiVue™ R30 Drive Video Recorder won “Best Choice of Computex

5
2015” award.
‧ Mio was elected again as the No. 1 brand of GPS products in the 2015 Ideal Brand in Consumers organized by Management Magazine, Taiwan.
‧ Mio MiVue™ 658 WIFI Drive Video Recorder and Classic 630 Traffic PND with Smart Alert won “Innovation Award in ICT month 2015”
‧ Win “Distinguished Partner Award” from Fujitsu
‧ Began to build a new MiTAC Corporate Headquarter Buildings in Hwaya
Technology Park in Taoyuan City
2016 ‧ RoadMate 7670T-LM DashCam Navigator got CES 2016 Innovation Awards Honoree.
‧ Mio was recognized as the Best Brand of Drive Video Recorder brand in 2016 ideal Brand in Consumers, organized by Management Magazine, Taiwan.
For further information on the company, please visit at: http://www.mic-holdings.com

6
Three. Corporate Governance
I. Organizational system
(I) Organizational Chart
監察人
稽核室 薪資報酬委員會
法務 投資規劃管理 財務 人力資源
總經理
董事長
董事會
股東大會
(II) Departmental business operation
Departments Principal business operation
Compensation Committee
‧ Stipulate and regularly review the performance of the directors, supervisors and managers; as well as the compensation policies, systems, standards and structure.
‧ Regularly evaluate and stipulate director, supervisor and manager compensation.
Auditing Office ‧ Review the condition of the company’s operations and offer recommendations for
improvement.
Legal Affairs ‧ Contract formulation and review. ‧ Consultation, support, and provision of business-related legal service; legal issues
in other aspects.
Investment planning management
‧ Assess the operation and the development of the investees and map out related investment plans.
‧ Design and establish management regulation and manage the result of operation of the investees.
‧ Shares registration and transfer.
Financial
‧ Financial operations and planning. ‧ Evaluation and research of domestic and international investment opportunities. ‧ Financial planning and various tax-related accounting treatment.
Human Resource
‧ Human resources strategic planning and execution. ‧ Human resource management and talent development. ‧ Execution and management of administration, safety, and health issues.
Shareholders’ meeting
Supervisor
Board of Directors meeting
Compensation Committee Auditing Office
Chairman
President
Legal Affairs Investment planning
management Financial Human Resource

7
II. Information on directors, supervisors, presidents, vice presidents, assistant presidents, and managers of each department and division
(I) Background of Directors and Supervisors Unit: share; % April 23, 2016
Titles
Country or
place of
registration
Names Date of
office Term
Date First
Elected
Shareholding at time of
election
Current
shareholding
Shares currently
held by spouse
or dependents
Shares held in the
names of others
Education and Experience Concurrent duties in the Company and in
other companies
Spouse or kin within
two degrees of
consanguinity serving
as executive, director,
or supervisor
Shares h
eld
Shareh
old
ing
percen
tage
Shares h
eld
Shareh
old
ing
percen
tage
Shares h
eld
Shareh
old
ing
percen
tage
Shares h
eld
Shareh
old
ing
percen
tage
Title
Nam
e
Relatio
nsh
ip
Chairman US Miau, Matthew Feng Chiang 2013.06.24 3-y 2013.06.24 10,942,999 1.43% 8,015,243 1.03% 0 0.00% 0 0.00%
Santa Clara University, EMBA
California Berkeley University, Bachelor,
Electrical Engineering
CEO, MiTAC Holdings Corporation
Chairman, Lien Hwa Industrial Corp.
Chairman, UPC Technology Corporation
Chairman, SYNNEX Technology
International Corp.
Director, Getac Technology Corporation
Chairman, MiTAC Inc
Director, MiTAC Information Technology
Corp
None None None
Director Republic of
China Ho, Jhi-Wu 2013.06.24 3-y 2013.06.24 2,551,863 0.33% 2,139,863 0.27% 0 0.00% 0 0.00%
MIS in Computer Science, Fairleigh Dickinson
University
Master UC San Diego
Marketing Manager, Pao Hwa Trading Co., Ltd.
President, MiTAC Holdings Corporation
Director and President, MiTAC International
Corp.
Chairman and CEO of MiTAC Computing
Technology Corp.
Director, Linpus Technologies, Inc.
Chairman, MIO Technology Corp.
Director, 3-Probe Technologies Co., Ltd.
Chairman of MiWELL
Director, LFE Aerospace Corp.
None None None
Director
Republic of
China MiTAC Inc. 2013.06.24 3-y 2013.06.24 61,228,286 8.00% 61,228,286 7.84% 0 0.00% 0 0.00% None None None None None
Republic of
China Rep.: Hsu, Tzu-Hwa 2013.09.13 3-y 2013.09.13 0 0.00% 0 0.00% 0 0.00% 0 0.00%
PhD, Electronic Engineering, University of
California, Berkeley, California, USA
President, Hua Deng International Investment
Inc.
Vice Chairman, East Tender Optoelectronics
Corporation
Independent Director, LuxNet Corporation
None None None
Director
Republic of
China UPC Technology Corporation 2013.06.24 3-y 2013.06.24 64,814,078 8.47% 64,814,078 8.30% 0 0.00% 0 0.00% None None None None None
Republic of
China Rep.: Way, Yung-Do 2013.06.24 3-y 2013.06.24 0 0.00% 0 0.00% 0 0.00% 0 0.00%
MBA of Georgia University
BA of Accountancy, Soochow University
Senior auditor, Deloitte & Sells, USA
CEO, Deloitte
Independent Director, SYNNEX Technology
International Corp.
Independent Director, Taiwan Cement
Company
Independent Director, Far Eastern
Department Stores Co. Ltd.
Independent Director, Primax Electronics
Ltd.
None None None

8
Titles
Country or
place of
registration
Names Date of
office Term
Date First
Elected
Shareholding at time of
election
Current
shareholding
Shares currently
held by spouse
or dependents
Shares held in the
names of others
Education and Experience Concurrent duties in the Company and in
other companies
Spouse or kin within
two degrees of
consanguinity serving
as executive, director,
or supervisor
Shares h
eld
Shareh
old
ing
percen
tage
Shares h
eld
Shareh
old
ing
percen
tage
Shares h
eld
Shareh
old
ing
percen
tage
Shares h
eld
Shareh
old
ing
percen
tage
Title
Nam
e
Relatio
nsh
ip
Director of Wowprime Corp..
Director, Vanguard International
Semiconductor Corporation
Supervisor, SerComm Corp
Supervisor, Chilisin Electronics Corp
Director, Iron Force Industrial Co., Ltd.
Director Republic of
China Rep: Chang, Kwang-Cheng 2013.09.13 3-y 2013.09.13 0 0.00% 0 0.00% 0 0.00% 0 0.00%
PhD. Atmospheric Science, State University
of New York, USA
Honorary Doctorate, Tokyo Denki University
MBA, State University of New York, USA
Master of Atmospheric Science, State
University of New York, USA
Bachelor of Metrology, Dept. of Geography,
National Taiwan University
Director, Commerce Development Research
Institute
President, Shih Chien University
President, Minghsin University of Science
and Technology
Visiting Professor, School of Business,
University of Hawaii
President, Chung Yuan Christian University
None
None None None
Supervisor Republic of
China Chiao, Yu-Cheng 2013.06.24 3-y 2013.06.24 0 0.00% 0 0.00% 0 0.00% 0 0.00%
MSEE and researcher in Business
Administration, Washington University
Chairman, Walsin Lihwa
Chairman, Winbon
Vice-Chairman, Walsin Lihwa
Chairman, Nuvoton Technology Corp.
Director, Song Yong Investment Co., Ltd.
Director, Miaowang Lianxin Co., Ltd.
Independent Director, SYNNEX
Technology International Corp.
Independent Director, Taiwan Cement
Company
None None None
Supervisor
Republic of
China
Lien Hwa Industrial
Corporation 2013.06.24 3-y 2013.06.24 45,812,655 5.99% 47,191,655 6.05% 0 0.00% 0 0.00% None None None None None
Republic of
China Rep: Ching, Hu-Shih 2013.06.24 3-y 2013.06.24 0 0.00% 583 0.00% 0 0.00% 0 0.00%
Master of Engineering at National Tsing Hua
University
Council for Economic Planning and
Development
Adjunct Lecturer, Dept. of Chemical
Engineering Feng Chia University
Asst GM, UPC Technology Corporation
Director and President, Lien Hwa
Industrial Corp.
Director, MiTAC Inc.
Director, Pao long international co., ltd.
Supervisor, Getac Technology
Corporation
Supervisor, MiTAC International Corp.
None None None
Note 1:Please refer to Table 1 below for information on the main shareholders of corporate shareholders.

9
Table 1: Dominant shareholders of institutional shareholders
April 23, 2016
Name of institutional shareholders (Note 1)
Major shareholders of institutional shareholders (Note 2)
Name of shareholder Percentage of shareholding
(%)
UPC Technology Corporation
Lien Hwa Industrial Corporation 29.99
Synnex Technology International Corporation 5.17
Ma, Chang-Lung 2.30
Liberty Stationery Corp. 1.81
Yi Yuan Investment Co., Ltd. 1.61
Tong Da Investment Corporation 1.23
Tsu Fung Investment Corp. 1.23
MiTAC International Corp. 1.21
Hua Mao Trading Co., Ltd. 1.12
Mei An Investment Co., Ltd. 1.07
MiTAC Inc.
Lien Hwa Industrial Corp. 35.24
Synnex Technology International Corporation 18.36
MiTAC International Corp. 8.69
Mei An Investment Co., Ltd. 8.18
Miau, Matthew Feng Chiang 5.42
Tsu Fung Investment Corp. 4.40
Hua Cheng Investment Co., Ltd. 1.92
Omron Corporation, Japan 1.70
Bao Hsin International Investment Co., Ltd. 1.18
Yi Feng Investment Co., Ltd. 0.75
Lien Hwa Industrial Corporation
UPC Technology Corporation 9.68
Yi Yuan Investment Co., Ltd. 9.14
Yi Feng Investment Co., Ltd. 4.86
Nan Shan Life Insurance Co., Ltd. 3.74
Cathay Life Insurance Co., Ltd. 3.30
Miao, Feng-Sheng 3.28
Miau, Matthew Feng Chiang 3.19
Synnex Technology International Corporation 3.08
Miao, Feng-Chuan 3.02
Y.S. Education Foundation 3.00
Note 1: If Directors and Supervisors serve as representatives of institutional shareholders, then the names of institutional shareholders must be provided.
Note 2: Name the major shareholders (the top 10 owners) of corporate shareholders and their shareholding percentage. Table 2 below is applicable if any of the major shareholders is also a corporate entity.

10
Table 2: Dominant shareholders of dominant institutional shareholders
April 23, 2016
Name of institutional shareholder (note 1)
Dominant shareholders of institutional shareholders (note 2)
Name of shareholder Percentage of shareholding
(%)
Lien Hwa Industrial Corporation
UPC Technology Corporation 9.68
Yi Yuan Investment Co., Ltd. 9.14
Yi Feng Investment Co., Ltd. 4.86
Nan Shan Life Insurance Co., Ltd. 3.74
Cathay Life Insurance Co., Ltd. 3.30
Miao, Feng-Sheng 3.28
Miau, Matthew Feng Chiang 3.19
Synnex Technology International Corporation 3.08
Miao, Feng-Chuan 3.02
Y.S. Education Foundation 3.00
Synnex Technology International Corporation
MiTAC Inc. 13.62
HSBC in its capacity as master custodian for investment account of Matthews Pacific Tiger
6.18
Fubon Life Insurance Co., Ltd. 2.77
Morgan Stanley & Co International PLC investment account held in custody by HSBC Bank (Taiwan) Limited
2.63
Bureau of Labor /Insurance 2.54
Civil Servants Pension Fund Management Committee
2.39
Nan Shan Life Insurance Co., Ltd. 2.28
Tu, Shu-Wu 2.17
Miau, Matthew Feng Chiang 1.91
Lien Hwa Industrial Corp. 1.81
Liberty Stationery Corp.
Zhi-Jiang Investment Co., Ltd. 21.09
Masateru Kadota 10.39
Akira Kadota 8.88
Yayoi Kadota 8.88
Takanori Kadota 8.79
Complete Connection Limited 5.70
Sun, Li-Kang 5.29
Yu, Ching-Shen 5.13
Chang, Zheng 3.50
Chang, Cheng 3.50
Yi Yuan Investment Co., Ltd. Shang Chuan Neng Ltd. (British Virgin Islands) 100.00

11
Name of institutional shareholder (note 1)
Dominant shareholders of institutional shareholders (note 2)
Name of shareholder Percentage of shareholding
(%)
Tong Da Investment Corporation
Ho Li Investment Co., Ltd. 19.99
Chou, Te-Chien 0.05
Synnex Technology International Corporation 19.99
Hua Cheng Construction Co., Ltd. 19.99
Wei Cheng Investment Co., Ltd. 19.99
Tsu Fung Investment Corp. 19.99
Tsu Fung Investment Corp. MiTAC International Corp. 100.00
MiTAC International Corp. MiTAC Holdings Corporation 100.00
Hua Mao Trading Co., Ltd. Foreign investor (not applicable) -
Mei An Investment Co., Ltd.
Vision Quest Overseas Ltd. 82.25
JumpStart Investments Ltd. 16.67
Others 1.08
UPC Technology Corporation
Lien Hwa Industrial Corp. 29.99
Synnex Technology International Corporation 5.17
Ma, Chang-Lung 2.30
Liberty Stationery Corp. 1.81
Yi Yuan Investment Co., Ltd. 1.61
Tong Da Investment Corporation 1.23
Tsu Fung Investment Corp. 1.23
MiTAC International Corp. 1.21
Hua Mao Trading Co., Ltd. 1.12
Mei An Investment Co., Ltd. 1.07
Yi Feng Investment Co., Ltd. Heng Fu Ltd. (British Virgin Islands) 100.00
Nan Shan Life Insurance Co., Ltd.
Run Chen Holdings Co., Ltd. investment trust account held under the Custody of First Bank
76.46
Ruen Chen Investment Holding Co., Ltd. 14.16
Tu, Ying-Tsung 3.25
Ruen Hua Dyeing & Weaving Co., Ltd. 0.28
Ruentex Leasing Co., Ltd. 0.15
Kuo, Wen-Te 0.11
Ji Pin Investment Co. Ltd. 0.11
Equity trust account of Nan Shan Life in custody of Taishin Bank
0.06
Global Cheer Investment Limited 0.05
Bao Yi Investment Co. Ltd. 0.05
Bao Hui Investment Co., Ltd. 0.05
Bao Huang Investment Co., Ltd. 0.05 Cathay Life Insurance Co., Ltd. Cathay Financial Holdings Co., Ltd. 100
Y.S. Education Foundation Non-corporate entity (n/a) -

12
Name of institutional shareholder (note 1)
Dominant shareholders of institutional shareholders (note 2)
Name of shareholder Shareholding
percentage (%)
Hua Cheng Investment Co., Ltd.
Lien Hwa Industrial Corp. 100.00
Omron Corporation, Japan
State Street Bank and Trust Company 505223 8.33
Japan Trustee Services Bank, Ltd. (trust account) 3.62
The Bank of Tokyo-Mitsubishi UFJ, Ltd. 3.60
State Street Bank and Trust Company 505001 3.54
The Bank of Kyoto, Ltd. 3.30
The Master Trust Bank of Japan, Ltd. (trust account) 3.30
Nippon Life Insurance Company 1.70
Japan Trustee Services Bank, Ltd. (trust account 9) 1.59
The Bank of New York, Non-Treaty Jasdec Account 1.45
Omron Employee Stockholding Association 1.41
Bao Hsin International Investment Co., Ltd.
Hon Hai Precision Industry Co., Ltd. 100.00
Note 1: If any of the major shareholders listed in Table 1 is an institution, then the name of the institution must be provided.
Note 2: Name the major shareholders (the top 10 owners) of corporate shareholders and their shareholding percentage.

13
Information on the directors and supervisors
Qualification requirement
Name
Having more than 5 years work experience and the following qualifications
Compliance with independence requirements (note 1)
The no. of public
companies where the
person acts as
independent director
Lecturer or higher level instructor at a public or private college or university in business, law, finance, accounting or other fields related to the operations of the company
Judge, public prosecutor, attorney at law, CPA, or other professionals licensed by national exams that are pertinent to the operation of the company
Work experience in business, law, finance, accounting, or other areas required for the operation of the company
1 2 3 4 5 6 7 8 9 10
Chairman Miau, Matthew Feng Chiang
- - � - - - � - - � � � � -
Director Ho, Jhi-Wu
- - � - - - � � - � � � � -
Director MiTAC Inc. Rep.: Hsu, Tzu-Hwa
- - � � � � � � � � � � - 1
Director UPC Technology Corporation Rep.: Way, Yung-Do
- � � � � � � � � � � � - 4
Director UPC Technology Corporation Rep: Chang, Kwang-Cheng
� - � � � � � � � � � � - -
Supervisor Chiao, Yu-Cheng
- - � � � � � � � � � � � 2
Supervisor Lien Hwa Industrial Corp Rep: Ching, Hu-Shih
- - � � - � � - - � � � - -
Note 1: place a “�” in the box if the director or supervisor met the following conditions at any time during active duty and two years prior to the date elected.
(1) Not an employee of the Company or its subsidiaries or affiliates. (2) Not a director or supervisor of any affiliated company (except for independent director of the parent company or
subsidiary in which the Company holds more than 50% direct or indirect voting interest). (3) The person, the spouse, underage children, who hold more than 1% of the outstanding shares or one of the top 10
shareholders who are natural persons or who hold shares of this company under the title of a third party. (4) Not the spouse, kin within the 2nd tier or the next of kin within the 3rd tier of any of the parties mentioned in (1)
~(3). (5) Not a director, supervisor or employee of an institutional shareholders holding more than 5% of the outstanding
shares of the Company, or of the top five institutional shareholders. (6) Not a director, supervisor, manager, or shareholder holding more than 5% of the outstanding shares of specific
company or institution having business of financial transactions with the Company. (7) Not a professional, proprietor, partner, company or the owner, partner, director, supervisor, manager or spouse of
the professional consulting entities providing services or consultation in business, law, finance, accounting and other for the Company or its subsidiaries or affiliates. The Remuneration Committee members who perform duties in accordance with the “Guidelines Governing the Listed/OTC Company’s Remuneration Committee Establishment and Duty Performance” Article 7 are not subjectto this restriction.
(8) Not a spouse or kin within the 2nd tier of another director. (9) The provisions of Article 30 of the Company Law are not applicable. (10) Not elected to the government, institution or their representatives under Article 27 of the Company Law.

14
(II)Information on Presidents, Vice Presidents, Assistant Presidents, and managers of each department and division
Unit: share; %April 23, 2016
Titles Nationality Names Elected/
appointed date
Shareholding Shares held by
spouse and underage children
Shares held in the names of others
Education and Experience Positions in other companies
Spouse or relatives of second degree or closer
acting as managers
Sh
ares held
Sh
areho
ldin
g
percen
tage
Sh
ares held
Sh
areho
ldin
g
percen
tage
Sh
ares held
Sh
areho
ldin
g
percen
tage
Title
Nam
e
Relatio
nsh
ip
CEO US
Miau, Matthew
Feng Chiang
2015.08.07 8,015,243 1.03% 0 0.00% 0 0.00%
Santa Clara University, EMBA California Berkeley University, Bachelor, Electrical Engineering
Chairman, Lien Hwa Industrial Corp. Chairman, UPC Technology Corporation Chairman, SYNNEX Technology International Corp. Director, Getac Technology Corporation Chairman, MiTAC Inc Director, MiTAC Information Technology Corp
None None None
President Republic of
China Ho,
Jhi-Wu 2013.9.12 2,139,863 0.27% 0 0.00% 0 0.00%
MIS in Computer Science, Fairleigh Dickinson University Master UC San Diego Marketing Manager, Pao Hwa Trading Co., Ltd.
Director and President, MiTAC International Corp. Chairman and CEO of MiTAC Computing Technology Corp. Director, Linpus Technologies, Inc. Chairman, MIO Technology Corp. Director, 3-Probe Technologies Co., Ltd. Chairman of MiWELL Director, LFE Aerospace Corp.
None None None
Vice President and head of finance
Republic of China
Huang, Hsiu-Ling
2013.9.12 130,270 0.02% 0 0.00% 0 0.00%
Bachelor, Taxation and Finance, National Chung Hsing University Director of General Management Dept., Hanrei Technology Corporation
Vice President, Finance Center, MiTAC International Corp. Supervisor, Mio Technology Corp. Supervisor, Tsu Fung Investment Corp. Director, LFE Aerospace Corp.
None None None

15
III. Remunerations to the directors, supervisors, presidents, and vice presidents
Remunerations to the Directors
2015 In thousands of New Taiwan Dollars/ thousand shares
Title Name
Remunerations to the Directors
Total of A, B, C, and
D in proportion to
earnings before
taxation (%)
Remuneration from holding employee positions
Total of A, B, C,
D, E, F and G in
proportion to
earnings before
taxation (%)
Rem
uneratio
n fro
m su
bsid
iaries or o
ther in
vestees
(H)
Compensation
(A)
Pension
(B)(Note 1)
Director
remuneration
(C)(Note 2)
Business
expenses (D)
Salaries, bonus, and
special expenses (E)
Pension (F)
(Note 1)
Employee remuneration (G)
(Note 3)
Quantity of share
subscription
entitled by ESO
(Note 4)
Acquired
new shares
with
employees’
rights
restricted
The com
pany
All co
mpan
ies in th
e
finan
cial statemen
ts
The com
pany
All co
mpan
ies in th
e
finan
cial statemen
ts
The com
pany
All co
mpan
ies in th
e
finan
cial statemen
ts
The com
pany
All co
mpan
ies in th
e
finan
cial statemen
ts
The com
pany
All co
mpan
ies in th
e
finan
cial statemen
ts
The com
pany
All co
mpan
ies in th
e
finan
cial statemen
ts
The com
pany
All co
mpan
ies in th
e
finan
cial statemen
ts
The Company All companies in the
financial statements The com
pany
All co
mpan
ies
inclu
ded
in th
e
conso
lidated
statemen
ts
The co
mpan
y
All co
mpan
ies
inclu
ded
in th
e
conso
lidated
statemen
ts
The co
mpan
y
All co
mpan
ies
inclu
ded
in th
e
conso
lidated
statemen
ts In cash In shares In cash In shares
Chairman Miau, Matthew Feng
Chiang
408 408 - - 1,500 1,500 96 96 0.11% 0.11% - 15,031 - - 1,400 - 1,400 - 1,550 1,550 - - 0.19% 1.05% None
Director Ho, Jhi-Wu
Director MiTAC Inc.
Rep.: Hsu, Tzu-Hwa
Director
UPC Technology
Corporation
Rep.: Way, Yung-Do
Rep: Chang,
Kwang-Cheng
Note 1: Pension as stated is the amount of appropriation.
Note 2: Represents the amount of directors’ remuneration that the board has proposed as part of the latest earnings appropriation.
Note 3: Represents employees' remuneration proposed as part of the latest earnings appropriation.
Note 4: Refers to the amount of shares exercisable through employee warrants, which the Director has received up till the publication date of this annual report (2016.5.15) excluding amounts that have been exercised), for assuming the role of a company employee (such as
President, Vice President, manager or other employees).
Note 5: The sum of remuneration provided for directors of the Company and for all companies included in the financial statements had increased slightly from the previous year; percentage-wise, however, directors' remuneration as a percentage to net income had decreased
from 0.25% to 0.11% this year. This reduction was due to a higher increase in net income relative to the increase in remuneration.
Note 6: Directors' remuneration is determined by the Board of Directors based on a number of considerations including Remuneration Committee's recommendations, peer levels, and future risks; the board is authorized under the Articles of Incorporation to approve directors'
remuneration and seek acknowledgment during annual general meeting.
Note 7: The Company does not single out the name and remuneration of particular director for disclosure. Therefore, the disclosure of remunerations was presented on a salary scale with the names of all concerned.

16
Salary Scale
Bracket of salaries to directors of the Company
Name of director
Total of (A+B+C+D) Sum of the first 7 items (A+B+C+D+E+F+G)
The Company All companies in the financial statements The Company All companies in the financial
statements
Less than NT$2,000,000
Miau, Matthew Feng Chiang/Ho, Jhi-Wu/MiTAC Inc./Hsu, Tzu-Hwa/UPC Technology Corporation/Way, Yung-Do/Chang, Kwang-Cheng
Miau, Matthew Feng Chiang/Ho, Jhi-Wu/MiTAC Inc./Hsu, Tzu-Hwa/UPC Technology Corporation/Way, Yung-Do/Chang, Kwang-Cheng
Miau, Matthew Feng Chiang/Ho, Jhi-Wu/MiTAC Inc./Hsu, Tzu-Hwa/UPC Technology Corporation/Way, Yung-Do/Chang, Kwang-Cheng
MiTAC Inc./Hsu, Tzu-Hwa/UPC Technology Corporation/Way, Yung-Do/Chang, Kwang-Cheng
NT$2,000,000~NT$5,000,000 (Exclusive)
NT$5,000,000~NT$10,000,000(Exclusive) Miau, Matthew Feng Chiang
NT$10,000,000~NT$15,000,000(Exclusive) Ho, Jhi-Wu
NT$15,000,000~NT$30,000,000(Exclusive)
NT$30,000,000~NT$50,000,000(Exclusive)
NT$50,000,000~NT$100,000,000(Exclusive)
More than NT$100,000,000
Total 7 7 7 7

17
Remuneration to supervisors 2015
In thousands of New Taiwan Dollars
Title Name
Remuneration to supervisors Total of A, B, and C in proportion to
earnings before taxation (%) Remuneration
from
subsidiaries
or other
investees (D)
Compensation (A) Remuneration (B)(Note 1) Fees for services rendered (C)
The Company
All companies
included in the
financial
statements
The Company
All companies
included in the
financial
statements
The Company
All companies
included in the
financial
statements
The Company
All companies
included in the
financial statements
Supervisor Chiao, Yu-Cheng
144 144 600 600 36 36 0.04% 0.04% None Supervisor
Lien Hwa Industrial Corp.
Rep: Ching, Hu-Shih
Note 1: Represents the amount of supervisors’ remuneration that the board has proposed as part of the latest earnings appropriation.
Note 2: The sum of remuneration provided for supervisors of the Company and for all companies included in the financial statements had remained unchanged from the previous year; percentage-wise, however, supervisors' remuneration as a percentage to
net income had decreased from 0.1% to 0.04% this year. This reduction was due to a higher increase in net income relative to the increase in remuneration.
Note 3: Supervisors' remuneration is determined by the Board of Directors based on a number of considerations including Remuneration Committee's recommendations, peer levels, and future risks; the board is authorized under the Articles of
Incorporation to approve supervisors' remuneration and seek acknowledgment during annual general meeting.
Note 4: The Company does not single out the name and remuneration of particular supervisor for disclosure and the disclosure of remunerations was presented on a salary scale with the names of all concerned.
Salary Scale
Bracket of salaries to supervisors of the Company
Name of supervisor
Total of (A+B+C)
The Company All companies in the financial statements
Less than NT$2,000,000 Chiao, Yu-Cheng/ Lien Hwa Industrial
Corp./Ching, Hu-Shih Chiao, Yu-Cheng/ Lien Hwa Industrial
Corp./Ching, Hu-Shih
NT$2,000,000 ~ NT$5,000,000 (Exclusive)
NT$5,000,000~NT$10,000,000(Exclusive)
NT$10,000,000~NT$15,000,000(Exclusive)
NT$15,000,000~NT$30,000,000(Exclusive)
NT$30,000,000~NT$50,000,000(Exclusive)
NT$50,000,000~NT$100,000,000(Exclusive)
More than NT$100,000,000
Total 3 3

18
Remuneration to President and Vice Presidents In thousands of New Taiwan Dollars/ thousand shares
Title Name
Salaries
(A)
Pension (B)(Note
1)
Bonus and special
expenses
(C)
Employee remuneration (D)
(Note 2)
Total of A, B, C, and D in proportion to
earnings before taxation (%)
Quantity of share
subscription entitled
by ESO (Note 3)
Acquired new
shares with
employees’ rights
restricted Remuneration
from
subsidiaries
or other
investees
(E)
Th
e com
pan
y
All
companies
included in
the
consolidated
statements
Th
e com
pan
y
All
companies
included in
the
consolidated
statements
Th
e com
pan
y
All
companies
included in
the
consolidated
statements
The Company
All companies
included in the
financial
statements
Th
e com
pan
y
All
companies
included in
the
consolidated
statements
Th
e com
pan
y
All
companies
included in
the
consolidated
statements
Th
e com
pan
y
All
companies
included in
the
consolidated
statements In cash
In
shares In cash
In
shares
CEO
Miau,
Matthew
Feng
Chiang
- 7,801 - 161 - 7,667 1,715 - 1,715 - 0.10% 0.99% 1,550 1,550 - - None President Ho,
Jhi-Wu
Vice
President
and head of
Finance
Huang,
Hsiu-Ling
Note 1: Pension as stated is the amount of appropriation. Note 2: Represents employees' remuneration proposed as part of the latest earnings appropriation. Note 3: Refers to the amount of shares exercisable through employees' warrants, which the President/Vice Presidents have received up till the publication date of this annual report (2016.5.15) excluding amounts that have
been exercised. Note 4: Total remuneration in 2015 was calculated at 0.10% of net income, up from the 0.03% in 2014. This increase was largely due to the creation of a new CEO position, which requires additional compensation as
compared to the previous year. Furthermore, total remuneration as a percentage to net income of the Company and all companies included in the financial statements had decreased from 1.92% in 2014 to 0.99% in 2015. This reduction was due to a higher increase in net income relative to the increase in remuneration.
Note 5: The remunerations to the President and the Vice Presidents commensurate with their personal contribution to the overall operation performance of the Company at the recommendation of the Remuneration Committee, industry level, and the possible risks in the future.
Salary Scale
Brackets of salaries to the President and all Vice Presidents
Name of President and Vice Presidents
Sum of the first 4 items (A+B+C+D)
The Company All companies in the financial statements
Less than NT$2,000,000 Miau, Matthew Feng Chiang/Ho, Jhi-Wu/Huang, Hsiu-Ling Miau, Matthew Feng Chiang
NT$2,000,000~NT$5,000,000
NT$5,000,000 (inclusive) ~NT$10,000,000 Huang, Hsiu-Ling
NT$10,000,000 (inclusive)~NT$15,000,000 Ho, Jhi-Wu
NT$15,000,000 (inclusive) ~NT$30,000,000
NT$30,000,000 (inclusive) ~NT$50,000,000
NT$50,000,000 (inclusive) ~NT$100,000,000
More than NT$100,000,000
Total 3 3
2015

19
Names of managers entitled to employee remuneration and amount entitled In thousands of New Taiwan Dollars
Title Name Amount paid in shares Amount paid in cash Total Total as a percentage to
after-tax net income (%)
Managers
CEO Miau, Matthew
Feng Chiang
- 1,715 1,715 0.10% President Ho, Jhi-Wu
Vice President and head of finance
Huang, Hsiu-Ling
Note:Represents employees' remuneration proposed as part of the latest earnings appropriation.

20
IV. Information on Corporate Governance
(I) Performance of Board of Directors: A total of 7 (A) board meetings were held in 2015; below are the attendance records:
Title Name
Attendance in
person
B
Proxy
attendance
count
Percentage of
actual attendance
(%)
[B/A]
Remarks
Chairman Miau, Matthew Feng
Chiang 7 0 100.00%
Director Ho, Jhi-Wu 7 0 100.00%
Director
UPC Technology
Corporation
Rep.: Way, Yung-Do
6 1 85.71%
Director
UPC Technology
Corporation
Rep: Chang,
Kwang-Cheng
6 1 85.71%
Director
MiTAC Inc.
Representative: Hsu,
Tzu-Hwa
5 1 71.43%
Special notes: I. Provision of Article 14-III of the Securities and Exchange Act, and minutes of Board meeting with
adverse opinions or qualified opinions from independent directors on record or backed by written declaration in resolutions of the Board: No.
II. The enforcement of the avoidance of the conflict of interest of the directors in making decisions: directors acted to avoid possible influence on the result of decision on motions with conflict of interest to The Company:
Board of Directors meeting
Date
Avoid the conflict
of interest Name of director
Content of the motion Reasons for the avoidance of the
conflict of interest The voting
2015.02.02 Ho, Jhi-Wu Review and approval of managers' 2014 year-end bonus
Concurrently serving as manager
Passed unanimously as proposed by all attending directors entitled to vote.
2015.02.02 Ho, Jhi-Wu Review and approval of managers' 2015 salary adjustment
Concurrently serving as manager
Passed unanimously as proposed by all attending directors entitled to vote.
2015.08.07 Ho, Jhi-Wu Review and approval of 2014 employee bonus and 2015 interim bonus for managers
Concurrently serving as manager
Passed unanimously as proposed by all attending directors entitled to vote.
2015.08.07
Miau, Matthew
Feng Chiang
Appointment of CEO The decision directly involved the director
The motion was passed as stated under unanimous consent of the directors who were present in the meeting.
2015.08.07
Miau, Matthew
Feng Chiang
Lift up the ban on managers holding positions in potential conflict of interest
The decision directly involved the director
The motion was passed as stated under unanimous consent of the directors who were present in the meeting.
III. Enhancements to the functionality of board of directors in the current and the most recent year (e.g.

21
establishment of an Audit Committee, improvement of information transparency etc), and the progress of such enhancements: The Company has established "Board of Directors Meeting Procedure" and implemented accordingly; all major resolutions made by the Board of Directors are disclosed on the Company's website. The Company also discloses information about Directors' and Supervisors' meeting attendance and continuing education regularly onto the "Corporate Governance" section of the Market Observation Post System, and thereby ensure the timeliness and transparency of information disclosed. In the years ahead, The Company will fortify the functions of the Board of Directors in responding to applicable legal rules and the requirements of corporate governance. The Company will be electing independent directors in 2016 to enhance the functionality of its Board of Directors.
(II) Performance of Audit Committee: The Company does not have an Audit Committee in place, but will be creating an Audit Committee as instructed by the authority in 2019.
(III)Supervisors' participation in Board of Directors meetings: A total of 7 (A) board meetings were held in 2015; below are the attendance records:
Title Name Attendance in person
(B)
Attendance rate(%)【B/A】 Remarks
Supervisor Chiao, Yu-Cheng 6 85.71%
Supervisor Lien Hwa Industrial
Corp Rep: Ching, Hu-Shih
7 100.00%
Special notes:
I. The organization and duties of the supervisors:
(I) The communications between the supervisors and the employees and shareholders of The Company (channels and means of communications): The sales personnel of The Company have reported to the supervisors regularly or at any time as needed. The supervisors may also contact relevant personnel directly for communications at any time as needed for related information.
(II) The communications between the supervisors, the chief internal auditor, and the certified public accountants (e.g., the financial position, business situation, and issues involved, and method and result of communication): The supervisors of The Company can investigate the operation and financial position of The Company at any time, and request the Board of Directors and managers to report. Where necessary, they may contact the external auditors of The Company. The chief internal auditor of The Company shall present audit reports to the supervisors at regular intervals.
II. Where the supervisors may present statements as observers when the Board is in session, specify the date and the number of the session, the content of the motions, the resolutions of the Board, and the response of Poya International to the opinions of the supervisors: No.

22
(IV) Status of corporate governance; deviation and causes of deviation from Corporate Governance Best-Practice Principles for TWSE/TPEX Listed
Companies:
Evaluation items
Corporate governance in action Deviation and causes of
deviation from the
Corporate Governance
Best-Practice Principles
for TWSE/TPEX Listed
Companies
Yes
No
Summary
I. Has the company established and
disclosed its corporate governance
principles based on "Corporate
Governance Best-Practice Principles for
TWSE/TPEX Listed Companies?"
� The Company has established corporate governance principles in accordance with "Corporate
Governance Best-Practice Principles for TWSE/TPEX Listed Companies" and published onto its
website and on MOPS.
These principles
conform with the
rationale and practices
of "Corporate
Governance
Best-Practice Principles
for TWSE/TPEX Listed
Companies."
II. Equity structure and shareholders’ equity:
(I) Has the Company implemented a set
of internal procedures to handle
shareholders' suggestions, queries,
disputes and litigations?
�
(I) The Company has appointed a designated company spokesperson for responding to the
recommendations, queries, and disputes from the shareholders.
Compliant with the
rationale and practices
of “Corporate
Governance
Best-Practice Principles
for TWSE/TPEX Listed
Companies.”
(II) Is the Company constantly informed
of the identities of its major
shareholders and the ultimate
controller?
�
(II) The Company can properly control the composition of major shareholders and the ultimate
parties in control of these major shareholders, and declares the quantity of shareholding by the
directors, supervisors, and major shareholders on a monthly basis in accordance with the
Securities and Exchange Act.
(III)Has the Company established and
implemented risk management and
firewalls on companies it is affiliated
with?
� (III)The Company has established an internal control system and related rules and regulations in
compliance with applicable legal rules, and has properly enforced such rules and regulations. In
addition to self-assessment, the Board of Directors and the management has also reviewed the
self-assessment results of the departments and the audit reports of the auditing functions at
regular intervals or at any time as needed to materialize the enforcement of the internal control
system. The Company seeks to establish viable financial, operation, and accounting systems in
accordance with requirements, and for buttressing the management of the subsidiaries and
affiliates for proper control to reduce operation risk. The transactions with subsidiaries and
affiliates were made under the principle of equity and fairness, and they are bound by related
rules and regulations governing business and financial transactions among the entities.

23
Evaluation items
Corporate governance in action Deviation and causes of
deviation from the
Corporate Governance
Best-Practice Principles
for TWSE/TPEX Listed
Companies
Yes
No
Summary
(IV)Has the Company established internal
policies that prevent insiders from
trading securities against non-public
information?
� (IV)The Company has established a set of "Material Insider Information Procedures" and "Integrity
Code of Conduct" to outline insiders' duty of confidentiality over material information. No
insider is allowed to exploit material information for own gain or for the gains of others. The
above procedures and code of conduct have been communicated to Directors, Supervisors,
managers and all parties who come into contact with material insider information, whether due
to identity, job role or controlling interest.
III. The organization and functions of the
Board of Directors
(I) Does the Board of Directors have
diversified policies regulated and
implemented substantively according
to the composition of the members?
�
(I) All members of the board possess the knowledge (e.g. decision making ability), skills (e.g.
accounting and financial analysis) and characters (e.g. global vision) required to accomplish
their duties. In addition, the Company will be electing independent directors to further enhance
board functionality during its 2016 annual general meeting.
Compliant with the
rationale and practices
of “Corporate
Governance
Best-Practice Principles
for TWSE/TPEX Listed
Companies.”
(II) Apart from the Remuneration
Committee and Audit Committee, has
the Company assembled other
functional committees at its own
discretion?
�
(II) The Company has assembled its Remuneration Committee in 2013; an Audit Committee will be
assembled in 2019 as required by law. Other functional committees will be introduced as needed
by the Company.
(III)Has the Company established a set of
policies and assessment tools to
evaluate the board's performance? Is
performance evaluated regularly at
least on an annual basis?
� (III)The Company will be introducing a set of performance assessment criteria for Board of
Directors in 2016. All board members have carried out their duties in compliance with
regulations and are constantly involved in continuing education.
(IV)Are external auditors' independence
assessed on a regular basis?
� (IV)Each year, the Company evaluates independence of its financial statement auditors and makes
sure that no conflicting interest exists (i.e. the auditors do not own shares or hold job positions
within the Company). Furthermore, the necessity to replace auditors is also evaluated on a
yearly basis (i.e. whether the auditors are unchanged for 7 consecutive years, or whether they are
subject to penalty or any occurrence that would compromise their independence). The
Company's financial statement auditors are appointed at the board's resolution; the board only
engages locally top 4 accounting firms, hence there should be no doubt with regards to auditors'
independence and professional capabilities.

24
Evaluation items
Corporate governance in action Deviation and causes of
deviation from the
Corporate Governance
Best-Practice Principles
for TWSE/TPEX Listed
Companies
Yes
No
Summary
IV. Does the Company have established a
communication channel for the
stakeholders, set the stakeholder section
on the Company’s website, and
responded to the stakeholders regarding
their concerns over corporate social
responsibilities?
� The Company has created a stakeholders section on its website and assigned dedicated personnel to
communicate, handle and reply to stakeholders' queries. The CSR report has been made available on
the website, which stakeholders may access and download at any time.
Stakeholders section:http://www.mic-holdings.com.tw/Stakeholders.html
TEL: 02-2652-5888, 03-3962888
E-mail: [email protected]
Compliant with the
rationale and practices
of “Corporate
Governance
Best-Practice Principles
for TWSE/TPEX Listed
Companies.”
V. Does the Company have commissioned a
professional stock service agent to handle
shareholders affairs?
� The Company has commissioned Chinatrust Bank as the share administration agency, which is
responsible for handling shareholder meeting affairs.
Compliant with the
rationale and practices
of “Corporate
Governance
Best-Practice Principles
for TWSE/TPEX Listed
Companies.”
VI. Information disclosure
(I) Has the Company established a
website that discloses financial,
business, and corporate
governance-related information?
�
(I) The Company has a website (www.mic-holdings.com.tw) that discloses financial and corporate
governance information in separate sections.
Compliant with the
rationale and practices
of “Corporate
Governance
Best-Practice Principles
for TWSE/TPEX Listed
Companies.”
(II) Has the Company adopted other
means to disclose information (e.g.
English website, assignment of
specific personnel to collect and
disclose corporate information,
implementation of a spokesperson
system, broadcasting of investor
conferences via the company
website)?
� (II) The Company has an English website and appoints dedicated personnel to gather and disclose
information relating to the Company. The Company has a spokesperson and an acting
spokesperson policy to address the public. Details of investor conferences are made publicly
accessible on "MOPS."

25
Evaluation items
Corporate governance in action Deviation and causes of
deviation from the
Corporate Governance
Best-Practice Principles
for TWSE/TPEX Listed
Companies
Yes
No
Summary
VII. Does the Company have other
information that enables a better
understanding of the Company's
corporate governance practices (including
but not limited to employee rights,
employee care, investor relations,
supplier relations, stakeholders' interests,
continuing education of
directors/supervisors, implementation of
risk management policies and risk
measurements, implementation of
customer policy, and insuring against
liabilities of company directors and
supervisors)?
� (I) Employee rights and privileges
MiTAC firmly believes that people is the driving force for corporate development. For this
reason, MiTAC highly values the rights and privileges of its employees and makes additional
investment for their welfare to high standard further to the protection of the rights and privileges
of the employees as required by law:
1. Policies: (1) Labor/health insurance, pension contribution, employee training,
safety and health measures, equal gender opportunities etc.
(2) Provide different forms of fringe benefits for the employees with
ceaseless effort, including group insurance protection, free physical
examination, and subsidy for pleasure trips, gym, emergency aid,
subsidy for matrimony/maternity/funeral, car loans, and subsidy for
continuing education.
2. Implementation: (1) Duly observe applicable legal rules for the protection of the rights
of employees.
(2) Employee welfare is managed by designated personnel.
(3) Designated employee relation personnel are appointed to respond
to the personal needs of the employees. This service system is
running well.
Compliant with the
rationale and practices
of “Corporate
Governance
Best-Practice Principles
for TWSE/TPEX Listed
Companies.”
(II) Concern for the employees
1. Policies: MiTAC has appointed designated personnel for managing employee
relation. These personnel are responsible for caring the employees. Scope
of service: emergency aid, employee complaint, handling complaints,
employee healthcare and hospitalization, coordination of employee
problems, prevention of sexual harassment at workplace, handling
complaints and consultation in career development. The Company also
works with external consultants to introduce an Employee Assistant
Program (EAP), where mental counselors, financial and legal specialists
are engaged to provide relief to employees' minds and daily lives.

26
Evaluation items
Corporate governance in action Deviation and causes of
deviation from the
Corporate Governance
Best-Practice Principles
for TWSE/TPEX Listed
Companies
Yes
No
Summary
2. Implementation: Last year, 36 service requests were made to the EAP by employees in
Taiwan and their family members, which represented 3% of the employee
size in Taiwan. Most of these requests were related to legal and mental
counseling. Through the assistance of the “EAP”, employees can receive
appropriate help and strongly applauded this service. When employees or
their families suffered from accidental injuries, natural disasters, or severe
illness, or death, MiTAC will provide immediate and appropriate help in
the form of financial aid. The purpose is to help these employees or
families recovered from ailment and get back to their work quickly. This
is the manifestation of The Company in caring for the employees and their
families as an integral part of its corporate social responsibility. As
mentioned, under the prerequisite of winning on both sides of the
management and labor, this has been proven highly effective in bringing
harmony and commitment to organizational stability at workplace.
(III) Investor relation:
MiTAC firmly insists on the principles of sincerity and information disclosure, and spare no
effort in making corporate governance transparent. In practice, MiTAC disclose its state of
operation and financial position to the shareholders. With the establishment of the spokesperson
and acting spokesperson system, The Company has performed its obligation in disclosure under
due diligence. Specialists and electronic mailbox have been made available to handle investors'
suggestions and queries.
(IV) Supplier relations and stakeholders' rights: The group maintains long-term relationship with its
suppliers to ensure continuity of material supply. Dedicated personnel have been assigned to
resolve product-related problems and whatever queries raised by stakeholders and shareholders,
and thereby protect their interests.
(V) Directors' and Supervisors' ongoing education: The Company's directors all have relevant
expertise. Information about their ongoing education has been disclosed onto the "Corporate
Governance" section of MOPS, and made readily accessible to investors. Continuing education
in 2015 and 2016 up till the publication date of this annual report:

27
Evaluation items
Corporate governance in action Deviation and causes of
deviation from the
Corporate Governance
Best-Practice Principles
for TWSE/TPEX Listed
Companies
Yes
No
Summary
Title Name Organizer Course name Training Hours
Chairman
Miau, Matthew
Feng Chiang
Taiwan Corporate Governance Association
Audit Committee Regulations and Practices.
3
Institute of Internal Auditors, ROC (Taiwan)
Operational Audit in Practice 3
Taiwan Institute of Directors
Tipping the Scale of Competitiveness - Global Realities and Responsive Strategies after COP21
3
Director Ho, Jhi-Wu Taiwan Corporate Governance Association
Audit Committee Regulations and Status
3
Institutional director
Representative
Way, Yung-Do
Taiwan Corporate Governance Association
Directors' and Supervisors' Responsibilities in Financial Statement Preparation - Case Studies
3
Taiwan Corporate Governance Association
Performance and Survey of Board of Directors among Public Listed Taiwanese Companies
2
Taiwan Academy of Banking and Finance
Best Board Practice and Corporate governance Workshop
2
Taiwan Corporate Governance Association
Group Governance 3
Taiwan Corporate Governance Association
Risk Management 3
Taiwan Corporate Governance Association
Sustainable Governance - New Corporate Governance and sustainability Trends
3
Securities and Futures Institute
Corporate Social Responsibility Report - Value of Sustainable Business Management
3

28
Evaluation items
Corporate governance in action Deviation and causes of
deviation from the
Corporate Governance
Best-Practice Principles
for TWSE/TPEX Listed
Companies
Yes
No
Summary
Institutional director
Representative
Chang, Kwang- Cheng
Taiwan Corporate Governance Association
Audit Committee Regulations and Status
3
Institutional director
Representative
Hsu, Tzu-Hwa
Securities and Futures Institute
Board of Directors’ Responsibility in Fraud Prevention
3
Securities and Futures Institute
Advanced Practical Workshop for (Independent) Directors and Supervisors - Avoidance of Insider Trading
3
Supervisor Chiao,
Yu-Cheng
Taiwan Corporate Governance Association
Challenges of Cross-strait Capital Markets; 2016 Economic Outlook
6
Taiwan Corporate Governance Association
Authority, Responsibilities and Practices of Board of Directors and Functional Committees
3
Taiwan Corporate Governance Association
Innovation - A Distinctive Bias. Trends of the Green Industry.
3
Representative of Institutional
Supervisor
Ching, Hu-Shih
Corporate Governance Association in Taiwan
Audit Committee Regulations and Practices.
3
Taiwan Academy of Banking and Finance
Corporate Governance 2.0 - Global Perspective and Taiwan Experience
3.5
Corporate Governance Association in Taiwan
Functionality and Performance Evaluation of Board of Directors
3
(VI)Risk management policies, practices, and risk assessment standards: The company has
established internal policies and performs risk management and evaluation accordingly.
(VII)Execution of customer policy: The group maintains sound relationship with customers to secure
profitability.
(VIII)Insurance against directors' and supervisors' liabilities: The Company has purchased liability
insurance in accordance with "Corporate Governance Best-Practice Principles for TWSE/TPEX
Listed Companies," details of which have been disclosed in the "Corporate Governance" section

29
Evaluation items
Corporate governance in action Deviation and causes of
deviation from the
Corporate Governance
Best-Practice Principles
for TWSE/TPEX Listed
Companies
Yes
No
Summary
of MOPS.
The insured The insurer The amount insured Term of policy (starting and
ending)
All directors
and supervisors
Fubon Insurance
Co., Ltd. NT$393,900,000
November 15, 2015
to November 15, 2016
VIII.Has the Company prepared a corporate
governance self-assessment report or
commissioned a professional organization
to compile a corporate governance
assessment report? (If so, please state the
board of directors' opinions, the result of
the self/external assessment, any major
weaknesses or suggestions raised, and
improvements made.)
� The Company neither prepares a corporate governance self-assessment report nor commissions a
professional organization to compile a corporate governance assessment report. However,
functioning of the Board of Directors, and practices such as internal control, internal audit, and
information disclosure have all been carried out in accordance with "Corporate Governance
Best-Practice Principles for TWSE/TPEX Listed Companies."
No material deviation is
found.

30
(V) Disclosure of the organization, functions, and operation of the remuneration committee, if applicable:
1.The Company established a Remuneration Committee on September 12, 2013; the committee comprised of three outside experts who satisfied criteria of professionalism and independence. The committee holds meetings at least twice a year and exercises the following authorities in a professional and objective manner; its suggestions are raised for discussion in board meetings: (1) Stipulate and regularly review the performance of the directors, supervisors and
managers; as well as the compensation policies, systems, standards and structure. (2) Regularly evaluate and stipulate director, supervisor and manager compensation.
2.Profiles of the Remuneration Committee members
Identity
Qu
alification
requ
iremen
t
Nam
e
Having more than five years work experience
and the following qualifications
Compliance with independence requirements
(Note 1)
No. of concurrent
roles as remuneration
committee member in
other public companies
Remarks
Lectu
rer or h
igh
er level in
structo
r at a pub
lic or
priv
ate colleg
e or u
niv
ersity in
bu
siness, law
,
finan
ce, accou
ntin
g o
r oth
er fields related
to th
e o
peratio
ns o
f the co
mp
any
Jud
ge, p
ub
lic pro
secuto
r, attorn
ey at law
, CPA
, or
oth
er pro
fession
als licensed
by
natio
nal ex
ams
that are p
ertinen
t to th
e op
eration
of th
e com
pan
y
Wo
rk ex
perien
ce in b
usin
ess, law, fin
ance,
accou
ntin
g, o
r oth
er areas requ
ired fo
r the
op
eration
of th
e com
pan
y
1 2 3 4 5 6 7 8
Members of the Remuneration
Committee
Cheng Chien-Jen
� � � � � � � � � 1
Members of the Remuneration
Committee
Ma, Shaw-Hsiang
� � � � � � � � � 0
Members of the Remuneration
Committee
Lu, Shyue-Ching
� � � � � � � � � 0
Note 1: place a "�" in the box below if the member met the following conditions at any time during active duty and two
years prior to the date of appointment. (1) Not an employee of the Company or its subsidiaries or affiliates. (2) Not a director or supervisor of the Company or its subsidiaries or affiliates. (except an independent director of
an investee of the Company, of the parent of the Company, or directly or indirectly controlled by the Company with more than 50% of its stakes).
(3) The person, the spouse, underage children, who hold more than 1% of the outstanding shares or one of the top 10 shareholders who are natural persons or who hold shares of this company under the title of a third party.
(4) Not the spouse, kin within the 2nd tier or the next of kin within the 3rd tier of any of the parties mentioned in (1) ~(3).
(5) Not a director, supervisor or employee of an institutional shareholders holding more than 5% of the outstanding shares of the Company, or of the top five institutional shareholders.
(6) Not a director, supervisor, manager, or shareholder holding more than 5% of the outstanding shares of specific company or institution having business of financial transactions with the Company.
(7) Not a professional, proprietor, partner, company or the owner, partner, director, supervisor, manager or spouse of the professional consulting entities providing services or consultation in business, law, finance, accounting and other for the Company or its subsidiaries or affiliates.
(8) The provisions of Article 30 of the Company Law are not applicable.
3. The Operation of the Remuneration Committee

31
(1) The Remuneration Committee of MiTAC is consisted of three members. (2) Duration of service: from September 12, 2013 to June 23, 2016. The Remuneration
Committee held two meetings (A) in 2015; details of members’ eligibility and attendance are as follows:
Title Name Attendance in
person (B)
Attendance by proxy
Percentage of actual attendance
(%) (B/A)
Remarks
Convener Cheng
Chien-Jen 2 0 100.00%
Members Ma,
Shaw-Hsiang 2 0 100.00%
Members Lu,
Shyue-Ching 0 1 0.00%
New on board 2015/05/08 Required attendance: 1
Members Sun Lu-Hsi 1 0 100.00% Resigned 2015/05/08 Required attendance: 1
Special notes: I. Where the Board may not accept or revise the recommendations of the Remuneration Committee,
specify the date and the instance of the Board session, and the content of the motions, the resolution of the Board, and the response to the opinions of the Remuneration Committee: None.
II. If there is any adverse opinion or qualified opinion of the members in the decision of specific motions in the Remuneration Committee on record or with written declaration, specify the date and the instance of the committee meeting, the content of the motion, the opinions of all members and the response to the opinions of the members: None.

32
(VI) The practice of corporate social responsibility:
Evaluation items
Corporate governance in action Discrepancy from
“Corporate Governance
Best-Practice Principles for
TWSE/TPEX Listed
Companies”.
Yes No Summary
I. Enforcement of corporate governance
(I) Does the Company have a corporate social
responsibility policy or system in place? Is
progress reviewed on a regular basis?
�
(I) The Company has adopted relevant systems and established environmental safety
and health strategies and HSF (hazardous substance free) policies as requested by
customers and the authority. Performance of the above systems, strategies and
policies are reviewed on a yearly basis. For more details regarding the Company's
CSR policies and progress, please refer to our official website and section
"Corporate Social Responsibility Perspectives and Commitments" in the CSR
report.
Compliant with the rationale
and practices of “Corporate
Governance Best-Practice
Principles for TWSE/TPEX
Listed Companies”.
(II) Does the Company organize social
responsibility training on a regular basis?
� (II) The Company communicates with Directors, supervisors and employees from
time to time about corporate ethics and code of conduct.
(III) Does the Company have a unit that
specializes (or is involved) in CSR
practices? Is the CSR unit run by senior
management and reports its progress to the
board of directors?
� (III) The President's Office and corresponding units within various departments form a
network that oversees the above matter. The Board of Directors' role in corporate
social responsibilities includes the following:
1. Outline the CSR mission or vision; establish CSR policy, system or
management guidelines.
2. Incorporate the CSR spirit into the Company's operating activities and growth;
while at the same time devise feasible CSR plans.
3. Ensure timely and accurate disclosure of CSR information.
(IV) Has the company implemented a reasonable
remuneration system that associates
employees' performance appraisals with
CSR? Is the remuneration system supported
by an effective reward/discipline system?
� (IV) In addition to creating a Remuneration Committee, the group also performs
annual salary surveys to determine the appropriateness of its compensation
policies. The Group run “Performance Evaluation” every six months, based on
individual performance and the performance of the two-track promotion
opportunities given, while referring to it as salary adjustment and payment of
bonuses. Also, express business integrity rule, Code of Conduct and the
incentives and disincentives, in order to improve the business operation.

33
Evaluation items
Corporate governance in action Discrepancy from
“Corporate Governance
Best-Practice Principles for
TWSE/TPEX Listed
Companies”.
Yes No Summary
II. Environment for sustainability
(I) Is the Company committed to achieving
efficient use of resources, and using
renewable materials that produce less
impact on the environment?
�
(I) The Company is committed to the efficient use of all resources through
measures such as: use of photovoltaic energy, switch towards green lighting,
the use of T5 energy-efficient light tunes, upgrade of air-conditioner
compressors, optimization of electromechanical equipment, use of
variable-frequency devices and energy-efficient appliances, use of air
compressor heat for water heating, upgrade of fuel boilers, and automated
control of air-conditioning system. The Company implement the MiGEM
intelligent environmental control system, using a large data analysis system
effectively to improve operational efficiency and reduce operating costs, as
well as to improve comfort and reduce energy consumption to fulfill corporate
social responsibility. This system levering the IoT cloud-based service, a
variety of environmental sensors will collect relevant information, can be for
constructional energy monitoring (electricity, water), environment & safety
monitoring applications (lighting control, IAQ monitoring, fire escape, video
monitoring, surveillance equipment, etc ...), as well as the largest electricity
environment farm field of air conditioning equipment (ice machine system,
AHU, FCU). By analysis thebig data algorithms and technology to achieve
the wisdom of energy-saving control device and can be controlled by APP
through pushing message for alarm function. This is the most advanced IoT
solution for energy management.
Compliant with the rationale
and practices of “Corporate
Governance Best-Practice
Principles for TWSE/TPEX
Listed Companies”.
(II) Has the Company developed an appropriate
environmental management system, given
its distinctive characteristics?
� (II) Installation of the platform for the management of restricted use of chemical
substances, and the control of hazardous substances under ISO 14001.
(III) Does the Company pay attention to the
impact of climate change on the operational
activities, implement greenhouse gas check,
and form an energy-saving,
carbon-reduction, and greenhouse
emissions reduction strategy?
� (II) MiTAC has the ability to track carbon footprint of its products, and has been
disclosing carbon emission on the CDP (Carbon Disclosure Project) platform
on an annual basis. In addition, MiTAC also sets reduction goals and takes
step towards achieving them.
The Company request strickly about industrial wastewater emissions, zero air
pollution, reducing waste generation and greenhouse gas emissions by up to
testing standards and other measures. On the other hand, companies in the
prevention of global warming and energy conservation, requested
administration department replaced old T8 lamps to new energy-saving T5

34
Evaluation items
Corporate governance in action Discrepancy from
“Corporate Governance
Best-Practice Principles for
TWSE/TPEX Listed
Companies”.
Yes No Summary
lamps. Large regional office lighting control switch is changed to a small area.
The original elongated lamp control switch change to type control switch for
the region, and increase the office air conditioner 1 ℃ to 26 ℃, in order to
save unnecessary energy waste. Beginning of each month, send out email to
deliver the green liftstyle. Select the manger for each floor to check the
implementation. All of this is to promote the policy of energy conservation.
III. Support social charity
(I) Does the Company have the relevant
management policies and procedures
stipulated in accordance with the relevant
laws and regulations and international
conventions on human rights?
�
(I) MiTAC complies with laws and strives to protect the rights and privileges of its
employees. All rights and obligations have been regulated in policies and the
supervisory system is well developed. These policies are amended at times
deemed appropriate to ensure the most comprehensive protection, and have been
made readily accessible by MiTAC employees on the intranet.
Compliant with the rationale
and practices of “Corporate
Governance Best-Practice
Principles for TWSE/TPEX
Listed Companies”.
(II) Does the Company have the complaint
mechanism and channel established for
employees and have it handled properly?
� (II) To provide employees with the means of expressing suggestions and opinions, an
employee relations unit has been created within MiTAC's Human Resource
Department, where dedicated personnel are assigned to implement employee care
measures and communication policies/channels. A digital mailbox named
"speak-out" has been set up to receive employees' suggestions and opinions.
Upon receiving messages, members of the employee relations unit would respond
with discretion and, if necessary, assemble a special panel to respond and make
improvements to employees' opinions in an anonymous and timely manner.
(III) Does the Company provide employee with
a safe and healthy work environment, and
provide safety and health education to
employees regularly?
� (III) MiTAC duly obeys safety and health-related regulations, and performs
inspections where necessary on the work environment (for lighting, CO2 content
etc), drinking water (for germ level), and building (for fire and structural safety).
In addition, all employees are subjected to physical examinations once every
other year at a standard that is higher than what the law requires. All new
employees are required to take part in an orientation course on safety and health,
as well as regular training on civil defense and fire safety.

35
Evaluation items
Corporate governance in action Discrepancy from
“Corporate Governance
Best-Practice Principles for
TWSE/TPEX Listed
Companies”.
Yes No Summary
(IV) Does the Company have established a
mechanism of periodical communication
with employees and have the employee
notified in a reasonable manner regarding
the potential impact of the operation
changes?
� (IV) The group has an interal Portal system that gathers the latest h news and
announcements from various departments within the Company. Employees may
access this information when they log in to their terminals each day. MiTAC
holds a staff meeting at the beginning of each month. The President presides over
this meeting and announces the latest development and the arrangement of the
organization to all function heads and representatives of different functional
areas. These executives will then disseminate such information to their
subordinates. Any material change of management policy that is likely to affect
employees' interests will be explained face-to-face by the respective department
in the form of a seminar, and thereby eliminate employees' doubts.
(V) Does the Company have an effective
career capacity development training
program established for the employees?
� (V) To assist employees in their career planning, the group requires managers to
engage employees in two-way discussions every six months about career plans.
Department heads have been assigned the responsibility to organize professional
training, while a global rotation system is in place to help employees develop
multiple talents. These talent programs are run on a long-term basis to help
enhance competitiveness. Furthermore, the Company encourages employees with
managerial roles to undertake on-job postgraduate studies and EMBA programs
to further refine their professional skills and management talents.
(VI) Has the Company implemented consumer
protection and grievance policies with
regards to its research, development,
procurement, production, operating and
service activities?
� (VI) MiTAC is devoted to protecting customers' interests as part of its product
responsibilities. Products are designed from a life cycle perspective, and the final
approval weighs upon a number of factors such as environmental protection,
convenience to consumers, and protection of consumers' interests. Customer
complaint channels have been established, while litigation and claims procedures
are also available for consumers to state their claims. Customers are able to raise
queries or recommendations through the contact methods specified in the
Company's web page (http://www.mic-holdings.com.tw/Contact_MHC.html).
(VII)Has the Company complied with laws and
international standards with regards to the
marketing and labeling of products and
services?
� (VII) The group takes responsibility for the products and services it sells, and devotes
great attention to marketing ethics. Its R&D, procurement, production and service
procedures have been designed to ensure transparency of product information and
product safety. The Company has published its consumer protection policy and
executed accordingly to prevent its products/services from causing damage to

36
Evaluation items
Corporate governance in action Discrepancy from
“Corporate Governance
Best-Practice Principles for
TWSE/TPEX Listed
Companies”.
Yes No Summary
consumers' interests, health and safety.
(VIII)Does the Company evaluate suppliers'
environmental and social conducts before
commencing business relationships?
� (VIII)The Company has supplier investigation procedures in place, and conducts
regular audits on internal raw material suppliers (and on new suppliers before
initiation of business relationship) to obtain assurance of their environmental
management practices and control of prohibited substances.
Start e-GP green product management system to implement of green parts supply
chain, to select qualified suppliers and to perform a detailed review parts GP and
Restriction of Chemical Substances investigation by GP system.
Currently, the Company requires all suppliers to comply with environmental
protection standards and provide GP-related information for all products supplied.
Furthermore, compliance requirements on EICC have also been communicated to
relevant suppliers through eSCM announcement.
(IX) Is the Company entitled to terminate
supply agreement at any time with a
major supplier, if the supplier is found to
have violated its corporate social
responsibilities and caused significant
impacts against the environment or
society?
� (IX) MiTAC has established “Universal Environmental Specification,” which demands
suppliers to duly comply with all environmental protection requirements for the
products supplied. In addition, MiTAC also demands the suppliers to participate
and observe the EICC (Electronic Industry Code of Conduct). Further, the
Securities Exchange Commission (SEC) of USA has been enforcing Article 1502
of the Dodd-Frank Wall Street Reform and Consumer Protection Act, and requires
disclosures regarding the use of conflict minerals. Some of MiTAC's customers
have issued depository receipts in the USA, and hence are required to declare to
SEC whether conflict minerals were used in previous year's production and
whether such minerals originated from certain African countries. For this reason,
MiTAC has included prohibition against use of “conflict materials” into its green
product policy, and responded accordingly to inquisitions made by the
aforementioned customers. In the meantime, MiTAC investigates its own
suppliers to determine whether the raw materials purchased and used in the
production process contain conflict minerals, and source of such minerals if any.
In 2015, MiTAC completed investigations on 608 suppliers and identified 259
mineral refineries; they are being required to comply with the same regulations as

37
Evaluation items
Corporate governance in action Discrepancy from
“Corporate Governance
Best-Practice Principles for
TWSE/TPEX Listed
Companies”.
Yes No Summary
does the MiTAC group.
IV. Intensification of disclosure
(I) Has the Company disclosed relevant and
reliable CSR information on its website and
at the Market Observation Post System?
�
(I) The Company uses its website and MOPS to make relevant and reliable
disclosures of CSR information, including the Company's CSR report and annual
report.
Compliant with the rationale
and practices of “Corporate
Governance Best-Practice
Principles for TWSE/TPEX
Listed Companies”.
V. If the Company has established CSR principles in accordance with "Corporate Social Responsibility Best Practice Principles for TWSE/TPEX Listed Companies," please
describe its current practices and any deviations from the Best Practice Principles:
The Company has established its own CSR principles, which conform with the rationale and practices of "Corporate Social Responsibility Best Practice Principles for
TWSE/TPEX Listed Companies."

38
Evaluation items
Corporate governance in action Discrepancy from
“Corporate Governance
Best-Practice Principles for
TWSE/TPEX Listed
Companies”.
Yes No Summary
VI. Other information useful to the understanding of corporate social responsibilities:
1. Responsibility of environmental protection
(1) System and policy: a. Set up the green platform in compliance with the requirements of RoHS/WEEE Directives and REACH and organize green supply chain management.
b. For performing the corporate responsibility of environmental protection, MiTAC seeks to regulate its obligation of environmental protection through the product environmental protection declaration statement.
(2) Implementation: a. For performing the corporate responsibility or environmental protection in electronic industry, MiTAC upgrades its capacity in speeding up the procurement of green items for its products and parts through green procurement from the suppliers in order to supervise the suppliers to reduce or ban the use of hazardous substances in the production.
b. MiTAC has made the statement of self-declaration in compliance with the environmental laws effective in the EU on PND products. MiTAC has demonstrated its strength in environmental protection, and has upgraded its business integrity and competitive power.
2. Contribution to the society:
(1) Systems and policies: a. Sponsorship of the Y.S. Award of Creativity, which helps develop local design talents and improve industry competitiveness. b. Organize forums on campus to exchange with the university students and share with them the experience in industry.
c. Participation in all kinds of industry seminars to share management and industry experience.
(2) Implementation: a. MiTAC sponsors the Y.S. Award of Creativity, an event that awards outstanding software designs, industrial designs, and micro film productions. MiTAC has been promoting awareness for this award on campus, and invites renowned industry figures local and abroad to share their experience with students in forums. These efforts have been made to inspire local designers and ultimately improve the industry's design capacity.
b. Winners of Y.S. Award of Creativity are offered internship opportunity. Meanwhile, other top-performing students are also encouraged to submit internship applications.
3. Consumers' rights and privileges:
(1) System: For realizing the responsibility for the consumers, MiTAC customer service team spares no effort in creating innovative models and logistics support system, and promotes this idea and system to all customer service teams of MiTAC in different countries of the world.
(2) Implementation: Launch the GPS brand for the consumers. a. “Mio Online Repair Service” allows the customers to request for repair without the constraints of time and place.
b. “Mio Online Education” provides simple and useful content so that customers can learn to use the devices easily.
c. “Mio Online Service” offers round-the-clock question and answer for Mio product information.
d. “Mio Online Update” allows for online product update through simple procedures.
e. “Mio Quick Map” allows the consumers to update their map and product instruction through the facilitation of the distributors in Taiwan.

39
Evaluation items
Corporate governance in action Discrepancy from
“Corporate Governance
Best-Practice Principles for
TWSE/TPEX Listed
Companies”.
Yes No Summary
4. Human right:
(1) Systems and policies: a. The group's recruitment policy focuses on hiring local employees as the first priority; regardless of where the group operates, it welcomes local workers and persons with disabilities. Competence is the determinant for employment. There shall be no discrimination against sex, religion, nationality, and political affiliation. All will be treated equally. The employment policy of MiTAC also explicitly states that all applicants and employees will be offered equal opportunity in recruitment, employment, development, evaluation, and remuneration.
b. MiTAC concerns for the rights and privileges of its employees, and duly obeys the Electronic Industry Code of Conduct (EICC) and relevant labor regulations in countries where it operates. MiTAC strictly prohibits hiring of child labor aged below 15, and refrains from assigning workers aged below 18 to works of hazardous nature. MiTAC seeks to protect the human rights of its workers irrespective of race, skin color, gender, language, religion, political affiliation or opinion, nationality, social background, wealth, birth, or any other identity differences. Employees are not discriminated in any way, whether in terms of recruitment or job duty.
c. The group is dedicated to building a gender-equal workplace, and strives to ensure equal opportunities and protect employees' dignity by strictly prohibiting against sexual harassment in the workplace.
(2) Implementation: a. MiTAC recognizes the contribution of people with different talents. Any addition or alteration of the policy of the terms and conditions of employment will be made through mutual consultation and coordination with the people concerned. There is no dispute so far.
b. MiTAC duly obeys labor regulations and respects the opinions of its employees. Any addition or amendment to the employment policy are fully negotiated between employees and the management. No employment-related dispute has arisen so far.
c. MiTAC has implemented a set of "Regulation Governing the Prevention of Sexual Harassment at Workplace and Complaints" and established a sexual harassment complaint hotline. Any complaint raised will be attended to by dedicated personnel. In addition, lectures on the prevention of sexual harassment are being held regularly to avoid sexual harassment in the workplace. These policies and practices have been soundly enforced so far.
5. Safety and health:
(1) System and policy: MiTAC has been certified for ISO 14001 - Environmental Protection System and OHSAS 18001 Occupational Health and Safety Advisory Services System since November 6, 2003. These certifications were attained as reinforcements to the safety and health of employees at workplace, and to protect employees from occupational injury, death, and prevent protest that arise as a result. These certifications are regularly validated by third-party institutions and properly enforced throughout the organization.
(2) Implementation: a. Protect the employees in safety and health, prevent occupational hazards, diseases, and potential danger, encourage the employees to participate in corrective action plans, and create a safe and healthy work environment.
b. Continual performance improvement in environmental safety and health: MiTAC conducts routine audits and assesses investments where appropriate to continually improve its environmental safety and health management system.
VII. Describe the criteria undertaken by any institution to certify the Company's CSR report: None.

40
(VII) The practice of business integrity and measures:
Assessment criteria
Current implementation Deviation and causes of
deviation from Integrity
Best-Practice Principles for
TWSE/TPEX Listed
Companies
Yes No Summary
I. With business integrity policy and action plan in place
(I) Has the Company stated in its Memorandum or external
correspondence about the polices and practices it has to
maintain business integrity? Are the board of directors
and the management committed in fulfilling this
commitment?
�
(I) MiTAC has implemented "Integrity Code of Conduct" and
published it onto the official website, which the Board of Directors
and the management are bound to obey when exercising authority.
Training courses and awareness campaigns are organized from time
to time to prevent dishonest behaviors from all personnel.
Compliant with the rationale
and practices of “Ethical
Corporate Management Best
Practice Principles for
TWSE/TPEX- listed
Companies.” (II) Does the Company have any measures against dishonest
conducts? Are these measures supported by proper
procedures, behavioral guidelines, disciplinary actions
and complaint systems?
� (II) MiTAC has Employee Code of Conduct and Anti-corruption Policy
in place to outline operating procedures and behavioral guidelines
that employees are bound to obey, and disciplinary actions and
grievance systems for violations. Both the code and the policy are
being rigorously enforced.
(III)Has the Company taken steps to prevent occurrences
listed in Paragraph 2, Article 7 of "Ethical Corporate
Management Best Practice Principles for
TWSE/TPEX-Listed Companies" or business conducts
that are prone to integrity risks?
� (III) MiTAC demands all employees to refrain from accepting improper
gifts, so that they do not compromise the Company's interests for
personal gains. In addition, all employees have the duty of
confidentiality over business secrets of the Company and other
relevant parties.
MiTAC has implemented relevant measures to prohibit against
bribery (for offering and acceptance), illegal political donations,
and inappropriate charity donations/sponsorships for business
activities that present higher integrity risks.
II. Realization of business integrity
(I) Does the Company evaluate the integrity of all
counterparties it has business relationships with? Are
there any integrity clauses in the agreements it signs with
business partners?
�
(I) MiTAC signs an "Agreement on Undertaking of Business Integrity"
when commencing business relationship with a major supplier.
Compliant with the rationale
and practices of “Ethical
Corporate Management Best
Practice Principles for
TWSE/TPEX- listed
Companies.” (II) Does the Company have a unit that specializes (or is
involved) in business integrity? Does this unit report its
progress to the board of directors on a regular basis?
� (II) The Human Resource Development Center is responsible for the
establishment of business integrity policy and prevention measures,
whereas the internal audit function is responsible for supervising
execution of such policy and measures. The internal audit function
conducts random audits on compliance status within the Company,
and produces audit reports for review by the Board of Directors.

41
Assessment criteria
Current implementation Deviation and causes of
deviation from Integrity
Best-Practice Principles for
TWSE/TPEX Listed
Companies
Yes No Summary
The Board of Directors of MiTAC will exercise the duty of care as
prudent managers to supervise and prevent dishonest conducts,
while constantly review performance to ensure continual
improvement and sound execution of integrity policy.
(III)Does the Company have any policy that prevents conflict
of interest, and channels that facilitate the report of
conflicting interests?
� (III) MiTAC has made a policy for the prevention of the conflict of
interest, and it provides appropriate channels for the directors,
supervisors, and managers in voluntary justification of their
positions, which may entail potential conflict of interest against
The Company.
(IV) Has the Company implemented effective accounting and
internal control systems for the purpose of maintaining
business integrity? Are these systems reviewed by
internal or external auditors on a regular basis?
� (IV) MiTAC has established and complied with an effective accounting
system and internal control system. In addition, MiTAC reviews the
systems at any time as needed to ensure the sustained effectiveness
of the system design and implementation. The internal audit
function of MiTAC conducts regular and special audits on the state
of compliance with the “internal control system” and prepares
related audit reports for presenting to the Board of Directors.
(V) Does the Company organize internal or external training
on a regular basis to maintain business integrity?
� (V) Employees are constantly reminded to adhere to integrity principles
in daily business activities.
III. Reporting of misconducts
(I) Does the Company provide concrete whistleblower and
reward system for employees to report misconducts?
Does the Company assign dedicated personnel to
investigate the reported misconducts?
�
(I) The Company has an Anti-corruption Policy supported by a
whistleblower and reward system. There is a broad range of
misconduct reporting channels available to both insiders and
outsiders, including mailboxes and hotlines that are run by the
Company or by independent third-party institutions. These
reporting channels have been announced to the public, while the
internal audit function is assigned to handle and investigate
reported cases.
Compliant with the rationale
and practices of “Ethical
Corporate Management Best
Practice Principles for
TWSE/TPEX- listed
Companies.”

42
Assessment criteria
Current implementation Deviation and causes of
deviation from Integrity
Best-Practice Principles for
TWSE/TPEX Listed
Companies
Yes No Summary
(II) Has the Company implemented any standard procedures
or confidentiality measures for handling reported
misconducts?
� (II) The Company has standard procedures in place to accept and
investigate reported misconducts. The procedures call for an
investigation panel to investigate and discipline wrongdoers, while
at the same time introduce a confidentiality system that ensures
confidentiality of the investigation process and safekeeping of
audit-related documents.
(III)Has the Company provided proper whistleblower
protection?
� (III) The Company has created and enforced whistleblower protection to
protect informants against mistreatment.
IV. Intensification of disclosure
(I) Has the Company disclosed its integrity principles and
progress onto its website and MOPS?
�
(I) The Company has established "Integrity Code of Conduct" and
published onto its website and at the "Corporate Governance"
section of MOPS. Implementation progress of the Integrity Code of
Conduct is disclosed in annual reports.
Compliant with the rationale
and practices of “Ethical
Corporate Management Best
Practice Principles for
TWSE/TPEX- listed
Companies.”
V. If the Company has established business integrity policies in accordance with "Ethical Corporate Management Best Practice Principles for TWSE/TPEX-Listed Companies,"
please describe its current practices and any deviations from the Best Practice Principles:
The Company has implemented Integrity Code of Conduct, which conforms with the rationality and practices of “Ethical Corporate Management Best Practice Principles for
TWSE/TPEX-listed Companies.”
VI. Other information relevant to understanding the Company's business integrity (e.g. reviews of business integrity principles): None.
(VIII) Other essential information that can help to understand the practice of corporate governance shall also be disclosed:
For more information on corporate governance, please visit the "Corporate Governance" section on MiTAC's website, or visit the "Corporate
Governance" section at MOPS (mops.twse.com.tw).
(IX) Other essential information that helps to understand the pursuit of corporate governance better: None.

43
(X) The implementation of the internal control system:
1. Statement of Declaration of Internal Control
2. Certified public accountants commissioned to conduct internal audit and the audit report: None.
MiTAC Holdings Corporation
Statement of Declaration of Internal Control
Date: March 25, 2016
The following declaration had been made based on the 2015 self-assessment of the Company’s internal control policies:
I. The Company acknowledges and understands that the establishment, implementation and maintenance of the internal control system are the responsibility of the Board and managers, and that such a system has been implemented within the Company. The purposes of this system is to provide reasonable assurance in terms of business performance, efficiency (including profitability, performance, asset security etc), reliable, timely and transparent financial reporting, and regulatory compliance.
II. There are inherent limitations to even the most well-designed internal control system. As such, an effective internal control system can only reasonably assure achievement of the three goals mentioned above. Furthermore, changes in the environment and circumstances may all affect the effectiveness of the internal control system. The internal control system of the Company features a self-monitoring mechanism that rectifies any deficiencies immediately upon discovery.
III. The Company evaluates the design and execution of its internal control system based on the criteria specified in "Regulations Governing Establishment of Internal Control Systems by Public Companies" (hereinafter referred to as "The Governing Principles") to determine whether existing policies continue to be effective. Criteria introduced by "The Governing Principles" consisted of five major elements, each representing a different stage of internal control: 1. Control environment; 2. Risk evaluation and response; 3. Procedural control; 4. Information and communication; and 5. Supervision. Each of the elements in turn contains certain audit items, Please refer to "The Governing Principles" for details.
IV. The Company has adopted the abovementioned criteria to validate the effectiveness of its system design and execution.
V. Based on the assessments described above, the Company considers the design and execution of its internal control system to be effective as at December 31, 2015. This system (including the supervision and management of subsidiaries) has provided assurance with regards to the Company's business results, target accomplishments, reliability, timeliness and transparency of reported financial information, and its compliance with relevant laws.
VI. This declaration constitutes part of the Company's annual report and prospectus, and shall be disclosed to the public. Any illegal misrepresentation or non-disclosure in the public statement above are subject to legal consequences described in Articles 20, 32, 171, and 174 of the Securities and Exchange Act.
VII. This declaration was passed unanimously by all five Directors present at the board meeting dated March 25, 2016.
MiTAC Holdings Corporation
Chairman: Miau, Matthew Feng Chiang
President: Ho, Jhi-Wu

44
(XI) In the most recent year and to the date this report was printed, any personnel of the company punished by law, or internal disciplinary action the violation of internal control system by company personnel, the major shortcomings and the state of corrective action: None.
(XII) In the latest year and to the date this report was printed, major resolutions of the Board and the Shareholders Meeting:
1. Shareholder meeting:
Date of
meeting Summary of important motions Resolutions Status of implementation
2015.06.11
1. Acknowledgment of 2014 business
report and financial statements
Voted and approved as
proposed Act in accordance with the resolution
2. Acknowledgment of 2014 earnings
appropriation
Shareholder dividend: cash
dividend at NT$0.7/share.
Voted and approved as
proposed
Set July 27, 2015 as the ex-date for cash
dividends; and August 14, 2015 as the cash
dividend payment date.
3. Discussion for the amendment of
“Articles of Incorporation”
Voted and approved as
proposed
To proceed according to the amended
“Articles of Incorporation.”
4. Discussion for the amendment of
“Director and Supervisor Election
Policy”
Voted and approved as
proposed
To proceed according to the amended
“Director and Supervisor Election Policy.”
5. Discussion for the amendment of
“Shareholder Meeting Rules”
Voted and approved as
proposed
To proceed according to the amended
“Shareholder Meeting Rules.”
6. Discussion for the removal of
restrictions against directors’
involvement in competing
business
Voted and approved as
proposed Act in accordance with the resolution
7. Special motion: shareholders have
proposed to reduce the Company's
share capital by NT$1.5 billion for
cash
Voted and rejected
2. Board of Directors meeting
Date of meeting
Important Resolutions
2015.02.02
1. Passed the proposal by subsidiary - MiTAC International Corp.to construct a corporate office building.
2. Passed amendments to "Integrity Code of Conduct."
3. Passed to assume liability of existing employee stock options (ESO) previously issued by MiTAC
International Corp., and to issue new common shares for the exercise of ESO:
The issuing date of new shares was set as March 2, 2015. In 2014 fourth quarter, 1,061,500 new
common shares were issued for the exercise of ESO.
4. Passed to retire 983,000 and 2,386,000 shares of MiTAC International Corp.that the subsidiary had
repurchased in its 14th and 15th treasury stock buybacks, respectively, but were not transferred to
employees beyond the scheduled expiry date.The capital reduction was scheduled to take effect on
March 2, 2015.
2015.03.19
1. Set the date and agendas for the Company's 2015 annual general meeting.
2. Passed the Company's 2014 financial statements.
3. Passed the proposed distribution of 2014 earnings
Shareholder dividend: cash dividend at NT$0.7/share.
Employee bonus: NT$633 thousand in cash
Remuneration to directors and supervisors: NT$2 million
4. Passed amendments to the Articles of Incorporation.
5. Passed amendments to "Directors and Supervisors Election Policy."
6. Passed amendments to "Shareholder Conference Rules."

45
Date of meeting
Important Resolutions
7. Passed the removal of restrictions against directors' competing business involvements.
2015.05.08
1. Passed reappointment of Remuneration Committee member: Following the resignation of Madam
Ms.Sun Lu-His, former Remuneration Committee member, Mr. Lu, Shyue-Ching was reappointed as a
member of the Remuneration Committee.
2. Passed to assume liability of existing employee stock options (ESO) previously issued by MiTAC
International Corp., and to issue new common shares for the exercise of ESO:
The issuing date of new shares was set on May 8 2014. In Q1 2015, 504,500 new shares of common
stock were issued through exercise of ESO.
2015.06.12
1. Set July 27, 2015 as the ex-date for cash dividends.
2. Passed to extend credit to subsidiary - MiTAC Computing Technology Corporation for up to NT$1
billion.
2015.08.07
1. Passed the Chairman's concurrent role as CEO of the Company.
2. Passed to remove restrictions against managers' concurrent roles and competing business involvements.
3. Passed to assume liability of existing employee stock options (ESO) previously issued by MiTAC
International Corp., and to issue new common shares for the exercise of ESO:
The issuing date of new shares was set as August 17, 2015. In 2015 second quarter, 10,653,280 new
common shares were issued for the exercise of ESO.
4. Passed to retire 951,000 shares of MiTAC International Corp.that the subsidiary had repurchased in its
16th treasury stock buyback but were not transferred to employees beyond the scheduled expiry date.
The capital reduction was scheduled to take effect on August 17, 2015.
2015.08.25 1. Passed to buy back shares of the Company: To be transferred to employees; a total of 20,000,000 shares
shall be purchased at NTD$18 ~ NTD$21.
2015.11.10
1. Passed the establishment of "Corporate Governance Best Practice Principles", "Corporate Social
Responsibility Best Practice Principles" and "Ethics Guidelines."
2. Passed to assume liability of existing employee stock options (ESO) previously issued by MiTAC
International Corp., and to issue new common shares for the exercise of ESO:
The issuing date of new shares was set as November 10, 2015. In 2015 third quarter, 772,550 new
common shares were issued for the exercise of ESO.
2016.01.26
1. Passed amendments to the Articles of Incorporation.
2. Passed the distribution of 2015 Directors' and Supervisors' remuneration totaling NT$2.1 million.
3. Passed a re-organization within MiTAC group: Star Well Technology Limited will contribute additional
capital to MiTAC Investment Co., Ltd.through one of Star Well's 100%-owned subsidiaries.
4. Passed capital reduction of the Chinese subsidiary - MiTAC Computer (Shunde) Ltd.
5. Passed to assume liability of existing employee stock options (ESO) previously issued by MiTAC
International Corp., and to issue new common shares for the exercise of ESO:
The issuing date of new shares was set as January 26, 2016. In 2015 fourth quarter, 790,430 new
common shares were issued for the exercise of ESO.
2016.03.25
1. Passed the distribution of 2015 employees' remuneration totaling NT$1,767,000.
2. Passed the Company's 2015 financial statements.
3. Passed the proposed distribution of 2015 earnings
Shareholders' dividends: cash dividends at NT$1.6 per share.
Shareholders' dividends: stock dividends at NT$0.4 per share.
4. Passed to capitalize earnings into share capital against issuance of 30,793,437 new common shares.
5. Passed amendments to "Third Party Lending Procedures," "Guarantee/Endorsement Procedures,"
"Asset Acquisition and Disposal Procedures," "Derivative Trading Procedures," and "Board of
Directors Meeting Procedure."
6. Passed re-election of Directors and Supervisors.
7. Passed the removal of restrictions against directors' competing business involvements.
8. Set the date and agendas for the Company's 2016 annual general meeting.
9. Passed the disposal of Loyalty Founder Enterprise Co., Ltd., an investment previously acquired by
subsidiary through private subscription of shares.
10. Passed to extend credit to subsidiary - MiTAC International Corp.for up to NT$2.5 billion.

46
Date of meeting
Important Resolutions
2016.05.10
1. Passed review of director and supervisor candidates.
2. Passed to assume liability of existing employee stock options (ESO) previously issued by MiTAC
International Corp., and to issue new common shares for the exercise of ESO:
The issuing date of new shares was set as May 10, 2016. In 2015 first quarter, 1,613,830 new common
shares were issued for the exercise of ESO.
(XIII) Documented opinions or declarations made by directors or supervisors against board resolutions in the last year, up till the publication date of this annual report: None.
(XIV) Resignation or dismissal of key personnel (including the Chairman, President, head of accounting, head of finance, chief internal auditor, or head of R&D) in the most recent year up till the publication date of this annual report: None.
V. Details of shares transferred or pledged by directors, supervisors, managers, or
shareholders with more than 10% ownership interest in the last year up till the
publication date of this annual report
(I) Changes of Shares which are owned by Directors, Supervisors, Managers and Major Shareholders
Title Name
2015 2016 up till April 23
Changes in
shares held
Changes in
shares pledged
Changes in
shares held
Changes in
shares pledged
Chairman and CEO
Miau, Matthew Feng Chiang
450,000 0 (4,717,756) 0
Director and President
Ho, Jhi-Wu 150,000
(652,000) 0 (30,000) 0
Director
MiTAC Inc. 0 0 0 0 Representative: Hsu, Tzu-Hwa
0 0 0 0
Director
UPC Technology Corporation
0 0 0 0
Representative: Way, Yung-Do
0 0 0 0
Rep: Chang, Kwang-Cheng
0 0 0 0
Supervisor Chiao, Yu-Cheng 0 0 0 0
Supervisor
Lien Hwa Industrial Corp
650,000 (16,223,000) 729,000 0
Rep: Ching, Hu-Shih 0 0 0 0 Vice President and head of finance
Huang, Hsiu-Ling 60,000 0 0 0
Note: The counterparties of shareholding transfers and shareholding pledges are not related parties.
(II) Information of share transfer: Not applicable.
(III) Information of Pledged Shares: Not applicable.

47
VI. Information on the relationship of top 10 shareholders by proportion of shareholding,
related parties, spouse, or kindred within the 2nd tier
April 23, 2016
Name
Shares held in own name
Shares currently held by spouse or dependents
Shares held in the names of
others
Disclosure of relationships between the top ten shareholders including spouses, 2nd tier relatives or
closer, or the relationships Rem
arks
Sh
ares held
Sh
areho
ldin
g
percen
tage
Sh
ares held
Sh
areho
ldin
g
percen
tage
Sh
ares held
Sh
areho
ldin
g
percen
tage
Name Relationship
UPC Technology Corporation Rep.: Miau, Matthew Feng Chiang
64,814,078 8.30% 0 0.00% 0 0.00%
MiTAC Inc. Common chairman
Lien Hwa Industrial Corp
Common chairman
Tsu Fung Investment Corp.
The Chairman of the company also acts as Chairman of the parent company
Miau, Matthew Feng Chiang
Chairman of this company
SYNNEX Technology International Corp.
Common chairman
Getac Technology Corporation
The Chairman of the company is the director of this company
MiTAC Inc. Rep.: Miau, Matthew Feng Chiang
61,228,286 7.84% 0 0.00% 0 0.00%
UPC Technology Corporation
Common chairman
Lien Hwa Industrial Corp
Common chairman
Tsu Fung Investment Corp.
The Chairman of the company also acts as Chairman of the parent company
Miau, Matthew Feng Chiang
Chairman of this company
SYNNEX Technology International Corp.
Common chairman
Getac Technology Corporation
The Chairman of the company is the director of this company
Lien Hwa Industrial Corp. Rep.: Miau, Matthew Feng Chiang
47,191,655 6.05% 0 0.00% 0 0.00%
UPC Technology Corporation
Investees valuated under the equity method
MiTAC Inc. Investees valuated under the equity method
Tsu Fung Investment Corp.
The Chairman of the company also acts as Chairman of the parent company
Miau, Matthew Feng Chiang
Chairman of this company
SYNNEX Technology International Corp.
Common chairman
Getac Technology Corporation
The Chairman of the company is the director of this company
King's Town Bank Co., Ltd. Representative: Tai, Cheng-Chih
31,778,000 4.07% 0 0.00% 0 0.00% None None
Cathay Life Insurance Co., Ltd. Representative:Tsai, Hung-Tu
21,803,000 2.79% 0 0.00% 0 0.00% None None
Mei An Investment Co., Ltd. Rep.: Tseng, Chung-Lung
16,129,371 2.07% 0 0.00% 0 0.00% None None
Tsu Fung Investment Corp. Rep.: Ho, Jhi-Wu
10,183,284 1.30% 0 0.00% 0 0.00%
UPC Technology Corporation
The Chairman of the parent of the company is the chairman of this company
MiTAC Inc. The Chairman of the parent of the company is the chairman of this company
Lien Hwa Industrial Corp
The Chairman of the parent of the company is the chairman of this company
Miau, Matthew Feng Chiang
The chairman of the parent of this company
SYNNEX Technology International Corp.
The Chairman of the parent of the company is the chairman of this company
Getac Technology Corporation
The Chairman of the parent of the company is the director of this company

48
April 23, 2016
Name
Shares held in own name
Shares currently held by spouse or dependents
Shares held in the names of
others
Disclosure of relationships between the top ten shareholders including spouses, 2nd tier relatives or closer, or the relationships
Rem
arks
Sh
ares held
Sh
areho
ldin
g
percen
tage
Sh
ares held
Sh
areho
ldin
g
percen
tage
Sh
ares held
Sh
areho
ldin
g
percen
tage
Name Relationship
Miau, Matthew Feng Chiang 8,015,243 1.03% 0 0.00% 0 0.00%
UPC Technology Corporation
Chairman of this company
MiTAC Inc. Chairman of this company
Lien Hwa Industrial Corp
Chairman of this company
Tsu Fung Investment Corp.
Chairman of the parent company
SYNNEX Technology International Corp.
Chairman of this company
Getac Technology Corporation
Director of this company
Synnex Technology International Corporation Rep.: Miau, Matthew Feng Chiang
7,084,475 0.91% 0 0.00% 0 0.00%
UPC Technology Corporation
Common chairman
MiTAC Inc. Common chairman
Lien Hwa Industrial Corp
Common chairman
Tsu Fung Investment Corp.
The Chairman of the company also acts as Chairman of the parent company
Miau, Matthew Feng Chiang
Chairman of this company
Getac Technology Corporation
The Chairman of the company is the Director of this company
Getac Technology Corporation Rep.: Huang Ming-Han
6,689,047 0.86% 0 0.00% 0 0.00%
UPC Technology Corporation
A director of the company is the Chairman of this company
MiTAC Inc. A director of the company is the Chairman of this company
Lien Hwa Industrial Corp
A director of the company is the Chairman of this company
Tsu Fung Investment Corp.
A director of the company is the Chairman of the parent of this company
Miau, Matthew Feng Chiang
Director of this company
SYNNEX Technology International Corp.
A director of the company is the Chairman of this company
VII. The shareholders of the company, the company’s directors, supervisors, managers, and
the business entity directly or indirectly controlled by the company on the same invested
company and also, the consolidated comprehensive shareholding ratio
May 15, 2016; Unit: share; %
Investee
Holding of the company
Holding of directors, supervisors, managers and
enterprises directly or indirectly controlled by the
company
Aggregate investment
Shares held Shareholding
percentage Shares held
Shareholding percentage
Shares held Shareholding
percentage
MiTAC International Corp.
1,429,218,313 100.00 - - 1,429,218,313 100.00
MiTAC Computing Technology Corporation
232,757,102 100.00 - - 232,757,102 100.00
Note: The above investments were accounted using the equity method.

49
Four. Status of Capital I. Capital and Shares
(I) Source of Paid-in Capital
1. Outstanding shares
Unit: share; NTD
Date Issuance
Price
Authorized capital Paid-in capital Remarks
Shares held Amount Shares held Amount Sources of
capital
Property other than cash
Effective (approval) date and reference number of capital
2015.03 10 1,100,000,000 11,000,000,000 766,041,561 7,660,415,610
Retirement of
treasury stock
NT$33,690,000
-
2015.04.09
Ching-Shou-Shang-Tzi
No. 10401050170
2015.03 10 1,100,000,000 11,000,000,000 766,546,061 7,665,460,610
Exercise of
employee stock
option in 2015
first quarter -
NT$5,045,000
-
2015.05.29
Ching-Shou-Shang-Tzi
No. 10401100750
2015.06 10 1,100,000,000 11,000,000,000 777,199,341 7,771,993,410
Exercise of
employee stock
option in 2015
second quarter -
NT$106,532,800
-
2015.09.10
Ching-Shou-Shang-Tzi
No. 10401190710
2015.09 10 1,100,000,000 11,000,000,000 776,248,341 7,762,483,410
Retirement of
treasury stock
NT$9,510,000
-
2015.09.10
Ching-Shou-Shang-Tzi
No. 10401190710
2015.09 10 1,100,000,000 11,000,000,000 777,020,891 7,770,208,910
Exercise of
employee
warrant in 2015
third quarter -
NT$7,725,500
-
2015.12.07
Ching-Shou-Shang-Tzi
No. 10401255040
2016.12 10 1,100,000,000 11,000,000,000 777,811,321 7,778,113,210
Exercise of
employee stock
option in 2015
fourth quarter -
NT$7,904,300
-
2016.03.02
Ching-Shou-Shang-Tzi
No. 10501041880
2016.03 10 1,100,000,000 11,000,000,000 779,425,151 7,794,251,510
Exercise of
employee stock
option in 2016
first quarter -
NT$16,138,300
- Registration in process
2016.04 10 1,100,000,000 11,000,000,000 780,631,811 7,806,318,110
Exercise of
employee stock
option in April
2016 -
NT$12,066,600
- Not yet
registered for change
Note: Only information for the last year and up till the publication date of this annual report is shown.
April 23, 2016/Unit: share
Share category Authorized capital
Remarks Outstanding Unissued shares Total
Registered common shares
780,631,811 319,368,189 1,100,000,000
All outstanding shares are TWSE-listed, and include 8,244,000 treasury stocks that have been bought back but yet to be retired.

50
2. Information relevant to the aggregate reporting policy: None.
(II) The composition of Shareholders April 23, 2016/Unit: share
The composition of
Shareholders
Qty
Government institutions
Financial institutions
Other institutions
Foreign institutions and foreign individuals
Natural persons
Treasury Stock
Total
Number of persons
2 18 138 300 92,379 1 92,838
Qty of shareholding
22 58,942,156 239,964,797 88,209,577 385,271,259 8,244,000 780,631,811
Percentage % 0.00 7.55 30.74 11.30 49.35 1.06 100.00
(III) Diversification of Shareholding
1. Common share
April 23, 2016
Level of holding No. of shareholders Qty of shareholding Percentage %
1 ~ 999 45,284 11,765,288 1.51
1,000 ~ 5,000 34,433 76,158,779 9.76
5,001 ~ 10,000 6,809 51,137,584 6.55
10,001 ~ 15,000 2,022 25,202,286 3.23
15,001 ~ 20,000 1,253 22,869,708 2.93
20,001 ~ 30,000 1,123 28,408,254 3.64
30,001 ~ 40,000 492 17,497,223 2.24
40,001 ~ 50,000 353 16,526,510 2.12
50,001 ~ 100,000 575 41,851,791 5.36
100,001 ~ 200,000 244 33,911,778 4.34
200,001 ~ 400,000 134 37,249,409 4.77
400,001 ~ 600,000 43 20,921,293 2.68
600,001 ~ 800,000 16 11,358,993 1.46
800,001 ~ 1,000,000 9 8,163,500 1.05 More than 1,000,001
shares Classified by actual needs
48 377,609,415 48.36
Total 92,838 780,631,811 100.00
2. Preferred share: None.
(IV)List of dominant shareholders April 23, 2016/Unit: share
Shareholding
Name of dominant shareholder Qty of shareholding (Note) Percentage of shareholding (%)
UPC Technology Corporation 64,814,078 8.30
MiTAC International Corp. 61,228,286 7.84
Lien Hwa Industrial Corp. 47,191,655 6.05
Note: Three shareholders of the Company each holds more than 5% of the outstanding shares.

51
(V) Information on market price, net worth, earnings, and dividend per share
Year Item
2014 2015 2016 up till
May 15 (Note 5)
Before dilution
After dilution Before dilution
After dilution
Per-share
market
price
High 30.50 29.90 35.40 34.70 26.85
Low 21.80 21.80(Note 6) 18.00 18.00(Note 6) 20.70
Average 27.16 26.52 24.12
Per-share
Net worth
Before adjustment 42.87 44.27 43.99
After adjustment 42.16 40.98(Note 1) -
Per-share
earnings
Weighted average EPS 742,397 742,397 755,205 785,998 (Note 1)
758,126
EPS 1.03 1.03 2.32 2.23 (Note 1) 0.22
Per-share
dividend
Cash dividend 0.68964501 1.60 (Note 1) -
Stock
dividend
From retained
earnings - 0.40 (Note 1)
-
From
capitalization
of surplus
- -
-
Accumulated unpaid
dividend
- - -
Investment
return
analysis
Price to Earnings ratio
(Note 2) 24.89 10.80 -
Price to dividend ratio
(Note 3) 36.63 15.66 (Note 1) -
Cash dividend yield
(Note 4) 2.73% 6.39% (Note 1) -
Note 1: 2015 earnings appropriation has been approved by the Board of Directors, but has yet to be acknowledged in a
shareholder meeting.
Note 2: Price/Earnings ratio = Yearly average closing price/ Earnings per share.
Note 3: Price/Dividend ratio = Yearly average closing price/ Cash dividend per share.
Note 4: Cash dividend yield rate = Cash dividend per share/ Yearly average closing price.
Note 5: Net worth per share and earnings per share should be based on auditor-reviewed data as at the latest quarter
before the publication date of this annual report. For all other fields, calculations should be based on data as at
the end of their respective years.
Note 6: The lowest market price per share is the price after ex-right day, so no adjustment is required
(VI) Dividend policy and its implementation 1. Dividend policies stated in the Company's Articles of Incorporation:
Earnings concluded from year-end account closure are first subject to reimbursement of previous losses and taxation, followed by a 10% provision for statutory reserves and provision/reversal of special reserves as required by law. Any balance remaining may be added to undistributed earnings carried from previous years and distributed at the proposal of the Board of Directors, subject to ratification in a shareholder meeting.
The percentage of dividends to be paid in cash may be proposed at the Board of Directors' discretion based on the Company's financial structure, future capital requirements and profitability, subject to a minimum of 10%; this minimum may be

52
adjusted with shareholders' consent.
2. The Company aims to maintain its dividend policy stable, and distribute no lesser than 30% of current year earnings as dividends to shareholders.
3. Dividend distribution proposed for the upcoming shareholder meeting
Based on the principles above, a dividend proposal was made by the Board of Directors on March 25, 2016 to distribute dividends for 2015 at NT$1.6 cash and NT$0.4 stock per share. This proposal will be presented for approval at the annual general meeting on June 21, 2016.
4. Expected changes in dividend policy: The Company does not expect any major changes to its dividend policy.
(VII)Impacts of stock dividends, to be proposed during the next general meeting of shareholders, to the company’s business performance and earnings per share.
Year Item
2016 (Projected)
Opening paid-up capital (NTD thousands) 7,778,113
Dividends for the current
year
Cash dividends per share (NTD$) 1.6
Stock dividends per share (from capitalization of earnings) (shares)
0.04
Stock dividends per share (from capitalization of reserves) (shares)
-
Changes in business
performance
Operating Income
Not applicable
(Note)
Year-on-year percentage variation of operating income
After-tax net income
Year-on-year percentage variation of after-tax net income
EPS
Year-on-year percentage variation of earnings per share
Yearly average return on investment (a reciprocal of yearly average Price to Earnings ratio)
Pro forma EPS
and P/E ratio
If capitalized earnings were entirely distributed as cash dividends instead
Pro forma EPS
Pro forma yearly return on investment
Without capitalization of reserves
Pro forma EPS
Pro forma yearly return on investment
Without capitalization of reserves and if capitalized earnings were entirely distributed as cash dividends instead
Pro forma EPS
Pro forma yearly return on investment
Note: According to "Regulations Governing the Publication of Financial Forecasts of Public Companies," the Company is not required to disclose 2016 estimates because it does not publish complete financial forecasts.
(VIII)Employees’/Directors’/Supervisors’ remuneration
1. Percentage and range of employees’/directors’/supervisors’ remuneration stated in the Articles of Incorporation
Annual profits concluded by the Company (i.e. pre-tax profit before distribution of

53
employees'/Directors'/Supervisors' remuneration) shall be subject to employee remuneration of no lesser than 0.1% and director remuneration of no higher than 1%. Remuneration shall be distributed with the resolution of the Board of Directors. However, profits must first be taken to offset against cumulative losses if any.
Employees’ remuneration, as mentioned above, can be paid in shares or cash and to employees of affiliated companies that satisfy certain criteria. This certain criteria may be determined under the Chairman's authority.
2. Basis of calculation for employees'/Directors'/Supervisors' remuneration and share-based compensations; and accounting treatments for any discrepancies between the amounts estimated and the amounts paid:
(1) Basis of estimation for employees'/Directors'/Supervisors' remuneration: 2015 employees' remuneration was proposed at a percentage no lesser than 0.1% of pre-tax income (before employees'/Directors'/Supervisors' remuneration); Directors' and Supervisors' remuneration were proposed using fixed amounts.
(2) Basis of estimation for share-based employee remuneration: The number of shares to be paid as employee remuneration was determined based on the closing price one day before the board resolution date, after taking into consideration the effects of stock and cash dividends.
(3) Accounting treatments for any discrepancies between the amount estimated and the amount paid: To be treated as changes in accounting estimates.
3. Remuneration passed by the Board of Directors:
(1) Employees’/Directors’/Supervisors’ remuneration, in cash or in shares. If the proposed payment is different from the amount estimated in the year the expense was recognized, please disclose the amount, the cause and treatment of such difference: The Board of Directors has proposed a cash remuneration of NT$1,766,631 for employees and NT$2,100,000 for Directors and Supervisors; all of which were indifferent from the amounts estimated in the year the expense was recognized.
(2) Percentage of employees’ remuneration paid in shares, relative to after-tax net income and total employees’ remuneration shown in standalone financial statements: Not applicable as no proposal was made to pay 2015 employee remuneration in shares.
4. Actual payment of employees’/Directors’/Supervisors’ remuneration in the previous year (including the number of shares allocated, the sum of cash paid, and the price at which shares were issued), and any differences from the figures estimated (explain the amount, the cause, and treatment of such discrepancies):
Actual payment in cash
Employees’ remuneration
Remuneration to directors and supervisors
633 thousand
2,000 thousand
Note: The amount of employees' remuneration and Directors'/Supervisors' remuneration paid were indifferent from the amount estimated.

54
(IX)The repurchase of shares by the Company: May 15, 2016
In thousands of New Taiwan Dollars/ thousand shares
Instance of repurchase Fifth
Date of Board Resolution 2015.08.25
Purpose of repurchase Assignment of shares to employees
Repurchase period August 27 to October 1, 2015
Price range NTD$ 18 to NT$ 21
Expected share repurchase (type and quantity)
Common shares 20,000
Completed share repurchase (type and quantity)
Common shares 8,244
Amount of capital stock repurchased
169,362
Average cost of shares repurchased (NTD$)
20.54
Reasons for not completing according to Board resolution
Share price had risen above the intended price range. Subsequent buybacks were suspended due to consideration for shareholders'
interests, the market system, and alternative use of capital.
Number of shares retired and transferred
0
Accumulated quantity of holding in Company shares
8,244
Accumulated proportion of holding Company shares in proportion to total outstanding shares of the Company
1.06%

55
II. Employee stock options
(I) Employee stock options unexpired and outstanding as at the publication date of this annual report,
and impacts to shareholders’ equity:
May 15, 2016
Type of Employee Stock Options The 11th issue of employee stock options (Note 1)
The effective date of declaration 2012.9.18
Issuance date 2012.10.11
Quantity of outstanding shares 19,375 units
Quantity of shares for subscription in proportion to total quantity of outstanding shares
Ratio
2.53%
Valid duration 6 years
Performance Issue new stock shares
Restricted exercise period and percentage (%)
Employees holding stock options for more than two years can exercise their options until ten days before the expiration date, except when transfer of stock is suspended by law.
DurationExercise Percentage
More than 2 years 50%
More than 3 years 75%
More than 4 years 100%
Stock shares exercised 4,599,620 share
Stock value exercised NTD$ 88,787,742
Unexercised underlying shares for the options (note 2)
14,193,630 share
Stock option price of outstanding stock option
NTD$ 19.1
Percentage of unexercised shares
relative to total outstanding shares (%)
1.82%
Impact on shareholder’s equity
Holders of our company’s options cannot exercise the options according to these regulations until two years after the options are granted. As a result, said options do not create significant impact on shareholders’ equity.
Note 1: The issuance was made as part of the share exchange dated September 12, 2013 for a general assumption of employee stock options issued by the acquired entity - MiTAC International Corp. The quantity and price of shares have already been adjusted using the share exchange ratio (MiTAC International Corp.: MiTAC Holdings Corporation = 1:0.5).
Note 2: After deduction of relinquished shares.

56
(II) The names, and acquisition and subscription of shares by managers who have acquired ESO and the top 10 employees entitled to
subscription under ESO as of the date this report was printed.
1. Managers May 15, 2016
In thousands of New Taiwan Dollars/ shares
Type Title Name
Shares of obtained
stock options (Note)
Percentage of obtained stocks to
outstanding shares
Exercised Unexercised
Quantity Exercise
price (NT$)
Subscription amount
Percentage of exercised shares relative to total
outstanding shares
Quantity
Subscribed stock price (NTD$)
Subscription amount
Percentage of exercised shares relative to total
outstanding shares
Term Price
Managers
CEO
Miau, Matthew
Feng Chiang
1,550,000 0.20% - - - - 1,550,000 Eleventh 19.1 29,605 0.20% President Ho,
Jhi-Wu
Vice President and head of finance
Huang, Hsiu-Ling
Note: Net of forfeited shares.

57
2. Top-10 employees (refers to employees other than managers) May 15, 2016
In thousands of New Taiwan Dollars/ shares
Type Title Name
Shares of obtained
stock options (Note 1)
Percentage of obtained
stocks to outstanding
shares
Exercised Unexercised
Quantity Exercise
price (NT$)
Subscription Amount
Ratio of shares
subscribed to the total number of
shares issued
Quantity
Subscribed stock price (NTD$)
Subscription Amount
Ratio of shares
subscribed to the total number of
shares issued
Term Price
Group Employee
President of subsidiary
Michael Lin
4,550,000 0.58% 918,000 19.5 19.1
17,674 0.12% 3,632,000 Eleventh 19.1 69,371 0.47%
Vice President of subsidiary
Albert Mu
Vice President of subsidiary
Chang, Yao-Chun
Vice President of subsidiary
King Chen (Note2)
Vice President of subsidiary
C. J. Lin
President of subsidiary
Chou, Charlotte
President of subsidiary
Shu-Chi Peggy Fong
Vice President of subsidiary
Percy Chen
Special Assistant of subsidiary
Crystal Yang
Vice President of subsidiary
Alice Fang (Note3)
Note: 1. Net of forfeited shares. Note2: Retired in July 31, 2015 Note3: Retired in April 1, 2016

58
Five. Operation Overview The Company a holding company mainly engages in investments as its specialty. The
subsidiaries major operations are development, design, manufacture, and sales of computers and ancillary equipment as well as Communication related products. Therefore, the relevant operation conditions are described according to the subsidiaries’ business.
I. Business Activities:
(I)Scope of business
1. Principal business activities
(1) Cloud computing products: include workstations, servers and storage devices; corporate and channel server / workstation series such as Intel-based and AMD-based X86 advanced servers / workstations (2-processor, 4-processor and 8-processor), IBM OpenPOWER-based single-processor and 2-processor servers and high-capacity servers, and integrated enterprise servers / workstations developed for specific customers; All-In-One LCD PCs, Mini PCs, POS systems, embedded industrial Panel PCs, BOX PCs and main boards.
(2) Mobile communication products: include auto electronics (e.g. in-car navigation, in-car audio amplifier), consumer electronics (e.g. portable navigation device (PND), GPS-enabled digital drive recorder), enterprise electronics (e.g. fleet communication/navigation devices, industrial-use tablet PCs), outdoor/recreational navigation devices, wellness wearable wristbands, and smart navigation and cloud-based services.
2. Business distribution In thousands of New Taiwan Dollars
Year Products
2015 Ratio (%)
Computer & communication
products 50,054,765 100.00
3. Major Products
(1) Cloud computing product
‧ Cloud Computing Server
‧ Rack-mounted servers
‧ Blade servers
‧ JBOD (Just a Bunch Of Disks) enclosure
‧ RBOD (RAID Bunch Of Disks) enclosure
‧ OCP (Open Compute Project) server
‧ All-In-One LCD PC
‧ Mini PC
‧ POS system
‧ Embedded industrial use system
‧ Embedded industrial use main board
(2) Mobile Communication product business
‧ Portable navigation device (PND)
‧ Carplay Display Audio & Connected Car Tablet & Navigation Box
‧ Car Amplifier
‧ GPS Bike Computer
‧ Outdoor Lighting Control
‧ Wellness wearable wristband

59
‧ Consumer electronics
‧ Outdoor navigation devices
‧ Fitness navigation device
‧ Auto electronics
‧ Enterprise electronics
‧ Mobile Health
‧ Mobile cloud storage
4. New products or technology under planning
(1) Cloud computing product
‧ Development of cloud computing servers
‧ Optimized virtual server
‧ Communication server
‧ Development of cloud storage and related technologies
‧ Network Switch
‧ Total system solutions
‧ System protocols and integration of Thin Client computers & servers
‧ Development of All-In-One LCD PC technologies
‧ POS system (point-of-sale system): encompasses technologies such as RPOS (Retail POS), MPOS (Mobile POS) and payment (contact/contact-less)
‧ Embedded systems and main boards for induatrial terminal applications
(2) Mobile Communication product business
‧ Cloud computing applications and technologies
‧ Integrated data capture, voice, and wireless broadband communication
‧ Global positioning system (GPS), electronic navigation technologies and mobile positioning services
‧ Display Audio with Smartphone Link
‧ Connected Device for Fleet Management
‧ Wellness Band
‧ Fitness Watch
‧ Event Recorder
‧ DVR and driving safety reminder
‧ Development of portable healthcare systems and applications
(II)Industry overview
(1) Current condition of the industry and its development
According to DIGITIMES Research, worldwide shipment of server systems increased 9.8% in 2015; this growth is expected to continue into 2016 and result in another 5.9% increase in shipment. This growth was mainly attributed to increased demands for Internet Data Centers (IDC). Development of cloud computing applications and social network compelled big businesses, like Amazon, Facebook, Google, and Microsoft, to construct data centers around the world in order to meet the market's demand. Economic development and government initiatives in China also inspire major telecommunication carriers and network service providers to commit resources into the installation and expansion of cloud computing and data centers, thus create demands for server hardware. x86 remained the mainstream platform adopted by new data centers worldwide. Although integrated systems were relatively small in terms of market share, they still make noticeable contributions to the growth of x86 servers.

60
For large data centers, it is increasingly common for customers to evaluate their investments based on Total Cost of Ownership (TCO), where factors such as stability, usability, ease of maintenance, ease of use, ease of management, and more importantly, energy consumption and efficiency, all need to be taken into consideration. For this reason, it is increasingly popular for customers to customize their systems and order directly from ODM/OEM. This new business model, referred to as ODM Direct, presents challenges to conventional branded manufacturers. In view of this new trend, branded manufacturers have taken the initiative to transform and adapt by introducing an integrated server that incorporates computing, storage and network switch functions all in one system to meet the needs of enterprise customers. Meanwhile, extensive efforts have also been made to refine and promote data center solutions and acquire cloud software developers to complement their transformation into solution/service providers.
In 2016, cloud computing applications will continue to grow, given the widespread of mobile devices and rising opportunities from Internet of Things (IoT). Demands for social networking may also create opportunity for big data analysis and related services. Based on Gartner's estimates, the server market should maintain its consistent growth in the future. However, given the prevailing economic realities and exchange rate volatility, some regions may not perform as well as others.
Although end-user PCs are lacking significant growth, there is however a shift towards AIO PCs because of the touch control and their appealing design, which makes AIO PC the main growth driver in desktop computers. According to DIGITIMES Research, AIO PC accounted for 10.5% of desktop (DT) shipments in 2015.
In terms of POS (point-of-sale) systems, market research companies have estimated shipment of POS devices to grow steadily to 1.8 ~ 2 million units. Apart from Windows-based systems, which is currently the mainstream, other operating systems such as Android have also emerged rapidly. There have recently been several new applications of the POS system that take advantage of tablet PCs and smartphones, such as menu ordering at restaurant, retail checkout, and warehouse management. These new applications will likely create demands for replacement purchases. According to studies made by international research and consultancy institutions, there will be increasing demands for POS systems to incorporate mobile payment features.
With regards to mobile healthcare, Global Industry Analysts, Inc. recently published a survey of the healthcare IT market that estimated the market's value to reach US$66 billion by 2020. The Asia Pacific region, in particular, presents potential compound growth rate of 11% per annum. Product-wise, the market is looking for solutions that would improve the profitability of medical institutions and enhance healthcare quality, and mobile healthcare seems to meet both requirements. Apart from which, other medical-related solutions such as decision support system, data storage/management, mobile computing and medical tourism are all expected to sustain growth in the future. According to the latest report of IDC, shipment of wearable devices may grow to 126.1 million units by 2019 as new suppliers, new products and new application come into play. This would represent a compounded annual growth rate (CAGR) of 45.1%. Apple, Google and Samsung all launched their own smart health platforms in 2014 as a strategic move towards this new opportunity. These platforms will be used to gather patients' data for big data analysis and future applications.
The "2015 China Medicine and Internet Development Report" made several predictions about online pharmaceutical retailers, that: with further deregulation of the prescription policy, the distribution of prescription drugs may shift from hospitals and physical retailers toward online retailers. Hospitals may shift as much as $11 billion of outpatient drugs, particularly non-injection and OTC types, from physical distribution to online distribution. As for other channels, approximately $12 billion of drugs will be distributed online instead of physical retail stores. The report pointed out that the value of drugs distributed online will increase from $15 billion to $22.7 billion, which represents

61
10% of the pharmaceutical market and a monumental milestone in online pharmaceutical distribution.
Medical resources in China are severely inadequate and unevenly allocated; and given the popularity of cellphones, Internet and mobile healthcare APPs, it is very likely for patients to receive medical consultation over mobile devices at lesser cost with greater ease, if the regulation allows so.
In terms of mobile communication products, while global sales of portable satellite navigation products has been declining over the years, related applications of satellite navigation has continued to thrive with other handheld or mobile devises.
According to the statistics released by a market survey firm, the traditional market of industrial use tablet PC would enjoy compound growth of approximately 11.1% and the quantity would be 5.4 to 7.4 million units. Traditionally, the Windows of Microsoft is the dominant operating system. With its free licensing and the advantage of high-level customization, Android rapidly rose in the newly emerged market and application. Examples are mobile health, vehicle-mounted tablet, and Mobile POS.
In product planning, The Company will gradually switch to embedded vehicle-mounted GPS equipment and bicycle-use GPS Tracking system as the mainstream product line of development. At the same time, new products featuring GPS tracking technologies like the GPS sports watch would also be in the plan. Besides traditional GPS tracking products, the Company will also be planning product launches in new directions, and the most prominent of all are wearable devices and IoT-related products. With respect to wearable devices, products will be integrated with the Company's existing cloud computing services and hardware/software environment to provide total solution for customers; in the IoT segment, the Company will integrate products with GPS technology and work with customers to explore broader applications in this new field.
(2) Linkage of industry upstream, midstream, and downstream
The industry in which our group operates is regarded the downstream. The upstream comprises of IC and chip manufacturers, the midstream comprises of component manufacturers, and the downstream comprises of end products such as servers and consumer products.
(3) Development trends and degree of competition for our products
a. Cloud computing products:
Application processors Graphic ICs Power management
ICs Wireless
communication ICs
RFID ICs Touch control ICs PC peripheral ICs Panel driver ICs
Main
chip
s C
om
po
nen
ts
Assem
bly,
desig
n an
d
man
ufactu
ring
Memory Touch panel
Connectors
PCB Lens Antenna Battery
Passive components
Power supply unit
Acoustic component
Active component
Cables, solder paste Disk array
Hard disk Casing Thermal module Fan
Embedded Servers PND Tablet PCs Wearable devices

62
X86 architecture remains the mainstream among the Company's products, while SPARC/RISC systems still also have a significant role to play. System on Chip (SOC) servers are currently under development. General-Purpose computing on Graphics Processing Units (GPGPU) has a certain market share in the application of High-Performance Computing (HPC). Meanwhile, IBM's OpenPOWER Foundation is currently expanding, which makes OpenPower-based products another strong contestant in the market.
In terms of product types, aside from the standard Rack-mount Units, due to the requirements on Total Cost of Ownership (TCO) from data centers, high density/multiple computation node and low energy consumption products have become development trends. Furthermore, large corporations such as Facebook, Baidu, Alibaba and QQ have even devised their own specifications (e.g. OCP, Scorpio) based on the needs of their own data centers and are requesting manufacturers to custom-make their equipment. For general servers, as the technology has become mature, ODM firms face brutal competition. The demand for cloud computing servers (high density and high effectiveness servers) can provide more differentiated strategies for ODM firms because difference exists among all product specifications and require high ability of design and integration.
Because the trend of Cloud Computing increased the market for Thin Client computers, demand grew as a result. In the past, only remote access was possible, the computers have grown to support area browser and have evolved to support VOIP and video conferencing. Computers have evolved from small screens to the capacity to support multiple high resolution monitors, and fan-less architecture have become the norm. In terms of product structure, Thin Client computers have evolved from traditional micro independent cases to All-in-one and Portable computers. In terms of platforms, SOC integrated chips have been developed from x86 architecture. Because All-in-one products allow the application of many new technologies on the hardware, this feature set them apart from traditional terminal products. Manufacturers can adopt differentiated strategy in the competition, such as multimedia, green/energy saving, and sensing technology.
b. Mobile communication products:
Regarding consumer products, we see that PNDs have evolved into personalized navigation service. Combined with LBS data, such service can integrate smart phones and internet connection functions, retrieve cloud data in a timely manner, and perform individualized service. In the outdoor application of PNDs, the trend is moving toward the area of outdoor sport and leisure use. Professionals are increasingly adopting them for bicycle and running applications. At this moment, digital drive recorders have become popular in Asia-Pacific markets, while in-car application is prevalent in Europe and the U.S. When used for “field of view support” (such as rear view cameras or panoramic support systems) or “image identification” (i.e. detecting obstacles and road lanes in Lane Centering Assist or Automatic High Beam system), digital drive recorders can form part of the vehicle safety system. In the product competition of professional PND products, we not only need competence in the GPS units, the brightness of monitors, energy saving design, and waterproof design all require intensive technology integration from upstream to downstream. Additionally, smart phones with Apps will chip away some consumers. How we can compete with various software companies is another problem we face in consumer products.
Mobile health products could be classified into two major categories: mobile care and long-term care. Mobile care products are designed to consolidate information needed by medical personnel, and help them complete clinical works with greater efficiency, thereby providing patients with better quality care. Information gathered from portable devices will be stored permanently using the same format as digital charts in a database designated specifically for clinical data. This database will facilitate data mining for various purposes such as solution for clinical problems,

63
development of clinical knowledge bank, and decision support. However, these products will still be prone to price competition from digitized conventional healthcare information systems.
In terms of long-term care, MiTAC offers dynamic evaluation systems for use within medical institutions, as well as wearable devices for long-term care outside medical institutions. The wearable devices will enable data collection over a longer period, thus provide caregivers with continual information to make more appropriate decisions. However, the Chinese market currently offers limited prospect for this product due to policy constraints.
(III)Technology and R&D overview
1. Committed R&D expense In thousands of New Taiwan Dollars
Year
Item 2015
2016 first quarter
(Note)
Research and
development expense 2,356,604 570,767
Note: up to the quarter before the publication of the annual report.
2. Successfully developed technology or product in the latest year or up to the publication
date of the annual report
As a response to the development trends of global wireless communications,
mobile communications, and cloud computing, MiTAC’s main R&D strategy is
controlling the development schedule of new technology and products, and launching
new technology products whenever possible with the R&D talent pool in Taiwan, China,
and the US. We follow the product specification set by technology leaders in mainstream
markets and create our own technology through R&D. We can also roll out products that
meet market demand to control business opportunities. The diversity and
comprehensiveness of MiTAC products combined with the support of a well-integrated
supply chain and globalized manufacturing locations is our advantage over the
competition.
(1) Significant achievements are as follows:
a. TYAN joined OpenPOWER Foundation in January 2014 and became one of its
founding members. Later in April, TYAN joined IBM in the announcement of
world's first OpenPOWER CRB (Customer Reference Board), which allows
software and hardware developers to test their products for compatibility and
optimization on the OpenPOWER platform. TYAN has also been working with
IBM to develop a high-performance server for IBM's data center. The
high-performance server began its deployment in June 2015, ans was later
commissioned into service in December 2015. TYAN is currently developing a
dual-processor OpenPOWER platform that supports NVIDIA's latest NVLink
technology (high-speed connection for multiple GPUs); the product is scheduled to
be released to the public in August 2016.
b.We formed corporate cooperative alliance with leading brands in the industry. We
introduce high efficiency processor technology and provide servers and
workstations so that we can become a leading brand in channel sales.
c. We integrate cloud smart solutions and Smart GPS device and integrate our
brand-new SoLoMo (Social, Local, Mobile) user experience into navigation
service. We offer these products to users eager to discover local information.
Meanwhile, such smart solution is also a solution designed to integrate on-board
education, entertainment, and mobile internet service platform.
d.By participating in Microsoft's "Azure Certified for IoT Launch Partners"
introduced toward the end of the previous year, the Company expects to offer IoT
64
solutions that run on Microsoft Azure, which will enable big data analysis and
bring more value-adding services to customers.
(2) Products
a. Cloud Computing products series
①Servers: Following the uprise of cloud computing and demand for data centers,
MiTAC has launched a series of single, duo, and quad processor servers by
leveraging on the R&D capability and team it has built up over the years. By
applying system integration, MiTAC was able to develop high capacity yet
energy-efficient servers that conform with ongoing demands for greenness and
energy conservation, and thereby lower customers' Total Cost of Ownership
(TCO) when constructing server farms. Apart from x86, the Company will also
devote resources into IBM's OpenPOWER architecture and system-on-chip
servers.
②Storage device: As a response to the increasing demand for massive data
transmission and storage brought about by cloud computing, and growth
opportunities presented in the storage market, MiTAC continues to commit its
R&D team to the development of new storage technologies and products. This
includes high-density, SBB2.0-compliant JBOD/RBOD products with SAS12G
interface.
③Total system solutions: Total system solution has revolutionized the ways
servers used to be designed. Not only does it optimize the use of space and
computing power, it also makes server configurations more flexible and
energy-efficient. OCP and Scorpio 2.0 designs, for example, have the potential
to increase node height by 5% and internal width by 11%, which increase
overall space utilization by 31% and allow as much as 2 times the hardware
density. The additional space also creates more possibilities for node designs. In
light of market's new trend and customers' new demands, MiTAC committed its
R&D team into the development of total system solutions, and eventually sold
its products to Japanese ISPs for data center construction.
④At Computex, TYAN unveiled a full range of high-capacity, power-saving, and
energy-efficient products for cloud application, including: the TYAN Yellow
River series (for intensive cloud computing), TYAN TN series (storage solution
for cloud computing), the TYAN FM65 series micro servers (cloud computing
solution that offers even greater energy efficiency).
⑤During SC'15, TYAN showcased its solutions for high-performance computing
(HPC) and Cloud Computing that are increasingly popular enterprise users.
TYAN's solutions in this area include a general server that supports the latest
Intel® Xeon® E5-2600 v3 processor, a high-end 2-DIMM/4-DIMM server that
supports Intel Xeon Phi® processor, and a high-performance server that
supports IBM's OpenPOWER architecture.
⑥Medium and high-end workstations: Powered by Intel® (or AMD) processors,
these workstations support 1-DIMM/2-DIMM and feature at least one PCI-E
Gen.3 x16 socket with high-performance graphics card and audio chipset to
give users an excellent work environment.
⑦All-In-One integrated LCD PC in 21.5” and 23.6” variations with convenient
user interface features such as embedded touch screen, webcam, and VoIP
communication.

65
⑧In 2012, MiTAC was engaged in a strategic joint venture with Intel for the
launch of Thin Mini-ITX, the very first standard platform exclusively designed
and manufactured for channel customers. A new, innovative version was
introduced soon after in 2013 featuring an independent graphic display card and
simple trendy design, which allowed easy and cost-effective customization for
use in distribution channels. The innovative design manifests itself in
multimedia, green/energy saving, and sensing technology. Later in 2014, a
portable version was introduced with long battery life that makes it suitable for
many applications. Its high level of integration has set new standards for the
next generation of products. In 2015, a new model featuring wireless charging
was launched in conjunction with Intel.
⑨Mini PC: These are highly integrated PCs featuring fan-less designs, legacy
connectors, and support for Intel's high-performance chipset - Baytrail. Their
simplistic design makes them widely popular in commercial and office
applications.
⑩Embedded industrial systems: Depending on customers' needs, MiTAC
develops BOX PCs and Panel PCs that operate in wide temperature ranges for
industrial use. Their support for multiple connector options makes them
versatile in a broad range of applications.
⑪Embedded industrial main board: in a strategic joint venture with Intel, the
Company pushed the Atom platform into embedded industrial applications and
introduced new generation of wide temperature products to satisfy different
terminal applications. In 2015, MiTAC's new-generation products are gradually
being introduced into customers' applications.
⑫POS (point-of-sale) system: To address customers' demand for lightweight and
better utilization of space, MiTAC has been developing a series of tablets with
dual operating systems and varying screen sizes. Some of which even have
payment features built-in to satisfy the needs of commercial users. These
innovations have been rated favorably by ODM customers.
b. Mobile communication products
①Mio launched the 6-series of digital drive recorder products in 2015. The
MiVue 6 emphasized on ease of backup, giving users the ability to backup
recorded videos using either WIFI connection or the proprietary dual-memory
card deisgn. A MiVue App has been designed to pair exclusively with MiVue
658 WIFI, thus allowing users to backup video onto cellphone while recording,
all with the touch of a button. The 6-series is also the first digital drive recorder
to have front and back cameras built in at the same time. Both cameras feature
1080P resolution, 30FPS and large apeture, which make the product the number
one choice to the most demanding consumers.
Product
Name Region Media Award Logo
MiVue 698 Russia Megaobzor Editors choice

66
MiVue 658 Russia Megaobzor Editors choice
MiVue 688 Russia Almodi.org Recommended
buy
MiVue 658
Touch BLX ANWB ANWB award
MiVue 685
WIFI Taiwan IT month 100 innovative
②Mio's Mivue 568 Wifi features the latest "one-touch backup" function that
backs up recorded videos onto cellphone simply with a touch of button (when
paired with an exclusive APP). The unit also has a 4M-pixel lens built-in to
record video at 1296p Extreme HD resolution, instead of the usual 1080p Full
HD. The unit uses its built-in GPS function to detect cuising speed and sensors
to detect tyre pressure, and sends corresponding notifications for driver's safety.
③Magellan SmartRV and SmartFleet: A successor to the Company's
revolutionary personalized navigation service, the SmartGPS technology has
been further expanded and applied to sports utility vehicles and fleets. The
service not only allows users to receive LBS data and access their personalized
navigation over cloud, but also enables fleet managers to coordinate vehicles
wirelessly over the cloud system.
④ORV (Off-road Recreation Vehicle) SmartECO System: This system allows
users to receive LBS (Location-based Service) information and access
personalized navigation data stored on cloud, which can then be used to plan
recreational routes. It combines the functionalities of cloud system, smartphone,
PC, and navigation device.
⑤Connected Car Tablet: Designed exclusively for enterprise customers with
vehicle management requirements, the tablet has 3G/BT/WiFi connectivity built
in and transmits real-time vehicle data back to the cloud, thus enable
communication and interaction between the despatch center and the driver.
These tablets have been tested under more rigorous conditions for vehicle use.
⑥During Computex 2015, Mio showcased its rearview mirror DVR that also
records video through the rearview mirror. The product received overwhelming
praises for its excellent image quality and wide recording angle.
⑦During Comutex 2015, MiTAC introduced wellness wearable solutions and
sports watches to help people record and analyze biological data and keep track
of sleep and exercises in their busy lifestyle, so that actions can be taken to
achieve work-life balance. The product has been scheduled to launch in
mid-2016.

67
⑧Industrial use tablet PC and portable devices: The Company launched the very
first portable tablet PC exclusively designed for mobile healthcare in 2012,
which won the “Best of Computex” award. In an attempt to deliver efficient
“patient safety” in mobile healthcare, the Company worked in conjunction with
the healthcare system and developed a total solution for administration of
chemotherapy medication, which later won the National Quality Award. In
2013, a complete product line was introduced during “Medica” in Germany,
which won the Company the "IF" Award in 2014 and 2015.
⑨Mobile healthcare solution:
I.Mobile Nursing Information System: Unlike ordinary nursing information
systems, the mobile feature aims to provide nursing staff with the most
relevant information depending on the time, place, and works involved. The
system also works to ensure patients' safety, as information such as barcodes,
images or picture aids are used to help identify patients and control procedures
such as drug administration, blood transfusion, and blood collection. Smart
features such as task scheduling, notifications and data entry help nursing staff
focus on their jobs and reduce time spent on activities unrelated to nursing. By
adopting international standard phrases and codes, new medical staff can
rapidly search for relevant knowledge from database to assist their decisions.
Lastly, the system provides real-time data on performance and costs that
would prove useful in hospital administration.
II.Long term Care Assessment System: The system is developed to generate
assessment reports on-demand. Featuring a unique interface design, users can
quickly complete the assessment questions (and skip irrelevant questions, as
prompted) to receive immediate feedback of the assessment result. The system
is also connected to a set of clinical nursing guides that suggests standardized
nursing programs for the user, and thus save time on assessments while
improve quality of nursing care.
(IV)Long- and short-term business development plan
1. Cloud Computing products series
(1)Short-term business development plan: In terms of product strategy, we continue
with cooperative development and production plans with existing customers or chip
manufacturers in workstations, servers, and storage device. Demand for servers in
China has been growing in recent years. To capture this trend, MiTAC is actively
looking for system integration service providers to cooperate in a long-term
relationship, or local firms that can provide cash flows and logistics management to
serve customers in a timely manner.
(2)Long-term business development plan: In terms of product strategy, we continue to
develop new products in servers and storage device markets and make such
development our dynamism for business growth for the next three years. In terms of
business strategy, the Company aims to expand its cooperation with leading server
customers in the world, and supply products from modules to full-systems, from
low-end to high-end, and from single to multiple product lines. In order to maintain
long-term, stable relationship, the Company needs to improve the capacity and
speed of product development, control production quality and delivery, integrate
supply chains throughout the world, and maintain a global logistics and service
network that would secure MiTAC’s position as a major ODM/OEM for servers

68
and systems.
2. Mobile communication products
(1) Short-term business development plan
1.1 Mobile handheld and digital family markets are at the initial growing stage. In
the short run, our company will operate with market development condition and
focus on channels and ODM operation in European and US markets. We will
actively develop niche products and explore customers in different areas. The
Company's future strategies in this area will involve: combining the SoLoMo
(Social, Location, Mobile) experience to develop revolutionary and competitive
products; bringing high added-value to customers through innovative and
professional product planning, R&D, design, and production capability;
improving overall effectiveness and for higher customer satisfaction; raising
brand loyalty of existing customers; and combining personal information such
as cloud data, social networking and Point of Interest to develop niche products
for different customers.
1.2 Industrial use tablet PC and portable devices: The Company will be launching
portable devices with equal emphasis in proprietary brand, ODM and OEM. In
Europe, MiTAC's primary focus is to promote the proprietary brand. In USA,
the Company will focus primarily on OEM, whereas in Japan, both OEM and
ODM services will progress concurrently. In China, the Company will
emphasize on introducing total mobile healthcare solutions via its distribution
network and by providing integrated software at key medical centers.
1.3 Mobile healthcare solutions: Judging by the market's demands and level of
saturation, MiTAC will focus its efforts on promoting Mobile Nursing
Information System and exploring new clinical applications as its short-term
strategy. Meanwhile, improvements will be made to the products to enhance
user experience, and thereby achieve marketing effects through the most
economical way - the word of mouth. Furthermore, MiTAC will actively
engage distributors for higher product exposure, and provide customers with
trial versions of the product to eliminate their doubts about how the products
may assist in their cause. Lastly, MiTAC will aim to introduce integrated
solutions to add value to individual software/hardware.
(2) Long-term business development plan
2.1 Mobile handheld and digital home market: Our long-term business
development strategy calls for expanding our scope and exploring emerging
markets in Asia-Pacific, China, Russia, and the Middle East. We will adapt to
the changes and needs of different age groups with diversified products.
Through our brands and B2B strategy and integrating user experience of Mio,
Magellan, and Navman products, we integrate life, health, sports and leisure,
and navigation service products to allow costomers access to real-time
information whether they are moving, running, or driving. This strategy will
guide MiTAC to the field of cloud service.
2.2 Industrial use tablet PC and portable devices: Sales are being expanded into
Russia, Central Asia, South Asia, and South America. Meanwhile, the
Company is continually working on expanding mobile healthcare solutions into
Europe and America. Apart from mobile healthcare, other applications such as
in-car tablets and Mobile POS are currently being developed.
2.3 Mobile healthcare solutions: Over the long run, MiTAC plans to promote its

69
mobile healthcare solutions to more users including inpatients, outpatients and
healthy consumers, instead of just medical staff. By combining the use of
wearable devices with the Mobile Nursing Information System, the big data
knowledge bank, and a cloud-based health platform, people would begin to
prevent diseases instead of treating them, and hence create immeasurable value.
II. Market and an overview of production and sales
(I) Market analysis
1. Geographic location of the sales of the company’s major products
In thousands of New Taiwan Dollars
Regions 2015
Taiwan 493,401
US 28,538,674
Europe 12,048,256
Others 8,974,434
Total 50,054,765
2. Market share
According to the survey and research conducted by DIGITIMES Research,
MiTAC ranked 5th among Taiwanese ODM service providers in terms of system and
main board shipments in 2015. With regards to mobile communication products,
MiTAC's auto electronics brand ranks firmly among the top 3 in the world.
3. Future supply and demand in this market and growth outlook
(1) Cloud Computing product
As the U.S. economy continues its recovery, businesses will be more willing to
invest in IT equipment, and thus contribute to additional demands for server products.
Combined with trends such as big data analysis and IoT, server shipments in 2016 are
expected to increase compared to 2015.
In light of increased shipment and declining average sales price, recently major
international server firms committed themselves to lower production cost and
increase product competitiveness and market share. As a result, energy efficiency and
lower cost have become the opportunity for future products of these firms. In addition
to Intel's next-generation Atom and energy-efficient Xeon processors, other chip
manufacturers are also trying to capture a piece of the server market with ARM-based
SoCs, and technological advancements have been made to reduce energy
consumption and costs. As computing continues to shift towards the server end,
customers will inevitably become more concerned with energy consumption of future
server products. MiTAC offers a broad variety of x86 servers through its TYAN
brand. From entry-level to high-end models, all TYAN products feature the latest
14nm production and Multi-core, Multi-thread technology with DDR4 support; some
products can even support high-end GPUs. TYAN has also been successful in the
development of 1U and 2U servers based on IBM's OpenPOWER architecture; both
of which have already been adopted by IBM for use as data centers, and therefore
present new selections for enterprise users. TYAN is professed to work in
cooperation with the customers in full effort, and will provide better service for
professional IT personnel. Continued effort will be made in innovation for developing
solutions with flexibility, reliability, high performance, high utility and low cost in
operation to help the customers installing an ideal IT infrastructure. This is the
optimal feedback to the changeable commercial environment and opportunities for
the enterprises. Therefore, MiTAC has suitable products to satisfy hardware
requirements of any user from general enterprises, large computing centers, data

70
centers, cloud computing centers, public infrastructures, to government projects.
These are the markets where the group will be promoting its X86 and OpenPOWER
servers.
(2) Mobile Communication product business
As cloud computing grows, more smart features are needed, which in turn contributes to the rapid development of smart terminal devices. Whether its is smartphones, tablet PCs, or any product with a display screen (e.g. in-car AV, watches, glasses), they could all be turned into smart terminals and provide enormous market opportunities. Applications of mobile terminals will broaden as more users connect to the cloud, bringing in billion dollars of business opportunities! Based on the SoLoMo concept, MiTAC has developed applications across different platforms and services to satisfy consumers' diverse tastes.
Embedded system, with its high level of integration, is more difficult in design than the traditional Wintel setup and incurs enormous expenses during the R&D stage. MiTAC not only has abundant experience in the design and shipment of consumer GPS systems, its embedded system design team also possesses the expertise to analyze users' behaviors in specific areas and integrate system functions to deliver customers' requirements. In the future, MiTAC will continue shifting its business focus towards industrial/commercial applications that present high growth potentials.
4. Competitive niche, positive and negative factors for the prospects of our development,
and our corresponding strategy
As cloud applications grow, MiTAC not only possesses the ability to design and
manufacture cloud hardware, it has also been integrating hardware, software,
engineering automation, manufacturing design, and after-sale services around the world
to develop a new business model that would accomplish higher customer satisfaction
and competitive advantage, in order to break free of the low-margin PC OEM business.
In terms of wireless communication, MiTAC will take initiative in developing
niche products that target specific needs in the market, while at the same time improve
its capacity in terms of R&D, innovation, hardware/software integration, cost control,
quality control, yield control, mass production, inventory management, access to key
components, logistic support, regional distribution, and financial strength.
(1) Competitive niche
A. Customer demand and control of the market: We grow with location based service markets. MiTAC jointly explore and invest in markets with regional software and hardware customers to understand terminal demand. MiTAC is also negotiating cooperation plans with various world-class information and communication firms so that it can fully grasp market trends, seize fluctuations in the market, and explore new products.
B. Cooperation with world-class software and hardware firms to secure the supply of material: This advantage includes the support of software firms in software development and the source of key components.
C. Research and development capability: Many of our products lead the market and win international awards, earning “number one” ranks.
D. Ceaseless advancement of quality and the expansion of production capacity: We have accumulated years of embedded product software-hardware integration technology, which is a major advantage in design and manufacturing.
E. Through the use of existing regional channels and the group's global logistics and service network, MiTAC is able to provide more complete services to customers.
(2) Favorable factors in development
A. A supply chain that integrates internet infrastructure
MiTAC has revised its sales and distribution model to conform with growing e-commerce throughout the world. Many of the high-priced products are being

71
produced and distributed directly to customers for greater efficiency, lower cost, and higher customer satisfaction.
B. Global e-manufacturing model
After a few years of trials with our logistics model, MiTAC’s e-manufacturing structure is becoming more and more adequate. We have formed a global manufacturing model with division of labor: Taiwan, Australia, and the US concentrate on R&D and design, combined with the modules and semi-finished goods produced by production bases in Mainland China, and joined by the BTO/CTO assembly centers in the US. This combination is our global manufacturing model with division of labor. Components and systems with low level and long transportation time are manufactured in China; main components with high unit price are procured from production bases worldwide. This globalized division of labor has turned MiTAC from a regional organization to an international conglomerate with well coordinated functions including R&D, engineering, manufacturing, and distribution.
C. Expand the development of products with high added-value
To follow the future trend of wireless IP communication-computer synthesis, MiTAC will continue to form strategic alliances with leading international firms to jointly explore markets. MiTAC has strong capacity in differentiated innovative design, research and development, production and manufacturing integration in GPS market, and is the leader in launching different models of GPS communication products and mobile healthcare products. MioCARE is unlike any chemo drug administration system used in conventional hospitals; it has been built based on BCMA to better tend to the needs of nursing staff.
Continued effort will be made for advanced integration of the embedded products. RFID and bio-identification system will be integrated into portable devices further to existing Bar Code Scanner and NFC. In addition, effort will be made in the development of the MDM (Mobile Device Management) software with a view to providing software integration partners faster and complete full-range service.
D. Maintaining growth momentum in the market
Other than continuing to invest resources in major markets such as North America and Europe, intensified exploration of markets with enormous growth potential in GPS, such as Asia-Pacific, and emerging markets such as China, Japan, and Eastern Europe will be focus points of development. The mobile health market in North America is the best developed market so far. In the market of equipment of the future, Asia-Pacific, including China, Japan, Taiwan, and Korea, will be very promising.
E. E-supply chain
Several adjustments have been made to MiTAC's globalized productions to accommodate local customers' needs. One of these adjustments is to adopt modular designs for main components, while another is to integrate MiTAC's e-commerce capacity with those of upstream suppliers for just-in-time shipment and delivery, which minimizes operational risks and inventory.
(3) Negative factors for the prospects of our development and our corresponding strategy
A. Competition comes from cell phones and on-board navigation and a/v systems. After all major firms successively committed themselves to the R&D, manufacturing, and production of GPS products, the pressure on the price grew fiercer by the day. The average retail price of PND after 2010 has dropped to below US$ 100. Additionally, PND has been integrated with wireless communication products, and smart phones with built-in GPS have become the norm for retail sales. This feature will steal the market away from PNDs more decisively. Our corresponding strategies are as follows:
(a) Improve the integration between PNDs and on-board information application. Differentiate our PNDs from smart phones with GPS functions.

72
(b) Emphasize R&D and innovation. Improve our result from R&D. Reduce product development cycle. Maintain our ability to launch new products. In addition, we will localize our products, and make them more diversified, differentiated, mass-produced to ensure we have an edge in our products and profit.
(c) Improve the satisfaction of our customer from design in the upstream to mass-production to logistics. We seek strategic alliance with major firms in the world.
(d) We use our global logistics model and establish an entire set of material planning, value chain, and logistics infrastructure.
B. The embedded system products confront the problems of small quantity in large variety, extremely high cost of development, and the strict requirements of quality and application environment. Most of the customers are small and medium enterprises in wide dispersion geographically. Marketing of these products is tough and the counter-measures are:
(a) Integration of all products to a single platform, compress the lead-time for development of new products and customized products.
(b) Continue the development of high-level integrative solution with equal weight in hardware and software research and development.
(c) Global marketing in a wide array of business mode.
(d) Launch a total solution for enhancing added value. Acquire Domain Knowledge of the industry for continued development of leading brands in technologies.
C. Key components are still controlled by overseas manufacturers. We need further experience in the integration of software and hardware. Our corresponding strategies are as follows:
(a)Maintain good supply chain relationship with overseas manufacturers of key components. We will also do our best to develop talent that is capable of integrating software and hardware in operating platform and communication components.
(b)Diversify the supply channel of key components: we seek more sources of suppliers and secure the source of our suppliers and competitive pricing. We seek to establish good interaction with domestic firms that are already producing or planning to produce key components to maximize our choices.
(c)Advantage through quantity: Popular demands for the Company's products have helped us win businesses of major OEM/ODM customers, which enables cost reduction through bulk purchase.
D. Uncertainty inherent to the newly emerged market of mobile health
(a)Rapidly changing needs: Prospects of medical/nursing software are heavily dependent upon government policies, insurance terms and hospital ratings, as users' demands are likely to vary due to changes in the above factors.
(b)Diversity of commercial models: The user is not necessarily the one who pays for the product; it can be individuals, hospitals, pharmaceutical companies, or insurance companies.
(c)Non-standardized specifications: It is difficult for users to express clearly what they need in an information tool. Furthermore, wide differences of products available in the market makes systems more costly to develop, implement and maintain. As a result, it may take time for costs to become acceptable to users.
(d)Longer sale cycle: Medical systems take more time to sell than consumer products. Sale cycles may vary depending on product pricing, target users, return on investment and payback period, whereas issues concerning software or hardware may drag on even longer, up to 12-18 months. This prolonged sale cycle alone gives rise to even more uncertainties.

73
(e)Users' interaction with wearable devices: Data gathered from wearable devices takes time to develop usefulness, therefore the challenge lies not in arousing users' interests, but keeping them interested in the product.
(f) In light of the above problems, MiTAC will aim to expand strategic partnership and create a full-fledged network that is operated using medical tablets. Partners such as developers of complementary medical products, medical instrument distributors, medical information system distributors etc may all play vital roles in this network, for they provide MiTAC with access to their customers and help reduce future maintenance costs. Furthermore, MiTAC will continually monitor changes in the healthcare market and future government policies, so that product features can be improved to maintain competitiveness.
(II) Important applications and production process for main products
1. The functions of major products
Product type Major purpose and functions
Workstations Graphical computing tool for designers
Servers Data computing tool for businesses
Storage devices Data storage tool for businesses
Desktop PCs A necessary tool for individuals, households, schools, companies, and merchants.
Mobile Communication Devices
Vehicle-mounted GPS audiovisual system, consumer electronics (outdoor, physical fitness, driver navigation), fleet management system, mobile health related products and application of cloud technology, and embedded system, industrial use tablet PC system.
2. Production process
(III) Supply of key materials
Component name Origin Supply status
CPU/ CHIPSET Suppliers: USA, Korea, China, Malaysia, Thailand Good
HDD Suppliers: USA, Japan, Thailand Good
DRAM Suppliers: Taiwan, USA, Korea Good
Flash Suppliers: Taiwan, USA, Japan, Korea, China Good
PCB Suppliers: Taiwan, USA, China, Korea Satisfactory
LCD panels Suppliers: Taiwan, Korea, China Good
DVD-RW Suppliers: Taiwan, Korea, China Good
LAN Suppliers: Taiwan, USA Good
Camera Module Suppliers: Taiwan, China Satisfactory
IQC test SMT
automated
insertion
Visual
inspection Manual
insertion
Laminate
soldering Laminate
repair Visual
inspection Laminate OQA
testing System
assembly
Aging test OQA Packaging Radom
packaging test Finished
product
AOI/AXI
testing

74
Battery Pack Suppliers: Taiwan, Japan, China Satisfactory
PCI Card Suppliers: Thailand, Israel, Singapore, China, Malaysia
Good
PSU Suppliers: USA, China, Thailand Good
Chassis Suppliers: China, Malaysia Good
(IV)Major customers and suppliers in the latest two years
1. The names of the suppliers in the last two years that accounted for more than 10% of the total purchase in any of these years, the purchase amount and percentage to total purchase, and give reasons for any change thereof, if applicable.
In thousands of New Taiwan Dollars
2014 2015 2016 first quarter
Item
Name Amount
As a percentage of full-year
Net purchase
(%)
Relatio
nsh
ip
with
the issu
er
Name Amount A
s a percen
tage
of fu
ll-year N
et p
urch
ase R
atio (%
)
Relationship with the
issuer
Name Amount
As a percentage of 2016 first
quarter net purchase (%)
Relationship
with the issuer
1 Supplier A 4,746,432 13 None Supplier A
6,475,666 15 None Supplier A 968,800 13 None
2 Supplier B 3,460,408 9 None Supplier B
6,412,992 15 None Supplier B 851,619 11 None
3 Others 28,817,181 78
Others 30,664,503 70 Others 5,840,296 76
Net purchase
37,024,021 100 Net
purchase 43,553,161 100
Net purchase
7,660,715 100
Note: All variations had taken into consideration production/sales policies, raw material demands, suppliers' prices,
actual delivery and quality of the respective years.
2. The names of the suppliers in the last two years that accounted for more than 10% of the total sales in any of these years, the sakes amount and percentage to total sales, and give reasons for any change thereof, if applicable.
In thousands of New Taiwan Dollars
2014 2015 2016 first quarter
Item Name Amount
As a percentage
of full-year Net sales Ratio (%)
Relationship with the issuer
Name Amount
As a percentage
of full-year Net sales Ratio (%)
Relationship with the issuer
Name Amount
As a percentage of
2016 first quarter net sales (%)
Relationship with the issuer
1 Customer E
21,205,664 50 None Customer E
29,663,727 59 None Customer E
4,496,623 49 None
2 Others 20,854,678 50 Others 20,391,038 41 Others 4,644,442 51
Net sales 42,060,342 100 Net sales 50,054,765 100 Net sales 9,141,065 100
Note: All variations have taken into account factors such as future market trends, product demands, industry prospects,
R&D technologies, sales margins, and customers' contracts.
(V) Production volume and value in the latest two years In thousands of New Taiwan Dollars/ unit
Production
volume &
value
Year
Main products
2014 2015
Capacity Volume Value Capacity Volume Value
Computer &
communication
products
21,214,255 15,504,233 37,024,022 22,592,497 16,477,087 43,553,161

75
(VI)Sales volume and value in the last two years In thousands of New Taiwan Dollars/ unit
Sales
volume
& value
Year
Main items
2014 2015
Domestic sales Export sales Domestic sales Export sales
Capacity Value Capacity Value Capacity Value Capacity Value
Computer &
communication
products
127,128 367,000 15,991,517 41,693,342 206,119 493,401 17,270,920 49,561,364
III.Employee information in the last two years up till the publication date of this annual
report
Year 2014 2015 Year-to-date
May 15, 2016
Em
plo
y
ee Co
unt
Direct Labor 0 0 0
Indirect Labor 1,216 1,160 1,178
Total 1,216 1,160 1,178
Average age 38.70 39.61 39.77 Average Years of service
7.54 8.18 8.22
Acad
emic
Qu
alification
(%)
Ph.D. 0.29 0.23 0.23
Master’s degree 33.61 33.82 33.73
College 64.71 64.43 64.61
Senior High School 1.32 1.45 1.35
Schools at the Senior Secondary Level and Below
0.07 0.08 0.08
Note: Due to the difficulties involved in surveying the entire group, the above table only presents employees of main subsidiaries, namely MiTAC International Corp. and MiTAC Computing Technology Corporation.
IV. Expenditure on Environmental Protection
The group did not suffer any loss or penalty due to pollution of environment in the last year up till the publication date of this annual report. Below is a description of relevant practices adopted by MiTAC:
MiTAC specializes in assembly. Its production process comprises entirely of assembly works, and hence does not produce any controlled substances that would constitute air pollution, water pollution, or toxicity pollution. In 1992, MiTAC received Certificate of Excellence during the 1st Environmental Evaluation for Top-500 Businesses organized by Environmental Protection Administration. In 1997, MiTAC attained ISO14001 certification and continues to devote itself to preventing pollution. In 1999, MiTAC received from the Council of Labor Affairs a 2-year certification for having passed the Safety and Health System Evaluation. MiTAC will continue to enforce its environmental protection and work safety policies, and strive to sustain an operation that is free of pollution and hazard.
(I) Background
MiTAC is a provider of PC/server products including workstations, enterprise servers, storage, and mobile communication devices. MiTAC has great respect for environmental protection requirements in Europe, and has adopted WEEE (Directives on Waste Electrical and Electronic Equipment) to redesign its products with environmental features such as recyclability, ease of disassembly, and use of renewable materials. Where power supply is involved, designs are made where appropriate to ensure optimal utilization of resources (e.g. ACPI combined with operating system for power saving; use of low-power CPU; modular design; IPMI software etc). With regards to the RoHS (Restriction of Hazardous

76
Substances) Directive, MiTAC exercises stringent control over hazardous substances such as Pb, Cd, Hg, Cr6+, PBBs and PBDEs, and makes SVHC declarations in accordance with EU REACH. Meanwhile, actions such as design review, supplier management and materials certification are adopted as part of the Company's green product management. A Green Product portal has been created on the intranet with SOPs and strategies outlined to facilitate regular review of the Company's compliance with EU regulations. For workers, an occupational health and safety system has been created to minimize the threat of accidents and health-related hazards, which saves cost over the long term. In addition, improvement of the work condition helps promote ethical conducts and raise productivity among employees.
(II)Environmental safety and health strategy
MiTAC has developed the following policies based on the environmental protection rationale mentioned above:
�Environmental safety and health policy
‧Compliance: Comply with the government's environmental safety and health laws,
and commit to standards that are more stringent than what the law requires.
‧Resources: Achieve optimal efficiency in resource utilization and promote energy
conservation.
‧Green production: Design products with "environmental" and maintenance-friendly
features, thereby minimize pollution during production, usage and maintenance.
‧Safe and health environment: Ensure employees' safety and health; prevent
occupational hazards, illnesses and potential harms, while at the same time involve employees in making improvements toward a safe and healthy work environment.
‧Ongoing improvement to environmental safety and health performance: Conduct
regular audits and assess suitable investments to continually improve the environmental safety and health management system.
�Hazardous substance free policy
1 Earth: respect the uniqueness of Earth's resources Devote attention to climate changes; participate in the reduction of greenhouse ‧
gases and lessen the environmental burden of the Company's activities. 2 Principles: comply with environmental laws and satisfy customers' requirements
Monitor the latest changes in environmental regulations such as RoHS, WEEE, ‧
REACH etc; ensure product compliance with environmental requirements. Adhere to the clean production principle; develop a green product platform and ‧
green supply chain management to satisfy customers' demands. 3 Commitments: maintain performance through management system; convey
environmental information and fulfill social responsibilities Implement a hazardous substance management system and initiate HSF ‧
monitoring procedures. Develop a communication system that addresses stakeholders publicly on ‧
information concerning environmental protection. Devote attention to preserving natural habitat while seeking business growth; ‧
assume social responsibilities as a corporate citizen. 4 Accomplishments: Provide green products that are characterized by low pollution,
energy-efficiency, lesser packaging, recyclability, and environmental friendliness Choose environmental‧ -friendly materials such as those that meet the requirements of RoHS, and plastic casings that are free of BFRs. Design products that meet international energy standards, such as Ene‧ rgy Star. Improve packaging towards lightweight, optimal size, and least variety of ‧
materials. Aim to achieve at least 75% product recycling rate (Reuse+Recycling+Recovery).‧
We believe "sustainability" to be the common challenge for all businesses. Since 2003, MiTAC had been collaborating with Ministry of Economic Affairs in an Industry

77
Technology Development Program (ITDP) to develop assembly technologies that are free of lead and halogen. The project was executed over 4 years, and successfully delivered its results in 2005. MiTAC's internal quality system comprises of two parts: (a) Product management: MiTAC was first certified for ISO9001 in 1993; since then, the Company has been validating this certification on a yearly basis. Towards the end of 2009, MiTAC developed a TL9000 management system based on ISO 9001 and successfully completed certification of its communication products. (b) Environmental management: MiTAC had prepared itself for the certification of ISO 14001:2004 since as early as 1997, and conformed with the regular review requirements of OHSAS 18001:2007 since as early as 1999. In 2007, MiTAC adopted IECQ QC080000 and began making adjustments to comply with IECQ terms. Extensive discussions were made with various departments and functions to revise existing procedures before undergoing a 3-stage validation process by SGS. On 12/7/2006, MiTAC was declared by SGS to have passed the validation, and IECQ has since been adopted as part of our internal procedures. We are dedicated to the protection of natural environment, and hope to preserve life over the course of our growth. We also recognize the importance of employees' safety and health to our operations, for which we commit every resource available at our disposal to maintain a work environment that is free of safety and health concerns. Meanwhile, we pace our business activities in harmony with nature, and adopt the highest standard to protect Earth's environment. By maintaining optimal balance between growth and nature, we strive to fulfill our duties as Earth's citizen and set good example for others to follow.
(III) Strategies for prohibited substances
In response to RoHS requirements, MiTAC group has been implementing Project G initiated by the Department of Industrial Technology, Ministry of Economic Affairs, to provide guidance for suppliers. All level-1 suppliers are being audited on-site to ensure compliance with RoHS, whereas level-2 suppliers are required to furnish information relating to RoHS at MiTAC's request. By controlling materials at the source, MiTAC has been able to minimize RoHS risks that are caused by change of design or supply in the upstream.
MiTAC group itself has accomplished halogen-free production, and is constantly conducting integrated tests on suppliers' parts for halogen contents, which enables it to develop full systems that are free of halogen. MiTAC group continues to improve its green production capacity according to customers' requirements, and has successfully marketed its products to Europe. As a result, MiTAC experiences no adverse impacts whatsoever from EU environmental directives.
Leveraging on the foundation of digital supply chain management, MiTAC has implemented a systematic process for suppliers to make RoHS & halogen-free reports. This new process solved much of the complexity that suppliers encountered when making reports on multiple products or production sites, and enhance improved the exchange of RoHS & halogen-related information.
Furthermore, to ensure that the delivered parts are compliant with RoHS & halogen-free requirements, the material inspection department has been fitted with ICP and GCMS equipment with supporting laboratory since 2010 so that it may conduct its own tests for hazardous substances such as Pb, Cd, Hg, Cr6+, PBBs, PBDEs, Br and Cl.
EU regulations on restricted substances are increasingly stringent (with the expiry of exclusion clauses); in response to this challenge, MiTAC's Environmental Protection Committee convenes meetings on a quarterly basis to devise suitable solutions and exchange knowledge on feasible technologies.
(IV)Response to EU environmental directives
Judging by the way s EU environmental regulations have progressed, it is apparent that the underlying requirements are becoming mandatory, while product declarations no longer suffice. Take ERP directives, for example, EU nations are starting to implement

78
policies relating to this directive. For MiTAC, DfE (Design for Environment)/Eco-design has already been adopted as one of the product design guidelines since 2008. Currently, MiTAC's DfE SOP requires R&D personnel to achieve the energy consumption requirements stated in ErP directives when designing products. To conform with EU REACH, MiTAC has made its declaration of conformity for SVHC (Substances of Very High Concern). Meanwhile, MiTAC's suppliers are being demanded to issue their own declarations regarding REACH SVHC for all components supplied, which is one of the compulsory requirements for their eligibility as suppliers. As of December 2015, ECHA had announced a total of 168 SVHC across 14 categories under REACH. This list of chemicals, along with new environmental standards for product design, have already been updated to MiTAC's green product platform, where suppliers can check for compliance and disclose chemical substances accordingly. Furthermore, following the 2011/65/EU(RoHS2.0) announced by European Commission on July 1, 2011, existing RoHS directives are expected to be superseded by the new version in the near future. In the meantime, MiTAC is updating its environmental protection standards to conform with the new RoHS directives, and requesting suppliers to provide new RoHS information accordingly.
(V) GHG (Greenhouse Gas) measures
In light of the global warming phenomenon and tightening GHG controls throughout the world, MiTAC initiated an ongoing GHG Inventory Program in August 2007 that covered all production sites in China. With the help of SGS Taiwan, the Company started adopting the GHG survey methodology and introducing training courses for internal surveyors, while at the same time developed GHG emission records and internal procedures in accordance with ISO14064-1 to provide useful references that would help reduce GHG emission in the future. Several energy-saving measures have since been taken to reduce GHG emission (particularly CO2), including: use of renewable energy (solar power), resource recycling, and energy conservation (lighting control, air-conditioning control during summer etc).
MiTAC has been gathering data and validating GHG emission based on The Greenhouse Gas Protocol; it conducts annual surveys of previous year's GHG emission, and the 2015 results are as follows:
� Direct GHG emission (Scope 1): 1,420 tons CO2e/year, which accounted for approximately 5% of total emission.
� Indirect GHG (Scope 2): 29,911 tons CO2e/year, which accounted for approximately 95% of total emission. Sources of indirect emission were mostly purchased electricity and steam.
MiTAC is utterly concerned about the world's changing climate. To protect Earth's resources and fulfill the Company's duties as a corporate citizen, MiTAC will continue reducing GHG emission and operating costs while at the same time achieve more efficient use of resources and energy and adopt sustainable energy sources that are friendly to the environment, and ultimately contribute to a low-carbon economy.
(VI)Environmental protection expenditure
1. Environmental protection expenditure refers to all expenses related to environmental protection activities. It represents how dedicated a company is to the environment, and serves as a key indicator to the quality of environmental management. However, the definition and scope of environmental expenditure still differ from country to country.
2. MiTAC has been gathering data on environmental expenditure since 2015, and disclosures will be made from this report onwards. Below are statistics regarding environmental protection expenditure:
‧ Environmental costs associated with the Company's operations (direct cost) amounted to NTD$1,325,444; this included expenses spent on: prevention of

79
air/effluent/soil/groundwater pollution, efficient use of resource, and disposal/treatment/recycling/reuse of commercial waste.
‧ Costs associated with administration of environmental activities (indirect cost) amounted to NTD$640,347; administration costs included personnel expenses spent on: environmental education, system management and validation, environmental monitoring, and environmental protection-related activities.
‧ Other environmental costs totaled approximately NTD$2,257,392, which included R&D expenses (for studying on the mitigation/control of environmental impacts), social activity expenses (e.g. sponsoring of environmental organizations, promotion of environmental information etc), taxes (e.g. energy levies) and other expenses (e.g. water treatment expenses).
‧ Losses (including damage compensations) and fines incurred due to pollution of environment in the year of report up till the publication date of this annual report: The Company has not incurred any losses (including damage compensations) or fines due to pollution of environment; hence the sum is zero.
V. Employer and employee relationships
Driven by a humane management approach, MiTAC is dedicated to creating a work environment that facilitates two-way communication between line managers, subordinates, and coworkers. The Company takes initiative in creating communication channels and gathering employees' thoughts as a means of ensuring harmonic labor-management relations and achieving win-win between the Company and its employees.
(I) Communication and inspiration
1. Communication
MiTAC organizes general assembly, management meetings and employee satisfaction surveys on a regular basis. An employee relations unit has been created within the Human Resource Department, where dedicated personnel are assigned to implement employee care measures and communication policies/channels. A digital mailbox named "speak-out" has been set up to receive employees' suggestions and opinions. Upon receiving messages, members of the employee relations unit would respond with discretion and, if necessary, assemble a special panel to handle, respond and make improvements to employees' opinions in an anonymous and timely manner.
Furthermore, the Company has robust policies and measures in place to convey and enforce the Act of Gender Equality in Employment and the Sexual Harassment Prevention Act. Employees are trained to respect and communicate with people of different gender, while guidelines and grievance channels are created all for the purpose of an equal-gender environment.
Being a multinational conglomerate, MiTAC has offices in many parts of the world. In order to facilitate communication and conferences between different parts of the Company or across regions, MiTAC has spent nearly NTD$10 million to install video-conferencing equipment in 9 office locations including Taiwan, China, USA, and UK. This advanced equipment delivers high image quality and stable audio stream, which enhances the efficiency of conferences and minimizes the need to have employees travel between office locations. Meanwhile, MiTAC employees are able to learn the Company's business performance and latest product information through internal channels such as intranet, monthly/quarterly publications, and the general assembly. Together, these measures ensure the completeness of internal communication within the Company.
2. Inspiration
MiTAC offers a broad variety of incentives to commend individual and team performance in all areas of expertise, and thereby encourage employees to seek continual growth and improvement that would contribute to the Company's

80
competitiveness. Some of the incentives offered to employees include: � Employee of the year award: Winners of this award are commended personally by
the President during year-end gathering; in addition, the Company prepares commendation letters and offers bonuses and extra leaves as a show of gratitude to employees and their families.
� Department/individual patent award: This award is intended to encourage employees in creating patents that are relevant to their jobs. Incentives are provided from proposal, application to approval stage of a patent application; at the end of each year, departments and individuals are assessed for the patents created, and those who exhibit outstanding performance are commended with department/individual awards.
� Long-time service award: As an appreciation for employees' long-time contribution and commitment to this company, senior employees with 5-year, 10-year, 15-year, 20-year and 25-year service history are commended personally by the Chairman and President with the long-term service award during year-end gatherings.
� Employee stock options and performance bonuses: These monetary benefits are provided to reward employees' contributions and inspire them to further achievements. By aligning employees' interests directly with those of shareholders, these benefits deliver a three-win between the Company, shareholders, and employees. The amount of stock options and bonuses granted to employees is determined by their responsibilities, contributions, and performance.
(II) Welfare and training
1. Welfare
MiTAC views employees as critical capital to the organization. All employees are entitled to labor insurance, national health insurance, group insurance, and travel insurance; together, they cover employees for death, health, and safety during overseas business trips, and thereby provide them with added comfort both in work and in life.
MiTAC has a an Employee Welfare Committee formed with employee representatives elected from various departments. The committee holds regular meetings to discuss and organize benefits and activities for employees; it offers a variety of social clubs and gives employees free access to gym, aerobic classes, and massage services (with masseurs and masseuses hired from outside the organization). Meanwhile, Linkou and Hsinchu Offices have been active in promoting recreational activities, and have designated indoor space exclusively for table tennis, where employees may develop bonds with each other.
MiTAC has a library center that opens all day to all employees. Much of the data is stored on discs and managed in the method recommended by "Interlibrary Cooperation Association" to help employees find the information they need.
To ensure employees' physical and mental health, MiTAC has been collaborating with professional consultants from outside the organization for the launch of "Employee Assistance Program." The program gathers experts of various professions including psychiatrists, lawyers, nutritionists, and financial consultants to assist employees and their family members on matters such as work stress, interpersonal relationships, family, marriage, intimacy, law, finance and healthcare, so that employees may achieve balance between work, life and health.
2. Employees' training and continuing education
We place great emphasis on the improvement of employees' skills, which is why a robust training system has been implemented to train employees systematically from orientation, on-job skills, to management skills. In addition, other learning resources such as online courses, work mentors, life counselors and ongoing education subsidies are being offered to provide employees with an environment that supports continual learning and growth. In 2015, for example, the Company organized 528 courses and received more than 7,000 enrollments, delivering 11,000 hours of training in total.
(III) Retirement policy

81
The group has established a robust retirement system in accordance with the Labor Standards Act and the Labor Pension Act. For employees who are subject to the retirement system under the Labor Standards Act (the old system), all contributions made to the system are being held in a dedicated pension reserve account and managed by a supervisory committee that comprises of representatives from the labor and the management. Furthermore, monthly contributions are made to the pension reserve account using actuarial estimates produced by an impartial third party. For employees who are subject to the retirement system under the Labor Pension Act (the new system), monthly contributions are made into employees' pension accounts in the amounts specified by law. So far, the two systems have been running properly as they are expected to.
(IV) Labor-management communication
MiTAC has always taken care of its employees and maintained sound labor-management relationship by sharing its gains and through communication. In the future, MiTAC shall commit to its humane management and aim to strengthen labor-management relationship further by creating more variety of communication channels.
(V) Work environment and employees’ safety
MiTAC has been certified for ISO 14001 - Environmental Protection System and OHSAS 18001 - Occupational Health and Safety Advisory Services System since November 6, 2003. These certifications were attained as reinforcements to the safety and health of employees at workplace, and to protect employees from occupational injury, death, and prevent protest that arise as a result. These certifications are regularly validated by third-party institutions and properly enforced throughout the organization.
(VI) Employee code of conduct
The Company has created a set of "Integrity Code of Conduct" to establish integrity as part of its corporate culture, and a set of "Employee Code of Conduct" to ensure the consistency of employees' behaviors. There are four main focuses in the Employee Code of Conduct: service principles, confidentiality and prohibition against competing business involvements, network usage and information security, and interaction with suppliers. These codes have been published on the Company's intranet where employees may access at any time, and serve as a regular reminder not to commit violations. Below are terms of the employee service principles: 1. Employees shall obey the instructions and assignments given by their managers.
Managers shall have the duty to guide and supervise their subordinates. 2. Employees are expected to work diligently and commit themselves to improving work
performance and quality, and achieve the expected productivity. 3. Employees are not allowed to leave their posts during work hours except for urgent
matters, which are subject to approval of the line manager. 4. Employees must not carry contrabands, flammable or explosive substances, or
hazardous objects unrelated to work into the workplace. To enforce discipline and fairness within the Company, a set of "Employee Reward
and Disciplinary Policy" has been created to serve as guidelines for rewarding excellence and penalizing violators. The Company has a set of "Anti-corruption Policy" policy in place to prevent illegal conducts and organized fraud. An investigation panel has been assembled to investigate suspicious conducts, and thereby ensure the soundness of the Company's operations.
(VII)Losses arising as a result of employment disputes in the most recent year up till the publication date of this annual report; disclose current and possible losses and any responsive actions taken; state reasons in cases where losses can not be reasonably estimated:
MiTAC did not suffer any losses due to employment dispute in the most recent year up till the publication date of this annual report. The Company currently maintains sound

82
labor-management relationship and expects very low probability of encountering any losses due to employment dispute in the future.
VI. Major Contracts
Contract nature
Participants Contract start/end date Main contents Restrictions
Master Supply Agreement Restatement
Customer E
From July 1, 2014 to June 30, 2017; automatically renewable on a yearly basis.
To outline terms concerning the production, delivery, payment and warranty of computer-related products.
None
Purchasing Agreement
Customer F From July 1, 2011 to June 30, 2016; renewable under the consensus of all participants.
To outline terms concerning the production, delivery, payment and warranty of computer-related products.
None
Design & Manufacturing Services Agreement
Customer G
From June 4, 2008 to June 3, 2011; automatically renewable on a yearly basis.
To outline terms concerning the production, delivery, payment and warranty of computer-related products.
None

83
Six.Financial Position I. Summary balance sheet and statement of comprehensive income for the last 5 years: The
Company was founded on September 12, 2013 through a share exchange, hence information prior to 2012 (inclusive) is unavailable.
(I)Condensed Balance Sheet – IFRSs (consolidated)
In thousands of New Taiwan Dollars
Year Item
Financial information for the last 3 years March 31, 2016 (reviewed by
CPA) December 31, 2013
December 31, 2014
December 31, 2015
Current assets 22,701,124 25,753,781 21,840,171 21,733,550
Property, Plant and Equipment
5,194,586 5,211,314 5,467,908 5,674,043
Intangible assets 593,892 316,694 119,005 122,521
Other assets 15,620,810 16,922,075 17,735,606 17,360,742
Total assets 44,110,412 48,203,864 45,162,690 44,890,856
Current liabilities
Before dividend
12,963,641 15,421,096 10,954,621 10,863,550
After dividend
13,415,230 15,954,342 Unappropriated Unappropriated
Non-Current liabilities 592,442 631,149 653,660 613,251
Total liabilities
Before dividend
13,556,083 16,052,245 11,608,281 11,476,801
After dividend
14,007,672 16,585,491 Unappropriated Unappropriated
Attributable to the shareholder’s equity of the parent company
30,554,029 32,151,619 33,554,409 33,414,055
Share capital 7,609,488 7,694,106 7,778,113 7,794,252
Additional paid-in capital
21,803,383 22,122,720 22,352,475 22,364,445
Retained earnings
Before dividend
563,114 829,877 2,017,858 2,181,186
After dividend
111,525 296,631 Unappropriated Unappropriated
Other equity 1,187,810 2,011,794 1,928,412 1,596,621
Treasury Stock (609,766) (506,878) (522,449) (522,449)
Non-Controlling Interest 300 0 0 0
Total equity
Before dividend
30,554,329 32,151,619 33,554,409 33,414,055
After dividend
30,102,740 31,618,373 Unappropriated Unappropriated

84
(II)Condensed Balance Sheet – IFRSs (individual)
In thousands of New Taiwan Dollars
Year Item
Financial information for the latest 3 years
December 31, 2013 December 31, 2014 December 31,
2015
Current assets 111,379 2,892,086 2,743,234
Property, Plant and Equipment 3,609 2,875 2,141
Intangible assets 0 0 0
Other assets 30,442,311 29,266,776 31,017,134
Total assets 30,557,299 32,161,737 33,762,509
Current liabilities
Before dividend
3,270 10,118 208,100
After dividend
454,859 543,364 Unappropriated
Non-Current liabilities 0 0 0
Total liabilities
Before dividend
3,270 10,118 208,100
After dividend
454,859 543,364 Unappropriated
Attributable to the shareholder’s equity of the parent company
30,554,029 32,151,619 33,554,409
Share capital 7,609,488 7,694,106 7,778,113
Additional paid-in capital 21,803,383 22,122,720 22,352,475
Retained earnings
Before dividend
563,114 829,877 2,017,858
After dividend
111,525 296,631 Unappropriated
Other equity 1,187,810 2,011,794 1,928,412
Treasury Stock (609,766) (506,878) (522,449)
Non-Controlling Interest 0 0 0
Total equity
Before dividend
30,554,029 32,151,619 33,554,409
After dividend
30,102,440 31,618,373 Unappropriated

85
(III)Condensed Comprehensive Income Statement – IFRSs (consolidated)
In thousands of New Taiwan Dollars Year
Item
Financial information for the latest 3 years
2016 first quarter (reviewed by CPA)
September 12 to December 31,
2013 2014 2015
Revenue 11,896,934 42,060,342 50,054,765 9,141,065
Gross profit 1,756,994 5,703,906 5,583,864 1,139,367
Operating income (loss) (129,831) (360,929) 296,470 (66,191) Non-Operating Income and Expenses
774,675 1,411,752 1,717,633 277,749
Pre-Tax Income (loss) 644,844 1,050,823 2,014,103 211,558 Continuing department Net Income - current (loss)
644,844 760,920 1,754,092 163,328
Loss from the discontinued department
0 0 0 0
Net Income – current (loss)
570,796 760,920 1,754,092 163,328
Other current comprehensive income (net, after-tax)
171,708 782,609 (116,247) (331,791)
Total current comprehensive income or loss
742,504 1,543,529 1,637,845 (168,463)
Net income attributable to: Parent company shareholders
571,287 761,086 1,754,092 163,328
Net income attributable to: Non-Controlling Interest
(491) (166) - -
Total comprehensive income Attributable to parent company shareholders
742,995 1,543,695 1,637,845 (168,463)
Total comprehensive income Attributable to non-controlling shareholders
(491) (166) - -
EPS 0.78 1.03 2.32 0.22

86
(IV)Condensed Comprehensive Income Statement – IFRSs (individual)
In thousands of New Taiwan Dollars Year
Item
Financial information for the latest three years
September 12 to December 31, 2013
2014 2015
Revenue 582,398 784,493 1,771,352
Gross profit 582,398 784,493 1,771,352
Operating income (loss) 570,793 757,113 1,743,184
Non-Operating Income and Expenses
494 9,495 19,581
Pre-Tax Income (loss) 571,287 766,608 1,762,765
Continuing department Net Income - current (loss)
571,287 761,086 1,754,092
Loss from the discontinued department
0 0 0
Net Income - current (loss) 571,287 761,086 1,754,092
Other current comprehensive income (net, after-tax)
171,708 782,609 (116,247)
Total current comprehensive income or loss
742,995 1,543,695 1,637,845
EPS 0.78 1.03 2.32
(V) Names and audit opinions of CPAs in the latest five years
Year Name of CPA firm Name of CPA Auditing opinions
2013 PricewaterhouseCoopers
Taiwan
Liu, Yin-Fei, Wen,
Fang-Yu
Modified unqualified
opinion
2014 PricewaterhouseCoopers
Taiwan
Liu, Yin-Fei, Wen,
Fang-Yu
Modified unqualified
opinion
2015 PricewaterhouseCoopers
Taiwan
Liu, Yin-Fei, Wen,
Fang-Yu
Modified unqualified
opinion

87
II. Financial analysis for the last 5 years: The Company was founded on September 12, 2013 through a share exchange, hence information prior to 2012 (inclusive) is unavailable.
(I)Financial analysis – IFRSs (consolidated)
Year Analysis items
Financial analysis for the last 3 years 2016 first quarter (reviewed by
CPA) 2013 2014 2015
Financial structure (%)
Debt to asset ratio 30.73 33.30 25.70 25.56
Ratio of long-term capital to property, plant and equipment
599.60 629.06 625.61 599.70
Debt servicing capability (%)
Current ratio 175.11 167.00 199.36 200.05
Quick ratio 122.96 118.03 139.50 141.00
Interest Coverage ratio 91.35 24.80 63.83 120.72
Operating efficiency
(Note)
A/R turnover rate (times) 6.68 5.93 7.32 6.53
Average collection days 54.64 61.55 49.86 55.89
Inventory turnover rate (times)
4.25 4.55 5.60 4.36
Payable turnover ratio (times)
5.43 5.11 6.74 5.89
Average days in sales 85.88 80.21 65.17 83.71
Property, plant, and equipment turnover rate (times)
7.55 8.08 9.37 6.56
Total assets turnover (time)
0.90 0.91 1.07 0.81
Profitability
Return on assets (%) 1.33 1.71 3.81 0.36
Return on equity (%) 1.89 2.42 5.33 0.48
Pre-tax income to paid-up capital (%)
8.47 13.65 25.89 2.71
Net profit margin (%) 4.79 1.80 3.50 1.78
Earnings per share (NT$) 0.78 1.03 2.32 0.22
Cash flow
Cash flow ratio (%) 6.70 - 30.75 -
Cash flow adequacy ratio (%)
566.41 48.93 136.43 122.96
Cash reinvestment ratio (%)
2.32 - 7.13 -
Leverage ratios
Operating leverage ratios - - 22.40 -
Financial leverage ratios - - 1.12 -
Root causes of changes in each financial ratio in the last two years (the changes under 20% are exempt from analyses) 1. Debt-to-asset ratio decreased mainly due to repayment of short-term borrowings in 2015. 2. Interest coverage ratio and profitability ratios increased mainly due to revenue growth and profit
growth in 2015.
3. Accounts receivable turnover increased mainly due to a 19% revenue growth in 2015 over 2014, combined with proper collection efforts.
4. Inventory turnover and accounts payable turnover increased mainly due to a 19% revenue growth in 2015 over 2014, which resulted in fast sale of inventory and lower closing balance of inventory and accounts payable compared to the previous year.
5. Cash flow adequacy ratio increased mainly because of profit growth in 2015, which generated higher cash inflow from operating activities.
Note: The operating capacity has been converted to capacity for the full year for comparison purposes.

88
(II)Financial analysis – IFRSs (individual)
Year
Analysis
Financial analysis for the last 3 years
2013 2014 2015
Financial structure (%)
Debt to asset ratio 0.01 0.03 0.61
Ratio of long-term capital to property, plant and equipment
846,606.51 1,118,317.18 1,567,230.68
Debt servicing capability (%)
Current ratio 3,406.08 28,583.57 1,318.22
Quick ratio 3,367.88 28,573.05 1,317.65
Interest Coverage ratio 190,430.00 NA NA
Operating efficiency (Note)
A/R turnover rate (times) NA NA NA
Average collection days NA NA NA
Inventory turnover rate (times)
NA NA NA
Payable turnover ratio (times) NA NA NA
Average days in sales NA NA NA
Property, plant, and equipment turnover rate (times)
NA NA NA
Total assets turnover (time) NA NA NA
Profitability
Return on assets (%) 1.89 2.42 5.32
Return on equity (%) 1.89 2.42 5.33
Pre-tax income to paid-up capital (%)
7.50 9.96 22.66
Net profit margin (%) 98.09 97.01 99.02
EPS ($) 0.78 1.03 2.32
Cash flow
Cash flow ratio (%) - 29,704.76 26.44
Cash flow adequacy ratio (%) - 660.17 309.61
Cash reinvestment ratio (%) - 7.94 (1.42)
Leverage ratios
Operating leverage ratios 1.00 1.00 1.00
Financial leverage ratios 1.00 1.00 1.00
Root causes of changes in each financial ratio in the last two years (the changes under 20% are exempt from analyses) 1.Profitability ratios and ratio of long-term capital to property, plant and equipment increased mainly due to
profit growth in 2015. 2.Debt to asset ratio increased while solvency ratios decreased; this was mainly due to the increase of other
payables. 3.Cash-flow related ratios decreased mainly because of lesser dividend income received in 2015, which
resulted in a reduction of cash inflow from operating activities.
Note: The Company is an investment holding company, hence not applicable.

89
1. Financial structure
(1)Debt to asset ratio = total liabilities / total assets
(2) Long-term capital to property, plants and equipment = (total equity + non-current liabilities) / net property, plant and equipment.
2. Debt servicing capability
(1)Current ratio = current assets / current liabilities
(2)Quick ratio = (current assets - inventory-prepayments) / current liabilities
(3) Interest coverage ratio = net profit before interest and tax / interest expenses for the current period
3. Operating efficiency
(1) Receivables turnover (including accounts receivable and notes receivable from business activities) = net sales / average receivables balance (including accounts receivable and notes receivable from business activities).
(2) Average days of collection = 365 / Receivables turnover
(3) Inventory turnover = Cost of goods sold / Average inventory amount
(4) Payables turnover (including accounts payable and notes payable for business activities) = cost of sales / average payables balance (including accounts payable and notes payable for business activities).
(5) Average days in sales = 365 / Inventory turnover
(6) Property, plant and equipment turnover = net sales / average net property, plant and equipment balance.
(7) Total assets turnover = Net sales / Average total assets
4. Profitability
(1) Return on assets = [Net Income or Loss + Interest expense × (1 - tax rate)] / Average total assets
(2)Return on equity = after tax net profit/ average total equity
(3)Net profit margin = after tax net profit/net sales
(4) Earnings per share = (attributable to the shareholder’s profit and loss of the parent company) - Preferred dividends) / Weighted average number of shares issued
5. Cash flow
(1)Cash flow ratio = Cash flow from operating activities / current liabilities
(2) Cash flow adequacy ratio = net cash flow from operating activities in the latest five years / (capital expenditure inventory + increase + cash dividends) in the latest five years.
(3) Cash flow reinvestment ratio = (Cash flow from operating activities-Cash dividends) / (Property, Plant and Equipment + long term investments + Other non-current assets + working capital)
6. Degree of leverage
(1) Degree of operating leverage = (net operating revenues - variable operating costs and expenses) / operating income.
(2)Degree of financial leverage = operating income / (operating income - interest expense).
III. Latest financial statements: See pages 107 to 199.
IV. The company and its affiliated companies should state any financial difficulties occurred
during the most recent year up to the date of printing of this annual report and disclose
the associated impact on the finances of the company: None.

90
Seven. Review and Analysis of Financial Status and
Performance and Associated Risks
I. Review and Analysis of Financial Status
In thousands of New Taiwan Dollars
Year Item
December 31, 2014 December 31,
2015
Variation
Amount %
Current assets 25,753,781 21,840,171 (3,913,610) -15%
Property, Plant and Equipment 5,211,314 5,467,908 256,594 5%
Intangible assets 316,694 119,005 (197,689) -62%
Other assets 16,922,075 17,735,606 813,531 5%
Total assets 48,203,864 45,162,690 (3,041,174) -6%
Current liabilities 15,421,096 10,954,621 (4,466,475) -29%
Non-Current liabilities 631,149 653,660 22,511 4%
Total liabilities 16,052,245 11,608,281 (4,443,964) -28%
Share capital 7,694,106 7,778,113 84,007 1%
Additional paid-in capital 22,122,720 22,352,475 229,755 1%
Retained earnings 829,877 2,017,858 1,187,981 143%
Other equity 2,011,794 1,928,412 (83,382) -4%
Treasury Stock (506,878) (522,449) (15,571) 3%
Attributable to the shareholder’s equity of the parent company
32,151,619 33,554,409 1,402,790 4%
Non-Controlling Interest 0 0 0 0%
Total equity 32,151,619 33,554,409 1,402,790 4%
Material changes in assets, liabilities, and shareholders' equity in the last two years (variations above 20% and amounting to at least NT$10 million): 1. Intangible assets: Mainly due to amortizations in the current period. 2. Current and total liabilities: Mainly due to repayment of short-term borrowings and decrease in
accounts payable. 3. Retained earnings: Mainly due to increase in current net inocme.
II.Review and Analysis of Financial Performance
In thousands of New Taiwan Dollars
Year Item
2014 2015 Variation
Amount %
Revenue 42,060,342 50,054,765 7,994,423 19%
Gross profit 5,703,906 5,583,864 (120,042) -2%
Operating income (loss) (360,929) 296,470 657,399 -182%
Non-Operating Income and Expenses
1,411,752 1,717,633 305,881 22%
Pre-Tax Income (loss) 1,050,823 2,014,103 963,280 92%
Income tax expense (289,903) (260,011) 29,892 -10%
Net Income - current (loss) 760,920 1,754,092 993,172 131%
Other current comprehensive income
782,609 (116,247) (898,856) -115%
Total current comprehensive income or loss
1,543,529 1,637,845 94,316 6%
(I) Significant changes in operating revenues, operating income and pre-tax income in the last two years and the underlying causes (unnecessary for variations less than 20%):

91
1.Operating income, pre-tax income and current net income: The increase in profits was mainly contributed by revenue growth and effective cost control.
2.Non-operating income and expense: This was due to increased losses recognized from equity-accounted associated companies and joint ventures, plus impairment of intangible assets recognized in 2014.
3.Other current comprehensive income: This was due to lesser translation differences arising from the conversion of financial statements of foreign operations.
(II) Expected sales volume and basis of estimate: The Company does not produce financial forecasts, hence not applicable.
(III)Possible financial impacts and responsive plans: Not applicable.
III. Review and Analysis of Cash Flow
In thousands of New Taiwan Dollars
Opening cash balance
Net cash flow from operating activities
for the year
Annual cash outflow
Cash surplus (deficit)
Financing of cash deficits
Investment plans
Finance plans
8,494,325 3,368,873 (4,616,322) 7,246,876 - -
(I) Analysis of cash flow for the year 1. Operating activities: The Company produced net cash outflow from operating
activities due to an increase in profitability. 2. Full-year cash outflow: The outflow was mainly caused by repayment of short-term
borrowings, plant construction, purchase of equipment, and payment of cash dividends.
(II) Improvement plans for cash deficit: Not applicable. (III)Liquidity analysis for the next year
In thousands of New Taiwan Dollars
Opening cash balance
Net cash flow from operating activities
for the year
Annual cash outflow
Cash surplus (deficit)
Financing of cash deficits
Investment plans
Finance plans
8,786,787 399,967 (4,046,785) 5,139,970 - -
1. Analysis of cash flow for the year: (1) Operating: The Company expects to produce net cash income from operating
activities in 2016. (2) Full-year cash outflow: The outflow is expected to be spent on plant construction,
purchase of equipment and payment of cash dividends. 2. Improvement plans for cash deficit: Not applicable.
IV. Impact of major capital expenditure in the year on the financial operations of the company:
None.
V. The main causes of profit or loss from reinvestment policies in the most recent year,
improvement plan and investment plans in the next year:
(I) Investment policies in the most recent year: MiTAC's investments are planned in accordance with future business requirements and long-term strategies, and are primarily intended to increase revenues and profits.
(II) Causes of profits or losses incurred by invested businesses and any improvement plans taken: Profits were mostly attributed to growing sales and cost control, whereas losses were mainly due to underwhelming sales or extra expenses incurred during the new product development stage. For invested businesses that do not deliver the expected results or have become idle, MiTAC will undertake proper measures by taking into consideration factors from various perspectives to improve performance and contain losses.
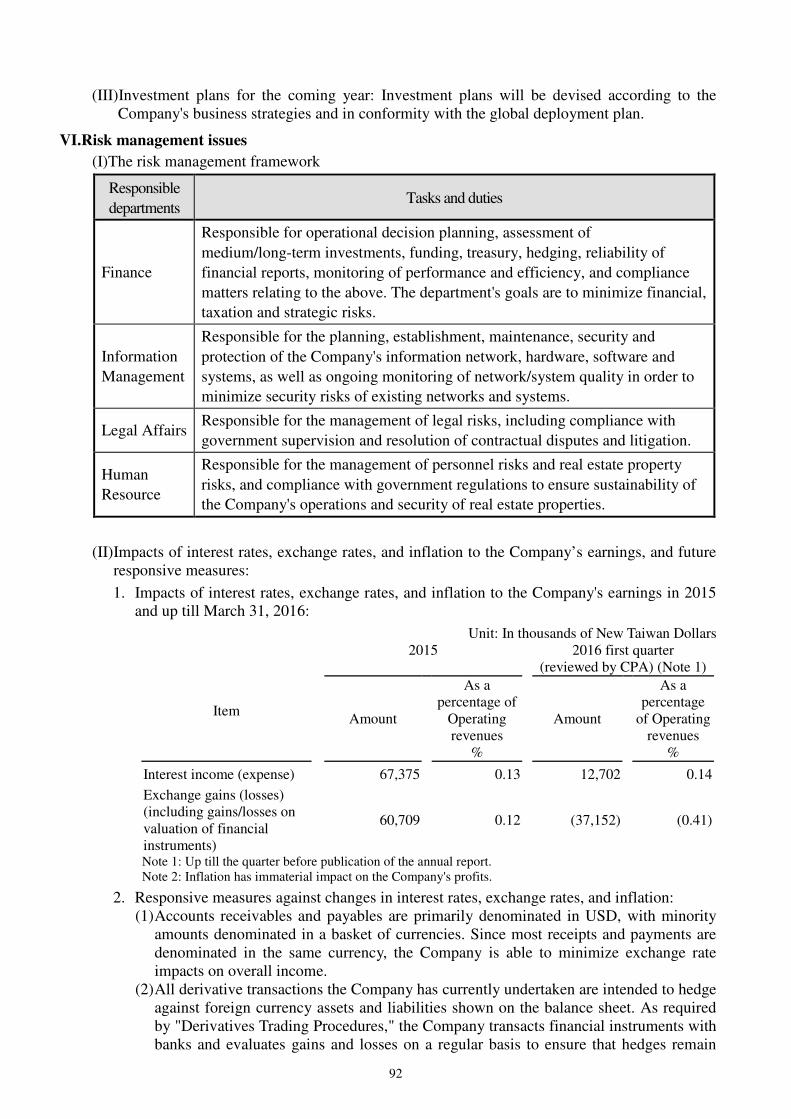
92
(III)Investment plans for the coming year: Investment plans will be devised according to the Company's business strategies and in conformity with the global deployment plan.
VI.Risk management issues
(I)The risk management framework
Responsible
departments Tasks and duties
Finance
Responsible for operational decision planning, assessment of
medium/long-term investments, funding, treasury, hedging, reliability of
financial reports, monitoring of performance and efficiency, and compliance
matters relating to the above. The department's goals are to minimize financial,
taxation and strategic risks.
Information
Management
Responsible for the planning, establishment, maintenance, security and
protection of the Company's information network, hardware, software and
systems, as well as ongoing monitoring of network/system quality in order to
minimize security risks of existing networks and systems.
Legal Affairs Responsible for the management of legal risks, including compliance with
government supervision and resolution of contractual disputes and litigation.
Human
Resource
Responsible for the management of personnel risks and real estate property
risks, and compliance with government regulations to ensure sustainability of
the Company's operations and security of real estate properties.
(II) Impacts of interest rates, exchange rates, and inflation to the Company’s earnings, and future responsive measures:
1. Impacts of interest rates, exchange rates, and inflation to the Company's earnings in 2015 and up till March 31, 2016:
Unit: In thousands of New Taiwan Dollars 2015
2016 first quarter (reviewed by CPA) (Note 1)
Amount
As a percentage of
Operating revenues
%
Amount
As a percentage
of Operating revenues
%
Item
Interest income (expense) 67,375 0.13 12,702 0.14
Exchange gains (losses) (including gains/losses on valuation of financial instruments)
60,709 0.12 (37,152) (0.41)
Note 1: Up till the quarter before publication of the annual report. Note 2: Inflation has immaterial impact on the Company's profits.
2. Responsive measures against changes in interest rates, exchange rates, and inflation: (1) Accounts receivables and payables are primarily denominated in USD, with minority
amounts denominated in a basket of currencies. Since most receipts and payments are denominated in the same currency, the Company is able to minimize exchange rate impacts on overall income.
(2) All derivative transactions the Company has currently undertaken are intended to hedge against foreign currency assets and liabilities shown on the balance sheet. As required by "Derivatives Trading Procedures," the Company transacts financial instruments with banks and evaluates gains and losses on a regular basis to ensure that hedges remain

93
effective in minimizing interest rate and exchange rate impacts on income. (3) The Company maintains close interactions with banks and conducts regular
assessments to secure the best borrowing rates, and therefore reduces impact of interest rate variations on income.
(4) The Company gathers regular information on exchange rate, interest rate, and the financial market. Meetings are held where appropriate to discuss the best course of action. In the occurrence of extreme market events, the executive management will be notified immediately for proper actions.
(5) In light of recent disasters caused by extreme weather conditions and rapid changes of interest rates and exchange rates around the world, it is increasingly important for businesses to source supplies that are stable and reasonably priced. To address this challenge, MiTAC has been monitoring changes in the market and making procurement plans in advance so that suppliers have ample time to find alternative materials or make advance purchases at their discretion. Since most of the supply chain are commonly affected by prolonged delivery, it has become apparent that the Company must devote greater attention to create demands, explore ways to reduce risks, manage uncertainties involving prolonged delivery and shortage of labor, relax inventory control and adjust cost control of non-production materials. Meanwhile, distributors shall carry additional inventory to avoid impact on earnings due to disruption of supply or volatile costs.
(III) Policies on high-risk and highly leveraged investments, loans to third parties, endorsements / guarantees, and trading of derivatives; describe the main causes of profit or loss incurred and future responsive measures:
1. The group does not engage in any high-risk or highly leveraged investments.
2. Loans to third parties are conducted in accordance with "Third Party Lending Procedures." Outstanding loans to third parties (by the Company and subsidiaries) amounted to NT$9,476,730,000 at the end of 2015 and NT$9,143,072,000 as at April 30, 2016.
3. Guarantees/endorsements to third parties are conducted in accordance with "Third Party Guarantee/Endorsement Procedures." Outstanding guarantees/endorsements to third parties (by the Company and subsidiaries) amounted to NT$4,308,950,000 at the end of 2015 and NT$4,078,464,000 as at April 30, 2016.
4. Trading of derivatives is conducted in accordance with "Derivatives Trading Procedures."
(IV)Future research and development plans and projected expenses:
1. Research and development expenses for the current year (2016) are estimated at NT$2.42 billion.
2. Future R&D plans
(1) Cloud Computing products series
‧ Development of cloud computing servers
‧ Optimized virtual server
‧ Development of high-performance GPU servers.
‧ Communication server
‧ Network switch
‧ Total system solutions
‧ Development of storage devices and related technologies
‧ System protocols and integration of Thin Client computers & servers
‧ R&D of All-In-One LCD computer technologies
‧ POS system (computer point of sale management system): including the
development of integrated technologies for the RPOS (Retail POS) and the MPOS
(Mobile POS)

94
‧ R&D of embedded industrial use main board for terminal application
(2) Mobile communication products
‧ Cloud computing applications and technologies
‧ Integrated data capture, voice, and wireless broadband communication
‧ Global positioning system (GPS), electronic navigation technologies and mobile
positioning services
‧ Compact portable electronic devices; technological development for green energy
products.
‧ Development of mobile healthcare hardware, software, products and services
(V) Financial impacts and responsive measures in the event of changes to local and foreign regulations: None.
(VI) Financial impacts and responsive measures in the event of technological or industrial changes:
1. Following a recent amendment to EU REACH (an environmental protection regulation), manufacturers are now being required to keep concerned substances below 1000ppm per component, instead of 1000ppm per system as it used to be. This change will bring challenges and costs to supply chain management, and the Company has been actively looking for solutions by engaging third-party consultants and platforms to help suppliers conform with EU REACH requirements on Substances of Very High Concern in the most cost-efficient manner.
2. Wage rise in China combined with U.S. manufacturers' return to home country will affect the Company's existing global deployment and investment strategies. The best response to this change would be to introduce automated production lines. In addition, MiTAC will try to incorporate the concept of manufacturing 4.0 and enhance supply chain management with an intelligent system. By integrating automated machinery with the production system, the Company would be able to produce broad variety of products in small quantities at a faster rate.
3. Cloud services, as described in previous chapters, would require many more medium and large-sized data centers. Customers will tend to avoid big brands and instead approach manufacturers directly with the required specifications. In other words, we see ODM Direct as the business model of the future, one that requires intensive investments in total system solutions. One of the Company's most important problems in the future would be to integrate existing technologies for faster product launch.
(VII) Crisis management, impacts, and responsive measures in the event of a change in corporate image: None.
(VIII)Expected benefits, risks and responsive measures of planned mergers or acquisitions: None.
(IX) Expected benefits, risks and responsive measures associated with plant expansions: None.
(X) Risks and responsive measures associated with concentrated sales or purchases:
Purchases: MiTAC adopts a policy to diversify purchases from at least two suppliers for every type of raw material. The Company maintains long-term relationship with its suppliers to ensure the continuity of materials supplied.
Sales: MiTAC's strong R&D and manufacturing capability has enabled it to maintain long-term relationship with existing customers while at the same time explore new customers to diversify revenue sources. There should not be any concentration in sales that would impact the Company's growth.
(XI) Impacts, risks and responsive measures following a major transfer of shareholding by directors, supervisors, or shareholders with more than 10% ownership interest:
The Company is constantly aware of the identity of its controlling shareholders, and the name of the ultimate controller of its major shareholders. Shareholdings of directors,

95
supervisors and major shareholders (more than 10% ownership interest) are reported regularly in accordance with the Securities and Exchange Act.
(XII) Impacts, risks and responsive measures associated with a change of management: None.
(XIII) Litigation and non-contentious cases:
In the last year up till the publication date of this annual report, there had been no litigations, non-contentious cases, or administrative litigations involving the Company, the Company's director, supervisor, President, person-in-charge, any shareholder with more than 10% ownership interest, or any subsidiary of the Company that would have significant impact on shareholders' equity or securities prices, as described in Subparagraph 12, Paragraph 6, Article 20 of "Regulations Governing Information to be Published in Annual Reports of Public Companies."
(XIV) Other significant risks and responsive measures:
Suppliers' profit-oriented strategies: The IT industry supply chain continues to consolidate and form new strategic alliances for competitive advantage. The uprise of Chinese suppliers coupled with rising wages in China, volatile commodity prices, and shift of focus towards hand-held devices and cloud applications all pose additional pressure to material costs and stability of supply. In response to this threat, MiTAC will discuss with its suppliers regularly on the choice and supply of materials and changes in the market, and adjust its procurement strategies accordingly.
VII.Other significant events: None.

96
Eight. Important Notice I. Information on subsidiaries/affiliates
(I) Consolidated report on the operation of affiliates
1. Organizational Chart of Affiliates
100%
100% 100% 100% 100% 100%
100% 100% 100%
100% 100% 100% 100% 100%
100% 100% 100% 100% 100% 100% 100%
100% 100%
昆達電腦科技昆達電腦科技昆達電腦科技昆達電腦科技(昆山)有限公司(昆山)有限公司(昆山)有限公司(昆山)有限公司上海神一信息上海神一信息上海神一信息上海神一信息科技有限公司科技有限公司科技有限公司科技有限公司 璽達信息科技璽達信息科技璽達信息科技璽達信息科技((((昆山昆山昆山昆山))))有限有限有限有限公司公司公司公司
100%
Tyan
Computer
Corporation
(USA)
MiTAC
Information
Systems Corp.
100%
神達投資有神達投資有神達投資有神達投資有限公司限公司限公司限公司旭達電腦(昆旭達電腦(昆旭達電腦(昆旭達電腦(昆山)有限公司山)有限公司山)有限公司山)有限公司100%
神達投資控股股份有限公司神達投資控股股份有限公司神達投資控股股份有限公司神達投資控股股份有限公司神達電腦股份有限公司神達電腦股份有限公司神達電腦股份有限公司神達電腦股份有限公司 神雲科技股份有限公司神雲科技股份有限公司神雲科技股份有限公司神雲科技股份有限公司
佛山市順德佛山市順德佛山市順德佛山市順德區烽達電子區烽達電子區烽達電子區烽達電子有限公司有限公司有限公司有限公司
資豐投資資豐投資資豐投資資豐投資(股)公司(股)公司(股)公司(股)公司
佛山市順德佛山市順德佛山市順德佛山市順德區順達電腦區順達電腦區順達電腦區順達電腦廠有限公司廠有限公司廠有限公司廠有限公司MiTAC Star
Service Ltd. 環達電腦(上環達電腦(上環達電腦(上環達電腦(上海)有限公司海)有限公司海)有限公司海)有限公司 昆山研達電昆山研達電昆山研達電昆山研達電腦科技有限腦科技有限腦科技有限腦科技有限公司公司公司公司100%
MiTAC Technology UK Ltd.
MiTAC
Logistics
Corporation
宇達電腦(上宇達電腦(上宇達電腦(上宇達電腦(上海)有限公司海)有限公司海)有限公司海)有限公司 Software
Insights Ltd.
鼎磊科技鼎磊科技鼎磊科技鼎磊科技(股)公司(股)公司(股)公司(股)公司 宇達電通宇達電通宇達電通宇達電通(股)公司(股)公司(股)公司(股)公司 達炙科技達炙科技達炙科技達炙科技(股)公司(股)公司(股)公司(股)公司Huge Extent
Ltd. 昆山丰達物昆山丰達物昆山丰達物昆山丰達物流有限公司流有限公司流有限公司流有限公司 昆山聯達信昆山聯達信昆山聯達信昆山聯達信息技術有限息技術有限息技術有限息技術有限公司公司公司公司Start Well Technology Ltd.
Silver Star Developments
Ltd.
Pacific China Corp. See the next page
MiTAC Holdings Corporation
MiTAC International Corp. MiTAC Computing Technology Corp.
DLC Technology
Corp.
Tsu Fung Investment
Corp.
Mio Technology
Corp.
MiWELL Technology
Corp.
MiTAC Service
(ShangHai)
Co., Ltd.
MiTAC Research
(ShangHai) Co., Ltd.
MiTAC Innovation (Kun Shan)
Co., Ltd.
Fengda Electronic Co., Ltd. in Shunde District, Foshan City
Mitac Computer
(Shunde) Co., Ltd.
MiTAC Information Technology
Ltd.
MiTAC Computer
(Kunshan) Co., Ltd.
MiTAC Technology (KunShan) Co., Ltd.
MiTAC Logistic
Service (KunShan) Ltd.
MiTAC Telematics Tahnology
Corp.
MITAC
Investment Holding Ltd.
MiTAC
Information
Systems (KunShan)
Co., Ltd.

97
100%
100%
100% 100% 100% 100% 100% 100% 100%
100% 100% 100%
100% 100%
蘇州宇達電通蘇州宇達電通蘇州宇達電通蘇州宇達電通有限公司有限公司有限公司有限公司MiTAC
Pacific
(H.K.) Ltd.
MiTAC
Japan
Corp.
Mio
International
Ltd.
Silver Star Developments Ltd.
神達電腦股份有限公司神達電腦股份有限公司神達電腦股份有限公司神達電腦股份有限公司
神達投資控股股份有限公司神達投資控股股份有限公司神達投資控股股份有限公司神達投資控股股份有限公司
System
Glory
International
Ltd.
MiTAC
Benelux
N.V.
MiTAC
Australia Pty
Ltd.
Top Sheen
Enterprises
Ltd.
Mitac Digital
Corporation
MiTAC
Europe Ltd.
Best Profit Ltd.
Mio
Technology
GmbH
MiTAC Holdings Corporation
MiTAC International Corp.
SuZhou
MIO Technology Corp.

98
2. Profile of affiliated companies: Currency: NTD 1,000
Enterprise name Date of
incorporation Address Paid-in capital (Note 1) Principal business or running items
MiTAC International Corp. Dec. 08, 1982No.1, Yen-Fa 2nd Rd., Hsinchu Science Park, Hsinchu County, Taiwan, R.O.C.
NT$14,292,183 The development, design, manufacturing, and sales of computers and peripherals, communications and related products.
MiTAC Computing Technology Corporation
Jul. 25, 2014 3F, No.1, Yen-Fa 2nd Rd., Hsinchu Science Park, Hsinchu County, Taiwan, R.O.C.
NT$2,327,571 The development, design, manufacturing, and sales of computers and peripherals, communications and related products.
Tsu Fung Investment Corp. Feb. 16, 1998 10/F, No. 77. MinSheng East Road Section III, Taipei NT$1,285,847 General Investment
Silver Star Developments Ltd. Jun. 05, 1990 P.O. Box 71, Craigmuir Chambers, Road Town, Tortola, British Virgin Islands
US$215,495 General Investment
MiTAC Japan Corp. Apr. 30, 1983Yasuda Shibaura-building No2 3F, Kaigan 3-2-12, Minato-ku, Tokyo, Japan 108-0022
YEN$ 50,000 Sales of communication, computer peripherals, software and hardware and post-delivery maintenance and repair service
MiTAC Benelux N.V. Sep. 13, 1993 Z5 Mollem 318 - 1730 Asse (Mollem), Belgium EUR$ 1,618 Sales of communication products and related post-delivery service
MiTAC Pacific (H.K.) Ltd. Jun. 13, 1991 Level 12 28 Hennessy Road, Wanchai Hong Kong US$10 Import and export service
Pacific China Corp. Dec. 27, 1996P.O. Box 957, Offshore Incorporations Centre, Road Town, Tortola, British Virgin Islands
US$120,924 General Investment
MiTAC Computer (Shunde) Ltd.
Jan. 18, 1993 No .1, Shunda Road, Lunjiao Street, ShunDe District, Foshan City, Guangdong
CNY$ 616,837 Production of mainframe, motherboard, interface cards, displays, power supply, keyboards and related metal/plastic parts, and motherboard repair services.
System Glory International Ltd.
Oct. 25, 1995 P.O. Box 957, Offshore Incorporations Centre, Road Town, Tortola, British Virgin Islands
US$0 General Investment
Mio Technology Corp. Jan. 17, 2000 10/F, No. 209, NanGang Road, Section 1, Nan Gang, Taipei
NT$20,000 Sales of communication products and related post-delivery service
Start Well Technology Ltd. Apr. 20, 2000P.O. Box 957, Offshore Incorporations Centre, Road Town, Tortola, British Virgin Islands
US$29,900 General Investment
MiTAC Computer (Kunshan) Co., Ltd.
Nov. 01, 2000No.269, No.2 Avenue, Export Processing Zone Kunshan, Jiangsu
CNY$ 304,321 Production of products relating to communication, computers, peripherals, software and hardware; sale of proprietary products.
Software Insights Ltd. Jul. 18, 2000 P.O. Box 957, Offshore Incorporations Centre, Road Town, Tortola, British Virgin Islands
US$5,200 General Investment
MiTAC Star Service Ltd. Jan. 12, 2001 P.O. Box 957, Offshore Incorporations Centre, Road Town, Tortola, British Virgin Islands
US$74,500 General Investment
MiTAC Service (ShangHai) Co., Ltd.
Oct. 11, 2001 2nd Level, Futebei Lu, No. 129, Waigaoqiao Bonded Special Zone, Shanghai.
CNY$ 8,277 Technical service, technical support, and software design/development relating to computers
MiTAC Technology (KunShan) Co., Ltd.
Jan. 28,2002 No.269, No.2 Avenue, Export Processing Zone Kunshan, Jiangsu
CNY$ 8,277 Testing, maintenance, and technical consultation and after-sale service of computer parts and related products.
Mio International Ltd. Feb. 06, 2004 P.O. Box 957, Offshore Incorporations Centre, Road Town, Tortola, British Virgin Islands
US$1,275 Sales of communication related products
MiTAC Research (ShangHai) Ltd.
Nov. 23, 2004No.213, Jiang Chang San Road, Zha Bei District, Shanghai CNY$ 43,040 Research, development and technical consultation services
Huge Extent Ltd. Jun. 22, 2006 P.O. Box 957, Offshore Incorporations Centre, Road Town, Tortola, British Virgin Islands
US$8,000 General Investment
MiTAC Australia Pty Ltd. Mar. 06,
2007 Suite 2, 408 Victoria Rd, Gladesville NSW 2111 Australia AUD$ 127 Sales of communication products and related post-delivery service

99
Enterprise name Date of
incorporation Address Paid-in capital (Note 1) Principal business or running items
MiTAC Europe Ltd. May 10,
2001 Spectrum House, Beehive Ring Road, London Gatwick Airport, RH6 0LG, UNITED KINGDOM
EUR$ 6,665 Sales of communication products and related post-delivery service
DLC Technology Corporation(Note 2)
Jun. 20, 2007 1F, No. 40, Wenhua 2nd Road, Guishan District, Taoyuan City
NT$0 Research, development and technical consultation services
Tyan Computer Corporation - USA
Jul. 17, 1989 3288 Laurelview Ct., Fremont, CA 94538 U.S.A. US$3,950 Sales of computer peripherals, software and hardware and related products
Mio Technology GmbH Dec. 03,
1998 Einsteinstr. 14 85716 Unterschleißheim Germany EUR$ 26 Sales of communication products and related post-delivery service
Top Sheen Enterprises Ltd. Jan. 23, 2003 P.O. Box 957, Offshore Incorporations Centre, Road Town, Tortola, British Virgin Islands
US$20,440 General Investment
Best Profit Ltd. Jan. 03, 2007 Scotia Centre, 4th Floor., P.O. Box 2804, George Town, Grand Cayman KY1-1112, Cayman Islands
US$37,131 General Investment
MiTAC Logistics Corporation Apr. 17, 2007 3288 Laurelview Ct., Fremont, CA 94538 U.S.A. US$2,850 Sales of computer peripherals, software and hardware and related products
Mio Technology (Suzhou) Ltd.
Dec. 04, 2003
No. 300, Di Yi Da Dao, Kunshan Development Zone, Jiangsu Province.
CNY$ 1,960 Sales of communication products and related post-delivery service
MiTAC Logistic Service (KunShan) Ltd.
Mar. 17, 2008
No. 269, Di-er Da Dao, Kunshan Export Processing Zone CNY$ 6,821 Shipping agent, import/export, and warehouse service.
MiTAC Digital Corporation Nov. 21,
2008 471 El Camino Real, Santa Clara, CA 95050 USA US$45,000 Sales of communication products and related post-delivery service
Mitac Information Technology Ltd.
Nov. 19, 2009
No. 300, Di Yi Da Dao, Kunshan Development Zone, Jiangsu Province.
CNY$ 2,048
After-sale maintenance, testing, consultation and technical services relating to computers, communication devices, and consumer electronics; operation of a customer service center; professional data processing, analysis and integrated services, and ERP services
MiTAC Information Systems Corp.
Jul. 08, 2010 39889 Eureka Drive Newark, CA 94560 US$25,000 Assembly, sales of computer peripherals, software and hardware and related products
MiTAC Innovation (KunShan) Ltd.
Jan. 21, 2011 No. 300, Di Yi Da Dao, Kunshan Development Zone, Jiangsu Province.
CNY$ 6,571 Research, development and technical consultation services
Fengda Electronic Co., Ltd. in Shunde District, Foshan City
Sep. 11, 2012 4th Floor, Building S6, No. 1 Factory, Shunda Road, Lunjiao St., Shunde District, Foshan City
CNY 25,590 Production of computer motherboards, motherboards and adapter cards
MiWELL Co., Ltd. Sep. 21, 2011 No.165, Sec. 2, Xi’an St., Beitou Dist., Taipei City NT$1,667 Information software services, retailing
Shanghai Shenyi Information Technology Co., Ltd.
Jul. 24, 2014 No. 211, Jiangchang 3rd Road, Zhabei District, Shanghai City
CNY$ 2,000 Sale of proprietary products and provision of after-sale services
MiTAC Technology UK Ltd. Aug. 01,
2014
Spectrum House, Beehive Ring Road, London Gatwick Airport, GATWICK, WEST SUSSEX, RH6 0LG, ENGLAND.
US$62,910 General Investment
MiTAC Information Systems (KunShan) Co., Ltd.
Sep. 17, 2015 No. 33, Jiefang Road, Kunshan Development Zone CNY$ 1,000 Production of products relating to communication, computers, peripherals, software and hardware; sale of proprietary products.
MITAC Investment Holding Ltd.
Nov. 06, 2015
Kunshan Export Processing Zone Building, Jiangsu Province (No. 300, 1st Avenue, Kunshan Development Zone)
CNY$ 640 Investment holding
Note1: for information on the exchange rate as of the statement date, refer to the note 3 to operation highlights of respective affiliates and subsidiaries. (Page 105) Note 2: company liquidation.

100
3. Information on the same shareholder deemed as controlling or in a parent-subsidiary relationship: None.
4. The industries in which the affiliates operate and the linkage between the affiliates
Industry Name of subsidiary/affiliate Connection with other subsidiaries/affiliates in business
operation
Manufacturing and sales of PC and communication
products
MiTAC International Corp. Manufacturing and sale of products, and provision of after-sale services
MiTAC Computer (Kunshan) Co., Ltd.
Manufacturing and sale of products
MiTAC Computer (Shunde) Ltd. Manufacturing and sale of products
Fengda Electronic Co., Ltd. in Shunde District, Foshan City
Manufacturing and sale of products
MiTAC Computing Technology Corporation
Manufacturing and sale of products, and provision of after-sale services
MiTAC Information Systems (KunShan) Co., Ltd.
Manufacturing and sale of products
Investment and Holding
Companies
Silver Star Developments Ltd. Investment in overseas subsidiaries for the manufacturing and sales of products and provision of after-sale services
System Glory International Ltd. General Investment
Pacific China Corp. Investment in overseas subsidiaries for the manufacturing and sales of products and provision of after-sale services
Software Insights Ltd. Investment in overseas subsidiaries for product research and development, and provision of technical consultation services
Start Well Technology Ltd. Investment in overseas subsidiaries for the manufacturing and sales of products and provision of after-sale services
MiTAC Star Service Ltd. Investment in overseas subsidiaries for the manufacturing and sales of products
Huge Extent Ltd. General Investment
Top Sheen Enterprises Ltd. Investment in overseas subsidiaries for the sales of products and provision of after-sale services
Best Profit Ltd. Investment in overseas subsidiaries for the sales of products and provision of after-sale services
Tsu Fung Investment Corp. General Investment
MiTAC Technology UK Ltd. Investment in overseas subsidiaries for the sales of products and provision of after-sale services
MITAC Investment Holding Ltd. General Investment
Technical Service
MiTAC Research (ShangHai) Ltd.
Research, development and technical consultation services
DLC Technology Corporation Research, development and technical consultation services
MiTAC Technology (KunShan) Co., Ltd.
After-sale product maintenance and repair, and provision of technical consultation services
MiTAC Service (ShangHai) Co., Ltd.
After-sale product maintenance and repair, and provision of technical consultation services
Mitac Information Technology Ltd.
After-sale product maintenance and repair, and provision of technical consultation services
MiTAC Innovation (KunShan) Ltd.
Research, development and technical consultation services
MiWELL Co., Ltd. Information software services, retailing
Shanghai Shenyi Information Technology Co., Ltd.
Sale of proprietary products and provision of after-sale services
Trading
Mio Technology Corp. Sale of products and provision of after-sale services
MiTAC Japan Corp. Sale of products and provision of after-sale services
MiTAC Benelux N.V. Sale of products and provision of after-sale services
Mio International Ltd. Sale of products
Mio Technology (Suzhou) Ltd. Sale of products and provision of after-sale services
MiTAC Australia Pty Ltd. Sale of products and provision of after-sale services
MiTAC Europe Ltd. Sale of products and provision of after-sale services
Tyan Computer Corporation - Sale of products and provision of after-sale services

101
USA
Mio Technology GmbH Sale of products and provision of after-sale services
MiTAC Logistics Corporation Sale of products and provision of after-sale services
MiTAC Digital Corporation Sale of products and provision of after-sale services
Trading and assembly
MiTAC Information Systems Corp.
Assembly and sale of products, and provision of after-sale services
Shipping agency and import/export
trade
MiTAC Logistic Service (KunShan) Ltd.
Shipping agent, import/export, and warehouse service.
MiTAC Pacific (H.K.) Ltd. Import and export service

102
5. Directors and Presidents of affiliated companies
Enterprise name Title Name or representative Shareholding
Shares held Shareholding percentage
MiTAC International Corp.
Chairman MiTAC Holdings Corporation /Rep: Miau, Matthew Feng Chiang
1,379,638,902 100%
Director/President MiTAC Holdings Corporation/Rep: Ho, Jhi-Wu 1,379,638,902 100% Director MiTAC Holdings Corporation/Rep: Michael Lin 1,379,638,902 100% Director MiTAC Holdings Corporation/Rep: Chang, Yao-Chun 1,379,638,902 100% Supervisor MiTAC Holdings Corporation/Rep: Ching, Hu-Shih 1,379,638,902 100%
MiTAC Computing Technology Corporation
Chairman MiTAC Holdings Corporation/Rep: Ho, Jhi-Wu 232,757,102 100%
Director MiTAC Holdings Corporation /Rep: Miau, Matthew Feng Chiang
232,757,102 100%
Director/President MiTAC Holdings Corporation/Rep: Michael Lin 232,757,102 100% Supervisor MiTAC Holdings Corporation/Rep: Crystal Yang 232,757,102 100%
Tsu Fung Investment Corp.
Chairman Director Director Supervisor
MiTAC International Corp./Rep: Ho, Jhi-Wu MiTAC International Corp./Rep: Crystal Yang MiTAC International Corp./Rep: Chung, Shu-Ling MiTAC International Corp./Rep: Huang, Hsiu-Ling
128,584,651 100% 128,584,651 100% 128,584,651 100% 128,584,651 100%
Silver Star Developments Ltd. Director Ho Jhi-Wu 0 0% Director Yang Hsiang-Yun 0 0% Director Yuan Chi-Ying 0 0%
MiTAC Japan Corp.
Director Ho Jhi-Wu 0 0% Director Yang Hsiang-Yun 0 0% Director/ President Toshihiko Hara 0 0% Supervisor Huang, Hsiu-Ling 0 0%
MiTAC Benelux N.V. Director Ho Jhi-Wu 0 0%
Director Chang Le-Chun 0 0% Director Yang Hsiang-Yun 0 0%
MiTAC Pacific (H.K.) Ltd. Director Ho Jhi-Wu 0 0% Director Yang Hsiang-Yun 0 0%
System Glory International Ltd. Director Ho Jhi-Wu 0 0% Director Yang Hsiang-Yun 0 0% Director Yuan Chi-Ying 0 0%
Pacific China Corp. Director Ho Jhi-Wu 0 0% Director Yang Hsiang-Yun 0 0% Director Yuan Chi-Ying 0 0%
MiTAC Star Service Ltd. Director Ho Jhi-Wu 0 0% Director Yang Hsiang-Yun 0 0% Director Yuan Chi-Ying 0 0%
Software Insights Ltd. Director Ho Jhi-Wu 0 0% Director Yang Hsiang-Yun 0 0% Director Yuan Chi-Ying 0 0%
MiTAC Computer (Kunshan) Co., Ltd.
Chairman Start Well Technology Ltd./Rep: Percy Chen N/A 100% Director Start Well Technology Ltd./Rep: Chang, Yao-Chun N/A 100% Director/President Start Well Technology Ltd./Rep: Wu, Shun-Huang N/A 100% Supervisor Huang, Hsiu-Ling N/A 0%
MiTAC Service (ShangHai) Co., Ltd.
Chairman Pacific China Corp./Rep: Ho, Jhi-Wu N/A 100% Director/President Pacific China Corp./Rep: Percy Chen N/A 100% Director Pacific China Corp./Rep: Chang, Yao-Chun N/A 100%
MiTAC Computer (Shunde) Ltd.
Chairman MiTAC Star Service Ltd./Rep: Michael Lin N/A 100% Vice chairman MiTAC Star Service Ltd./Rep: J.J. Huang N/A 100% Director/President MiTAC Star Service Ltd./Rep: Chen, Chien-Hung N/A 100% Supervisor Huang, Hsiu-Ling N/A 0%
MiTAC Research (ShangHai) Ltd.
Chairman Software Insights Ltd./Rep: Ho, Jhi-Wu N/A 100% Director/President Software Insights Ltd./Rep: Yeh, Nai-Yuan N/A 100% Director Software Insights Ltd./Rep: Crystal Yang N/A 100%
Mio Technology Corp.
Chairman MiTAC International Corp./Rep: Ho, Jhi-Wu 2,000,000 100% Director/President MiTAC International Corp./Rep: Chang, Yao-Chun 2,000,000 100% Director MiTAC International Corp./Rep: Li, Hui-Ling 2,000,000 100% Supervisor MiTAC International Corp./Rep: Huang, Hsiu-Ling 2,000,000 100%
Start Well Technology Ltd. Director Ho Jhi-Wu 0 0% Director Yang Hsiang-Yun 0 0% Director Yuan Chi-Ying 0 0%
MiTAC Technology (KunShan) Co., Ltd.
Chairman Start Well Technology Ltd./Rep: Ho, Jhi-Wu N/A 100%
Director Start Well Technology Ltd./Rep: Chang, Yao-Chun N/A 100%
Director/President Start Well Technology Ltd./Rep: Percy Chen N/A 100%
Supervisor Huang, Hsiu-Ling N/A 0%
Mio International Ltd.
Director Ho Jhi-Wu 0 0% Director Yang Hsiang-Yun 0 0%
Director Yuan Chi-Ying 0 0%
Huge Extent Ltd. Director Ho Jhi-Wu 0 0% Director Yang Hsiang-Yun 0 0% Director Yuan Chi-Ying 0 0%

103
Enterprise name Title Name or representative Shareholding
Shares held Shareholding percentage
MiTAC Australia Pty Ltd.
Director Ho Jhi-Wu 0 0%
Director Yang Hsiang-Yun 0 0%
Director Wendy Hammond 0 0%
MiTAC Europe Ltd. Director Ho Jhi-Wu 0 0%
Director Chang Le-Chun 0 0% Director Yang Hsiang-Yun 0 0%
DLC Technology Corporation Liquidation in progress 0 100%
Mio Technology (Suzhou) Ltd.
Chairman Mio International Ltd./Rep: Ho, Jhi-Wu N/A 100% Director Mio International Ltd./Rep: James C. Yuan N/A 100% Director Mio International Ltd./Rep: Chang, Yao-Chun N/A 100%
Supervisor Huang, Hsiu-Ling N/A 0%
President Yeh, Nai-Yuan N/A 0%
Tyan Computer Corporation - USA Director Ho Jhi-Wu 0 0%
Director Robert Chen 0 0%
Mio Technology GmbH Director Ho Jhi-Wu 0 0%
Director Yang Hsiang-Yun 0 0%
Top Sheen Enterprises Ltd. Director Ho Jhi-Wu 0 0% Director Yang Hsiang-Yun 0 0% Director Yuan Chi-Ying 0 0%
Best Profit Ltd. Director Ho Jhi-Wu 0 0% Director Yang Hsiang-Yun 0 0% Director Yuan Chi-Ying 0 0%
MiTAC Logistics Corporation Director Ho Jhi-Wu 0 0% Director Yuan Chi-Ying 0 0% Director/President Robert Chen 0 0%
MiTAC Logistic Service (KunShan) Ltd.
Chairman Start Well Technology Ltd./Rep: Ho, Jhi-Wu N/A 100%
Director Start Well Technology Ltd./Rep: Percy Chen N/A 100%
Director Start Well Technology Ltd./Rep: Chang, Yao-Chun N/A 100%
Supervisor Huang, Hsiu-Ling N/A 0%
President Start Well Technology Ltd./Rep: Wu, Shun-Huang N/A 0%
MiTAC Digital Corporation Director Ho Jhi-Wu 0 0% Director/President Chang Le-Chun 0 0% Director Yang Hsiang-Yun 0 0%
Mitac Information Technology Ltd.
Chairman Start Well Technology Ltd./Rep: Ho, Jhi-Wu N/A 100% Director/President Start Well Technology Ltd./Rep: Percy Chen N/A 100% Director Start Well Technology Ltd./Rep: Chang, Yao-Chun N/A 100% Supervisor Huang, Hsiu-Ling N/A 0%
MiTAC Information Systems Corp.
Director Ho Jhi-Wu 0 0% Director Yang Hsiang-Yun 0 0% Director Robert Chen 0 0% Director/President Charlotte C.Y. Chou 0 0%
MiTAC Innovation (KunShan) Ltd.
Chairman Software Insights Ltd./Rep: Ho, Jhi-Wu N/A 100% Director/President Software Insights Ltd./Rep: Yeh, Nai-Yuan N/A 100% Director Software Insights Ltd./Rep: Michael Lin N/A 100% Supervisor Crystal Yang N/A 0%
Fengda Electronic Co., Ltd. in Shunde District, Foshan City
Chairman/President Software Insights Ltd./Rep: J.J. Huang N/A 100% Vice chairman Software Insights Ltd./Rep: Ho, Jhi-Wu N/A 100% Director Software Insights Ltd. /Rep: James C. Yuan N/A 100% Supervisor Huang, Hsiu-Ling N/A 0%
MiWELL Co., Ltd.
Chairman MiTAC International Corp./Rep: Ho, Jhi-Wu 166,667 100% Director MiTAC International Corp./Rep: Chang, Yao-Chun 166,667 100% Director/President MiTAC International Corp./Rep: Chang, Yuan-Hsiang 166,667 100% Supervisor MiTAC International Corp./Rep: Chris Yen 166,667 100%
Shanghai Shenyi Information Technology Co., Ltd.
Chairman MiTAC Computer (KunShan) Co., Ltd./Rep: Ho, Jhi-Wu
N/A 100%
Director/President MiTAC Computer (KunShan) Co.,Ltd./Rep: Yeh, Nai-Yuan
N/A 100%
Director MiTAC Computer (KunShan) Co.,Ltd./Rep: Percy Chen
N/A 100%
Director MiTAC Computer (KunShan) Co.,Ltd./Rep: Chang, Yao-Chun
N/A 100%
Supervisor Huang, Hsiu-Ling N/A 0%
MiTAC Technology UK Ltd.
Director MiTAC Computing Technology Corporation/Rep: Ho, Jhi-Wu
62,909,737 100%
Director MiTAC Computing Technology Corporation/Rep: Michael Lin
62,909,737 100%
Director MiTAC Computing Technology Corporation/Rep: Crystal Yang
62,909,737 100%

104
Enterprise name Title Name or representative Shareholding
Shares held Shareholding percentage
MiTAC Information Systems (KunShan) Co., Ltd.
Chairman MiTAC Computer (KunShan) Co., Ltd./Rep: Percy Chen
N/A 100%
Director MiTAC Computer (KunShan) Co.,Ltd./Rep: Chang, Yao-Chun
N/A 100%
Director/President MiTAC Computer (KunShan) Co.,Ltd./Rep: Wu, Shun-Huang
N/A 100%
Supervisor Huang, Hsiu-Ling N/A 0%
MITAC Investment Holding Ltd.
Chairman/President Start Well Technology Ltd./Rep: Percy Chen N/A 100% Director Start Well Technology Ltd./Rep: Ho, Jhi-Wu N/A 100% Director Start Well Technology Ltd./Rep: Yeh, Nai-Yuan N/A 100% Director Start Well Technology Ltd./Rep: Wu, Shun-Huang N/A 100% Supervisor Huang, Hsiu-Ling N/A 0%

105
6. Business overview of affiliated companies: In thousands of New Taiwan Dollars
Enterprise name Capital Total assets
Total liabilities
Net worth
Revenue Operating
income (loss)
Earnings in current period
(after tax)
EPS (NTD$)
(after-tax)
MiTAC Holdings Corporation 7,778,113
33,762,509
208,100 33,554,409
1,771,352
1,743,184 1,754,092 2.32
MiTAC International Corp. 14,292,183
32,092,819
5,328,334 26,764,485
4,639,080
(686,680) 854,637 0.60
Tsu Fung Investment Corp. 1,285,847
1,337,066
439 1,336,627
53,988 29,369 29,583 0.23
Silver Star Developments Ltd.-Consolidated 7,073,637
23,534,730
6,030,671 17,504,059
19,825,154
(187,601) 827,968 3.84
MiTAC Japan Corp. 13,635 38,529 10,523 28,006 82,904 225 476 476.00
MiTAC Benelux N.V. 58,061 158,647 101,106 57,541 45,940 (9,300) (8,950) (137.16)
MiTAC Pacific (H.K.) Ltd. 328 22,852 19,034 3,818 0 (305) (1) (0.10)
Pacific China Corp. 3,969,326
4,098,065
0 4,098,065
0 0 103 0.00
MiTAC Computer (Shunde) Ltd. 3,081,099
6,550,674
3,130,732 3,419,942
12,404,037
15,622 61,512 NA
System Glory International Ltd. 0 125,359 31,261 94,098 0 0 7,669 7,669,000.00 Mio Technology Corp. 20,000 22,613 52 22,561 0 (144) 1,399 0.70
Start Well Technology Ltd. 981,468 2,211,239
28,002 2,183,237
0 0 9,941 0.33
MiTAC Computer (Kunshan) Co., Ltd. 1,520,081
3,230,063
1,184,235 2,045,828
3,868,931
(29,891) 4,122 NA
Software Insights Ltd. 170,693 176,808 32,825 143,983 0 0 0 0.00
MiTAC Star Service Ltd. 2,445,463
2,463,542
0 2,463,542
0 0 0 0.00
MiTAC Service (ShangHai) Co., Ltd. 41,345 29,370 14,471 14,899 57,506 (22,920) (22,215) NA
MiTAC Technology (Kunshan) Co., Ltd. 41,344 73,462 19,263 54,199 79,870 (17,977) (11,192) NA
Mio International Ltd. 41,852 1,548,452
1,489,681 58,771 3,175,502
0 0 0.00
MiTAC Research (Shanghai) Co., Ltd. 214,985 504,280 61,978 442,302 244,347 4,538 20,313 NA
Huge Extent Ltd. 262,600 262,600 0 262,600 0 0 0 0.00
MiTAC Australia Pty Ltd. 3,046 227,266 332,869 (105,603)
503,116 (44,230) (44,405) (349.65)
MiTAC Europe Ltd. 239,140 207,617 571,618 (364,001)
838,991 (70,614) (69,709) (3.09)
DLC Technology Corporation 0 0 0 0 0 (91) 0 NA
Tyan Computer Corporation-USA 129,669 1,013,837
364,566 649,271 1,736,806
20,688 20,012 20,012.00
Mio Technology GmbH 933 8,179 (42) 8,221 4,179 199 100 NA
Top Sheen Enterprises Ltd. 670,929 1,477,125
820,625 656,500 0 0 0 0.00
Best Profit Ltd. 1,218,833
1,872,369
857,602 1,014,767
0 0 146 0.00
MiTAC Logistics Corporation 93,552 390,522 169,194 221,328 866,159 10,288 3,321 33.21
Mio Technology (Suzhou) Ltd. 9,790 228,233 218,643 9,590 307,320 14,182 12,530 NA
MiTAC Logistic Service (KunShan) Ltd. 34,070 36,735 348 36,387 2,198 (227) 953 NA
MiTAC Digital Corporation 1,477,125
692,462 1,363,179 (670,717)
1,319,800
(33,547) (19,156) (0.43)
Mitac Information Technology Ltd. 10,232 164,583 98,172 66,411 286,805 9,898 16,058 NA
MiTAC Information Systems Corp. 820,625 6,587,917
5,201,565 1,386,352
29,760,340
179,634 116,812 38,937.33
MiTAC Innovation (KunShan) Ltd. 32,820 81,152 19,761 61,391 73,635 3,379 5,872 NA
Fengda Electronic Co., Ltd. in Shunde District, Foshan City 127,822 133,975 4,903 129,072 0 (37) 1,772 NA
MiWELL Co., Ltd. 1,667 621 27 594 808 103 104 0.62
MiTAC Computing Technology Corporation 2,327,571
12,941,429
8,401,619 4,539,810
28,426,390
964,511 960,370 4.13
Shanghai Shenyi Information Technology Co., Ltd. 9,990 29,933 27,551 2,382 39,446 (1,897) (1,486) NA
MiTAC Technology UK Ltd. 2,065,012
2,256,951
0 2,256,951
0 0 140,146 2.23
MiTAC Information Systems (KunShan) Co., Ltd. 4,995 5,518 523 4,995 0 0 0 NA
MITAC Investment Holding Ltd. 3,195 3,199 4 3,195 0 0 0 NA
Note 1: Related figures of the subsidiaries incorporated in foreign countries shall be denominated in NTD at the exchange rate between NTD and respective foreign currencies as of the day of reporting. Note 2: The information on Silver Star Developments Ltd.-Consolidated is the consolidated information of this company and its subsidiaries. Note 3: Converted using the following exchange rates in 2015:
Year-end Average
USD: 32.825 31.737 EUR: 35.880 35.241 JPY: 0.273 0.262
RMB: 4.995 5.033 AUD: 23.985 23.875

106
(II)Consolidated financial statement of subsidiaries
MiTAC Investment Holding Co., Ltd. And its subsidiaries
Declaration of Consolidated Financial Statements of Affiliates
Affiliated enterprises subject to the preparation of consolidated business reports under
“Criteria Governing Preparation of Affiliation Reports, Consolidated Business Reports and
Consolidated Financial Statements of Affiliated Enterprises” were identical to the affiliated
companies subject to the preparation of consolidated financial statements under IFRSs10 for
financial period 2015 (from January 1 to December 31, 2015). All mandatory disclosures of the
consolidated business reports have been disclosed in the consolidated financial statements, therefore
no separate consolidated business report was prepared.
Hereby declared
Company name: MiTAC Holdings Corporation
Representative: Miau, Matthew Feng Chiang
March 25, 2016
(III)Affiliation Report: None
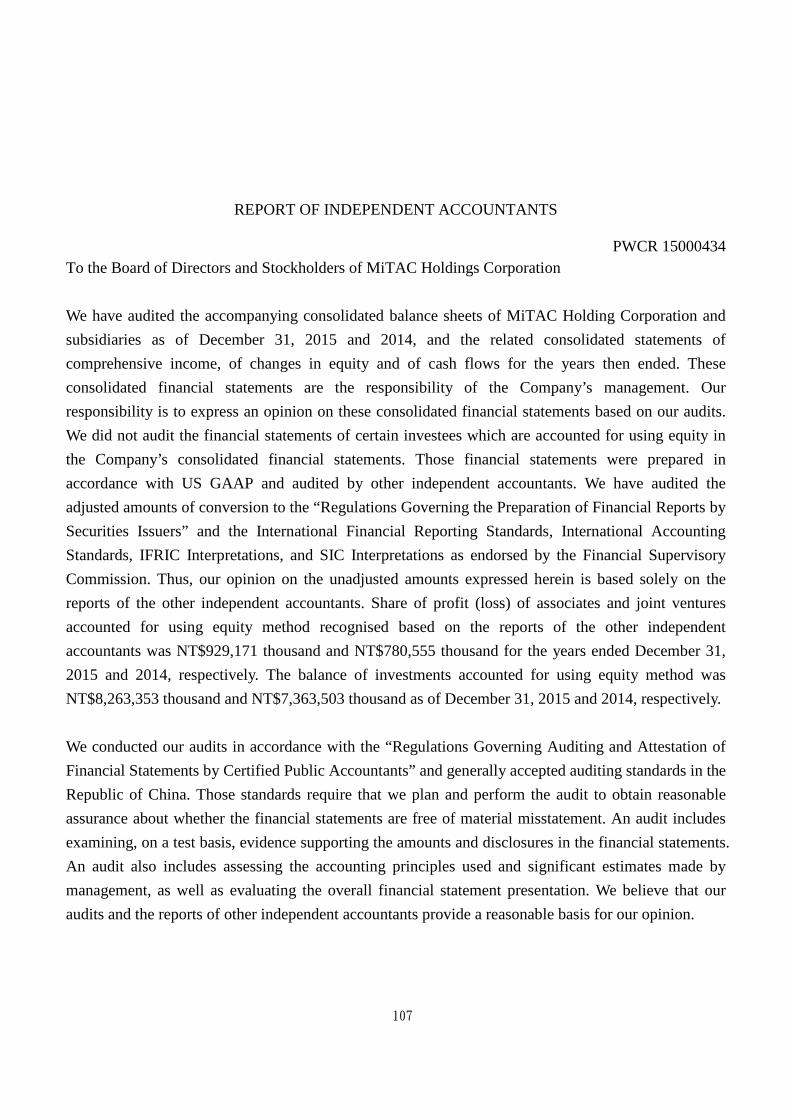
107
REPORT OF INDEPENDENT ACCOUNTANTS
PWCR 15000434
To the Board of Directors and Stockholders of MiTAC Holdings Corporation
We have audited the accompanying consolidated balance sheets of MiTAC Holding Corporation and
subsidiaries as of December 31, 2015 and 2014, and the related consolidated statements of
comprehensive income, of changes in equity and of cash flows for the years then ended. These
consolidated financial statements are the responsibility of the Company’s management. Our
responsibility is to express an opinion on these consolidated financial statements based on our audits.
We did not audit the financial statements of certain investees which are accounted for using equity in
the Company’s consolidated financial statements. Those financial statements were prepared in
accordance with US GAAP and audited by other independent accountants. We have audited the
adjusted amounts of conversion to the “Regulations Governing the Preparation of Financial Reports by
Securities Issuers” and the International Financial Reporting Standards, International Accounting
Standards, IFRIC Interpretations, and SIC Interpretations as endorsed by the Financial Supervisory
Commission. Thus, our opinion on the unadjusted amounts expressed herein is based solely on the
reports of the other independent accountants. Share of profit (loss) of associates and joint ventures
accounted for using equity method recognised based on the reports of the other independent
accountants was NT$929,171 thousand and NT$780,555 thousand for the years ended December 31,
2015 and 2014, respectively. The balance of investments accounted for using equity method was
NT$8,263,353 thousand and NT$7,363,503 thousand as of December 31, 2015 and 2014, respectively.
We conducted our audits in accordance with the “Regulations Governing Auditing and Attestation of
Financial Statements by Certified Public Accountants” and generally accepted auditing standards in the
Republic of China. Those standards require that we plan and perform the audit to obtain reasonable
assurance about whether the financial statements are free of material misstatement. An audit includes
examining, on a test basis, evidence supporting the amounts and disclosures in the financial statements.
An audit also includes assessing the accounting principles used and significant estimates made by
management, as well as evaluating the overall financial statement presentation. We believe that our
audits and the reports of other independent accountants provide a reasonable basis for our opinion.

108
In our opinion, based on our audits and the reports of other independent accountants, the consolidated
financial statements referred to in the first paragraph present fairly, in all material respects, the
financial position of MiTAC Holdings Corporation and its subsidiaries as of December 31, 2015 and
2014, and their financial performance and cash flows for the years then ended in conformity with the
“Rules Governing the Preparations of Financial Statements by Securities Issuers” and the International
Financial Reporting Standards, International Accounting Standards, IFRIC Interpretations, and SIC
Interpretations as endorsed by the Financial Supervisory Commission.
We have also audited the parent company only financial statements of MiTAC Holdings Corporation
as of and for the years ended December 31, 2015 and 2014 (not presented herein), and have expressed
a modified unqualified opinion on such financial statements.
PricewaterhouseCoopers, Taiwan
March 25, 2016
-------------------------------------------------------------------------------------------------------------------------------------------------The accompanying consolidated financial statements are not intended to present the financial position and results ofoperations and cash flows in accordance with accounting principles generally accepted in countries and jurisdictions otherthan the Republic of China. The standards, procedures and practices in the Republic of China governing the audit of suchfinancial statements may differ from those generally accepted in countries and jurisdictions other than the Republic ofChina. Accordingly, the accompanying consolidated financial statements and report of independent accountants are notintended for use by those who are not informed about the accounting principles or auditing standards generally accepted inthe Republic of China, and their applications in practice.As the financial statements are the responsibility of the management, PricewaterhouseCoopers cannot accept any liabilityfor the use of, or reliance on, the English translation or for any errors or misunderstandings that may derive from thetranslation.

MiTAC HOLDINGS CORPORATION AND SUBSIDIARIESCONSOLIDATED BALANCE SHEETS
DECEMBER 31, 2015 AND 2014(EXPRESSED IN THOUSANDS OF NEW TAIWAN DOLLARS)
109
2015 2014
ASSETS Note Amount % Amount %
Current assets
1100 Cash and cash equivalents 6(1) $ 8,786,787 19 $ 8,494,325 18
1110 Financial assets at fair value through profit or loss - current 6(2) 5,711 - 29,460 -
1125 Available-for-sale financial assets – current 6(3) 595,826 1 606,396 1
1150 Notes receivable – net 4,644 - 4,817 -
1170 Accounts receivable – net 6(5) 5,489,355 12 7,526,653 16
1180 Accounts receivable – related parties 6(5) and 7 253,354 1 231,167 -
1200 Other receivables 7 62,601 - 86,337 -
1220 Current income tax assets 72,908 - 40,842 -
130X Inventories - net 6(6) 6,272,009 14 7,189,749 15
1410 Prepayments 286,277 1 362,423 1
1476 Other financial assets - current 6(7) and 8 10,699 - 1,181,612 2
11XX Total current assets 21,840,171 48 25,753,781 53
Non-current assets
1523 Available-for-sale financial assets – non-current 6(3) 720,789 2 887,366 2
1543 Financial assets carried at cost – non-current 6(4) 1,143,049 3 1,117,642 2
1550 Investments accounted for under the equity method 6(8) 14,024,341 31 13,043,136 27
1600 Property, plant and equipment-net 6(9) and 8 5,467,908 12 5,211,314 11
1760 Investment property – net 6(10) 1,061,808 2 1,080,307 2
1780 Intangible assets-net 6(11) 119,005 - 316,694 1
1840 Deferred income tax assets 6(27) 456,908 1 443,352 1
1900 Other non-current assets 8 328,711 1 350,272 1
15XX Total non-current assets 23,322,519 52 22,450,083 47
1XXX Total assets $ 45,162,690 100 $ 48,203,864 100
(Continued)

MiTAC HOLDINGS CORPORATION AND SUBSIDIARIESCONSOLIDATED BALANCE SHEETS
DECEMBER 31, 2015 AND 2014(EXPRESSED IN THOUSANDS OF NEW TAIWAN DOLLARS)
The accompanying notes are an integral part of these consolidated financial statements.See report of independent accountants dated March 25, 2016.
110
2015 2014
LIABILITIES AND EQUITY Note Amount % Amount %
Current liabilities
2100 Short-term borrowings 6(12) $ 714,516 2 $ 3,590,577 7
2120 Financial liabilities at fair value through profit or loss
- current
6(13)15,914 - 3,371 -
2170 Accounts payable 5,364,344 12 7,371,117 15
2180 Accounts payable – related parties 7 183,363 - 263,912 1
2200 Other payables 7 3,691,058 8 3,507,921 7
2230 Current income tax liabilities 6(27) 198,957 - 50,954 -
2250 Provisions for liabilities - current 6(16) 350,486 1 338,376 1
2300 Other current liabilities 435,983 1 294,868 1
21XX Total current liabilities 10,954,621 24 15,421,096 32
Non-current liabilities
2570 Deferred income tax liabilities 6(27) 331,973 1 331,912 1
2600 Other non-current liabilities 6(14) 321,687 1 299,237 -
25XX Total non-current liabilities 653,660 2 631,149 1
2XXX Total liabilities 11,608,281 26 16,052,245 33
Equity attributable to owners of the parent
Share capital 6(17)
3110 Common shares 7,778,113 17 7,694,106 16
Capital surplus 6(18)
3200 Capital surplus 22,352,475 49 22,122,720 46
Retained earnings 6(19)
Legal reserve 132,420 - 56,311 -
Special reserve 52,117 - - -
3350 Unappropriated retained earnings 1,833,321 4 773,566 2
Other equity 6(20)
3400 Other equity 1,928,412 5 2,011,794 4
3500 Treasury shares 6(17) ( 522,449) ( 1) ( 506,878) ( 1)
3XXX Total equity 33,554,409 74 32,151,619 67
Significant Contingent Liabilities And Unrecognised ContractCommitments
9(1)(2)
Significant Events After the Balance Sheet Date 11
Total liabilities and equity $ 45,162,690 $ 100 $ 48,203,864 $ 100

MiTAC HOLDINGS CORPORATION AND SUBSIDIARIESCONSOLIDATED STATEMENTS OF COMPREHENSIVE INCOME
(EXPRESSED IN THOUSANDS OF NEW TAIWAN DOLLARS,EXCEPT EARNINGS PER SHARE)
The accompanying notes are an integral part of these consolidated financial statements.See report of independent accountants dated March 25, 2016.
111
For the year endedDecember 31, 2015
For the year endedDecember 31, 2014
Notes Amount % Amount %4000 Operating revenue 6(21) and 7 $ 50,054,765 100 $ 42,060,342 1005000 Operating costs 6(6) and 7 ( 44,470,901) ( 89) ( 36,356,436) ( 87)5900 Gross profit 5,583,864 11 5,703,906 13
Operating expenses 6(25)(26)6100 Selling expenses ( 1,357,072) ( 2) ( 1,671,976) ( 4)6200 General and administrative expenses ( 1,573,718) ( 3) ( 1,473,662) ( 3)6300 Research and development expenses ( 2,356,604) ( 5) ( 2,919,197) ( 7)6000 Total operating expenses ( 5,287,394) ( 10) ( 6,064,835) ( 14)6900 Operating profit (loss) 296,470 ( 1) ( 360,929) ( 1)
Non-operating income and expenses7010 Other income 6(22) 375,910 - 390,563 17020 Other gains and losses 6(23) ( 7,205) - ( 148,370) -7050 Finance costs 6(24) ( 32,053) - ( 44,146) -7060 Share of profit of associates and joint ventures accounted for
under equity method6(8)
1,380,981 3 1,213,705 37000 Total non-operating income and expenses 1,717,633 3 1,411,752 47900 Profit before income tax 2,014,103 4 1,050,823 37950 Income tax expense 6(27) ( 260,011) ( 1) ( 289,903) ( 1)8200 Profit for the year $ 1,754,092 3 $ 760,920 2
Other comprehensive incomeComponents of other comprehensive income that will not bereclassified to profit or loss
8311 Losses on remeasurements of defined benefit plans ($ 33,349) - ($ 42,706) -8320 Share of other comprehensive income of associates and joint
ventures accounted for using equity method, components ofother comprehensive income that will not be reclassified toprofit or loss ( 5,185) - ( 5,929) -
8349 Income tax related to components of other comprehensiveincome that will not be reclassified to profit or loss 5,669 - 7,260 -
8310 Components of other comprehensive loss that will not bereclassified to profit or loss ( 32,865) - ( 41,375) -
Components of other comprehensive income that will bereclassified to profit or loss
8361 Cumulative translation differences of foreign operations 400,893 1 889,391 28362 Unrealized loss on valuation of available-for-sale financial
assets ( 184,940) - ( 94,686) -8370 Share of other comprehensive (loss) income of associates and
joint ventures accounted for using equity method,components of other comprehensive income that will bereclassified to profit or loss ( 299,335) ( 1) 29,279 -
8360 Components of other comprehensive (loss) income thatwill be reclassified to profit or loss ( 83,382) - 823,984 2
8300 Other comprehensive (loss) income for the year ($ 116,247) - $ 782,609 28500 Total comprehensive income for the year $ 1,637,845 3 $ 1,543,529 4
Profit attributable to:8610 Owners of parent 1,754,092 3 761,086 28620 Non-controlling interest - - ( 166) -
$ 1,754,092 3 $ 760,920 2Comprehensive income (loss) attributable to:
8710 Owners of parent $ 1,637,845 3 $ 1,543,695 48720 Non-controlling interest - - ( 166) -
$ 1,637,845 3 $ 1,543,529 49750 Basic earnings per share 6(28) $ 2.32 $ 1.039850 Diluted earnings per share 6(28) $ 2.30 $ 1.02

MiTAC HOLDINGS CORPORATION AND SUBSIDIARIESCONSOLIDATED STATEMENTS OF CHANGES IN STOCKHOLDERS’ EQUITY
(EXPRESSED IN THOUSANDS OF NEW TAIWAN DOLLARS)
112
Attributable to owners of the Company
Retained Earnings
Currencytranslationdifferences
Unrealized gainor loss on
available-for-salefinancial assets2014 Notes
Commonshares Capital surplus
Legalreserve
Unappropriatedretained earnings
Treasuryshares Total
Non-controllinginterest Total equity
Balance at January 1, 2014 $ 7,609,488 $ 21,803,383 $ - $ 563,114 $ 899,611 $ 288,199 ($ 609,766 ) $ 30,554,029 $ 300 $ 30,554,329
Distribution of 2013 earnings
Legal reserve 6(19) - - 56,311 ( 56,311 ) - - - - - -
Cash dividends 6(19) - - - ( 451,589 ) - - - ( 451,589 ) - ( 451,589 )
Employee stock options exercised 6(15)(18) 97,723 129,127 - - - - - 226,850 - 226,850
Compensation cost of employees’share based –payment transactions
6(15)(18)- 66,639
-- - - - 66,639 - 66,639
Treasury stock transferred toemployees
6(18)- 1,035
-- - - 77,281 78,316 - 78,316
Retirement of treasury stock ( 13,105) ( 12,502 ) - - - - 25,607 - - -
Subsidiaries received cash dividendspaid by the parent company
6(18)- 6,935 - - - - - 6,935 - 6,935
Net income (loss) for the year - - - 761,086 - - - 761,086 ( 166 ) 760,920
Net other comprehensive income(loss) for the year - - - ( 41,375 ) 973,032 ( 149,048) - 782,609 - 782,609
Net change of equity in associatesaccounted for under equity method
6(18)- 128,103 - ( 993 ) - - - 127,110 - 127,110
Acquisition of non-controllinginterest - - - ( 366 ) - - - ( 366 ) ( 134 ) ( 500 )
Balance at December 31, 2014 $ 7,694,106 $ 22,122,720 $ 56,311 $ 773,566 $ 1,872,643 $ 139,151 ($ 506,878 ) $ 32,151,619 $ - $ 32,151,619
(Continued)

MiTAC HOLDINGS CORPORATION AND SUBSIDIARIESCONSOLIDATED STATEMENTS OF CHANGES IN STOCKHOLDERS’ EQUITY
(EXPRESSED IN THOUSANDS OF NEW TAIWAN DOLLARS)
113
Attributable to owners of the Company
Retained Earnings
2015 NotesCommon
sharesCapitalsurplus
Legalreserve
Specialreserve
Unappropriatedretained earnings
Currencytranslationdifferences
Unrealizedgain or loss on
available-for-salefinancial assets
Treasuryshares Total
Non-controlling
interestTotalequity
Balance at January 1, 2015 $ 7,694,106 $ 22,122,720 $ 56,311 $ - $ 773,566 $ 1,872,643 $ 139,151 ( $ 506,878) $ 32,151,619 $ - $32,151,619
Distribution of 2014 earnings
Legal reserve 6(19) - - 76,109 - ( 76,109 ) - - - - - -
Special reserve 6(19) - - - 52,117 ( 52,117 ) - - - - - -
Cash dividends 6(19) - - - - ( 533,246 ) - - - ( 533,246) - ( 533,246)
Employee stock optionsexercised 6(15)(18) 127,207 175,941 - - - - - - 303,148 - 303,148
Compensation cost ofemployees’ share based –payment transactions 6(15)(18) - 55,137 - - - - - - 55,137 - 55,137
Treasury stock transferred toemployees 6(18) - ( 2,472 ) - - - - - 69,347 66,875 - 66,875
Retirement of treasury stock 6(18) ( 43,200 ) ( 41,244 ) - - - - - 84,444 - - -
Purchase of treasury stock 6(17) - - - - - - - ( 169,362 ) ( 169,362) - ( 169,362)
Subsidiaries received cashdividends paid by the parentcompany 6(18) - 7,976 - - - - - - 7,976 - 7,976
Net change of equity inassociates accounted forunder equity method 6(18) - 34,417 - - - - - - 34,417 - 34,417
Net income for the year - - - - 1,754,092 - - - 1,754,092 - 1,754,092
Net other comprehensiveincome (loss) for the year - - - - ( 32,865 ) 135,865 ( 219,247) - ( 116,247) - ( 116,247)
Balance at December 31,2015 $ 7,778,113 $ 22,352,475 $132,420 $ 52,117 $ 1,833,321 $ 2,008,508 ( $ 80,096 ) ( $ 522,449) $ 33,554,409 $ - $33,554,409
The accompanying notes are an integral part of these consolidated financial statements.
See report of independent accountants dated March 25, 2016.

MiTAC HOLDINGS CORPORATION AND SUBSIDIARIESCONSOLIDATED STATEMENTS OF CASH FLOWS
(EXPRESSED IN THOUSANDS OF NEW TAIWAN DOLLARS)
114
For the yearended December
31, 2015
For the yearended December
31, 2014
Cash flows from operating activities:
Income before income tax $ 2,014,103 $ 1,050,823
Adjustments to reconcile income before income tax to net cash
provided by (used in) operating activities:
Income and expenses having no effect on cash flows
(Reversal of) bad debts expense 6(5) 6,419 ( 26,594 )
Loss on inventory market value decline 6(6) 182,649 131,792
Depreciation 6(9)(10)(25) 534,742 486,984
Impairment loss 6(3)(11)(23) 25,902 216,198
Amortization 6(11)(25) 249,700 289,660
Amortization of long-term prepaid rent 6,804 6,569
Compensation cost of share-based payment 6(15) 55,137 66,639
Interest income 6(22) ( 99,428 ) ( 147,848 )
Interest expense 6(24) 32,053 44,146
Dividend income 6(22) ( 119,828 ) ( 105,534 )
Net income of financial assets/liabilities at fair value through
profit or loss ( 18,362 )6(23) 36,291
Share of profit of associates accounted for under equity method 6(8) ( 1,380,981 ) ( 1,213,705 )
Loss (gain) on disposal of investments 6(23) 16,506 ( 58,609 )
Gain on disposal of property, plant and equipment, net 6(23) ( 12,999 ) ( 11,227 )
Gain disposal of other non current assets 6(23) - ( 15,832 )
Changes in assets/liabilities relating to operating activities
Net changes in assets relating to operating activities
Notes receivable, net 173 4,529
Accounts receivable 2,273,874 ( 1,103,894 )
Other receivables 26,156 58,923
Inventories 840,965 ( 725,420 )
Prepayments 76,146 ( 124,017 )
Net changes in liabilities relating to operating activities
Notes payable - ( 1,622 )
Accounts payable ( 2,245,258 ) 672,842
Other payables 188,253 ( 61,266 )
Other current liabilities 141,115 68,648
Provisions for liabilities - current 13,245 ( 119,909 )
Accrued pension liabilities 5,577 ( 439 )
Cash provided by (used in) operating activities 2,867,316 ( 636,525 )
Payment of interest ( 37,168 ) ( 40,808 )
Receipt of interest 107,274 147,414
Payment of income tax ( 167,836 ) ( 180,688 )
Cash dividend received 599,287 340,579
Net cash provided by (used in) operating activities 3,368,873 ( 370,028 )
(Continued)

MiTAC HOLDINGS CORPORATION AND SUBSIDIARIESCONSOLIDATED STATEMENTS OF CASH FLOWS
(EXPRESSED IN THOUSANDS OF NEW TAIWAN DOLLARS)
The accompanying notes are an integral part of these consolidated financial statements.See report of independent accountants dated March 25, 2016.
115
For the yearended December
31, 2015
For the yearended December
31, 2014
Cash flows from investing activities:
Decrease in other financial assets $ 1,170,853 $ 597,064
Proceeds from disposal of available-for-sale financial assets 33,799 82,770
Acquisition of available-for-sale financial assets ( 72,340 ) ( 45,000 )
Acquisition of financial assets carried at cost ( 25,000 ) ( 25,957 )
Proceeds from disposal of financial assets carried at cost - 2,879
Proceeds from capital reduction of financial assets carried at cost - 63,223
Acquisition of investments accounted for under the equity method ( 64,237 ) ( 7,839 )
Proceeds from disposal of investment accounted for under the equity
method 17,135 -
Acquisition of property, plant and equipment 6(9) ( 804,950 ) ( 452,480 )
Proceeds from disposal of property, plant and equipment 16,477 48,156
Increase in intangible assets 6(11) ( 52,026 ) ( 119,239 )
Decrease (increase) in refundable deposits 24,216 ( 22,231 )
Increase in other non-current assets ( 14,637 ) ( 7,791 )
Proceeds from disposal of other non-current assets - 19,401
Net cash provided by investing activities 229,290 132,956
Cash flows from financing activities:
(Decrease) increase in short-term borrowings ( 2,876,061 ) 1,481,607
(Decrease) increase in guarantee deposits ( 12,439 ) 20,688
Employee stock options exercised 303,148 226,850
Treasury stock transferred to employees 66,875 78,316
Purchase of treasury stock ( 169,362 ) -
Cash dividends paid ( 525,270 ) ( 444,654 )
Acquisition of non-controlling interest - ( 500 )
Net cash (used in) provided by financing activities ( 3,213,109 ) 1,362,307
Effects of changes in exchange rates ( 92,592 ) 178,367
Net increase in cash and cash equivalents 292,462 1,303,602
Cash and cash equivalents at beginning of year 8,494,325 7,190,723
Cash and cash equivalents at end of year $ 8,786,787 $ 8,494,325

116
MiTAC HOLDINGS CORPORATION AND SUBSIDIARIESNOTES TO THE CONSOLIDATED FINANCIAL STATEMENTS
DECEMBER 31, 2015 AND 2014
(Expressed In Thousands Of New Taiwan dollars, Except As Otherwise Indicated)
1. HISTORY AND ORGANIZATION
(1) MiTAC Holdings Corporation (the “Company”) was established by MiTAC International Corp.
(“MiTAC International”) through a share conversion on September 12, 2013, and on the same date,
the competent authority has approved for the Company’s shares to be listed on the Taiwan Stock
Exchange (TWSE). MiTAC International became the Company’s wholly-owned subsidiary after
conversion. The main business of the Company and its subsidiaries (collectively referred herein as
the “Group”) is to design, manufacture and sell products related to investment, computer and its
peripherals and communications.
(2) In order to promote the Group’s specialization of work to eventually transform and improve its
competitiveness, the Board of Directors of MiTAC International has resolved to divest its cloud
computing products group to the newly established company – MiTAC Computing Technology
Corporation as the consideration for the acquisition of 220,000 thousand newly issued ordinary
shares of MiTAC Computing Technology Corporation on the spin-off day, September 1, 2014. As a
result, MiTAC International and MiTAC Computing Technology Corporation are now
wholly-owned by the Company after the spin-off.
2. THE DATE OF AUTHORIZATION FOR ISSUANCE OF THE CONSOLIDATED FINANCIAL
STATEMENTS AND PROCEDURES FOR AUTHORIZATION
These consolidated financial statements were authorized for issuance by the Board of Directors on
March 25, 2016.
3. APPLICATION OF NEW STANDARDS, AMENDMENTS AND INTERPRETATIONS
(1) Effect of the adoption of new issuances of or amendments to International Financial Reporting
Standards (“IFRSs”) as endorsed by the Financial Supervisory Commission (“FSC”)
According to Financial-Supervisory-Securities-Auditing No. 1030010325 issued by FSC on April 3,
2014, commencing 2015, companies with shares listed on the TWSE or traded on the Taipei
Exchange or Emerging Stock Market shall adopt the 2013 version of IFRS (not including IFRS 9,
‘Financial instruments’) as endorsed by the FSC and Regulations Governing the Preparation of
Financial Reports by Securities Issuers effective January 1, 2015 (collectively referred herein as the
“2013 version of IFRS”) in preparing the consolidated financial statements. The impact of adopting
the 2013 version of IFRS is listed below:
A. IAS 19 (revised), ‘Employee benefits’
The revised standard makes amendments that net interest amount, calculated by applying the
discount rate to the net defined benefit asset or liability, replaces the finance charge and expected
return on plan assets. The revised standard eliminates the accounting policy choice that the
actuarial gains and losses could be recognised based on corridor approach or recognised in profit
or loss. The revised standard requires that the actuarial gains and losses can only be recognized
117
immediately in other comprehensive income when incurred. Past service cost will be recognized
immediately in the period incurred and will no longer be amortised using straight-line basis over
the average period until the benefits become vested. An entity is required to recognise
termination benefits at the earlier of when the entity can no longer withdraw an offer of those
benefits and when it recognises any related restructuring costs, rather than when the entity is
demonstrably committed to a termination. Additional disclosures are required for defined benefit
plans. The revised standard has no significant impact on the Group’s consolidated financial
statements.
B. IAS 1, ‘Presentation of financial statements’
The amendment requires entities to separate items presented in OCI classified by nature into two
groups on the basis of whether they are potentially reclassifiable to profit or loss subsequently
when specific conditions are met. If the items are presented before tax then the tax related to
each of the two groups of OCI items (those that might be reclassified and those that will not be
reclassified) must be shown separately. Accordingly, the Group will adjust its presentation of the
statement of comprehensive income.
C. IFRS 12, ‘Disclosure of interests in other entities’
The standard integrates the disclosure requirements for subsidiaries, joint arrangements,
associates and unconsolidated structured entities. And, the Group will disclose additional
information about its interests in consolidated entities and unconsolidated entities accordingly.
D. IFRS 13, ‘Fair value measurement’
The standard defines fair value as the price that would be received to sell an asset or paid to
transfer a liability in an orderly transaction between market participants at the measurement date.
The standard sets out a framework for measuring fair value from market participants’ perspective,
and requires disclosures about fair value measurements. For non-financial assets only, fair value
is determined based on the highest and best use of the asset. Based on the Group’s assessment,
the adoption of the standard has no significant impact on its consolidated financial statements,
and the Group will disclose additional information about fair value measurements accordingly.
(2) Effect of new issuances of or amendments to IFRSs as endorsed by the FSC but not yet adopted by
the Group
None.

118
(3) IFRSs issued by IASB but not yet endorsed by the FSC
New standards, interpretations and amendments issued by IASB but not yet included in the 2013
version of IFRSs as endorsed by the FSC:
New Standards, Interpretations and Amendments
Effective Date by
International Accounting
Standards Board
IFRS 9, ‘Financial instruments' January 1, 2018
Sale or contribution of assets between an investor and its associate or joint
venture (amendments to IFRS 10 and IAS 28)
To be determined by
International Accounting
Standards Board.
Investment entities: applying the consolidation exception (amendments to
IFRS 10, IFRS 12 and IAS 28)
January 1, 2016
Accounting for acquisition of interests in joint operations (amendments to
IFRS 11)
January 1, 2016
IFRS 14, 'Regulatory deferral accounts' January 1, 2016
IFRS 15, ‘Revenue from contracts with customers' January 1, 2018
IFRS 16, ‘Leases' January 1, 2019
Disclosure initiative (amendments to IAS 1) January 1, 2016
Disclosure initiative (amendments to IAS 7) January 1, 2017
Recognition of deferred tax assets for unrealized losses (amounts to IAS
12)
January 1, 2017
Clarification of acceptable methods of depreciation and amortisation
(amendments to IAS 16 and IAS 38)
January 1, 2016
Agriculture: bearer plants (amendments to IAS 16 and IAS 41) January 1, 2016
Defined benefit plans: employee contributions (amendments to IAS 19R) July 1, 2014
Equity method in separate financial statements (amendments to IAS 27) January 1, 2016
Recoverable amount disclosures for non-financial assets (amendments
to IAS 36)
January 1, 2014
Novation of derivatives and continuation of hedge accounting
(amendments to IAS 39)
January 1, 2014
IFRIC 21, ‘Levies’ January 1, 2014
Improvements to IFRSs 2010-2012 July 1, 2014
Improvements to IFRSs 2011-2013 July 1, 2014
Improvements to IFRSs 2012-2014 January 1, 2016
The Group is assessing the potential impact of the new standards, or amendments above and has not
yet been able to reliably estimate their impact on the consolidated financial statements.

119
4. SUMMARY OF SIGNIFICANT ACCOUNTING POLICIES
The principal accounting policies applied in the preparation of these consolidated financial statements
are set out below. These policies have been consistently applied to all the periods presented, unless
otherwise stated.
(1) Compliance statement
These consolidated financial statements are prepared by the Group in accordance with the “Rules
Governing the Preparation of Financial Statements by Securities Issuers” and the International
Financial Reporting Standards, International Accounting Standards, IFRIC Interpretations, and
SIC Interpretations as endorsed by the FSC (collectively referred herein as the “IFRSs”).
(2) Basis of preparation
A. Except for the following items, these consolidated financial statements have been prepared
under the historical cost convention:
a) Financial assets and financial liabilities (including derivative instruments) at fair value
through profit or loss.
b) Available-for-sale financial assets measured at fair value.
c) Defined benefit liabilities recognised based on the net amount of pension fund assets and
present value of defined benefit obligation.
B. The preparation of financial statements in compliance with IFRSs requires the use of certain
critical accounting estimates. It also requires management to exercise its judgment in the
process of applying the Group’s accounting policies. The areas involving a higher degree of
judgment or complexity, or areas where assumptions and estimates are significant to the
consolidated financial statements are disclosed in Note 5.
(3) Basis of consolidation
A. Basis for preparation of consolidated financial statements:
a) All subsidiaries are included in the Group’s consolidated financial statements. Subsidiaries
are all entities (including special purpose entities) over which the Group has the power to
govern the financial and operating policies. In general, control is presumed to exist when the
parent owns, directly or indirectly through subsidiaries, more than half of the voting power
of an entity. The existence and effect of potential voting rights that are currently exercisable
or convertible have been considered when assessing whether the Group controls another
entity. Subsidiaries are fully consolidated from the date on which control is transferred to the
Group. They are de-consolidated from the date that control ceases.
b) Inter-company transactions, balances and unrealised gains or losses on transactions between
companies within the Group are eliminated. Accounting policies of subsidiaries have been
adjusted where necessary to ensure consistency with the policies adopted by the Group.
c) Profit or loss and each component of other comprehensive income are attributed to the
owners of the parent and to the non-controlling interests. Total comprehensive income is
attributed to the owners of the parent and to the non-controlling interests even if this results
in the non-controlling interests having a deficit balance.

120
d) Changes in a parent’s ownership interest in a subsidiary that do not result in the parent losing
control of the subsidiary (transactions with non-controlling interests) are accounted for as
equity transactions, i.e. transactions with owners in their capacity as owners. Any difference
between the amount by which the non-controlling interests are adjusted and the fair value of
the consideration paid or received is recognised directly in equity.
e) When the Group loses control of a subsidiary, the Group remeasures any investment retained
in the former subsidiary at its fair value. Any difference between fair value and carrying
amount is recognised in profit or loss. All amounts previously recognised in other
comprehensive income in relation to the subsidiary are reclassified to profit or loss on the
same basis as would be required if the related assets or liabilities were disposed of. That is,
when the Group loses control of a subsidiary, all gains or losses previously recognised in
other comprehensive income in relation to the subsidiary should be reclassified from equity
to profit or loss, if such gains or losses would be reclassified to profit or loss when the
related assets or liabilities are disposed of.
B. Subsidiaries included in the consolidated financial statements:
Ownership (%)
Investor Subsidiary Main activitiesDecember31, 2015
December31, 2014 Description
MiTAC Holdings Corp. MiTAC International Corp. Computer and its peripherals:design, manufacture and sellcommunications products
100% 100%
MiTAC Holdings Corp. MiTAC Computing TechnologyCorp.
Computer and its peripherals:design, manufacture and sellcommunications products
100% 100%
MiTAC International Corp. Tsu Fung Investment Corp. General investments 100% 100%
MiTAC International Corp. Silver Star Developments Ltd. General investments 100% 100%
MiTAC International Corp. DLC Technology Corp. Research, development and relatedtechnical advisory services
100% 100% Note 4
MiTAC International Corp. Mio Technology Corp. Sale of communication products andrelated after-sale services
100% 100%
MiTAC International Corp. MiWell Technology Corp. Information/software services andretail business
100% 100%
MiTAC ComputingTechnology Corp.
MiTAC Technology UK Ltd. General investments 100% 100%
Silver Star DevelopmentsLtd.
System Glory International Ltd. General investments 100% 100%
Silver Star DevelopmentsLtd.
Pacific China Corp. General investments 100% 100%
Silver Star DevelopmentsLtd.
Magicmate Group Ltd. General investments - 100% Note 3
Silver Star DevelopmentsLtd.
Best Profit Ltd. General investments 100% 100%
Pacific China Corp. MiTAC Star Service Ltd. General investments 100% 100%
Pacific China Corp. Software Insights Ltd. General investments 100% 100%
Pacific China Corp. Start Well Technology Ltd. General investments 100% 100%
Pacific China Corp. Huge Extent Ltd. General investments 100% 100%
Best Profit Ltd. Booming Enterprises Inc. General investments - 100% Note 3
Best Profit Ltd. Top Sheen Enterprises Ltd. General investments 100% 100%
Best Profit Ltd. MiTAC Europe Ltd. Sale of communication products andrelated after-sale services
100% 100%
MiTAC Technology UKLtd.
Tyan Computer Corp. (USA) Sales of computer peripherals,hardware/ software and relatedproducts
100% 100% Note 1

121
Ownership (%)
Investor Subsidiary Main activitiesDecember31, 2015
December31, 2014 Description
MiTAC Technology UKLtd.
MiTAC Logistics Corp. Sale of computer peripherals,hardware/software and relatedproducts
100% 100% Note 1
MiTAC Technology UKLtd.
MiTAC Information Systems Corp. Assembling and sale of computerperipherals, hardware/software andrelated products
100% 100% Note 1
MiTAC Europe Ltd. Mio Technology GMBH Sale of communication products andrelated after-sale services
100% 100%
Silver Star DevelopmentsLtd.
MiTAC Japan Corp. Sale of communication products,computer peripherals,hardware/software and relatedproducts and related after-saleservices
100% 100%
Silver Star DevelopmentsLtd.
MiTAC Benelux N.V. Sale of communication products andrelated after-sale services
100% 100%
Silver Star DevelopmentsLtd.
MiTAC Pacific (H.K.) Ltd. Sale of computer peripherals,hardware/software and relatedproducts
100% 100%
Silver Star DevelopmentsLtd.
Mio International Ltd. Sale of communication andrelated products
100% 100%
Silver Star DevelopmentsLtd.
MiTAC Australia Pty Ltd. Sale of communication products andrelated after-sale services
100% 100%
Silver Star DevelopmentsLtd.
Navman Technology NZ Ltd. Sale of communication products andrelated after-sale services
- 100% Note 3
Start Well Technology Ltd. MiTAC Computer (Kunshan) Ltd. Manufacture of computers,computer peripherals,hardware/software and relatedproducts and sale of own-producedproducts
100% 100%
Start Well Technology Ltd MiTAC Investment Holding Ltd. Investment Holdings 100% - Note 5
Pacific China Corp. MiTAC Service (Shanghai) Co.,Ltd.
Testing, maintenance and display ofcomputer components and relatedtechnical advisory services andafter-sale services
100% 100%
MiTAC Star Service Ltd. MiTAC Computer (Shunde) Corp. Manufacture of computer frame,motherboard, interface card, display,power supply, keyboard, relatedmetal stamping parts and plasticparts and maintenance ofmotherboard
100% 100%
MiTAC Computer(Kunshan) Ltd.
MiTAC Telematics TechnologyCorp.
Sales of self-produced products andrelated after-sale services
100% 100%
MiTAC Computer(Kunshan) Ltd
MiTAC Information Systems(Kunshan) Co., Ltd.
Sales and manufacturing ofcomputer accessories, hardware,software and related services
100% - Note 5
Software Insights Ltd. MiTAC Research (Shanghai) Ltd. Research, development andmanufacture of computer software,sale of own-produced products andrelated technical advisory services
100% 100%
Star Well Technology Ltd. MiTAC Technology (Kunshan) Co.,Ltd.
Testing, maintenance and display ofcomputer components and relatedtechnical advisory services andafter-sale services
100% 100% Note 2
Mio International Ltd. Mio Technology Ltd. Sale of communication products andrelated after-sale services
100% 100%
Start Well Technology Ltd. MiTAC Logistic Service (Kunshan)Ltd.
Agency of freight transport, exportand import trading and warehousingservices.
100% 100% Note 2
Top Sheen Enterprises Ltd. MiTAC Digital Corp. Sale of communication products andrelated after-sale services
100% 100%

122
Ownership (%)
Investor Subsidiary Main activitiesDecember31, 2015
December31, 2014 Description
Start Well Technology Ltd. MiTAC Information TechnologyLtd.
After-sale maintenance, testing andtechnical advisory services ofcomputers, communication productsand consumer electronic products;establishment of customer servicecenters; customer data processing,analysis and integrated services andbusiness administration services
100% 100% Note 2
Software Insights Ltd. MiTAC Innovation (Kunshan) Ltd. Research and development ofcalculator, server, mobile phone,PDA and GPS, and technicaltransfer, technical advisory andtechnical services of related R&Dproducts
100% 100%
MiTAC Computer(Shunde) Corp.
Mitac Electronics (Foshan), Co.,Ltd.
Manufacture of computermainboard, motherboard andadapter card
100% 100%
Note 1: In the third quarter of 2014, MiTAC International Corp. has divested its share of
Foreground Technology Ltd. to MiTAC Computing Technology Corp., and Silver Star
Developments Ltd. has sold Sky Universe Enterprise Ltd. to MiTAC Computing
Technology Corp.. In order to simplify the investment structure, MiTAC Computer
Technology Corp. has liquidated its holding companies – Foreground Technology Ltd.
and Sky Universe Enterprise Ltd.. The pricing of share capital of the holding companies’
original subsidiaries - Tyan Computer Corp. (USA), MiTAC Logistics Corp. and
MiTAC Information Systems Corp. has been fixed by MiTAC Computing Technology
Corp. in order to acquire the share capital of MiTAC Technology UK Ltd.. Tyan
Computer Corp. (USA), MiTAC Logistics Corp. and MiTAC Information Systems
Corp. are now wholly-owned by MiTAC Technology UK Ltd.
Note 2: Bright Crown Management Ltd. and Dynamic Star Investments Ltd. were merged into
Start Well Technology Ltd. due to the reorganization in the fourth quarter of 2014.
MiTAC Technology (Kunshan) Ltd., MiTAC Logistic Service (Kunshan) Ltd. and
MiTAC Information Technology Ltd. are now wholly-owned by Start Well Technology
Ltd.
Note 3: Subsidiaries liquidated in 2015.
Note 4: Subsidiaries in the process of liquidation.
Note 5: Subsidiaries newly established in the fourth quarter of 2015.
C. Subsidiaries not included in the consolidated financial statements: None.
D. Adjustments for subsidiaries with different balance sheet dates: None.
E. Nature and extent of the restrictions on fund remittance from subsidiaries to the parent
company: None.
F. Subsidiaries that have non-controlling interests that are material to the Group: None.
(4) Foreign currency translation
Items included in the financial statements of each of the Group’s entities are measured using the
currency of the primary economic environment in which the entity operates (the “functional

123
currency”). The consolidated financial statements are presented in New Taiwan Dollars, which is
the Company’s functional and the Group’s presentation currency.
A. Foreign currency transactions and balances
(a)Foreign currency transactions are translated into the functional currency using the exchange
rates prevailing at the dates of the transactions or valuation where items are remeasured.
Foreign exchange gains and losses resulting from the settlement of such transactions are
recognised in profit or loss in the period in which they arise.
(b)Monetary assets and liabilities denominated in foreign currencies at the period end are
re-translated at the exchange rates prevailing at the balance sheet date. Exchange differences
arising upon re-translation at the balance sheet date are recognised in profit or loss.
(c)Non-monetary assets and liabilities denominated in foreign currencies held at fair value
through profit or loss are re-translated at the exchange rates prevailing at the balance sheet
date; their translation differences are recognised in profit or loss. Non-monetary assets and
liabilities denominated in foreign currencies held at fair value through other comprehensive
income are re-translated at the exchange rates prevailing at the balance sheet date; their
translation differences are recognised in other comprehensive income. However,
non-monetary assets and liabilities denominated in foreign currencies that are not measured
at fair value are translated using the historical exchange rates at the dates of the initial
transactions.
B. Translation of foreign operations
(a)The operating results and financial position of all the group entities and associates that have
a functional currency different from the presentation currency are translated into the
presentation currency as follows:
i. Assets and liabilities for each balance sheet presented are translated at the spot exchange
rate at the date of that balance sheet;
ii. Income and expenses for each statement of comprehensive income are translated at
average exchange rates of that period.
iii.All resulting exchange differences are recognised in other comprehensive income.
(b)When the foreign operation partially disposed of or sold is an associate, exchange
differences that were recorded in other comprehensive income are proportionately
reclassified to profit or loss as part of the gain or loss on sale. In addition, if the Group
retains partial interest in the former foreign associate after losing significant influence over
the former foreign associate, such transactions should be accounted for as disposal of all
interest in these foreign operations.
(c)When the foreign operation partially disposed of or sold is a subsidiary, cumulative
exchange differences that were recorded in other comprehensive income are proportionately
transferred to the non-controlling interest in this foreign operation. In addition, if the Group
retains partial interest in the former foreign subsidiary after losing control of the former

124
foreign subsidiary, such transactions should be accounted for as disposal of all interest in the
foreign operation.
(5) Classification of current and non-current items
A. Assets that meet one of the following criteria are classified as current assets; otherwise they are
classified as non-current assets:
(a)Assets arising from operating activities that are expected to be realised, or are intended to be
sold or consumed within the normal operating cycle;
(b)Assets held mainly for trading purposes;
(c)Assets that are expected to be realised within twelve months from the balance sheet date;
(d)Cash and cash equivalents, excluding restricted cash and cash equivalents and those that are
to be exchanged or used to pay off liabilities more than twelve months after the balance
sheet date.
B. Liabilities that meet one of the following criteria are classified as current liabilities; otherwise
they are classified as non-current liabilities:
(a)Liabilities that are expected to be paid off within the normal operating cycle;
(b)Liabilities arising mainly from trading activities;
(c)Liabilities that are to be paid off within twelve months from the balance sheet date;
(d)Liabilities for which the repayment date cannot be extended unconditionally to more than
twelve months after the balance sheet date. Terms of a liability that could, at the option of
the counterparty, result in its settlement by the issue of equity instruments do not affect its
classification.
(6) Cash equivalents
Cash equivalents refer to short-term, highly liquid investments that are readily convertible to
known amounts of cash and which are subject to an insignificant risk of changes in value. Time
deposits that meet the definition above and are held for the purpose of meeting short-term cash
commitments in operations are classified as cash equivalents.
(7) Financial assets and financial liabilities at fair value through profit or loss
A. Classifications
The main purpose for holding financial assets or liabilities at fair value through profit or loss is
for trading, and for selling or rebuying in a short time. Derivative financial instruments are used
to hedge and also use the same classification.
B. Recognition and assessment
Trading of financial assets at fair value through profit or loss is accounted for using trade date
accounting (the date that the Group promises to trade the assets). Financial assets are initially
recognised at fair value, and related trading costs are recognised as expenses for the period.
Financial assets are later measured at fair value, and the movement in fair value is recognised
in profit or loss for the period.

125
(8) Available-for-sale financial assets
A. Available-for-sale financial assets are non-derivatives that are either designated in this category
or not classified in any of the other categories.
B. On a regular way purchase or sale basis, available-for-sale financial assets are recognised and
derecognised using trade date accounting.
C. Available-for-sale financial assets are initially recognised at fair value plus transaction costs.
These financial assets are subsequently remeasured and stated at fair value, and any changes in
the fair value of these financial assets are recognised in other comprehensive income.
Investments in equity instruments that do not have a quoted market price in an active market
and whose fair value cannot be reliably measured or derivatives that are linked to and must be
settled by delivery of such unquoted equity instruments are presented in ‘financial assets
measured at cost’.
(9) Notes, accounts, and other receivables
Accounts receivable are loans and receivables originated by the entity. They are created by the
entity by selling goods or providing services to customers in the ordinary course of business.
Accounts receivable are initially recognised at fair value and subsequently measured at amortised
cost using the effective interest method, less provision for impairment. However, short-term
accounts receivable without bearing interest are subsequently measured at initial invoice amount
as effect of discounting is immaterial.
(10) Impairment of financial assets
A. The Group assesses at each balance sheet date whether there is objective evidence that a
financial asset or a group of financial assets is impaired as a result of one or more events that
occurred after the initial recognition of the asset (a ‘loss event’) and that loss event (or events)
has an impact on the estimated future cash flows of the financial asset or group of financial
assets that can be reliably estimated.
B. The criteria that the Group uses to determine whether there is objective evidence of an
impairment loss is as follows:
(a) Significant financial difficulty of the issuer or debtor;
(b) A breach of contract, such as a default or delinquency in interest or principal payments;
(c) The Group, for economic or legal reasons relating to the borrower’s financial difficulty,
granted the borrower a concession that a lender would not otherwise consider;
(d) It becomes probable that the borrower will enter bankruptcy or other financial
eorganisation;
(e) The disappearance of an active market for that financial asset because of financial
difficulties;

126
(f) Observable data indicating that there is a measurable decrease in the estimated future cash
flows from a group of financial assets since the initial recognition of those assets, although
the decrease cannot yet be identified with the individual financial asset in the group,
including adverse changes in the payment status of borrowers in the group or national or
local economic conditions that correlate with defaults on the assets in the group;
(g) Information about significant changes with an adverse effect that have taken place in the
technology, market, economic or legal environment in which the issuer operates, and
indicates that the cost of the investment in the equity instrument may not be recovered;
(h) A significant or prolonged decline in the fair value of an investment in an equity
instrument below its cost.
C. When the Group assesses that there has been objective evidence of impairment and an
impairment loss has occurred, accounting for impairment is made as follows according to the
category of financial assets:
(a) Financial assets measured at amortised cost
The amount of the impairment loss is measured as the difference between the asset’s
carrying amount and the present value of estimated future cash flows discounted at the
financial asset’s original effective interest rate, and is recognised in profit or loss. If, in a
subsequent period, the amount of the impairment loss decreases and the decrease can be
related objectively to an event occurring after the impairment loss was recognised, the
previously recognised impairment loss is reversed through profit or loss to the extent that
the carrying amount of the asset does not exceed its amortised cost that would have been
at the date of reversal had the impairment loss not been recognised previously.
Impairment loss is recognised and reversed by adjusting the carrying amount of the asset
through the use of an impairment allowance account.
(b) Financial assets measured at cost
The amount of the impairment loss is measured as the difference between the asset’s
carrying amount and the present value of estimated future cash flows discounted at
current market return rate of similar financial asset, and is recognised in profit or loss.
Impairment loss recognised for this category shall not be reversed subsequently.
Impairment loss is recognised by adjusting the carrying amount of the asset through the
use of an impairment allowance account.
(c) Available-for-sale financial assets
The amount of the impairment loss is measured as the difference between the asset’s
acquisition cost (less any principal repayment and amortisation) and current fair value,
less any impairment loss on that financial asset previously recognised in profit or loss,
and is reclassified from ‘other comprehensive income’ to ‘profit or loss’. If, in a
subsequent period, the fair value of an investment in a debt instrument increases, and the
increase can be related objectively to an event occurring after the impairment loss was
recognised, then such impairment loss is reversed through profit or loss. Impairment loss
of an investment in an equity instrument recognised in profit or loss shall not be reversed
through profit or loss. Impairment loss is recognised and reversed by adjusting the
carrying amount of the asset through the use of an impairment allowance account.

127
(11) Derecognition of financial assets
The Group derecognises a financial asset when the contractual rights to receive the cash flows
from the financial asset expire.
The Group derecognises a financial asset when one of the following conditions is met:
A. The contractual rights of the cash flows from the financial asset expire.
B. The contractual rights to receive cash flows of the financial asset have been transferred and
the Group has transferred substantially all risks and rewards of ownership of the financial
asset.
C. The contractual rights to receive cash flows of the financial asset have been transferred;
however, the Group has not retained control of the financial asset.
(12) Inventories
A. The perpetual inventory system is adopted for inventory recognition. Inventories are stated at
standard cost, and adjusted at the end of reporting period to approximate them to the cost
calculated on a weighted average method.
B. At the end of period, inventories are evaluated at the lower of cost or net realisable value, and
the individual item approach is used in the comparison of cost and net realisable value. The
calculation of net realisable value should be based on the estimated selling price in the normal
course of business, net of estimated costs of completion and estimated selling expenses.
(13) Investments accounted for using equity method / associates
A. Associates are all entities over which the Group has significant influence but not control. In
general, it is presumed that the investor has significant influence, if an investor holds, directly
or indirectly 20 percent or more of the voting power of the investee. Investments in associates
are accounted for using the equity method and are initially recognised at cost.
B. The Group’s share of its associates’ post-acquisition profits or losses is recognised in profit or
loss, and its share of post-acquisition movements in other comprehensive income is
recognised in other comprehensive income. When the Group’s share of losses in an associate
equals or exceeds its interest in the associate, including any other unsecured receivables, the
Group does not recognise further losses, unless it has incurred legal or constructive
obligations or made payments on behalf of the associate.
C. When changes in an associate’s equity that are not recognised in profit or loss or other
comprehensive income of the associate and such changes not affecting the Group’s ownership
percentage of the associate, the Group recognises change in ownership interests in the
associate in ‘capital surplus’ in proportion to its ownership.
D. Unrealised gains on transactions between the Group and its associates are eliminated to the
extent of the Group’s interest in the associates. Unrealised losses are also eliminated unless
the transaction provides evidence of an impairment of the asset transferred. Accounting
policies of associates have been adjusted where necessary to ensure consistency with the
policies adopted by the Group.

128
E. In the case that an associate issues new shares and the Group does not subscribe or acquire
new shares proportionately, which results in a change in the Group’s ownership percentage of
the associate but maintains significant influence on the associate, then ‘capital surplus’ and
‘investments accounted for under the equity method’ shall be adjusted for the increase or
decrease. If the above condition causes a decrease in the Group’s ownership percentage of the
associate, in addition to the above adjustment, the amounts previously recognised in other
comprehensive income in relation to the associate are reclassified to profit or loss
proportionately on the same basis as would be required if the relevant assets or liabilities were
disposed of.
F. When the Group disposes its investment in an associate and loses significant influence over
this associate, the amounts previously recognised in other comprehensive income in relation
to the associate, are reclassified to profit or loss, on the same basis as would be required if the
relevant assets or liabilities were disposed of. If it retains significant influence over this
associate, then the amounts previously recognised in other comprehensive income in relation
to the associate are reclassified to profit or loss proportionately in accordance with the
aforementioned approach.
G. When the Group disposes its investment in an associate and loses significant influence over
this associate, the amounts previously recognised as capital surplus in relation to the associate
are transferred to profit or loss. If it retains significant influence over this associate, then the
amounts previously recognised as capital surplus in relation to the associate are transferred to
profit or loss proportionately.
(14) Property, plant and equipment
A. Property, plant and equipment are initially recorded at cost. Borrowing costs incurred during
the construction period are capitalised.
B. Subsequent costs are included in the asset’s carrying amount or recognised as a separate asset,
as appropriate, only when it is probable that future economic benefits associated with the item
will flow to the Group and the cost of the item can be measured reliably. The carrying amount
of discarded assets is derecognised when critical repairs are incurred, and other repair
expenses are charged to profit or loss for the period when they incur.
C. Land is not depreciated. Other property, plant and equipment apply cost model and are
depreciated using the straight-line method to allocate their cost over their estimated useful
lives. If each part of an item of property, plant, and equipment with a cost that is significant in
relation to the total cost of the item must be depreciated separately.

129
D. The assets’ residual values, useful lives and depreciation methods are reviewed, and adjusted
if appropriate, at each balance sheet date. If expectations for the assets’ residual values and
useful lives differ from previous estimates or the patterns of consumption of the assets’ future
economic benefits embodied in the assets have changed significantly, any change is
accounted for as a change in estimate under IAS 8, ‘Accounting Policies, Changes in
Accounting Estimates and Errors’, from the date of the change. The estimated useful lives of
property, plant and equipment are as follows:
Buildings (included utility equipment) 3 ~ 55 years
Machinery and equipment 5 years
Transportation equipment 5 years
Other equipment 3 ~ 6 years
E. The Group has recognised title of assets with significant risks and compensation not yet
transferred and leases to lessees as operating leases. Rental income and expenses of operating
leases are recognised over the leasing period on a straight line basis.
(15) Investment property
An investment property is stated initially at its cost and measured subsequently using the cost
model. Except for land, investment property is depreciated on a straight-line basis over its
estimated useful life of 3 ~ 56 years.
(16) Intangible assets
Separately acquired patents are stated at historical cost. Patents and other intangible assets
(including customers relationship and non-compete clause) obtained from business combination
are recognised at fair value at the acquisition date. Basic capitalisation of computer software use
right is based on the acquisition cost and cost incurred to make ready the use of the specific
software. The estimated useful life of intangible assets are amortised on a straight line basis:
Computer software In accordance with contracts or 5 years
Patent and other intangible assets 5 ~ 10 years
(17) Impairment of non-financial assets
The Group assesses at each balance sheet date the recoverable amounts of those assets where
there is an indication that they are impaired. An impairment loss is recognised for the amount by
which the asset’s carrying amount exceeds its recoverable amount. The recoverable amount is the
higher of an asset’s fair value less costs to sell or value in use. When the circumstances or reasons
for recognising impairment loss for an asset in prior years no longer exist or diminish, the
impairment loss is reversed. The increased carrying amount due to reversal should not be more
than what the depreciated or amortised historical cost would have been if the impairment had not
been recognised.

130
(18) Borrowings
Borrowings are recognised initially at fair value, net of transaction costs incurred. Borrowings are
subsequently stated at amortised cost; any difference between the proceeds (net of transaction
costs) and the redemption value is recognised in profit or loss over the period of the borrowings
using the effective interest method.
(19) Accounts payable
Notes and accounts payable are obligations to pay for goods or services that have been acquired in
the ordinary course of business from suppliers. They are recognised initially at fair value and
subsequently measured at amortised cost using the effective interest method. However, short-term
accounts payable without bearing interest are subsequently measured at initial invoice amount as
effect of discounting is immaterial.
(20) Derecognition of financial liabilities
A financial liability is derecognised when the obligation under the liability specified in the
contract is discharged or cancelled or expires.
(21) Offsetting financial instruments
Financial assets and liabilities are offset and reported in the net amount in the balance sheet when
there is a legally enforceable right to offset the recognised amounts and there is an intention to
settle on a net basis or realise the asset and settle the liability simultaneously.
(22) Provisions
Provisions are recognised when the Group has a present legal or constructive obligation as a result
of past events, and it is probable that an outflow of economic resources will be required to settle
the obligation and the amount of the obligation can be reliably estimated. Provisions are measured
at the present value of the expenditures expected to be required to settle the obligation on the
balance sheet date. Provisions are not recognised for future operating losses.
(23) Employee benefits
A. Short-term employee benefits
Short-term employee benefits are measured at the undiscounted amount of the benefits
expected to be paid in respect of service rendered by employees in a period and should be
recognised as expenses in that period when the employees render service.
B. Pensions
(a)Defined contribution plans
For defined contribution plans, the contributions are recognised as pension expenses when
they are due on an accrual basis. Prepaid contributions are recognised as an asset to the
extent of a cash refund or a reduction in the future payments.

131
(b)Defined benefit plans
i. Net obligation under a defined benefit plan is defined as the present value of an amount of
pension benefits that employees will receive on retirement for their services with the
Group in current period or prior periods. The liability recognised in the balance sheet in
respect of defined benefit pension plans is the present value of the defined benefit
obligation at the balance sheet date less the fair value of plan assets, together with
adjustments for unrecognised past service costs. The defined benefit net obligation is
calculated annually by independent actuaries using the projected unit credit method. The
rate used to discount is determined by using interest rates of high-quality corporate bonds
that are denominated in the currency in which the benefits will be paid, and that have
terms to maturity approximating to the terms of the related pension liability; when there
is no deep market in high-quality corporate bonds, the Group uses interest rates of
government bonds (at the balance sheet date) instead.
ii. Actuarial gains and losses arising on defined benefit plans are recognised in other
comprehensive income in the period in which they arise.
C. Employees’ and directors’ and supervisors’ remuneration
Employees’ and directors’ and supervisors’ remuneration are recognised as expenses and
liabilities, provided that such recognition is required under legal obligation or constructive
obligation and those amounts can be reliably estimated. Any difference between the resolved
amounts and the subsequently actual distributed amounts is accounted for as changes in
estimates. If employee compensation is distributed by shares, the Group calculates the numbers
of shares based on the closing price at the previous day of the board meeting resolution.
(24) Employee share-based payment
For the equity-settled share-based payment arrangements, the employee services received are
measured at the fair value of the equity instruments granted at the grant date, and are recognised
as compensation cost over the vesting period, with a corresponding adjustment to equity. The fair
value of the equity instruments granted shall reflect the impact of market vesting conditions and
non-market vesting conditions. Compensation cost is subject to adjustment based on the service
conditions that are expected to be satisfied and the estimates of the number of equity instruments
that are expected to vest under the non-market vesting conditions at each balance sheet date. And
ultimately, the amount of compensation cost recognised is based on the number of equity
instruments that eventually vest.
(25) Income tax
A. The tax expense for the period comprises current and deferred tax. Tax is recognised in profit
or loss, except to the extent that it relates to items recognised in other comprehensive income
or items recognised directly in equity.

132
B. The current income tax expense is calculated on the basis of the tax laws enacted or
substantively enacted at the balance sheet date in the countries where the Company and its
subsidiaries operate and generate taxable income. Management periodically evaluates positions
taken in tax returns with respect to situations in accordance with applicable tax regulations. It
establishes provisions where appropriate based on the amounts expected to be paid to the tax
authorities. An additional 10% tax is levied on the unappropriated retained earnings and is
recorded as income tax expense in the year the stockholders resolve to retain the earnings.
C. Deferred income tax is recognised, using the balance sheet liability method, on temporary
differences arising between the tax bases of assets and liabilities and their carrying amounts in
the consolidated balance sheet. However, the deferred income tax is not accounted for if it
arises from initial recognition of goodwill or of an asset or liability in a transaction other than a
business combination that at the time of the transaction affects neither accounting nor taxable
profit or loss. Deferred income tax is provided on temporary differences arising on investments
in subsidiaries, except where the timing of the reversal of the temporary difference is
controlled by the Group and it is probable that the temporary difference will not reverse in the
foreseeable future. Deferred income tax is determined using tax rates (and laws) that have been
enacted or substantially enacted by the balance sheet date and are expected to apply when the
related deferred income tax asset is realised or the deferred income tax liability is settled.
D. Deferred income tax assets are recognised only to the extent that it is probable that future
taxable profit will be available against which the temporary differences can be utilised. At each
balance sheet date, unrecognised and recognised deferred income tax assets are reassessed.
E. Current income tax assets and liabilities are offset and the net amount reported in the balance
sheet when there is a legally enforceable right to offset the recognised amounts and there is an
intention to settle on a net basis or realise the asset and settle the liability simultaneously.
Deferred income tax assets and liabilities are offset on the balance sheet when the entity has
the legally enforceable right to offset current tax assets against current tax liabilities and they
are levied by the same taxation authority on either the same entity or different entities that
intend to settle on a net basis or realise the asset and settle the liability simultaneously.
F. A deferred tax asset shall be recognised for the carry forward of unused tax credits resulting
from research and development expenditures to the extent that it is possible that future taxable
profit will be available against which the unused tax credits can be utilised.
(26) Share capital
A. Ordinary shares are classified as equity. Incremental costs directly attributable to the issue of
new shares or stock options are shown in equity as a deduction, net of tax, from the proceeds.
B. Where the Company repurchases the Company’s equity share capital that has been issued, the
consideration paid, including any directly attributable incremental costs (net of income taxes)
is deducted from equity attributable to the Company’s equity holders. Where such shares are
subsequently reissued, the difference between their book value and any consideration received,
net of any directly attributable incremental transaction costs and the related income tax effects,
is included in equity attributable to the Company’s equity holders.

133
(27) Dividends
Dividends are recorded in the Company’s financial statements in the period in which they are
approved by the Company’s shareholders. Cash dividends are recorded as liabilities; stock
dividends are recorded as stock dividends to be distributed and are reclassified to ordinary shares
on the effective date of new shares issuance.
(28) Revenue recognition
A. The Group designs, manufactures and sells computer and its peripherals, communication and
related products. Revenue is measured at the fair value of the consideration received or
receivable taking into account of value-added tax, returns, rebates and discounts for the sale of
goods to external customers in the ordinary course of the Group’s activities. Revenue arising
from the sales of goods should be recognised when the Group has delivered the goods to the
customer, the amount of sales revenue can be measured reliably and it is probable that the
future economic benefits associated with the transaction will flow to the entity. The delivery of
goods is completed when the significant risks and rewards of ownership have been transferred
to the customer, the Group retains neither continuing managerial involvement to the degree
usually associated with ownership nor effective control over the goods sold, and the customer
has accepted the goods based on the sales contract or there is objective evidence showing that
all acceptance provisions have been satisfied.
B. The Group offers customers volume discounts and right of return for defective products. The
Group estimates appropriate discounts and returns based on regular way purchases or sales.
Provisions for such liabilities are recorded when the sales are recognised.
(29) Business combinations and organisation restructuring
A. The Group uses the acquisition method to account for business combinations. The
consideration transferred for an acquisition is measured as the fair value of the assets
transferred, liabilities incurred or assumed and equity instruments issued at the acquisition date,
plus the fair value of any assets and liabilities resulting from a contingent consideration
arrangement. All acquisition-related costs are expensed as incurred. Identifiable assets
acquired and liabilities and contingent liabilities assumed in a business combination are
measured initially at their fair values at the acquisition date. There is a choice on an
acquisition-by-acquisition basis to measure the non-controlling interest in the acquiree either at
fair value or at the non-controlling interest’s proportionate share of the acquiree’s identifiable
net assets.
B. If the total of the fair values of the consideration of acquisition and any non-controlling
interest in the acquiree as well as the previous equity interest in the acquiree is higher than the
fair value of the Group’s identifiable assets acquired and obligations borne, goodwill is
recognised at the acquisition-date. If the fair value of the Group’s identifiable assets acquired
and obligations borne is higher than the total of the fair values of the consideration of
acquisition, non-controlling interest in the acquiree, as well as previous equity interest in the
acquire, the difference is recognised in profit or loss for the period at the acquisition date.

134
C. The newly established investment holding company through share swap is jointly controlled
under business combination. Under regulations of competent authority, the investment holding
company is recorded at the carrying value and is included in the consolidated financial
statements at the date of establishment.
(30) Operating segments
Operating segments are reported in a manner consistent with the internal reporting provided to the
chief operating decision-maker,who is responsible for allocating resources and assessing
performance of the operating segments.
5. CRITICAL ACCOUNTING JUDGEMENTS, ESTIMATES AND KEY SOURCES OF
ASSUMPTION UNCERTAINTY
A.The preparation of these consolidated financial statements requires management to make critical
judgements in applying the Group’s accounting policies and make critical assumptions and estimates
concerning future events. Assumptions and estimates may differ from the actual results and are
continually evaluated and adjusted based on historical experience and other factors. Such assumptions
and estimates have a significant risk of causing a material adjustment to the carrying amounts of assets
and liabilities within the next financial year; and the related information is addressed below:
(1) Critical judgements in applying the Group’s accounting policies
A. Financial assets - impairment of equity investments
The Group follows the guidance of IAS 39 to determine whether a financial asset—equity
investment is impaired. This determination requires significant judgement. In making this
judgement, the Group evaluates, among other factors, the duration and extent to which the fair
value of an equity investment is less than its cost and the financial health of and short-term
business outlook for the investee, including factors such as industry and sector performance,
changes in technology and operational and financing cash flow.
B. Financial assets—fair value measurement of unlisted stocks without active market
The Group’s unlisted stocks that are not traded in an active market, the fair value of the ones
listed under ‘financial assets measured at cost’ cannot be measured reliably since no sufficient
industry information of companies similar to those unlisted stocks’ financial information can be
obtained.
(2) Critical accounting estimates and assumptions
A. Impairment assessment of tangible and intangible assets (excluding goodwill)
The Group assesses impairment based on its subjective judgement and determines the separate
cash flows of a specific group of assets, useful lives of assets and the future possible income and
expenses arising from the assets depending on how assets are utilised and industrial
characteristics. Any changes of economic circumstances or estimates due to the change of Group
strategy might cause material impairment on assets in the future.

135
B. Realisability of deferred income tax assets
Deferred income tax assets are recognised only to the extent that it is probable that future taxable
profit will be available against which the deductible temporary differences can be utilised.
Assessment of the realisability of deferred income tax assets involves critical accounting
judgements and estimates, including the assumptions of expected future sales revenue growth
rate and profit rate, tax exempt duration, available tax credits, tax planning, etc. Any variations in
global economic environment, industrial environment, and laws and regulations might cause
material adjustments to deferred income tax assets.
C. Evaluation of inventories
As inventories are stated at the lower of cost and net realizable value, the Group must determine
the net realizable value of inventories on balance sheet date using judgements and estimates. Due
to the rapid technology innovation, the Group evaluates the amounts of normal inventory
comsumption, obsolete inventories or inventories without market selling value on balance sheet
date, and writes down the cost of inventories to the net realizable value. Therefore, there might
be material changes to the evaluation.
6. DETAILS OF SIGNIFICANT ACCOUNTS
(1) Cash and cash equivalents
December 31, 2015 December 31, 2014
Cash:
Cash on hand and petty cash (revolvingfunds)
$ 1,128 $ 1,242
Checking accounts and demand deposits 2,878,492 2,965,162
Cash equivalents:
Time deposits 4,580,204 3,952,096
Structured deposits - 178,220
Repurchase bonds 1,326,963 1,397,605
Total $ 8,786,787 $ 8,494,325
A. The Group transacts with a variety of financial institutions all with high credit quality todisperse credit risk, so it expects that the probability of counterparty default is remote.
B. The Group’s cash and cash equivalents pledged to others as collateral are described in Note 8.
(2) Financial assets at fair value through profit or loss
Items December 31, 2015 December 31, 2014
Current items:
Financial assets held for trading
Non-hedging derivatives $ 5,711 $ 29,460

136
A. The Group recognised net loss of $23,748 and net gain of $15,296 on financial assets designatedas at fair value through profit or loss for the years ended December 31, 2015 and 2014,respectively.
B. The non-hedging derivative instrument transactions and contract information are as follows:December 31, 2015
Financial Instrument ItemNotional Amount
(in thousands)Fair Market Value
(in thousands)
MiTAC International Corp.
Forward foreign exchange - Sell Advance booking USD to buy NTD USD 4,000 NTD 192
″ Advance booking EUR to buy USD EUR 4,447 NTD 1,109
″ Advance booking AUD to buy USD AUD 6,514 NTD 647
Forward foreign exchange - Buy Advance booking JPY to sell USD JPY 65,000 NTD 70
MiTAC Digital Corp.
Forward foreign exchange - Sell Advance booking CAD to buy USD CAD 2,350 USD 85
MiTAC Computing Technology Corp.
Forward foreign exchange - Sell Advance booking USD to buy NTD USD 5,000 NTD 254
Silver Star Developments Ltd.
Forward foreign exchange - Sell Advance booking CNY to buy USD USD 15,000 USD 19
MiTAC Australia Pty Ltd.
Forward foreign exchange - Sell Advance booking NZD to buy USD NZD 235 USD -
December 31, 2014
Financial Instrument ItemNotional Amount
(in thousands)Fair Market Value
(in thousands)
MiTAC International Corp.
Forward foreign exchange – Sell Advance booking USD to buy CNY USD 1,000 NTD 121
″ Advance booking EUR to buy USD EUR 6,763 NTD 8,638
″ Advance booking AUD to buy USD AUD 8,985 NTD 12,424
″ Advance booking GBP to buy USD GBP 250 NTD 16
MiTAC Digital Corp.
Forward foreign exchange – Sell Advance booking CAD to buy USD CAD 400 USD 11
MiTAC Europe Ltd.
Forward foreign exchange – Buy Advance booking USD to sell EUR USD 6,000 USD 150
MiTAC Computer Technology Corp.
Forward foreign exchange – Buy Advance booking USD to sell NTD USD 2,000 NTD 2,427
Forward foreign exchange – Sell Advance booking JPY to buy USD JPY 80,000 NTD 472
Silver Star Developments Ltd.
Forward foreign exchange – Sell Advance booking EUR to buy USD EUR 1,200 USD 8
C. The Group has no financial assets at fair value through profit or loss pledged to others.

137
(3) Available-for-sale financial assets
Items December 31, 2015 December 31, 2014
Current items:
Listed stocks $ 566,624 $ 577,053
Beneficiary certificates 142,539 101,880
Subtotal 709,163 678,933
Adjustments of available-for-sale financialassets
( 113,337) ( 72,537)
Total $ 595,826 $ 606,396
Non-current items:
Listed stocks $ 415,500 $ 412,941
Unlisted stocks 174,481 200,397
Subtotal 589,981 613,338
Adjustments of available-for-sale financialassets
130,808 274,028
Total $ 720,789 $ 887,366
A. The Group recognized ($207,595) and ($77,594) in other comprehensive income (loss) for fairvalue change and reclassified ($22,655) and $17,092 from equity to profit or loss for the yearsended December 31, 2015 and 2014, respectively.
B. The Group’s certain available-for-sale financial assets continuously generate loss, as a result,the fair value declined significantly below its initial investment cost. The Group, thereforerecognized impairment loss of $25,902 and $104,593 on the financial assets for the years endedDecember 31, 2015 and 2014, respectively.
(4) Financial assets carried at cost
Items December 31, 2015 December 31, 2014
Non-current items:
Unlisted stocks $ 1,257,818 $ 1,229,831
Accumulated impairment-Financial assets
carried at cost ( 114,769) ( 112,189)
Total $ 1,143,049 $ 1,117,642
A. According to the Group’s intention, its investment in unlisted stocks should be classified asavailable-for-sale financial assets. However, as the stocks are not traded in active market, andno sufficient industry information of companies similar to the unlisted stocks and relatedfinancial information on the investee can be obtained, the fair value of the investment cannot bemeasured reliably. The Group classified those stocks as “financial assets carried at cost”.
B. As of December 31, 2015 and 2014, no financial assets carried at cost held by the Group werepledged to others.

138
(5) Accounts receivable
December 31, 2015 December 31, 2014
Third parties $ 5,812,800 $ 7,962,940
Less: Allowance for sales returns and discounts ( 248,372) ( 358,389)
Allowance for bad debts ( 75,073) ( 77,898)
5,489,355 7,526,653
Related parties 253,354 231,167
$ 5,742,709 $ 7,757,820
A. The ageing analysis of accounts receivable that were past due but not impaired is as follows:
December 31, 2015 December 31, 2014
1 to 90 days $ 353,478 $ 292,024
91 to 180 days 13,527 12,615
Over 180 days 19,876 162
$ 386,881 $ 304,801
B. Movements on the Group’s provision for impairment of accounts receivable are as follows:
For the year endedDecember 31, 2015
For the year endedDecember 31, 2014
At January 1 $ 77,898 $ 139,584
Amount recognized (reversed) during theperiod
6,419 ( 26,594)
Write-offs and effect from exchange rateduring the period ( 9,244) ( 35,092)
At December 31 $ 75,073 $ 77,898
C. The credit quality of accounts receivable that were neither past due nor impaired was in thefollowing categories based on the Group’s Credit Quality Control Policy:
December 31, 2015 December 31, 2014
Group 1 $ 3,857,448 $ 6,050,064
Group 2 1,821,825 1,839,242
$ 5,679,273 $ 7,889,306
Group 1 - Medium-low credit risk accounts receivable: enterprises with ideal operations, highfinancial transparency, and approved by the headquarters’ credit control manager.
Group 2 - Ordinary credit risk accounts receivable: customers other than medium-low creditrisk accounts receivable.
(6) Inventories
December 31, 2015 December 31, 2014
Raw materials $ 3,822,786 $ 4,138,219
Work in process 436,850 868,856
Finished goods 2,012,373 2,182,674
$ 6,272,009 $ 7,189,749

139
Expense and loss incurred on inventories:
For the year endedDecember 31, 2015
For the year endedDecember 31, 2014
Cost of goods sold $ 44,288,252 $ 36,224,644
Loss on market value decline 182,649 131,792
$ 44,470,901 $ 36,356,436
(7) Other financial assets
December 31, 2015 December 31, 2014
Current:
Time deposits – over three months $ - $ 1,152,423
Pledged deposits 10,699 29,189
$ 10,699 $ 1,181,612
A. The Group recognize with a variety of financial institutions all with high credit quality todisperse credit risk, so it expects that the probability of counterparty default is remote.
B. Information about other financial assets that were pledged to others as collateral are describedin Note 8.
(8) Investments accounted for under the equity method
A.Investee company December 31, 2015 December 31, 2014
Getac Technology Corp. $ 4,512,388 $ 4,377,108
3 Probe Technology Co., Ltd. 10,077 8,701
Lian Jie Investment Co., Ltd. 122,040 149,591
Lian Jie II Investment Co., Ltd. 32,474 -
Shen-Tong Construction & DevelopmentCo., Ltd. 83,018 83,190
Loyalty Founder Enterprise Co., Ltd. 381,096 367,519
Green Share Corp. 8,774 7,527
Harbinger II (BVI) VentureCapital Corp. 27,148 148,928
Mainpower International Ltd. 199,908 200,978
Synnex Corp. 8,287,761 7,373,085
Suzhou MiTAC Preclusion TechnologyCo., Ltd. 290,817 291,226
Harbinger Ruyi Venture Ltd. 36,010 35,283
Harbinger Ruyi II Venture Ltd. 32,830 -
$ 14,024,341 $ 13,043,136

140
B. The Group’s recognized share of profit from associates accounted for under the equity method
for the years ended December 31, 2015 and 2014 were $1,380,981 and $1,213,705, respectively.
C. The basic information of the associates that are material to the Group is as follows:
Company
name
Principal place
of business Shareholding ratio Nature of relationship
Methods of
measurement
December 31, 2015 December 31, 2014
Getac
Technology
Corp.
Taiwan 32.90% 32.71% Owned over 20% ownership Equity method
Synnex
Corp.
USA 13.99% 14.07% Significant influence Equity method
D. The summarized financial information of the associates that are material to the Group is as
below:
Balance sheet
Getac Technology Corp.
December 31, 2015 December 31, 2014
Current assets $ 14,429,503 $ 15,362,162
Non-current assets 8,752,458 9,176,539
Current liabilities ( 7,359,061) ( 8,930,858)
Non-current liabilities ( 805,505) ( 1,291,455)
Total net assets $ 15,017,395 $ 14,316,388
Share in associate’s net assets $ 4,512,388 $ 4,377,108
Synnex Corp.
December 31, 2015 December 31, 2014
Current assets $ 118,474,321 $ 122,348,740
Non-current assets 27,508,635 26,887,143
Current liabilities ( 62,963,504) ( 86,142,723)
Non-current liabilities ( 23,834,003) ( 10,676,430)
Total net assets $ 59,185,449 $ 52,416,730
Share in associate’s net assets $ 8,287,761 $ 7,373,085
Statement of comprehensive income
Getac Technology Corp.
For the year ended
December 31, 2015
For the year ended
December 31, 2014
Revenue $ 18,334,953 $ 16,291,585
Profit for the period from continuing
operations $ 1,428,070 $ 851,952
Other comprehensive income, net of tax ( 147,464) 495,519
Total comprehensive income $ 1,280,606 $ 1,347,471
Dividends received from associates $ 247,516 $ 190,397

141
Synnex Corp.
For the year ended
December 31, 2015
For the year ended
December 31, 2014
Revenue $ 423,325,774 $ 419,416,387
Profit for the period from continuing
operations $ 6,539,520 $ 5,252,308
Other comprehensive loss, net of tax ( 1,542,722) ( 781,762)
Total comprehensive income $ 4,996,798 $ 4,470,546
Dividends received from associates $ 101,314 $ 21,031
E. The carrying amount of the Group’s interests in all individually immaterial associates and the
Group’s share of the operating results are summarized below:
As of December 31, 2015 and 2014, the carrying amount of the Group’s individually immaterial
associates amounted to $1,224,192 and $1,292,943, respectively.
For the year ended
December 31, 2015
For the year ended
December 31, 2014
Profit or loss for the period from continuing
operations $ 114,779 $ 361,396
Other comprehensive loss-net of tax ( 132,736) ( 8,539)
Total comprehensive (loss) income ($ 17,957) $ 352,857
F. The fair value of the Group’s material associates with quoted market prices is as follows:
December 31, 2015 December 31, 2014
Getac Technology Corp. $ 3,817,459 $ 3,160,589
Synnex Corp. 16,388,542 13,733,754
$ 20,206,001 $ 16,894,343
G. The Group holds 13.99% ownership in Synnex Corp. but has significant influence over Synnex
Corp. as the Group is the largest shareholder of Synnex Corp. and the Company’s chairman
Feng Chiang Miau serves as this company’s honorary chairman. In addition, the Group holds
14.76% ownership in Mainpower International Ltd. and the Group serves as this company’s
corporate supervisor.H. Synnex Corp.’s fiscal year ends on November 30, thus the Group uses the financial information
on November 30 as the basis for the preparation of annual consolidated financial statements;other associates’ fiscal year all end on December 31.

142
(9) Property, plant and equipment
Land Buildings Machinery
Computer andcommunication
equipmentTransportation
equipmentOffice
equipmentLeasehold
improvementsMolding
equipmentOther
equipment
Constructionin progress
and equipmentfor inspection Total
At January 1, 2015
Cost $ 1,122,325 $ 5,261,351 $ 2,409,367 $ 256,675 $ 68,521 $ 791,913 $ 53,855 $ 168,838 $ 715,442 $ 24,305 $10,872,592
Accumulated depreciationand impairment - ( 1,918,523 ) ( 2,205,775 ) ( 184,524 ) ( 39,309 ) ( 650,290) ( 46,110 ) ( 68,890 ) ( 547,857 ) - ( 5,661,278 )
$ 1,122,325 $ 3,342,828 $ 203,592 $ 72,151 $ 29,212 $ 141,623 $ 7,745 $ 99,948 $ 167,585 $ 24,305 $ 5,211,314
2015
At January 1 $ 1,122,325 $ 3,342,828 $ 203,592 $ 72,151 $ 29,212 $ 141,623 $ 7,745 $ 99,948 $ 167,585 $ 24,305 $ 5,211,314
Additions - 14,965 109,663 25,412 8,009 41,491 6,270 66,389 103,103 429,648 804,950
Disposals - ( 129 ) ( 1,820 ) ( 146 ) ( 812 ) ( 862) - - 291 - ( 3,478 )
Reclassifications - 5,301 ( 5,092 ) 1,268 - - - - - ( 1,477 ) -
Depreciation - ( 173,088 ) ( 57,186 ) ( 37,834 ) ( 10,381 ) ( 48,647) ( 5,482 ) ( 124,668 ) ( 62,138 ) - ( 519,424 )
Effects of exchange ratechanges 6,362 ( 25,017 ) ( 2,945 ) ( 795 ) 1,543 ( 2,176) ( 132 ) - ( 1,868 ) ( 426 ) ( 25,454 )
At December 31 $ 1,128,687 $ 3,164,860 $ 246,212 $ 60,056 $ 27,571 $ 131,429 $ 8,401 $ 41,669 $ 206,973 $ 452,050 $ 5,467,908
At December 31, 2015
Cost $ 1,128,687 $ 5,217,291 $ 2,377,298 $ 254,967 $ 64,008 $ 774,885 $ 23,968 $ 80,285 $ 722,369 $ 452,050 $ 11,095,808
Accumulated depreciationand impairment - ( 2,052,431 ) ( 2,131,086 ) ( 194,911 ) ( 36,437 ) ( 643,456) ( 15,567 ) ( 38,616 ) ( 515,396 ) - ( 5,627,900 )
$ 1,128,687 $ 3,164,860 $ 246,212 $ 60,056 $ 27,571 $ 131,429 $ 8,401 $ 41,669 $ 206,973 $ 452,050 $ 5,467,908
Information about the property, plant and equipment that were pledged to others as collateral are described in Note 8.

143
Land Buildings Machinery
Computer andcommunication
equipmentTransportation
equipmentOffice
equipmentLeasehold
improvementsMolding
equipmentOther
equipment
Constructionin progress
and equipmentfor inspection Total
At January 1, 2014
Cost $ 1,111,705 $ 5,201,433 $ 2,937,854 $ 382,419 $ 69,648 $ 757,627 $ 90,292 $ 173,412 $ 700,514 $ 27,818 $ 11,452,722
Accumulated depreciationand impairment - ( 1,755,825 ) ( 2,841,444 ) ( 301,691 ) ( 45,840 ) ( 629,421) ( 61,186 ) ( 51,734 ) ( 570,995 ) - ( 6,258,136 )
$ 1,111,705 $ 3,445,608 $ 96,410 $ 80,728 $ 23,808 $ 128,206 $ 29,106 $ 121,678 $ 129,519 $ 27,818 $ 5,194,586
2014
At January 1 $ 1,111,705 $ 3,445,608 $ 96,410 $ 80,728 $ 23,808 $ 128,206 $ 29,106 $ 121,678 $ 129,519 $ 27,818 $ 5,194,586
Additions - 15,335 185,718 30,036 15,122 53,143 609 47,420 90,343 14,754 452,480
Disposals - ( 1,619 ) ( 13,358 ) ( 4,111 ) ( 1,249 ) ( 3,220) ( 12,518 ) - ( 854 ) - ( 36,929 )
Reclassifications - ( 43,218 ) - 10,231 600 - 663 - 1,179 ( 18,949 ) ( 49,494 )
Depreciation - ( 168,930 ) ( 72,321 ) ( 44,956 ) ( 9,540 ) ( 40,967) ( 11,660 ) ( 69,150 ) ( 55,670 ) - ( 473,194 )
Effects of exchange ratechanges 10,620 95,652 7,143 223 471 4,461 1,545 - 3,068 682 123,865
At December 31 $ 1,122,325 $ 3,342,828 $ 203,592 $ 72,151 $ 29,212 $ 141,623 $ 7,745 $ 99,948 $ 167,585 $ 24,305 $ 5,211,314
At December 31, 2014
Cost $ 1,122,325 $ 5,261,351 $ 2,409,367 $ 256,675 $ 68,521 $ 791,913 $ 53,855 $ 168,838 $ 715,442 $ 24,305 $ 10,872,592
Accumulated depreciationand impairment - ( 1,918,523 ) ( 2,205,775 ) ( 184,524 ) ( 39,309 ) ( 650,290) ( 46,110 ) ( 68,890 ) ( 547,857 ) - ( 5,661,278 )
$ 1,122,325 $ 3,342,828 $ 203,592 $ 72,151 $ 29,212 $ 141,623 $ 7,745 $ 99,948 $ 167,585 $ 24,305 $ 5,211,314
Information about the property, plant and equipment that were pledged to others as collateral are described in Note 8.

144
(10) Investment property
Land Buildings Total
At January 1, 2015
Cost $ 808,608 $ 575,157 $ 1,383,765
Accumulated depreciation andimpairment - ( 303,458 ) ( 303,458 )
$ 808,608 $ 271,699 $ 1,080,307
2015
At January 1 $ 808,608 $ 271,699 $ 1,080,307
Depreciation - ( 15,318 ) ( 15,318 )
Effects of exchange rate changes - ( 3,181 ) ( 3,181 )
At December 31 $ 808,608 $ 253,200 $ 1,061,808
At December 31, 2015
Cost $ 808,608 $ 496,700 $ 1,305,308
Accumulated depreciation andimpairment - ( 243,500 ) ( 243,500 )
$ 808,608 $ 253,200 $ 1,061,808
Land Buildings Total
At January 1, 2014
Cost $ 808,608 $ 491,625 $ 1,300,233
Accumulated depreciation andimpairment - ( 255,184 ) ( 255,184 )
$ 808,608 $ 236,441 $ 1,045,049
2014
At January 1 $ 808,608 $ 236,441 $ 1,045,049
Reclassifications - 43,218 43,218
Depreciation - ( 13,790 ) ( 13,790 )
Effects of exchange rate changes - 5,830 5,830
At December 31 $ 808,608 $ 271,699 $ 1,080,307
At December 31, 2014
Cost $ 808,608 $ 575,157 $ 1,383,765
Accumulated depreciation andimpairment - ( 303,458 ) ( 303,458 )
$ 808,608 $ 271,699 $ 1,080,307

145
A. Rental income from the lease of the investment property and direct operating expensesarising from the investment property are shown below:
For the year endedDecember 31, 2015
For the year endedDecember 31, 2014
Rental income from the lease of theinvestment property $ 33,368 $ 21,568
Direct operating expenses arising fromthe investment property thatgenerated rental income in the period $ 15,575 $ 12,263
Direct operating expenses arising fromthe investment property that did notgenerate rental income in the period $ 7,855 $ 13,379
B. The fair value of the investment property held by the Group on December 31, 2015 and2014 were $3,093,761 and $3,103,360, respectively, which were revalued by independentappraisers and with reference to market transaction prices.
(11) Intangible assets
Patent rights Software Others Total
At January 1, 2015
Cost $ 908,657 $ 665,759 $ 298,210 $ 1,872,626
Accumulatedamortization andimpairment ( 778,849 ) ( 478,873 ) ( 298,210 ) ( 1,555,932 )
$ 129,808 $ 186,886 $ - $ 316,694
2015
At January 1 $ 129,808 $ 186,886 $ - $ 316,694
Additions - 52,026 - 52,026Amortization ( 129,808 ) ( 119,892 ) - ( 249,700 )
Effects of exchangerate changes - ( 15 ) - ( 15 )
At December 31 $ - $ 119,005 $ - $ 119,005
At December 31, 2015
Cost $ 908,657 $ 717,785 $ 298,210 $ 1,924,652
Accumulatedamortization andimpairment ( 908,657 ) ( 598,780 ) ( 298,210 ) ( 1,805,647 )
$ - $ 119,005 $ - $ 119,005

146
Patent rights Software Others Total
At January 1, 2014
Cost $ 908,657 $ 489,002 $ 298,066 $ 1,695,725
Accumulatedamortization andimpairment ( 649,041 ) ( 291,849 ) ( 160,943 ) ( 1,101,833 )
$ 259,616 $ 197,153 $ 137,123 $ 593,892
2014
At January 1 $ 259,616 $ 197,153 $ 137,123 $ 593,892
Additions - 119,095 144 119,239Amortization ( 129, 808 ) ( 131,888 ) ( 27,964 ) ( 289,660 )
Impairment loss - - ( 111,605 ) ( 111,605 )
Effects of exchangerate changes - 2,526 2,302 4,828
At December 31 $ 129,808 $ 186,886 $ - $ 316,694
At December 31, 2014
Cost $ 908,657 $ 665,759 $ 298,210 $ 1,872,626
Accumulatedamortization andimpairment ( 778,849 ) ( 478,873 ) ( 298,210 ) ( 1,555,932 )
$ 129,808 $ 186,886 $ - $ 316,694
1. Details of amortization on intangible assets are as follows:For the year endedDecember 31, 2015
For the year endedDecember 31, 2014
Operating costs $ 30 $ 67
Selling expenses 19,921 51,952
Administrative expenses 192,403 210,250
Research and developmentexpenses 37,346 27,391
$ 249,700 $ 289,660
2. During the assessment of intangible assets in 2014, the recoverable amount of customerrelationship is assessed as below the carrying amount. Therefore, the Group has recognizedimpairment loss of $111,605 for the year ended December 31, 2014.
(12) Short-term borrowings
December 31, 2015 December 31, 2014
Unsecured bank borrowings $ 714,516 $ 3,590,577
Interest rates 0.77%~0.87% 0.79%~1.70%

147
(13) Financial liabilities at fair value through profit or loss
Items December 31, 2015 December 31, 2014
Current items:
Financial liabilities held fortradingNon-hedging derivatives
instruments$ 15,914 $ 3,371
A. The Group recognized net loss of $12,543 and net gain of $3,066 for the years endedDecember 31, 2015 and 2014, respectively.
B. The non-hedging derivative instrument transactions and contract information are as follows:
December 31, 2015
Financial Instrument ItemNotional Amount
(in thousands)Fair Market Value
(in thousands)MiTAC International Corp.
Forward foreign exchange - Sell Advance booking USD to buy NTD USD 9,000 ( NTD 452)
″ Advance booking EUR to buy USD EUR 4,800 ( NTD 2,845)
″ Advance booking AUD to buy USD AUD 8,413 ( NTD 2,562)
MiTAC Computing TechnologyCorp.
Forward foreign exchange - Sell Advance booking USD to buy NTD USD 30,000 ( NTD 4,012)
Silver Star Developments Ltd.
Forward foreign exchange - Sell Advance booking EUR to buy USD EUR 6,500 ( USD 154)
MiTAC Australia Pty Ltd.
Forward foreign exchange - Sell Advance booking NZD to buy USD NZD 1,375 ( USD 30)
December 31, 2014
Financial Instrument ItemNotional Amount
(in thousands)Fair Market Value
(in thousands)MiTAC International Corp.
Forward foreign exchange - Sell Advance booking USD to buy NTD USD 1,000 ( NTD 194)
″ Advance booking USD to buy CNY USD 9,000 ( NTD 2,519)
″ Advance booking AUD to buy USD AUD 1,250 ( NTD 183)
Silver Star Developments Ltd.
Forward foreign exchange - Sell Advance booking CNY to buy USD CNY 10,000 ( USD 15)
(14) Pensions
A.(a)The Company and its domestic subsidiaries have a defined benefit pension plan inaccordance with the Labor Standards Law, covering all regular employees’ service yearsprior to the enforcement of the Labor Pension Act on July 1, 2005 and service yearsthereafter of employees who chose to continue to be subject to the pension mechanismunder the Law. Under the defined benefit pension plan, two units are accrued for eachyear of service for the first 15 years and one unit for each additional year thereafter,subject to a maximum of 45 units. Pension benefits are based on the number of unitsaccrued and the average monthly salaries and wages of the last 6 months prior toretirement. The Company contributes monthly an amount equal to 2% of the employees’monthly salaries and wages to the retirement fund deposited with Bank of Taiwan, thetrustee, under the name of the independent retirement fund committee. Also, theCompany would assess the balance in the aforementioned labor pension reserve account

148
by the end of December 31, every year. If the account balance is not enough to pay thepension calculated by the aforementioned method, to the labors expected to be qualifiedfor retirement next year, the Company will make contribution for the deficit by nextMarch.
(b)The amounts recognized in the balance sheet are determined as follows:
December 31, 2015 December 31, 2014
Present value of defined benefitobligations
($ 501,074 ) ($ 471,221 )
Fair value of plan assets 229,490 233,198
Net defined benefit liability ($ 271,584 ) ($ 238,023 )
(c)Movements in net defined benefit liabilities are as follows:
Present value of
defined benefit
obligations
Fair value of
plan assets
Net defined
benefit liability
Year ended December 31, 2015
Balance at January 1 ($ 471,221) $ 233,198 ($ 238,023)
Current service cost ( 4,460) - ( 4,460)
Interest (expense) income ( 8,835) 4,459 ( 4,376)
( 484,516) 237,657 ( 246,859)
Remeasurements:
Return on plan assets
(excluding amounts included in
interest income or expense) - 1,844 1,844
Change in demographic
assumptions ( 10,686) - ( 10,686)
Change in financial
assumptions ( 18,024) - ( 18,024)
Experience adjustments ( 6,483) - ( 6,483)
( 35,193) 1,844 ( 33,349)
Pension fund contribution - 8,624 8,624
Paid pension 18,635 ( 18,635) -
Balance at December 31 ($ 501,074) $ 229,490 ($ 271,584)

149
Present value of
defined benefit
obligations
Fair value of
plan assets
Net defined
benefit liability
Year ended December 31, 2014
Balance at January 1 ($ 582,276) $ 316,851 ($ 265,425)
Current service cost ( 4,871) - ( 4,871)
Interest (expense) income ( 8,262) 4,558 ( 3,704)
( 595,409) 321,409 ( 274,000)
Remeasurements:
Return on plan assets
(excluding amounts included in
interest income or expense) - 1,127 1,127
Change in demographic
assumptions ( 22,168) - ( 22,168)
Experience adjustments ( 21,360) - ( 21,360)
( 43,528) 1,127 ( 42,401)
Pension fund contribution - 8,962 8,962
Paid pension 21,786 ( 21,786) -
Effect of business combination 145,930 ( 76,514) 69,416
Balance at December 31 ($ 471,221) $ 233,198 ($ 238,023)
(d) The Bank of Taiwan was commissioned to manage the Fund of the Company’s anddomestic subsidiaries’ defined benefit pension plan in accordance with the Fund’s annualinvestment and utilisation plan and the “Regulations for Revenues, Expenditures,Safeguard and Utilisation of the Labor Retirement Fund” (Article 6: The scope ofutilisation for the Fund includes deposit in domestic or foreign financial institutions,investment in domestic or foreign listed, over-the-counter, or private placement equitysecurities, investment in domestic or foreign real estate securitization products, etc.).With regard to the utilisation of the Fund, its minimum earnings in the annualdistributions on the final financial statements shall be no less than the earnings attainablefrom the amounts accrued from two-year time deposits with the interest rates offered bylocal banks. If the earnings is less than aforementioned rates, government shall makepayment for the deficit after being authorized by the Regulator. The Company has noright to participate in managing and operating that fund and hence the Company isunable to disclose the classification of plan asset fair value in accordance with IAS 19paragraph 142. The composition of fair value of plan assets as of December 31, 2015 and2014 is given in the Annual Labor Retirement Fund Utilisation Report announced by thegovernment.
(e) The principal actuarial assumptions used were as follows:
A. MiTAC International Corp.
For the year ended
December 31, 2015
For the year ended
December 31, 2014
Discount rate 1.500% 1.875%
Future salary increase 2.00% 2.00%
B. MiTAC Computing Technology Corp.
For the year ended
December 31, 2015
For the year ended
December 31, 2014
Discount rate 1.625% 1.875%
Future salary increase 2.00% 2.00%

150
Assumptions regarding future mortality experience are set based on actuarial advice in
accordance with published statistics and experience in each territory. Because the main
actuarial assumption changed, the present value of defined benefit obligation is
affected. The analysis was as follows:
A. MiTAC International Corp.
Discount rate Future salary increases
Increase 0.25% Decrease 0.25% Increase 0.25% Decrease 0.25%
December 31, 2015
Effect on present value ofdefined benefitobligation $ 8,621 ($ 8,963) ($ 8,763) $ 8,472
December 31, 2014
Effect on present value ofdefined benefitobligation $ 8,417 ($ 8,758) ($ 8,590) $ 8,297
B. MiTAC Computing Technology Corp.
Discount rate Future salary increases
Increase 0.25% Decrease 0.25% Increase 0.25% Decrease 0.25%
December 31, 2015
Effect on present value ofdefined benefitobligation $ 5,467 ($ 5,710) ($ 5,595) $ 5,384
December 31, 2014
Effect on present value ofdefined benefitobligation $ 5,143 ($ 5,378) ($ 5,279) $ 5,074
The sensitivity analysis above is based on other conditions that are unchanged but only
one assumption is changed. In practice, more than one assumption may change all at
once. The method of analysing sensitivity and the method of calculating net pension
liability in the balance sheet are the same.
(f) Expected contributions to the defined benefit pension plans of the Group within one yearfrom December 31, 2015 amounts to $8,616.
(g) As of December 31, 2015, the weighted average duration of that retirement plan is10.7~12.9 years.
B.(a) Effective July 1, 2005, the Company and its domestic subsidiaries have established adefined contribution pension plan (the “New Plan”) under the Labor Pension Act (the“Act”), covering all regular employees with R.O.C. nationality. Under the New Plan, theCompany and its domestic subsidiaries contribute monthly an amount based on 6% of theemployees’ monthly salaries and wages to the employees’ individual pension accounts atthe Bureau of Labor Insurance. The benefits accrued are paid monthly or in lump sumupon termination of employment.
(b)The Company’s Mainland China subsidiaries have a defined contribution plan. Monthlycontributions to an independent fund administered by the government in accordance withthe pension regulations in the People’s Republic of China (PRC) are based on certainpercentages of employees’ monthly salaries and wages. Other than the monthly

151
contributions, the Group has no further obligations.
(c) The pension costs under the defined contribution pension plans of the Group for theyears ended December 31, 2015 and 2014 were $80,537 and $78,734, respectively.
(15) Share-based payment
A. As of December 31, 2015 and 2014, the Company’s share-based payment arrangementswere as follows:
Type ofarrangement Grant date
Quantitygranted(shares inthousands)
Contract
period Vesting conditions
Eighth stock optionincentive plan
2008.10.13 and2008.10.27
31,785
(Note)
6 years 50% can be exercised after 2 years of grant
75% can be exercised after 3 years of grant
100% can be exercised after 4 years ofgrant
Ninth stock optionincentive plan
2009.04.29 and2009.07.03
16,894
(Note)
6 years 25% can be exercised after 2 years of grant
50% can be exercised after 3 years of grant
100% can be exercised after 4 years ofgrant
Tenth stock optionincentiveplan
2009.10.05,
2010.04.19 and
2010.05.06
26,903
(Note)
6 years 30% can be exercised after 2 years of grant
60% can be exercised after 3 years of grant
100% can be exercised after 4 years ofgrant
Eleventh stock optionincentive plan
2012.10.11 19,375
(Note)
6 years 50% can be exercised after 2 years of grant
75% can be exercised after 3 years of grant
100% can be exercised after 4 years ofgrant
Thirteenth treasurystock transfer toemployees
2014.8.15 1,864.5 - Vested immediately
Fourteenth treasurystock transfer toemployees
2014.8.15 2,090.5 - Vested immediately
Sixteenth treasurystock transfer toemployees
2015.7.13 3,549 - Vested immediately
Note: In accordance with the share conversion arrangement, the obligation of fulfilling thestock options issued by MiTAC International Corp. through the approval of authorityis to be borne by the Company on the conversion date and to make adjustments to theconversion price and issuance amount in accordance with the conversion ratio.

152
B. A summary of the movements of the Company’s stock option plans is set forth below:
For the year ended to December 31, 2015 For the year ended to December 31, 2014No. of options
(shares inthousands)
Weighted averageexercise price(in dollars)
No. of options(shares inthousands)
Weighted averageexercise price(in dollars)
Options outstanding at beginningof the period
59,298 23.72 89,059 $ 24.14
Options forfeited ( 21,845 ) 25.64 ( 19,989 ) 23.46
Options exercised ( 12,721 ) 23.49 ( 9,772 ) 22.91
Options outstanding at end of theperiod 24,732 21.24 59,298 23.72
Options exercisable at end of theperiod 20,251 49,700
Options approved and not yetissued at the end of the period
- -
C. The weighted-average stock price of stock options at exercise dates for the years endedDecember 31, 2015 and 2014 were $25.57 (in dollars) and $27.16 (in dollars), respectively.
D. As of December 31, 2015 and 2014, outstanding compensatory employee stock option planis as follows:
As of December 31, 2015
Number of options outstanding at the end of the year
Range of exercise price(in dollars)
In thousandsof shares
Expected weightedaverage residual
years
Weighted averageexercise price(in dollars)
$24.2 to $26.6 9,164 0.30 $ 24.88
$19.1 15,568 2.75 19.10
24,732
As of December 31, 2014
Number of options outstanding at the end of the year
Range of exercise price(in dollars)
In thousandsof shares
Expected weightedaverage residual
years
Weighted averageexercise price(in dollars)
$24.8 to $26.6 15,385 0.41 $ 25.74
$24.8 to $27.2 24,578 1.06 25.79
$19.5 19,335 3.75 19.50
59,298

153
E. Information about the fair value of the Company’s shared-based payment transactions:
(1) The fair values of stock options are measured using the Black-Scholes option-pricingmodel:
Type ofarrangement Grant date
Stockprice
(in dollars)
Exerciseprice(in dollars)
Expectedpricevolatility(Note 1)
Expectedoption life
Expecteddividends
Risk-freeinterestrate
Fair valueper unit(in dollars)
(Note 2)
Eighthemployeestockoptions
2008.10.13
2008.10.27
$ 13.20
11.35
$ 13.20
11.35
28.37%
28.42%
3.47 years
3.47 years
0%
0%
1.96%
1.89%
3.12
2.67
Ninthemployeestockoptions
2009.04.292009.07.03
14.3013.30
14.3013.30
34.87%34.36%
3.67 years3.67 years
0%0%
0.93%1.02%
3.923.62
Tenthemployeestockoptions
2009.10.052010.04.19
13.9014.45
13.9014.45
35.25%30.04%
3.61 years3.61 years
0%0%
0.55%0.75%
3.753.40
2010.05.06 13.1 13.1 29.85% 3.61 years 0% 0.74% 3.06
Eleventhemployeestockoptions
2012.10.11 10.15 10.15 36.14% 3.47 years 0% 0.88% 2.79
Note 1:Expected price volatility rate was estimated by using the stock prices of themost recent period with length of this period equal as the length of the stockoptions’ expected life, excluding obvious irregularities of changes in stockprices for the observation amount while considering the effect of theappropriation of retained earnings on the transaction price of stocks to calculateexpected price volatility rate.
Note 2: Information of fair value from the original issuance by MiTAC InternationalCorp.
(2) The factors for the fair value of other share-based payments:
Type of arrangementGrantdate
Stock price(in dollars)
Exercise price(in dollars)
Fair value perunit (in dollars)
Treasury stocktransferred toemployees
2014.8.15 $25.1 $18.4 and $21.5 $6.7 and $3.6
Treasury stocktransferred toemployees
2015.7.13 $29.65 $18.9 $10.75
F. Expenses incurred on share-based payment transactions are shown below:
For the year endedDecember 31, 2015
For the year endedDecember 31, 2014
Equity-settled $ 55,137 $ 66,639

154
(16) Provisions
Warranty - current For the year endedDecember 31, 2015
For the year endedDecember 31, 2014
Beginning balance $ 338,376 $ 458,285
Additional provisions 315,061 265,039
Used during the period ( 298,697 ) ( 318,691 )
Unused amounts reversed ( 3,119 ) ( 67,571 )
Effects of exchange rate changes ( 1,135 ) 1,314
Ending balance $ 350,486 $ 338,376
(17) Share capital
A. As of December 31, 2015, the Company’s authorized capital was $11,000,000, consisting of
1.1 billion shares (including 125 million shares reserved for employee stock options), and
the paid-in capital was $7,778,113 with a par value of $10 per share.
Movements in the number of the Company’s ordinary shares outstanding are as follows:
Unit: in thousands of sharesFor the year endedDecember 31, 2015
For the year endedDecember 31, 2014
Outstanding shares as ofJanuary 1 749,976 736,249
Purchase of treasury stock ( 8,244 ) -
Treasury stock transferred toemployees 3,549 3,955
Employee stock options exercised 12,721 9,772
Changes in outstanding sharesduring the year
8,026 13,727
Outstanding shares as ofDecember 31
758,002 749,976
B. Treasury shares
(a) Reason for share reacquisition and movements in the number of the Company’s treasuryshares are as follows:
December 31, 2015
Name of companyholding the shares
Reason forreacquisition
Number of shares
(shares in thousands) Carrying amount
MiTAC Holding Corp. Transferred toemployees
8,244 $ 169,362
Subsidiary- Tsu FungInvestment Corp.
Stockconversion
10,183 276,085
Subsidiary- SSDL " 1,382 77,002

155
December 31, 2014
Name of companyholding the shares
Reason forreacquisition
Number of shares
(shares in thousands) Carrying amount
Subsidiary- MiTACInternational Corp.
Stockconversion
7,869 $ 153,791
Subsidiary- Tsu FungInvestment Corp.
" 10,183 276,085
Subsidiary- SSDL " 1,382 77,002
(b) Pursuant to the R.O.C. Securities and Exchange Law, the number of shares bought back
as treasury shares should not exceed 10% of the number of the Company’s issued and
outstanding shares and the amount bought back should not exceed the sum of retained
earnings, paid-in capital in excess of par value and realised capital surplus.
(c) Pursuant to the R.O.C. Securities and Exchange Law, treasury stock should not be
pledged as collateral and is not entitled to dividends before it is reissued to the
employees.
(d) Pursuant to the R.O.C. Securities and Exchange Law, treasury shares should be reissued
to the employees within three years from the reacquisition date and shares not reissued
within the three-year period are to be retired. Treasury shares to enhance the Company’s
credit rating and the stockholders’ equity should be retired within six months of
acquisition.
(e) In accordance with the Financial Supervisory Commission, Securities and Futures
Bureau, No.1010047490, the Company shall not appropriate special reserve
proportionately to the shareholding ratio for the difference of ending market price below
the carrying amount of the parent’s stock held by the subsidiaries. If the market price
reverses subsequently, the reversal amount shall be appropriated as special reserve
proportionately to the shareholding ratio.

156
(18) Capital surplus
Sharepremium
Treasury stocktransactions
Net equity ofassociates andjoint venturesaccounted forunder theequity method
Employeestock options Total
At January 1, 2015 $ 21,427,076 $ 52,683 $ 150,448 $ 492,513 $ 22,122,720
Employee stock optionsexercised 260,326 - - ( 84,385 ) 175,941
Changes from associatesand joint venturesaccounted for under theequity method - - 34,417 - 34,417
Employee compensationplan - employee stockoptions - - - 55,137 55,137
Treasury stocktransferred to employees - 35,680 - ( 38,152 ) ( 2,472)
Subsidiaries receivedcash dividends paid bythe parent company - 7,976 - - 7,976
Retirement of treasuryshares ( 120,193 ) 78,949 - - ( 41,244)
At December 31, 2015 $ 21,567,209 $ 175,288 $ 184,865 $ 425,113 $ 22,352,475
Sharepremium
Treasury stocktransactions
Net equity ofassociates andjoint venturesaccounted forunder theequity method
Employeestock options Total
At January 1, 2014 $ 21,276,857 $ - $ 22,345 $ 504,181 $ 21,803,383
Employee stock optionsexercised 186,715 - - ( 57,588 ) 129,127
Changes from associatesand joint venturesaccounted for under theequity method - - 128,103 - 128,103
Employee compensationplan - employee stockoptions - - - 66,639 66,639
Treasury stocktransferred to employees - 21,754 - ( 20,719 ) 1,035
Subsidiaries receivedcash dividends paid bythe parent company - 6,935 - - 6,935
Retirement of treasuryshares ( 36,496 ) 23,994 - - ( 12,502)
At December 31, 2014 $ 21,427,076 $ 52,683 $ 150,448 $ 492,513 $ 22,122,720

157
Pursuant to the R.O.C. Company Act, capital surplus arising from paid-in capital in excess of
par value on issuance of common stocks and donations can be used to cover accumulated
deficit or to issue new stocks or cash to shareholders in proportion to their share ownership,
provided that the Company has no accumulated deficit. Further, the R.O.C. Securities and
Exchange Law requires that the amount of capital surplus to be capitalised mentioned above
should not exceed 10% of the paid-in capital each year. Capital surplus should not be used to
cover accumulated deficit unless the legal reserve is insufficient.
(19) Retained earnings
A. Under the Company’s Articles of Incorporation, the current year’s earnings, if any, shall
first be used to pay all taxes and offset prior years’ operating losses and then 10% of the
remaining amount shall be set aside as legal reserve. Special reserve shall also be set aside
pursuant to the regulations. Appropriation of the remainder plus prior year’s accumulated
unappropriated retained earnings shall be proposed by the Board of Directors and resolved
by the stockholders.
B. Earnings appropriation ratio and cash dividends ratio are decided by the Board of Directors,
taking into account the Company’s financial structure, future capital requirements and
profitability, and cash dividends shall account for at least 10% of the total dividends
appropriated. Earnings appropriation ratio and cash dividends ratio are subject to
adjustments once approved by the stockholders.
C. Except for covering accumulated deficit or issuing new stocks or cash to shareholders in
proportion to their share ownership, the legal reserve shall not be used for any other
purpose. The use of legal reserve for the issuance of stocks or cash to shareholders in
proportion to their share ownership is permitted, provided that the distribution of the
reserve is limited to the portion in excess of 25% of the Company’s paid-in capital.
D. In accordance with the regulations, the Company shall set aside special reserve from the
debit balance on other equity items at the balance sheet date before distributing earnings.
When debit balance on other equity items is reversed subsequently, the reversed amount
could be included in the distributable earnings.
E. On June 11, 2015, the appropriation of earnings for the year ended December 31, 2014
resolved by the shareholders is as follows:
2014
AmountDividend per share
(in dollars)
Legal reserve $ 76,109
Special reserve 52,117
Cash dividend 533,246 $ 0.7
Total $ 661,472

158
F. On March 25, 2016, the appropriation of earnings for the year ended December 31, 2015proposed by the Board of Directors and to be approved by the shareholders is as follows:
2015
Amount
Dividend per share
(in dollars)
Legal reserve $ 175,409
Special reserve 13,574
Cash dividend 1,231,738 $ 1.6
Stock dividend 307,934 0.4
Total $ 1,728,655G. For the information relating to employees’ compensation (bonuses) and directors’ and
supervisors’ remuneration, please refer to Note 6 (26).
(20) Other equity items
Available-for-saleinvestments
Currencytranslation Total
At January 1, 2015 $ 139,151 $ 1,872,643 $ 2,011,794
Reclassified to profit or loss upondisposal
8,467 8,208 16,675
Reclassified to impairment loss 14,188 - 14,188
Revaluation
–Group ( 207,595) - ( 207,595)
–Associates ( 34,307) - ( 34,307)
Currency translation differences:
–Group - 393,934 393,934
–Associates - ( 266,277) ( 266,277)
At December 31, 2015 ( $ 80,096) $ 2,008,508 $ 1,928,412
Available-for-saleinvestments
Currencytranslation Total
At January 1, 2014 $ 288,199 $ 899,611 $ 1,187,810
Reclassified to profit or loss upondisposal
( 50,638) ( 7,210) ( 57,848)
Reclassified to impairment loss 33,342 - 33,342
Revaluation
–Group ( 77,594) - ( 77,594)
–Associates ( 54,158) - ( 54,158)
Currency translation differences:
–Group - 889,391 889,391
–Associates - 90,851 90,851
At December 31, 2014 $ 139,151 $ 1,872,643 $ 2,011,794

159
(21) Operating revenue
For the year endedDecember 31, 2015
For the year endedDecember 31, 2014
Sales revenue $ 49,398,546 $ 41,701,620
Other operating revenue 656,219 358,722
Total $ 50,054,765 $ 42,060,342
(22) Other income
For the year endedDecember 31, 2015
For the year endedDecember 31, 2014
Interest income:
Interest income from bank deposits $ 99,428 $ 147,848
Rental revenue 79,534 56,684
Dividend income 119,828 105,534
Other income 77,120 80,497
Total $ 375,910 $ 390,563
(23) Other gains and losses
For the year endedDecember 31, 2015
For the year endedDecember 31, 2014
Net (loss) gain on financial liabilitiesat fair value through profit or loss
($ 12,543 ) $ 3,066
Net (loss) gain on financial assets atfair value through profit or loss
( 23,748 ) 15,296
Net currency exchange gain (loss) 97,000 ( 14,174 )
Gain on disposal of property, plantand equipment
12,999 11,227
(Loss) gain on disposal ofinvestments
( 16,506 ) 58,609
Gain on disposal of non currentassets - 15,832
Impairment loss of financial assets ( 25,902 ) ( 104,593 )
Impairment loss of non-financialassets - ( 111,605 )
Other losses ( 38,505 ) ( 22,028 )
Total ($ 7,205 ) ($ 148,370)
(24) Finance costs
For the year endedDecember 31, 2015
For the year endedDecember 31, 2014
Interest expense:
Bank borrowings $ 32,053 $ 44,146

160
(25) Expenses by nature
For the year endedDecember 31, 2015
For the year endedDecember 31, 2014
Employee benefit expense $ 5,139,127 $ 5,132,246
Depreciation on property, plant andequipment and investment property 534,742 486,984
Amortisation charges 249,700 289,660
Total $ 5,923,569 $ 5,908,890
(26) Employee benefit expense
For the year endedDecember 31, 2015
For the year endedDecember 31, 2014
Wages and salaries $ 4,533,402 $ 4,517,933
Employee stock options 55,137 66,639
Labor and health insurance fees 353,075 332,469
Pension costs 89,373 87,004
Other personnel expenses 108,140 128,201
$ 5,139,127 $ 5,132,246
A. Under the Company’s Articles of Incorporation, when distributing the current year’searnings, the Company shall first offset prior years’ operating losses and pay all taxes, andthen set aside 10% as legal reserve. Special reserve is set aside or reversed in accordancewith related laws and employees’ bonus shall account for at least 1% of the remainder.
However, in accordance with the Company Act amended in May 20, 2015, a company shalldistribute employee compensation, based on the distributable profit of the current year, in afixed amount or a ratio of profits. If a company has accumulated deficit, earnings should bechanneled to cover losses. A company may, by a resolution adopted by a majority vote at ameeting of board of directors attended by two-thirds of the total number of directors, havethe profit distributable as employees' compensation distributed in the form of shares or incash; and in addition thereto a report of such distribution shall be submitted to theshareholders' meeting. Qualification requirements of employees, including the employees ofsubsidiaries of the company meeting certain specific requirements, entitled to receiveaforementioned stock or cash may be specified in the Articles of Incorporation.
B. The Board of Directors of the Company has approved the amended Articles of Incorporationof the Company on January 26, 2016 and the amended articles will be reported to andresolved by the shareholders. According to the amended articles, the profit (pre-tax profitbefore deduction of employees’ compensation and directors’ and supervisors’ remuneration)of the current year shall be distributed as employees’ compensation and directors’ andsupervisors’ remuneration, which will be resolved by the Board of Directors. The ratio shallnot be lower than 0.1% for employees and not be higher than 1% for directors andsupervisors. If a company has accmulated deficit, earnings should be reserved to coverlosses. Employees’ compensation can be distributed in cash or shares and shall bedistributed to the employees of subsidiaries of the Company who meet certain specificrequirements. The chairman of the Board is authorized to set the qualification requirements.

161
C. For the year ended December 31, 2015, employees’ compensation was accrued at 0.1% ofgain on pre-tax profit before deduction of employees’ compensation and directors’ andsupervisors’ remuneration. Employees’ compensation recognised for the year of 2014 wasaccrued based on 0.1% of the net income of 2014, taking into account other factors such aslegal reserve, and directors’ and supervisors’ remuneration were recorded at the estimatedamount.
D. For the years ended December 31, 2015 and 2014, employees’ compensation (bonus) wasaccrued at $1,767 and $633, respectively; and directors’ and supervisors’ remuneration wasaccrued at $2,100 and $2,000, respectively. The aforementioned amounts were recognisedin salary expenses.
E. For the year ended December 31, 2015, the actual distributed amount of $1,767 foremployees’ cash compensation and $2,100 for directors’ and supervisors’ remuneration asresolved by the Board of Directors were in agreement with the accrued amounts. Employees’cash bonus of $633 and directors’ and supervisors’ remuneration of $2,000 of 2014 asresolved at the shareholders’ meeting were in agreement with those amounts recognised inthe profit or loss of 2014.
F. Information about employees’ compensation (bonus) and directors’ and supervisors’remuneration of the Company as resolved by the Board of Directors and the shareholders atthe shareholders’ meeting will be posted in the “Market Observation Post System” at thewebsite of the Taiwan Stock Exchange.
(27) Income tax
A. Income tax expense
(a) Components of income tax expense:
For the year endedDecember 31, 2015
For the year endedDecember 31, 2014
Current tax:
Current tax on profits for theperiod $ 253,138 $ 182,517
Tax on undistributed surplusearnings 5,824 5,521
Adjustments in respect of prioryears 7,635 446
Total current tax 266,597 188,484
Deferred tax:
Origination and reversal oftemporary differences ( 6,586 ) ( 77,862 )
Net operating loss carryforward - 179,281
Total deferred tax 6,586 101,419
Income tax expense $ 260,011 $ 289,903

162
(b) The income tax (charge)/credit relating to components of other comprehensive income isas follows:
For the year endedDecember 31, 2015
For the year endedDecember 31, 2014
Actuarial losses on definedbenefit obligations
($ 5,669 ) ($ 7,260 )
B. Reconciliation between income tax expense and accounting profit
For the year endedDecember 31, 2015
For the year endedDecember 31, 2014
Tax calculated based on profitbefore tax and statutory tax rate $ 732,278 $ 450,135
Additional 10% income taximposed on unappropriatedearnings 5,824 5,521
Effects from items disallowed bytax regulation ( 534,122 ) ( 358,265 )
Effects from foreign income 48,396 12,785Over provision of prior year’s
income tax 7,635 446Effect from net operating loss
carryforward - 179,281Income tax expense $ 260,011 $ 289,903
C. Amounts of deferred tax assets or liabilities as a result of temporary differences and losscarryforward are as follows:
For the year ended December 31, 2015
Beginningbalance
Recognisedin profit orloss
Recognisedin othercomprehensiveincome
Effects ofexchangerate changes
Endingbalance
Deferred tax assets:
Temporary differences:
Warranty provision $ 43,001 $ 4,537 $ - $ - $ 47,538
Loss from decline ininventory price tomarket value 84,106 ( 9,336 ) - 1,557 76,327
Unrealized estimatepayable 132,231 19,157 - - 151,388
Others 184,014 ( 7,711 ) 5,669 ( 317 ) 181,655
Subtotal $ 443,352 $ 6,647 $ 5,669 $ 1,240 $ 456,908
Deferred tax liabilities:
Temporary differences:
Equity investments ( 320,474 ) - - - ( 320,474 )
Others ( 11,438 ) ( 61 ) - - ( 11,499 )
Subtotal ( $ 331,912 ) ( $ 61 ) $ - $ - ( $ 331,973 )
Total $ 111,440 $ 6,586 $ 5,669 $ 1,240 $ 124,935

163
For the year ended December 31, 2014
Beginningbalance
Recognisedin profit orloss
Recognisedin othercomprehensiveincome
Effects ofexchangerate changes
Endingbalance
Deferred tax assets:
Temporary differences:
Warranty provision $ 61,711 ($ 18,710 ) $ - $ - $ 43,001
Loss from decline ininventory price tomarket value 166,460 ( 84,794 ) - 2,440 84,106
Unrealized estimatepayable 114,542 17,689 - - 132,231
Others 44,402 136,743 7,260 ( 4,391 ) 184,014
Net operating losscarryforward 179,281 ( 179,281 ) - - -
Subtotal $ 566,396 ( $ 128,353 ) $ 7,260 ( $ 1,951) $ 443,352
Deferred tax liabilities:
Temporary differences:
Equity investments ( 358,846 ) 38,372 - - ( 320,474 )
Others - ( 11,438 ) - - ( 11,438 )
Subtotal ( $ 358,846 ) $ 26,934 $ - $ - ( $ 331,912 )
Total $ 207,550 ( $ 101,419 ) $ 7,260 ( $ 1,951 ) $ 111,440
D. Expiration dates of unused net operating loss carryforwards of the Company and its
subsidiaries and amounts of unrecognised deferred tax assests are as follows:
December 31, 2015
Year incurredAmount filed/assessed Unused amount
Unrecogniseddeferred taxassets
Usable untilyear
2011 Assessed $ 172,967 $ 172,967 2021
2012 Assessed 297,134 297,134 2022
2014 Filed 36,392 36,392 2024
December 31, 2014
Year incurredAmount filed/assessed Unused amount
Unrecogniseddeferred taxassets
Usable untilyear
2011 Assessed $ 185,363 $ 185,363 2021
2012 Assessed 297,134 297,134 2022
2013 Assessed 11,092 11,092 2023
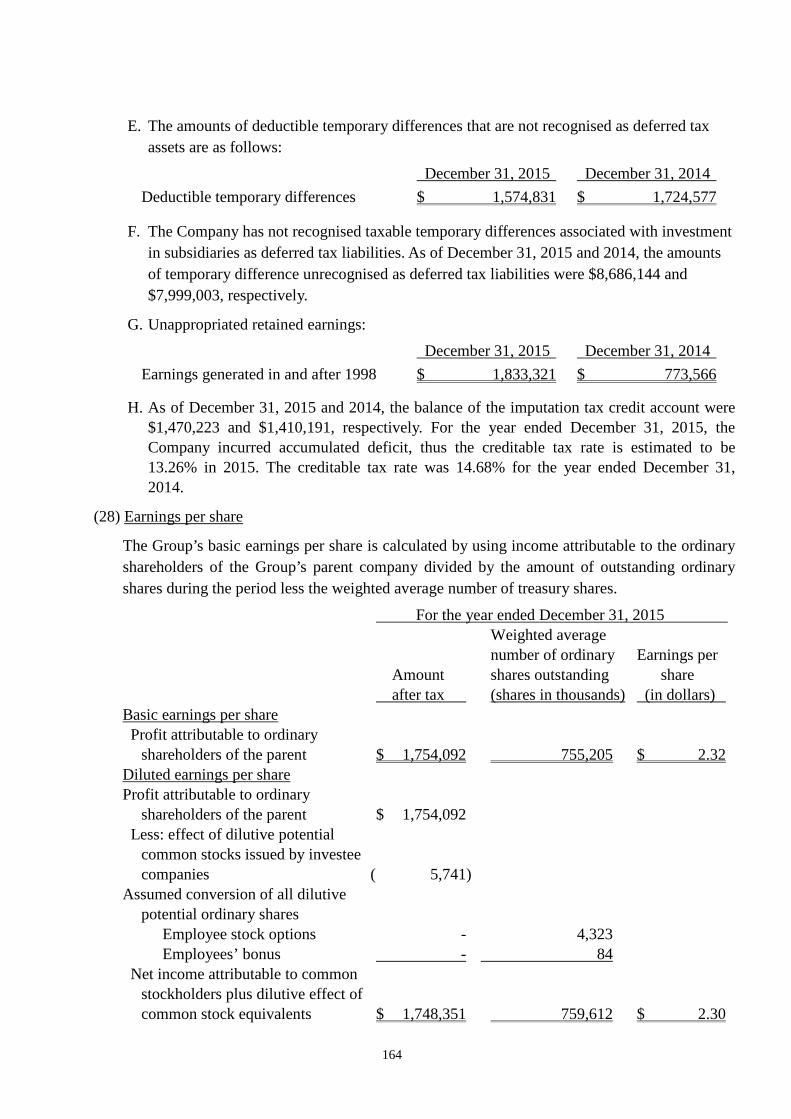
164
E. The amounts of deductible temporary differences that are not recognised as deferred tax
assets are as follows:
December 31, 2015 December 31, 2014
Deductible temporary differences $ 1,574,831 $ 1,724,577
F. The Company has not recognised taxable temporary differences associated with investment
in subsidiaries as deferred tax liabilities. As of December 31, 2015 and 2014, the amounts
of temporary difference unrecognised as deferred tax liabilities were $8,686,144 and
$7,999,003, respectively.
G. Unappropriated retained earnings:
December 31, 2015 December 31, 2014
Earnings generated in and after 1998 $ 1,833,321 $ 773,566
H. As of December 31, 2015 and 2014, the balance of the imputation tax credit account were$1,470,223 and $1,410,191, respectively. For the year ended December 31, 2015, theCompany incurred accumulated deficit, thus the creditable tax rate is estimated to be13.26% in 2015. The creditable tax rate was 14.68% for the year ended December 31,2014.
(28) Earnings per share
The Group’s basic earnings per share is calculated by using income attributable to the ordinary
shareholders of the Group’s parent company divided by the amount of outstanding ordinary
shares during the period less the weighted average number of treasury shares.
For the year ended December 31, 2015
Amountafter tax
Weighted averagenumber of ordinaryshares outstanding(shares in thousands)
Earnings pershare
(in dollars)Basic earnings per shareProfit attributable to ordinary
shareholders of the parent $ 1,754,092 755,205 $ 2.32Diluted earnings per shareProfit attributable to ordinary
shareholders of the parent $ 1,754,092Less: effect of dilutive potential
common stocks issued by investeecompanies ( 5,741)
Assumed conversion of all dilutivepotential ordinary shares
Employee stock options - 4,323Employees’ bonus - 84
Net income attributable to commonstockholders plus dilutive effect ofcommon stock equivalents $ 1,748,351 759,612 $ 2.30

165
For the year ended December 31, 2014
Amountafter tax
Weighted averagenumber of ordinaryshares outstanding(shares in thousands)
Earnings pershare
(in dollars)Basic earnings per shareProfit attributable to ordinary
shareholders of the parent $ 761,086 742,397 $ 1.03Diluted earnings per shareProfit attributable to ordinary
shareholders of the parent $ 761,086Less: effect of dilutive potential
common stocks issued by investeecompanies ( 2,552)
Assumed conversion of all dilutivepotential ordinary shares
Employee stock options - 4,403Employees’ bonus - 38
Net income attributable to commonstockholders plus dilutive effect ofcommon stock equivalents $ 758,534 746,838 $ 1.02
(29) Operating Leases
The Group leases building assets to others under non-cancellable operating lease agreements.These leases have terms expiring between 1 and 5 years, and all these lease agreements arenot renewable at the end of the lease period. Rental revenue of $79,534 and $56,684 wererecognized for the years ended December 31, 2015 and 2014, respectively. The futureaggregate minimum lease receivable under non-cancellable operating leases are as follows:
December 31, 2015 December 31, 2014
Not later than one years $ 64,401 $ 56,156
Later than one year but not later
than five years 98,358 145,126
Later than five years 6,351 10,651
$ 169,110 $ 211,933

166
7. RELATED PARTY TRANSACTIONS
(1) Significant related party transactions and balances
A. Operating revenue:
(a)
For the year endedDecember 31, 2015
For the year endedDecember 31, 2014
Sales of goods:
-Associates $ 1,242,187 $ 1,904,012
-Other related parties 20 571$ 1,242,207 $ 1,904,583
(b) The selling price to related parties is based on market value in the region of the related party.
(c) The collection period to domestic related parties is 90 days after shipping date based on the
net balance of receivables after offsetting with payable accounts.
(d) The collection period to foreign related parties is 150 days for the net amount after offsetting
certain receivables and payables considering the reasonable time from shipping to collection
terms to overseas and domestic related parties.
(e) The collection period for third parties is approximately 90 days after shipping date.
B. Purchases:
(a)
For the year endedDecember 31, 2015
For the year endedDecember 31, 2014
Purchases of goods:
-Associates $ 831,469 $ 815,519
-Other related parties 2,289 10,466
$ 833,758 $ 825,985
(b) The purchase prices from related parties are based on the international market value and the
market price in the region of the related party.
(c) The payment period is 150 days after offsetting certain receivables and payables for foreign
related parties; the payment period is 90 days after shipping date based on the net amount
after offsetting certain receivables and payables for other related parties.
(d) The payment period to regular suppliers is approximately 90 days after purchase date.
C. Receivables from related parties:
December 31, 2015 December 31, 2014
Accounts receivable:
-Associates $ 253,354 $ 230,574
-Other related parties - 593
Subtotal 253,354 231,167

167
December 31, 2015 December 31, 2014
Other receivables:
-Associates $ 22,279 $ 48,429
-Other related parties 2,342 3,031
Subtotal 24,621 51,460
Total $ 277,975 $ 282,627
D. Payables to related parties:
December 31, 2015 December 31, 2014
Accounts payable:
-Associates $ 181,404 $ 263,567
-Other related parties 1,959 345
Subtotal 183,363 263,912
Other payables:
Associates 6,903 11,090
Other related parties 249 4,299
Subtotal 7,152 15,389
Total $ 190,515 $ 279,301
E. Property transactions:
Acquisition of property, plant andequipment:
For the year endedDecember 31, 2015
For the year endedDecember 31, 2014
Associates $ 6,694 $ 15,750
Other related parties 1,923 1,474
$ 8,617 $ 17,224
Acquisition of financial assets:Acquisition amount
AccountTransaction Share
(Shares in thousands) ItemFor the year endedDecember 31, 2015
For the year endedDecember 31, 2014
Other relatedparties
Financial assetsmeasured at cost
$ 2,500 Investment $ 25,000 $ 25,000
F. Rent revenue
For the years ended December 31, 2015 and 2014, the rental revenue collected from leasing
offices and factories to associates amounted to $31,162 and $34,778, respectively.

168
G. Expenses
For the year endedDecember 31, 2015
For the year endedDecember 31, 2014
Associates $ 12,311 $ 27,922
Other related parties 56,807 66,699
$ 69,118 $ 94,621
Expenses mainly pertain to rental expenditures for the lease of offices and other miscellaneous
expenses.
H. Endorsements and guarantees provided to related parties:
As of December 31, 2015 and 2014, associates provided guarantees for operating leases to
MiTAC International Corp. amounting to $3,600.
(2) Key management compensationFor the year endedDecember 31, 2015
For the year endedDecember 31, 2014
Salaries and other short-term employeebenefits
$ 37,950 $ 34,954
Post-employment benefits 539 536
Share-based payments 1,922 5,578
Total $ 40,411 $ 41,068
8. PLEDGED ASSETS
The Group’s assets pledged as collateral are as follows:
Book value
Pledged asset December 31, 2015 December 31, 2014 Purpose
Buildings $ 362,180 $ 323,093 Short-term loans
Land use rights 13,422 14,076 Short-term loans
Time deposits 3,500 3,500 Guarantee deposit for the lease of land in SciencePark
Time deposits 2,204 2,186 Guarantee deposit for the lease of dormitory inScience Park
Time deposits - 7,638 Customs guarantee
Time deposits - 9,500 Guarantee for application for letters of credit
Demand deposits 4,995 6,365 Customs guarantee
$ 386,301 $ 366,358
9. SIGNIFICANT CONTINGENT LIABILITIES AND UNRECOGNISED CONTRACT
COMMITMENTS
(1) Contingencies
None.

169
(2) Commitments
A. Operating lease arrangement
The minimum amount payable under the Group’s future non-cancellable operating lease is as
follows:
December 31, 2015 December 31, 2014
Not more than 1 year $ 125,478 $ 131,555
More than 1 year but not more than 5years
147,481 67,487
Over 5 years 18,255 21,906
Total $ 291,214 $ 220,948
B. Capital expenditure contracted but not provided are as follows:
December 31, 2015 December 31, 2014
Property, plant and equipment $ 1,219,270 $ -
10. SIGNIFICANT DISASTER LOSS:
None.
11. SIGNIFICANT EVENTS AFTER THE BALANCE SHEET DATE:
None.
12. OTHERS
(1) Capital management
The Group’s objectives when managing capital are to safeguard the Group’s ability to continue
as a going concern in order to provide returns for shareholders and to maintain an optimal
capital structure to reduce the cost of capital.
(2) Financial instruments
A. Fair value information of financial instruments
The carrying amounts of the Group’s financial instruments not measured at fair value,
including cash and cash equivalents, notes receivable, accounts receivable, other receivables,
other current assets, short-term loans, notes payable, accounts payable and other payables,
long-term loans (including due within one year or one operating cycle) and guarantee
deposits (shown as other non-current liabilities) are approximate to their fair values. The fair
value information of financial instruments measured at fair value is provided in Note 12(3).
B. Financial risk management policies
The Group’s activities expose it to a variety of financial risks: market risk (including foreign
exchange risk, interest rate risk and price risk), credit risk and liquidity risk. The Group’s
overall risk management programme focuses on the unpredictability of financial markets and
seeks to minimise potential adverse effects on the Group’s financial position and financial
performance. The Group uses derivative financial instruments to hedge certain risk
exposures (see Notes 6(2), 6(13)).

170
C. Significant financial risks and degrees of financial risks
(a)Market risk
Foreign exchange risk
i. The Group operates internationally and is exposed to foreign exchange risk arising
from various currency exposures, primarily with respect to the USD, EUR and RMB.
Foreign exchange risk arises from future commercial transactions, recognised assets
and liabilities and net investments in foreign operations.
ii. Management has set up a policy to require group companies to manage their foreign
exchange risk against their functional currency. The group companies are required to
hedge their entire foreign exchange risk exposure with the Group treasury. To manage
their foreign exchange risk arising from future commercial transactions and
recognised assets and liabilities, entities in the Group use forward foreign exchange
contracts, transacted with Group treasury. Foreign exchange risk arises when future
commercial transactions or recognised assets or liabilities are denominated in a
currency that is not the entity’s functional currency.
iii. The Group’s businesses involve some non-functional currency operations (the
Company’s and certain subsidiaries’ functional currency: NTD; other certain
subsidiaries’ functional currency: USD, EUR and RMB).The information on assets
and liabilities denominated in foreign currencies whose values would be materially
affected by the exchange rate fluctuations is as follows:
December 31, 2015
Foreign CurrencyAmount (InThousands)
ExchangeRate
Book Value(NTD)
(Foreign currency: functionalcurrency)
Financial assets
Monetary items
USD:NTD $ 311,824 32.825 $ 10,235,623
EUR:NTD 8,978 35.880 322,131
AUD:NTD 9,880 23.985 236,972
USD:RMB 136,420 6.572 4,477,987
Non-monetary items
RMB:USD 58,222 0.152 290,800
Financial liabilities
Monetary items
USD:NTD 267,269 32.825 8,773,105
EUR:NTD 9,656 35.880 346,457
AUD:NTD 14,927 23.985 358,024
USD:RMB 69,949 6.572 2,296,076

171
December 31, 2014
Foreign CurrencyAmount (InThousands)
ExchangeRate
Book Value(NTD)
(Foreign currency: functionalcurrency)
Financial assets
Monetary items
USD:NTD $ 411,890 31.650 $ 13,036,319
EUR:NTD 6,408 38.470 246,516
RMB:NTD 189,256 5.092 963,692
AUD:NTD 9,663 25.905 250,320
USD:RMB 125,565 6.216 3,974,132
Non-monetary items
RMB:USD 57,193 0.161 291,226
Financial liabilities
Monetary items
USD:NTD 391,271 31.650 12,383,727
EUR:NTD 7,752 38.470 298,219
RMB:NTD 195,604 5.092 996,016
AUD:NTD 10,243 25.905 265,345
USD:RMB 117,743 6.216 3,726,566
iv. Total exchange gain (loss), including realized and unrealized arising from significant
foreign exchange variation on the monetary items held by the Group for the years
ended December 31, 2015 and 2014, amounted to $97,000 and ($14,174),
respectively.
v. When the exchange rates for USD, AUD, EUR and RMB to NTD, and USD to RMB
increased or decreased by 1%, with all other factors the same at December 31, 2015
and 2014, net profit before tax would increase or decrease by $34,991 and $8,161 for
the years ended December 31, 2015 and 2014, respectively.
Price risk
A. The Group is exposed to equity securities price risk because of investments held by
the Group and classified on the consolidated balance sheet either as
available-for-sale or at fair value through profit or loss. The Group is not exposed to
commodity price risk. To manage its price risk arising from investments in equity
securities, the Group diversifies its portfolio. Diversification of the portfolio is done
in accordance with the limits set by the Group.

172
B. The Group’s investments in equity securities comprise domestic listed and unlisted
stocks. The prices of equity securities would change due to the change of the future
value of investee companies. If the prices of these equity securities had
increased/decreased by 1% with all other variables held constant, other components
of equity would have increased/decreased by $13,166 and $14,938 for the years
ended December 31, 2015 and 2014, respectively, as a result of gains/losses on
equity securities classified as available-for-sale.
Interest rate risk
The Group’s interest rate risk arises from borrowings. However, the Group’s
borrowings are all at a fixed rate, thus interest rate risk has no significant impact on
the Group.
(b)Credit risk
i. Credit risk refers to the risk of financial loss to the Group arising from default by the
clients or counterparties of financial instruments on the contract obligations.
According to the Group’s credit policy, each local entity in the Group is responsible
for managing and analysing the credit risk for each of their new clients before standard
payment and delivery terms and conditions are offered. Internal risk control assesses
the credit quality of the customers, taking into account their financial position, past
experience and other factors. Individual risk limits are set based on internal or external
ratings in accordance with limits set by the board of directors. The utilisation of credit
limits is regularly monitored. Credit risk arises from cash and cash equivalents,
derivative financial instruments and deposits with banks and financial institutions, as
well as credit exposures to wholesale and retail customers, including outstanding
receivables.
ii. No credit limits were exceeded during the years ended December 31, 2015 and 2014,
and management does not expect any significant losses from non-performance by
these counterparties.
iii.The credit quality information of financial assets that are neither past due nor impaired
is described in Note 6 (5).
iv. The ageing analysis of financial assets that were past due but not impaired is described
in Note 6 (5).
v. The individual analysis of financial assets that had been impaired is provided in the
statement for each type of financial asset in Note 6.
(c)Liquidity risk
i. Cash flow forecasting is performed in the operating entities of the Group and
aggregated by Group treasury. Group treasury monitors rolling forecasts of the
Group’s liquidity requirements to ensure it has sufficient cash to meet operational
needs.

173
ii. The table below analyses the Group’s non-derivative financial liabilities and
net-settled or gross-settled derivative financial liabilities into relevant maturity
groupings based on the remaining period at the balance sheet date to the contractual
maturity date for non-derivative financial liabilities and to the expected maturity date
for derivative financial liabilities. The amounts disclosed in the table are the
contractual undiscounted cash flows.
Non-derivative financial liabilities:
December 31, 2015Less than1 year
Between 1and 2 years
Between 2and 3 years Over 3 years
Short-term borrowings $ 714,516 $ - $ - $ -
Accounts payable 5,547,707 - - -
Other payables 3,691,058 - - -
Guarantee deposits 5,640 7,311 1,317 5,311
December 31, 2014Less than1 year
Between 1and 2 years
Between 2and 3 years Over 3 years
Short-term borrowings $ 3,590,577 $ - $ - $ -
Accounts payable 7,635,029 - - -
Other payables 3,507,921 - - -
Guarantee deposits 5,024 24,292 779 1,410
Derivative financial liabilities
As of December 31, 2015 and 2014, the Group’s derivative financial liabilities mature
within one year.
iii.The Group does not expect the timing of occurrence of the cash flows estimated
through the maturity date analysis will be significantly earlier, nor expect the actual
cash flow amount will be significantly different.
(3) Fair value estimation
A. Details of the fair value of the Group’s financial assets and financial liabilities not measured
at fair value are provided in Note 12(2)A. Details of the fair value of the Group’s investment
property measured at cost are provided in Note 6(10).
B. The different levels that the inputs to valuation techniques are used to measure fair value of
financial instruments have been defined as follows:
Level 1: Quoted prices (unadjusted) in active markets for identical assets or liabilities.
Level 2: Inputs other than quoted prices included within level 1 that are observable for the
asset or liability, either directly (that is, as prices) or indirectly (that is, derived
from prices).
Level 3: Inputs for the asset or liability that are not based on observable market data.

174
The following table presents the Group’s financial assets and liabilities that are measured atfair value at December 31, 2015 and 2014:
December 31, 2015 Level 1 Level 2 Level 3 Total
Financial assets:
Forward exchange contracts $ - $ 5,711 $ - $ 5,711
Equity securities 1,102,133 151,515 62,967 1,316,615
Total $ 1,102,133 $ 157,226 $ 62,967 $ 1,322,326
Financial liabilities:
Forward exchange contracts $ - $ 15,914 $ - $ 15,914
December 31, 2014 Level 1 Level 2 Level 3 Total
Financial assets:
Forward exchange contracts $ - $ 29,460 $ - $ 29,460
Equity securities 1,189,592 224,168 80,002 1,493,762
Total $ 1,189,592 $ 253,628 $ 80,002 $ 1,523,222
Financial liabilities:
Forward exchange contracts $ - $ 3,371 $ - $ 3,371
C. The methods and assumptions the Group used to measure fair value are as follows:
(a) The instruments the Group used market quoted prices as their fair values (that is, Level
1) are listed below by characteristics:
Listed shares Open-end fund
Market quoted price Closing price Net asset value
(b) Except for financial instruments with active markets, the fair value of other financial
instruments is measured by using valuation techniques or by reference to counterparty
quotes.
(c) When assessing non-standard and low-complexity financial instruments, the Group
adopts valuation technique that is widely used by market participants. The inputs used
in the valuation method to measure these financial instruments are normally observable
in the market.
(d) The valuation of derivative financial instruments is based on valuation model widely
accepted by market participants, such as present value techniques and option pricing
models. Forward exchange contracts are usually valued based on the current forward
exchange rate.

175
(e) The output of valuation model is an estimated value and the valuation technique may
not be able to capture all relevant factors of the Group’s financial and non-financial
instruments. Therefore, the estimated value derived using valuation model is adjusted
accordingly with additional inputs, for example, model risk or liquidity risk and etc. In
accordance with the Group’s management policies and relevant control procedures
relating to the valuation models used for fair value measurement, management believes
adjustment to valuation is necessary in order to reasonably represent the fair value of
financial and non-financial instruments at the consolidated balance sheet. The inputs
and pricing information used during valuation are carefully assessed and adjusted based
on current market conditions.
(f) The Group takes into account adjustments for credit risk to measure the fair value of
financial and non-financial instruments to reflect credit risk of the counterparty and the
Group’s credit quality.
D. For the years ended December 31, 2015 and 2014, there was no transfer between Level 1
and Level 2.
E. The following table presents the changes in level 3 instruments as at December 31, 2015
and 2014:
For the year endedDecember 31, 2015
For the year endedDecember 31, 2014
January 1 $ 80,002 $ 149,334
Loss recognized in profit or loss ( 4,331 ) ( 71,251 )
Loss recognized in othercomprehensive income
( 13,211 ) ( 386 )
Effect of foreign exchange rate 507 2,305
December 31 $ 62,967 $ 80,002
F. Investment department is in charge of valuation procedures for fair value measurements
being categorized within Level 3, which is to verify independent fair value of financial
instruments. Such assessment is to ensure the valuation results are reasonable by applying
independent information to make results close to current market conditions, and reviewing
the information periodically.
G. The following is the qualitative information of significant unobservable inputs and sensitivity
analysis of changes significant unobservable inputs to valuation model used in Level 3 fair
value measurements:
Fair value atDecember 31, 2015
Valuationtechnique
Significantunobservable input
Range(weighted average)
Relationship ofinputs to fair value
Non-derivative
equity instrument:Unlisted shares $ 62,967 Net asset value Net asset value - The higher the net
asset value, the
higher the fairvalue.

176
H. The Group has carefully assessed the valuation models and assumptions used to measure fair
value; therefore, the fair value measurement is reasonable. However, use of different
valuation models or assumptions may result in difference measurement. The following is the
effect of profit or loss or of other comprehensive income from financial assets and liabilities
categorized within Level 3 if the inputs used to valuation models have changed:
December 31, 2015
Recognised in profit or lossRecognised in other
comprehensive income
Input ChangeFavourable
changeUnfavourable
changeFavourable
changeUnfavourable
change
Financial assets
Equity instrument Net asset value ± 1% $ - $ - $ 630 $ 630
December 31, 2014
Recognised in profit or lossRecognised in other
comprehensive income
Input Change
Favourable
change
Unfavourable
change
Favourable
change
Unfavourable
change
Financial assets
Equity instrument Net asset value ± 1% $ - $ - $ 800 $ 800

177
13. SUPPLEMENTARY DISCLOSURES
(1) Significant transactions information
A. Loans to others: Please refer to table 1.
B. Provision of endorsements and guarantees to others: Please refer to table 2.
C. Holding of marketable securities at the end of the period (not including subsidiaries,associates and joint ventures): Please refer to table 3.
D. Acquisition or sale of the same security with the accumulated cost exceeding NT$300 millionor 20% of the Company’s paid-in capital: None.
E. Acquisition of real estate reaching NT$300 million or 20% of paid-in capital or more: Pleaserefer to table 4.
F. Disposal of real estate reaching NT$300 million or 20% of paid-in capital or more: None.
G. Purchases or sales of goods from or to related parties reaching NT$100 million or 20% ofpaid-in capital or more: Please refer to table 5.
H. Receivables from related parties reaching NT$100 million or 20% of paid-in capital or more:Please refer to table 6.
I. Trading in derivative instruments undertaken during the reporting periods: Please refer toNotes 6(2) and (13).
J. Significant inter-company transactions during the reporting periods: Please refer to table 7.
(2) Information on investees
Names, locations and other information of investee companies (not including investees inMainland China): Please refer to table 8.
(3) Information on investments in Mainland China
A. Basic information: Please refer to table 9.
B. Significant transactions, either directly or indirectly through a third area, with investeecompanies in the Mainland Area: Please refer to table 9.

178
14. SEGMENT INFORMATION
(1) General information
Management has determined the reportable operating segments based on the reports reviewed bythe chief operating decision-maker that are used to make strategic decisions. The Group’s chiefoperating decision-maker manages business from the perspectives of cloud computing productbusiness group and mobile communication product business group.
The Group’s company organization, basis of department segmentation and principles formeasuring segment information for the period were not significantly changed.
(2) Information about segment profit or loss, assets and liabilities
The segment information provided to the chief operating decision-maker for the reportablesegments and reconciliations are as follows:
For the year ended December 31, 2015
ItemCloud computing
business group
Mobilecommunicationsbusiness group Others Total
Revenue $ 43,061,238 $ 5,504,762 $ 1,488,765 $ 50,054,765
Segment gain (loss) 1,175,122 ( 489,254 ) ( 389,398 ) 296,470
For the year ended December 31, 2014
ItemCloud computing
business group
Mobilecommunicationsbusiness group Others Total
Revenue $ 33,106,750 $ 7,484,957 $ 1,468,635 $ 42,060,342
Segment gain (loss) 728,770 ( 845,236 ) ( 244,463 ) ( 360,929 )
(3) Reconciliation for segment income (loss)
The revenue from external customers reported to the chief operating decision-maker is measuredin a manner consistent with that in the statement of comprehensive income.
A reconciliation of loss for reportable segments to profit before tax and discontinued operationsis provided as follows:
ItemFor the year endedDecember 31, 2015
For the year endedDecember 31, 2014
Profit (loss) for reportable segments $ 296,470 ( $ 360,929)
Unallocated:
Share of profits and losses from affiliatesand joint ventures accounted for underthe equity method 1,380,981 1,213,705
(Loss) gain on disposal of investments ( 16,506) 58,609
Dividend revenue 119,828 105,534
Interest revenue 99,428 147,848
Other income 133,902 ( 113,944)
Profit before tax and discontinued operations $ 2,014,103 $ 1,050,823

179
(4) Information on products and services
For the year endedDecember 31, 2015
For the year endedDecember 31, 2014
Sales $ 49,398,546 $ 41,701,620
Other revenue 656,219 358,722
Total $ 50,054,765 $ 42,060,342
(5) Geographical information
For the years ended December 31, 2015 and 2014, revenues and noncurrent assets from certainregions are listed below:
For the year ended December 31, 2015 For the year ended December 31, 2014
Revenue Assets-Noncurrent Revenue Assets-Noncurrent
Taiwan $ 493,401 $ 3,120,562 $ 367,000 $ 2,957,166
USA 28,538,674 853,376 22,295,017 846,142
Europe 12,048,256 135,307 10,558,842 154,916
Others 8,974,434 2,830,244 8,839,483 2,938,203
Total $ 50,054,765 $ 6,939,489 $ 42,060,342 $ 6,896,427
(6) Major customer information
For the years ended December 31, 2015 and 2014, the major customer information of the Groupare listed below:
For the year ended December 31, 2015
Customer RevenuePercentage oftotal revenue Segment
Customer B $ 29,663,727 59% Cloud computing product businessgroup
For the year ended December 31, 2014
Customer RevenuePercentage oftotal revenue Segment
Customer B $ 21,205,664 50% Cloud computing product businessgroup

Item Value
0MiTAC Holdings
Corp.
MiTAC
International
Corp.
Y
Other
receivables-
related
parties
2,500,000 2,500,000 1,500,0000.7577%-
0.96%2 0 Operations 0 None 0 3,362,838 6,725,675
0MiTAC Holdings
Corp.
MiTAC
Computing
Technology
Corp.
Y
Other
receivables-
related
parties
1,000,000 1,000,000 - 0 2 0 Operations 0 None 0 3,362,838 6,725,675
1MiTAC
International Corp.
MiTAC
Computing
Technology
Corp.
Y
Other
receivables-
related
parties
1,000,000 1,000,000 984,7500.8082%~0.8
788%2 0 Operations 0 None 0 2,673,595 5,347,189
2Silver Star
Developments Ltd.
Top Sheen
Enterprises Ltd.Y
Other
receivables-
related
parties
821,750 820,625 820,625 0 2 0 Operations 0 None 0 14,147,273 14,147,273
2Silver Star
Developments Ltd.
MiTAC
International
Corp.
Y
Other
receivables-
related
parties
821,750 754,975 754,975 0 2 0 Operations 0 None 0 6,891,687 6,891,687
2Silver Star
Developments Ltd.
Software
Insights Ltd.Y
Other
receivables-
related
parties
32,870 32,825 32,825 0 2 0 Operations 0 None 0 14,147,273 14,147,273
2Silver Star
Developments Ltd.
MiTAC Digital
CorporationY
Other
receivables-
related
parties
975,000 951,925 951,925 0 2 0 Operations 0 None 0 14,147,273 14,147,273
2Silver Star
Developments Ltd.Best Profit Ltd. Y
Other
receivables-
related
parties
858,778 857,602 857,602 0 2 0 Operations 0 None 0 14,147,273 14,147,273
2Silver Star
Developments Ltd.
MiTAC Europe
Ltd.Y
Other
receivables-
related
parties
189,000 143,520 143,520 0 2 0 Operations 0 None 0 14,147,273 14,147,273
2Silver Star
Developments Ltd.
Mio
Technology
Ltd.
Y
Other
receivables-
related
parties
103,520 74,925 74,925 0 2 0 Operations 0 None 0 14,147,273 14,147,273
(Except as otherwise indicated)
Maximum outstanding
balance during the year
ended December 31,
2015
Balance at December
31, 2015
(Note 8)
Actual amount
drawn downNo. Creditor Borrower
General
ledger
account
Expressed in thousands of NTD
MITAC HOLDINGS CORPORATION AND SUBSIDIARIES
Loans to others
For the year ended December 31, 2015
Table 1
Is a related
party
CollateralLimit on loans
granted to a single
party
Ceiling on total
loans granted FootnoteInterest rate
Nature of
loan
Amount of
transactions
with the
borrower
Reason for
short-term
financing
Allowance
for
doubtful
accounts
180
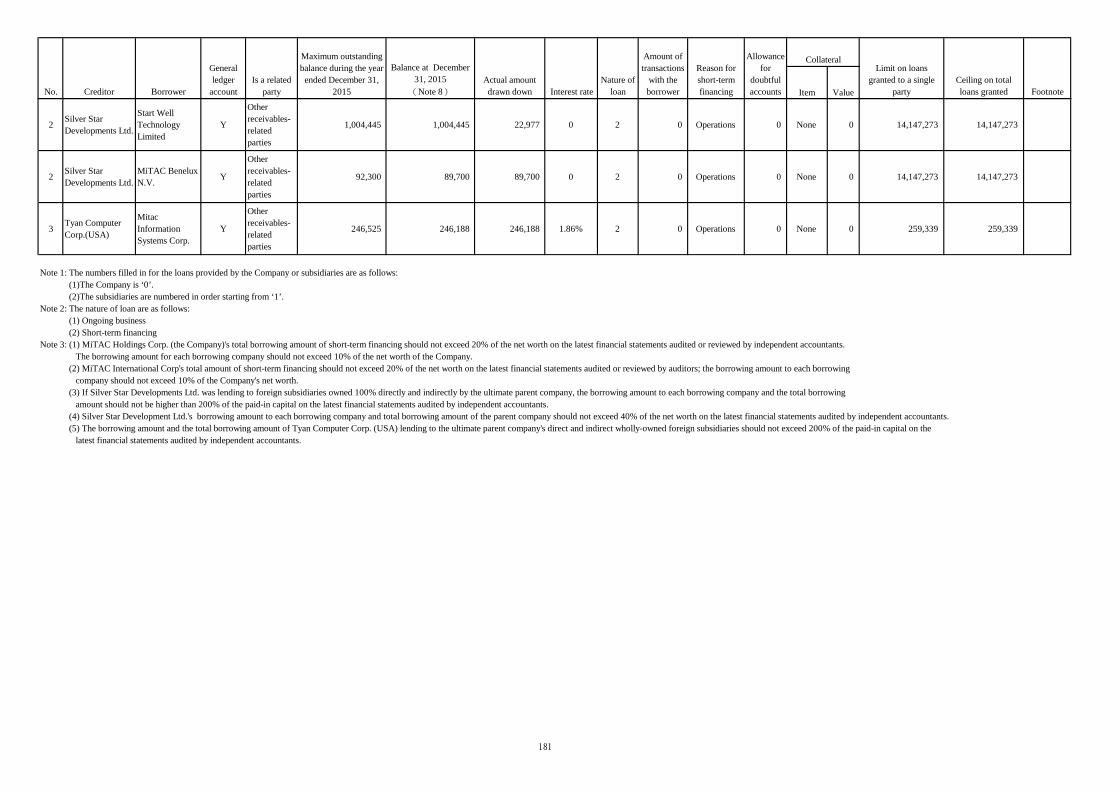
Item Value
Maximum outstanding
balance during the year
ended December 31,
2015
Balance at December
31, 2015
(Note 8)
Actual amount
drawn downNo. Creditor Borrower
General
ledger
account
Is a related
party
CollateralLimit on loans
granted to a single
party
Ceiling on total
loans granted FootnoteInterest rate
Nature of
loan
Amount of
transactions
with the
borrower
Reason for
short-term
financing
Allowance
for
doubtful
accounts
2Silver Star
Developments Ltd.
Start Well
Technology
Limited
Y
Other
receivables-
related
parties
1,004,445 1,004,445 22,977 0 2 0 Operations 0 None 0 14,147,273 14,147,273
2Silver Star
Developments Ltd.
MiTAC Benelux
N.V.Y
Other
receivables-
related
parties
92,300 89,700 89,700 0 2 0 Operations 0 None 0 14,147,273 14,147,273
3Tyan Computer
Corp.(USA)
Mitac
Information
Systems Corp.
Y
Other
receivables-
related
parties
246,525 246,188 246,188 1.86% 2 0 Operations 0 None 0 259,339 259,339
Note 1: The numbers filled in for the loans provided by the Company or subsidiaries are as follows:
(1)The Company is ‘0’.
(2)The subsidiaries are numbered in order starting from ‘1’.
Note 2: The nature of loan are as follows:
(1) Ongoing business
(2) Short-term financing
Note 3: (1) MiTAC Holdings Corp. (the Company)'s total borrowing amount of short-term financing should not exceed 20% of the net worth on the latest financial statements audited or reviewed by independent accountants.
The borrowing amount for each borrowing company should not exceed 10% of the net worth of the Company.
(2) MiTAC International Corp's total amount of short-term financing should not exceed 20% of the net worth on the latest financial statements audited or reviewed by auditors; the borrowing amount to each borrowing
company should not exceed 10% of the Company's net worth.
(3) If Silver Star Developments Ltd. was lending to foreign subsidiaries owned 100% directly and indirectly by the ultimate parent company, the borrowing amount to each borrowing company and the total borrowing
amount should not be higher than 200% of the paid-in capital on the latest financial statements audited by independent accountants.
(4) Silver Star Development Ltd.'s borrowing amount to each borrowing company and total borrowing amount of the parent company should not exceed 40% of the net worth on the latest financial statements audited by independent accountants.
(5) The borrowing amount and the total borrowing amount of Tyan Computer Corp. (USA) lending to the ultimate parent company's direct and indirect wholly-owned foreign subsidiaries should not exceed 200% of the paid-in capital on the
latest financial statements audited by independent accountants.
181

Company name
Relationship
with the
endorser/
guarantor
(Note 2)
0 MiTAC
Holdings Corp.
Tyan Computer
Corp.(USA)
3 16,814,189$ 98,280$ 98,280$ 98,280$ -$ 0.29 16,814,189$ Y N N
0 MiTAC
Holdings Corp.
MiTAC Computing
Technology Corp.
2 16,814,189 1,276,120 1,089,795 1,089,795 - 3.24 16,814,189 Y N N
0 MiTAC
Holdings Corp.
MiTAC Information
Systems Corp.
3 16,814,189 163,500 163,500 163,500 - 0.49 16,814,189 Y N N
0 MiTAC
Holdings Corp.
Tsu Sung
Investment Corp
3 16,814,189 100,000 100,000 - - 0.30 16,814,189 Y N N
1 MiTAC
International
Corp.
MiTAC Digital
Corporation
3 13,367,973 223,027 209,775 16,553 - 0.78 13,367,973 N N N
1 MiTAC
International
Corp.
MiTAC Information
Systems Corp.
3 13,367,973 91,140 - - - - 13,367,973 N N N
1 MiTAC
International
Corp.
MiTAC Computing
Technology Corp.
3 13,367,973 2,848,300 1,873,300 87,525 - 7.01 13,367,973 N N N
2 MiTAC
Computing
Technology
Corp.
MiTAC
International Corp.
3 2,297,797 1,749,300 774,300 - - 16.85 2,297,797 N N N
Note 1: The numbers filled in for the endorsements/guarantees provided by the Company or subsidiaries are as follows:
(1) The Company is ‘0’.
(2) The subsidiaries are numbered in order starting from ‘1’.
Note 2: Relationship between the endorser/guarantor and the party being endorsed/guaranteed is classified into the following six categories; fill in the number of category each case belongs to:
(1) The endorser/guarantor parent company owns directly more than 50% voting shares of the endorsed/guaranteed subsidiary.
(2) The endorser/guarantor parent company and its subsidiaries jointly own more than 50% voting shares of the endorsed/guaranteed company.
Note 3: (1) The endorsement and guarantees amount provided by MiTAC Holdings Corp. to each entity which is directly or indirectly held 50% or more of the voting power by the company should not exceed 50% of the net
worth on the latest financial statements audited or reviewed by independent accountants.
Expressed in thousands of NTD
MITAC HOLDINGS CORPORATION AND SUBSIDIARIES
Provision of endorsements and guarantees to others
For the year ended December 31, 2015
Table 2
(Except as otherwise indicated)
Outstanding
endorsement/
guarantee
amount at
December 31,
2015
Actual amount
drawn down
Number
(Note 1)
Endorser/
guarantor
Party being
endorsed/guaranteed
Limit on
endorsements/
guarantees
provided for a
single party
( Note 3 )
Maximum
outstanding
endorsement/
guarantee
amount as of
December 31,
2015
Provision of
endorsements/
guarantees to
the party in
Mainland
China Footnote
Amount of
endorsements/
guarantees
secured with
collateral
Ratio of
accumulated
endorsement/
guarantee
amount to net
asset value of
the endorser/
guarantor
company
Ceiling on
total amount of
endorsements/
guarantees
provided
(Note 3)
Provision of
endorsements/
guarantees by
parent
company to
subsidiary
Provision of
endorsements/
guarantees by
subsidiary to
parent
company
182

Company name
Relationship
with the
endorser/
guarantor
(Note 2)
Outstanding
endorsement/
guarantee
amount at
December 31,
2015
Actual amount
drawn down
Number
(Note 1)
Endorser/
guarantor
Party being
endorsed/guaranteed
Limit on
endorsements/
guarantees
provided for a
single party
( Note 3 )
Maximum
outstanding
endorsement/
guarantee
amount as of
December 31,
2015
Provision of
endorsements/
guarantees to
the party in
Mainland
China Footnote
Amount of
endorsements/
guarantees
secured with
collateral
Ratio of
accumulated
endorsement/
guarantee
amount to net
asset value of
the endorser/
guarantor
company
Ceiling on
total amount of
endorsements/
guarantees
provided
(Note 3)
Provision of
endorsements/
guarantees by
parent
company to
subsidiary
Provision of
endorsements/
guarantees by
subsidiary to
parent
company
(2) MiTAC Holding Corp's total endorsements and guarantees should not exceed 50% of the net worth on the latest financial statements audited or reviewed by independent accountants.
(3) The endorsement and guarantees amount provided by MiTAC International Corp. to each entity which is directly or indirectly held 50% or more of the voting power should not exceed 50% of its net worth on
the latest financial statements audited or reviewed by independent accountants.
(4) The endorsement and guarantees amount provided by MiTAC International Corp. to each entity which the ultimate parent company directly or indirectly holds 100% of the voting power should not exceed 50% of its
net worth on the latest financial statements audited or reviewed by independent accountants.
(5) MiTAC Internatioal Corp.'s total endorsements and guarantees should not exceed 50% of the net worth on the latest financial statmeents audited or reviewed by independent accountants.
183

Number of shares Book value Ownership (%) Fair value
MiTAC International Corp. MiTAC International Corp. Same board chairman
Financial assets
carried at cost-non
current
22,067,969 586,164$ 8.69 586,164$
MiTAC International Corp. Overseas Investment & Development Corp. None
Financial assets
carried at cost-non
current
1,000,000 10,000 1.11 10,000
MiTAC International Corp. Harbinger Venture Management Co., Ltd. Same board chairman
Financial assets
carried at cost-non
current
7,727,225 34,584 14.05 34,584
MiTAC International Corp. Harbinger VI Same board chairman
Financial assets
carried at cost-non
current
6,015,937 60,159 13.28 60,159
MiTAC International Corp. Harbinger VII Same board chairman
Financial assets
carried at cost-non
current
7,500,000 75,000 10.73 75,000
MiTAC International Corp. UPC Technology Corp. Same board chairman
Available-for-sale
financial assets-non
current
14,193,179 134,693 1.21 134,693
MiTAC International Corp. Lien Hwa Industrial Corp. Same board chairman
Available-for-sale
financial assets-non
current
14,572,439 276,876 1.64 276,876
MiTAC International Corp. MiTAC Information Technology Corp.
The Company's
chairman is MiTAC
Inc.'s director.
Available-for-sale
financial assets-non
current
6,520,558 49,935 6.52 49,935
MiTAC International Corp. Linpus Technology Corp. None
Available-for-sale
financial assets-non
current
2,205,020 35,532 16.33 35,532 Note 2
Tsu Fung Investment Corp. Synnex Technology International Corp. None
Available-for sale
financial assets-
current
3,297,119 105,673 0.21 105,673
Tsu Fung Investment Corp. UPC Technology Corp. None
Available-for sale
financial assets-
current
14,351,669 136,197 1.23 136,197
Tsu Fung Investment Corp. Lien Hwa Industrial Corp. None
Available-for sale
financial assets-
current
52,000 988 0.01 988
Tsu Fung Investment Corp. MiTAC Holding Corp.Ultimate parent
company
Available-for sale
financial assets-
current
10,183,284 253,055 1.32 253,055 Note 1
Expressed in thousands of NTD
MITAC HOLDINGS CORPORATION AND SUBSIDIARIES
Holding of marketable securities at the end of the period (not including subsidiaries, associates and joint ventures)
December 31, 2015
Table 3
(Except as otherwise indicated)
FootnoteSecurities held by Marketable securities
Relationship with the
securities issuer
General ledger
account
As of December 31, 2015
184

Number of shares Book value Ownership (%) Fair value FootnoteSecurities held by Marketable securities
Relationship with the
securities issuer
General ledger
account
As of December 31, 2015
Tsu Fung Investment Corp. Getac Technology Corp. None
Available-for sale
financial assets-
current
10,329,741 207,111$ 1.77 207,111$
Tsu Fung Investment Corp. Loyalty Founder Enterprise Co., Ltd. None
Available-for sale
financial assets-
current
51,331 521 0.04 521
Tsu Fung Investment Corp. National Aerospace Fasteners Corporation None
Available-for sale
financial assets-
current
1,188 66 0.00 66
Tsu Fung Investment Corp. J Touch Corporation None
Available-for sale
financial assets-
current
638,000 2,731 0.45 2,731
Tsu Fung Investment Corp. Uni-President Assets Management Corp. None
Available-for sale
financial assets-
current
4,719,599 77,039 0.00 77,039
Tsu Fung Investment Corp. Prudential Financial Money Market Fund None
Available-for sale
financial assets-
current
4,199,654 65,500 0.00 65,500
Tsu Fung Investment Corp. Linpus Technology Corp. None
Available-for-sale
financial assets-non
current
493,516 7,952 3.66 7,952 Note 2
MiTAC International Corp. Harbinger Venture Management Co., Ltd. None
Available-for-sale
financial assets-non
current
684,316 479 19.99 479
MiTAC International Corp. Cirocomm Technology None
Available-for-sale
financial assets-non
current
2,352,086 13,863 4.73 13,863
MiTAC International Corp. G. Marso Electronics, Inc. None
Available-for-sale
financial assets-non
current
253,363 - 1.16 -
MiTAC International Corp. MiTAC Information Technology Corp. None
Available-for-sale
financial assets-non
current
3,965,814 30,370 3.97 30,370
MiTAC International Corp. Tung Da Investment Co., Ltd. None
Available-for-sale
financial assets-non
current
4,630,492 47,384 19.99 47,384 Note 3
MiTAC International Corp. Lien Yung Investment Corp. None
Financial assets
carried at cost-non
current
9,015,254 87,969 19.99 87,969
MiTAC International Corp. MiTAC Inc. None
Financial assets
carried at cost-non
current
11,162,880 277,785 4.40 277,785
Silver Star Developments Ltd.(SSDL)
and its subsidiariesBudworth Investments Ltd. None
Financial assets
carried at cost-non
current
2,297,875 11,388 14.83 11,388
185

Number of shares Book value Ownership (%) Fair value FootnoteSecurities held by Marketable securities
Relationship with the
securities issuer
General ledger
account
As of December 31, 2015
Silver Star Developments
Ltd.(SSDL)and its subsidiariesGlobal Strategic Investment Inc. None
Financial assets
carried at cost-non
current
245,000 -$ 1.26 -$
Silver Star Developments
Ltd.(SSDL)and its subsidiariesGapura Inc. None
Available-for-sale
financial assets-non
current
295,831 - 5.55 -
Silver Star Developments
Ltd.(SSDL)and its subsidiariesPanasas Inc. None
Available-for-sale
financial assets-non
current
13,913 - 0.04 -
Silver Star Developments
Ltd.(SSDL)and its subsidiariesRasilent Systems Inc. None
Available-for-sale
financial assets-non
current
1,210,763 - 3.88 -
Silver Star Developments
Ltd.(SSDL)and its subsidiariesGlobal Strategic Investment Inc.(SAMOA) None
Available-for-sale
financial assets-non
current
434,946 15,105 1.23 15,105
Silver Star Developments
Ltd.(SSDL)and its subsidiariesCirocomm Technology Corp. None
Available-for-sale
financial assets-non
current
2,352,086 13,863 4.73 13,863
Silver Star Developments
Ltd.(SSDL)and its subsidiariesPhysi-Cal Enterprises None
Available-for-sale
financial assets-non
current
354 - 8.41 -
Silver Star Developments
Ltd.(SSDL)and its subsidiariesSynnex Technology International Corp. None
Available-for-sale
financial assets-non
current
2,955,921 94,737 0.19 94,737
Silver Star Developments
Ltd.(SSDL)and its subsidiariesMiTAC Holding Corp.
Ultimate parent
company
Available-for-sale
financial assets-non
current
1,381,944 34,341 0.18 34,341 Note 1
Note 1: The Company's shares held by Tsu Fung Investment Corp. and Silver Star Developments Ltd. are accounted for as treasury stocks.
Note 2: The Company's subsidiary - Tsu Fung Investment Corp. transferred its ownership of Linpus Technolgy Corp. by the net worth value to MiTAC International Corp. Such disposal gain has not been realised.
Note 3: MiTAC International Corp. sold its shares of Tung Da Investment Co., Ltd. to Tsu Fung Investment Corp.,and such disposal gain has not yet been realised.
186

Original
owner who
sold the real
estate to the
counterparty
Relationship
between the
original
owner and the
acquirer
Date of the
original
transaction Amount
MiTAC
International
Corp.
Corporate
Headquarters
Building
(booked as
construction in
progress)
2015.02.02 $ 1,634,000
In accordance
with the
provisions of the
contract
J.J.PAN AND
PARTERS, Architects
and Planners;
Lee Ming Construction
Co., Ltd.;
Environetics Design
Group, Inc.;
Herpin
Communication
Engineering Co., Ltd.
Non-related
party- - - -
Negotiation with
each other
Based on the
group's business
strategy
development,
the corporate
headquarters
building will be
the R&D center
to strengthen
our Taiwan
roots and
prepare for
future growth.
None
Expressed in thousands of NTD
MITAC HOLDINGS CORPORATION AND SUBSIDIARIES
Acquisition of real estate reaching NT$300 million or 20% of paid-in capital or more
For the year ended December 31, 2015
Table 4
(Except as otherwise indicated)
Note : Date of the event referred to herein is the date of contract signing date, date of payment, date of execution of a trading order, date of title transfer, date of board resolution, or other date that can confirm the counterparty and the
monetary amount of the transaction, whichever is earlier.
Relationship
with the
counterparty
If the counterparty is a related party, information as to the last
transaction of the real estate is disclosed below:
Basis or
reference used
in setting the
price
Reason for
acquisition of
real estate and
status of the real
estate
Other
commitmentsCounterparty
Real estate
acquired by
Real estate
acquired
Date of the
event(Note)
Transaction
amount
Status of
payment
187

Purchases
(sales) Amount
Percentage of
total purchases
(sales) Credit term Unit price Credit term Balance
Percentage of
total
notes/accounts
receivable
(payable)
MiTAC International Corp. MiTAC Digital Corp. Subsidary Sales 656,186)( 14.14% Note 1 Note 3 Note 1 72,087$ 6.98%
MiTAC International Corp. MiTAC Europe Ltd. Subsidary Sales 530,931)( 11.44% Note 1 Note 3 Note 1 321,128 31.11%
MiTAC International Corp. MiTAC Australia Pty Ltd. Subsidary Sales 363,592)( 7.84% Note 1 Note 3 Note 1 236,930 22.95%
MiTAC International Corp.MiTAC Computer (Kunshan)
Ltd.Subsidary Purchases 1,624,376 46.67% Note 2 Note 3 Note 2 1,326,202)( 69.05%
MiTAC International Corp. MiTAC Computer (Shunde) Ltd. Subsidary Purchases 380,933 10.94% Note 2 Note 3 Note 2 298,051)( 15.52%
MiTAC Computing
Technology Corp.
MiTAC Information Systems
Corp.Subsidary Sales 15,574,004)( 54.79% Note 1 Note 3 Note 1 3,316,499 65.62%
MiTAC Computing
Technology Corp.MiTAC Computer (Shunde) Ltd. Affiliate Purchases 7,688,072 32.63% Note 2 Note 3 Note 2 3,170,986)( 73.81%
MiTAC Computing
Technology Corp.Tyan Computer Corp.(USA) Subsidary Sales 1,406,834)( 4.95% Note 1 Note 3 Note 1 246,422 4.88%
MiTAC Computing
Technology Corp.Tyan Computer Corp.(USA) Subsidary Purchases 545,877 2.32% Note 2 Note 3 Note 2 - -
MiTAC Computing
Technology Corp.MiTAC Logistics Corp. Subsidary Sales 733,560)( 2.58% Note 1 Note 3 Note 1 103,166 2.04%
MiTAC Computing
Technology Corp.
MiTAC Computer (Kunshan)
Ltd.Affiliate Purchases 103,361 0.44% Note 2 Note 3 Note 2 101,534)( 2.36%
MiTAC Computing
Technology Corp.Synnex Corp. and its subsidary Associate Sales 1,213,711)( 4.27% Note 1 Note 3 Note 1 252,691 5.00%
MiTAC Computing
Technology Corp.
Loyalty Founder Enterprise Co.,
Ltd.Associate Purchases 667,524 2.83% Note 2 Note 3 Note 2 172,914)( 4.03%
Silver Star Developments
Ltd.(SSDL) and its subsidiaryMiTAC International Corp. Parent Company Sales 2,007,905)( 10.13% Note 1 Note 3 Note 1 1,624,253 23.88%
Notes/accounts receivable (payable)
Expressed in thousands of NTD
MITAC HOLDINGS CORPORATION AND SUBSIDIARIES
Purchases or sales of goods from or to related parties reaching NT$100 million or 20% of paid-in capital or more
For the year ended December 31, 2015
Table 5
Purchaser/seller Counterparty
Relationship with
the
counterparty
Transaction
Differences in transaction
terms
(Except as otherwise indicated)
188

Purchases
(sales) Amount
Percentage of
total purchases
(sales) Credit term Unit price Credit term Balance
Percentage of
total
notes/accounts
receivable
(payable)
Notes/accounts receivable (payable)
Purchaser/seller Counterparty
Relationship with
the
counterparty
Transaction
Differences in transaction
terms
Silver Star Developments
Ltd.(SSDL) and its subsidiaryMiTAC International Corp. Parent Company Purchases 1,569,776 8.67% Note 2 Note 3 Note 2 635,883)( 15.53%
Silver Star Developments
Ltd.(SSDL) and its subsidiary
MiTAC Computing Technology
Corp.Affiliate Sales 7,791,433)( 39.30% Note 1 Note 3 Note 1 3,315,833 48.76%
MiTAC Technology UK Ltd.
And its subsidiary
MiTAC Computing Technology
Corp.Parent Company Purchases 547,971)( 1.69% Note 1 Note 3 Note 1 - -
MiTAC Technology UK Ltd.
And its subsidiary
MiTAC Computing Technology
Corp.Parent Company Sales 17,714,398 55.76% Note 2 Note 3 Note 2 3,666,088)( 69.39%
Note 1: The Group's credit term for foreign related parties is to collect within 5 months based on the net amount of receivables after offseting against payables, which takes into consideration the reasonable amount of
time for the Company to ship products to each company and for the companies to sell the products and collect the sales. The Group's credit term for domestic related parties is 3 months from the date of
shiipment for the collection of the net amount of receivables after offsetting against payables; the credit term for third parties is an average of 3 months after the date of shipment.
Note 2: The Group's payment term for foreign related parties is within 5 months for the collection of the net amount of receivables after offsetting against payables, which is in accordance with the Group's credit
policies of accounts receivable with foreign related parties, the Grouup's payment term for domestic related parties is 3 months from the date of shipment from the counterparty for the net amount of receivables
after offsetting against payables; the payment term for third parties is an average of 3 months after the date of shipment from the counterparty.
Note 3: The selling price to related parties is based on market value.
189

Table 6
Amount
receivables
Other
receivables Amount
Action
taken
MiTAC Holdings Corp. MiTAC Computing Technology Corp. Subsidiary -$ 195,495$ - -$Not
Applicable-$ -$
MiTAC International Corp. MiTAC Europe Ltd. Subsidiary 321,128 648 1.96 51,334Not
Applicable59,662
-
MiTAC International Corp. MiTAC Australia Pty Ltd. Subsidiary 236,930 2,013 1.49 -Not
Applicable59,058
-
MiTAC International Corp. MiTAC Holdings Corp. Parent Company - 114,883 - -Not
Applicable-
-
MiTAC Computing Technology Corp. MiTAC Information Systems Corp. Subsidiary 3,316,499 - 4.08 -Not
Applicable1,121,796
-
MiTAC Computing Technology Corp. MiTAC Logistics Corp. Subsidiary 103,166 250 7.14 -Not
Applicable121,367
-
MiTAC Computing Technology Corp. Synnex Corp. and its subsidiary Associate 252,691 - 9.61 -Not
Applicable253,269
-
MiTAC Computing Technology Corp. Tyan Computer Corp.(USA) Subsidiary 246,422 461 6.97 -Not
Applicable274,026
-
Silver Star Developments
Ltd.(SSDL) and its subsidiaryMiTAC International Corp. Parent Company 1,624,253 9,841 1.18 -
Not
Applicable215,275
-
Silver Star Developments
Ltd.(SSDL) and its subsidiaryMiTAC Computing Technology Corp. Affiliate 3,315,833 57,321 1.89 -
Not
Applicable1,333,929
-
MITAC HOLDINGS CORPORATION AND SUBSIDIARIES
Receivables from related parties reaching NT$100 million or 20% of paid-in capital or more
December 31, 2015
Expressed in thousands of NTD
(Except as otherwise indicated)
Balance as at December 31, 2015Amount collected
subsequent to the
balance sheet date
Allowance for
doubtful accountsCreditor Counterparty
Relationship
with the
counterparty Turnover rate
Overdue receivables
190

General ledger account Amount Transaction terms
Percentage of consolidated
total operating revenues or
total assets (Note 3)
0 MiTAC Holdings Corp. MiTAC International Corp. 1 Other receivables $ 1,500,909 3.32%
1 MiTAC International Corp. MiTAC Computing Technology Corp. 3 Other income 238,486 0.48%
1 MiTAC International Corp. MiTAC Computing Technology Corp. 3 Other receivables 1,040,842 2.30%
1 MiTAC International Corp. Silver Star Developments Ltd. and its subsidiary 3 Sales 1,569,776 Note 4 3.14%
1 MiTAC International Corp. Silver Star Developments Ltd. and its subsidiary 3 Purchases 2,007,905 Note 5 4.01%
1 MiTAC International Corp. Silver Star Developments Ltd. and its subsidiary 3 Accounts receivable 635,883 Note 4 1.41%
1 MiTAC International Corp. Silver Star Developments Ltd. and its subsidiary 3 Accounts payable 1,624,253 Note 5 3.60%
2 MiTAC Computing Technology Corp. MiTAC Technology UK Ltd. and its subsidiary 3 Sales 17,714,398 Note 4 35.39%
2 MiTAC Computing Technology Corp. MiTAC Technology UK Ltd.and its subsidiary 3 Purchases 547,971 Note 5 1.09%
2 MiTAC Computing Technology Corp. MiTAC Technology UK Ltd. and its subsidiary 3 Accounts receivable 3,666,088 Note 4 8.12%
2 MiTAC Computing Technology Corp. Silver Star Developments Ltd.and its subsidiary 3 Purchases 7,791,433 Note 5 15.57%
2 MiTAC Computing Technology Corp. Silver Star Developments Ltd.and its subsidiary 3 Accounts payable 3,315,833 Note 5 7.34%
3 Silver Star Developments Ltd. and its subsidiary MiTAC International Corp. 3 Other receivables 764,816 1.69%
Note 1: The numbers filled in for the transaction company in respect of inter-company transactions are as follows:
(1) Parent company is "0".
(2) The subsidiaries are numbered in order starting from "1".
(1) Parent company to subsidiary.
(2) Subsidiary to parent company.
(3) Subsidiary to subsidiary.
Note 6: The Company may decide to disclose or not to disclose transaction details in this table based on the Materiality Principle.
(Except as otherwise indicated)
MITAC HOLDINGS CORPORATION AND SUBSIDIARIES
Significant inter-company transactions during the reporting periods
For the year ended December 31, 2015
Table 7 Expressed in thousands of NTD
Note 4: The Group's credit term for foreign related parties is 5 months for the collection of the net amount of receivables after offsetting against payables, which takes into consideration the reasonable amount of time for the Company
to ship the products to each company and for the collection of the accounts. The company's sales price with related parties is based on the intermational market trends and the region the sales were made.
Note 5: The Group's payment term for foreign related parties is 5 months for the collection of the net amount of receivables after offsetting against payables after checking and the transaction price is based on the international market
trends and the region the sales were made.
Note 2: Relationship between transaction company and counterparty is classified into the following three categories:
Note 3: Regarding percentage of transaction amount to consolidated total operating revenues or total assets, it is computed based on period-end balance of transaction to consolidated total assets for balance sheet accounts and based on
accumulated transaction amount for the period to consolidated total operating revenues for income statement accounts.
Number
(Note 1) Company name Counterparty
Relationship
(Note 2)
Transaction
191

Balance as at
December 31,
2015
Balance as at
December 31,
2014
Number of shares
(Note)
Ownership
(%) Book value
MiTAC Holding Corp. MiTAC International Corp. Taiwan
Development, design
and manufacturing and
sale of computers and
its peripherals,
telecommunication
related products
26,239,187$ 26,239,187$ 1,429,218,313 100.00 26,477,089$ 810,982$ 810,982$ Subsidiary
MiTAC Holding Corp.MiTAC Computing Technology
Corp.Taiwan
Development, design
and manufacturing and
sale of computers and
its peripherals,
telecommunication
related products
3,419,621 3,419,621 232,757,102 100.00 4,539,810 960,370 960,370 Subsidiary
MiTAC International Corp. Getac Technology Corp. Taiwan
Manufacturing and sale
of notebook computers,
military and industrial
computer systems, etc.
1,391,549 1,391,549 190,396,939 32.90 4,512,388 1,274,281 Associate
MiTAC International Corp. Tsu Fung Investment Corp. Taiwan Investment 625,000 625,000 128,584,651 100.00 1,336,768 29,583 Subsidiary
MiTAC International Corp. 3Probe Technologies Corp. Taiwan
Information process
service, sales of
software and
international trading.
16,839 16,839 1,086,000 23.25 10,077 5,652 Associate
MiTAC International Corp. DLC Technology Corp. Taiwan
Research, development
and related technical
advisory services
- 25,755 - 100.00 - -
Subsidiary
in the
processing
of
liquidation
MiTAC International Corp. Lian Jie Investment Co., Ltd. Taiwan Investment 113,057 113,057 11,305,650 49.98 122,040 19,020 Associate
MITAC HOLDINGS CORPORATION AND SUBSIDIARIES
Net profit (loss)
of the investee
for the year
ended December
31, 2015
Investment
income (loss)
recognised by the
Company for the
year ended
December 31,
2015 FootnoteInvestor Investee Location
Main business
activities
Initial investment amount Shares held as at December 31, 2015
Information on investees
For the year ended December 31, 2015
Table 8
Expressed in thousands of NTD
(Except as otherwise indicated)
192

Balance as at
December 31,
2015
Balance as at
December 31,
2014
Number of shares
(Note)
Ownership
(%) Book value
Net profit (loss)
of the investee
for the year
ended December
31, 2015
Investment
income (loss)
recognised by the
Company for the
year ended
December 31,
2015 FootnoteInvestor Investee Location
Main business
activities
Initial investment amount Shares held as at December 31, 2015
MiTAC International Corp. Lian Jie II Investment Co., Ltd. Taiwan Investment 32,500 - 3,250,000 32.50 32,474 79)( Associate
MiTAC International Corp.Silver Star Developments
Ltd.and its subsidiary
British Virgin
IslandsInvestment 7,073,637 7,073,637 215,495,404 100.00 17,469,022 827,968 Subsidiary
MiTAC International Corp.Loyalty Founder Enterprise Co.,
Ltd.Taiwan
Sales and
manufacturing of metal
and plastic electronics
enclosure
150,000 150,000 36,368,453 25.24 381,096 42,274 Associate
MiTAC International Corp. Green Share Corp. Taiwan Investment 85,594 85,594 8,559,400 47.55 83,018 362)( Associate
MiTAC International Corp.Shen-Tong Construction &
Development Co., ltd.Taiwan
Building and factory
construction, leasing
and sales
30,704 30,704 2,000,000 100.00 22,561 1,399 Subsidiary
MiTAC International Corp. Mio Technology Corp. Taiwan
Sale of communication
products and related
after-sale services
8,550 8,550 166,667 100.00 594 104 Subsidiary
MiTAC International Corp. MiWell Technology Corp. Taiwan
Information / software
services and retail
business
7,839 7,839 783,900 48.99 8,774 2,545 Associate
MiTAC Computing Technology
Corp.
MiTAC Technology UK Ltd.
and its subsidiaryUK
Sale of computers and
its peripherals, and
hardware, software and
related products
1,948,381 1,948,381 62,909,737 100.00 2,124,280 140,146 Subsidiary
Silver Star Developments Ltd.
and its subsidiaries
Harbinger II(BVI) Venture
Capital Corp.
British Virgin
IslandsInvestment 29,814 29,814 908,284 49.96 27,148 10,387)( Associate
Silver Star Developments Ltd.
and its subsidiariesMainpower International Ltd.
British Virgin
IslandsInvestment 180,538 180,538 5,500,001 14.76 199,908 1,059)( Associate
Silver Star Developments Ltd.
and its subsidiariesSynnex Corp. USA
Information process
services, sales of
computer peripheral,
system and network
products
534,592 534,592 5,551,764 13.99 8,287,761 6,539,520 Associate
Silver Star Developments Ltd.
and its subsidiariesHarbinger Ruyi Venture Ltd.
British Virgin
IslandsInvestment 32,825 32,825 1,000,000 28.57 36,010 1,971)( Associate
193

Balance as at
December 31,
2015
Balance as at
December 31,
2014
Number of shares
(Note)
Ownership
(%) Book value
Net profit (loss)
of the investee
for the year
ended December
31, 2015
Investment
income (loss)
recognised by the
Company for the
year ended
December 31,
2015 FootnoteInvestor Investee Location
Main business
activities
Initial investment amount Shares held as at December 31, 2015
Silver Star Developments Ltd.
and its subsidiariesHarbinger Ruyi II Venture Ltd.
British Virgin
IslandsInvestment 32,825 - 10,000 32.26 32,830 14 Associate
194

Remitted to
Mainland
China
Remitted
back
to Taiwan
MiTAC Computer
(Shunde) Corp.
Manufacturing of
computer cases and
monitors. Etc.
3,081,099$ 2 2,291,185$ -$ -$ 2,291,185$ 61,512$ 100.00 61,512$ 3,419,942$ -$
MiTAC Computer
(Kunshan) Co., Ltd.
Sales and
manufacturing of
computer
accessories,
hardware, software
and related services
1,520,081 2 942,078 - - 942,078 4,122 100.00 4,122 2,045,828 -
MiTAC Service
(Shanghai) Co., Ltd.
Testing, repair and
display of
computer
components and
related products,
and related
technical advisory
services and after-
sale services
41,345 2 32,825 - - 32,825 22,215)( 100.00 22,215)( 14,899 -
MiTAC Technology
(Kunshan) Co., Ltd.
Testing, repair and
display of
computer
components and
related products,
and related
technical advisory
services and after-
sale services
41,344 2 32,825 - - 32,825 11,192)( 100.00 11,192)( 54,199 -
Amount remitted from
Taiwan to
Mainland China/
Amount remitted back
to Taiwan for the year
ended December 31, 2015
MITAC HOLDINGS CORPORATION AND SUBSIDIARIES
Information on investments in Mainland China
For the year ended December 31, 2015
Table 9
Expressed in thousands of NTD
Investee in Mainland
China
Main business
activities Paid-in capital
Investment
method
(Note 1)
Accumulated
amount of
remittance from
Taiwan to
Mainland China
as of January 1,
2015 Footnote
Accumulated
amount of
remittance from
Taiwan to
Mainland China
as of December
31, 2015
Net income of
investee as of
December 31,
2015
(Except as otherwise indicated)
Ownership
held by the
Company
(direct or
indirect)
Investment
income (loss)
recognised by
the Company
for the year
ended
December 31,
2015 (Note 2)
Book value of
investments in
Mainland China
as of December
31, 2015
Accumulated
amount
of investment
income
remitted back to
Taiwan as of
December 31,
2015
195

Remitted to
Mainland
China
Remitted
back
to Taiwan
Amount remitted from
Taiwan to
Mainland China/
Amount remitted back
to Taiwan for the year
ended December 31, 2015
Investee in Mainland
China
Main business
activities Paid-in capital
Investment
method
(Note 1)
Accumulated
amount of
remittance from
Taiwan to
Mainland China
as of January 1,
2015 Footnote
Accumulated
amount of
remittance from
Taiwan to
Mainland China
as of December
31, 2015
Net income of
investee as of
December 31,
2015
Ownership
held by the
Company
(direct or
indirect)
Investment
income (loss)
recognised by
the Company
for the year
ended
December 31,
2015 (Note 2)
Book value of
investments in
Mainland China
as of December
31, 2015
Accumulated
amount
of investment
income
remitted back to
Taiwan as of
December 31,
2015
MiTAC Research
(ShangHai) Ltd.
Research,
development and
production of
computer software,
sales of own-
produced products
and related
technical advisory
services
214,985$ 2 170,690$ - - 170,690$ 20,313$ 100.00 20,313$ 442,302$ -$
Shzhou MiTAC
Precision Technology
Co., Ltd.
Design and
manufacturing of
computer chassis
and its
components,
1,633,189 2 443,138 - - 443,138 29,120 29.91 8,754 489,343 -
Mio Technology Ltd. Sales of
communication
products and
related after-sale
services
9,790 2 8,206 - - 8,206 12,530 100.00 12,530 9,590 -
MiTAC Logistic Service
(Kunshan) Ltd.
Agency of freight
transport, export
and import trading
and warehousing
services
34,070 2 32,825 - - 32,825 953 100.00 953 36,387 -
MiTAC Information
Technology Ltd.
After-sales
maintenance,
testing, consulting
services and related
support technology
services
10,232 2 9,848 - - 9,848 16,058 100.00 16,058 66,411 -
196

Remitted to
Mainland
China
Remitted
back
to Taiwan
Amount remitted from
Taiwan to
Mainland China/
Amount remitted back
to Taiwan for the year
ended December 31, 2015
Investee in Mainland
China
Main business
activities Paid-in capital
Investment
method
(Note 1)
Accumulated
amount of
remittance from
Taiwan to
Mainland China
as of January 1,
2015 Footnote
Accumulated
amount of
remittance from
Taiwan to
Mainland China
as of December
31, 2015
Net income of
investee as of
December 31,
2015
Ownership
held by the
Company
(direct or
indirect)
Investment
income (loss)
recognised by
the Company
for the year
ended
December 31,
2015 (Note 2)
Book value of
investments in
Mainland China
as of December
31, 2015
Accumulated
amount
of investment
income
remitted back to
Taiwan as of
December 31,
2015
MiTAC Innovation
(Kunshan) Ltd.
Research and
development of
computer, server,
mobile phone,
PDA, GNSS and
GPS, and related
technology transfer,
technical services
32,820 2 32,825 - - 32,825 5,872 100.00 5,872 61,391 -
CGK Zhong Shan Co.,
Ltd.
Manufacture and
sales of optical
glass, in-touch
display system
components and
touch display mode
Organizations.
252,329$ 2 1,828$ - - 1,828$ 31,588)($ 0.70 -$ 1,828$ -
MiTAC Electronics
(Foshan) Co., Ltd.
Manufacture of
computer
mainboard,
motherboard.
127,822 3 - - - - 1,772 100.00 1,772 129,072 -
Orient Optical Crystal
Mfg. CO.
Manufacturing of
protective cover
glass
20,317 2 147 - - 147 2,866 0.70 - 147 -
MiTAC Telematics
Technology Corporation
Sales of self-
produced products
and related after-
sale services
9,990 3 - - - - 1,486)( 100.00 1,486)( 2,382 -
Vango Technologies
Inc.
Research and
development and
manufacture and
sales of integrated
circuit and modular
software, and
related technology
transfer, technical
services
213,141 2 - 13,633 - 13,633 26,518 4.51 - 13,633 -
197

Remitted to
Mainland
China
Remitted
back
to Taiwan
Amount remitted from
Taiwan to
Mainland China/
Amount remitted back
to Taiwan for the year
ended December 31, 2015
Investee in Mainland
China
Main business
activities Paid-in capital
Investment
method
(Note 1)
Accumulated
amount of
remittance from
Taiwan to
Mainland China
as of January 1,
2015 Footnote
Accumulated
amount of
remittance from
Taiwan to
Mainland China
as of December
31, 2015
Net income of
investee as of
December 31,
2015
Ownership
held by the
Company
(direct or
indirect)
Investment
income (loss)
recognised by
the Company
for the year
ended
December 31,
2015 (Note 2)
Book value of
investments in
Mainland China
as of December
31, 2015
Accumulated
amount
of investment
income
remitted back to
Taiwan as of
December 31,
2015
MiTAC Investment
Holding Ltd.
Investment
Holdings
3,195 2 - - - - - 100.00 - 3,195 -
MiTAC Information
Systems (Kunshan) Co.,
Ltd.
Sales and
manufacturing of
computer
accessories,
hardware, software
and related services
4,995 3 - - - - - 100.00 - 4,995 -
Note 1: Investment methods are classified into the following three categories:
(1) Directly invest in a company in Mainland China.
(2) Invest in the investees in Mainland China through Silver Star Developments Ltd. and its subsidiaries which are located in the third area.
(3) Others:Invest in Mainland China through investees in Mainland Chian.
(1) It should be indicated if the investee was still in the incorporation arrangements and had not yet generated any profit during this period.
(2) Indicate the basis for investment income (loss) recognition in the number of one of the following three categories:
A. The financial statements were audited and attested by international accounting firm which has cooperative relationship with accounting firm in R.O.C..
B. The financial statements were audited and attested by R.O.C. parent company's CPA.
C. The financial statements were not audited and attested by independent accountants.
(3) The basis for investment income (loss) recognition for MiTAC computer (Shunde) Corp., MiTAC Computer (Kunshan) Co., Ltd., MiTAC Research (ShangHai) Ltd., and Shzhou MiTAC Precision Technology Co., Ltd. is category B,
the others are category C.
Note 2: In the 'Investment income (loss)recognised by the Company for the year ended December 31, 2015' column:
198

Company name
Accumulated amount of remittance from
Taiwan to Mainland China as of December
31, 2015
Investment
amount approved
by the Investment
Commission of
the Ministry of
Economic Affairs
(MOEA)
Ceiling on
investments in
Mainland China
imposed by the
Investment
Commission of
MOEA (Note 3)
MiTAC International Corp. $ 4,405,166 $ 6,374,666
B. Significant transactions conducted with investees in Mainland China:
Note 3: In accordance with the "Regulations Governing the Permission of Investment or Techical Cooperation in Mainland Area", MiTAC International Corp. has acquired the Business Operation Headquarter Certificate
(Jing-Shou-Gong-Zi Ltetter. No. 10220408560) issued by the Industrial Development Bureau of the Ministry of Economic Affairs, which exempts the Company form the limitation on the amount of investment in
Mainland China..
MiTAC International Corp. and MiTAC Computing Technology Corp's delivery service expenses with investees in Mainland China for the year ended December 31, 2015 amounted to $120,942, for details of other significant
transactions, please refer to table 1 and table 5.
199