Mg-Al Layered Double Hydroxide: A Potential Nanofiller and ...
160
Mg-Al Layered Double Hydroxide: A Potential Nanofiller and Flame-Retardant for Polyethylene Von der Fakult¨ at Maschinenwesen der Technischen Universit¨ at Dresden zur Erlangung des akademischen Grades Doktoringenieur (Dr.-Ing.) angenommene Dissertation ------------------------ M.Tech. Costa, Francis Reny geb. am 17.01.1976 in Calcutta, India Tag der Einreichung: 12.02.2007 Tag der Verteidigung: 09.11.2007 Gutachter: Prof. Dr.rer.nat.habil. Gert Heinrich Prof. Dr.-Ing.habil Hans-Joachim Radusch Prof. Dr.rer.nat.habil. Stefan Kaskel Vorsitzender der Promotionskommission: Prof. Dr.-Ing.habil R. Lange
Transcript of Mg-Al Layered Double Hydroxide: A Potential Nanofiller and ...

Mg-Al Layered Double Hydroxide: A Potential Nanofiller andFlame-Retardant for Polyethylene
Von der Fakultat Maschinenwesen
der
Technischen Universitat Dresden
zur
Erlangung des akademischen Grades
Doktoringenieur (Dr.-Ing.)
angenommene Dissertation
- - - - - - - - - - - - - - - - - - - - - - - -
M.Tech. Costa, Francis Reny
geb. am 17.01.1976 in Calcutta, India
Tag der Einreichung: 12.02.2007
Tag der Verteidigung: 09.11.2007
Gutachter: Prof. Dr.rer.nat.habil. Gert Heinrich
Prof. Dr.-Ing.habil Hans-Joachim Radusch
Prof. Dr.rer.nat.habil. Stefan Kaskel
Vorsitzender der Promotionskommission: Prof. Dr.-Ing.habil R. Lange

Dedicated to My Best Friend and WifeSwapna

Acknowledgment
It is an ultimate pleasure to see the extreme hard work and dedication that I invested in my research
during last four years have been acclaimed within scientific community. This success would have never
been possible to achieve without the assistance from my supervisors, co-workers, friends and family
members. Before presenting my Ph.D. thesis, therefore, I express my deep gratitude to all these kind
hearted people.
I was extremely lucky to get Prof. Gert Heinrich and Prof. Udo Wagenknecht as supervisors in my
research work at Leibniz-Institut fur Polymerforschung Dresden e.V. They not only constantly helped
me with inspiration and ideas, but also provided me complete freedom to pursue my own thinking. Prof.
Heinrich created a deep interest in me for polymer physics, which I never studies seriously before. Prof.
Wagenknecht provided all necessary technical support and infrastructures for my work. Above all, they
are very nice persons and I admire their humble and friendly personality.
Besides my supervisors, I would like to remember the co-operation that I have always received from
the members of processing group at IPF. Dr. Andreas Leuteritz, Herr Sven Wiessner and Frau Ulrike
Jentzsche-Hutschenreuter were the most helpful persons from this group on whom I relied a lot. They
not only helped me while working in the chemical and processing laboratory, but also were always
available in solving my personal problems. The numerous discussions with Dr. Leuteritzs were always
thoughtful and productive for my work. I also thank Herr Bernd Kretzschmar, Herr Andreas Scholze,
Herr Dirk Pahlitzsch, Frau Maria Auf der Landwehr and others for helping me while working in the large
processing laboratory.
I specially thank Dr. Marina Grenzner who helped me in doing detail analysis and modeling of the
rheological characteristics of my materials. Her strong theoretical knowledge was a great support for me
in this regard.
The members from the other working groups at IPF were also helped me during my research work.
Dr. Dieter Jehnichen helped me for XRD analysis of my samples, Frau Liane Haussler and Frau Kerstin
Arnhold for thermal analysis, Frau Gudrum Adam for FTIR analysis, Frau Ute Reuter for mechanical
testing, Frau Dr. Victoria Albrecht for BET analysis and many others for providing occasional assistance.
I thank all of them from the deep of my heart. I also thank Dr. Ulrike Staudinger, Dr. Mahmoud Abdel
Goad, Dr. Roland Vogel and many others for helping me in several ways.
I also acknowledge the financial support received from Deutsche Akademischer Austauschdienst
(DAAD) as a DAAD-Leibniz scholar during my whole Ph.D. research period.
Forgetting the support from my family members at this moment would be a big hypocrisy for me.
My parents always supported my venture into higher study through their constant inspiration, love and
sacrifice. My Ph.D. work would have never been possible without the support of my wife, Swapna. She
took care of all aspect of my life as a friend and a real well-wisher. Her company keeps me relaxed and
in peace during the difficult situations of my life.

Contents
1 Introduction 11.1 Objective . . . . . . . . . . . . . . . . . . . . . . . . . . . . . . . . . . . . . . . . . . 1
1.2 Basics of Polymer Flammability and the Role of Flame-Retardants . . . . . . . . . . . . 2
1.3 Environmental Concerns Relating Common Flame-Retardants and the Prospect of Mg-
Al–LDH . . . . . . . . . . . . . . . . . . . . . . . . . . . . . . . . . . . . . . . . . . . 4
1.4 Synopsis of the Presented Work . . . . . . . . . . . . . . . . . . . . . . . . . . . . . . 5
2 Literature Review 62.1 Layered Double Hydroxide . . . . . . . . . . . . . . . . . . . . . . . . . . . . . . . . . 6
2.2 An Overview of LDH Based Polymer Nanocomposites . . . . . . . . . . . . . . . . . . 8
2.2.1 Preparation . . . . . . . . . . . . . . . . . . . . . . . . . . . . . . . . . . . . . 8
2.2.1.1 In-situ Polymerization . . . . . . . . . . . . . . . . . . . . . . . . . . 9
2.2.1.2 Solution Intercalation of Polymers within LDH Layers . . . . . . . . . 12
2.2.1.3 Melt Compounding Method . . . . . . . . . . . . . . . . . . . . . . . 13
2.2.2 Properties of Polymer/LDH Nanocomposites . . . . . . . . . . . . . . . . . . . 14
2.2.2.1 Morphological Characteristics . . . . . . . . . . . . . . . . . . . . . . 14
2.2.2.2 General Properties of Polymer/LDH Nanocomposites . . . . . . . . . 18
2.3 Potential Applications of LDH Materials . . . . . . . . . . . . . . . . . . . . . . . . . . 21
2.4 Nanoclays as Flame-Retardant in Polymer . . . . . . . . . . . . . . . . . . . . . . . . . 23
2.4.1 Flammability of Layered Silicate based Polymer Nanocomposites . . . . . . . . 23
2.4.2 LDH Clay as Flame-Retardants for Polymer . . . . . . . . . . . . . . . . . . . . 25
3 Experimental: Compounding and Characterization 283.1 Materials Description . . . . . . . . . . . . . . . . . . . . . . . . . . . . . . . . . . . . 28
3.1.1 Mg-Al–LDH . . . . . . . . . . . . . . . . . . . . . . . . . . . . . . . . . . . . 28
3.1.2 Chemicals Used for LDH Synthesis . . . . . . . . . . . . . . . . . . . . . . . . 29
3.1.3 Surfactants . . . . . . . . . . . . . . . . . . . . . . . . . . . . . . . . . . . . . 29
3.1.4 Polymers . . . . . . . . . . . . . . . . . . . . . . . . . . . . . . . . . . . . . . 29
3.2 Melt Processing . . . . . . . . . . . . . . . . . . . . . . . . . . . . . . . . . . . . . . . 30
3.2.1 Introduction . . . . . . . . . . . . . . . . . . . . . . . . . . . . . . . . . . . . . 30
3.2.2 Mixing in Batch Mixer (Brabender Plasticorder) . . . . . . . . . . . . . . . . . 30
3.2.3 Mixing in Extruder . . . . . . . . . . . . . . . . . . . . . . . . . . . . . . . . . 31
3.3 Characterizations . . . . . . . . . . . . . . . . . . . . . . . . . . . . . . . . . . . . . . 32
3.3.1 X-ray Diffraction Analysis . . . . . . . . . . . . . . . . . . . . . . . . . . . . . 32
i

CONTENTS ii
3.3.2 FTIR Analysis . . . . . . . . . . . . . . . . . . . . . . . . . . . . . . . . . . . 33
3.3.3 Morphological Analysis by Electron Microscopy . . . . . . . . . . . . . . . . . 33
3.3.4 Thermal Analysis . . . . . . . . . . . . . . . . . . . . . . . . . . . . . . . . . . 33
3.3.5 Rheological Analysis . . . . . . . . . . . . . . . . . . . . . . . . . . . . . . . . 33
3.3.5.1 Dynamic Oscillatory Shear Experiment . . . . . . . . . . . . . . . . . 33
3.3.5.2 Step Strain Experiment . . . . . . . . . . . . . . . . . . . . . . . . . 34
3.3.5.3 Non-linear Shearing or Flow Reversal Experiment . . . . . . . . . . . 34
3.3.6 Mechanical Properties and Fracture Behavior . . . . . . . . . . . . . . . . . . . 35
3.3.7 Flammability Properties . . . . . . . . . . . . . . . . . . . . . . . . . . . . . . 35
3.3.7.1 Limiting Oxygen Index (LOI) . . . . . . . . . . . . . . . . . . . . . . 35
3.3.7.2 Cone Calorimeter Test . . . . . . . . . . . . . . . . . . . . . . . . . . 36
3.3.7.3 UL–94 testing . . . . . . . . . . . . . . . . . . . . . . . . . . . . . . 38
4 LDH: Synthesis, Modification and Characterization 404.1 Synthesis . . . . . . . . . . . . . . . . . . . . . . . . . . . . . . . . . . . . . . . . . . 40
4.2 Modification of LDH . . . . . . . . . . . . . . . . . . . . . . . . . . . . . . . . . . . . 40
4.3 Characterization of LDH Materials . . . . . . . . . . . . . . . . . . . . . . . . . . . . . 41
4.3.1 Characterization of the Unmodified Clays . . . . . . . . . . . . . . . . . . . . . 41
4.3.2 Characterization of the Modified Clays . . . . . . . . . . . . . . . . . . . . . . 44
4.3.2.1 XRD Analysis . . . . . . . . . . . . . . . . . . . . . . . . . . . . . . 44
4.3.2.2 FTIR Analysis . . . . . . . . . . . . . . . . . . . . . . . . . . . . . . 46
4.3.2.3 Morphological Analysis . . . . . . . . . . . . . . . . . . . . . . . . . 50
4.3.2.4 Thermal Analysis . . . . . . . . . . . . . . . . . . . . . . . . . . . . 51
4.3.2.5 SDBS Modified LDH or LDH-DBS . . . . . . . . . . . . . . . . . . . 53
4.4 Conclusion . . . . . . . . . . . . . . . . . . . . . . . . . . . . . . . . . . . . . . . . . 59
5 Characterizations of PE/LDH Nanocomposite 605.1 Morphological Characterizations . . . . . . . . . . . . . . . . . . . . . . . . . . . . . . 60
5.1.1 Introduction . . . . . . . . . . . . . . . . . . . . . . . . . . . . . . . . . . . . . 60
5.1.2 PE/LDH Nanocomposite Prepared in Small Batch-Mixer . . . . . . . . . . . . . 61
5.1.3 PE/LDH Nanocomposite Compositions Prepared in Twin-Screw Extruder . . . . 63
5.2 Thermal Analysis . . . . . . . . . . . . . . . . . . . . . . . . . . . . . . . . . . . . . . 69
5.3 Rheological Analysis . . . . . . . . . . . . . . . . . . . . . . . . . . . . . . . . . . . . 72
5.3.1 Introduction . . . . . . . . . . . . . . . . . . . . . . . . . . . . . . . . . . . . . 72
5.3.2 Linear Viscoelastic Behavior . . . . . . . . . . . . . . . . . . . . . . . . . . . . 74
5.3.3 Non-Linear Viscoelastic Behavior . . . . . . . . . . . . . . . . . . . . . . . . . 80
5.3.3.1 Non-linear rheological behavior of unfilled PE . . . . . . . . . . . . . 81
5.3.3.2 Non-Linear Rheological Behavior of PE/LDH Nanocomposites . . . . 85
5.3.3.3 Modeling of non-linear rheological behavior of PE/LDH nanocomposites 91
5.4 Mechanical Properties and Fracture Behavior . . . . . . . . . . . . . . . . . . . . . . . 94
CONTENTS iii
6 Flammability Properties of LDH Based Composites 1006.1 PE/LDH Nanocomposites . . . . . . . . . . . . . . . . . . . . . . . . . . . . . . . . . . 100
6.1.1 Flammability Study by LOI . . . . . . . . . . . . . . . . . . . . . . . . . . . . 100
6.1.2 Flammability Study by UL94 . . . . . . . . . . . . . . . . . . . . . . . . . . . 102
6.1.3 Flammability Study by Cone Calorimetry . . . . . . . . . . . . . . . . . . . . . 103
6.2 PE/LDH/Mg(OH)2 Composites: Synergistic Effect . . . . . . . . . . . . . . . . . . . . 111
7 Conclusions and Outlooks 118
Appendices 142
A Theoretical Calculation of Combustion Residue 143
B Rheological Measurements 145
C Surface energy measurement using capillary penetration method 147
D Curriculum Vitae of Francis Reny Costa 149

Nomenclature
LDH layered double hydroxide
MH magnesium hydroxide
Mg-Al–LDH magnesium and aluminum based LDH
HRR heat release rate
PHRR peak heat release rate
THR total heat released
SEA specific extinction area
tig ignition time
LOI limited oxygen index
T0.1 and T0.5 temperature at 10.0 and 50.0 % weight loss respectively
DBS dodecylbenzenesulfonate
DS dodecylsulfate
BEHP bis (2-ethylhexyl)hydrogenphosphate
CLDH calcined LDH
LDHR regenerated LDH
G′ storage modulus
Gprime loss modulus
|η∗| complex viscosity
G(t) stress relaxation modulus
iv
C1
I
1.1 Objective
Polymers constitute a versatile class of materials that can be designed to obtain wide ranges of properties,
making them an inevitable choice for large scale applications in various fields, like household commodi-
ties, transport, building, electrical, electronic, space applications, etc. However, in many applications,
the intrinsic flammability of common polymers often restricts their use in spite of their enormous design
flexibility and performance efficiency. Being organic in nature, both synthetic and natural polymers are
usually combustible and decompose into volatile combustible products when exposed to heat. In addi-
tion to immediate fire risk posed by the polymeric materials while burning, their combustion products
often cause serious threat to human health and environment. In United States alone between 1996 and
2005, an average of 3,932 human loss and another 20,919 injuries (excluding the events of September
11, 2001) were reported annually as the result of fire accidents [1]. Additionally, all these fire accidents
together involve loss of properties worthy of several thousand millions of dollars. Thus, the improvement
of flammability of polymeric materials continues to remain as a very fresh area of research for polymer
chemists and material engineers. Such research is also highly encouraged by the polymer industries
because of huge economic and sociological casualties involved each year in fire accidents. Among
the various methods of improving flammability of polymeric materials, incorporation of flame-retardant
chemicals is a very commonly used one. These flame-retardant chemicals called flame-retardants, ex-
ecute certain specific function(s) during combustion process in order to either extinguish the flame or
to slow its propagation. The present work and the relevant reporting involve the investigation of a rela-
tively new inorganic material, namely layered double hydroxide (LDH) as potential flame-retardant for
polymers. The basic reason for selecting LDH or more specifically magnesium-aluminum based LDH
(Mg-Al–LDH) is their typical metal hydroxide-like chemistry and conventional clay-like layered crys-
talline structure. The former can be helpful in their direct participation in flame inhibition through en-
dothermic decomposition and stable char formation. Whereas, the later makes them suitable for polymer
nanocomposite preparation, which can improve their dispersion in polymer matrix. In fact, the principle
used for the preparation of layered silicate based polymer nanocomposites has also been employed here
to incorporate Mg-Al–LDH in polymer matrix. The polymer chosen for the present work is low density
polyethylene (PE), which belongs to one of the most widely used and extremely flammable group of
polymers i.e., polyolefins.
1
CHAPTER 1. INTRODUCTION 2
1.2 Basics of Polymer Flammability and the Role of Flame-Retardants
When both natural and synthetic polymers are exposed to a source of sufficient heat energy, a process
called pyrolysis starts that liberates flammable volatiles. These volatiles then mix with air (containing
oxygen) and undergo ignition when the temperature is sufficiently high. Therefore, three steps are in-
volved for whole combustion process: heating, thermal decomposition or pyrolysis and ignition into
flame [2]. If the heat of combustion is enough to sustain the pyrolysis and the subsequent ignition,
polymers burn spontaneously even after the removal of the external heat source. Thus a self-sustaining
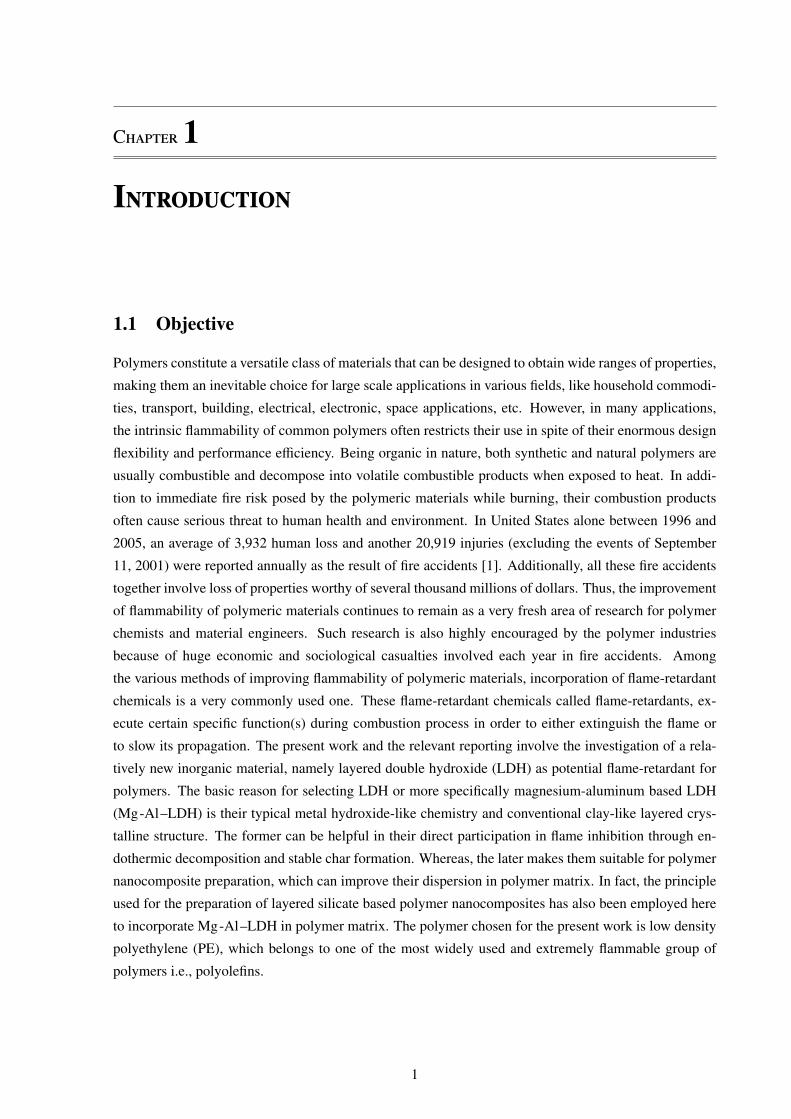
combustion cycle is established, which has been schematically demonstrated in Figure 1.1. Pyrolysis is
an endothermic process as the dissociation of chemical bonds always requires some energy. Whereas, the
ignition during which the flammable products of pyrolysis reacts with oxygen, is always an exothermic
process and provides a thermal feedback mechanism for the combustion process. Ignition starts when
temperature reaches the characteristic ignition temperature of the volatiles and depends on factors, like
availability of oxygen, chemical stability of the volatiles and obviously temperature. In a self-sustaining
combustion cycle, the heat produced by the ignition propagates the pyrolysis process along the fresh
polymer surface and maintains the supply of fuel to the flame front. This results in spreading of the
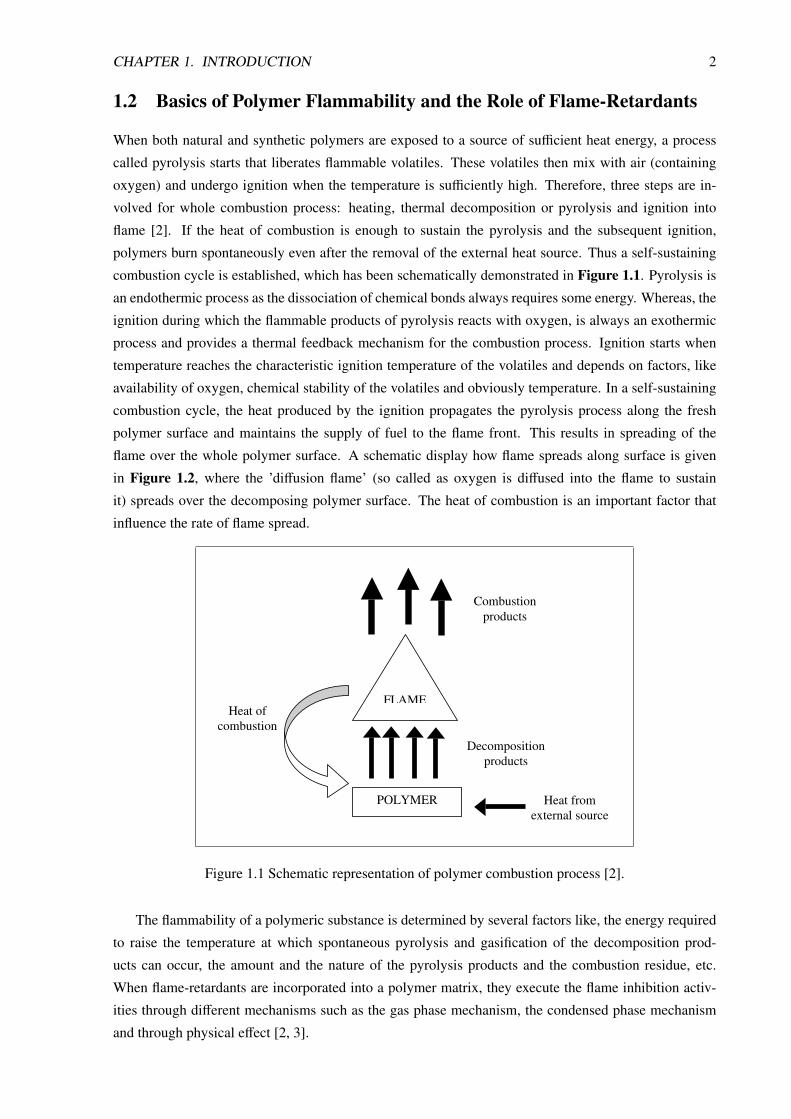
flame over the whole polymer surface. A schematic display how flame spreads along surface is given
in Figure 1.2, where the ’diffusion flame’ (so called as oxygen is diffused into the flame to sustain
it) spreads over the decomposing polymer surface. The heat of combustion is an important factor that
influence the rate of flame spread.
FLAME
POLYMER
Decomposition products
Combustion products
Heat of combustion
Heat from external source
Figure 1.1 Schematic representation of polymer combustion process [2].
The flammability of a polymeric substance is determined by several factors like, the energy required
to raise the temperature at which spontaneous pyrolysis and gasification of the decomposition prod-
ucts can occur, the amount and the nature of the pyrolysis products and the combustion residue, etc.
When flame-retardants are incorporated into a polymer matrix, they execute the flame inhibition activ-
ities through different mechanisms such as the gas phase mechanism, the condensed phase mechanism
and through physical effect [2, 3].
CHAPTER 1. INTRODUCTION 3
Figure 1.2 Schematic flame spread during of polymer combustion process [2].
Polymers upon pyrolysis generates active species that react with atmospheric oxygen producing H2–
O2 radical scheme involving OHand Hradicals. This radical scheme propagates the flame over the
polymer surface. In gas phase mechanism, the decomposition products of the flame-retardants inter-
act chemically with these radicals and cause flame inhibition. All halogen containing flame-retardants
primarily act through this mechanism. During combustion, they produce halogen atom and hydrogen
halide. The free halogen atoms, if generated, react with the combustible pyrolysis products and produce
hydrogen halides. These hydrogen halides are the actual flame inhibitor that cut off the flame propagation
through inactivation of the radical species, like OH, and Hradicals in the H2–O2 radical scheme [2, 4].
In condensed phase mechanism, the flame-retardant chemicals directly react with polymer at a
temperature below the pyrolysis temperature of the latter. Such interaction often occurs through non-
oxidative dehydration of the polymeric matrix resulting in lowering of its oxygen content and ultimately
leads to the formation of carbonaceous char. This not only reduces the formation of carbon monoxide and
carbon dioxide, but also the resultant char forms a barrier layer against the flame propagation and heat
conduction [2, 4]. The phosphorous containing flame-retardants usually act through this mechanism.
The flame-retardants that inhibit flame exclusively through physical effects do not usually chemically
interact with polymers or pyrolysis products. They are decomposed below the pyrolysis temperature of
polymers and impart flame inhibition effect both in gas phase and in condensed phase. The endothermic
decomposition of these flame-retardants acts as a heat sink causing cooling effect to the surrounding and
the inactive gaseous decomposition products cause dilution effect in the gas phase lowering the effective
concentration of the combustible volatiles in the flame zone. The flame-retardants that act through this
mechanism include various metal hydroxides, borates, talc, etc. Their thermal decomposition residue,
which is most often metallic oxides, also contributes to flame inhibition through stable char formation
on the burning surface and occasionally catalysing the carbonaceous char formation in case of polymers
that undergoes acid catalyzed dehydration reaction [2, 4].
CHAPTER 1. INTRODUCTION 4
1.3 Environmental Concerns Relating Common Flame-Retardants andthe Prospect of Mg -Al–LDH
Though the primary purpose of using flame-retardants in polymers is very noble, conventional flame-
retardants have many negative effects. This includes mainly the toxic effect of the decomposition prod-
ucts of the flame-retardant chemicals, both direct and indirect, to the human lives and the environment.
Among the conventional flame-retardants, the toxicity issue related to various halogen containing ones
has drawn more attentions. The polyhalogenated diphenyl ethers, the commonly used halogen contain-
ing flame-retardants, produce highly toxic dioxins and furans during non flaming thermal decomposition
[2, 3]. These toxic by products may contaminate everything from whale bladder to dolphins to human
blood to household dust and to sludge. Also during combustion, halogen containing flame-retardants
produce acidic and corrosive fumes causing direct health concern for lives in the immediate vicinity of
a fire. The phosphorous containing flame-retardants, though mainly act in the condensed phase, may
also release some gaseous phosphorous containing toxic chemical (which are often neurotoxic or car-
cinogenic) during combustion [2]. Because of all these environmental and health concerns related to
halogenated and many phosphorous based conventional flame-retardants, the search for environment
friendly and non-toxic flame-retardants has been increased in the recent years, especially after growing
restriction against the use of halogen containing flame-retardants.
For years, scientists have been using the concept of nanotechnology to improve the flame retardancy
of polymer composites. This approach involves the dispersing of an inorganic filler in nanoscale as
flame-retardants into a polymer matrix. Usually, layered silicates and various nanoparticles (like, MgO,
Mg(OH)2, etc) after suitable pretreatment are used for this purpose. The various research reports have
already shown that such an approach indeed improves the flammability of the composites. Often satisfac-
tory flammability improvements can be achieved in these composites when a small amount of secondary
flame-retardant is incorporated along with the nanofillers. The advantages of this approach are the sig-
nificant reduction of the amount of the flame-retardant loading and nontoxic decomposition products
from the flame-retardants. Mg-Al–LDH is a material that combines the characteristics of Mg(OH)2, a
commonly used flame-retardant in polyolefin, and the structural features of layered silicates, commonly
used clay materials for polymer nanocomposite preparation. Like Mg(OH)2, Mg-Al–LDH undergoes
endothermic decomposition releasing the bound water and producing a metal oxide residue. Therefore,
Mg-Al–LDH has a definite potential as flame-retardant, which can act through physical effect described
before. Additionally, its layered silicates-like structure, makes it suitable for preparing polymer/clay-
based nanocomposites. This can lead to an improved dispersion of the filler particles through intercala-
tion and exfoliation crystal layers by polymer chains, which is unlikely in case of Mg(OH)2. Because
of these interesting characteristics, Mg-Al–LDH can be an interesting material to be investigated as po-
tential flame-retardant nanofillers for polymers. Besides, non toxic nature of Mg-Al–LDH makes it an
environment-friendly additive for polymers. Therefore, the aim of the present work was to investigate
the potential of this Mg-Al–LDH clay as a nanofiller for PE and its ability to improve the flammability
properties of the polymer.
CHAPTER 1. INTRODUCTION 5
1.4 Synopsis of the Presented Work
In the presented work, Mg-Al–LDH has been used as a nanofiller and a potential flame-retardant addi-
tive in a commercially available low-density polyethylene (PE) matrix. The investigation started with a
thorough literature review of the present art of work involving LDH and LDH-based polymer nanocom-
posites. An overview of LDH preparation, it organic modification and polymer/LDH-based nanocom-
posite preparation are given at the beginning. Then various characteristic features of LDH-based polymer
nanocomposites in terms of particle dispersion, properties, etc are described in details. Also a general
overview of various potential applications of LDH materials is given. The use of nanoclay as flame-
retardants in polymer is an upcoming field with many interesting development. Usually, layered silicate
type of clays are used for this purpose. So, a brief review of nanoclay in general as flame-retardant and
their comparison with LDH as potential flame-retardant nanofiller have also been given.
The various materials used in the present study and their basic features are described in Chapter 3.
The experimental methods and analytical tools used for characterization of the LDH materials and the
nanocomposites are also presented.
The actual experimental work started with the synthesis and the organic modification of Mg-Al–
LDH, which are reported in Chapter 4. The main purpose of this section was to study the intercalation
behavior of Mg-Al–LDH with various organic surfactants. Both the pristine and the modified clay ma-
terials have been characterized in details using various analytical techniques. The organically modified
Mg-Al–LDH that showed best properties, mainly in terms of interlayer separation, was chosen for the
preparation of PE/Mg-Al–LDH (henceforth will be designated as PE/LDH) nanocomposites using melt
compounding technique. This particular organically modified Mg-Al–LDH was characterized in details.
The characterization of PE/LDH nanocomposite compositions have discussed in details in Chapter
5. Primarily, X-ray diffraction (XRD) and electron microscopy were used to investigate morpholog-
ical features and the nature of LDH particle dispersion in PE matrix. Also thermal properties of the
nanocomposites studied in details to investigate the influence of LDH clay on the thermal stability of the
final composites. The melt rheological analysis is a very useful method to study flow behavior of the
polymeric melts. This method is also a complementary method to the XRD and electron microscopy for
studying the nature of filler particle dispersion in matrix. Therefore, a details rheological investigation of
the PE/LDH nanocomposite melts were performed. The performance of a flame-retardant also depend
on how it influence the mechanical properties of the final composites. This is because often higher load-
ing of the flame-retardants is limited by the deterioration of the mechanical properties and processing
irregularities. Therefore, the mechanical characteristics and the fracture behavior of the nanocomposite
compositions were also studied in details.
Chapter 6 has been devoted to the discussion of the flammability properties of the PE/LDH nanocom-
posites. The flammability performance of this material has been investigated using various standard
techniques, like cone-calorimetry, UL-94 test methods, limited oxygen index (LOI) determination, etc.
The synergistic effect of the LDH nanoparticles with conventional Mg(OH)2 flame-retardant was also
investigated.
Finally, the summary of the whole work and future outlooks regarding the use of LDH as flame-
retardant nanofillers are presented in Chapter 7.
C2
L R
2.1 Layered Double Hydroxide
Layered double hydroxides (LDHs) belong to a general class called anionic clay minerals. They can
be of both synthetic and natural origin. The most commonly known naturally occurring LDH clay is
hydrotalcite having chemical formula Mg6Al2 (OH)16CO30.4H2O. Hydrotalcite is the first mineral of
this group whose structure and properties were studied extensively and often taken as the representative
of the LDH clay materials. Hence, the LDHs are also know as hydrotalcite-like-compounds. The general
chemical formula of LDH clays is written as [MI I1−xMI I I
x(OH)2]x+(An−)x/n.yH2O, where MI I is a
divalent metal ion, such as Mg2+, Ca2+, Zn2+, etc, MI I I is a trivalent metal ion, such as Al3+, Cr3+,
Fe3+, Co3+, etc and An− is an anion, such as Cl−, CO32−, NO3
−, etc. The anions occupy the interlayer
region of these layered crystalline materials. Although a wide range of values of x is claimed to provide
LDH structure, the pure phase of LDH clays is usually obtained for a limited range as 0.2 ≤ x ≤0.33
[5].
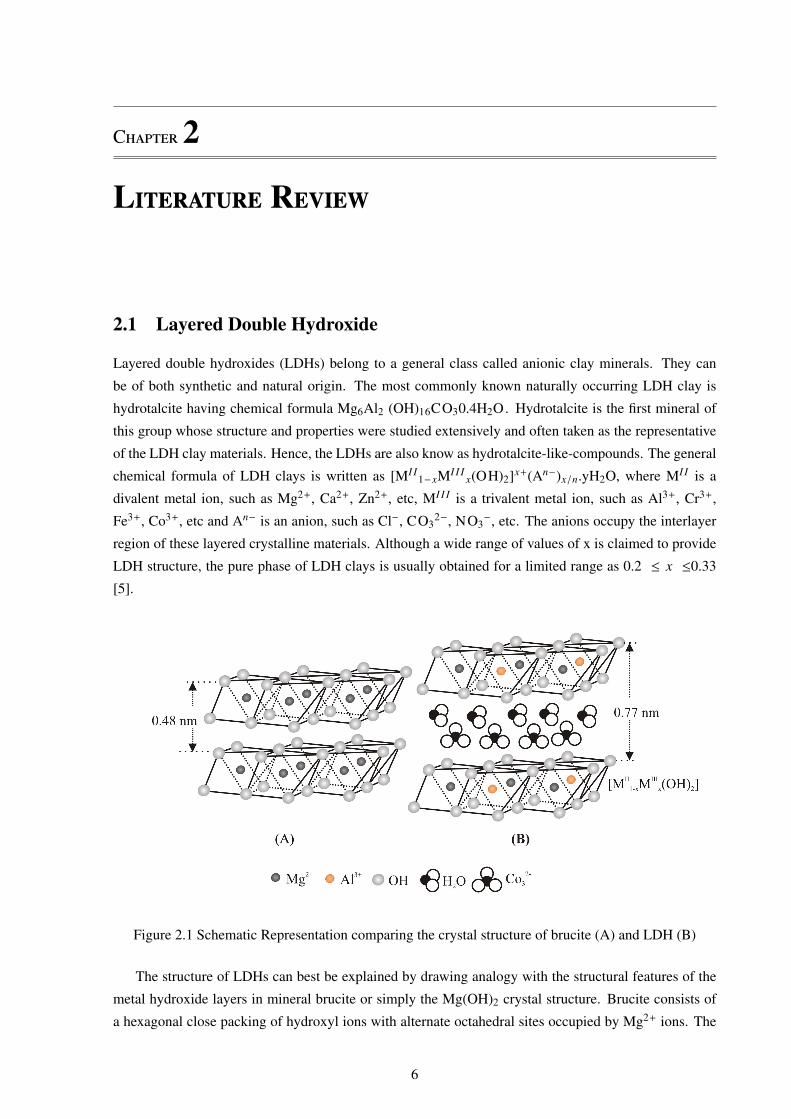
Figure 2.1 Schematic Representation comparing the crystal structure of brucite (A) and LDH (B)
The structure of LDHs can best be explained by drawing analogy with the structural features of the
metal hydroxide layers in mineral brucite or simply the Mg(OH)2 crystal structure. Brucite consists of
a hexagonal close packing of hydroxyl ions with alternate octahedral sites occupied by Mg2+ ions. The
6
CHAPTER 2. LITERATURE REVIEW 7
metal hydroxide sheets in brucite crystal are neutral in charge and stack one upon another by Van der
Waal’s interaction. The interlayer distance or the basal spacing in brucite has a value of about 0.48 nm. In
LDH, some of the divalent cations of these brucite-like sheets are isomorphously substituted by a trivalent
cation and the mixed metal hydroxide layers, [MI I1−xMI I I
x(OH)2]x+, thus formed acquire a net positive
charge. This excess charge on the metal hydroxide layers is neutralized by the anions accumulated in the
interlayer region. The interlayer region in LDHs also contains some water molecules for the stabilization
of the crystal structure. The presence of anions and water molecules leads to an enlargement of the
basal spacing from 0.48 nm in brucite to about 0.77 nm in Mg-Al–LDH. A schematic representation
comparing the brucite and the LDH structures is shown in Figure 2.1.
Although LDHs have layered structure like layered silicates, the two are quite significantly different
from each other. While LDHs have positively charged layers with anionic interlayer species (so they are
called anionic clay), the layered silicates have positively charged layers with cationic interlayer species
(hence called cationic clay). In terms of compositions, geometry and layer thickness, LDHs are vastly
different from layered silicates. In LDH, as described earlier, each crystal layer is composed of a single
octahedral metal hydroxide sheet. Whereas, in layered silicates, it is a sandwiched structure of two or
more sheets of metal oxides. For example, montmorillonite crystal layer is made up of three sheets. One
octahedral sheet containing oxides of Fe, Al , Mg, etc remains sandwiched between two silica tetrahedral
sheets. This difference in layer structure results much lower crystal layer thickness and rigidity in case
of LDHs.
The charge density of hydroxide sheets in LDHs is in the range of 0.33 – 0.25 Cm−2 (as high as in
mica, 0.32 – 0.34 Cm−2) [6], which is much higher compared to that observed in various cationic clays
of both natural and synthetic origin. However, the remarkable behavior of LDH is their high reactivity
toward various organic anions, which can exchange as much as 80 – 100% of the interlayer anions in
LDHs [6].
Many LDH materials show unique phenomenon called ’memory effect’, which involves the regenera-
tion of the layered crystalline structure from their calcined form, when the later is dispersed in an aqueous
solution containing suitable anion [7]. This property is often used to synthesize and modify LDHs with
different types of intercalating anions. Typically, LDHs containing carbonate anion are heated to a tem-
perature in the range of 350–800 ℃ for several hours and the resultant mixed metal oxide (more precisely
a solid solution of the two metal oxides) is then dispersed in an aqueous solution of the desired anionic
species. The dispersion is stirred mechanically for overnight at room temperature to ensure completion
of the regeneration process. The regeneration property shown by LDHs is extensively reported in nu-
merous literatures [5, 6, 8, 9]. There are several methods by which LDHs can be synthesized. However,
all these methods may not be suitable and equally efficient for every combination of metal ions. Some of
the methods described in literatures are listed below.
The co-precipitation method involves co-precipitation of selected pairs of metal ions from their aque-
ous solution by a dilute NaOHor NaHCO3 or Na2CO3 or NH4OHsolution. The pH of the reaction
medium is maintained in the range of 8 to 10 depending on the nature of the metal ions. To obtain well
crystallized materials the final suspension is subjected to hydrothermal treatment for a long period. The
detail description of the process is available in numerous reports available in literature [10–13].
The homogeneous precipitation method using urea hydrolysis for synthesis provides LDH with a
high degree of crystallinity and a narrow distribution of particle size. Usually, an aqueous solution

CHAPTER 2. LITERATURE REVIEW 8
of desired metal ions and urea in calculated molar ratio is heated in the temperature range 90 ℃ to
reflux condition for 24 – 36 hours. The urea molecules undergo decomposition producing ammonium
carbonate, which finally causes the precipitation of LDH containing CO32− as intercalating anion. More
descriptive procedure of this method can be found in several literatures cited in reference [14–16].
The ion exchange method takes the advantage of exchangeable interlayer anions present in LDHs
by other anionic species. Based on this property, the LDHs containing one type of intercalating anionic
species can be synthesized from the LDHs containing another type of intercalating anion. Usually, the
original LDH is dispersed in an aqueous solution of the desired anionic species and the dispersion is
stirred at room temperature for several hours. However, some anionic species show more affinity to
the inter gallery region of LDH than the other. More intensive literatures dealing with this method of
synthesis of LDH are given in reference [17–19].
Hydrothermal crystallization method involves the crystallization of amorphous MIII2O3 precursor in
presence of a suitable MIIO, the latter acting as a crystallizing agent [20]. The precursor MIII2O3 is
an amorphous hydrated oxide of the trivalent metal component of LDH whereas the crystallizing agent
MIIOis a reactive and basic oxide of the divalent metal component. The actual synthesis is carried out
by hydrothermal treatment of an aqueous suspension of these two metal oxides in a pressurized vessel at
elevated temperature for several days.
2.2 An Overview of LDH Based Polymer Nanocomposites
2.2.1 Preparation
Although the usages of LDHs in different fields, like catalysis, acid scavenger, controlled chemical re-
lease, etc. are well known, their potential as nanofillers in preparing polymer nanocomposites is very
recently realized by researchers. In this regard, unlike conventional layered silicates (which is widely
used so far as nanofiller in polymer), LDHs possess certain inherent advantages. For example, being
mostly of synthetic origin, the presence of impurity in LDHs is far less and also a wide range of chem-
ical compositions can be obtained by changing the type and molar ratio of the metal ion pairs during
the synthesis process. Additionally, the positive nature of the crystal layers in LDHs provides a greater
flexibility in selecting the suitable modifier from several groups of organic compounds, like like fatty
acid salts, sulfonates, sulfates, phosphates, etc [6, 21, 22]. The LDHs apparently resemble many cationic
clay minerals (like layered silicates) so far as the principle of polymer nanocomposite preparation is
concerned. But, the major disadvantage of LDHs is the high charge density of layers, which firmly
holds the metal hydroxide layers in the crystalline stacks and makes the intercalation of the polymeric
materials into the interlayer region difficult. However, the strong affinity of LDHs for anion exchange re-
action even with oligomeric anionic species gives an opportunity to convert these materials into suitable
precursors for polymer nanocomposite preparation. In literatures, several methods for the preparation
of polymer/LDH nanocomposites have been reported [23], which are described briefly in the following
sections.

CHAPTER 2. LITERATURE REVIEW 9
2.2.1.1 In-situ Polymerization
In-situ polymerisation is the most widely referred technique for polymer/LDH nanocomposites prepara-
tion. This method is solution based and is usually carried out in an aqueous system. The scheme shown
in Figure 2.2 indicates the general principle for carrying out in-situ polymerization within the layers of
LDH crystals. The primary step is the preparation of monomer intercalated LDH hybrids, which are then
subjected to excitation by heat [24, 25], initiating chemicals [26], etc. for carrying out the polymeriza-
tion reaction. Various methods of intercalation of monomers into the interlayer region of LDHs and their
subsequent polymerization have been reported in literatures, which are summarized in Figure 2.2.
A A A A A
A A A A A
A A A A A
– A – A – A – A –
– A – A – A – A –
– A – A – A – A –
(1) MonomerA
(4) Spacer
MonomerA
hν, ∆, e-
LDH Monomerintercalated LDH
PolymerInterleaved LDH
Solution of MII
and MIII
(2)Monomer solution,
Co-precipitation
Calcined LDH(mixed oxide)
(3)Heating at > 450°C for few hours
Dispersion in aq.solution ofmonomer
Figure 2.2 Schematic pathways of in-situ polymerization within LDH layers to synthesize polymer-
LDH nanocomposites
The anionic interchange method involves the dispersion of LDHs into a monomer solution, most
often in aqueous medium (path 1 in Figure 2.2) [26–29]. The dispersion is then stirred for several hours
with mild heating. The monomer molecules must have anionic functionality or strong nucleophillic sites
in order to replace the interlayer anions in LDHs and to stabilize the layered stacking of the hydroxide
sheets by neutralizing their excess positive charge. For example, acrylate anions can be easily interca-
lated into Mg-Al–LDH through ion exchanges with Cl− or NO3− present in LDH [29]. Isupov et al.
reported the intercalation of various isomeric anions of amino benzoic acid into Li-Al–LDH and their
subsequent polymerisation [30]. Similarly, Leroux and co-workers have intercalated vinyl benzene sul-
fonate monomer into Zn-Al–LDH [27] and aminobenzenesulfonate monomer into Cu-Cr–LDH [28].
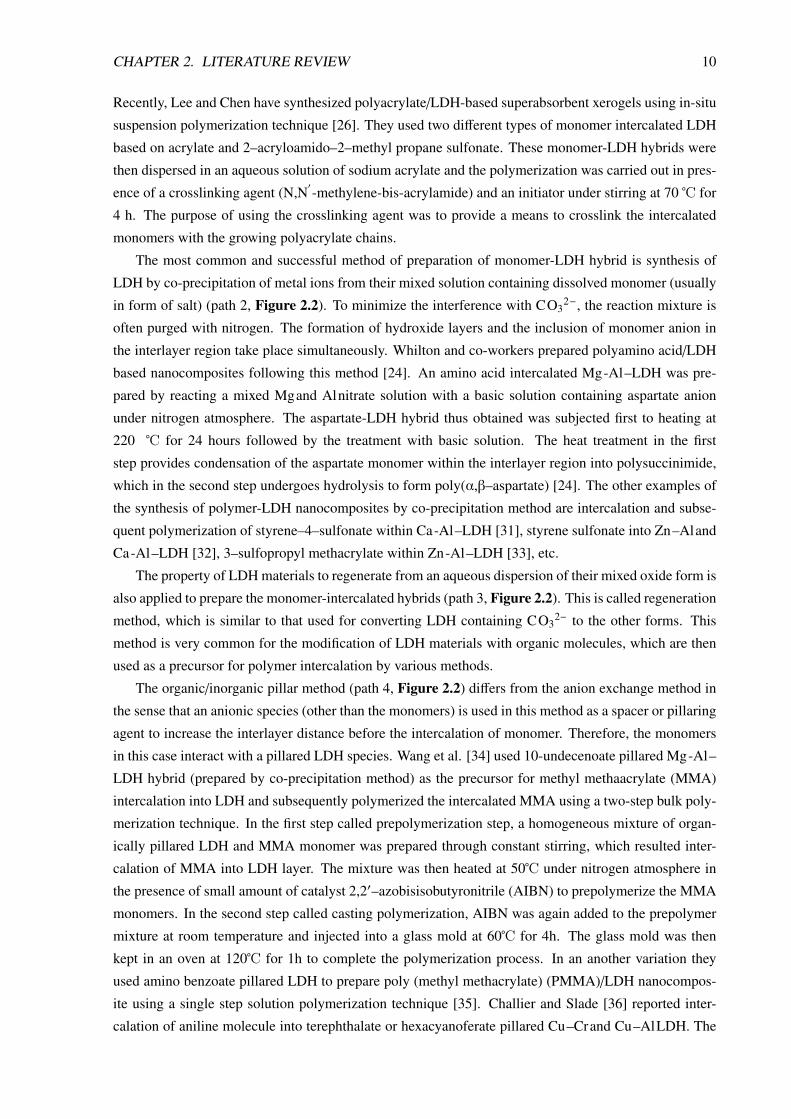
CHAPTER 2. LITERATURE REVIEW 10
Recently, Lee and Chen have synthesized polyacrylate/LDH-based superabsorbent xerogels using in-situ
suspension polymerization technique [26]. They used two different types of monomer intercalated LDH
based on acrylate and 2–acryloamido–2–methyl propane sulfonate. These monomer-LDH hybrids were
then dispersed in an aqueous solution of sodium acrylate and the polymerization was carried out in pres-
ence of a crosslinking agent (N,N′
-methylene-bis-acrylamide) and an initiator under stirring at 70 ℃ for
4 h. The purpose of using the crosslinking agent was to provide a means to crosslink the intercalated
monomers with the growing polyacrylate chains.
The most common and successful method of preparation of monomer-LDH hybrid is synthesis of
LDH by co-precipitation of metal ions from their mixed solution containing dissolved monomer (usually
in form of salt) (path 2, Figure 2.2). To minimize the interference with CO32−, the reaction mixture is
often purged with nitrogen. The formation of hydroxide layers and the inclusion of monomer anion in
the interlayer region take place simultaneously. Whilton and co-workers prepared polyamino acid/LDH
based nanocomposites following this method [24]. An amino acid intercalated Mg-Al–LDH was pre-
pared by reacting a mixed Mgand Alnitrate solution with a basic solution containing aspartate anion
under nitrogen atmosphere. The aspartate-LDH hybrid thus obtained was subjected first to heating at
220 ℃ for 24 hours followed by the treatment with basic solution. The heat treatment in the first
step provides condensation of the aspartate monomer within the interlayer region into polysuccinimide,
which in the second step undergoes hydrolysis to form poly(α,β–aspartate) [24]. The other examples of
the synthesis of polymer-LDH nanocomposites by co-precipitation method are intercalation and subse-
quent polymerization of styrene–4–sulfonate within Ca-Al–LDH [31], styrene sulfonate into Zn–Aland
Ca-Al–LDH [32], 3–sulfopropyl methacrylate within Zn-Al–LDH [33], etc.
The property of LDH materials to regenerate from an aqueous dispersion of their mixed oxide form is
also applied to prepare the monomer-intercalated hybrids (path 3, Figure 2.2). This is called regeneration
method, which is similar to that used for converting LDH containing CO32− to the other forms. This
method is very common for the modification of LDH materials with organic molecules, which are then
used as a precursor for polymer intercalation by various methods.
The organic/inorganic pillar method (path 4, Figure 2.2) differs from the anion exchange method in
the sense that an anionic species (other than the monomers) is used in this method as a spacer or pillaring
agent to increase the interlayer distance before the intercalation of monomer. Therefore, the monomers
in this case interact with a pillared LDH species. Wang et al. [34] used 10-undecenoate pillared Mg-Al–
LDH hybrid (prepared by co-precipitation method) as the precursor for methyl methaacrylate (MMA)
intercalation into LDH and subsequently polymerized the intercalated MMA using a two-step bulk poly-
merization technique. In the first step called prepolymerization step, a homogeneous mixture of organ-
ically pillared LDH and MMA monomer was prepared through constant stirring, which resulted inter-
calation of MMA into LDH layer. The mixture was then heated at 50℃ under nitrogen atmosphere in
the presence of small amount of catalyst 2,2′–azobisisobutyronitrile (AIBN) to prepolymerize the MMA
monomers. In the second step called casting polymerization, AIBN was again added to the prepolymer
mixture at room temperature and injected into a glass mold at 60℃ for 4h. The glass mold was then
kept in an oven at 120℃ for 1h to complete the polymerization process. In an another variation they
used amino benzoate pillared LDH to prepare poly (methyl methacrylate) (PMMA)/LDH nanocompos-
ite using a single step solution polymerization technique [35]. Challier and Slade [36] reported inter-
calation of aniline molecule into terephthalate or hexacyanoferate pillared Cu–Crand Cu–AlLDH. The

CHAPTER 2. LITERATURE REVIEW 11
interlamellar oxidative polymerization of aniline molecules yields polyaniline intercalated LDH with re-
tention of the framework of the later. Sugahara and co-workers [37] intercalated acrylonitrile monomer
into a dodecylsulfonate pillared Mg-Al–LDH to synthesize polyacrylonitrile in the interlayer region.
Similarly, O’Leary and co-worker [39] also used dodecylsulfate pillared Mg-Al–LDH to intercalate acry-
C O - O
H 2 N
N H 2
C O O -
+
+
+
O N H 2 H 2 N
O O
O
O
O
O
LDH - AB
( ODA )
(PMDA)
DMAc
R.T.
C O - O
N H C O C O O H
N
C O O -
C O
C H O O
H
N
C O O -
O O
C O - O
N O
O Imidization
(LDH - AB/PAA)
(LDH - AB/PI )
Figure 2.3 Preparation of LDH-polyimide (LDH-AB/PI) nanocomposites (LDH-AB: aminoben-
zoate intercalated LDH, ODA: 4,4’-oxydianiline, PMDA: pyromellitic anhydride [38].
late monomer and its subsequent polymerization. Although the primary function of the pillaring agent is
the expansion of the interlayer distance, it may also actively participate in the interlayer polymerization
reaction. The pillaring agent in such case has a functional group similar to the monomer molecules by
which it interacts with the grwoing polymer chains and attach them to the LDH sheet. Hsueh and Chen
[38] synthesized LDHs/polyimide nanocomposites an active pillaring agent amino benzoate. The Amino
benzoate modified Mg-Al–LDH was used as the precursor for intercalation of monomers (pyromellitic
anhydride and 4,4’–oxydianiline). The formation of polyimide in the interlayer region takes place in two

CHAPTER 2. LITERATURE REVIEW 12
steps through the formation of polyamic acid. The possible mechanism of interlayer polymerization is
shown in Figure 2.3.
2.2.1.2 Solution Intercalation of Polymers within LDH Layers
The direct intercalation of the polymeric species having functional groups that can interact with the
hydroxide layers of LDH is also an effective way to prepare polymer/LDH nanocomposites. Principally,
the methods used for intercalation of monomer or small oligomeric organic molecules into LDH, are
also applicable for high molecular weight species. But, due to a very small interlayer distance and high
charge density of the LDH layers, the direct intercalation of large polymeric chains is more difficult.
Messsersmith and Stupp [40] prepared poly(vinyl alcohol) (PVA) intercalated Ca-Al–LDH by pre-
cipitating the later in the presence of dissolved PVA. The process involved mixing of a Ca(OH)2/PVA so-
lution to a solution containing Ca(OH)2 and Al(OH)3. It was suggested by them that the PVA molecules
facilitate the nucleation and the growth of the metal hydroxide layers. Further, Oriakhi and co-workers
[41] reported the incorporation of poly(acrylic acid), poly(vinylsulfonate) and poly(styrenesulfonate)
into the LDHs, like M1−xAlx (OH)2x+ (where, M is Mg, Ca, Co) and Zn1−xMx (OH)2
x+ (where, M
is Al, Cr) by precipitating LDH from a deareated aqueous basic solution containing mixed metal ni-
trates and dissolved polymer. Other examples of polymer-LDH nanocomposites prepared by direct inter-
calation through co-precipitation technique are Mg-Al–LDH intercalated with poly(styrenesulfonate),
poly(vynylsulfonate) [42], polyaspartate [24], poly(ethyleneoxide) derivatives [43], etc.
Often for the intercalation of polymeric species in solution, organically modified LDH clays are used.
Various anionic surfactants, like the salts of the fatty acids with different chain lengths, alkyl or alkyl-
aryl sulfonates, etc are usually used for LDH modification. This modification involves the exchange of
anionic species present in the unmodified LDH by a suitable organic anion, which is carried out by the
similar methods used for LDH synthesis. The organically modified LDHs show higher interlayer sepa-
ration and increased hydrophobicity, both of which make the polymer intercalation process easier. The
high reactivity of LDHs toward various organic surfactant anions, in spite of their high surface charge
density, makes the modification process feasible. Intercalation behavior of LDHs toward various organic
anionic surfactants is extensively reported in literatures [6, 22, 44–46]. Carlino [22] reviewed different
methods for modification of LDHs by long chain carboxylic acids. To prepare polymer nanocomposites,
typically the organically modified LDH is dispersed in a solution containing polymer. The resultant dis-
persion is then stirred or aged under nitrogen atmosphere to accomplish the polymer intercalation. Qu
and co-workers prepared and characterized polyethylene/LDH [47, 48] and polystyrene/LDH nanocom-
posites [49] by this method using dodecylsulfate modified LDH (LDH-DS). The nanocomposites were
obtained by refluxing the mixture of LDH-DS and the polymers solution in xylene. Buniak and co-
workers [50] also used LDH-DS to prepare poly(ethylene oxide) (PEO)/LDH nanocomposites. The
modification of Mg-Al–LDH was carried out using ion-exchange method and the modified LDH was
later treated with aqueous solution of PEO to prepare the nanocomposite. Recently, Liao and Ye [51]
prepared PEO/LDH based nanocomposite electrolyte by solution intercalation method. First, using the
co-precipitation method they modified Mg-Al–LDH with two different types of anionic surfactants: n-
alkyl 3-sulfopropyl ether salt (containing about 11 ethylene oxide/mole and C13 – C15 alkyl chain) and
oligomeric hydroxy poly(ethylene oxide) phosphate. Then the nanocomposites were obtained by mix-
ing PEO, the modified LDH and lithium perchlorate in anhydrous acetonitrile at 70 ℃ with constant

CHAPTER 2. LITERATURE REVIEW 13
stirring for several hours. Further, Li and co-workers [52] prepared glycine intercalated Mg-Al–LDH
and modified with formamide, which was then treated with an acetone solution of PMMA to form the
nanocomposites. All these cases mentioned so far produce mostly polymer-intercalated LDH particle in
the nanocomposite matrix. But, Hsuesh and Chen [53] reported the synthesis of exfoliated epoxy/LDH
nanocomposites by treating amino laurate intercalated Mg-Al–LDH with a mixture of epoxy resin and
curing agent. The resin and the curing agent diffused into the LDH interlayer region after heating the
mixture for few hours. The thermal aging of this reaction mixture causes exfoliation of the LDH layers
due to curing of the epoxy resin in between the layers, which results in formation of crosslined network
of epoxy resin.
The direct ion exchange with LDHs by the polymers having anionic functional groups is also a
feasible method for the preparation of polymer/LDH nanocomposites. This method does not involve
the organic modification of the pristine LDH. Yang and co-worker [54] reported the intercalation of
poly(ethylene oxide) sulfate and poly(ethylene glycol) within Mg-Al–LDH by aging a polymer-LDH
aqueous suspension at 65 ℃ for 4 days. Costa and co-workers [55] prepared nanocomposites through
intercalation of dendrimers (carboxylate terminated polyamidoamide) into LDH. They observed satura-
tion of dendrimer intercalation into host LDH when the mixing ratio of the two ingredients exceeded 1 : 2
(charge ratio of anionic clay and carboxylate group of the dendrimer). The dendrimers remained densely
packed in the interlayer region of LDH with an ellipsoidal shape. When excess dendrimers was used
(mixing ratio 1 : 8), in addition to intercalation they were also adsorbed on the clay surface. Similarly,
Leroux and co-workers [43] intercalaed poly(ethylene oxide) derivatives into Cu-Cr–LDH by replacing
Cl− anion from the interlayer region. They first ultrasonicated the LDH material in decarbonised water,
which was then added to a neutralized polymer solution containing an amount of polymer equivalent to
twice the anion exchange capacity of the clay.
2.2.1.3 Melt Compounding Method
Perhaps the most challenging method of preparing polymer/clay nanocomposites is the melt compound-
ing method. With non-polar polymers, like polyolefin, it becomes more difficult due to high thermody-
namic incompatibility between the non-polar matrix and the polar clay materials. There are not many
reports available till today that exclusively deal with the preparation of polymer/LDH nanocomposites
using melt-compounding technique. This method has definite technological advantage over the solu-
tion method as it can be easily adopted for industrial product manufacture using conventional polymer
processing equipments. Therefore, in spite of being most difficult method, melt-compounding method
always finds special interest among researchers. Use of Mg-Al–LDH in the preparation of polymer
composites using this method is very common, where it is treated as simple metal hydroxide whose ba-
sic nature and endothermic decomposition serves two-fold purpose: as acid scavengers in halogenated
polymers [56, 57] and as flame-retardant [58]. However, in none of these applications any reference was
made to exploit the efficiency of Mg-Al–LDH as nanofiller.
The melt-compounding method used for the preparation of polymer/LDH nanocomposites is similar
to that used for conventional polymer/clay nanocomposites. The organically modified LDHs are the
suitable precursor for this process, which are mixed with molten polymer in the typical plastic processing
equipments. Nichols and co-workers [59] first reported the melt-compounding method for preparing
polymer/LDH nanocomposites. Very recently, researchers are showing more interests in this method to
CHAPTER 2. LITERATURE REVIEW 14
prepare nanocomposites based on different types of matrices. For examples, Zammarano et al. prepared
polyamide 6/LDH nanocomposites using organically modified Mg-Al–LDH [60]. They observed that
high degree of exfoliation of the LDH particles can be obtained using LDHs with low anion exchange
capacity. Lee et al. [61] prepared poly(ethyleneterephthalate)/LDH nanocomposites with Mg-Al–LDH
modified with various organic surfactants. They observed improved thermal and mechanical properties
of these nanocomposite composition compared to the unfilled polymer. The other reported polymer/LDH
nanocomposites systems prepared by melt-compounding methods includes polypropylene/Zn-Al–LDH
[62], polyethylene/Mg-Al–LDH [63], polyethylene/Zn-Al–LDH [64], etc.
2.2.2 Properties of Polymer/LDH Nanocomposites
2.2.2.1 Morphological Characteristics
In polymer/clay nanocomposites, complete exfoliation of clay layers results in disappearance of the
diffraction maxima in their XRD patterns. However, this can also occur due to other reasons, like ex-
tremely low concentration of clay materials in the composites, crystal defects, etc. The majority of the
reports on polymer/LDH nanocomposites show the intercalated or swollen nature of the clay structures.
The presence of the basal reflections in the XRD patterns of such type of nanocomposites indicates that
the LDH crystal structure is not destroyed completely. But, shifting of their positions to lower 2 θ values
is interpreted as an expansion of the interlayer region by the polymer chains. Besides, broadening of the
characteristic reflections in nanocomposites is often related to the defects in the crystal layer stacking
caused by the interlayer polymeric species. The information on the arrangements of the polymer chains
within the interlayer region can also be obtained from the XRD data, which suggest that both bi-layer and
mono-layer arrangements of polymer chains are possible depending on the nature of the chain backbone
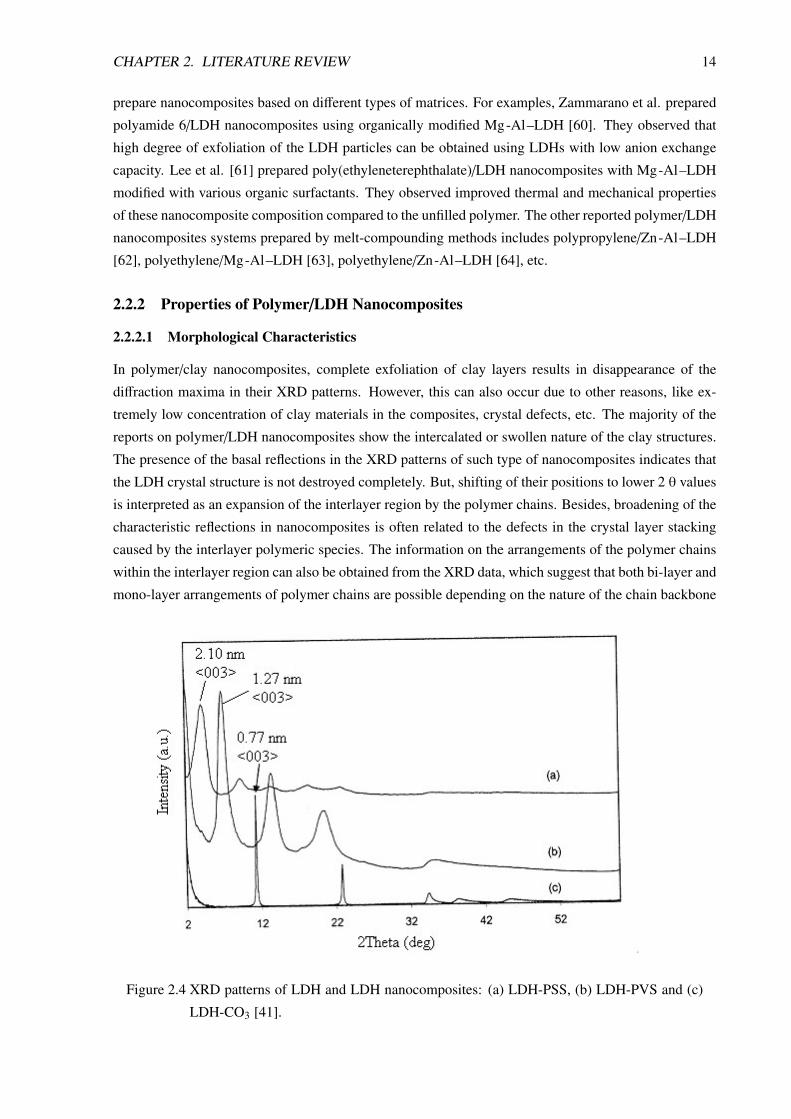
Figure 2.4 XRD patterns of LDH and LDH nanocomposites: (a) LDH-PSS, (b) LDH-PVS and (c)
LDH-CO3 [41].
CHAPTER 2. LITERATURE REVIEW 15
and the pendent functionalities. For example, Figure 2.4 shows the XRD patterns of polystyrenesul-
fonate (PSS) and polyvinylsulfonate (PVS) intercalated Mg-Al–LDH nanocomposites. The theoretical
calculations based on these XRD results and molecular dimensions (which gives thickness of the metal
hydroxide sheet equal to about 0.48 nm and interlayer gap 0.28 nm) reveal that the interlayer distance
increases from 0.76 nm in the original LDH to 1.27 nm to the LDH-PVS hybrid and to 2.10 nm in the
LDH-PSS hybrid. The bi-layer thickness of these polymers based on molecular dimensions matches
the expanded interlayer distance [41, 42]. Again, the nature of arrangement of the pendent anionic
functionality or electron rich moiety (like phenyl ring) on the polymer backbone can also influence the
packing nature of the polymers in the interlayer region. For example, syndiotactic polystyrenesulfonate
with alternating anionic groups projecting to the opposite sides of polymer backbone forms a monolayer
arrangement in Ca–Al LDH host [31].
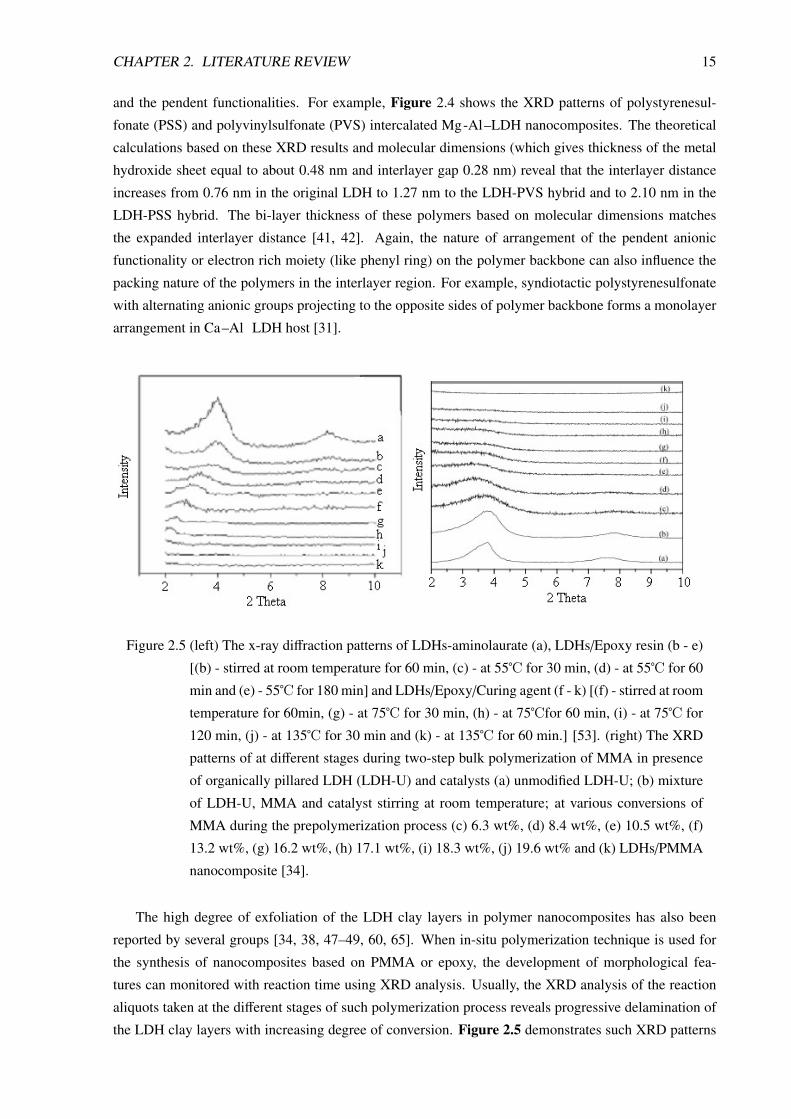
Figure 2.5 (left) The x-ray diffraction patterns of LDHs-aminolaurate (a), LDHs/Epoxy resin (b - e)
[(b) - stirred at room temperature for 60 min, (c) - at 55℃ for 30 min, (d) - at 55℃ for 60
min and (e) - 55℃ for 180 min] and LDHs/Epoxy/Curing agent (f - k) [(f) - stirred at room
temperature for 60min, (g) - at 75℃ for 30 min, (h) - at 75℃for 60 min, (i) - at 75℃ for
120 min, (j) - at 135℃ for 30 min and (k) - at 135℃ for 60 min.] [53]. (right) The XRD
patterns of at different stages during two-step bulk polymerization of MMA in presence
of organically pillared LDH (LDH-U) and catalysts (a) unmodified LDH-U; (b) mixture
of LDH-U, MMA and catalyst stirring at room temperature; at various conversions of
MMA during the prepolymerization process (c) 6.3 wt%, (d) 8.4 wt%, (e) 10.5 wt%, (f)
13.2 wt%, (g) 16.2 wt%, (h) 17.1 wt%, (i) 18.3 wt%, (j) 19.6 wt% and (k) LDHs/PMMA
nanocomposite [34].
The high degree of exfoliation of the LDH clay layers in polymer nanocomposites has also been
reported by several groups [34, 38, 47–49, 60, 65]. When in-situ polymerization technique is used for
the synthesis of nanocomposites based on PMMA or epoxy, the development of morphological fea-
tures can monitored with reaction time using XRD analysis. Usually, the XRD analysis of the reaction
aliquots taken at the different stages of such polymerization process reveals progressive delamination of
the LDH clay layers with increasing degree of conversion. Figure 2.5 demonstrates such XRD patterns

CHAPTER 2. LITERATURE REVIEW 16
Figure 2.6 Change of XRD patterns with the different contents of LDH content in polystyrene/LDH
nanocomposite sample: (a) 100 wt%, (b) 50 wt%, (c) 20 wt%, (d) 10 wt%, (e) 5 wt%
[49].
for PMMA and expoxides based nanocomposites. The high degree of exfoliation is not only confirmed
from the disappearance of all the characteristic peaks corresponding to LDH after expected conversion,
but also from the large extent of polymer fraction unextractable by a suitable solvent from the resultant
nanocomposite [65]. When the melt-compounding method is employed for polymer/LDH nanocompos-
a b
c d
50 nm 50 nm
Figure 2.7 TEM micrographs showing LDH particle dispersion in different polymer (a) PMMA [34],
(b) epoxy [53], (c) polyamide 6 [60] and (d) polystyrene containing 5 wt% LDH [49]
CHAPTER 2. LITERATURE REVIEW 17
ites preparation, processing conditions such as temperature, degree of shearing, etc influence the degree
of exfoliation of the LDH particles [60]. Besides, the concentration of LDH and the nature of polymer
matrix also influence the state of particle dispersion in the nanocomposite. In general, with highly polar
matrices, like epoxies, PMMA, polyimide, polyamide, etc the high degree of exfoliation of the LDH
clay layers is achieved up to much higher LDH concentration compared to the relatively less polar or
non-polar polymers. In later case, the high degree of exfoliation exists at lower concentration of LDH
and with increasing concentration agglomerate formation takes place. Chen and co-workers reported
that in polystyrene/LDH nanocomposites, fully exfoliated LDH particles are observed at the low con-
centrations of LDH whereas at high concentrations, the LDH particles mostly have intercalated nature
[47–49]. Figure 2.6 reveals the variation of interlayer separation of Zn-Al–LDH in polystyrene based
nanocomposites with LDH concentration. The fully exfoliated nature of the composites containing 5.0
and 10.0 wt% LDH can be speculated from the loss of basal reflection in their XRD pattern.
The analysis of the TEM micrographs of the polymer/LDH nanocomposites presents direct infor-
mation about the nature of clay particle dispersion. In the exfoliated nanocomposites based on PMMA,
epoxy and polyimide, the dispersed particles mostly exist as exfoliated layers or small tactoids (stacks of
small number of single layer). But, in case of the intercalated nanocomposites, they exhibit a tendency to
A
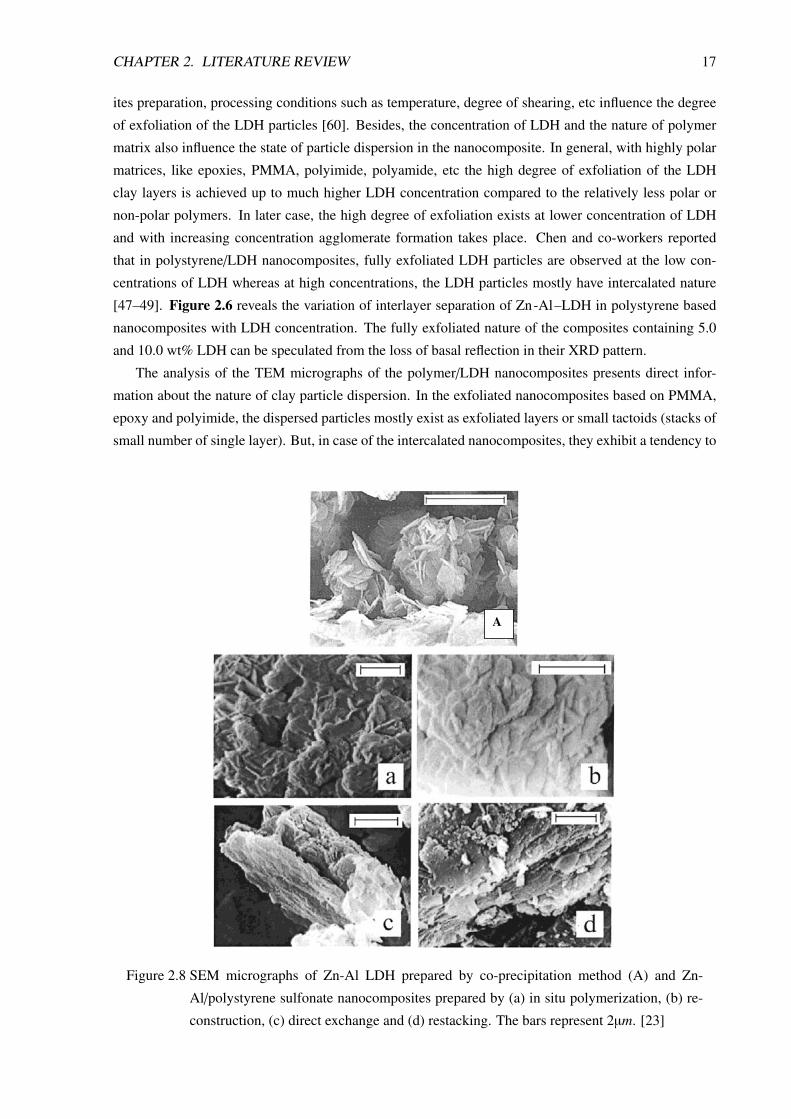
Figure 2.8 SEM micrographs of Zn-Al LDH prepared by co-precipitation method (A) and Zn-
Al/polystyrene sulfonate nanocomposites prepared by (a) in situ polymerization, (b) re-
construction, (c) direct exchange and (d) restacking. The bars represent 2µm. [23]
CHAPTER 2. LITERATURE REVIEW 18
form aggregates or physically associated structures. This has been vividly demonstrated in Figure 2.7,
where TEM images of the nanocomposites containing 5.0 wt% LDH in different matrices are shown at
comparable magnification. In case polar matrix (epoxy, PMMA and polyamide), complete exfoliation
of the LDH particles can be observed whereas in polystryrene matrix LDH particles are mostly interca-
lated. In addition to the polarity of matrix polymer, the method of preparation of the nanocomposites
significantly influences the crystallinity and the morphology of the dispersed LDH particles. Figure 2.8demonstrates the morphological features of Zn-Al–LDH-polystyrene sulfonate intercalated nanocom-
posites prepared by different methods [23]. Irrespective of the the method used, a complete change in the
LDH particle morphology can be observed after the polymer intercalation. The original platelet-like pri-
mary structure of the LDH crystallites no longer exists in the nanocomposites, rather the sheet are more
or less crumpled over one another. As clear from Figure 2.8, this reorganization of particle structure is
greatly influenced by the preparation method.
2.2.2.2 General Properties of Polymer/LDH Nanocomposites
In general, when compared with the conventional polymer composites, polymer nanocomposites exhibit
significant improvements in different properties at relatively much lower concentration of filler. They
usually differ from the conventional composites in different aspects, like size of the dispersed filler par-
ticles, nature and extent of interaction at the particle-polymer interface, etc. The efficiency of various
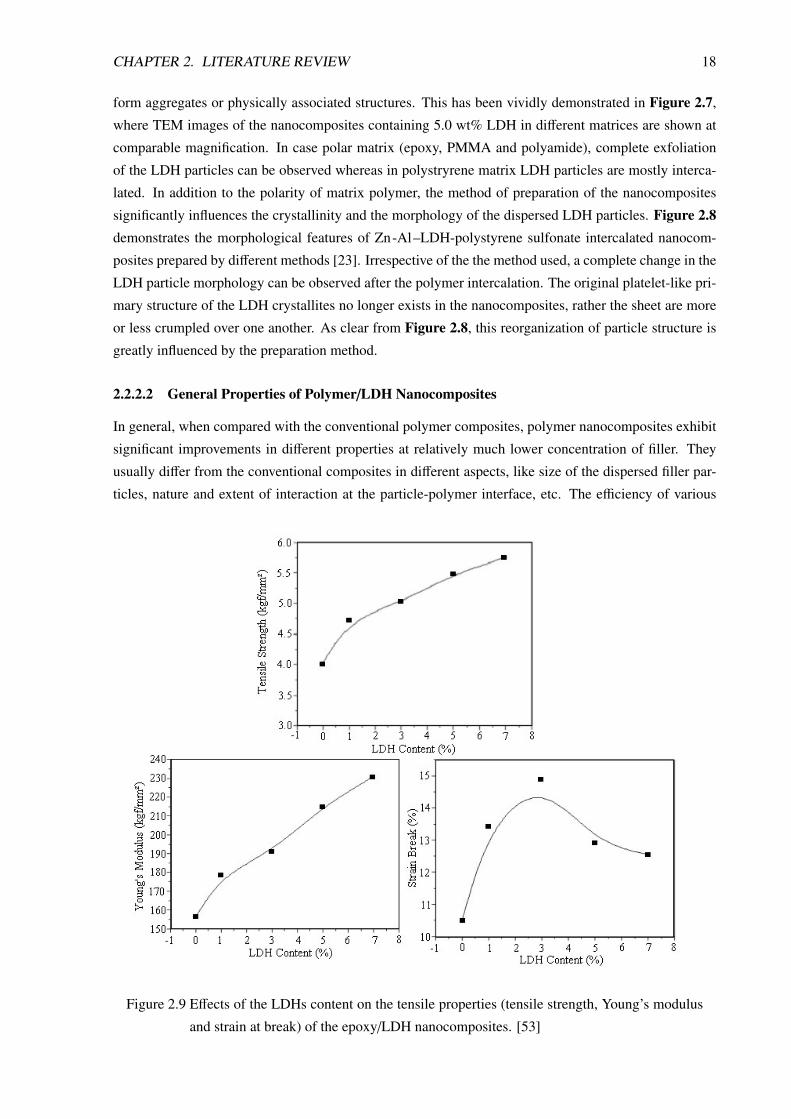
Figure 2.9 Effects of the LDHs content on the tensile properties (tensile strength, Young’s modulus
and strain at break) of the epoxy/LDH nanocomposites. [53]

CHAPTER 2. LITERATURE REVIEW 19
additives in polymer composites can be increased many folds when dispersed in the nanoscale. This
becomes more noteworthy when the additive is used to address any specific property of the final com-
posites such as mechanical properties, conductivity, gas permeability, thermal stability, etc. In case of
polymer/LDH nanocomposites, similar improvements are also observed in many ocassion.
The mechanical properties of epoxy/LDH nanocomposites are shown in Figure 2.9. It is evident
that the presence of a small amount of LDH significantly increases the tensile strength and the modulus
showing the strong reinforcing nature of LDH on the epoxy matrix. This highly reinforcing nature of
LDH particles in epoxy is related to their exfoliated structure in the nanocomposite, where the highly
anisometric LDH layers remain strongly attached to the polar epoxy matrix. This becomes possible
due favorable chemical and electrostatic interaction between LDH surface and oxygen rich backbone of
epoxy matrix. Thus each individual exfoliated layer imparts reinforcing effect on the matrix. However,
Such strong interaction often acts negatively on the impact strength of the nanocomposites resulting
sharp decrease in elongation at break after a certain level of LDH concentration. In case of relatively less
polar polymer, aggregation of the dispersed particles leads to a reduction in the mechanical properties
after an initial improvement observed at low concentration of LDH. Hsueh and Chen [38] have observed
this behavior in polyimide/LDH based nanocomposites. They reported that beyond 5 wt% LDH content,
the dispersed nanolayers form aggregates and the tensile properties of the nanocomposites are reduced.
In case of exfoliated PMMA/LDH nanocomposites, Wang et al. [65] have observed a strong reinforcing
nature of the exfoliated LDH clay particles. In presence of 5 wt% LDH, such composite shows above
60% and 80% increase in tensile strength and modulus, respectively in comparison to unfilled PMMA.
However, flexibility and the impact properties of such nanocomposites are significantly affected, which
is reflected in over 50 % lowering in elongation at break during tensile testing.
The improvement of thermal properties compared to the unfilled polymer is a very important aspect
of polymer/LDH nanocomposites. LDHs contain large amount of bound water due to the presence of
-OHgroup on the metal hydroxide sheets and some free water molecules in the interlayer region. The
mechanism by which LDH clays improves the thermal stability and flammability of polymer matrix is
similar to that observed in case of conventional metal hydroxide type fillers, like Mg(OH)2 and Al(OH)3.
The endothermic decomposition of LDHs takes off heat from the surrounding and the liberated water
vapor reduces the concentration of combustible volatile in the vicinity of the polymer surface. As a
result, the decomposition temperature of the polymer is increased. Interestingly, such improvement is
quite significant even at low concentrations of LDH . This is probably due to better dispersion of the
LDH particles compared to that observed in conventional composites based on simple metal hydroxide.
Again, when the more basic interlayer anions in the unmodified LDHs are replaced by less basic organo
anionic species in the modified LDHs, the thermal stability of the metal hydroxide layers are enhanced
[66]. Additionaly, the nanoscale dispersion of the clay materials in polymer nanocomposites improves
the compactness of the char formed after burning of the surface region. This hinders the conduction
of heat and the diffusion of oxygen into the bulk region [67, 68]. The improved thermal stability of
LDH based nanocomposites has been reported by many researchers [38, 46–49, 53]. In all these cases,
thermogravimetric analysis (TGA) showed significant increase in the temperature at which 50% weight
loss occurs.
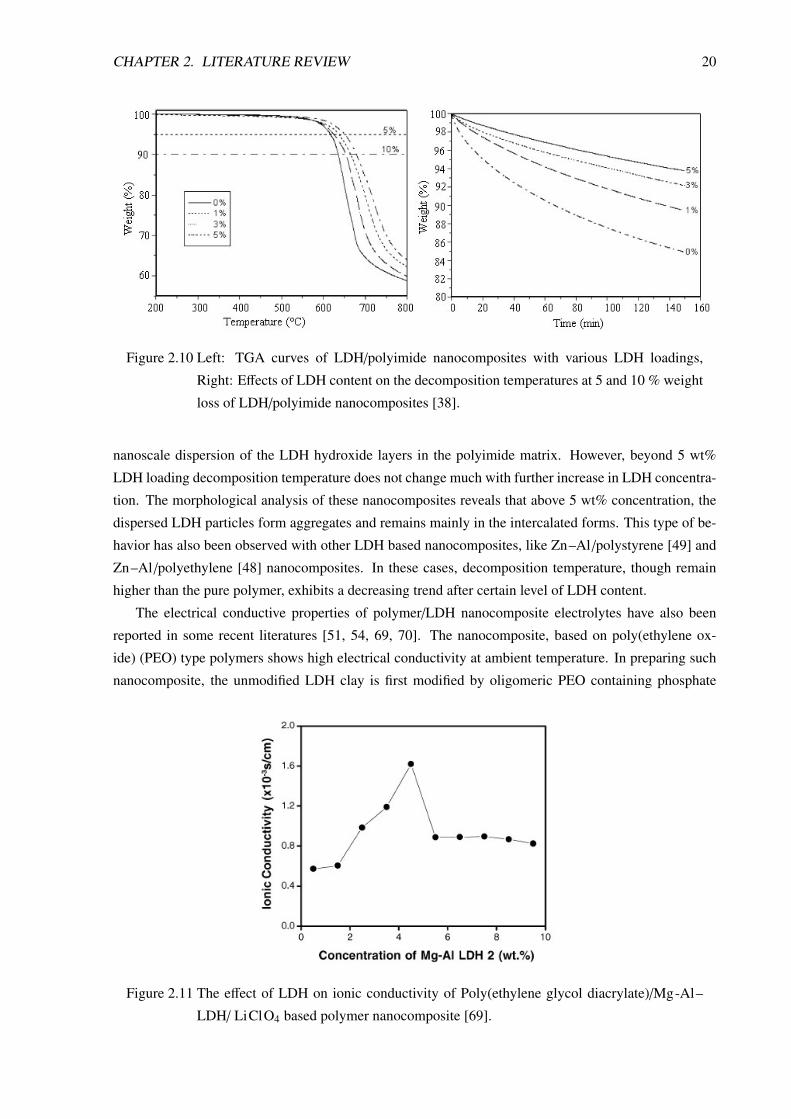
Figure 2.10 shows TGA results of polyimide-LDH nanocomposites. The addition of 5 wt% LDH
causes significant enhancement of the thermal stability of the composites, which is attributed to the
CHAPTER 2. LITERATURE REVIEW 20
Figure 2.10 Left: TGA curves of LDH/polyimide nanocomposites with various LDH loadings,
Right: Effects of LDH content on the decomposition temperatures at 5 and 10 % weight
loss of LDH/polyimide nanocomposites [38].
nanoscale dispersion of the LDH hydroxide layers in the polyimide matrix. However, beyond 5 wt%
LDH loading decomposition temperature does not change much with further increase in LDH concentra-
tion. The morphological analysis of these nanocomposites reveals that above 5 wt% concentration, the
dispersed LDH particles form aggregates and remains mainly in the intercalated forms. This type of be-
havior has also been observed with other LDH based nanocomposites, like Zn–Al /polystyrene [49] and
Zn–Al /polyethylene [48] nanocomposites. In these cases, decomposition temperature, though remain
higher than the pure polymer, exhibits a decreasing trend after certain level of LDH content.
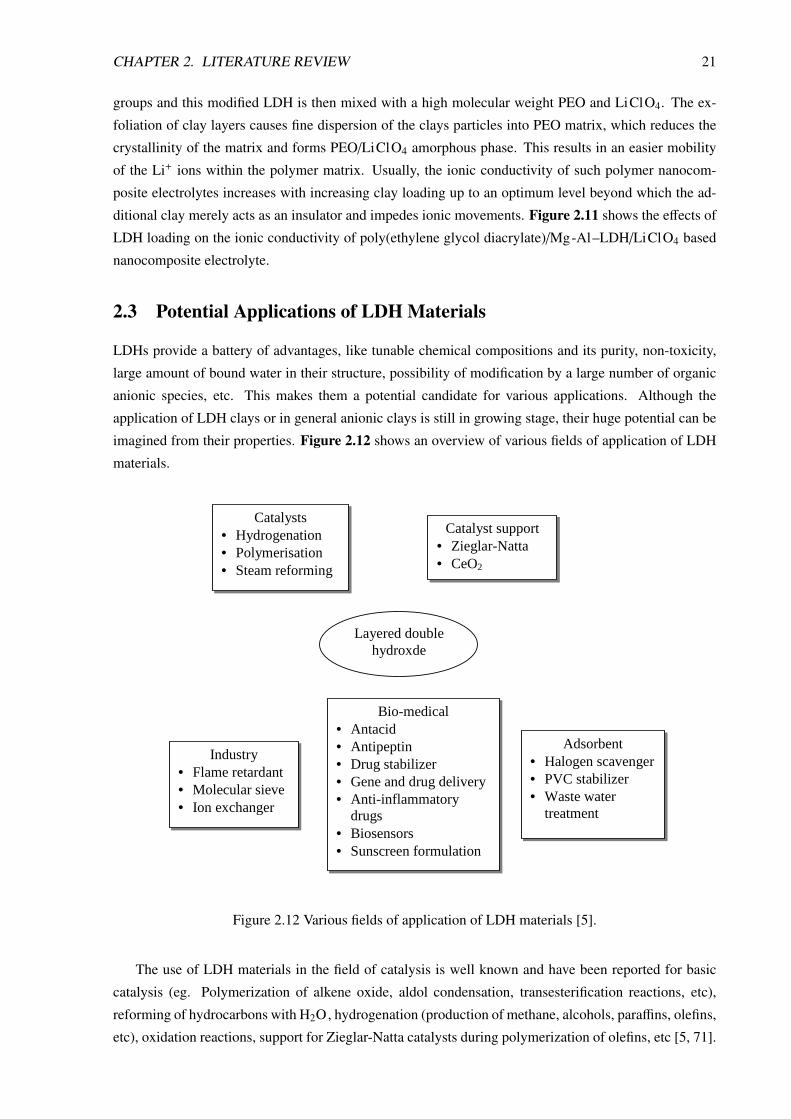
The electrical conductive properties of polymer/LDH nanocomposite electrolytes have also been
reported in some recent literatures [51, 54, 69, 70]. The nanocomposite, based on poly(ethylene ox-
ide) (PEO) type polymers shows high electrical conductivity at ambient temperature. In preparing such
nanocomposite, the unmodified LDH clay is first modified by oligomeric PEO containing phosphate
Figure 2.11 The effect of LDH on ionic conductivity of Poly(ethylene glycol diacrylate)/Mg-Al–
LDH/ LiClO4 based polymer nanocomposite [69].
CHAPTER 2. LITERATURE REVIEW 21
groups and this modified LDH is then mixed with a high molecular weight PEO and LiClO4. The ex-
foliation of clay layers causes fine dispersion of the clays particles into PEO matrix, which reduces the
crystallinity of the matrix and forms PEO/LiClO4 amorphous phase. This results in an easier mobility
of the Li+ ions within the polymer matrix. Usually, the ionic conductivity of such polymer nanocom-
posite electrolytes increases with increasing clay loading up to an optimum level beyond which the ad-
ditional clay merely acts as an insulator and impedes ionic movements. Figure 2.11 shows the effects of
LDH loading on the ionic conductivity of poly(ethylene glycol diacrylate)/Mg-Al–LDH/LiClO4 based
nanocomposite electrolyte.
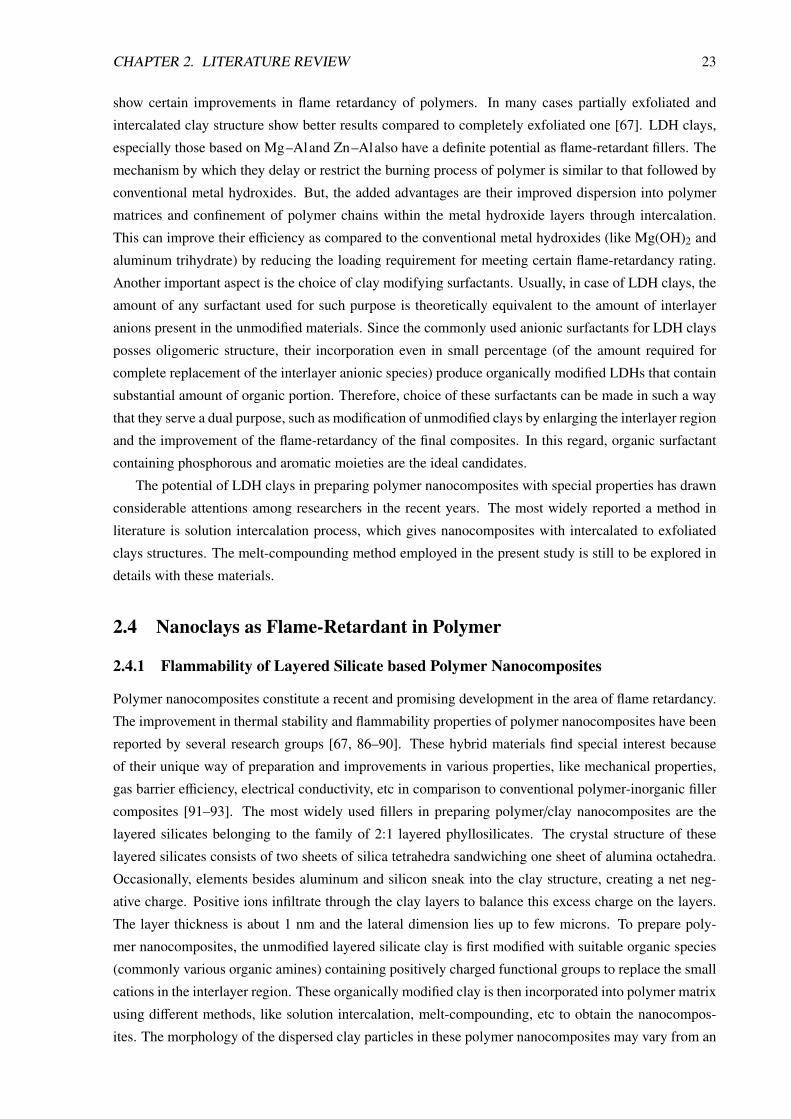
2.3 Potential Applications of LDH Materials
LDHs provide a battery of advantages, like tunable chemical compositions and its purity, non-toxicity,
large amount of bound water in their structure, possibility of modification by a large number of organic
anionic species, etc. This makes them a potential candidate for various applications. Although the
application of LDH clays or in general anionic clays is still in growing stage, their huge potential can be
imagined from their properties. Figure 2.12 shows an overview of various fields of application of LDH
materials.
Layered double hydroxde
Catalysts • Hydrogenation • Polymerisation • Steam reforming
Catalyst support • Zieglar-Natta • CeO2
Industry • Flame retardant • Molecular sieve • Ion exchanger
Bio-medical • Antacid • Antipeptin • Drug stabilizer • Gene and drug delivery • Anti-inflammatory
drugs • Biosensors • Sunscreen formulation
Adsorbent • Halogen scavenger • PVC stabilizer • Waste water
treatment
Figure 2.12 Various fields of application of LDH materials [5].
The use of LDH materials in the field of catalysis is well known and have been reported for basic
catalysis (eg. Polymerization of alkene oxide, aldol condensation, transesterification reactions, etc),
reforming of hydrocarbons with H2O, hydrogenation (production of methane, alcohols, paraffins, olefins,
etc), oxidation reactions, support for Zieglar-Natta catalysts during polymerization of olefins, etc [5, 71].

CHAPTER 2. LITERATURE REVIEW 22
Because of bio-compatible nature, the use of LDH materials in bio-medical field is wide spread.
One important and very promising field of application is the controlled release of drugs and various
active chemical species. In this regard, the intercalation chemistry of LDH type clay is of special inter-
est in stabilizing and sequestration of highly active or toxic molecules. Such bio-nanohybrid can then
be administered into the body system, where the active ingredients are released at desired location via
a chemical switch such as change in pH. For example, for controlled release of various inflammatory
drugs the use of this techniques provides better results [72]. The use Mg-Al–LDH in formulating anti-
gastric medicine is another popular biomedical application. Recently, Lee and Chen [73] reported the
drug release behavior of nanocomposite hydrogels prepared from Mg-Al–LDH and poly[acrylic acid-
co-poly(ethylene glycol methyl ethyl acrylate)]. Other important bio-medical application of LDH based
organic hybrids as bio-macromolecule carriers. Choy and co-workers [74] used LDH to encapsulate
DNA molecules by simple ion-exchange method in aqueous medium. These bio-LDH nanohybrids are
then used for release of DNA molecules inside cells. LDH-organic hybrids can also be used in designing
of electrochemical biosensors for various chemicals. For examples, polyphenylene oxidase intercalated
Zn-Al–LDH hybrids for phenol determination [75], urease intercalated Zn-Al–LDH for urea detection
[76], etc.
The Mg-Al–LDH is also used as stabilizer and halogen scavenger in polyvinylchloride (PVC) formu-
lation [56, 77]. The incorporation of small amount of LDH into PVC significantly improves the thermal
stability of the resin and suppresses its degradation. This happens through mainly two processes: the
interaction of Cl− ions into the interlayer region of LDH followed by the reaction of HCl (produced
due to dehydrochlorination of PVC) with the hydroxide groups of the metal hydroxide layers producing
metal chloride.
Recently, the use of LDH clays to prepare polymer nanocomposites electrolytes has been reported
[51, 54, 69, 70]. These nanocomposites shows high ionic conductivity at ambient temperature and can
be a suitable material for designing thin-film type of Li-polymer secondary battery cells.
LDHs could be treated as a carrier for specific chemical agent such as UV or photo stabilizer, dye or
coloring agents, fluorescent chemicals, antioxidants, etc used in polymer composites. These chemicals
are often water soluble and contains functional groups that can favourably interact with LDH. As a
results, they can be easily intercalated within the gallery space of nanostructured LDH particles. The
hybrid thus formed can be incorporated into the polymer matrix, where these specific chemicals can
exhibit their intended functions. The basic purpose of using LDH as carrier is to prevent unwanted
release of these chemicals (commonly known as leaching) from the matrix thus maintaining the life time
of the final composites [78]. Additionally, due to entrapment within the LDH crystal layers, the overall
(thermal, chemical and photostability) of these chemicals will be enhanced [79, 80]. Evans et al. have
made extensive investigation on the intercalation of various organic dyes and UV stabilizers within LDH
[80–82]. Such intercalated LDH-dye hybrids can also dispersed in polymer matrix, where the hybrid
fillers simultaneously exhibit the functions of the nanofiller and the organic dye [83]. Various rare-
earth metal complex based on Ce, Eu, Tb, etc can be intercalated into LDH to synthesize luminescent
materials [84, 85]. These LDH based luminescent materials can be ideal materials for application in the
field of signal lights and optical sensors.
The concept of nanotechnology in designing flame-retardant polymer composites is an upcoming
field. It has already been established that polymer nanocomposites based on layered silicates type clays
CHAPTER 2. LITERATURE REVIEW 23
show certain improvements in flame retardancy of polymers. In many cases partially exfoliated and
intercalated clay structure show better results compared to completely exfoliated one [67]. LDH clays,
especially those based on Mg–Aland Zn–Alalso have a definite potential as flame-retardant fillers. The
mechanism by which they delay or restrict the burning process of polymer is similar to that followed by
conventional metal hydroxides. But, the added advantages are their improved dispersion into polymer
matrices and confinement of polymer chains within the metal hydroxide layers through intercalation.
This can improve their efficiency as compared to the conventional metal hydroxides (like Mg(OH)2 and
aluminum trihydrate) by reducing the loading requirement for meeting certain flame-retardancy rating.
Another important aspect is the choice of clay modifying surfactants. Usually, in case of LDH clays, the
amount of any surfactant used for such purpose is theoretically equivalent to the amount of interlayer
anions present in the unmodified materials. Since the commonly used anionic surfactants for LDH clays
posses oligomeric structure, their incorporation even in small percentage (of the amount required for
complete replacement of the interlayer anionic species) produce organically modified LDHs that contain
substantial amount of organic portion. Therefore, choice of these surfactants can be made in such a way
that they serve a dual purpose, such as modification of unmodified clays by enlarging the interlayer region
and the improvement of the flame-retardancy of the final composites. In this regard, organic surfactant
containing phosphorous and aromatic moieties are the ideal candidates.
The potential of LDH clays in preparing polymer nanocomposites with special properties has drawn
considerable attentions among researchers in the recent years. The most widely reported a method in
literature is solution intercalation process, which gives nanocomposites with intercalated to exfoliated
clays structures. The melt-compounding method employed in the present study is still to be explored in
details with these materials.
2.4 Nanoclays as Flame-Retardant in Polymer
2.4.1 Flammability of Layered Silicate based Polymer Nanocomposites
Polymer nanocomposites constitute a recent and promising development in the area of flame retardancy.
The improvement in thermal stability and flammability properties of polymer nanocomposites have been
reported by several research groups [67, 86–90]. These hybrid materials find special interest because
of their unique way of preparation and improvements in various properties, like mechanical properties,
gas barrier efficiency, electrical conductivity, etc in comparison to conventional polymer-inorganic filler
composites [91–93]. The most widely used fillers in preparing polymer/clay nanocomposites are the
layered silicates belonging to the family of 2:1 layered phyllosilicates. The crystal structure of these
layered silicates consists of two sheets of silica tetrahedra sandwiching one sheet of alumina octahedra.
Occasionally, elements besides aluminum and silicon sneak into the clay structure, creating a net neg-
ative charge. Positive ions infiltrate through the clay layers to balance this excess charge on the layers.
The layer thickness is about 1 nm and the lateral dimension lies up to few microns. To prepare poly-
mer nanocomposites, the unmodified layered silicate clay is first modified with suitable organic species
(commonly various organic amines) containing positively charged functional groups to replace the small
cations in the interlayer region. These organically modified clay is then incorporated into polymer matrix
using different methods, like solution intercalation, melt-compounding, etc to obtain the nanocompos-
ites. The morphology of the dispersed clay particles in these polymer nanocomposites may vary from an
CHAPTER 2. LITERATURE REVIEW 24
intercalated structure (where the polymer chains remains intercalated within the clay layers) to a com-
pletely exfoliated structure (where individual clay layers remains completely separated from each other
and dispersed homogeneously throughout the matrix). Technologically, all these types of clay particle
morphology are useful for final applications of the end materials. Usually, with non-polar polymers like
polyolefins, clay particles show less degree of exfoliation compared to polar polymers like polyamide.
The thermal stability of the clay based polymer nanocomposites have been extensively studied by
several research groups [67, 94, 95]. The most common technique to investigate the thermal stability is
thermogravimetric analysis (TGA). The results of TGA analysis is interpreted in terms of two tempera-
tures: one is T0.1 representing the temperature at which 10% weight loss occurs, which is taken as the
onset of thermal degradation and the other is T0.5 representing the temperature at which 50% weight loss
occurs, which is usually treated as the degradation temperature [90]. The amount of residue left above
600 ℃ gives a measure of char produced after combustion. Thermogravimetric analysis of polymer/clay
nanocomposites, in many cases, show higher thermal stability compared to the unfilled polymer matrix.
This is manifested as the higher values T0.1 and T0.5 in the nanocomposites. For example, Wilkie et al.
[90] reported polystyrene/montmorinilite based nanocomposites showing about 40 – 50 ℃ increase in
both T0.1 and T0.5. They have also shown that the nature of the organic modifiers used for clay modifi-
cation influences the thermal stability of the nanocomposites. Similar enhancement of thermal stability
have also been reported for other polymer/clay nanocomposites based on polydimethylsiloxane [96],
polyimide [97, 98], polyurethane [99], polycaprolactum [100], PMMA [94, 101], etc. The delay in the
onset of decomposition is often related to barrier effect caused by the dispersed clay particles and their
combustion residue against the diffusion of volatile gas and oxygen across the burning surface [102].
The heat release test usually carried out by cone-calorimeter is a very important method to analysis
the flammability performance of polymeric materials [4, 67]. Cone-calorimeter analysis of different
polymer nanocomposites reveals significant improvements in flammability properties. The results of this
analysis are expressed in terms of various combustion relevant properties, like heat release rate (HRR)
and its maximum value (called peak HRR or PHRR), carbon monoxide yield, smoke release rate, etc.
Gilman and co-workers [67] have extensively investigated several polymer nanocomposite systems using
cone calorimetry and some of their results are summarized in Table 2.1. It is apparent that in all these
nanocomposites PHRR and mean HRR are significantly reduced indicating their improved flammability
performance. Interestingly the parameters like, heat of combustion (Hc), specific extinction area (SEA, a
measure of smoke yield) and carbon monoxide yield, are not significantly changed in presence of layered
silicates. This means the chemistry of decomposition during combustion is not influenced by the silicates.
The intercalated and the exfoliated nanocomposites show comparable results in cone calorimeter analysis
[103]. Further, Wilkie and co-workers [90] have observed that in polyethylene/clay nanocomposites,
presence of 3.0 wt% clay cuases 30.0 – 40.0% reduction in PHRR compared to pure polyethylene. All
these results when compared with conventional composites or micro composites indicate that polymer
nanocomposites certainly exhibit improved flammability properties at similar filler concentrations. The
layered silicate influence the flammability of the nanocomposites primarily through condensed phase
mechanism [67, 86]. This involves the formation of compact char at the surface of burning material that
provides mainly the two-way barrier effect to the diffusing gases and volatiles through the surface: first
against the diffusion of oxygen from surrounding atmosphere to the surface beneath the char and the
second the flammable volatile from the polymer to the flame front. When these two diffusion processes

CHAPTER 2. LITERATURE REVIEW 25
Table 2.1 Selected cone calorimeter investigation results for polymer/layered silicatenanocomposites at 35 kW/m2 heat flux [67]
Residue Mean Mean Mean MeanSample Yield PHRRa HRRb Hc
c SEAd COYield
% kW/m2 kW/m2 MJ/kg m2/kg kg/kg
Nylon-6 (N6) 1 1010 603 27 197 0.01N6/silicate(2%)exfoliated 3 686 390 27 271 0.01N6/silicate(5%)exfoliated 6 378 304 27 296 0.02
Nylon-12 (N12) 0 1710 846 40 387 0.02N12/silicate(2%)exfoliated 2 1060 719 40 435 0.02
Polystyrene (PS) 0 1120 703 29 1460 0.09PS/silicate (3%)immiscible 3 1080 715 29 1840 0.09PS/silicate (3%)intercalated 4 567 444 27 1730 0.08
Polypropylene (PP) 0 1525 536 39 704 0.02PP/silicate(2%)intercalated 5 450 322 44 1028 0.02
a Peak heat release rateb Heat release ratec Heat of combustiond Specific extinction area
are severely obstructed, material can show self extinguishing behaviour [4]. The secondary mechanism
of flame inhibition can be that at high temperatures, the inorganic fillers act as radical scavengers due
to their Lewis acidic nature resulting in the inactivation of the flame propagating radicals formed during
pyrolysis of the polymer chains [86, 103].
2.4.2 LDH Clay as Flame-Retardants for Polymer
Though the uses of LDH clay as heat stabilizer and acid scavenger in halogenated polymers (such as
PVC) are well known [57, 104] its use as inorganic flame-retardant is not very common. The flame-
retardant characteristics of LDH clays originate from their Mg(OH)2 like chemistry, which involves
endothermic decomposition with the liberation of water vapor and often carbon dioxide. The residue
of such combustion is the metallic oxides that impedes the burning process by reducing the oxygen
supply to the fresh surface beneath. The early report on the flame-retardant application of LDH was
published by Miyata et al [58]. The idea was to add hydrotalcite (naturally occurring LDH clay) both in
unmodified or in surface treated form at high concentrations (> 50 wt%) in polymers, like polyolefins,
polystyrene, nylon, polycarbonate, etc to obtain flame-retardant compositions. In fact, such high con-
centrations though often provided various industrial acceptable flammability ratings (such as UL94 V0),
the mechanical properties of the final composites were drastically affected. The treatment of LDH clays
as flame-retardant as well as a nanofiller can be a potential development in this regard. In the recent
years, many reports have been published that highlight the improved thermal and flammable properties
of LDH clay based polymer nanocomposites. Recently, Zammarano and co-workers [105] have reported
synthesis of self-extinguishing epoxy/LDH nanocomposites. They have also observed a synergistic ef-
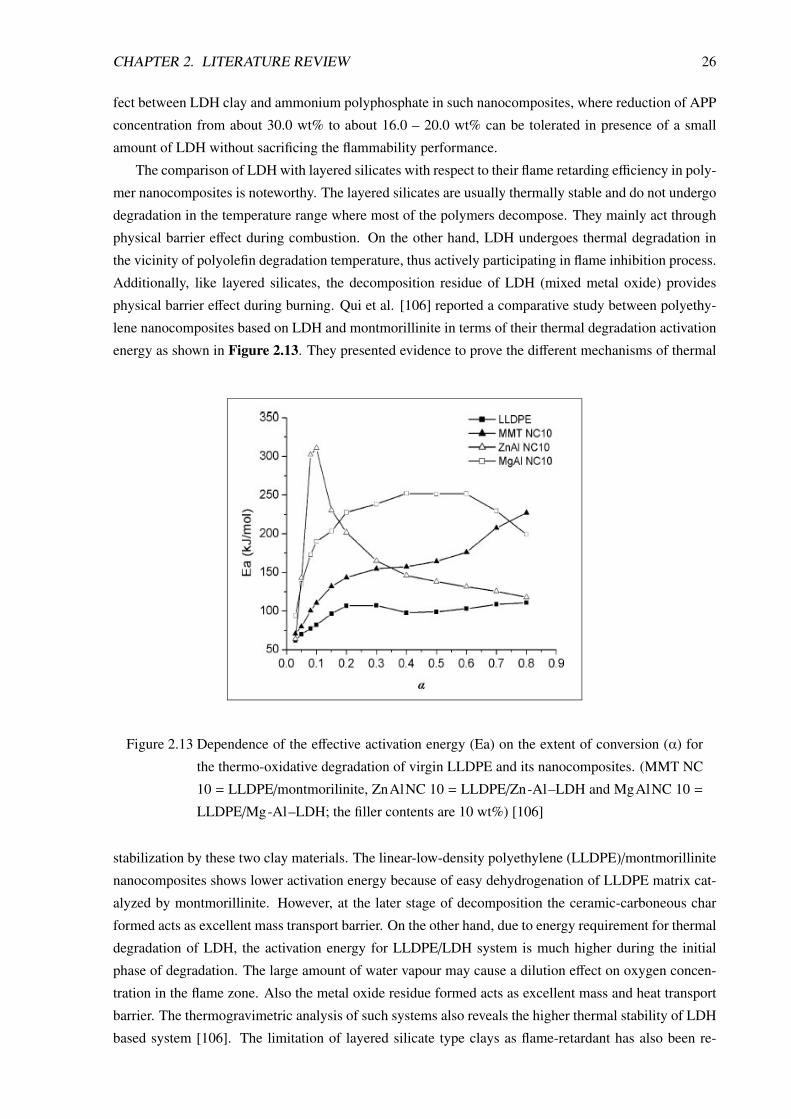
CHAPTER 2. LITERATURE REVIEW 26
fect between LDH clay and ammonium polyphosphate in such nanocomposites, where reduction of APP
concentration from about 30.0 wt% to about 16.0 – 20.0 wt% can be tolerated in presence of a small
amount of LDH without sacrificing the flammability performance.
The comparison of LDH with layered silicates with respect to their flame retarding efficiency in poly-
mer nanocomposites is noteworthy. The layered silicates are usually thermally stable and do not undergo
degradation in the temperature range where most of the polymers decompose. They mainly act through
physical barrier effect during combustion. On the other hand, LDH undergoes thermal degradation in
the vicinity of polyolefin degradation temperature, thus actively participating in flame inhibition process.
Additionally, like layered silicates, the decomposition residue of LDH (mixed metal oxide) provides
physical barrier effect during burning. Qui et al. [106] reported a comparative study between polyethy-
lene nanocomposites based on LDH and montmorillinite in terms of their thermal degradation activation
energy as shown in Figure 2.13. They presented evidence to prove the different mechanisms of thermal
Figure 2.13 Dependence of the effective activation energy (Ea) on the extent of conversion (α) for
the thermo-oxidative degradation of virgin LLDPE and its nanocomposites. (MMT NC
10 = LLDPE/montmorilinite, ZnAlNC 10 = LLDPE/Zn-Al–LDH and MgAlNC 10 =
LLDPE/Mg-Al–LDH; the filler contents are 10 wt%) [106]
stabilization by these two clay materials. The linear-low-density polyethylene (LLDPE)/montmorillinite
nanocomposites shows lower activation energy because of easy dehydrogenation of LLDPE matrix cat-
alyzed by montmorillinite. However, at the later stage of decomposition the ceramic-carboneous char
formed acts as excellent mass transport barrier. On the other hand, due to energy requirement for thermal
degradation of LDH, the activation energy for LLDPE/LDH system is much higher during the initial
phase of degradation. The large amount of water vapour may cause a dilution effect on oxygen concen-
tration in the flame zone. Also the metal oxide residue formed acts as excellent mass and heat transport
barrier. The thermogravimetric analysis of such systems also reveals the higher thermal stability of LDH
based system [106]. The limitation of layered silicate type clays as flame-retardant has also been re-

CHAPTER 2. LITERATURE REVIEW 27
ported others in literature [107]. As these clays remain inert during degradation of polymer, can not
reduce the total heat released during combustion process and hence cannot reduce the propensity to form
a long-duration flame. But, LDH because of its endothermic decomposition acts as heat sink, effectively
reducing the heat released during combustion of the nanocomposites.
The major drawback with metal hydroxide type conventional fillers (like Mg(OH)2 and aluminum
trihydroxide) is their high concentration (usually above 50 wt%) requirements to obtain satisfactory
flame-retardant effects. Although polar polymers, like polyesters, alkyd resins, etc can tolerate such high
concentration, non polar polymers, like polyolefins show deterioration of their mechanical properties
and processibility [108, 109]. The poor dispersion of these highly polar ioorganic materials within a
hydrophobic polymer matrix is often held responsible for the high concentration dosing to obtain satis-
factory flame retardancy. Several attempts, like surface treatment [110], use of compatibilizer [111–113],
etc are therefore made to improve the dispersibility of these fillers in non polar matrix. In spite of all
these attempts, the problem still persists and needs to be further addressed. Therefore, their exists a con-
stant urge to develop flame-retardants, which at low concentration can provide desired flame retardancy
and also will not affect the mechanical properties significantly, if not improved further. LDH can be an
interesting material to investigate and study in this regard, The layered structure and exchangeable inter-
layer species make them suitable precursor for preparation of polymer nanocomposites, where improved
dispersion can be achieved through intercalation and delamination. Again, having cationic hydroxide
layers with anionic interlayer ions, there exists several types of anionic surfactants,like carboxylate, sul-
fonate, phosphate, etc that can be used to modify unmodified LDH materials. The critical choice of clay
modifying surfactants may provide the added contribution to flame retardancy. For examples, surfactants
containing elements like, P, S, B, etc can act as radical scavengers during combustion process. Such ef-
fects have already been observed in case layered silicate based nanocomposites, where the clay materials
are intercalated with triphenylphosphate [114, 115].

C3
E: C C
3.1 Materials Description
3.1.1 Mg -Al–LDH
Preliminary investigations on the intercalation behavior of LDH with different anionic surfactants was
carried out using the synthesized Mg-Al–LDH. However, preparation of polymer based composites in
kilogram size batches needs a sizable amount of Mg-Al–LDH. Therefore, the commercially available
varieties of this LDH clay were also used, especially for carrying out compounding in twin-screw ex-
truder. The Mg:Alratio in the synthesized LDH is approximately 2:1 and hence a commercial grade of
Mg-Al–LDH with similar Mg:Alratio was selected. Both the Mg-Al–LDH samples were white pow-
ders with similar bulk density. The various characteristics of the industrial materials used are listed in
Table 3.1.
Table 3.1 Various technical details of the commercial Mg-Al–LDH used in the present study
Description Mg-Al–LDH
Trade name Dualmag HT Hycite 713
Producer Dulso a.s. Sudchemie AGSlovak Republic Germany
Chemical formula Mg1−xAlx(OH)2(CO3)x/2.mH2O
MgO /Al2O3 ratio 4.4 4.7
Loss on drying (%) 0.19 0.20
BET surface (N2) (m2/g) 9.2 9.0
pH (1g/50 ml EtOH /H2O) 8.5 9.2
Bulk density (g/l) 300 330
Heavy metals (ppm) < 0.1 < 10
Mg-Al–LDH was also used in combination with a conventional metal hydroxide type flame-retardant
magnesium hydroxide (MH) in the PE matrix. The product used was Magnifin–H5 supplied by Magne-
siumprodukte GmbH and Co KG - Qualitatswesen, Germany.
28

CHAPTER 3. EXPERIMENTAL: COMPOUNDING AND CHARACTERIZATION 29
3.1.2 Chemicals Used for LDH Synthesis
The various chemicals used for the synthesis of Mg-Al–LDH were synthetic grade and are described
below.
Magnesium Chloride (MgCl2) and Aluminum Chloride (AlCl3): Both were in hexahydrated form
with 98% purity and were purchased from Aldrich chemical company.
Urea: This is white solid and completely soluble in water at ambient condition. It was also purchased
from Aldrich chemical company and as 98% pure form.
3.1.3 Surfactants
Since the interlayer region of the Mg-Al–LDH clay accommodates anionic species, anionic surfactants
are most suitable to modify for its modification. Primarily, four different surfactants were used for the
modification of Mg-Al–LDH to study its intercalation behavior. The choice of surfactants was made
based on different anionic functional groups, solubility in aqueous medium and structure of the hydro-
carbon chain. The surfactants used are sodium dodecylbenzenesulfonate (SDBS), lauric acid, sodium
dodecylsulfate (SDS) and bis(2-ethylhexyl)hydrogen phosphate. All these surfactants were purchased
from Aldrich chemical company, Germany and used without further purification. The various properties
of these surfactants are given in Table 3.2.
Table 3.2 Various technical details of the surfactants used for the modification of Mg-Al–LDH
Materials Symbol for Purity Densityanionic form (%) (g/cc)
sodium dodecylsulfate DS 98.0 N/A
sodium dodecylbenzene DBS N/A N/Asulfonate
lauric acid laurate 99.5 0.883
bis(2-ethylhexyl) BEHP 97.0 1.06hydrogen phosphate
The anionic forms of these surfactants are the actual species that enter the interlayer region of the
LDH clay. Both SDS and SDBS are highly water soluble producing their anionic forms dodecylsulfate
(DS) and dodecylbenzenesulfonate (DBS) respectively in solution. The other two surfactants, namely
lauric acid and bis(2-ethylhexyl)hydrogen phosphate are sparingly soluble in water at room temperature.
Therefore, to obtain their water soluble forms and the corresponding anions, they were treated with
NaOHand NH4OHsolutions respectively. These aqueous solutions containing respective anions were
then used for LDH modification.
3.1.4 Polymers
The main polymer matrix used in the whole study is polyethylene (PE), which is a commercially avail-
able general purpose grade of low-density polyethylene LD263 from Exxonmobil chemical company.
It is a high molecular weight grade with a high value of polydispersity index. Typically, this type of
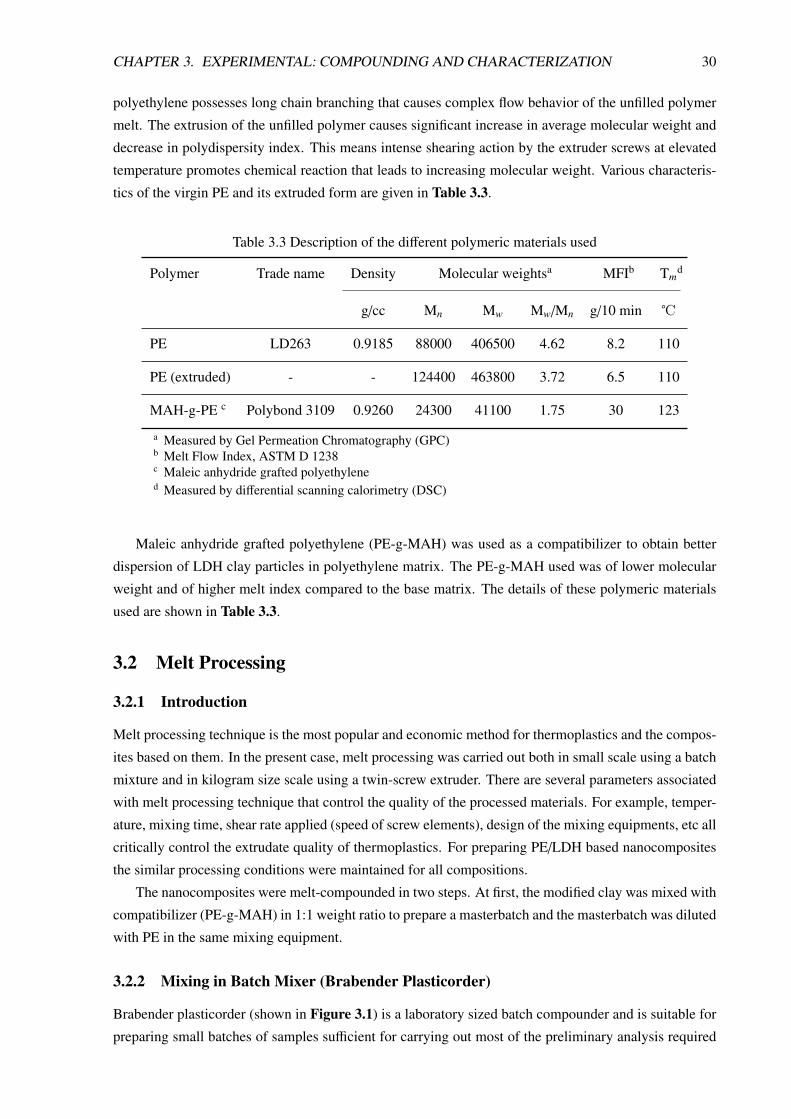
CHAPTER 3. EXPERIMENTAL: COMPOUNDING AND CHARACTERIZATION 30
polyethylene possesses long chain branching that causes complex flow behavior of the unfilled polymer
melt. The extrusion of the unfilled polymer causes significant increase in average molecular weight and
decrease in polydispersity index. This means intense shearing action by the extruder screws at elevated
temperature promotes chemical reaction that leads to increasing molecular weight. Various characteris-
tics of the virgin PE and its extruded form are given in Table 3.3.
Table 3.3 Description of the different polymeric materials used
Polymer Trade name Density Molecular weightsa MFIb Tmd
g/cc Mn Mw Mw/Mn g/10 min ℃
PE LD263 0.9185 88000 406500 4.62 8.2 110
PE (extruded) - - 124400 463800 3.72 6.5 110
MAH-g-PE c Polybond 3109 0.9260 24300 41100 1.75 30 123
a Measured by Gel Permeation Chromatography (GPC)b Melt Flow Index, ASTM D 1238c Maleic anhydride grafted polyethylened Measured by differential scanning calorimetry (DSC)
Maleic anhydride grafted polyethylene (PE-g-MAH) was used as a compatibilizer to obtain better
dispersion of LDH clay particles in polyethylene matrix. The PE-g-MAH used was of lower molecular
weight and of higher melt index compared to the base matrix. The details of these polymeric materials
used are shown in Table 3.3.
3.2 Melt Processing
3.2.1 Introduction
Melt processing technique is the most popular and economic method for thermoplastics and the compos-
ites based on them. In the present case, melt processing was carried out both in small scale using a batch
mixture and in kilogram size scale using a twin-screw extruder. There are several parameters associated
with melt processing technique that control the quality of the processed materials. For example, temper-
ature, mixing time, shear rate applied (speed of screw elements), design of the mixing equipments, etc all
critically control the extrudate quality of thermoplastics. For preparing PE/LDH based nanocomposites
the similar processing conditions were maintained for all compositions.
The nanocomposites were melt-compounded in two steps. At first, the modified clay was mixed with
compatibilizer (PE-g-MAH) in 1:1 weight ratio to prepare a masterbatch and the masterbatch was diluted
with PE in the same mixing equipment.
3.2.2 Mixing in Batch Mixer (Brabender Plasticorder)
Brabender plasticorder (shown in Figure 3.1) is a laboratory sized batch compounder and is suitable for
preparing small batches of samples sufficient for carrying out most of the preliminary analysis required

CHAPTER 3. EXPERIMENTAL: COMPOUNDING AND CHARACTERIZATION 31
for material characterization. The rotor used for compounding PE/LDH system was a sigma type. In the
first step, PE-g-MAH was melted in the mixing chamber. When nearly constant torque was achieved, a
desired amount of modified Mg-Al–LDH was fed into the mixing chamber and compounded for further
6 minutes. The masterbatch thus obtained was then granulated, premixed with desired amount of PE and
again compounded in the mixing chamber for another 6 minutes to prepare the final compositions. The
temperature and the rotor speed applied during both the steps were 200 ℃ and 100 rpm respectively.
Figure 3.1 Brabender plasticorder: (left) the mixing chamber and (right) sigma type screw used for
melt-compounding
3.2.3 Mixing in Extruder
Large batch (up to few kg) of the compounds was prepared in a tightly intermeshing, corotating twin-
screw extruder (Leistritz Micro 27) having screw diameter of 27 mm and L/D ratio equal to 36. In the
first step, modified Mg-Al–LDH and PE-g-MAH were mixed in the extruder in 1:1 weight ratio. The
extruded masterbatch strands were water cooled as they emerged from the extruder die and were then
granulated. The masterbatch granules were dried at 60 ℃ for about two hours. In the second step, the
dried masterbatch granules and desired amount of PE were premixed and compounded in the extruder.
All the ingredients were dried in vacuum at 80 ℃ for 2h prior to extrusion. The processing conditions
used for both these steps are
• 160 – 210 ℃ temperature profile from the feed to the die section of the extruder barrel
• 200 rpm screw speed
• 6 kg/h feed rate
• vacuum outlet in the mixing section of the extruder barrel to take out any volatiles formed during
the compounding process
The final composites as extruded was water cooled, granulated and dried at 60 ℃ for two hours.
The concentrations in the final composites were determined based on the metal hydroxide content
of the modified clay. It has been estimated that the SDBS modified Mg-Al–LDH contains about 46.0
wt% metal hydroxide (see Appendix A). The LDH content of the nanocomposite compositions has been

CHAPTER 3. EXPERIMENTAL: COMPOUNDING AND CHARACTERIZATION 32
interpreted in terms of its metal hydroxide content and the sum of the amounts of PE matrix and PE-g-
MAH has been taken as the total polymer content of the system. The sample designation and also the
actual amount of metal hydroxide content in each samples are described in Table 3.4. The amount of
metal hydroxide per 100 gm of metal hydroxide plus polymer content (without considering the organic
content of the filler) has also been shown. It is obvious that due to high molecular weight of the organic
surfactant SDBS, the modified LDH content large proportion of organic species.
Table 3.4 Designation of PE/LDH nanocomposite composition and the actualmetal hydroxide content in each composition
Nanocomposite Metal hydroxide content per Metal hydroxide content perComposition 100 g polymer+ metal hydroxide 100 g batch
g g
PE-LDH1 2.5 2.43
PE-LDH2 5.0 4.72
PE-LDH3 7.5 6.89
PE-LDH4 10.0 8.95
PE-LDH5 15.0 12.75
PE-LDH6 20.0 16.20
3.3 Characterizations
3.3.1 X-ray Diffraction Analysis
X-ray diffraction analysis (XRD) using wide angle x-ray scattering (WAXS) over 2θ = 1.8 to 40°, in
steps of 0.1 or 0.02°was carried out using 4-circle wide-angle diffractometer P4 (Bruker-AXS, Karlsruhe,
Germany, formerly Siemens AG) with Cu-Kα radiation (λ = 0.154 nm, monochromatization by primary
graphite crystal) generated at 30 mA and 40 kV. The primary pin hole diameter was set 0.5 mm (detector
distance 12 cm) and measuring time was kept 600 s. The calculation of the interlayer distance (d) was
carried out from the measured value of diffraction angle 2θ using brag equation given by
2dsinθ = nλ (3.1)
where, λ represents the wave length of the incident X-ray beam and n is a positive integer. XRD spectra
were interpreted with respect to the position of the first order basal reflection < 003 >, which depends on
the distance between two adjacent metal hydroxide sheets in the LDH crystal lattice (i.e. d). The higher
order reflections of the same < hkl > series (i.e. < 006 >, < 009 > and so on) were also reported as they
indicate the presence of repeating crystal planes and symmetry in a specific crystallographic direction.

CHAPTER 3. EXPERIMENTAL: COMPOUNDING AND CHARACTERIZATION 33
3.3.2 FTIR Analysis
Fourier transform infrared (FTIR) spectra for unmodified LDH, its calcined and organically modified
forms were recorded over the wave number range 400 – 4000 cm−1 using Equinox 55 FTIR spectrometer.
The powdered samples were mixed with KBR in a 1:200 ratio of their weight and pressed in the form of
pellets for measurement. For measuring FTIR of the polymeric composites thin films of thickness in the
range 100 – 250 µm were compression molded at about 150 ℃.
3.3.3 Morphological Analysis by Electron Microscopy
To observe the particle morphology of unmodified LDH and its surfactant modified forms scanning
electron microscopy (SEM) was used (model: LEO 435 VP, Carl Zeiss SMT). The powder samples were
first gold coated using a sputter coater. At first, the powder sample was sprinkled over a sticky surface
made by adhering conductive carbon cement on a SEM sample holder; then loose powers were removed
by shaking the sample holder and finally the adhered particles were gold coated. SEM was also used to
investigate the surface morphology of the fractured surface of the nanocomposites. To observe the state
of dispersion of the LDH particles in the polyethylene matrix, transmission electron microscope (TEM,
model: Zeiss EM 912) was used at different magnification. TEM was carried out at room temperature
with an acceleration voltage of 120keV and bright field illumination. The ultra thin sections of samples
were prepared by ultramicrotomy at -130 ℃ using Reichert Ultracut S (Leica, Austria). The thickness of
the section cut was in the range 100 to 130 nm.
3.3.4 Thermal Analysis
The thermal analysis were carried out by thermogravimetric analyser (TGA 6 from Perkin Elmer) using
a heating rate of 10 K/min. Both air and nitrogen atmospheres were used for the thermal degradation
study. TGA analysis of LDH clay and the composites provides useful information regarding the thermal
stability and thermal decomposition temperature of the materials. The residue left after heating beyond
700℃ in the TGA chamber is considered to be the char yield of the combustion process for the respective
material.
3.3.5 Rheological Analysis
The rheological measurements were carried out by an ARES rheometer (Rheometrics Scientific, USA)
with torque transducers having a torque range from 0.02 g.cm to 2000 g.cm. During each experiment, the
temperature maintained at the desired value by constant heating of the sample under nitrogen atmosphere.
The various rheological measurements that were carried out using different strain input program are
described below.
3.3.5.1 Dynamic Oscillatory Shear Experiment
Linear viscoelastic properties of the composites were studied under dynamic oscillatory shearing using
parallel plates geometry (diameter 25 mm) and sample thickness of 2 mm. During each measurement
the samples were subjected to an input strain function given by equation 3.2.
CHAPTER 3. EXPERIMENTAL: COMPOUNDING AND CHARACTERIZATION 34
γ(t) = γ0sin(ωt) (3.2)
The strain amplitude, γ0 was maintained below 5% to ensure the linear viscoelastic regime of mea-
surement for all the samples. The frequency-temperature sweep was carried out within the frequency (ω)
range 0.056 rad/s to 100 rad/s and the temperature range 160 – 240 ℃. The resulting time dependent
stress response by the sample is given by
σ(t) = γ0[G′sin(ωt) +G′′cos(ωt)] (3.3)
where, σ(t) is the shear stress, G′ is the storage or elastic modulus and G′′ is the loss or viscous modulus.
The response of the sample melt under dynamic oscillatory shear was also interpreted in terms of other
parameters, like complex viscosity |η∗| and tanδ, where δ is phase angle (phase shift between stress and
strain vector). The definition of these two parameters are given by the following equations.
tanδ =G′′
G′(3.4)
|η∗| =
√[G′′
ω
]2+
[G′
ω
]2(3.5)
3.3.5.2 Step Strain Experiment
The stress relaxation behavior of the polymeric melts was investigated by subjecting the melts to a step
strain experiments. The samples were melted at 240 ℃ within the parallel plates and were allowed to
attain equilibrium state under quiescent condition. Then a sudden strain of magnitude γ was applied.
The strain was maintained at that value and the decay of modulus, called stress relaxation modulus G(t),
was then monitored with time. G(t) is defined as
G(t) =τ(t)γ
(3.6)
where, τ(t) represent the time dependent stress.
3.3.5.3 Non-linear Shearing or Flow Reversal Experiment
To carry out the non-linear shear experiments, polymer melts were subjected to a steady shearing step
(called preshearing step) at a constant shear rate till the apparent steady state is reached. The shearing
was then stopped for an interval of specified duration (called rest period) and finally subjected to a second
steady shearing step (called flow reversal step) at the same shear rate like the preshearing step, but in the
opposite direction. This protocol of non-linear shearing was repeated with increasing rest period for each
composition with the fresh sample each time. The shear cycle is schematically represented in Figure 3.2.
Results obtained in the preshearing cycle are then discarded due to their non-reproducibility, while the
data measured in the flow reversal step are used to study the influence of shear rate and the rest period
on the state of the filler structure.
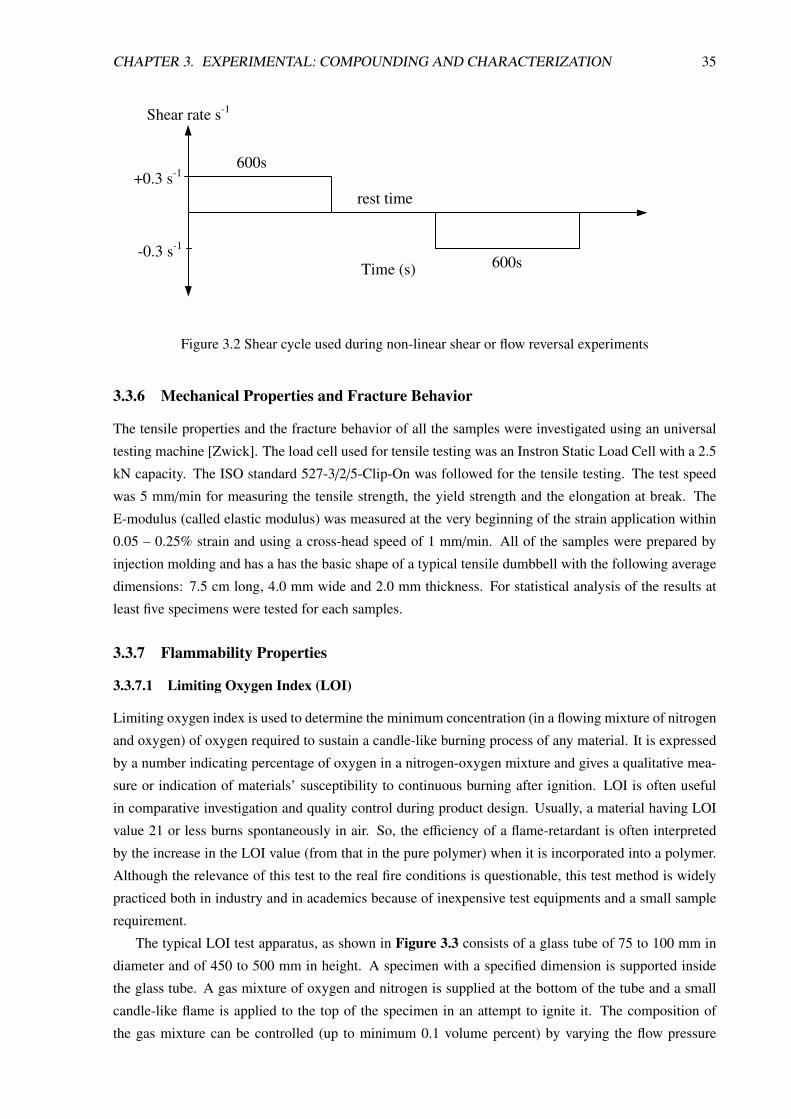
CHAPTER 3. EXPERIMENTAL: COMPOUNDING AND CHARACTERIZATION 35
+0.3 s-1
-0.3 s-1
Shear rate s-1
Time (s)
rest time
600s
600s
Figure 3.2 Shear cycle used during non-linear shear or flow reversal experiments
3.3.6 Mechanical Properties and Fracture Behavior
The tensile properties and the fracture behavior of all the samples were investigated using an universal
testing machine [Zwick]. The load cell used for tensile testing was an Instron Static Load Cell with a 2.5
kN capacity. The ISO standard 527-3/2/5-Clip-On was followed for the tensile testing. The test speed
was 5 mm/min for measuring the tensile strength, the yield strength and the elongation at break. The
E-modulus (called elastic modulus) was measured at the very beginning of the strain application within
0.05 – 0.25% strain and using a cross-head speed of 1 mm/min. All of the samples were prepared by
injection molding and has a has the basic shape of a typical tensile dumbbell with the following average
dimensions: 7.5 cm long, 4.0 mm wide and 2.0 mm thickness. For statistical analysis of the results at
least five specimens were tested for each samples.
3.3.7 Flammability Properties
3.3.7.1 Limiting Oxygen Index (LOI)
Limiting oxygen index is used to determine the minimum concentration (in a flowing mixture of nitrogen
and oxygen) of oxygen required to sustain a candle-like burning process of any material. It is expressed
by a number indicating percentage of oxygen in a nitrogen-oxygen mixture and gives a qualitative mea-
sure or indication of materials’ susceptibility to continuous burning after ignition. LOI is often useful
in comparative investigation and quality control during product design. Usually, a material having LOI
value 21 or less burns spontaneously in air. So, the efficiency of a flame-retardant is often interpreted
by the increase in the LOI value (from that in the pure polymer) when it is incorporated into a polymer.
Although the relevance of this test to the real fire conditions is questionable, this test method is widely
practiced both in industry and in academics because of inexpensive test equipments and a small sample
requirement.
The typical LOI test apparatus, as shown in Figure 3.3 consists of a glass tube of 75 to 100 mm in
diameter and of 450 to 500 mm in height. A specimen with a specified dimension is supported inside
the glass tube. A gas mixture of oxygen and nitrogen is supplied at the bottom of the tube and a small
candle-like flame is applied to the top of the specimen in an attempt to ignite it. The composition of
the gas mixture can be controlled (up to minimum 0.1 volume percent) by varying the flow pressure

CHAPTER 3. EXPERIMENTAL: COMPOUNDING AND CHARACTERIZATION 36
of the oxygen and nitrogen stream. The LOI values of the LDH based composites were measured by
a LOI tester from Raczek Analysentechnik GmbH Scientific Instruments using injection molded strips
(125 x 6.5 x 3.2 mm) according to ASTM 2863.
Sample
Figure 3.3 A typical LOI measuring instrument
3.3.7.2 Cone Calorimeter Test
The cone calorimeter test is an advanced and widely used test method for assessing flammability of
polymeric materials. The method followed is described in international standard ISO 5660. The test
specimen used according to this standard has a surface area of 100 ∗ 100 mm2 and thickness below 50
mm. The test specimen with dimension of 100 x 100 x 4 mm were used in the present work and were
prepared by injection molding. During the actual test, an external heat flux of 30 kW/m2 was applied.
All the samples were preconditioned for 24 h at 23 C and 50% relative humidity.
The test apparatus basically consists of a radiant heat source in the shape of a truncated cone, a load
cell and a gas collection system as shown in Figure 3.4. After the sample is mounted on sample holder,
it is exposed to a heat flux (chosen in the range 0 – 100 kW/m2, but typically within the range 25 – 75
kW/m2). The test specimen is placed horizontally on the sample mount using an aluminum pan, which
just cover the volume of the sample with top surface exposed (the aluminum pan prevents the spilling
of the melt when the sample burns). With this set up, it was not possible to analysis the unfilled PE as
the melt overflew the aluminum pan). An electric spark is then used to ignite the volatile gases liberated
from the heated sample. The gases and smokes liberated during burning are collected in an exhaust pipe,
where at the same time consumption of oxygen, temperature and opacity of the smoke are determined
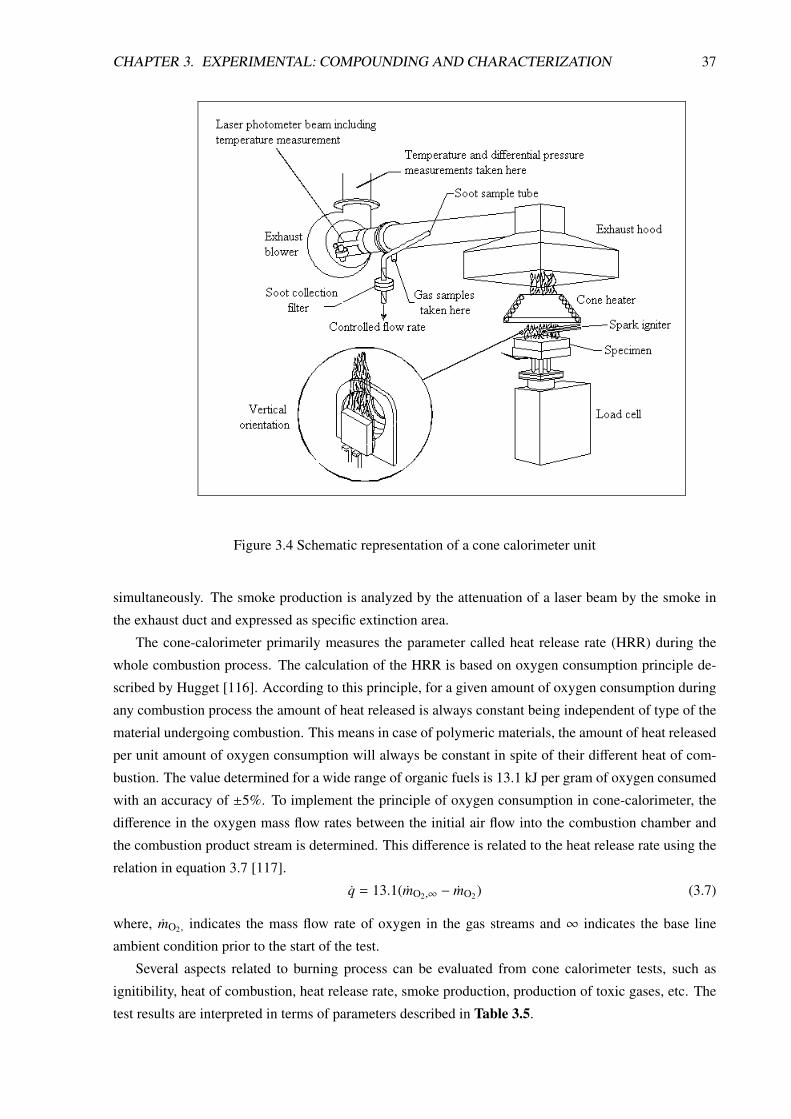
CHAPTER 3. EXPERIMENTAL: COMPOUNDING AND CHARACTERIZATION 37
Figure 3.4 Schematic representation of a cone calorimeter unit
simultaneously. The smoke production is analyzed by the attenuation of a laser beam by the smoke in
the exhaust duct and expressed as specific extinction area.
The cone-calorimeter primarily measures the parameter called heat release rate (HRR) during the
whole combustion process. The calculation of the HRR is based on oxygen consumption principle de-
scribed by Hugget [116]. According to this principle, for a given amount of oxygen consumption during
any combustion process the amount of heat released is always constant being independent of type of the
material undergoing combustion. This means in case of polymeric materials, the amount of heat released
per unit amount of oxygen consumption will always be constant in spite of their different heat of com-
bustion. The value determined for a wide range of organic fuels is 13.1 kJ per gram of oxygen consumed
with an accuracy of ±5%. To implement the principle of oxygen consumption in cone-calorimeter, the
difference in the oxygen mass flow rates between the initial air flow into the combustion chamber and
the combustion product stream is determined. This difference is related to the heat release rate using the
relation in equation 3.7 [117].
q = 13.1(mO2,∞ − mO2) (3.7)
where, mO2, indicates the mass flow rate of oxygen in the gas streams and ∞ indicates the base line
ambient condition prior to the start of the test.
Several aspects related to burning process can be evaluated from cone calorimeter tests, such as
ignitibility, heat of combustion, heat release rate, smoke production, production of toxic gases, etc. The
test results are interpreted in terms of parameters described in Table 3.5.

CHAPTER 3. EXPERIMENTAL: COMPOUNDING AND CHARACTERIZATION 38
Table 3.5 Different parameters measured during cone calorimeter tests
Parameter Symbol Unit Description
Time of ignition tig s Time required for igniting is triggered bythe electric spark
Total heat release THR MJ/m2 The cumulative heat release during thewhole combustion process (area under theheal release curve)
Heat release rate HRR kW/m2 The instantaneous heat released duringcombustion process
Peak heat release rate PHRR kW/m2 Maximum in the heat release curve
Heat of combustion Hc MJ/kg Ratio between heat release and mass loss
Specific extinction area SEA m2/kg A measure of smoke released measuredfrom smoke obstruction data
Production of CO CO6min kg/kg Production of carbon monoxide during first6 minutes of combustion
Mass loss rate MLR g/s Instantaneous mass loss during combustion
3.3.7.3 UL–94 testing
UL–94 test is widely practiced for determining relative flammability and dripping behavior during burn-
ing process. This test rating is important for plastics applications in electrical and electronic equipments.
This method serves the preliminary indication of the acceptability of plastic materials with respect to
flammability for a particular application. There are three types of UL–94 testing methods practiced, such
as UL–94 V, UL–94 HB and UL–94 5V. In this study, only the first two methods have been used to
Table 3.6 UL-94 vertical and horizontal test criteria
Criteria V–2 V–1 V–0 HB
Number of ignition time 2 2 2 1
Maximum flaming time per specimen perflame application, sec
30 30 10 -
Maximum total flaming time, 5 specimens,2 ignitions, sec
250 250 50 -
Specimen drips, ignites cotton Yes No No -
Maximum afterglow time, per specimen,sec
60 60 30 -
Burn to the holding clamp No No No -
Maximum burning rate for specimens 3.0mm to 13.0 mm, mm/min
- - - 40
Maximum burning rate for specimen lessthan 3.0 mm, mm/min
- - - 75

CHAPTER 3. EXPERIMENTAL: COMPOUNDING AND CHARACTERIZATION 39
Figure 3.5 Schematic representation of a UL–94 VB (top) and UL–94 HB (bottom) test methods
characterize LDH based composites. Various kind of UL–94 V and UL–94 HB ratings are discussed in
Table 3.6 and the test procedures are schematically shown in Figure 3.5. The samples size used in both
cases are similar and have dimension of 130 x 12.5 − 13.0 x 4 mm. In case of UL–94 V test, the sample
is clamped vertically with the bottom end exposed to the flame for two times each with 10 s duration.
The UL–94 rating or no rating is then determined observing the burning time and burning behavior after
each of the two flame exposures. In case of UL–94 HB test, the sample is clamped horizontally on the
sample holder at one end and subjected to flame for 30 s at the other end. The rating is determined by
observing the speed of flame propagation (how fast the sample burns) between two specified marks on
the samples. For each composition, total five samples were tested and the average was calculated. All
the samples were preconditioned for 72 h at at 23 C and 60% relative humidity.
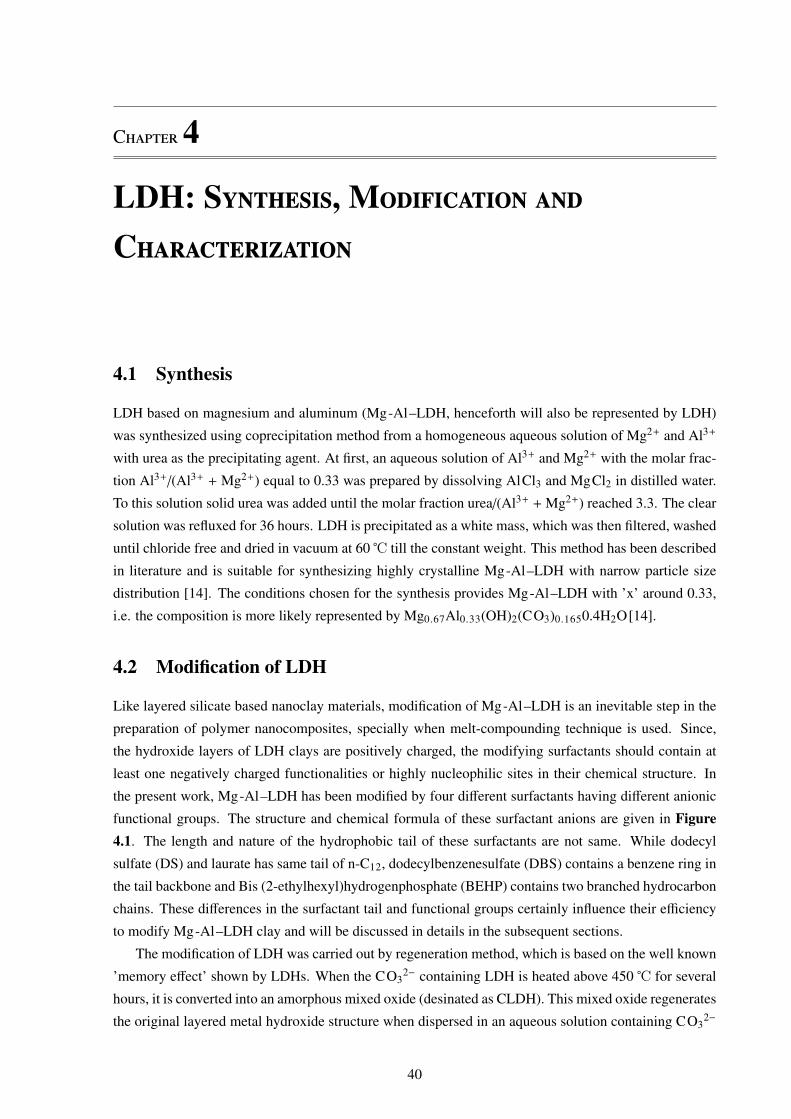
C4
LDH: S, M C
4.1 Synthesis
LDH based on magnesium and aluminum (Mg-Al–LDH, henceforth will also be represented by LDH)
was synthesized using coprecipitation method from a homogeneous aqueous solution of Mg2+ and Al3+
with urea as the precipitating agent. At first, an aqueous solution of Al3+ and Mg2+ with the molar frac-
tion Al3+/(Al3+ + Mg2+) equal to 0.33 was prepared by dissolving AlCl3 and MgCl2 in distilled water.
To this solution solid urea was added until the molar fraction urea/(Al3+ +Mg2+) reached 3.3. The clear
solution was refluxed for 36 hours. LDH is precipitated as a white mass, which was then filtered, washed
until chloride free and dried in vacuum at 60 ℃ till the constant weight. This method has been described
in literature and is suitable for synthesizing highly crystalline Mg-Al–LDH with narrow particle size
distribution [14]. The conditions chosen for the synthesis provides Mg-Al–LDH with ’x’ around 0.33,
i.e. the composition is more likely represented by Mg0.67Al0.33(OH)2(CO3)0.1650.4H2O[14].
4.2 Modification of LDH
Like layered silicate based nanoclay materials, modification of Mg-Al–LDH is an inevitable step in the
preparation of polymer nanocomposites, specially when melt-compounding technique is used. Since,
the hydroxide layers of LDH clays are positively charged, the modifying surfactants should contain at
least one negatively charged functionalities or highly nucleophilic sites in their chemical structure. In
the present work, Mg-Al–LDH has been modified by four different surfactants having different anionic
functional groups. The structure and chemical formula of these surfactant anions are given in Figure4.1. The length and nature of the hydrophobic tail of these surfactants are not same. While dodecyl
sulfate (DS) and laurate has same tail of n-C12, dodecylbenzenesulfate (DBS) contains a benzene ring in
the tail backbone and Bis (2-ethylhexyl)hydrogenphosphate (BEHP) contains two branched hydrocarbon
chains. These differences in the surfactant tail and functional groups certainly influence their efficiency
to modify Mg-Al–LDH clay and will be discussed in details in the subsequent sections.
The modification of LDH was carried out by regeneration method, which is based on the well known
’memory effect’ shown by LDHs. When the CO32− containing LDH is heated above 450 ℃ for several
hours, it is converted into an amorphous mixed oxide (desinated as CLDH). This mixed oxide regenerates
the original layered metal hydroxide structure when dispersed in an aqueous solution containing CO32−
40
CHAPTER 4. LDH: SYNTHESIS, MODIFICATION AND CHARACTERIZATION 41
and stirred for sufficient time. If an anion other than CO32− remains in the solution, the regeneration leads
to intercalation of that anion in the LDH structure. The same principle was used for the modification of
LDH with organic surfactants. The mixed oxide is dispersed in an aqueous solution of the desired
surfactant and stirred for about 24 h at ambient temperature. The concentration of the surfactant solution
was maintained around 0.1 – 0.2 M and CLDH was added to a specified volume of this surfactant solution
in such an amount that there is enough surfactant anion available for 100% substitution of the interlayer
carbonate anion after regeneration. The modified solid was then separated by repeated washing and
centrifugation and dried at 60 ℃ the till constant weight. To check the ’memory effect’ of the LDH clay,
CLDH was also dispersed in an aqueous solution of Na2CO3 and treated similarly as before. The so
called regenerated solid was called LDHR.
SO4-
Dodecylsulfate (DS)
SO3-
Dodecylbenzenesulfonate (DBS)
CO2-
Laurate
P
O-
O O
O
Bis (2-ethylhexyl) hydrogenphosphate (BEHP)
Figure 4.1 Different surfactants used for intercalation within the LDH gallery
4.3 Characterization of LDH Materials
4.3.1 Characterization of the Unmodified Clays
The XRD patterns of the synthesized and unmodified Mg-Al–LDH, its calcined form (CLDH) and the
regenerated form (LDHR) are shown in Figure 4.2. The first three reflections assigned belong to the
common < hkl > series i.e. < 00l > and resemble those reported in literature for synthetic Mg-Al–LDH
[14] and hydrotalcite minerals [5]. The basal reflection < 003 > has the value of 2θ about 11.8°. This
corresponds to a basal spacing or interlayer distance of about 0.76 nm, which is equal to the sum of the
thickness of interlayer region and one metal hydroxide layer. These characteristic reflections of Mg-
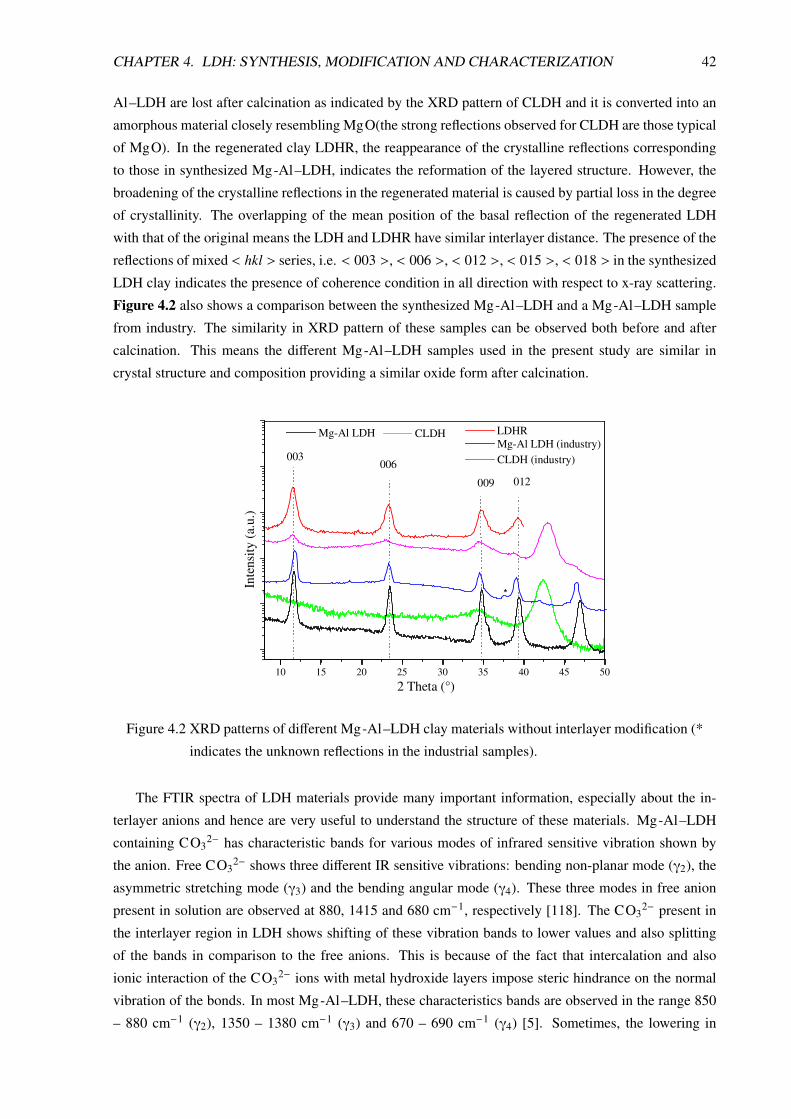
CHAPTER 4. LDH: SYNTHESIS, MODIFICATION AND CHARACTERIZATION 42
Al–LDH are lost after calcination as indicated by the XRD pattern of CLDH and it is converted into an
amorphous material closely resembling MgO(the strong reflections observed for CLDH are those typical
of MgO). In the regenerated clay LDHR, the reappearance of the crystalline reflections corresponding
to those in synthesized Mg-Al–LDH, indicates the reformation of the layered structure. However, the
broadening of the crystalline reflections in the regenerated material is caused by partial loss in the degree
of crystallinity. The overlapping of the mean position of the basal reflection of the regenerated LDH
with that of the original means the LDH and LDHR have similar interlayer distance. The presence of the
reflections of mixed < hkl > series, i.e. < 003 >, < 006 >, < 012 >, < 015 >, < 018 > in the synthesized
LDH clay indicates the presence of coherence condition in all direction with respect to x-ray scattering.
Figure 4.2 also shows a comparison between the synthesized Mg-Al–LDH and a Mg-Al–LDH sample
from industry. The similarity in XRD pattern of these samples can be observed both before and after
calcination. This means the different Mg-Al–LDH samples used in the present study are similar in
crystal structure and composition providing a similar oxide form after calcination.
10 15 20 25 30 35 40 45 50
CLDH (industry)
CLDH
*
Inte
nsi
ty (
a.u.)
2 Theta (°)
Mg-Al LDH
012009
006003
LDHR
Mg-Al LDH (industry)
Figure 4.2 XRD patterns of different Mg-Al–LDH clay materials without interlayer modification (*
indicates the unknown reflections in the industrial samples).
The FTIR spectra of LDH materials provide many important information, especially about the in-
terlayer anions and hence are very useful to understand the structure of these materials. Mg-Al–LDH
containing CO32− has characteristic bands for various modes of infrared sensitive vibration shown by
the anion. Free CO32− shows three different IR sensitive vibrations: bending non-planar mode (γ2), the
asymmetric stretching mode (γ3) and the bending angular mode (γ4). These three modes in free anion
present in solution are observed at 880, 1415 and 680 cm−1, respectively [118]. The CO32− present in
the interlayer region in LDH shows shifting of these vibration bands to lower values and also splitting
of the bands in comparison to the free anions. This is because of the fact that intercalation and also
ionic interaction of the CO32− ions with metal hydroxide layers impose steric hindrance on the normal
vibration of the bonds. In most Mg-Al–LDH, these characteristics bands are observed in the range 850
– 880 cm−1 (γ2), 1350 – 1380 cm−1 (γ3) and 670 – 690 cm−1 (γ4) [5]. Sometimes, the lowering in

CHAPTER 4. LDH: SYNTHESIS, MODIFICATION AND CHARACTERIZATION 43
4000 3500 3000 2500 2000 1500 1000 500
0.0
0.5
1.0
1.5
2.0
2.5
3.0
Inte
nsi
ty (
a.u)
Wave Number (cm-1)
Mg-Al LDH
Mg-Al LDH (industry)
CDH
LDHR
H2O---CO
3
2- interaction
Inter layer
H2O
1357 cm-1
γ3
870 cm-1
γ2
685 cm-1
γ4
Figure 4.3 Comparison of the FTIR spectra of synthesized Mg-Al–LDH, CLDH, LDHR and an in-
dustrial Mg-Al–LDH showing the recovery of original structure LDH after regeneration
process.
symmetry of the interlayer CO32− causes degeneration or splitting of the γ3 band into a doublet band
[119, 120]. This lowering of symmetry, additionally, can activate γ1 vibration mode around 1050 cm−1
and the absence of this vibration can be taken as an indication of retaining full symmetry by the CO32−
anions in the interlayer region [121]. Both the synthesized and industrial LDH samples show a sharp
band at 1357 cm−1 corresponding to γ3 vibration appears without any distinct shoulder or degeneration
indicating the absence of splitting of the γ3 band (Figure 4.3). Besides, no band or shoulder around 1050
cm−1 means highly symmetric nature of the interlayer CO32− ions. The γ3 band is the most sensitive
CO32− band and from its position depends on the MII /MIII ratio i.e. the value of x in the LDH chemical
formula. The lowering of this ratio (increasing the value of x) means higher is the electrostatic attraction
(through hydrogen bonding) on the interlayer anions by the metal hydroxide sheets. As a result, with
decreasing MII /MIII ratio, position of the γ3 band shifts to lower value of wave number indicating higher
energy required for desired vibration. For MII /MIII ratio equal to 3/1 and 2/1 the positions of γ3 band is
observed at about 1370 cm−1 and 1355 cm−1 respectively [121]. The synthesized LDH shows a strong γ3
band around 1357 cm−1 indicating the Mg2+/Al3+ ratio is close to 2/1 i.e. x is close to 0.33. The bands
corresponding to other two modes of vibration are also visible in Figure 4.3, such as a sharp band around
685 cm−1 indicates γ4 mode and a small shoulder around 870 cm−1 for γ2 mode. The broad band in the
range 3200 – 3700 cm−1 originates from the O–Hstretching of the metal hydroxide layer and interlayer
water molecules. A shoulder present around 3000 – 3100 cm−1 is caused by the interaction between the
CO32− and H2Opresent in the interlayer region, which involves mostly hydrogen bonding [5, 122]. The
bending vibration of the interlayer H2Ois also reflected in the broad bands around 1600 cm−1. The bands
characteristic of the metal-oxygen bond stretching appear below 700 cm−1. The sharp bands around 780,
554 and 430 – 450 cm−1 originate from various lattice vibration associated with metal hydroxide sheet.
A comparison with the commercial LDH sample used for the nanocomposite preparation is also shown
in Figure 4.3. This sample has known Mg2+/Al3+ ratio of about 2.3 (that means x is equal to 0.30) in its

CHAPTER 4. LDH: SYNTHESIS, MODIFICATION AND CHARACTERIZATION 44
composition (Table 3.1). The FTIR spectra of this material exactly overlap that of the synthesized LDH
showing close similarity in their chemical composition.
The close similarity between the FTIR spectra of the regenerated LDH with the original LDH in
Figure 4.3 confirms the recovery of chemical structure of the LDH during the regeneration process.
However, the FTIR spectra for calcined LDH indicates, though in much reduced intensity, the presence of
all three modes of vibration of the carbonate ion and also a O–Hstretching band. This means calcination
at 450 ℃ though destroys the crystal structure of LDH (as confirmed from the XRD pattern in Figure4.2), there still exist some carbonate ions and water molecules in the material. This may arise either
due to adsorption of carbon dioxide and water vapor at the surface of highly porous CLDH or due to
incomplete degradation of LDH at 450 ℃.
4.3.2 Characterization of the Modified Clays
4.3.2.1 XRD Analysis
The XRD patterns of the surfactant modified LDH is shown in Figure 4.4. As expected, the position of
the first order basal reflection < 003 > in all modified samples is shifted to a higher d-value indicating
an expansion in the interlayer distance. Although none of the modified samples show distinct reflection
at d = 0.76 nm, their exists a weak and broad reflection in the close vicinity, which may be either due
to the presence of small fraction of the unmodified LDH or due to a higher order reflection in < 00l >
series in the modified samples. However, the first option seems most probable as the XRD pattern of all
the modified sample show reflections corresponding to single < 00l > series and no mixed < hkl > as
compared to the unmodified LDH. The absence of reflection corresponding to mixed < hkl > series also
indicates a loss of crystallinity of LDH after organic modification. This may be due to presence of only
small crystallites and/or the loss of coherent conditions for all other directions (i.e. no repeat units) in
the sense of scattering.
0.5 1.0 1.5 2.0 2.5 3.0 3.5 4.0
Inte
nsi
ty (
a.u.)
d (nm)
A - LDHC
B
A
B - LDH-DS
C - LDH-DBS
E
D
D - LDH-laurate
006 003
E - LDH-BEHP
Figure 4.4 XRD patterns of modified LDH obtained using regeneration methods in presence of var-
ious surfactants.
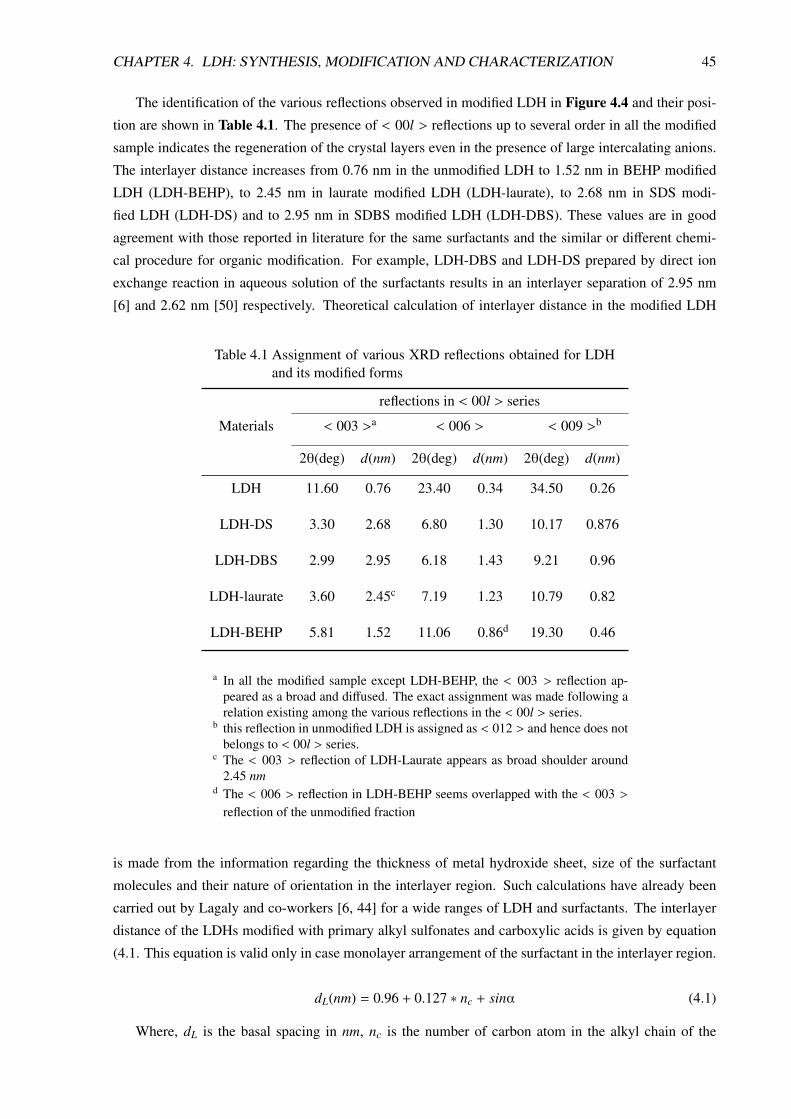
CHAPTER 4. LDH: SYNTHESIS, MODIFICATION AND CHARACTERIZATION 45
The identification of the various reflections observed in modified LDH in Figure 4.4 and their posi-
tion are shown in Table 4.1. The presence of < 00l > reflections up to several order in all the modified
sample indicates the regeneration of the crystal layers even in the presence of large intercalating anions.
The interlayer distance increases from 0.76 nm in the unmodified LDH to 1.52 nm in BEHP modified
LDH (LDH-BEHP), to 2.45 nm in laurate modified LDH (LDH-laurate), to 2.68 nm in SDS modi-
fied LDH (LDH-DS) and to 2.95 nm in SDBS modified LDH (LDH-DBS). These values are in good
agreement with those reported in literature for the same surfactants and the similar or different chemi-
cal procedure for organic modification. For example, LDH-DBS and LDH-DS prepared by direct ion
exchange reaction in aqueous solution of the surfactants results in an interlayer separation of 2.95 nm
[6] and 2.62 nm [50] respectively. Theoretical calculation of interlayer distance in the modified LDH
Table 4.1 Assignment of various XRD reflections obtained for LDHand its modified forms
reflections in < 00l > series
Materials < 003 >a < 006 > < 009 >b
2θ(deg) d(nm) 2θ(deg) d(nm) 2θ(deg) d(nm)
LDH 11.60 0.76 23.40 0.34 34.50 0.26
LDH-DS 3.30 2.68 6.80 1.30 10.17 0.876
LDH-DBS 2.99 2.95 6.18 1.43 9.21 0.96
LDH-laurate 3.60 2.45c 7.19 1.23 10.79 0.82
LDH-BEHP 5.81 1.52 11.06 0.86d 19.30 0.46
a In all the modified sample except LDH-BEHP, the < 003 > reflection ap-peared as a broad and diffused. The exact assignment was made following arelation existing among the various reflections in the < 00l > series.
b this reflection in unmodified LDH is assigned as < 012 > and hence does notbelongs to < 00l > series.
c The < 003 > reflection of LDH-Laurate appears as broad shoulder around2.45 nm
d The < 006 > reflection in LDH-BEHP seems overlapped with the < 003 >reflection of the unmodified fraction
is made from the information regarding the thickness of metal hydroxide sheet, size of the surfactant
molecules and their nature of orientation in the interlayer region. Such calculations have already been
carried out by Lagaly and co-workers [6, 44] for a wide ranges of LDH and surfactants. The interlayer
distance of the LDHs modified with primary alkyl sulfonates and carboxylic acids is given by equation
(4.1. This equation is valid only in case monolayer arrangement of the surfactant in the interlayer region.
dL(nm) = 0.96 + 0.127 ∗ nc + sinα (4.1)
Where, dL is the basal spacing in nm, nc is the number of carbon atom in the alkyl chain of the
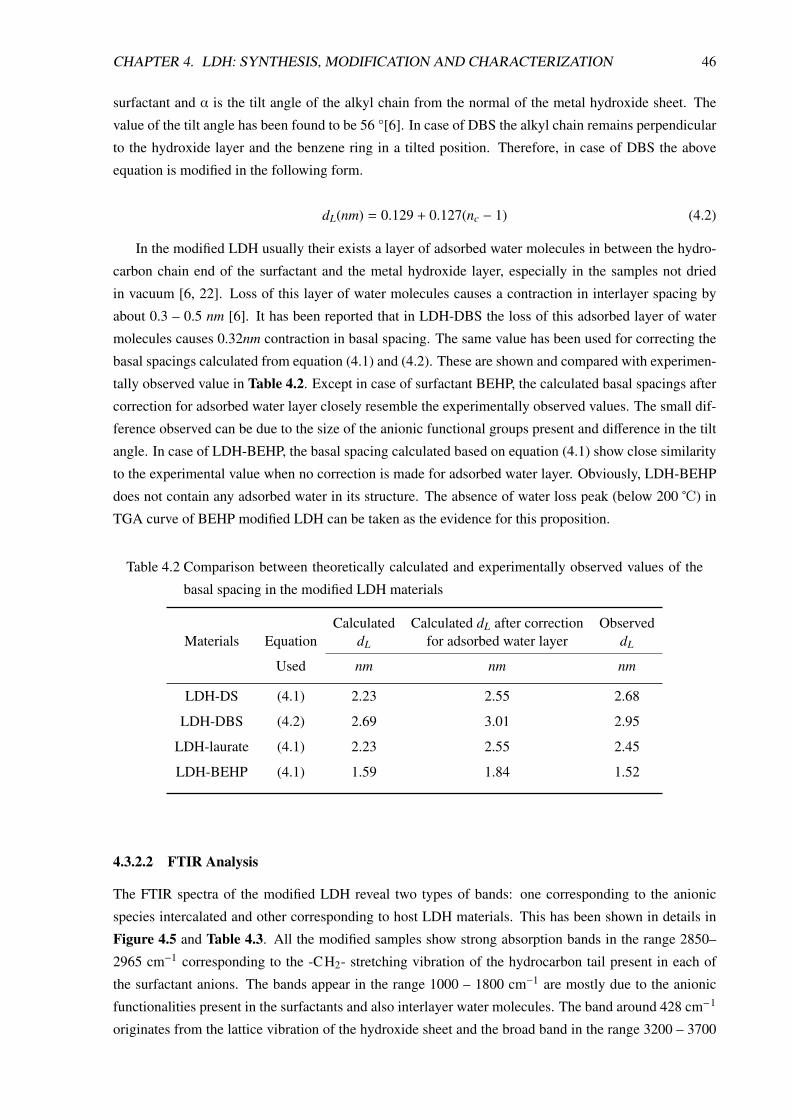
CHAPTER 4. LDH: SYNTHESIS, MODIFICATION AND CHARACTERIZATION 46
surfactant and α is the tilt angle of the alkyl chain from the normal of the metal hydroxide sheet. The
value of the tilt angle has been found to be 56 °[6]. In case of DBS the alkyl chain remains perpendicular
to the hydroxide layer and the benzene ring in a tilted position. Therefore, in case of DBS the above
equation is modified in the following form.
dL(nm) = 0.129 + 0.127(nc − 1) (4.2)
In the modified LDH usually their exists a layer of adsorbed water molecules in between the hydro-
carbon chain end of the surfactant and the metal hydroxide layer, especially in the samples not dried
in vacuum [6, 22]. Loss of this layer of water molecules causes a contraction in interlayer spacing by
about 0.3 – 0.5 nm [6]. It has been reported that in LDH-DBS the loss of this adsorbed layer of water
molecules causes 0.32nm contraction in basal spacing. The same value has been used for correcting the
basal spacings calculated from equation (4.1) and (4.2). These are shown and compared with experimen-
tally observed value in Table 4.2. Except in case of surfactant BEHP, the calculated basal spacings after
correction for adsorbed water layer closely resemble the experimentally observed values. The small dif-
ference observed can be due to the size of the anionic functional groups present and difference in the tilt
angle. In case of LDH-BEHP, the basal spacing calculated based on equation (4.1) show close similarity
to the experimental value when no correction is made for adsorbed water layer. Obviously, LDH-BEHP
does not contain any adsorbed water in its structure. The absence of water loss peak (below 200 ℃) in
TGA curve of BEHP modified LDH can be taken as the evidence for this proposition.
Table 4.2 Comparison between theoretically calculated and experimentally observed values of the
basal spacing in the modified LDH materials
Calculated Calculated dL after correction ObservedMaterials Equation dL for adsorbed water layer dL
Used nm nm nm
LDH-DS (4.1) 2.23 2.55 2.68
LDH-DBS (4.2) 2.69 3.01 2.95
LDH-laurate (4.1) 2.23 2.55 2.45
LDH-BEHP (4.1) 1.59 1.84 1.52
4.3.2.2 FTIR Analysis
The FTIR spectra of the modified LDH reveal two types of bands: one corresponding to the anionic
species intercalated and other corresponding to host LDH materials. This has been shown in details in
Figure 4.5 and Table 4.3. All the modified samples show strong absorption bands in the range 2850–
2965 cm−1 corresponding to the -CH2- stretching vibration of the hydrocarbon tail present in each of
the surfactant anions. The bands appear in the range 1000 – 1800 cm−1 are mostly due to the anionic
functionalities present in the surfactants and also interlayer water molecules. The band around 428 cm−1
originates from the lattice vibration of the hydroxide sheet and the broad band in the range 3200 – 3700
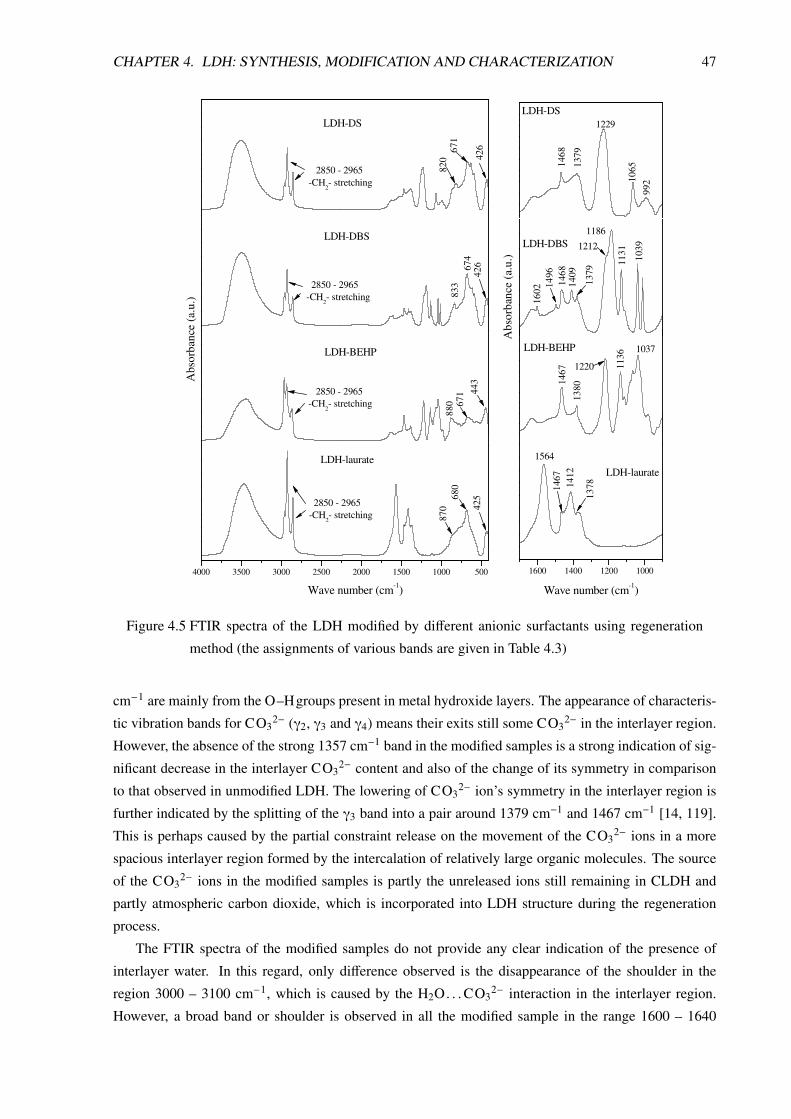
CHAPTER 4. LDH: SYNTHESIS, MODIFICATION AND CHARACTERIZATION 47
4000 3500 3000 2500 2000 1500 1000 500
443
LDH-BEHP
671
880
2850 - 2965-CH
2- stretching
2850 - 2965-CH
2- stretching
Abs
orba
nce
(a.u
.)
LDH-DS
42667
182
0
426
2850 - 2965-CH
2- stretching
LDH-DBS
674
833
Wave number (cm-1)
425
2850 - 2965-CH
2- stretching
LDH-laurate68
087
0
1600 1400 1200 1000
Wave number (cm-1)
LDH-laurate
1564
1412
1467
1378
LDH-DBS
1602
1496
1468
1409
1186
1131
1212
1039
1379
LDH-DS
1468
1379
1229
1065
992
Abs
orba
nce
(a.u
.)
LDH-BEHP
1467
1380
1220 1136
1037
Figure 4.5 FTIR spectra of the LDH modified by different anionic surfactants using regeneration
method (the assignments of various bands are given in Table 4.3)
cm−1 are mainly from the O–Hgroups present in metal hydroxide layers. The appearance of characteris-
tic vibration bands for CO32− (γ2, γ3 and γ4) means their exits still some CO3
2− in the interlayer region.
However, the absence of the strong 1357 cm−1 band in the modified samples is a strong indication of sig-
nificant decrease in the interlayer CO32− content and also of the change of its symmetry in comparison
to that observed in unmodified LDH. The lowering of CO32− ion’s symmetry in the interlayer region is
further indicated by the splitting of the γ3 band into a pair around 1379 cm−1 and 1467 cm−1 [14, 119].
This is perhaps caused by the partial constraint release on the movement of the CO32− ions in a more
spacious interlayer region formed by the intercalation of relatively large organic molecules. The source
of the CO32− ions in the modified samples is partly the unreleased ions still remaining in CLDH and
partly atmospheric carbon dioxide, which is incorporated into LDH structure during the regeneration
process.
The FTIR spectra of the modified samples do not provide any clear indication of the presence of
interlayer water. In this regard, only difference observed is the disappearance of the shoulder in the
region 3000 – 3100 cm−1, which is caused by the H2O. . . CO32− interaction in the interlayer region.
However, a broad band or shoulder is observed in all the modified sample in the range 1600 – 1640

CHAPTER 4. LDH: SYNTHESIS, MODIFICATION AND CHARACTERIZATION 48
Table 4.3 Assignment of FTIR bands in LDH modified with different surfactants by regeneration
method [19, 118, 123, 124]
Materials Band position (cm−1) Tapes of Vibration
2850–2965 ν−C H2
1229 νS=O (symmetric)
LDH-DS 1065 νS=O (asymmetric)
630 νC−S
671, 820, 1379 and 1468 Different vibration modes of CO32−
426 M-O(lattice vibration)
2850–2965 ν−C H2
1186 νS=O (symmetric)
LDH-DBS 1038 νS=O (asymmetric)
615 νC−S
1602, 1496, 1409 and 1450(w) νC=C of the benzene ring
674, 833, 1379 and 1467 Different vibration modes of CO32−
426 M-O(lattice vibration)
2850–2965 ν−C H2
1037 and 1136 νP−O−C
LDH-BEHP 1220 νP=O
671, 880, 1380 and 1465 Different vibration modes of CO32−
443 M-O(lattice vibration)
2850–2965 ν−C H2
1563 ν−C O O−(asymmetric)
LDH-Laurate 1412 ν−C O O−(symmetric)
680, 870, 1378 and 1467 Different vibration modes of CO32−
425 M-O(lattice vibration)
cm−1, which may indicate the presence of H2Omolecules as the band for its bending vibration appears
in this region. The XRD and TGA (see below) analysis show the presence of interlayer water. Therefore,
it is logical to interpret that the water molecules present in the modified LDH do not interact with CO32−
anions rather they bridge the gap between the hydrocarbon tail of the surfactants and the metal hydroxide
layers.
The FTIR bands corresponding to the functional groups of the surfactant anions are distinctly visible
in all the modified samples. In LDH-DS, the characteristic S=Ostretching vibration bands appear at
1229 cm−1 (symmetric) and 1065 cm−1 (asymmetric). The corresponding bands in LDH-DBS appears
at 1186 cm-1 and 1038 cm−1 respectively. The C–Sstretching vibration band is also observed at 630

CHAPTER 4. LDH: SYNTHESIS, MODIFICATION AND CHARACTERIZATION 49
cm−1 in LDH-DS and at 615 cm−1 in LDH-DBS. The LDH-DBS additionally shows multiple bands cor-
responding to the C=Cvibrations of the aromatic ring in the range 1450 – 1610 cm−1. The LDH-BEHP
shows characteristic P-O-Cstretching vibration bands at 1136 cm−1 (symmetric) and 1037 cm−1 (asym-
metric). The P=Ostretching vibration is also indicated by a strong band at 1220 cm−1. The LDH-laurate
shows two strong characteristic bands at 1563 cm−1 and 1412 cm−1 respectively for the asymmetric and
the symmetric stretching vibrations associated with the COO−1 group [124]. The intercalation imparts
some degree of constraints on the various characteristic vibrations of these functional groups. As a result,
their corresponding FTIR bands are expected to shift to lower values of wave number in comparison to
their free-state values as more energy is required for executing such vibrations under constraints.
A B
C D
E F
Figure 4.6 SEM micrographs of the LDH samples: A = unmodified Mg-Al–LDH, B = CLDH, C=
LDH-laurate, D = LDH-DS, E = LDH-DBS and F = LDH-BEHP (magnification bar
2µm)
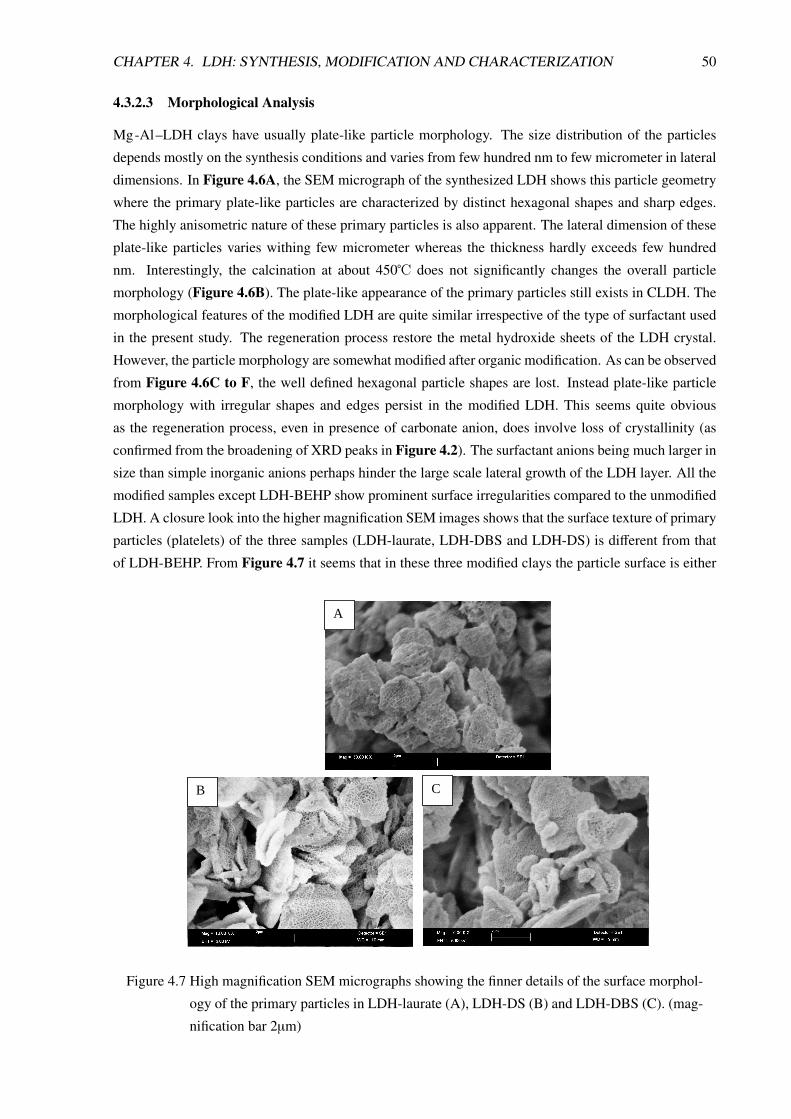
CHAPTER 4. LDH: SYNTHESIS, MODIFICATION AND CHARACTERIZATION 50
4.3.2.3 Morphological Analysis
Mg-Al–LDH clays have usually plate-like particle morphology. The size distribution of the particles
depends mostly on the synthesis conditions and varies from few hundred nm to few micrometer in lateral
dimensions. In Figure 4.6A, the SEM micrograph of the synthesized LDH shows this particle geometry
where the primary plate-like particles are characterized by distinct hexagonal shapes and sharp edges.
The highly anisometric nature of these primary particles is also apparent. The lateral dimension of these
plate-like particles varies withing few micrometer whereas the thickness hardly exceeds few hundred
nm. Interestingly, the calcination at about 450℃ does not significantly changes the overall particle
morphology (Figure 4.6B). The plate-like appearance of the primary particles still exists in CLDH. The
morphological features of the modified LDH are quite similar irrespective of the type of surfactant used
in the present study. The regeneration process restore the metal hydroxide sheets of the LDH crystal.
However, the particle morphology are somewhat modified after organic modification. As can be observed
from Figure 4.6C to F, the well defined hexagonal particle shapes are lost. Instead plate-like particle
morphology with irregular shapes and edges persist in the modified LDH. This seems quite obvious
as the regeneration process, even in presence of carbonate anion, does involve loss of crystallinity (as
confirmed from the broadening of XRD peaks in Figure 4.2). The surfactant anions being much larger in
size than simple inorganic anions perhaps hinder the large scale lateral growth of the LDH layer. All the
modified samples except LDH-BEHP show prominent surface irregularities compared to the unmodified
LDH. A closure look into the higher magnification SEM images shows that the surface texture of primary
particles (platelets) of the three samples (LDH-laurate, LDH-DBS and LDH-DS) is different from that
of LDH-BEHP. From Figure 4.7 it seems that in these three modified clays the particle surface is either
A
B C
Figure 4.7 High magnification SEM micrographs showing the finner details of the surface morphol-
ogy of the primary particles in LDH-laurate (A), LDH-DS (B) and LDH-DBS (C). (mag-
nification bar 2µm)
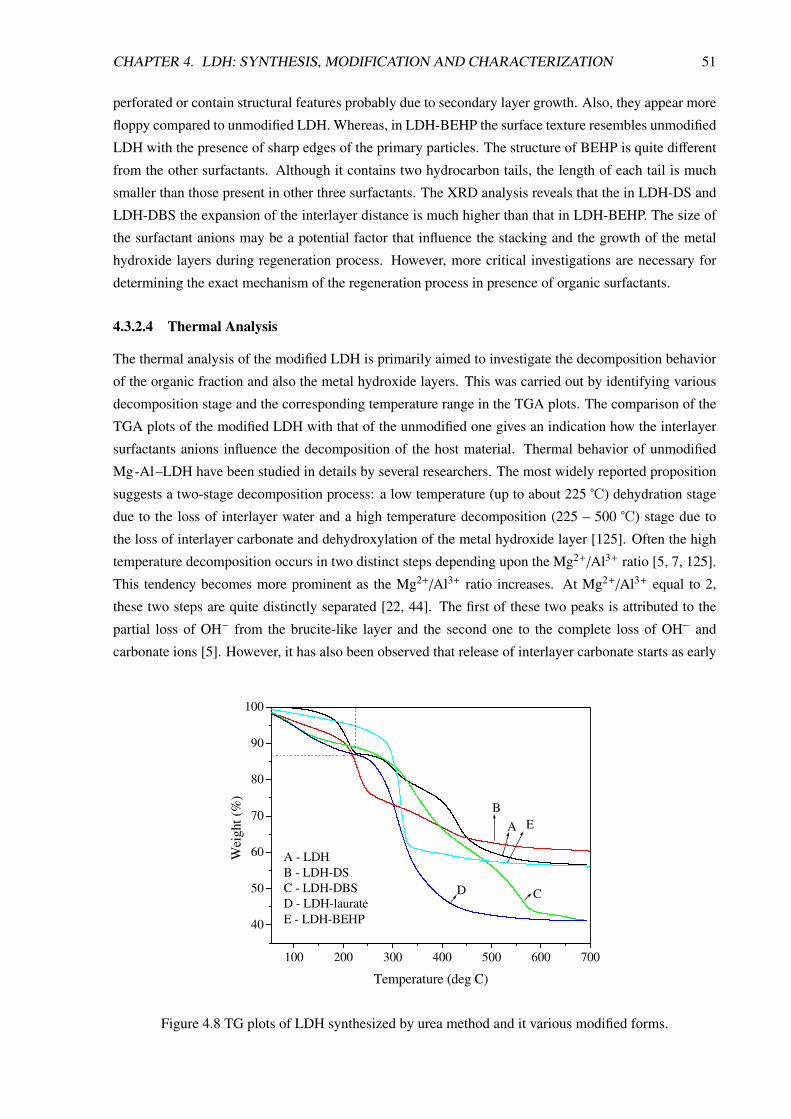
CHAPTER 4. LDH: SYNTHESIS, MODIFICATION AND CHARACTERIZATION 51
perforated or contain structural features probably due to secondary layer growth. Also, they appear more
floppy compared to unmodified LDH. Whereas, in LDH-BEHP the surface texture resembles unmodified
LDH with the presence of sharp edges of the primary particles. The structure of BEHP is quite different
from the other surfactants. Although it contains two hydrocarbon tails, the length of each tail is much
smaller than those present in other three surfactants. The XRD analysis reveals that the in LDH-DS and
LDH-DBS the expansion of the interlayer distance is much higher than that in LDH-BEHP. The size of
the surfactant anions may be a potential factor that influence the stacking and the growth of the metal
hydroxide layers during regeneration process. However, more critical investigations are necessary for
determining the exact mechanism of the regeneration process in presence of organic surfactants.
4.3.2.4 Thermal Analysis
The thermal analysis of the modified LDH is primarily aimed to investigate the decomposition behavior
of the organic fraction and also the metal hydroxide layers. This was carried out by identifying various
decomposition stage and the corresponding temperature range in the TGA plots. The comparison of the
TGA plots of the modified LDH with that of the unmodified one gives an indication how the interlayer
surfactants anions influence the decomposition of the host material. Thermal behavior of unmodified
Mg-Al–LDH have been studied in details by several researchers. The most widely reported proposition
suggests a two-stage decomposition process: a low temperature (up to about 225 ℃) dehydration stage
due to the loss of interlayer water and a high temperature decomposition (225 – 500 ℃) stage due to
the loss of interlayer carbonate and dehydroxylation of the metal hydroxide layer [125]. Often the high
temperature decomposition occurs in two distinct steps depending upon the Mg2+/Al3+ ratio [5, 7, 125].
This tendency becomes more prominent as the Mg2+/Al3+ ratio increases. At Mg2+/Al3+ equal to 2,
these two steps are quite distinctly separated [22, 44]. The first of these two peaks is attributed to the
partial loss of OH− from the brucite-like layer and the second one to the complete loss of OH− and
carbonate ions [5]. However, it has also been observed that release of interlayer carbonate starts as early
100 200 300 400 500 600 700
40
50
60
70
80
90
100
E
D C
B
A
Wei
ght
(%)
Temperature (deg C)
A - LDH
B - LDH-DS
C - LDH-DBS
D - LDH-laurate
E - LDH-BEHP
Figure 4.8 TG plots of LDH synthesized by urea method and it various modified forms.

CHAPTER 4. LDH: SYNTHESIS, MODIFICATION AND CHARACTERIZATION 52
as 250 ℃ and continues till 500 ℃ [126].
The thermal decomposition analysis of the unmodified LDH and its modified forms is presented in
Figure 4.8 and 4.9. The low temperature decomposition step in the unmodified LDH lies below 230 ℃with decomposition peak around 210 ℃. During this step the loss of interlayer water molecules corre-
sponds to a small (about 10 – 11 wt%) loss in weight in the TGA plot. This weight loss is closely equiva-
lent to the total interlayer water content according to the chemical formula of LDH with Mg2+/Al3+ ratio
equal to 2. The high temperature decomposition of the unmodified LDH takes place in two distinct steps
with decomposition peaks around 300 and 430 ℃. The organic modification of the LDH significantly
changes its the thermal decomposition behavior in comparison to the unmodified sample, especially the
second stage of the decomposition process, which results complete collapse of materials structure. It is
also apparent from Figure 4.8 and 4.9 that the nature of surfactant anions has a strong influence on the
thermal stability of the modified LDH. The loss of interlayer water molecules up to temperature about
225 ℃ in the modified samples are comparable to unmodified LDH, except the sample LDH-BEHP suf-
fering much less weight loss compared to the others. This indicates that in LDH-BEHP much less water
molecules are accommodated in the interlayer region. This is also reflected in the XRD analysis, where
experimentally observed interlayer distance corresponds to the theoretical value calculated without con-
sidering the presence of the water layer in the interlayer region. Unlike other surfactants, BEHP has two
100 200 300 400 500 600 700
Temperature (deg C)
LDH
210
300
430
LDH-DS
LDH-DBS
Dif
fere
nti
al w
eight
340560
230
LDH-laurate
LDH-BEHP
316
308
Figure 4.9 DTG curves for LDH and its various modified forms showing major decomposition
stages.

CHAPTER 4. LDH: SYNTHESIS, MODIFICATION AND CHARACTERIZATION 53
branched hydrocarbon tails and thus perhaps, makes the interlayer region in LDH-BEHP too crowded
to accommodate a large number of water molecules. The water molecules adsorbed on the non-gallery
surfaces of LDH can also undergo desorption during this low temperature weight loss stage [127]. Fig-ure 4.8 and 4.9 also exhibit that the low temperature decomposition peak shifts to lower temperature
in most of the modified samples indicating release of water molecules at lower temperature compared
to that in unmodified LDH. In unmodified LDH, interlayer water molecules remain in close interaction
with the interlayer carbonate ions and the hydroxide sheets through hydrogen bonding in a relatively
constrained environment. After intercalation with surfactants, such interactions are largely reduced due
to large decrease in carbonate anion concentration in the interlayer region and accumulation of the water
molecules in between hydrocarbon tail of surfactant and hydroxide sheets. Similar shifts in the first de-
composition step is also observed with decreasing Mg2+/Al3+ ratio, which causes reduction in carbonate
anion proportion in LDH composition [22].
The second decomposition stage is also changed significantly after organic modification. The two-
step decomposition is only distinctly observed in LDH-DBS in the range 240 – 600 ℃. However, both
the peaks shift to higher value compared to the unmodified LDH. The decomposition of the dodecylben-
zenesulfonate also takes place during this phase and probably interferes with the decomposition of the
host material. The decomposition of benzene ring and long hydrocarbon chain in absence of free oxygen
can delay the overall thermal decomposition process. LDH-DS shows lower thermal stability compared
to other samples with greater weight loss up to temperature 230 ℃. The decomposition of dodecylsulfate
ion takes place in the range 210 – 250 ℃ [128] and therefore, a greater loss is observed below 250 ℃compared to other modified LDH samples. The loss of the remaining carbonate and dehydroxylation
of the host layer in LDH-DS takes place at slower rate over a wide temperature range of 280 – 300 C
resulting in a broad peak in DTG plot. Thermal decompositions of LDH-laurate and LDH-BEHP are
characterized by the presence of a large proportion of weight loss step, which in case of former ranges
within 250 – 350 ℃ and later within 280 – 350 ℃. This is caused by the decomposition of the interlayer
surfactant anions in these regions. However, major dehydroxylation process of the host materials occurs
or starts around 300 ℃. Therefore, largest proportion of weight loss for these two modified samples
takes place in this region.
4.3.2.5 SDBS Modified LDH or LDH-DBS
Since LDH-DBS has the largest interlayer distance among all the modified samples studied, this organi-
cally modified LDH was chosen for the preparation of PE/LDH based nanocomposites. The characteri-
zation of LDH-DBS in the previous section though provides many important information on its structure,
a further analysis using FTIR and XRD at various temperatures can be helpful to understand the changes
in structure of LDH and LDH-DBS with increasing temperature. These information may also be impor-
tant during processing and melt rheological analysis of the nanocomposites as they are carried out at a
elevated temperature.
I. XRD analysis at different temperaturesFigure 4.10 shows the XRD patterns of both unmodified LDH and LDH-DBS at different temper-
atures. The XRD measurements were carried out by heating the sample within the sample holding
unit in XRD instrument under nitrogen atmosphere. In Figure 4.10, the unchanged positions of the

CHAPTER 4. LDH: SYNTHESIS, MODIFICATION AND CHARACTERIZATION 54
0.2 0.3 0.4 0.5 0.6 0.7 0.8
<006><003>
Inte
nsity
(a.u
.)
d (nm)
1 2 3 4 5
<009>
<006>
<003>
d (nm)
30 70 110 150 190 200 210 220 230 240 250 260 270 280 290 300 310 320 330 340 350
Figure 4.10 XRD patterns of unmodified LDH (left) and LDH-DBS (right) measured at different
temperature showing the change in structure with temperature
first order and subsequent basal reflections of < 00l > series in the unmodified LDH indicates no
significant change occurs in the crystal structure of LDH up to about 200 ℃. Beyond this temper-
ature, the intensity of the first order basal reflection < 003 > becomes progressively weaker and
there appears a second reflection at slightly higher value of 2θ (from 11.7 to 13.2 degree), which
corresponds to about 0.10 nm decrease in interlayer distance. The similar shifts in 2θ also take
place in cases of the higher order basal reflection (< 006 >, < 009 >, etc). Above 220 ℃, all the
basal reflection peaks observed in LDH below 200 ℃ are lost at their original position, but a new
similar set of basal reflections appears at somewhat shifted 2θ value. From the thermal analysis
shown previously and also from numerous references from literature, it is well known that loss of
interlayer water in LDH occurs below 225 ℃. This loss in water causes a reduction in interlayer
distance, but interestingly does not destroy the crystal structure of the LDH materials. In case of
LDH-DBS, the loss of interlayer water molecules can not be identified so distinctly from the XRD
spectra. When the XRD pattern of this materials obtained at different temperatures are compared
side by side, the basal reflections starts broadening above about 100 ℃. Since the decrease in in-

CHAPTER 4. LDH: SYNTHESIS, MODIFICATION AND CHARACTERIZATION 55
terlayer distance due to such water loss is only about 0.3 nm, corresponding decrease in first basal
reflection (< 003 >) from 2.96 nm to about 2.66 nm appears in the form of a weak shoulder in the
XRD pattern above 100 ℃ in Figure 4.10.
In the unmodified LDH, the sharp basal reflection of the < 00l > series are observed even up to
300 ℃. This means the layered structure remains undisturbed up to this temperature. Above 300
℃, all the XRD reflections become progressively weaker and broader with increasing temperature
indicating a breakdown of the layered structure. Around 320 to 330 ℃, the material becomes pre-
dominantly amorphous. In case of LDH-DBS, above 280 to 290 ℃, the different XRD reflections
become indistinguishable. During processing and melt analysis of PE/LDH nanocomposites, tem-
peratures is hardly reached above 250 ℃. So the physical and the chemical integrity of the clay
material during such processes remain practically unaffected.
II. TGA analysis under inert and oxygen atmosphereTGA analysis of Mg-Al–LDH and LDH-DBS discussed earlier were based on the results obtained
from the measurements carried out under oxygen atmosphere. The same measurement when car-
ried out under an inert atmosphere and the results are compared, interesting information regarding
the thermal stability of various species/moieties are obtained and distinct regions of their thermal
degradation can be identified. Figure 4.11 reveals such comparison between TGA results obtained
under oxygen and nitrogen environments. Interestingly, in case of unmodified LDH the nature of
TGA and hence the DTG plots remain exactly identical under both the environment. This means
thermal decomposition of unmodified LDH simply involves the loss of interlayer species and then
endothermic decomposition of metal hydroxide layer. The complete loss of interlayer water takes
place within 210 – 220 ℃ which is indicated by strong peak ’a’ in the DTG curve. The second large
decomposition stage occurs around 300 ℃ (indicated by the peak ’b’ in DTG plot), which involves
100 200 300 400 500 600 700
30
40
50
60
70
80
90
100
100 200 300 400 500 600 700
-20
-18
-16
-14
-12
-10
-8
-6
-4
-2
0
f
e
d cb
a
Dif
fere
nti
al w
eight
Temeperature (deg)
LDH
loss of crystalline
structure
LDH
complete
loss of inter
layer H2O
Wei
gh
t (%
)
Temperature (deg)
LDH: air LDH: nitrogen LDH-DBS: air LDH-DBS: nitrogen
Figure 4.11 TGA analysis of LDH and LDH-DBS in different atmospheres
mostly the loss of interlayer carbonate causing collapsing of the layered structure as confirmed from
Figure 4.10. The decomposition of the metal hydroxide sheets also begins at this stage, but to a
very insignificant extent as the residual weight still remains about 80 %. The final decomposition
peak ’c’ in the DTG plot of the unmodified LDH is observed around 430 ℃. During this stage, the
CHAPTER 4. LDH: SYNTHESIS, MODIFICATION AND CHARACTERIZATION 56
hydroxide layers are decomposed to form metal oxide releasing water vapour. The equal amounts
of residue are left after heating LDH above 700 ℃ in both the atmospheres. This also indicates
the similar nature of the residue obtained. However, in case of LDH-DBS, thermal decomposition
under nitrogen and oxygen atmospheres follows different paths and also yields different extents
of residue. The two TGA plots are virtually identical below about 300 ℃ indicating no oxidative
degradation occurs below this temperature. However, when compared with the unmodified LDH,
low temperature decomposition though spans up to 200 to 210 ℃, the decomposition peak is ob-
served at much lower temperature (around 100 ℃). Since the weight loss in this range is mostly due
to the release of interlayer water molecules, it can be said that in LDH-DBS, the interlayer water
is more losely bound as compared to that in the unmodified LDH. One may argue that this weight
can be due to desorption of the physically adsorbed water molecules on the non-gallery surfaces of
LDH crystallites. However, this seems unlikely as LDH-DBS has highly hydrophobic surface with
low surface energy (discussed later).
From above 300 ℃ to 600 ℃, decomposition of LDH-DBS under oxygen atmosphere is character-
ized by two peaks one at around 340 ℃ (e) and other at around 560 ℃ (peak ’f’). When decom-
position is carried out under nitrogen atmosphere, the second peak does not show any change in
position, but the first one shifts from about 340 ℃ to about 460 ℃. It is believed that this shift in
decomposition peak in DTG is associated with the decomposition of the intercalated DBS anion.
In presence of oxygen, DBS anion undergoes oxidative decomposition liberating oxides of carbon
and water vapour whereas under inert atmosphere, it undergoes non oxidative degradation through
bond scission, which usually occur at higher temperature than their oxygen supported combustion
temperature. Also the non oxidative decomposition of hydrocarbon species produces carbonaceous
solid residue, which may account for the higher amount of residue left after thermal analysis under
nitrogen atmosphere.
III. FTIR investigation at elevated temperaturesThe FTIR analysis of unmodified LDH and LDH-DBS at different temperature provides useful
information regarding the changes in structure of the host material with increasing temperature.
Figure 4.12 A–C shows the selected regions of FTIR spectra measured with increasing temperature
up to 235 ℃ for unmodified LDH. The most interesting change observed on heating is the gradual
disappearance of the shoulder around 3100 cm−1, which stands for hydrogen bonding between
interlayer water molecules and carbonate anion. This is due to loss of major portion of interlayer
water molecules below about 250 ℃. This also reduces the intensity of the broad peak observed
in the region 1550 - 1750 cm−1 associated with the bending vibration of the interlayer water. The
presence of strong γ3 peak around 1357 cm−1, even at 235 ℃, indicates most of the CO32− ions are
still retained in the interlayer region (Figure 4.12C). The FTIR spectra of LDH-DBS at different
temperatures shows how the interlayer water molecules are released with increasing temperature.
The broad peak around 1640 cm−1 due to H2Obending vibration nearly disappears as early as 100
℃ in Figure 4.12D and is released at much lower temperature than that in the unmodified LDH.
IV. Surface Tension MeasurementInterfacial tension is a very important parameter that controls the miscibility of filler particles into
a polymer matrix. If the surface tensions of these two components differ largely from each other,

CHAPTER 4. LDH: SYNTHESIS, MODIFICATION AND CHARACTERIZATION 57
3400 3200 3000 28000.0
0.5
1.0
1.5
2.0
2.5(A)
shoulder due to H
2O....CO=
3 interaction
Wave number (cm-1)
Inte
nsity
(a.u
.)
RT 50 100 150 200 235
2000 1900 1800 1700 1600 15000.0
0.1
0.2
0.3(B)
Inte
nsity
(a.u
.)
broad peaks due to interlayer H
2O
Wave number (cm-1)
1600 1500 1400 13000.0
0.5
1.0
1.5
2.0(C) peak due to
interlayer CO=
3
Inte
nsity
(a.u
.)
Wave number (cm-1)
1750 1700 1650 1600 15500.00
0.05
0.10
0.15
0.20
0.25
0.30(D)
C-H stretchingin benzene ring
interlayer H
2O
Inte
nsity
(a.u
.)
Wave number (cm-1)
RT 50 100 150 200 235
Figure 4.12 FTIR spectra of unmodified LDH (A-C) and LDH-DBS (D) taken at different tem-
peratures showing changes in the structure of the unmodified clay material.
interfacial tension becomes very high and the filler particle cannot disperse well in the matrix.
Therefore, the prerequisite condition for obtaining a good dispersion of an inorganic filler in a
non-polar polymer is the reduction of its surface tension difference with the polymer. The pristine
unmodified LDH has highly hydrophilic surface similar to that of Mg(OH)2. The modification of
LDH with surfactants not only brings about the enlargement of interlayer distance in LDH, but
also makes it more hydrophobic. This is important as it prevents large scale aggregate formation
by the filler particles when mixed with non-polar polymers. The technique used for measuring the
surface tension of LDH materials is the capillary penetration method based on modified Washburn
equation [129, 130]. The powdered LDH materials were packed in a glass capillary tube having
one end closed with a piece of filter paper. At the other end, the filled capillary was hanged to
a microbalance. The close end was then brought in contact with several test liquids of different
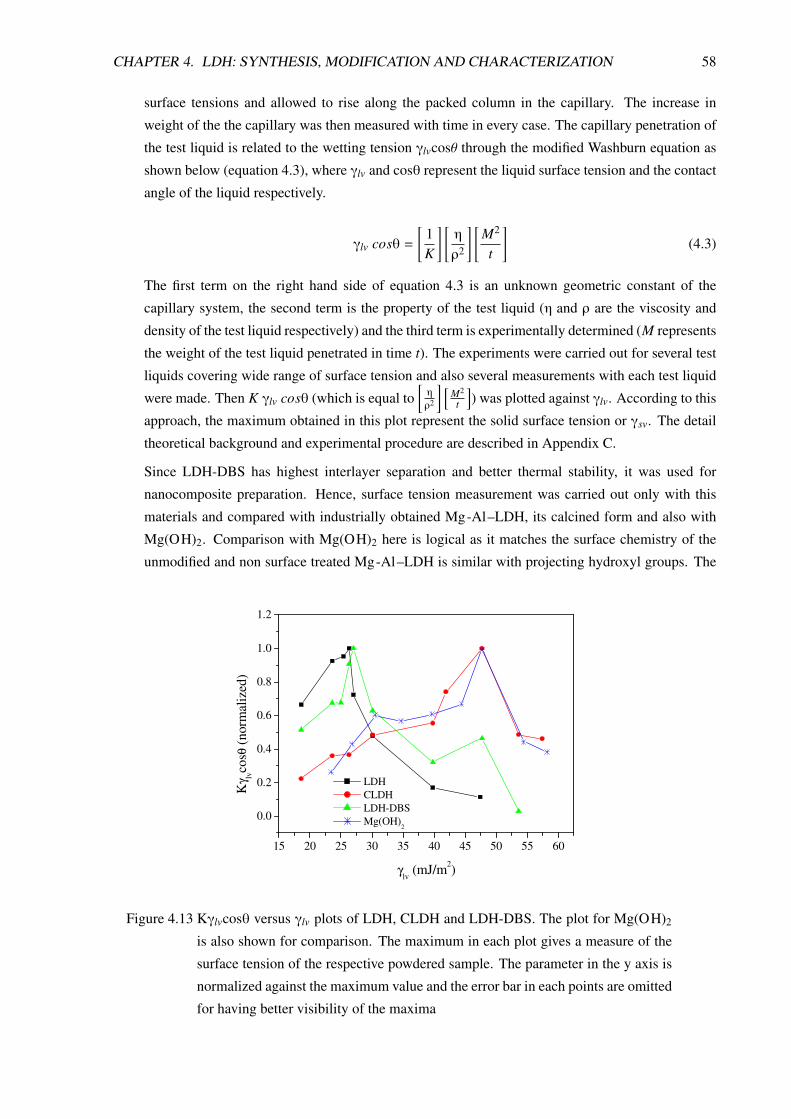
CHAPTER 4. LDH: SYNTHESIS, MODIFICATION AND CHARACTERIZATION 58
surface tensions and allowed to rise along the packed column in the capillary. The increase in
weight of the the capillary was then measured with time in every case. The capillary penetration of
the test liquid is related to the wetting tension γlvcosθ through the modified Washburn equation as
shown below (equation 4.3), where γlv and cosθ represent the liquid surface tension and the contact
angle of the liquid respectively.
γlv cosθ =[
1K
] [η
ρ2
] [M2
t
](4.3)
The first term on the right hand side of equation 4.3 is an unknown geometric constant of the
capillary system, the second term is the property of the test liquid (η and ρ are the viscosity and
density of the test liquid respectively) and the third term is experimentally determined (M represents
the weight of the test liquid penetrated in time t). The experiments were carried out for several test
liquids covering wide range of surface tension and also several measurements with each test liquid
were made. Then K γlv cosθ (which is equal to[η
ρ2
] [M2
t
]) was plotted against γlv. According to this
approach, the maximum obtained in this plot represent the solid surface tension or γsv. The detail
theoretical background and experimental procedure are described in Appendix C.
Since LDH-DBS has highest interlayer separation and better thermal stability, it was used for
nanocomposite preparation. Hence, surface tension measurement was carried out only with this
materials and compared with industrially obtained Mg-Al–LDH, its calcined form and also with
Mg(OH)2. Comparison with Mg(OH)2 here is logical as it matches the surface chemistry of the
unmodified and non surface treated Mg-Al–LDH is similar with projecting hydroxyl groups. The
15 20 25 30 35 40 45 50 55 60
0.0
0.2
0.4
0.6
0.8
1.0
1.2
Kγ lv
cosθ
(nor
mal
ized
)
γlv (mJ/m2)
LDH CLDH LDH-DBS Mg(OH)
2
Figure 4.13 Kγlvcosθ versus γlv plots of LDH, CLDH and LDH-DBS. The plot for Mg(OH)2
is also shown for comparison. The maximum in each plot gives a measure of the
surface tension of the respective powdered sample. The parameter in the y axis is
normalized against the maximum value and the error bar in each points are omitted
for having better visibility of the maxima
CHAPTER 4. LDH: SYNTHESIS, MODIFICATION AND CHARACTERIZATION 59
results from the capillary penetration tests are shown in Figure 4.13. Mg-Al–LDH obtained from
industry is surface treated and shows low surface energy value, which is around 26.34 mJ/m2 as
shown by the peak position in Figure 4.13. After calcination, LDH is converted to its mixed ox-
ide form and become more hygroscopic showing large increase in the surface tension (maximum
is shifted to 47.74 mJ/m2). On treatment with SDBS, the regeneration of the crystal structure of
LDH takes place. The XRD pattern indicates that DBS anion are intercalated in between hydroxide
sheets. However, no information about the nature of the exposed surface of the LDH crystallites is
obtained from the XRD analysis. The modification of LDH with SDBS lowers the surface tension
to near about 27 mJ/m2. This is much lower than that of magnesium hydroxide. Such significant
lowering of surface tension after modification with surfactants having hydrophobic tail(s) has also
been reported in case of cationic clays, like montmorilinite using amine based organic surfactants
[131].
4.4 Conclusion
The organic modification of Mg-Al–LDH and characterization of the modified clays have been discussed
in this chapter. The method used for such modification was based on regeneration effect shown by the
LDH materials. This method avoids complicated chemical process, use of organic solvent and external
heating. Among the different surfactants investigated SDBS gave the best results in terms of increase of
interlayer separation. It provides nearly four fold increase in basal spacing. Another interesting aspects
to be noted here that regeneration method works better with anionic surfactants that are highly soluble in
aqueous medium. The homogeneity of the product is excellent in these cases. For example, with SDBS
and SDS, no unmodified fraction of LDH can be detected in their XRD patterns. On the other hand,
surfactants, which are not soluble or sparingly soluble in aqueous medium at room temperature such
as laurate, organic phosphate, stearate, etc give significant fraction of unmodified LDH as confirmed
from the XRD and FTIR analysis. All the surfactants studied, give mono layer stacking within the
interlayer region. However, bi layer arrangements of anionic surfactants can also occur under specific
condition and has been reported in literature for stearate [132], sodium octylsulfate [45], etc. In case of
LDH-DBS, elemental analysis (Appendix A) confirms that surfactant anion can not completely replace
carbonate ions in the interlayer region. However, this can not be confirmed from the FTIR investigation
(Figure 4.5) as the peaks for interlayer carbonate ion fall in the region where the peaks corresponding to
C=C of benzene ring appears. In the industrial sample, where the value of ’x’ in chemical structure of
LDH is roughly 0.3, the chemical the elemental analysis shows that around 48 – 50% of the carbonate
anion are replaced by the DBS ion. The high degree of anion exchange by large surfactants has one
disadvantage that it results hybrid with high organic content. The inorganic content of such modified
filler, which account for matrix reinforcement, improvement of barrier properties and flammability, etc
will be drastically reduced in that case.
C5
C PE/LDHN
5.1 Morphological Characterizations
5.1.1 Introduction
In addition to the base matrix PE and the filler particles, the PE/LDH nanocomposite prepared by melt-
compounding contain a third component, namely compatibilizer. This compatibilizer is a functionalized
polymer containing pendent maleic anhydride groups on a polyethylene backbone. The primary purpose
of using a functionalized polymer (PE-g-MAH) is to improve compatibility between the non-polar PE
matrix and the highly polar LDH particle surface. Though organic modification makes the clay mostly
hydrophobic (see Figure 4.13 in Chapter 4), use of functionalized polymer is a common practice in the
preparation of polyolefin/clay type nanocomposites. This may be due to fact that polar functional groups
present in functionalized polymers (like maleic anhydride group in PE-g-MAH) can have favorable inter-
action with clay surface. The rigorous morphological characterization of a polymer/clay nanocomposite
is necessary to understand the state of clay particle dispersion in polymer matrix. The primary approach
is to study the changes in the interlayer separation of the clay crystals using X-ray diffraction analysis
(XRD) using wide angle X-ray scattering (WAXS) at various stages of material preparation. In case of
melt compounding process, such analysis is usually carried out with freshly compounded nanocomposite
samples and is compared with that observed in the clay precursor i.e. organically modified clay. How-
ever, the XRD analysis alone can not be reliable to draw final conclusion about the dispersion state of
clay particle in nanocomposites [133, 134]. This is because of the fact that the nature of reflection (in
terms of its position and intensity) in the WAXS pattern not only depend on the interlayer separation, but
also on several other factors, like concentration of the clay in the nanocomposites, symmetry in specific
crystallographic directions, etc. Besides, inhomogeneity in crystal structure of the clay (i.e. intercalated,
exfoliated and unmodified fraction existing in the same sample) may results in a complicated WAXS
pattern. Therefore, along with XRD analysis electron microscopic investigations are often coupled to
obtain a complete picture of dispersion of the clay particle in polymer nanocomposites. However, the
morphological analysis using electron microscopy, like TEM also has certain inherent disadvantage so
far as polymer nanocomposite is concerned. First, to view the nanoscopic particle distribution within
a polymer matrix one needs to rely on high magnification images, which makes the scan surface area
very small not necessarily representing the whole surface area of the sample. Second, it shows only the
surface morphology of the particle distribution and not the bulk morphology. In case of molded articles
60

CHAPTER 5. CHARACTERIZATIONS OF PE/LDH NANOCOMPOSITE 61
or test specimen, the nature of particle distribution can be significantly different at the different sections
of the samples [135]. To obtain the overview of particle dispersion over large surface area, images of
different magnifications starting from low magnification to high magnification should be investigated
simultaneously on the same surface.
2 4 6 8 10 12 14 16
LDPE/LDH nanocomposite (Brabender plasticorder)
LDH-DBS
disappearance or large decrease in intensityof the higher order peak in nanocomposites
<009><006>
<003>2.95 nm
Inte
nsity
(a.
u.)
2θ (deg)
LDH Concentrations 2.43 wt% 4.72 wt% 6.89 wt%
500 nm
200 nm
4.73 wt% 6.89 wt%
Figure 5.1 WAXS patterns (top) and representative TEM micrographs of PE/LDH nanocomposites
(below: LDH concentration are shown) prepared by melt-compounding in Brabender
plasticorder.
5.1.2 PE/LDH Nanocomposite Prepared in Small Batch-Mixer
To investigate whether melt-mixing method is suitable or not for preparing PE/LDH nanocomposites,
small batches of sample with different LDH contents were prepared in a batch-mixer (Brabender plasti-
corder). The WAXS pattern and the representative TEM micrographs of these compositions are shown
in Figure 5.1. For comparison, the WAXS pattern of LDH-DBS is also shown. The WAXS patterns
of these trial samples are characterized by the presence of the first order basal reflection (< 003 >) in
all the compositions indicating that the LDH layers are not fully exfoliated in the polymer matrix. An-

CHAPTER 5. CHARACTERIZATIONS OF PE/LDH NANOCOMPOSITE 62
other interesting point to be noted here is the nature of higher order basal reflection of < 00l > series.
They are either disappeared or their intensities are sharply reduced. This a clear indication of increasing
crystal disordering of the LDH particles in the nanocomposites [134]. The first order basal reflection in
LDH-DBS corresponds to an interlayer layer separation of about 2.95 nm. In case of the nanocomposites
prepared in Brabender plasticorder, there observed no change in the position of the basal reflection as
compared to that in LDH-DBS. Also at low LDH concentrations, intensity of this peak is very week
and higher order reflections can not be detected by the instrument. At high LDH concentrations, the
higher order basal reflection peaks become prominent indicating the presence of larger crystallites of
LDH. The representative TEM images shown in Figure 5.1 indicate that the dispersed LDH particles
in the nanocomposite matrix have preferentially intercalated morphology with occasional exfoliation of
the clay layers from bigger LDH platelets. The primary particles appear swollen and have disordered
structure at their surfaces. They also forms aggregates at high concentrations (Figure 5.1B). The high
magnification TEM images reveal that nanoscopic particle fragments (particle size well below 100 nm)
are indeed delaminated from the surface of the primary LDH particles. As shown in Figure 5.2, the
increasing LDH concentration though the primary particles form more aggregates, their partial exfo-
liation is not supressed. This kind of morphology resembles those observed in intercalated/exfoliated
type polymer clay nanocomposites [133]. The partially exfoliated nature of the LDH particles seems
a promising sign toward the possibility of obtaining better dispersion of metal hydroxide type filler in
polyolefin matrix and preparing polyolefin/LDH based nanocomposites.
100 nm
100 nm
Figure 5.2 High magnification TEM showing exfoliated LDH layers fragments (some indicated by
arrow marks) in PE/LDH nanocomposites containing low (left, 4.72 wt% ) and high
(right, 16.20 wt%) LDH concentration (magnification bar 100 nm).
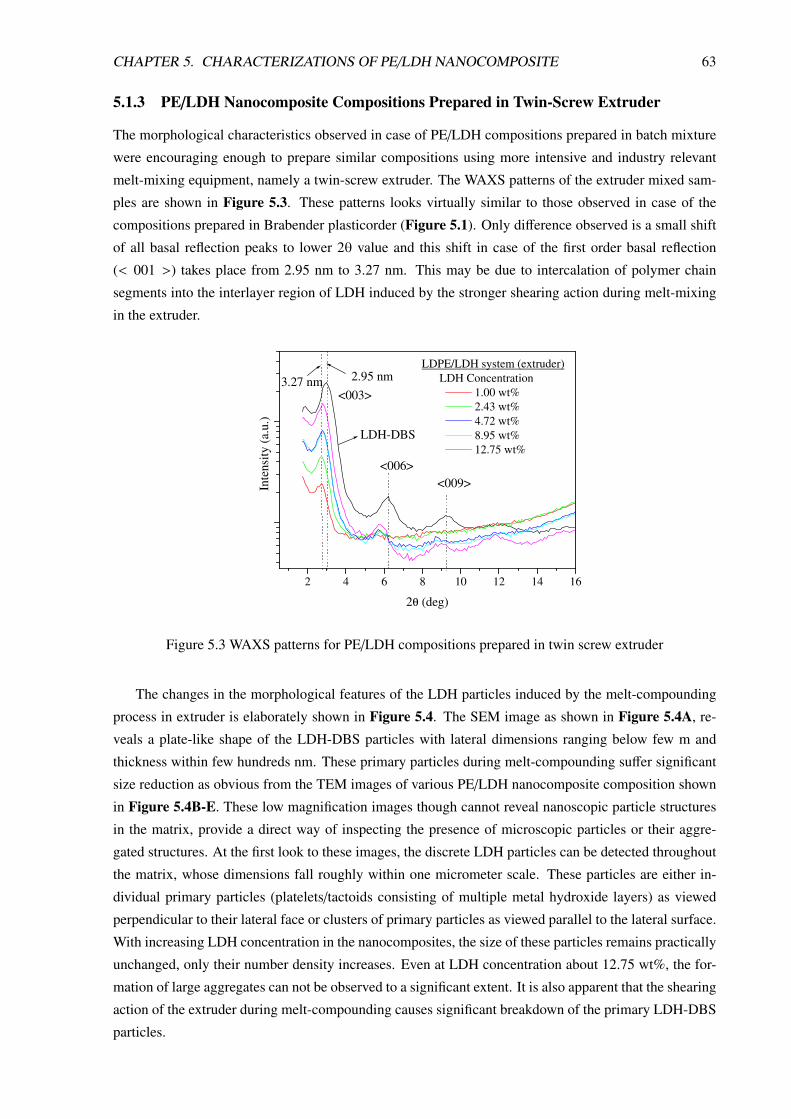
CHAPTER 5. CHARACTERIZATIONS OF PE/LDH NANOCOMPOSITE 63
5.1.3 PE/LDH Nanocomposite Compositions Prepared in Twin-Screw Extruder
The morphological characteristics observed in case of PE/LDH compositions prepared in batch mixture
were encouraging enough to prepare similar compositions using more intensive and industry relevant
melt-mixing equipment, namely a twin-screw extruder. The WAXS patterns of the extruder mixed sam-
ples are shown in Figure 5.3. These patterns looks virtually similar to those observed in case of the
compositions prepared in Brabender plasticorder (Figure 5.1). Only difference observed is a small shift
of all basal reflection peaks to lower 2θ value and this shift in case of the first order basal reflection
(< 001 >) takes place from 2.95 nm to 3.27 nm. This may be due to intercalation of polymer chain
segments into the interlayer region of LDH induced by the stronger shearing action during melt-mixing
in the extruder.
2 4 6 8 10 12 14 16
LDH-DBS
<009>
<006>
<003>3.27 nm 2.95 nm
Inte
nsi
ty (
a.u.)
2θ (deg)
LDPE/LDH system (extruder)
LDH Concentration
1.00 wt%
2.43 wt%
4.72 wt%
8.95 wt%
12.75 wt%
Figure 5.3 WAXS patterns for PE/LDH compositions prepared in twin screw extruder
The changes in the morphological features of the LDH particles induced by the melt-compounding
process in extruder is elaborately shown in Figure 5.4. The SEM image as shown in Figure 5.4A, re-
veals a plate-like shape of the LDH-DBS particles with lateral dimensions ranging below few m and
thickness within few hundreds nm. These primary particles during melt-compounding suffer significant
size reduction as obvious from the TEM images of various PE/LDH nanocomposite composition shown
in Figure 5.4B-E. These low magnification images though cannot reveal nanoscopic particle structures
in the matrix, provide a direct way of inspecting the presence of microscopic particles or their aggre-
gated structures. At the first look to these images, the discrete LDH particles can be detected throughout
the matrix, whose dimensions fall roughly within one micrometer scale. These particles are either in-
dividual primary particles (platelets/tactoids consisting of multiple metal hydroxide layers) as viewed
perpendicular to their lateral face or clusters of primary particles as viewed parallel to the lateral surface.
With increasing LDH concentration in the nanocomposites, the size of these particles remains practically
unchanged, only their number density increases. Even at LDH concentration about 12.75 wt%, the for-
mation of large aggregates can not be observed to a significant extent. It is also apparent that the shearing
action of the extruder during melt-compounding causes significant breakdown of the primary LDH-DBS
particles.
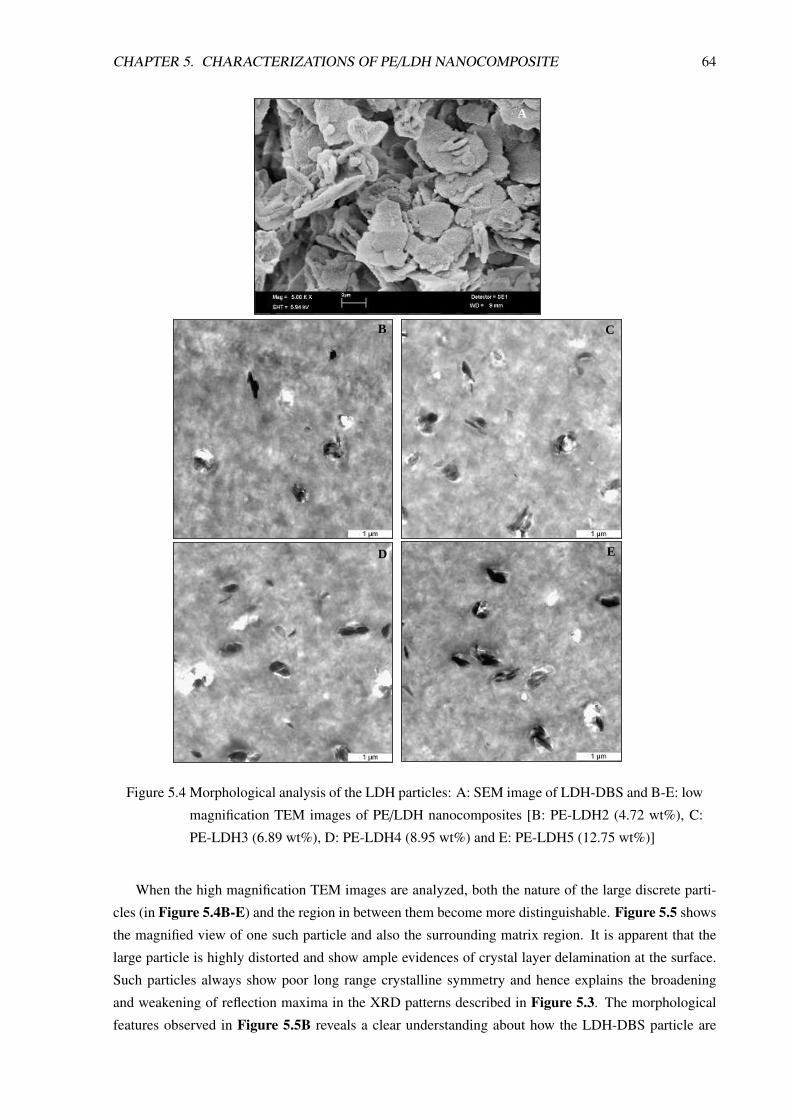
CHAPTER 5. CHARACTERIZATIONS OF PE/LDH NANOCOMPOSITE 64
A
B C
D E
Figure 5.4 Morphological analysis of the LDH particles: A: SEM image of LDH-DBS and B-E: low
magnification TEM images of PE/LDH nanocomposites [B: PE-LDH2 (4.72 wt%), C:
PE-LDH3 (6.89 wt%), D: PE-LDH4 (8.95 wt%) and E: PE-LDH5 (12.75 wt%)]
When the high magnification TEM images are analyzed, both the nature of the large discrete parti-
cles (in Figure 5.4B-E) and the region in between them become more distinguishable. Figure 5.5 shows
the magnified view of one such particle and also the surrounding matrix region. It is apparent that the
large particle is highly distorted and show ample evidences of crystal layer delamination at the surface.
Such particles always show poor long range crystalline symmetry and hence explains the broadening
and weakening of reflection maxima in the XRD patterns described in Figure 5.3. The morphological
features observed in Figure 5.5B reveals a clear understanding about how the LDH-DBS particle are

CHAPTER 5. CHARACTERIZATIONS OF PE/LDH NANOCOMPOSITE 65
(A) (B)
Figure 5.5 TEM micrographs showing that exfoliated LDH particles exist both in the bulk matrix
(A) and also in the vicinity of the originating bigger particles (B).
exfoliated during melt-compounding. At first, the polymer chains penetrate within the interlayer region
of the LDH-DBS particles and push apart the metal hydroxide sheets. With the course of time within
the mixing channel of extruder, more and more polymer chains enter the interlayer region and the shear-
ing action of the screws forces the delamination of the surface layers one by one from the surface of
a large LDH-DBS particle. As a result, not only the exfoliated particle fragments are formed, but also
the size of the original particles is reduced. This also explains why the average size of the primary
particles observed in Figure 5.4 is much smaller than that observed in case of LDH-DBS prior to melt-
compounding. The breakdown of the organically modified primary LDH particles has also been observed
during melt-compounding in case of polyamide 6 based nanocomposites [60]. Therefore, it is expected
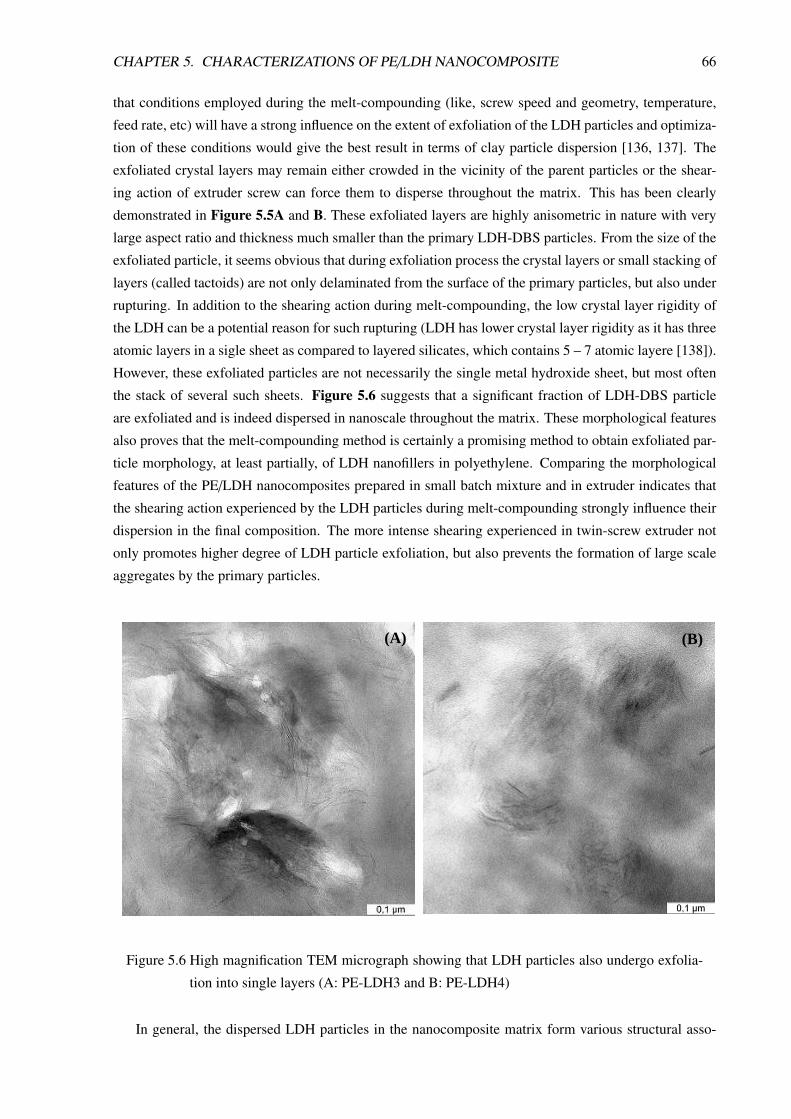
CHAPTER 5. CHARACTERIZATIONS OF PE/LDH NANOCOMPOSITE 66
that conditions employed during the melt-compounding (like, screw speed and geometry, temperature,
feed rate, etc) will have a strong influence on the extent of exfoliation of the LDH particles and optimiza-
tion of these conditions would give the best result in terms of clay particle dispersion [136, 137]. The
exfoliated crystal layers may remain either crowded in the vicinity of the parent particles or the shear-
ing action of extruder screw can force them to disperse throughout the matrix. This has been clearly
demonstrated in Figure 5.5A and B. These exfoliated layers are highly anisometric in nature with very
large aspect ratio and thickness much smaller than the primary LDH-DBS particles. From the size of the
exfoliated particle, it seems obvious that during exfoliation process the crystal layers or small stacking of
layers (called tactoids) are not only delaminated from the surface of the primary particles, but also under
rupturing. In addition to the shearing action during melt-compounding, the low crystal layer rigidity of
the LDH can be a potential reason for such rupturing (LDH has lower crystal layer rigidity as it has three
atomic layers in a sigle sheet as compared to layered silicates, which contains 5 – 7 atomic layere [138]).
However, these exfoliated particles are not necessarily the single metal hydroxide sheet, but most often
the stack of several such sheets. Figure 5.6 suggests that a significant fraction of LDH-DBS particle
are exfoliated and is indeed dispersed in nanoscale throughout the matrix. These morphological features
also proves that the melt-compounding method is certainly a promising method to obtain exfoliated par-
ticle morphology, at least partially, of LDH nanofillers in polyethylene. Comparing the morphological
features of the PE/LDH nanocomposites prepared in small batch mixture and in extruder indicates that
the shearing action experienced by the LDH particles during melt-compounding strongly influence their
dispersion in the final composition. The more intense shearing experienced in twin-screw extruder not
only promotes higher degree of LDH particle exfoliation, but also prevents the formation of large scale
aggregates by the primary particles.
(A) (B)
Figure 5.6 High magnification TEM micrograph showing that LDH particles also undergo exfolia-
tion into single layers (A: PE-LDH3 and B: PE-LDH4)
In general, the dispersed LDH particles in the nanocomposite matrix form various structural asso-
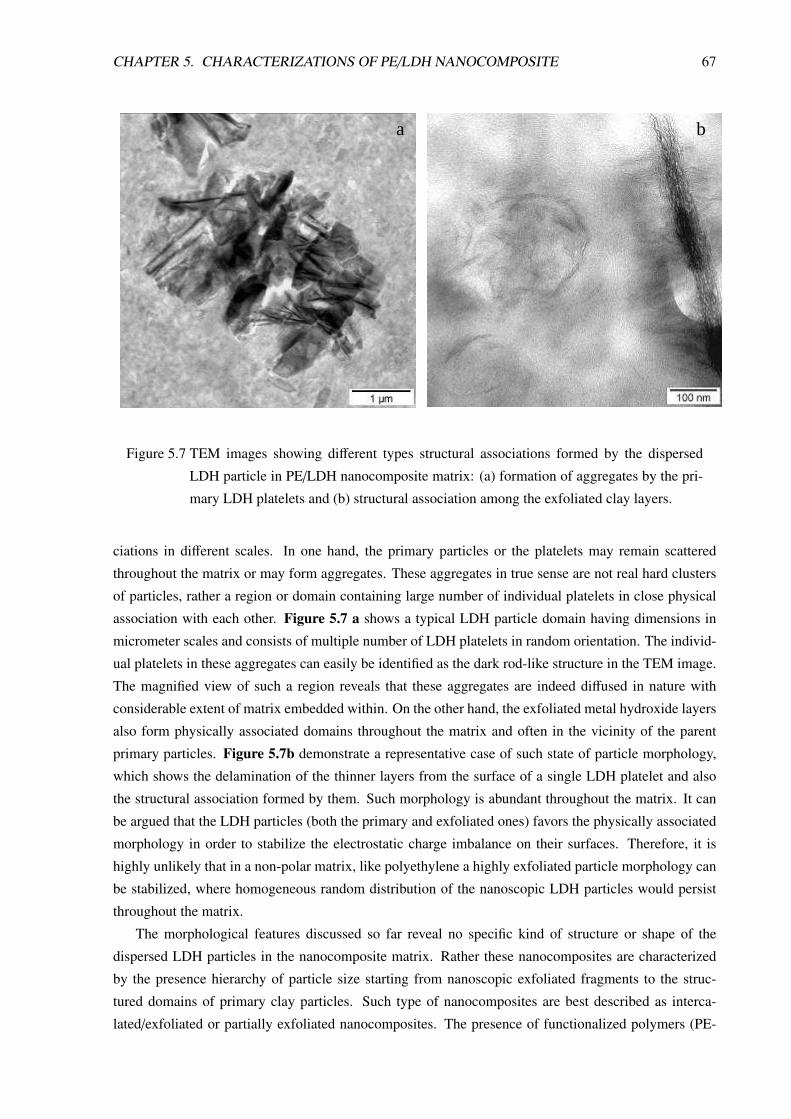
CHAPTER 5. CHARACTERIZATIONS OF PE/LDH NANOCOMPOSITE 67
a b
Figure 5.7 TEM images showing different types structural associations formed by the dispersed
LDH particle in PE/LDH nanocomposite matrix: (a) formation of aggregates by the pri-
mary LDH platelets and (b) structural association among the exfoliated clay layers.
ciations in different scales. In one hand, the primary particles or the platelets may remain scattered
throughout the matrix or may form aggregates. These aggregates in true sense are not real hard clusters
of particles, rather a region or domain containing large number of individual platelets in close physical
association with each other. Figure 5.7 a shows a typical LDH particle domain having dimensions in
micrometer scales and consists of multiple number of LDH platelets in random orientation. The individ-
ual platelets in these aggregates can easily be identified as the dark rod-like structure in the TEM image.
The magnified view of such a region reveals that these aggregates are indeed diffused in nature with
considerable extent of matrix embedded within. On the other hand, the exfoliated metal hydroxide layers
also form physically associated domains throughout the matrix and often in the vicinity of the parent
primary particles. Figure 5.7b demonstrate a representative case of such state of particle morphology,
which shows the delamination of the thinner layers from the surface of a single LDH platelet and also
the structural association formed by them. Such morphology is abundant throughout the matrix. It can
be argued that the LDH particles (both the primary and exfoliated ones) favors the physically associated
morphology in order to stabilize the electrostatic charge imbalance on their surfaces. Therefore, it is
highly unlikely that in a non-polar matrix, like polyethylene a highly exfoliated particle morphology can
be stabilized, where homogeneous random distribution of the nanoscopic LDH particles would persist
throughout the matrix.
The morphological features discussed so far reveal no specific kind of structure or shape of the
dispersed LDH particles in the nanocomposite matrix. Rather these nanocomposites are characterized
by the presence hierarchy of particle size starting from nanoscopic exfoliated fragments to the struc-
tured domains of primary clay particles. Such type of nanocomposites are best described as interca-
lated/exfoliated or partially exfoliated nanocomposites. The presence of functionalized polymers (PE-
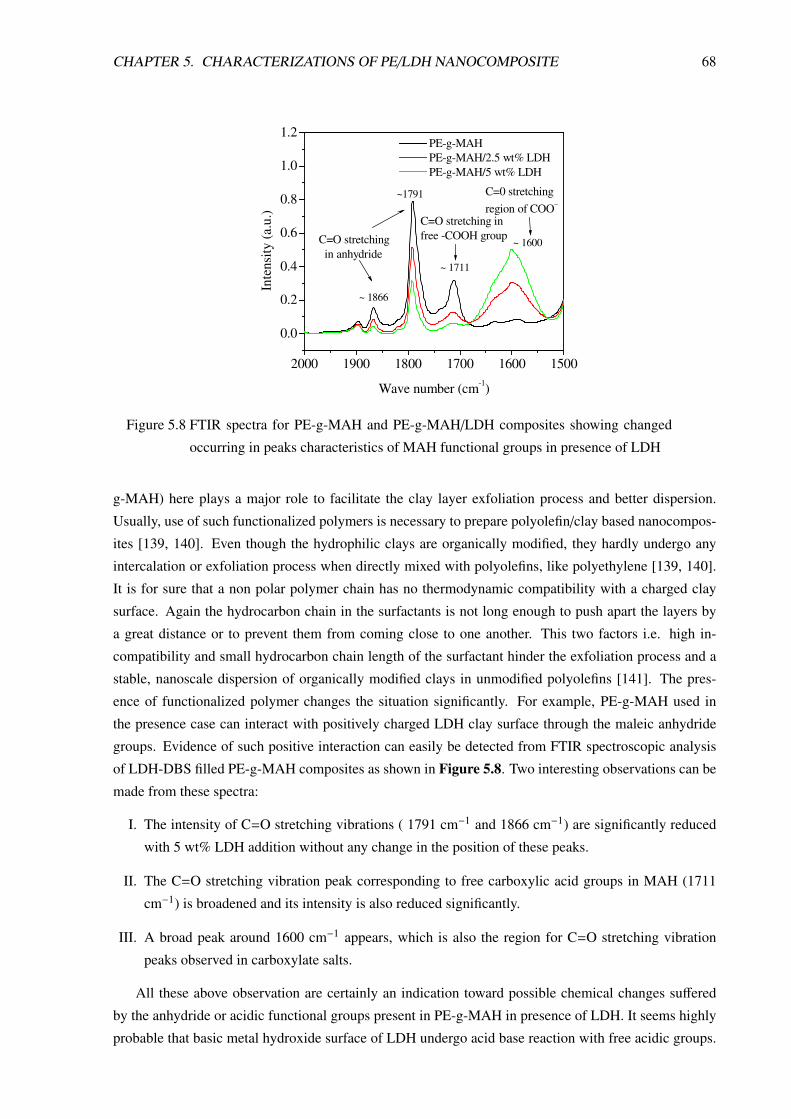
CHAPTER 5. CHARACTERIZATIONS OF PE/LDH NANOCOMPOSITE 68
2000 1900 1800 1700 1600 1500
0.0
0.2
0.4
0.6
0.8
1.0
1.2
C=0 stretchingregion of COO−
C=O stretching in free -COOH groupC=O stretching
in anhydride~ 1600
~ 1866
~ 1711
~1791
Inte
nsity
(a.u
.)
Wave number (cm-1)
PE-g-MAH PE-g-MAH/2.5 wt% LDH PE-g-MAH/5 wt% LDH
Figure 5.8 FTIR spectra for PE-g-MAH and PE-g-MAH/LDH composites showing changed
occurring in peaks characteristics of MAH functional groups in presence of LDH
g-MAH) here plays a major role to facilitate the clay layer exfoliation process and better dispersion.
Usually, use of such functionalized polymers is necessary to prepare polyolefin/clay based nanocompos-
ites [139, 140]. Even though the hydrophilic clays are organically modified, they hardly undergo any
intercalation or exfoliation process when directly mixed with polyolefins, like polyethylene [139, 140].
It is for sure that a non polar polymer chain has no thermodynamic compatibility with a charged clay
surface. Again the hydrocarbon chain in the surfactants is not long enough to push apart the layers by
a great distance or to prevent them from coming close to one another. This two factors i.e. high in-
compatibility and small hydrocarbon chain length of the surfactant hinder the exfoliation process and a
stable, nanoscale dispersion of organically modified clays in unmodified polyolefins [141]. The pres-
ence of functionalized polymer changes the situation significantly. For example, PE-g-MAH used in
the presence case can interact with positively charged LDH clay surface through the maleic anhydride
groups. Evidence of such positive interaction can easily be detected from FTIR spectroscopic analysis
of LDH-DBS filled PE-g-MAH composites as shown in Figure 5.8. Two interesting observations can be
made from these spectra:
I. The intensity of C=O stretching vibrations ( 1791 cm−1 and 1866 cm−1) are significantly reduced
with 5 wt% LDH addition without any change in the position of these peaks.
II. The C=O stretching vibration peak corresponding to free carboxylic acid groups in MAH (1711
cm−1) is broadened and its intensity is also reduced significantly.
III. A broad peak around 1600 cm−1 appears, which is also the region for C=O stretching vibration
peaks observed in carboxylate salts.
All these above observation are certainly an indication toward possible chemical changes suffered
by the anhydride or acidic functional groups present in PE-g-MAH in presence of LDH. It seems highly
probable that basic metal hydroxide surface of LDH undergo acid base reaction with free acidic groups.
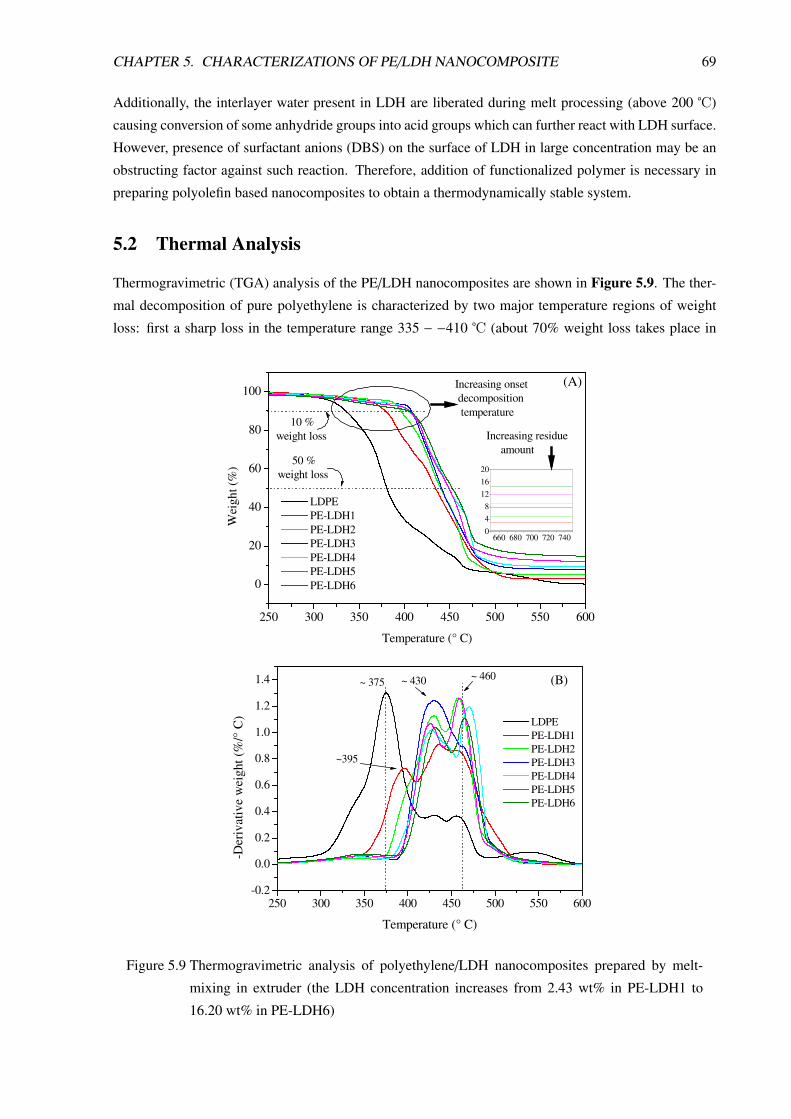
CHAPTER 5. CHARACTERIZATIONS OF PE/LDH NANOCOMPOSITE 69
Additionally, the interlayer water present in LDH are liberated during melt processing (above 200 ℃)
causing conversion of some anhydride groups into acid groups which can further react with LDH surface.
However, presence of surfactant anions (DBS) on the surface of LDH in large concentration may be an
obstructing factor against such reaction. Therefore, addition of functionalized polymer is necessary in
preparing polyolefin based nanocomposites to obtain a thermodynamically stable system.
5.2 Thermal Analysis
Thermogravimetric (TGA) analysis of the PE/LDH nanocomposites are shown in Figure 5.9. The ther-
mal decomposition of pure polyethylene is characterized by two major temperature regions of weight
loss: first a sharp loss in the temperature range 335 − −410 ℃ (about 70% weight loss takes place in
250 300 350 400 450 500 550 600
0
20
40
60
80
100
LDPE PE-LDH1 PE-LDH2 PE-LDH3 PE-LDH4 PE-LDH5 PE-LDH6
660 680 700 720 740048
121620
(A)
Increasing residue amount
Increasing onset decomposition temperature
50 % weight loss
10 % weight loss
Wei
ght (
%)
Temperature (° C)
250 300 350 400 450 500 550 600-0.2
0.0
0.2
0.4
0.6
0.8
1.0
1.2
1.4
LDPE PE-LDH1 PE-LDH2 PE-LDH3 PE-LDH4 PE-LDH5 PE-LDH6
(B)~ 460~ 430
~395
~ 375
-Der
ivat
ive
wei
ght (
%/°
C)
Temperature (° C)
Figure 5.9 Thermogravimetric analysis of polyethylene/LDH nanocomposites prepared by melt-
mixing in extruder (the LDH concentration increases from 2.43 wt% in PE-LDH1 to
16.20 wt% in PE-LDH6)
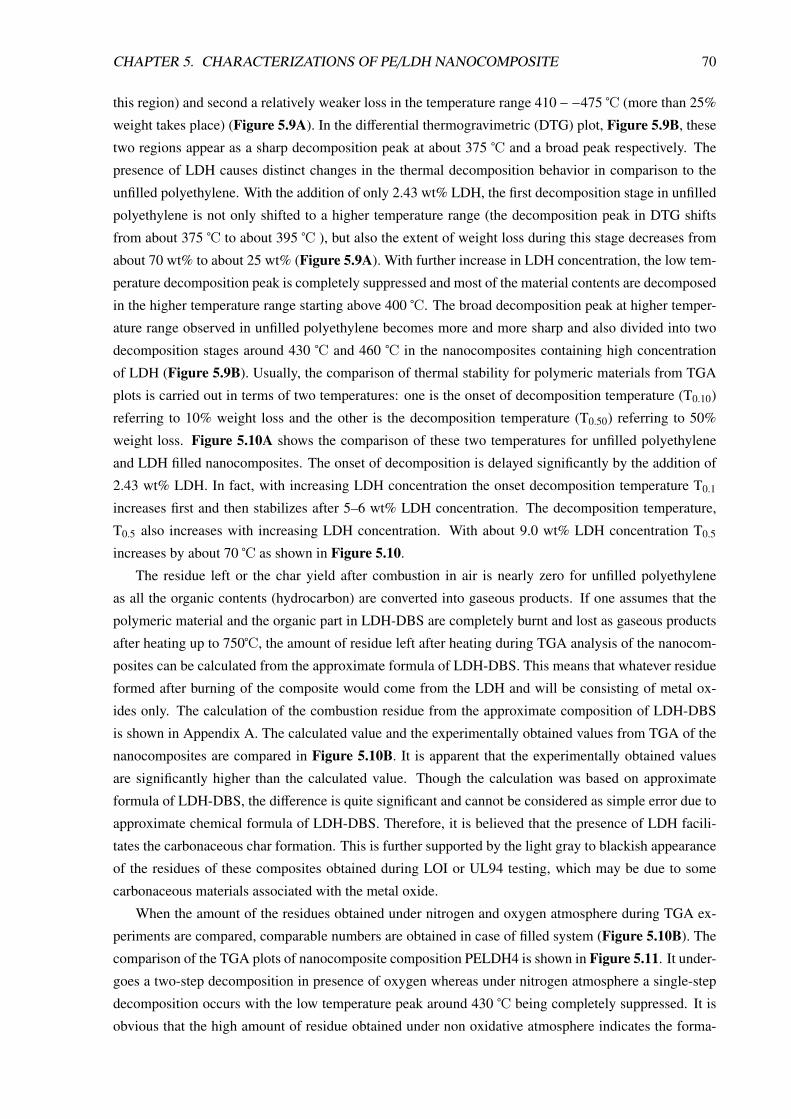
CHAPTER 5. CHARACTERIZATIONS OF PE/LDH NANOCOMPOSITE 70
this region) and second a relatively weaker loss in the temperature range 410 − −475 ℃ (more than 25%
weight takes place) (Figure 5.9A). In the differential thermogravimetric (DTG) plot, Figure 5.9B, these
two regions appear as a sharp decomposition peak at about 375 ℃ and a broad peak respectively. The
presence of LDH causes distinct changes in the thermal decomposition behavior in comparison to the
unfilled polyethylene. With the addition of only 2.43 wt% LDH, the first decomposition stage in unfilled
polyethylene is not only shifted to a higher temperature range (the decomposition peak in DTG shifts
from about 375 ℃ to about 395 ℃ ), but also the extent of weight loss during this stage decreases from
about 70 wt% to about 25 wt% (Figure 5.9A). With further increase in LDH concentration, the low tem-
perature decomposition peak is completely suppressed and most of the material contents are decomposed
in the higher temperature range starting above 400 ℃. The broad decomposition peak at higher temper-
ature range observed in unfilled polyethylene becomes more and more sharp and also divided into two
decomposition stages around 430 ℃ and 460 ℃ in the nanocomposites containing high concentration
of LDH (Figure 5.9B). Usually, the comparison of thermal stability for polymeric materials from TGA
plots is carried out in terms of two temperatures: one is the onset of decomposition temperature (T0.10)
referring to 10% weight loss and the other is the decomposition temperature (T0.50) referring to 50%
weight loss. Figure 5.10A shows the comparison of these two temperatures for unfilled polyethylene
and LDH filled nanocomposites. The onset of decomposition is delayed significantly by the addition of
2.43 wt% LDH. In fact, with increasing LDH concentration the onset decomposition temperature T0.1
increases first and then stabilizes after 5–6 wt% LDH concentration. The decomposition temperature,
T0.5 also increases with increasing LDH concentration. With about 9.0 wt% LDH concentration T0.5
increases by about 70 ℃ as shown in Figure 5.10.
The residue left or the char yield after combustion in air is nearly zero for unfilled polyethylene
as all the organic contents (hydrocarbon) are converted into gaseous products. If one assumes that the
polymeric material and the organic part in LDH-DBS are completely burnt and lost as gaseous products
after heating up to 750℃, the amount of residue left after heating during TGA analysis of the nanocom-
posites can be calculated from the approximate formula of LDH-DBS. This means that whatever residue
formed after burning of the composite would come from the LDH and will be consisting of metal ox-
ides only. The calculation of the combustion residue from the approximate composition of LDH-DBS
is shown in Appendix A. The calculated value and the experimentally obtained values from TGA of the
nanocomposites are compared in Figure 5.10B. It is apparent that the experimentally obtained values
are significantly higher than the calculated value. Though the calculation was based on approximate
formula of LDH-DBS, the difference is quite significant and cannot be considered as simple error due to
approximate chemical formula of LDH-DBS. Therefore, it is believed that the presence of LDH facili-
tates the carbonaceous char formation. This is further supported by the light gray to blackish appearance
of the residues of these composites obtained during LOI or UL94 testing, which may be due to some
carbonaceous materials associated with the metal oxide.
When the amount of the residues obtained under nitrogen and oxygen atmosphere during TGA ex-
periments are compared, comparable numbers are obtained in case of filled system (Figure 5.10B). The
comparison of the TGA plots of nanocomposite composition PELDH4 is shown in Figure 5.11. It under-
goes a two-step decomposition in presence of oxygen whereas under nitrogen atmosphere a single-step
decomposition occurs with the low temperature peak around 430 ℃ being completely suppressed. It is
obvious that the high amount of residue obtained under non oxidative atmosphere indicates the forma-
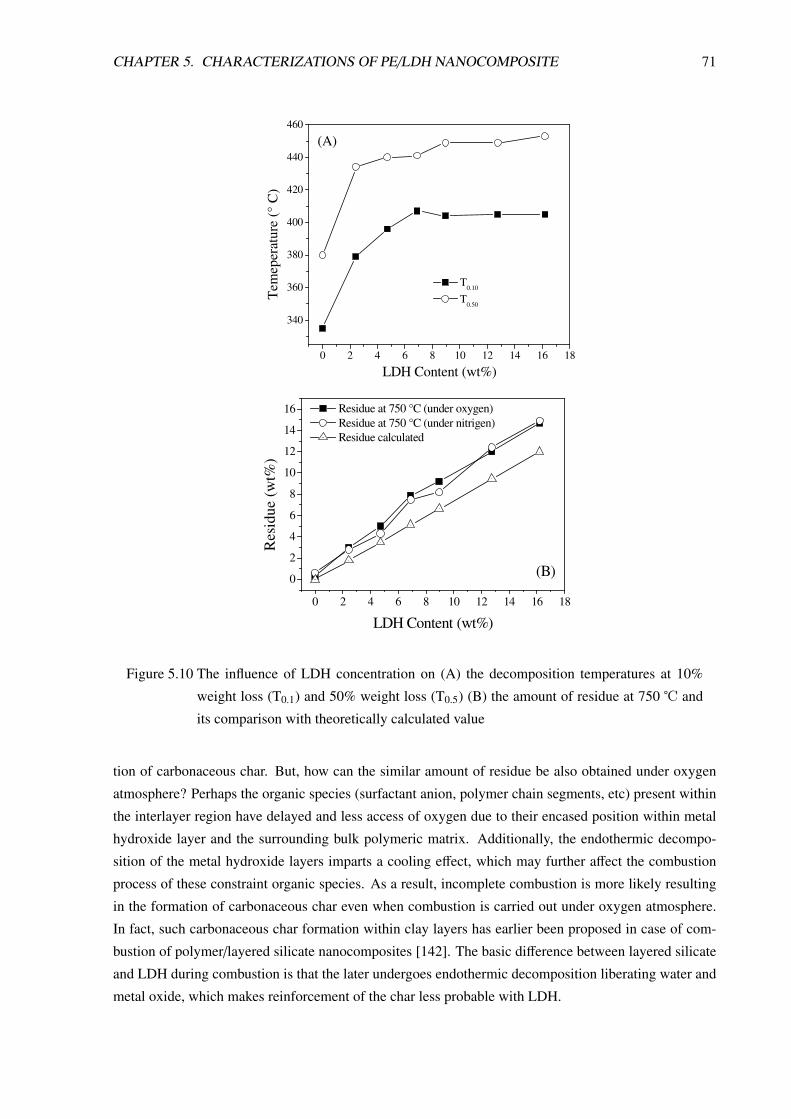
CHAPTER 5. CHARACTERIZATIONS OF PE/LDH NANOCOMPOSITE 71
0 2 4 6 8 10 12 14 16 18
340
360
380
400
420
440
460
(A)
Tem
eper
atur
e (°
C)
LDH Content (wt%)
T0.10
T0.50
0 2 4 6 8 10 12 14 16 18
0
2
4
6
8
10
12
14
16
(B)
Res
idue
(wt%
)
LDH Content (wt%)
Residue at 750 °C (under oxygen) Residue at 750 °C (under nitrigen) Residue calculated
Figure 5.10 The influence of LDH concentration on (A) the decomposition temperatures at 10%
weight loss (T0.1) and 50% weight loss (T0.5) (B) the amount of residue at 750 ℃ and
its comparison with theoretically calculated value
tion of carbonaceous char. But, how can the similar amount of residue be also obtained under oxygen
atmosphere? Perhaps the organic species (surfactant anion, polymer chain segments, etc) present within
the interlayer region have delayed and less access of oxygen due to their encased position within metal
hydroxide layer and the surrounding bulk polymeric matrix. Additionally, the endothermic decompo-
sition of the metal hydroxide layers imparts a cooling effect, which may further affect the combustion
process of these constraint organic species. As a result, incomplete combustion is more likely resulting
in the formation of carbonaceous char even when combustion is carried out under oxygen atmosphere.
In fact, such carbonaceous char formation within clay layers has earlier been proposed in case of com-
bustion of polymer/layered silicate nanocomposites [142]. The basic difference between layered silicate
and LDH during combustion is that the later undergoes endothermic decomposition liberating water and
metal oxide, which makes reinforcement of the char less probable with LDH.

CHAPTER 5. CHARACTERIZATIONS OF PE/LDH NANOCOMPOSITE 72
0
20
40
60
80
100
300 350 400 450 500 550 6000.00.20.40.60.81.01.21.41.6
Wei
ght (
%)
-Der
ivat
ive
wei
ght (
%/°
C)
Temperature (°C)
PE-LDH4N
2
PE-LDH4O
2
Figure 5.11 Comparison of the Thermogravimetric analysis of PE/LDH nanocomposite under oxy-
gen and nitrogen atmosphere
5.3 Rheological Analysis
5.3.1 Introduction
Rheological analysis of polymeric melts involves the study of the mechanical response of the melt under
the action of external mechanical stress or strain. In case of filled polymeric systems, rheological behav-
ior can be drastically different from that of the unfilled melts depending on the nature of filler particles
(structure, size, shape, surface characteristics, etc) and the state of their dispersion in the polymer ma-
trix [143, 144]. In fact, rheological analysis is an important tool to investigate the state of filler particle
dispersion in filled systems and their response under external force. Though an indirect method, rheo-
logical analysis can be treated as a complementary to the direct methods for morphological analysis, like
XRD and electron microscopy, which altogether provide a complete picture of the state of filler particle
dispersion in polymer matrix. The major advantages of rheological analysis are that it reflects the bulk
properties of the matrix and also provides flow behavior of the melt that are often useful in deciding the
optimum processing conditions required for the melt processing of polymer composites.
Polymeric melts are viscoelastic systems and their response to shearing depends on the ratio be-
tween the time scales of shear experiments and the characteristic relaxation time of microstructures
present within such systems. The term microstructure means molecular entanglements in a high molec-
ular weight unfilled melt and additionally structural association the filler particles in a particle filled
system. Principally, such microstructures signify structural feature that acts as a physical barrier against
flowability of the polymer chains under stress. When the experimental time scale is far below the char-
acteristic relaxation time the microstructure (experienced at high frequencies or shear rates), the system

CHAPTER 5. CHARACTERIZATIONS OF PE/LDH NANOCOMPOSITE 73
shows preferably elastic response characterized by high value of storage modulus. Whereas, at large ex-
perimental time scale (experienced at low frequencies or shear rates), the system shows viscous response.
Again, shearing actions, if sufficiently high can change and even destroy these microstructures resulting
in an entirely different material response compared to that observed when shearing does not affect the
microstructures. From the scientific point of view, investigations in both these regions are important
as they highlight the different mechanism of material’s response toward external stress. The polymeric
melts are characterized by a critical strain below which stress bears linear relationship with the applied
strain and their ratio (known as relaxation modulus) shows a constant value independent of strain. Thus,
the rheological behavior of polymeric melts below this critical strain is a linear viscoelastic one. Above
the critical strain, due to changes in the microstructures, the relaxation modulus decreases with strain and
the stress becomes a non-linear function of strain resulting in a non-linear viscoelastic material response
[145]. Therefore, the primary task before carrying intensive rheological analysis is to determine the tran-
sition point between linear and non-linear viscoelastic regime. One simple way to determine this critical
strain or a range about it, is to subject the polymeric melt to dynamic oscillatory shear using sinusoidal
strain at constant frequency and varying strain amplitude. The strain input function looks like
γ(t) = γ0 sin(ωt) (5.1)
where oscillatory strain γ(t) is applied at constant frequency ω with varying strain amplitude γ0
The storage modulus, G′, is then monitored against strain amplitude. In the log G′versus log γ
plot, the transition from linear to non-linear regime is indicated by the change of the storage modulus
from low strain plateau value to strain dependent values [146]. In case of PE/LDH nanocomposites, this
strain amplitude sweep tests were carried out at constant frequency of 10 rad/s and a temperature 240
℃. The results are shown in Figure 5.12. It is apparent that unfilled polyethylene melt show linear
viscoelastic behavior up to much larger strain compared to PE/LDH nanocomposites and the critical
strain for the former in present case lies within 25 – 30 % strain range. In case of nanocomposites, the
0.01 0.1 1 10 1000.4
0.6
0.8
1.0
1.2
approximate critical
strain for highest filled
PE/LDH nanocomposites
G´(
γ)/G
´ linea
r
γ0 (%)
LDPE
PE-LDH2
PE-LDH4
PE-LDH6
Figure 5.12 Strain dependence of the in-phase component stress response (storage modulus, normal-
ized w.r.t. linear value) during an oscillatory shear experiment
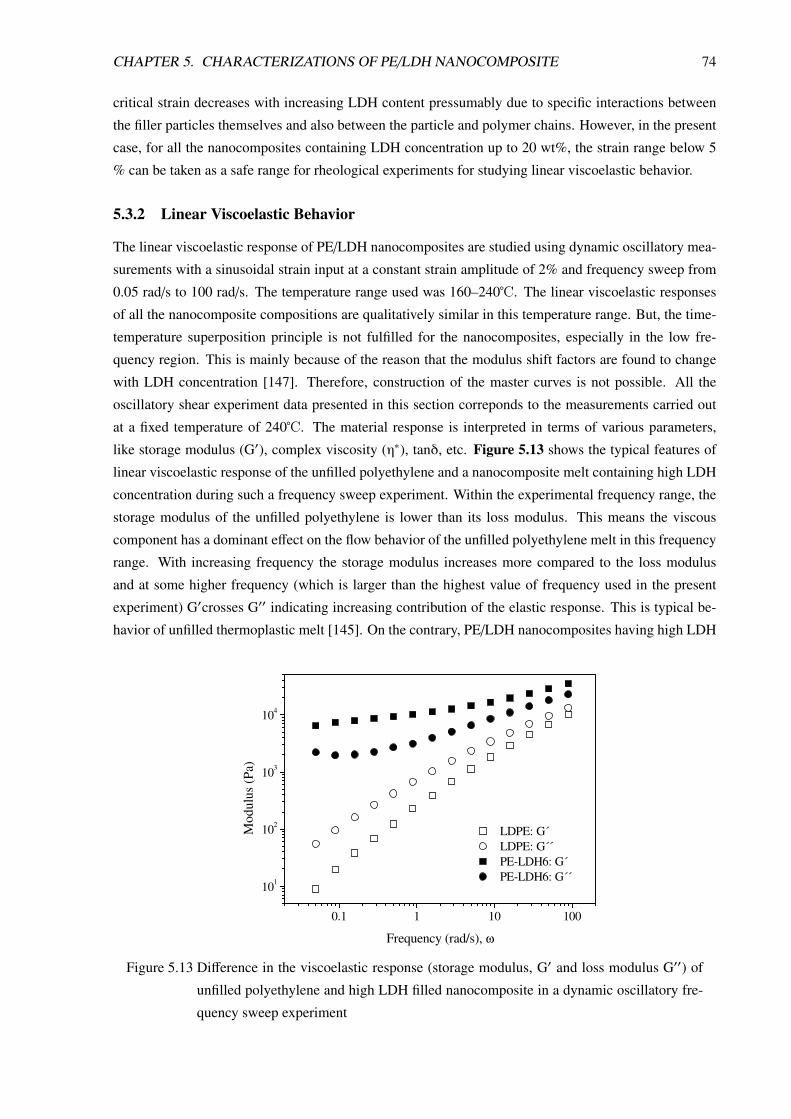
CHAPTER 5. CHARACTERIZATIONS OF PE/LDH NANOCOMPOSITE 74
critical strain decreases with increasing LDH content pressumably due to specific interactions between
the filler particles themselves and also between the particle and polymer chains. However, in the present
case, for all the nanocomposites containing LDH concentration up to 20 wt%, the strain range below 5
% can be taken as a safe range for rheological experiments for studying linear viscoelastic behavior.
5.3.2 Linear Viscoelastic Behavior
The linear viscoelastic response of PE/LDH nanocomposites are studied using dynamic oscillatory mea-
surements with a sinusoidal strain input at a constant strain amplitude of 2% and frequency sweep from
0.05 rad/s to 100 rad/s. The temperature range used was 160–240℃. The linear viscoelastic responses
of all the nanocomposite compositions are qualitatively similar in this temperature range. But, the time-
temperature superposition principle is not fulfilled for the nanocomposites, especially in the low fre-
quency region. This is mainly because of the reason that the modulus shift factors are found to change
with LDH concentration [147]. Therefore, construction of the master curves is not possible. All the
oscillatory shear experiment data presented in this section correponds to the measurements carried out
at a fixed temperature of 240℃. The material response is interpreted in terms of various parameters,
like storage modulus (G′), complex viscosity (η∗), tanδ, etc. Figure 5.13 shows the typical features of
linear viscoelastic response of the unfilled polyethylene and a nanocomposite melt containing high LDH
concentration during such a frequency sweep experiment. Within the experimental frequency range, the
storage modulus of the unfilled polyethylene is lower than its loss modulus. This means the viscous
component has a dominant effect on the flow behavior of the unfilled polyethylene melt in this frequency
range. With increasing frequency the storage modulus increases more compared to the loss modulus
and at some higher frequency (which is larger than the highest value of frequency used in the present
experiment) G′crosses G′′ indicating increasing contribution of the elastic response. This is typical be-
havior of unfilled thermoplastic melt [145]. On the contrary, PE/LDH nanocomposites having high LDH
0.1 1 10 100
101
102
103
104
Mod
ulus
(Pa)
Frequency (rad/s), ω
LDPE: G´ LDPE: G´´ PE-LDH6: G´ PE-LDH6: G´´
Figure 5.13 Difference in the viscoelastic response (storage modulus, G′ and loss modulus G′′) of
unfilled polyethylene and high LDH filled nanocomposite in a dynamic oscillatory fre-
quency sweep experiment

CHAPTER 5. CHARACTERIZATIONS OF PE/LDH NANOCOMPOSITE 75
content show completely different behavior. The storage modulus always remains higher than the loss
modulus within the experimental frequency range indicating dominant elastic character of the material.
This is typical behavior observed in crosslinked polymer or polymer gel, where viscous flow is restricted
by chemical constraints. In the present case, high concentration of LDH particles both in nano- and
microscales creates strong physical barrier against the mobility of the polymer chains. The influence
of increasing LDH concentration on linear viscoelastic response as discussed in the following sections
shows how liquid-like melt is gradually transforms into a solid-like melt.
Figure 5.13 also shows that the difference in viscoelastic response between unfilled melt and the
nanocomposite strongly depends on the frequency region at which they are compared. In the high fre-
quency range, due to a small time period in each shear cycle, the dispersed filler particles can not fluctuate
in phase with the oscillating shear force field and appears virtually static. As a result their influence is
minimized and materials behavior is solely determined the matrix behavior [143]. On the other hand,
at low frequencies the influence of the filler particles can be realized as they get more time to follow
the oscillating shear force field and if they interfere with flowability of the materials strong effects like
that presented in Figure 5.13 are observed. Therefore, in discussing the linear viscoelastic behavior of
nanocomposites the low frequency data are of prime importance.
The ability to store energy by any polymeric melt during shearing depends on its chain relaxation
behavior. Lower the relaxation time for a system faster it dissipates the energy and hence shows lower
value of storage modulus. In storage modulus versus frequency plot (Figure 5.14), the low frequency
data for unfilled polyethylene reflect this fact. At low frequencies due to longer time period of shear
cycles polymer chains get sufficient time to relax nearly completely showing low value of G′. This is
the typical behavior of Newtonian liquids. The addition of LDH filler causes an upward shift of the
low frequency G′ values, which becomes more prominent with increasing LDH concentration ultimately
0.1 1 10 100
101
102
103
104
Data below this frequency are fitted to G' ~ ωn
1
Stor
age
mod
ulus
(Pa)
, G'
Frequency (rad/s), ω
Symbol Sample Value of n1 in
G' ~ ωn1
LDPE 1.17 PE-LDH1 0.59 PE-LDH2 0.47 PE-LDH3 0.27 PE-LDH4 0.22 PE-LDH5 0.16 PE-LDH6 0.16
Figure 5.14 Storage modulus (G′) versus frequency (ω) plots for unfilled PE and PE/LDH nano-
composite melts based on the results obtained from dynamic oscillatory measurements.
The table on right the relaxation exponents obtained by fitting low frequency data to the
power law model
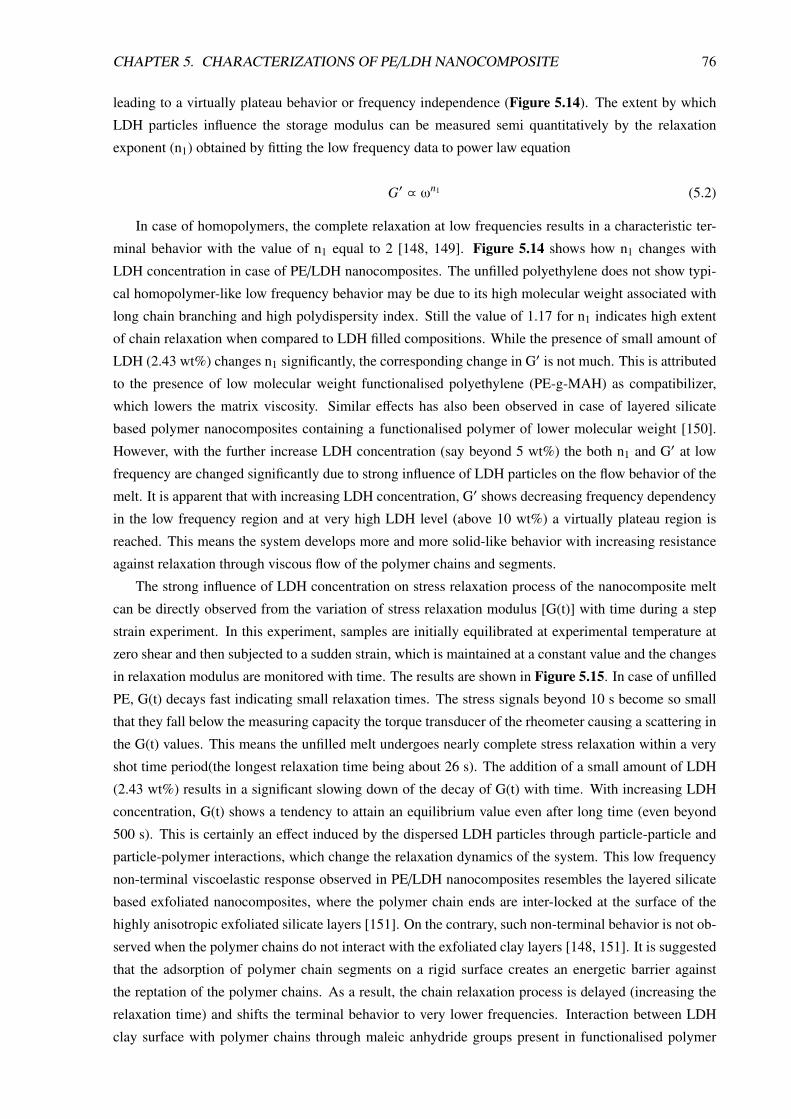
CHAPTER 5. CHARACTERIZATIONS OF PE/LDH NANOCOMPOSITE 76
leading to a virtually plateau behavior or frequency independence (Figure 5.14). The extent by which
LDH particles influence the storage modulus can be measured semi quantitatively by the relaxation
exponent (n1) obtained by fitting the low frequency data to power law equation
G′ ∝ ωn1 (5.2)
In case of homopolymers, the complete relaxation at low frequencies results in a characteristic ter-
minal behavior with the value of n1 equal to 2 [148, 149]. Figure 5.14 shows how n1 changes with
LDH concentration in case of PE/LDH nanocomposites. The unfilled polyethylene does not show typi-
cal homopolymer-like low frequency behavior may be due to its high molecular weight associated with
long chain branching and high polydispersity index. Still the value of 1.17 for n1 indicates high extent
of chain relaxation when compared to LDH filled compositions. While the presence of small amount of
LDH (2.43 wt%) changes n1 significantly, the corresponding change in G′ is not much. This is attributed
to the presence of low molecular weight functionalised polyethylene (PE-g-MAH) as compatibilizer,
which lowers the matrix viscosity. Similar effects has also been observed in case of layered silicate
based polymer nanocomposites containing a functionalised polymer of lower molecular weight [150].
However, with the further increase LDH concentration (say beyond 5 wt%) the both n1 and G′ at low
frequency are changed significantly due to strong influence of LDH particles on the flow behavior of the
melt. It is apparent that with increasing LDH concentration, G′ shows decreasing frequency dependency
in the low frequency region and at very high LDH level (above 10 wt%) a virtually plateau region is
reached. This means the system develops more and more solid-like behavior with increasing resistance
against relaxation through viscous flow of the polymer chains and segments.
The strong influence of LDH concentration on stress relaxation process of the nanocomposite melt
can be directly observed from the variation of stress relaxation modulus [G(t)] with time during a step
strain experiment. In this experiment, samples are initially equilibrated at experimental temperature at
zero shear and then subjected to a sudden strain, which is maintained at a constant value and the changes
in relaxation modulus are monitored with time. The results are shown in Figure 5.15. In case of unfilled
PE, G(t) decays fast indicating small relaxation times. The stress signals beyond 10 s become so small
that they fall below the measuring capacity the torque transducer of the rheometer causing a scattering in
the G(t) values. This means the unfilled melt undergoes nearly complete stress relaxation within a very
shot time period(the longest relaxation time being about 26 s). The addition of a small amount of LDH
(2.43 wt%) results in a significant slowing down of the decay of G(t) with time. With increasing LDH
concentration, G(t) shows a tendency to attain an equilibrium value even after long time (even beyond
500 s). This is certainly an effect induced by the dispersed LDH particles through particle-particle and
particle-polymer interactions, which change the relaxation dynamics of the system. This low frequency
non-terminal viscoelastic response observed in PE/LDH nanocomposites resembles the layered silicate
based exfoliated nanocomposites, where the polymer chain ends are inter-locked at the surface of the
highly anisotropic exfoliated silicate layers [151]. On the contrary, such non-terminal behavior is not ob-
served when the polymer chains do not interact with the exfoliated clay layers [148, 151]. It is suggested
that the adsorption of polymer chain segments on a rigid surface creates an energetic barrier against
the reptation of the polymer chains. As a result, the chain relaxation process is delayed (increasing the
relaxation time) and shifts the terminal behavior to very lower frequencies. Interaction between LDH
clay surface with polymer chains through maleic anhydride groups present in functionalised polymer

CHAPTER 5. CHARACTERIZATIONS OF PE/LDH NANOCOMPOSITE 77
0.01 0.1 1 10 100100
101
102
103
104
G(t
) (Pa
)
Time (s)
LDPE PE-LDH1 PE-LDH2 PE-LDH3 PE-LDH4 PE-LDH5
Figure 5.15 Step strain experiment showing how the stress relaxation modulus varies decays with
time in unfilled PE and in the PE/LDH nanocomposite melts having different LDH con-
centrations
has been observed. The morphological analysis of the PE/LDH nanocomposites at different loadings
discussed earlier and the fracture surface analysis of these nanocomposites show that polymer chains
are indeed adsorbed on the LDH particle surface and are also entrapped within loose particle clusters
[152]. The highly anisometric exfoliated LDH layers remains randomly dispersed in the matrix and in
the vicinity of larger particle agglomerates. With increasing LDH concentration, the number density of
the exfoliated layers increases, which decreases the average inter-particle distance. This may lead to
formation of localized domains of physical networked structure, where the nanostructured particles may
orient themselves in some preferential direction [147, 151, 153]. The shearing in low frequency region
can not generate sufficient force to destroy such structured domain resulting in fluctuation of individual
particles to oscillate with the shear force field. Also, close proximity and strong particle-particle inter-
action cause a kind of physical jamming leading to extremely slow relaxation of the particle phase as
well. As a result, this causes strong reinforcement of the melt producing high elastic modulus compared
to unfilled melt.
The variation of complex viscosity (|η∗—) with frequency and LDH concentration is shown in Fig-ure 5.16. The unfilled PE melt is characterized by a low frequency Newtonian flow behavior, which
transforms to shear thinning characteristic in the high frequency region. This is typical behavior of un-
filled polymeric melts (with only differences observed in the frequency region at which transition from
Newtonian to shear thinning behavior takes place depending on the molecular weight and the molecu-
lar architecture). The presence of nanostructured LDH particles in the melt not only enhances the melt
viscosity but also induces shear thinning character in the low frequency region. The frequency indepen-
dent viscosity of unfilled melt in the low frequency region is an indication that the shear force applied
in this region is not sufficient to disentangle the polymer chains and align them in the flow direction.
Such Newtonian behavior at low frequencies or low shear rate is also common in polymer composites
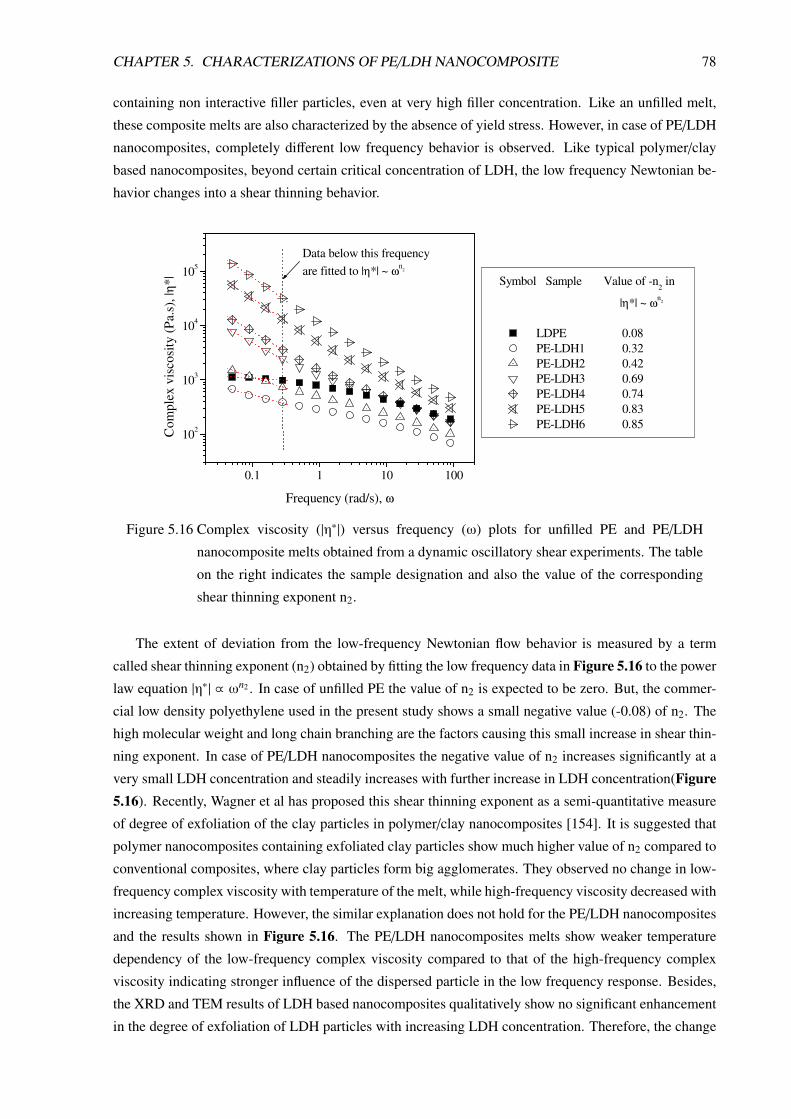
CHAPTER 5. CHARACTERIZATIONS OF PE/LDH NANOCOMPOSITE 78
containing non interactive filler particles, even at very high filler concentration. Like an unfilled melt,
these composite melts are also characterized by the absence of yield stress. However, in case of PE/LDH
nanocomposites, completely different low frequency behavior is observed. Like typical polymer/clay
based nanocomposites, beyond certain critical concentration of LDH, the low frequency Newtonian be-
havior changes into a shear thinning behavior.
0.1 1 10 100
102
103
104
105
Data below this frequency are fitted to |η*| ~ ωn
2
Symbol Sample Value of -n2 in
|η*| ~ ωn2
LDPE 0.08 PE-LDH1 0.32 PE-LDH2 0.42 PE-LDH3 0.69 PE-LDH4 0.74 PE-LDH5 0.83 PE-LDH6 0.85
Com
plex
vis
cosi
ty (P
a.s)
, |η*
|
Frequency (rad/s), ω Figure 5.16 Complex viscosity (|η∗|) versus frequency (ω) plots for unfilled PE and PE/LDH
nanocomposite melts obtained from a dynamic oscillatory shear experiments. The table
on the right indicates the sample designation and also the value of the corresponding
shear thinning exponent n2.
The extent of deviation from the low-frequency Newtonian flow behavior is measured by a term
called shear thinning exponent (n2) obtained by fitting the low frequency data in Figure 5.16 to the power
law equation |η∗| ∝ ωn2 . In case of unfilled PE the value of n2 is expected to be zero. But, the commer-
cial low density polyethylene used in the present study shows a small negative value (-0.08) of n2. The
high molecular weight and long chain branching are the factors causing this small increase in shear thin-
ning exponent. In case of PE/LDH nanocomposites the negative value of n2 increases significantly at a
very small LDH concentration and steadily increases with further increase in LDH concentration(Figure5.16). Recently, Wagner et al has proposed this shear thinning exponent as a semi-quantitative measure
of degree of exfoliation of the clay particles in polymer/clay nanocomposites [154]. It is suggested that
polymer nanocomposites containing exfoliated clay particles show much higher value of n2 compared to
conventional composites, where clay particles form big agglomerates. They observed no change in low-
frequency complex viscosity with temperature of the melt, while high-frequency viscosity decreased with
increasing temperature. However, the similar explanation does not hold for the PE/LDH nanocomposites
and the results shown in Figure 5.16. The PE/LDH nanocomposites melts show weaker temperature
dependency of the low-frequency complex viscosity compared to that of the high-frequency complex
viscosity indicating stronger influence of the dispersed particle in the low frequency response. Besides,
the XRD and TEM results of LDH based nanocomposites qualitatively show no significant enhancement
in the degree of exfoliation of LDH particles with increasing LDH concentration. Therefore, the change

CHAPTER 5. CHARACTERIZATIONS OF PE/LDH NANOCOMPOSITE 79
in the shear-thinning exponent as shown in Figure 5.16 is not due to enhancement of degree of exfoli-
ation. Rather, the increasing LDH concentration brings about two changes in the system, firstly, more
number of polymer chains/segments get interlocked on the LDH platelets surface or in the inter layer
region. Secondly, the average distance between the dispersed particles is decreased. These two factors
contribute though different mechanisms to the final properties of the nanocomposites. The interlocking
of the polymer chains on LDH platelets certainly restricts their mobility and hence delays their relaxation
process. This is reflected in so called zero shear viscosity of the melts. In case of unfilled PE and the
nanocomposites containing low amount of LDH, the well defined zero shear viscosity can be determined
Figure 5.16 by extrapolating the viscosity versus frequency curve to zero frequency. However, this does
not work at high LDH concentration as the complex viscosity versus frequency curves diverge as fre-
quency approaches zero indicating the presence of an yield stress value. Instead of zero shear viscosity,
the complex viscosities determined at low frequency (0.05 rad) are compared, an exponential dependence
on the LDH concentration is observed, which follows equation 5.3 and is shown in Figure 5.17.
η0 = ηPE ∗ exp(α ∗ φ) (5.3)
where, η0 is the low frequency complex viscosity, ηPE is the low frequency complex viscosity of the
unfilled PE and φ is the weight fraction of LDH in nanocomposite. Writing equation (5.2), the changes
in the matrix viscosity upon addition of the lower molecular weight MAH-g-PE fraction was not consid-
Figure 5.17 Viscosity at low frequency (0.05 rad) as a function of LDH concentration in PE/LDH
nanocomposites

CHAPTER 5. CHARACTERIZATIONS OF PE/LDH NANOCOMPOSITE 80
ered. The exponent α ≈ 30 is significantly larger than that expected in the case of pure hydrodynamic
reinforcement (2.5 for spheres [155]) and can be explained by a build-up of a filler network structure
similar to that in the filled elastomers [156]. This also helps us to understand why nanocomposites
show strong shear thinning behavior beyond some critical clay concentration. The formation of network
structure (more specifically, sub network structures due to the formation of structured domains) by the
nanostructured clay particles beyond certain critical filler concentration induces solid-like behavior in
the melt showing high viscosity and elastic modulus. During low-strain and low frequency oscillatory
shearing, matrix mobility is severely restricted by such particulate domain. However, as the shearing
become more intense with increasing frequency or strain, the network structures start getting disturbed
and at sufficiently high frequency or shear rate they may be completely destroyed with shear induced
alignment of the clay particles in the flow direction. As a result, melt rheology at this stage is solely
influenced by the matrix showing strong temperature dependence. The elastic nature of the melt is also
reduced by such alignment [147]. Additionally, the polymer chains which are entrapped between particle
clusters or constrained by the clay particles through intercalation and adsorption, experience larger effec-
tive strain compared to unconfined chains [157]. This can lead to enhanced shear thinning behavior of
the nanocomposite melts at low shear rate experienced during low frequency oscillatory measurements
[150, 158].
5.3.3 Non-Linear Viscoelastic Behavior
It is known that shearing polymeric melts within linear viscoelastic regime does not destroy their mi-
crostructures, but may cause reorganization with respect to the direction of flow. In many practical
situations, however, these materials often experience much severe shearing with high strain or strain
rate. For example, during extrusion rotational motion of the extruder screw generates sufficient shear
rate that the linear stress-strain relation is hardly followed. Such strong shearing is often necessary to
facilitate breakdown of larger filler particles for achieving better dispersion in filled polymer composites.
Therefore, characterizing polymer melts in non-linear viscoelastic regime bears direct correspondence
to the actual melt processing conditions. The shearing of polymeric melts in non-linear regime causes
changes in the internal structure of the system, which can be more pronounced in case of filled system,
especially when the filler particles show strong interaction among themselves. Such filled polymeric
melts usually exhibit thixotropic effect. This means during shearing, the various microstructures suffer
structural breakdown whose extent depends on the magnitude and duration of the shear force and when
shearing is stopped regeneration of the structures takes place with time [143]. The breakdown and regen-
eration of the microstructures both being time dependent processes introduce additional time constants
in the response behavior of the melt toward non-linear shearing. To investigate this structural breakdown
and regeneration processes in case of present system, the sample melts were subjected to shear cycles
constituted of three steps as follows:
I. In the first step sample was sheared at a constant steady shear rate (+γ) till an apparent steady state
is reached. This step is called preshearing cycle.
II. In the second step, the shearing was stopped and the sample was allowed stay in quiescent state for
variable time. This step is called rest period.

CHAPTER 5. CHARACTERIZATIONS OF PE/LDH NANOCOMPOSITE 81
III. In the third and final step samples were sheared using the same shear rate as in the first step, but in
opposite direction (i.e. −γ). This step is called flow reversal step.
To provide identical flow history, all the test samples were equilibrated at the test temperature for
about 10 minutes before the preshearing cycle. The purpose behind carrying out such step-wise shearing,
was to subject the system to high strain shearing in the first step so that the microstructures present within
the system are ruptured and during the rest period shearing force was withdrawn in order to ensure the
structural regeneration under static condition. The length of the rest period was varied expecting its
influence on the extent of structural rebuild-up. The flow reversal step was carried out to observe the
effect of the regenerated structure and its response during steady shear. This type of step shearing has
previously been employed to study similar effects in solutions of liquid crystalline polymers by Walker
and co-workers [159] and later applied by others in case of polymer/layered silicate nanocomposites
[150, 160]. In the present case, unfilled polyethylene was first characterized to understand the behavior
of PE matrix alone during steady shear and rest period, especially with different shear rates and rest
periods.
5.3.3.1 Non-linear rheological behavior of unfilled PE
The PE used in the present investigation is a low density and high molecular weight commercial polymer.
This type of PE is characterized by long chain branching and multiple branch points on a single poly-
mer chain. Therefore, it is obvious that the polymer chains form much higher extent of entanglements
compared to the polyethylenes having no or very small number of branching. The multiple long chain
branching causes more sterric hindrance against the chain disentanglement process under the influence
of applied stress. These chain entanglements are viewed as the microstructures acting as the energetic
barrier against the viscous flow and are the root cause of non-linear rheological response during shearing
at high shear rate and high strain. The response of this polyethylene melt during steady shearing is shown
in Figure 5.18.
In Figure 5.18A, stress response of unfilled polyethylene at low constant shear rate is characterized
by a monotonous increase in stress with time until a steady state is reached. With increasing shear rate
a tendency to form a stress maximum (more specifically a broad maximum) before attaining the steady
state is observed. With further increase in shear rate, this stress maximum (stress overshoot) becomes
more prominent and its position is shifted to the left on the time axis. Such non-linear flow behavior is
well known and theoretically described in case of high-molecular-weight polymer melts and concentrated
polymer solutions [161–163].
Under the influence of shear flow, the process of stress development and its relaxation in a polymeric
melt can be explained in terms of the various kinds of motions, their relative time scales and the influ-
ence of chain entanglements. In a concentrated solution or melt of a high molecular weight polymer,
each polymer chain forms entanglements with the neighboring chains and itself. The molecular weight
of the chain segment between two adjacent entanglement points (Me) is very important parameter in
understanding the polymer chain dynamics. According to Doi-Edward’s theory the movements of such
entangled polymer chains are described by two different kinds of motion [163, 164]. The first kind is the
small scale wriggling motion confined within the chain segments between the entanglements originating
from the changing conformational topology of the monomer units. The characteristic time scale of this
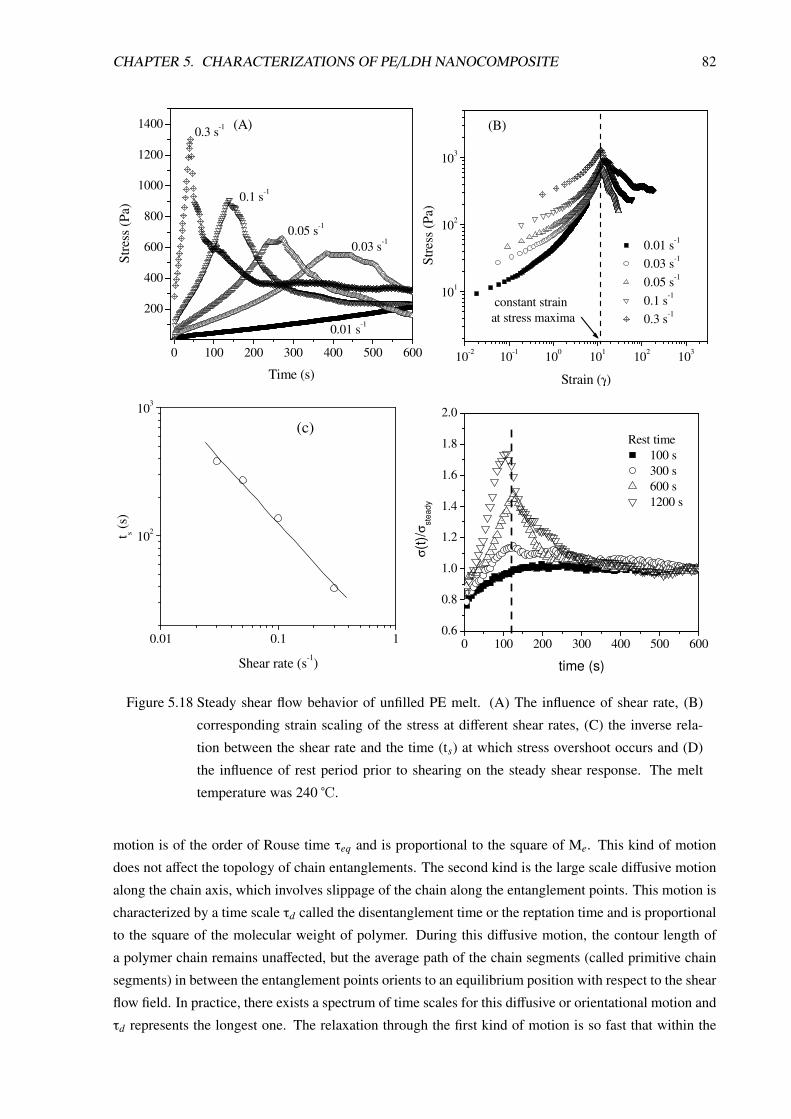
CHAPTER 5. CHARACTERIZATIONS OF PE/LDH NANOCOMPOSITE 82
0 100 200 300 400 500 600
200
400
600
800
1000
1200
1400
10-2 10-1 100 101 102 103
101
102
103
0.3 s-1
0.1 s-1
0.05 s-1
0.03 s-1
0.01 s-1
(A)St
ress
(Pa)
Time (s)
constant strainat stress maxima
(B)
0.01 s-1
0.03 s-1
0.05 s-1
0.1 s-1
0.3 s-1
Stre
ss (P
a)
Strain (γ)
0.01 0.1 1
102
103
(c)
t s (s)
Shear rate (s-1)
0 100 200 300 400 500 6000.6
0.8
1.0
1.2
1.4
1.6
1.8
2.0σ(
t)/σ st
eady
time (s)
Rest time 100 s 300 s 600 s 1200 s
Figure 5.18 Steady shear flow behavior of unfilled PE melt. (A) The influence of shear rate, (B)
corresponding strain scaling of the stress at different shear rates, (C) the inverse rela-
tion between the shear rate and the time (ts) at which stress overshoot occurs and (D)
the influence of rest period prior to shearing on the steady shear response. The melt
temperature was 240 ℃.
motion is of the order of Rouse time τeq and is proportional to the square of Me. This kind of motion
does not affect the topology of chain entanglements. The second kind is the large scale diffusive motion
along the chain axis, which involves slippage of the chain along the entanglement points. This motion is
characterized by a time scale τd called the disentanglement time or the reptation time and is proportional
to the square of the molecular weight of polymer. During this diffusive motion, the contour length of
a polymer chain remains unaffected, but the average path of the chain segments (called primitive chain
segments) in between the entanglement points orients to an equilibrium position with respect to the shear
flow field. In practice, there exists a spectrum of time scales for this diffusive or orientational motion and
τd represents the longest one. The relaxation through the first kind of motion is so fast that within the

CHAPTER 5. CHARACTERIZATIONS OF PE/LDH NANOCOMPOSITE 83
time scale of practical rheological experiments its influence is never realised. Therefore, the theoretical
explanation of the non-linear rheological response of concentrated polymer solutions or melts is based
only on the orientation effects of the primitive chain segments under applied stress [162–164].
In the present case, with unfilled PE melt, the strain scaling of stress developed during steady shear
(Figure 5.18B) indicates that the strain at which stress maximum is observed is independent of the
shear rate within the experimental range. This means that within the limit of experimental shear rate, the
polymer chains always maintain their equilibrium contour length and do not suffer chain length extension
[162, 164, 165]. At low shear rates, when τd ∗ γ � 1, the relaxation of the primitive chain segments
to the new equilibrium position at the steady state takes place within the experimental time scale. As a
results, monotonous increase in the stress is observed with time till the steady state is reached when all
the chains attains their equilibrium orientation with respect to the shear flow field. With the unfilled PE,
such monotonous increase in stress with steady shear was observed below γ < 0.03s−1.
At moderate shear rates (τd ∗ γ � 1), when diffusive or orientational relaxation time (τd) is compa-
rable or less than the experimental time scale (1/γ), the rate of chain relaxation is smaller than the rate
at which they gain energy by the applied shear stress [165]. This results in an excessive stress build up
in the polymer chains compared to the steady state, which is manifested as the stress overshoot at the
beginning of flow during steady shearing as observed in Figure 5.18A above γ > 0.03s−1. As the shear
rate is further increased within the limit τeq ∗ γ < 1, the appearance of the stress overshoot peak becomes
more intense and at shorter time, but necessarily at the same constant strain Figure 5.18B.
Doi-Edward’s theory also predicts a constant strain γ (= γ ∗ t) equal to 2 at which stress overshoot
appears for linear polymers. However, in the present case γ has been observed at about 12, which can not
be explained by original Doi-Edwards theory [162, 164]. The similar deviation have also been reported
in case of commercial PE and other high molecular weight branched polymers [166]. The experimental
results shows that ts (the time at which stress overshoot appears) varies inversely with γ as shown in
Figure 5.18C, which resemble the observation made by Wagner [167] in case of highly branched low
density PE. He also reported a constant strain of γ ∗ t = 7 for stress maximum during steady shear. Such
deviation is attributed mainly to extensive chain branching and much more complex and energy intensive
chain dynamics associated with commercial low density PE melts [166, 168].
In addition to the influence of shear rate, another important aspect, namely shear history of the melt,
strongly influences the non-linear response of the melt. In case of unfilled PE, this was investigated
through flow reversal experiment described earlier. The shear rate applied during this experiment was
0.3s−1 and melt temperature of 240℃. The effect of rest period on the stress growth during the flow
reversal step was examined and the results are presented in Figure 5.18D. It is interesting to note that at
low rest period (300 s or below), unfilled PE melt does not show any overshoot. When the rest period is
increased, a distinct overshoot appears at the beginning of steady shearing in the flow reversal step, whose
magnitude increases with increasing duration of the rest period. It seems also apparent that the time at
which stress overshoot appears remains independent of the rest period, which means the strain at stress
maximum is also independent of the rest period. Similar behavior has also been observed previously
in case of polyisobutylene (PIB) solution [161]. The physical interpretation of the dependence of stress
overshoot can be given in terms of relaxation from the equilibrium orientation of the primitive chain
segments with respect to the applied shear flow field. In absence of shearing, the equilibrium state is
characterized by the random orientation of the primitive chain segments. The preshearing step during
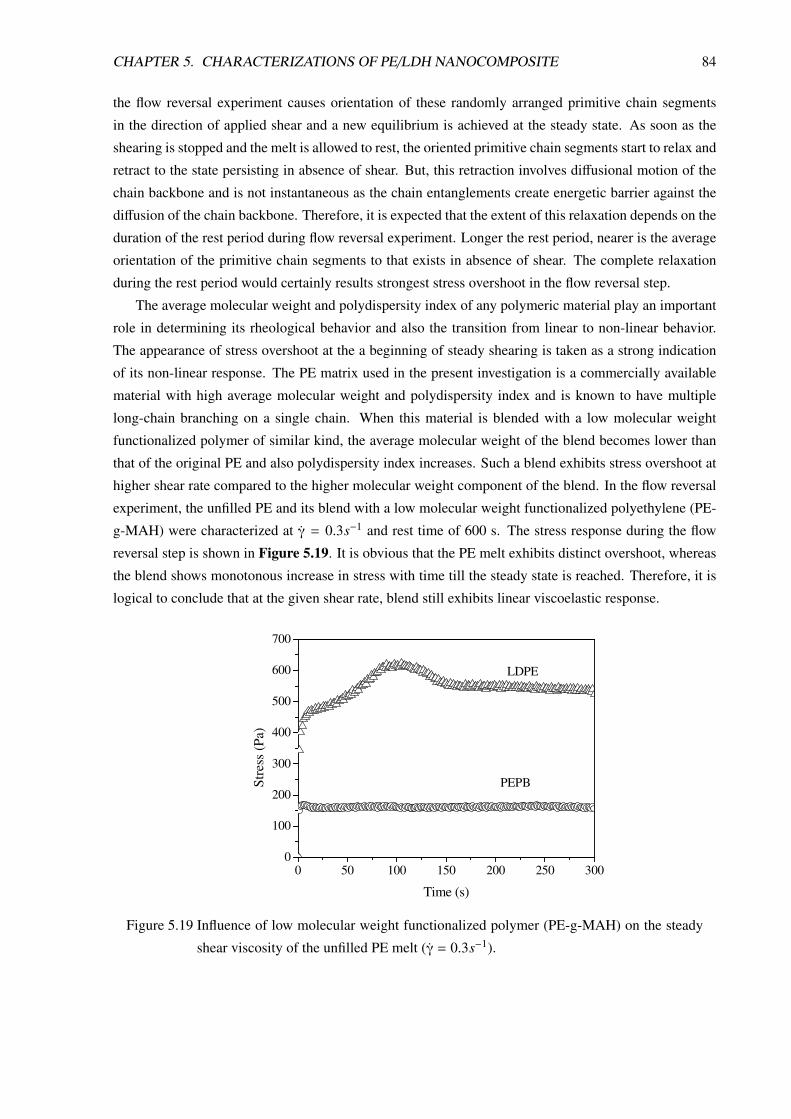
CHAPTER 5. CHARACTERIZATIONS OF PE/LDH NANOCOMPOSITE 84
the flow reversal experiment causes orientation of these randomly arranged primitive chain segments
in the direction of applied shear and a new equilibrium is achieved at the steady state. As soon as the
shearing is stopped and the melt is allowed to rest, the oriented primitive chain segments start to relax and
retract to the state persisting in absence of shear. But, this retraction involves diffusional motion of the
chain backbone and is not instantaneous as the chain entanglements create energetic barrier against the
diffusion of the chain backbone. Therefore, it is expected that the extent of this relaxation depends on the
duration of the rest period during flow reversal experiment. Longer the rest period, nearer is the average
orientation of the primitive chain segments to that exists in absence of shear. The complete relaxation
during the rest period would certainly results strongest stress overshoot in the flow reversal step.
The average molecular weight and polydispersity index of any polymeric material play an important
role in determining its rheological behavior and also the transition from linear to non-linear behavior.
The appearance of stress overshoot at the a beginning of steady shearing is taken as a strong indication
of its non-linear response. The PE matrix used in the present investigation is a commercially available
material with high average molecular weight and polydispersity index and is known to have multiple
long-chain branching on a single chain. When this material is blended with a low molecular weight
functionalized polymer of similar kind, the average molecular weight of the blend becomes lower than
that of the original PE and also polydispersity index increases. Such a blend exhibits stress overshoot at
higher shear rate compared to the higher molecular weight component of the blend. In the flow reversal
experiment, the unfilled PE and its blend with a low molecular weight functionalized polyethylene (PE-
g-MAH) were characterized at γ = 0.3s−1 and rest time of 600 s. The stress response during the flow
reversal step is shown in Figure 5.19. It is obvious that the PE melt exhibits distinct overshoot, whereas
the blend shows monotonous increase in stress with time till the steady state is reached. Therefore, it is
logical to conclude that at the given shear rate, blend still exhibits linear viscoelastic response.
0 50 100 150 200 250 3000
100
200
300
400
500
600
700
PEPB
LDPE
Stre
ss (P
a)
Time (s) Figure 5.19 Influence of low molecular weight functionalized polymer (PE-g-MAH) on the steady
shear viscosity of the unfilled PE melt (γ = 0.3s−1).

CHAPTER 5. CHARACTERIZATIONS OF PE/LDH NANOCOMPOSITE 85
5.3.3.2 Non-Linear Rheological Behavior of PE/LDH Nanocomposites
The response of PE/LDH nanocomposites containing different amounts of LDH and PE-g-MAH (ratio
of LDH to PE-g-MAH is always constant) at γ = 0.3s−1 and two different rest periods (100 s and 600 s)
is shown in Figure 5.20, where the stress growth during the flow reversal step has been plotted against
the time of shearing. When the rest period is small (100 s), the nanocomposites endow qualitatively
similar behavior irrespective of LDH concentration i.e. the stress increases monotonously with time
till the steady state is reached. However, the steady state viscosity of the melt increases with LDH
concentration, whose effect is partly counter balanced by the simultaneously increasing amount of PE-
g-MAH. This means that LDH particles have definite reinforcing effect on the polyethylene melt. At
large rest period, for example 600 s, both the PE and the nanocomposites exhibit stress overshoot at the
0 50 100 150 200 250 3000
400
800
1200
1600
2000
2400
0 50 100 150 200 250 3000
400
800
1200
1600
2000
2400
LDPE PE-LDH2 PE-LDH3 PE-LDH4
(B)
Rest time = 600 s
Stre
ss (P
a)
Time (s)
(A)
Rest time = 100 s
Stre
ss (P
a)
Time (s)
LDPE PE-LDH2 PE-LDH3 PE-LDH4
Figure 5.20 Effect of LDH concentration on the stress growth during the flow reversal step in the
flow reversal experiment (shearing was carried out for 600 s, but the steady state is
reached within 300 s; (γ = 0.3s−1).
CHAPTER 5. CHARACTERIZATIONS OF PE/LDH NANOCOMPOSITE 86
beginning of the flow in the flow reversal step. The nature of stress overshoot peak in nanocomposites
(both in terms of its position and magnitude) is completely different from that observed in PE. In later it
is rather broad and the time at which it appears (tmax) is at around 125 s after the beginning of the flow.
Whereas, in case of nanocomposites, the stress overshoot peaks are much more well defined and sharper.
Also the tmax is at around 8 s and the magnitude of the stress overshoot peak increases with increasing
LDH concentration.
When the stress growth shown in Figure 5.20B is scaled against the strain (γ ∗ t), the strain at which
stress maximum appears is found to be much smaller in the nanocomposites. This means that in the
nanocomposites, the microstructures are disturbed at much lower strain in comparison to the unfilled
melt. Similar behavior is also observed during dynamic oscillatory shearing with increasing strain am-
plitude at constant low frequency. The linear relation between the storage modulus and strain amplitude
is transformed to a non-linear one at much lower strain amplitudes in the nanocomposites depending on
the LDH concentration (Figure 5.12). Again, while comparing with the unfilled melt, the influence of
PE-g-MAH should also be considered, whose presence shifts the critical shear rate (at which stress over-
shoot appears) to a higher value. It is thus apparent that this difference in shear growth observed during
flow reversal step between the nanocomposites and the unfilled PE is due to the presence of LDH par-
ticles. Such unusual flow behavior during steady shearing is not common in conventional particle filled
composites at so low filler concentrations, where particle-particle and particle-polymer interactions are
not very strong. The significant difference in the tmax values between the unfilled and the LDH filled
melts is an indication that the LDH particles, even in small concentration, considerably alters the flow
dynamics of the polymer chains. Additionally, the contribution from the particle phase alone plays an
important role in determining the stress developed in the nanocomposite melts during steady shearing.
The linear viscoelastic behavior and the morphological features of PE/LDH nanocomposites discussed
earlier showed that the dispersed LDH particles not only interact among themselves, but also with the
polymer chains. As a result, in addition to chain entanglements, possible polymer-filler interaction im-
poses another degree of energetic barrier against the movement of the polymer chains under shear. The
relaxation process in the nanocomposite melt becomes slower, which causes higher stress build-up at the
beginning of steady shearing. The net outcome of all these effects is the appearance of stronger stress
overshoot peak at much shorter time in PE/LDH nanocomposites in the flow reversal step.
Several researchers have tried to explain this type of stress overshoot behavior both qualitatively and
theoretically in case of filled polymer melts [144, 150, 169, 170]. It is generally accepted that this stress
overshoot is related to the accumulation of stress in the particle phase and its subsequent release due to
rupture of these various particulate structures. In case of polymer/clay nanocomposites, such particulate
structures mainly consist of physically associated particulate domains or localized network structures
both in microscale (formed by the primary clay particles) and in nanoscale (formed by the exfoliated
clay layers) [150]. When the nanocomposite melt is subjected to shearing, both the particle phase and
the matrix phase respond according to their characteristic structural rigidities. The elastic modulus of the
particulate structure is certainly much higher than that of the polymer matrix. This is because the force
that facilitates the formation of various particulate structures in the melt state is usually of electrostatic in
nature coupled with thermodynamic incompatibility between the particle and the polymer phases. In case
of LDH clay particles, this is indeed very strong because of its high surface charge density. Whereas,
in case of unfilled PE melt, the elasticity is mostly related to the chain entanglement and its degree,
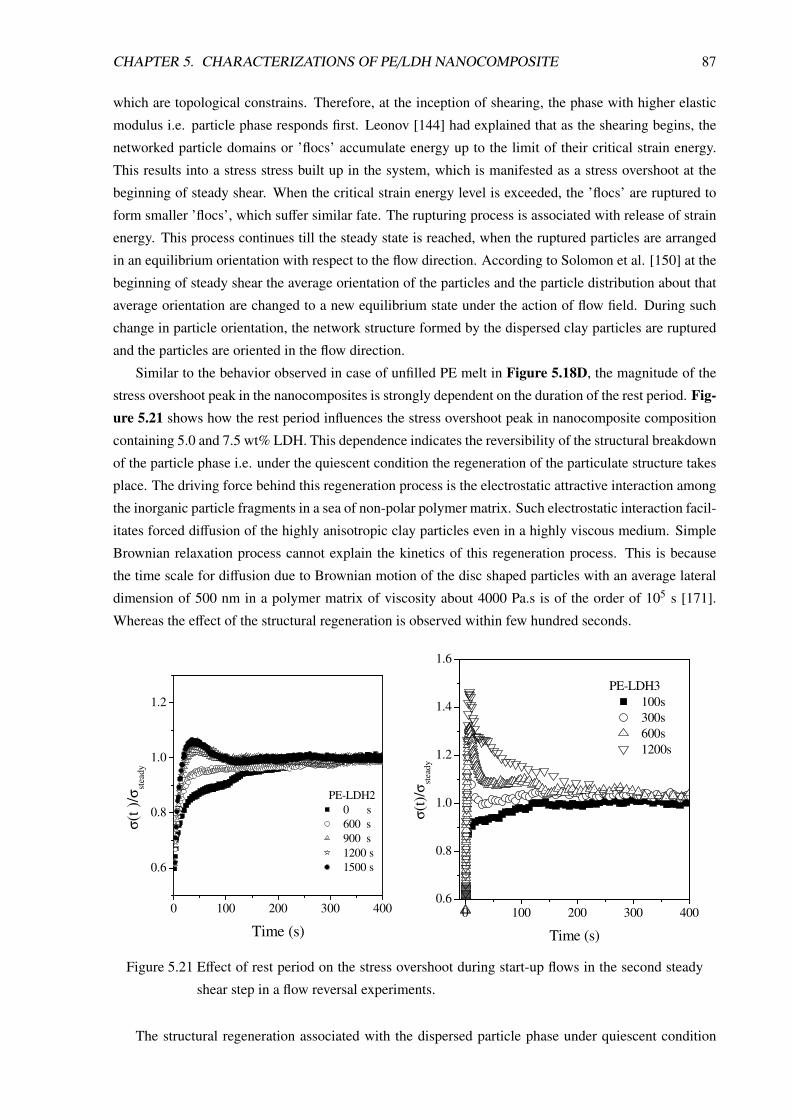
CHAPTER 5. CHARACTERIZATIONS OF PE/LDH NANOCOMPOSITE 87
which are topological constrains. Therefore, at the inception of shearing, the phase with higher elastic
modulus i.e. particle phase responds first. Leonov [144] had explained that as the shearing begins, the
networked particle domains or ’flocs’ accumulate energy up to the limit of their critical strain energy.
This results into a stress stress built up in the system, which is manifested as a stress overshoot at the
beginning of steady shear. When the critical strain energy level is exceeded, the ’flocs’ are ruptured to
form smaller ’flocs’, which suffer similar fate. The rupturing process is associated with release of strain
energy. This process continues till the steady state is reached, when the ruptured particles are arranged
in an equilibrium orientation with respect to the flow direction. According to Solomon et al. [150] at the
beginning of steady shear the average orientation of the particles and the particle distribution about that
average orientation are changed to a new equilibrium state under the action of flow field. During such
change in particle orientation, the network structure formed by the dispersed clay particles are ruptured
and the particles are oriented in the flow direction.
Similar to the behavior observed in case of unfilled PE melt in Figure 5.18D, the magnitude of the
stress overshoot peak in the nanocomposites is strongly dependent on the duration of the rest period. Fig-ure 5.21 shows how the rest period influences the stress overshoot peak in nanocomposite composition
containing 5.0 and 7.5 wt% LDH. This dependence indicates the reversibility of the structural breakdown
of the particle phase i.e. under the quiescent condition the regeneration of the particulate structure takes
place. The driving force behind this regeneration process is the electrostatic attractive interaction among
the inorganic particle fragments in a sea of non-polar polymer matrix. Such electrostatic interaction facil-
itates forced diffusion of the highly anisotropic clay particles even in a highly viscous medium. Simple
Brownian relaxation process cannot explain the kinetics of this regeneration process. This is because
the time scale for diffusion due to Brownian motion of the disc shaped particles with an average lateral
dimension of 500 nm in a polymer matrix of viscosity about 4000 Pa.s is of the order of 105 s [171].
Whereas the effect of the structural regeneration is observed within few hundred seconds.
0 100 200 300 400
0.6
0.8
1.0
1.2
σ(t )
/σst
eady
Time (s)
PE-LDH2 0 s 600 s 900 s 1200 s 1500 s
0 100 200 300 4000.6
0.8
1.0
1.2
1.4
1.6
σ(t)
/σst
eady
Time (s)
PE-LDH3 100s 300s 600s 1200s
Figure 5.21 Effect of rest period on the stress overshoot during start-up flows in the second steady
shear step in a flow reversal experiments.
The structural regeneration associated with the dispersed particle phase under quiescent condition

CHAPTER 5. CHARACTERIZATIONS OF PE/LDH NANOCOMPOSITE 88
and the effect of the regenerated structure on the transient response during steady shearing followed
immediately after the quiescent period was also studied in case of flocculated suspension of TiO2 by
Lapasin et al. [172]. They used oscillatory time sweep at a low strain amplitude and a low frequency
during the quiescent period to monitor the change in storage modulus of the melt with time. The idea
behind this experiment was stemmed from the fact that shearing at low strain and frequency does not
disturb the particulate structure in the suspension. Similar investigation has been carried out with un-
filled polyethylene melt and the PE/LDH nanocomposites during flow reversal experiment. The results
are shown in Figure 5.22. The oscillatory shear measurement during a long rest period shows striking
difference between the unfilled PE and the nanocomposites. In the former, the storage modulus increases
marginally with increasing rest time whereas, in the nanocomposites an exponential increase of the stor-
age modulus is observed that does not reach the steady value within the experimental time. The strong
increase in storage modulus under nearly quiescent condition shows a direct evidence of the structural
build-up in the system. It is obvious that the ruptured LDH particles oriented in the preshearing step
start to reorganize from their stress induced equilibrium state and approach to a new equilibrium dis-
persion state that prevails in absence of shear. In case of PE/LDH nanocomposite and similar systems
101 102 103
500
1000
1500
2000
2500
3000
3500
0 50 100 150 200 250 3000
1000
2000
3000
4000
5000(A)
Stor
age
mod
ulus
(MPa
)
Time (s)
(B)
Stre
ss (M
Pa)
Time (s)
LDPE PE + 4.72 wt% LDH (1:4) PE + 8.95 wt% LDH (1:2)
300 s
s
0.3 - 1
- 0.3 - 1
γ .
300
0.3 - 1
- 0.3 - 1
t rest γ .
Figure 5.22 The experimental results showing how the storage modulus (measured by applying low
amplitude (1.0%) and low frequency (1 rad/s) dynamic oscillatory shearing during rest
period trest) changes with time (A) and the corresponding transient steady shear response
followed after the rest period (B). (The ratio shown in bracket indicates the ratio of LDH
and functionalized polymer in the nanocomposites)
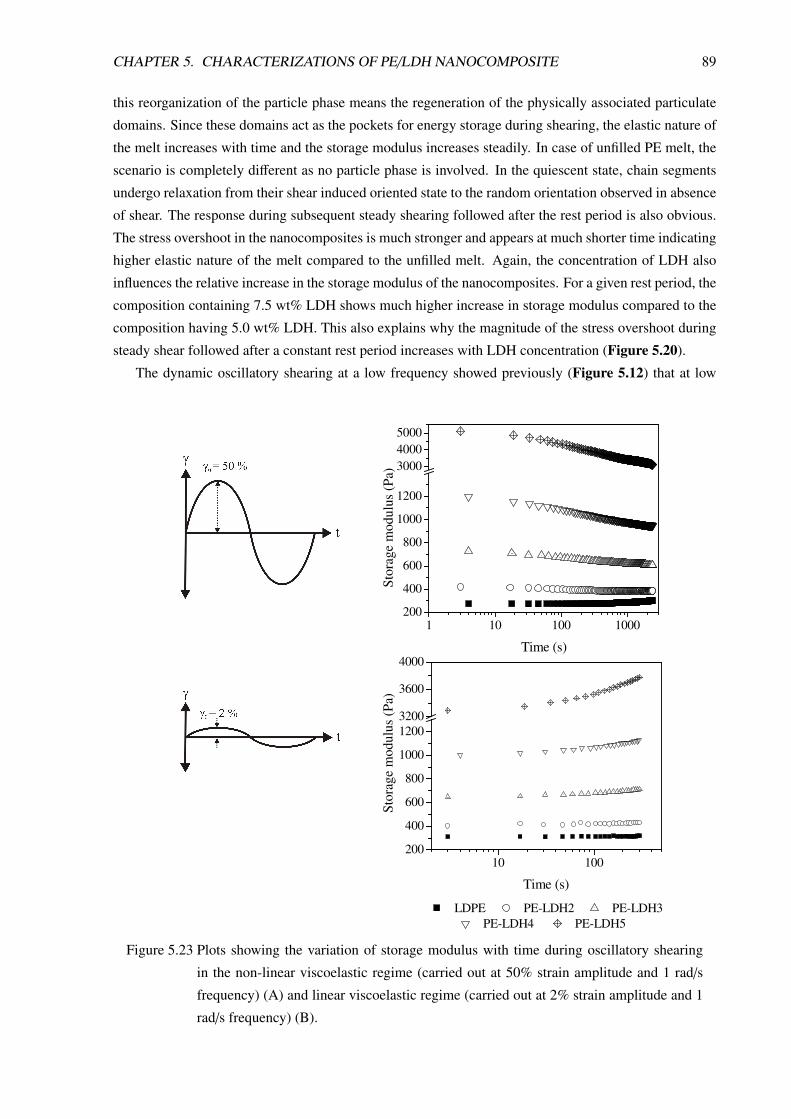
CHAPTER 5. CHARACTERIZATIONS OF PE/LDH NANOCOMPOSITE 89
this reorganization of the particle phase means the regeneration of the physically associated particulate
domains. Since these domains act as the pockets for energy storage during shearing, the elastic nature of
the melt increases with time and the storage modulus increases steadily. In case of unfilled PE melt, the
scenario is completely different as no particle phase is involved. In the quiescent state, chain segments
undergo relaxation from their shear induced oriented state to the random orientation observed in absence
of shear. The response during subsequent steady shearing followed after the rest period is also obvious.
The stress overshoot in the nanocomposites is much stronger and appears at much shorter time indicating
higher elastic nature of the melt compared to the unfilled melt. Again, the concentration of LDH also
influences the relative increase in the storage modulus of the nanocomposites. For a given rest period, the
composition containing 7.5 wt% LDH shows much higher increase in storage modulus compared to the
composition having 5.0 wt% LDH. This also explains why the magnitude of the stress overshoot during
steady shear followed after a constant rest period increases with LDH concentration (Figure 5.20).
The dynamic oscillatory shearing at a low frequency showed previously (Figure 5.12) that at low
1 10 100 1000200
400
600
800
1000
1200
300040005000
10 100200
400
600
800
1000
12003200
3600
4000
LDPE PE-LDH2 PE-LDH3 PE-LDH4 PE-LDH5
Stor
age
mod
ulus
(Pa)
Time (s)
Stor
age
mod
ulus
(Pa)
Time (s)
Figure 5.23 Plots showing the variation of storage modulus with time during oscillatory shearing
in the non-linear viscoelastic regime (carried out at 50% strain amplitude and 1 rad/s
frequency) (A) and linear viscoelastic regime (carried out at 2% strain amplitude and 1
rad/s frequency) (B).

CHAPTER 5. CHARACTERIZATIONS OF PE/LDH NANOCOMPOSITE 90
strain amplitude the storage modulus of the nanocomposite melts remains constant and independent of
the applied strain. But, above a certain critical strain (dependent on the LDH concentration), it decreases
with increasing strain. This critical strain defines the strain limit at which linear viscoelastic response of
the melt is transformed into non-linear one. Therefore, in principle, the kinetics of the structural break-
down of the microstructures and their regeneration processes can be investigated by subjecting the melts
to two consecutive oscillatory shearing steps at constant frequency. First in the non-linear viscoelastic
regime at strain 50 % (at a strain amplitude when both unfilled polyethylene and the nanocomposites
shows strain dependent modulus) to study the structural breakdown with time and second in the linear
viscoelastic regime at strain 2 % (at a strain when modulus is independent of strain amplitude) to study
the regeneration of the structures. During both the shearing steps, storage modulus was monitored with
time and the results are shown in Figure 5.23.
In Figure 5.23A, it can be observed that in case of PE/LDH nanocomposites, the storage modulus
decreases with time. The continuous shearing at high strain amplitude causes structural breakdown in
the nanocomposites resulting in a loss of their elastic character. It is also apparent that during the initial
phase storage modulus decreases at faster rate and then approaches a steady state. At the beginning of
shearing, the nanocomposite melts are in a state where relatively large aggregated structures and struc-
tured domains prevail and the rate of structure breakdown depends on their size and the shear rate [173].
As the shearing continues the average size of these microstructures is progressively reduced and hence
also the rate of structure breakdown. When the steady state is achieved, their exists an equilibrium be-
tween structure breakdown and regeneration process. At this stage, the size of the particle aggregates
and the structured domains are determined solely by the applied shear rate. The effect of LDH concen-
tration on the rate of structure breakdown is also obvious as it determines both the extent and size of
the structural association among the dispersed particles. Higher is the concentration of LDH, larger is
the size and number density of particle aggregates and structured domains. On the contrary, in Figure5.23 the changes in storage modulus of the unfilled polyethylene is insignificant in comparison to the
nanocomposites. It shows a small increase in shear modulus after prolonged period of shearing. This
can be due increase in molecular weight due to continuous shearing in the rheometer chamber at elevated
temperature for long period. This seems logical as such increase in molecular weight is also observed in
case of unfilled polyethylene after extrusion in twin screw extruder at 200 ℃.
In Figure 5.23B, the effect of structure regeneration on the storage modulus of the nanocomposite
melts is apparent. Since the shearing at low amplitude and low frequency does not affect the microstruc-
tures within a polymeric melt, the second shearing step can be treated as equivalent to the rest period
previously described in the flow reversal experiment. During this shearing step the diffusion kinetics
of the dispersed LDH particles are not affected by the small strain amplitude. As a result, the structure
break down process stops and the force that generates elastic strain within particulate structure (ulti-
mately leading to their breakdown) disappears. Consequently, the separated and oriented particles start
to regenerate the structural features characteristic of the zero shear equilibrium state. Simple Brownian
motion can not be held responsible for this regeneration process as the actual time scale of this regenera-
tion process is much shorter as compared to the one obtained from Brownian dynamics involving highly
anisotropic clay particles. Rather, a strong attractive interaction among the dispersed clay particles and
thermodynamic incompatibility between the particle and polymer phase facilitate such fast diffusion of
the clay particles within a highly viscous medium [150]. The structure regeneration causes exponential

CHAPTER 5. CHARACTERIZATIONS OF PE/LDH NANOCOMPOSITE 91
increase in the storage modulus of the melt, which did not achieve steady state within the applied time
period during the experiment. The effect of LDH concentration is also evident. May be the increasing
particle concentration reduces the average inter-particle separation after structure breakdown, which re-
sults a relatively shorter diffusion path length during regeneration process. Hence, the rate of recovery
increases with increasing LDH concentration in the nanocomposites.
5.3.3.3 Modeling of non-linear rheological behavior of PE/LDH nanocomposites
The rheological behavior of PE/LDH nanocomposite described in the previous sections provides a quali-
tative physical interpretation of the materials response during a steady shear experiment in the non-linear
flow regime. These interpretations are not sufficient for the predictions of the magnitude and the time
scale of the response. For example, to predict the magnitude of the stress overshoot peak and the time of
its appearance (tmax) at an arbitrary shear rate, one needs accurate mathematical description of the ma-
terials response as a function of the applied shear rate. Such predictions are often very useful in proper
designing of the processing parameters for polymeric melts that strongly depend on the flow behavior.
Therefore, in the present section this has been tried based on the knowledge available in literatures for
describing the flow behavior of polymeric melts. In analysing the PE/LDH nanocomposite compositions,
the stress overshoot effect from the matrix alone was neglected primarily because its magnitude (not the
normalized value) is negligible in comparison to the filled systems and also it appears at much higher
time scale at a given shear rate. Secondly, the increasing amount of low molecular weight functionalized
polymer reduces the stress overshoot tendency of the matrix phase. Thus, as the first approximation, the
nonlinear viscoelastic response in filled PE/LDH nanocomposites system studied here may be ascribed
to the presence of LDH agglomerate structures in various scales.
The appearance of overshoot can be readily described using the Wagner model [174, 175]:
τ(t) =
t∫−∞
M(t − t′) exp(−β|γ(t, t′)|) γ(t, t′) dt′ (5.4)
Here, the first term under integral is the memory function and the second exponential term is the damping
function with the parameter β describing the strength of non-linearity. The term
γ(t, t′) =
t′∫t
γ(t′′) dt′′ (5.5)
depends on the history of strain rate for all past times −∞ < t′ 6 t. For the sake of simplicity, we consider
here the memory function to be in a form of the Maxwell model with only one relaxation mode:
M(t − t′) =[η
λ02
]exp[−(t − t′)/λ0] (5.6)
where η and λ0 are the viscosity and the relaxation time, respectively. Then for the start up of the shear
flow one obtains a following solution:[τ(t)γ0
]= −ηi
[λγ2λ0
2 (1 − e−t/λγ) +tλ0
e−t/λγ(1 −λγ
λ0
)](5.7)

CHAPTER 5. CHARACTERIZATIONS OF PE/LDH NANOCOMPOSITE 92
where the first term describes a monotonic increase of the shear stress and the second term describes the
stress overshoot. The relaxation time of sheared system is given by:
λγ =λ0
1 + β |γ0| λ0(5.8)
whereby λγ decreases with the increase in γ0. The decrease of a characteristic relaxation time with
increasing shear rate in the case of filled nanocomposites can be interpreted as the decrease in the di-
mensions of an average filler agglomerate. Thus, the Wagner model implicitly assumes that the system
structures become finer under the application of shear flow. It is clear that in reality a filled polymer
system undergoes gradual breakage of its structure after the start up of the shear flow. Therefore, Lion
et al. proposed a model in which the relaxation time undergoes a gradual decrease from the rest value
of λ0 till the stationary value of λst [176]. In the following, it is assumed that the relaxation time used in
equation (5.3) is simply an average value between λ0 and λst.
In the stress relaxation experiment, when the step strain γ0 is applied at time t = 0, the Wagner model
gives the following solution
τ(t) = −γ0 G(t) eβγ0 (5.9)
where,
G(t) =
0∫−∞
M(t − t′) dt′ (5.10)
is the is the linear viscoelastic relaxation modulus determined at γ → 0. Equation (5.9) expresses the
principle of time-strain factorization, i.e. that the nonlinear relaxation modulus
G(t, γ0) = G(t) eβγ0 (5.11)
can be factored into a function of time alone and a function of strain alone. This factorization is indeed
observed experimentally for silicate-based intercalated nanocomposites, except at very short times (about
10s), thus justifying the estimation of long relaxation times from the stress relaxation curves.
The Wagner model proved itself over years to be quite useful for description of the nonlinear vis-
coelastic properties of commercial polymer melts. However, polymer nanocomposites represent much
more complex systems than the pure melts due to the presence of inhomogeneous filler structure and pos-
sible filler-polymer and filler-filler interaction. The first problem confronted in this study is that behavior
of the samples strongly depends on the history of their preparation. Further, the filler structure has been
found to change constantly in non-linear shear experiments and this cannot be described in the frame
of original Wagner model with β equal to a constant. Therefore, to describe the non-linear rheological
behavior of the present nanocomposite system, modification of Wagner model was necessary.
In order to explain the experimentally observed behavior in the nanocomposites melts, the non-
linearity parameter β in original Wagner model was considered to vary with time during steady shear
until a steady value is reached at equilibrium. This parameter can now be given a special name i.e.
structural variable. The instantaneous value of β(t) as a function of time during steady shear can be
written as
β(t) = βst + (β0 − βst) exp(−
tTb
)(5.12)
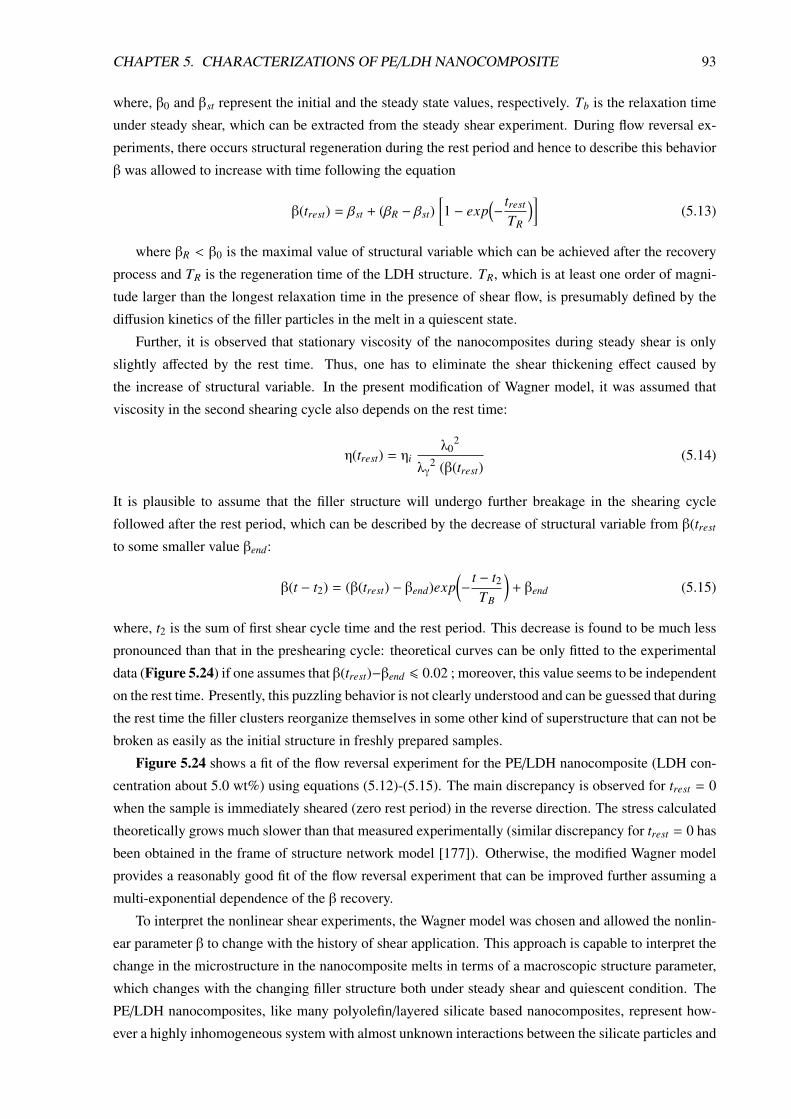
CHAPTER 5. CHARACTERIZATIONS OF PE/LDH NANOCOMPOSITE 93
where, β0 and βst represent the initial and the steady state values, respectively. Tb is the relaxation time
under steady shear, which can be extracted from the steady shear experiment. During flow reversal ex-
periments, there occurs structural regeneration during the rest period and hence to describe this behavior
β was allowed to increase with time following the equation
β(trest) = βst + (βR − βst)[1 − exp
(−
trest
TR
)](5.13)
where βR < β0 is the maximal value of structural variable which can be achieved after the recovery
process and TR is the regeneration time of the LDH structure. TR, which is at least one order of magni-
tude larger than the longest relaxation time in the presence of shear flow, is presumably defined by the
diffusion kinetics of the filler particles in the melt in a quiescent state.
Further, it is observed that stationary viscosity of the nanocomposites during steady shear is only
slightly affected by the rest time. Thus, one has to eliminate the shear thickening effect caused by
the increase of structural variable. In the present modification of Wagner model, it was assumed that
viscosity in the second shearing cycle also depends on the rest time:
η(trest) = ηiλ0
2
λγ2 (β(trest)
(5.14)
It is plausible to assume that the filler structure will undergo further breakage in the shearing cycle
followed after the rest period, which can be described by the decrease of structural variable from β(trest
to some smaller value βend:
β(t − t2) = (β(trest) − βend)exp(−
t − t2TB
)+ βend (5.15)
where, t2 is the sum of first shear cycle time and the rest period. This decrease is found to be much less
pronounced than that in the preshearing cycle: theoretical curves can be only fitted to the experimental
data (Figure 5.24) if one assumes that β(trest)−βend 6 0.02 ; moreover, this value seems to be independent
on the rest time. Presently, this puzzling behavior is not clearly understood and can be guessed that during
the rest time the filler clusters reorganize themselves in some other kind of superstructure that can not be
broken as easily as the initial structure in freshly prepared samples.
Figure 5.24 shows a fit of the flow reversal experiment for the PE/LDH nanocomposite (LDH con-
centration about 5.0 wt%) using equations (5.12)-(5.15). The main discrepancy is observed for trest = 0
when the sample is immediately sheared (zero rest period) in the reverse direction. The stress calculated
theoretically grows much slower than that measured experimentally (similar discrepancy for trest = 0 has
been obtained in the frame of structure network model [177]). Otherwise, the modified Wagner model
provides a reasonably good fit of the flow reversal experiment that can be improved further assuming a
multi-exponential dependence of the β recovery.
To interpret the nonlinear shear experiments, the Wagner model was chosen and allowed the nonlin-
ear parameter β to change with the history of shear application. This approach is capable to interpret the
change in the microstructure in the nanocomposite melts in terms of a macroscopic structure parameter,
which changes with the changing filler structure both under steady shear and quiescent condition. The
PE/LDH nanocomposites, like many polyolefin/layered silicate based nanocomposites, represent how-
ever a highly inhomogeneous system with almost unknown interactions between the silicate particles and

CHAPTER 5. CHARACTERIZATIONS OF PE/LDH NANOCOMPOSITE 94
0 100 200 300 400
0.6
0.8
1.0
1.2 PE-LDH2
σ(t)
/σst
eady
t (s)
rest time 0 s 600 s 900 s 1200 s 1500 s
Figure 5.24 Reverse shear flow experiment for the nanocomposite PE-LDH2: |γ|. Symbols - exper-
iment; lines - modified Wagner model in which β(t) is given by eq. (5.11). βR = 0.14,
βst = 0.02, TR = 500s, β(trest) − βend = 0.02 , TB = 50s, λ0 = 30s
the particles and polymer matrix. Therefore, this has not been intended to provide a microscopic descrip-
tion of the structural evolution in the PE/LDH nanocomposites, but rather to extract some regularities. It
is clear that the structural variable β correlates with an average dimension of the filler aggregates. It was
found that the structural β changes differently depending on the direction of approaching the steady state.
In overall, structural behavior of the PE/LDH nanocomposites under shear flow is similar to the behavior
of filled elastomers for which breakdown of filler clusters at increasing strain and their re-aggregation
with decreasing strain was observed under oscillatory shear (Payne effect [153]). In both cases, only
partial recovery of the initial structure has been observed.
5.4 Mechanical Properties and Fracture Behavior
The mechanical properties of PE/LDH nanocomposites are shown in details in Figure 5.25. It is apparent
that, LDH clay does not act as a reinforcing filler for PE matrix. The yield strength value steadily
decreases with increasing LDH concentration. Whereas the tensile modulus increases significantly in
the nanocomposites. Up to about 10.0 wt% LDH concentration, the changes in mechanical properties,
especially the yield strength and elongation at break are not very significant. The nanocomposites at
low LDH concentrations show similar mechanical and fracture behavior as compared to the unfilled
PE. However, beyond 10 wt% LDH concentration, the materials undergo brittle failure with low yield
strength and elongation at break.
In comparing the mechanical properties based on Figure 5.25 one important factor should be kept in
mind. The influence of low molecular weight functionalized polymer (PE-g-MAH) on the mechanical
properties can be very significant [152]. It has been observed that such low molecular weight fraction
reduces the tensile strength and yield strength of the unfilled matrix. In the present case, each nanocom-
posite composition contains functionalized polymer twice the amount of LDH. Therefore, comparison
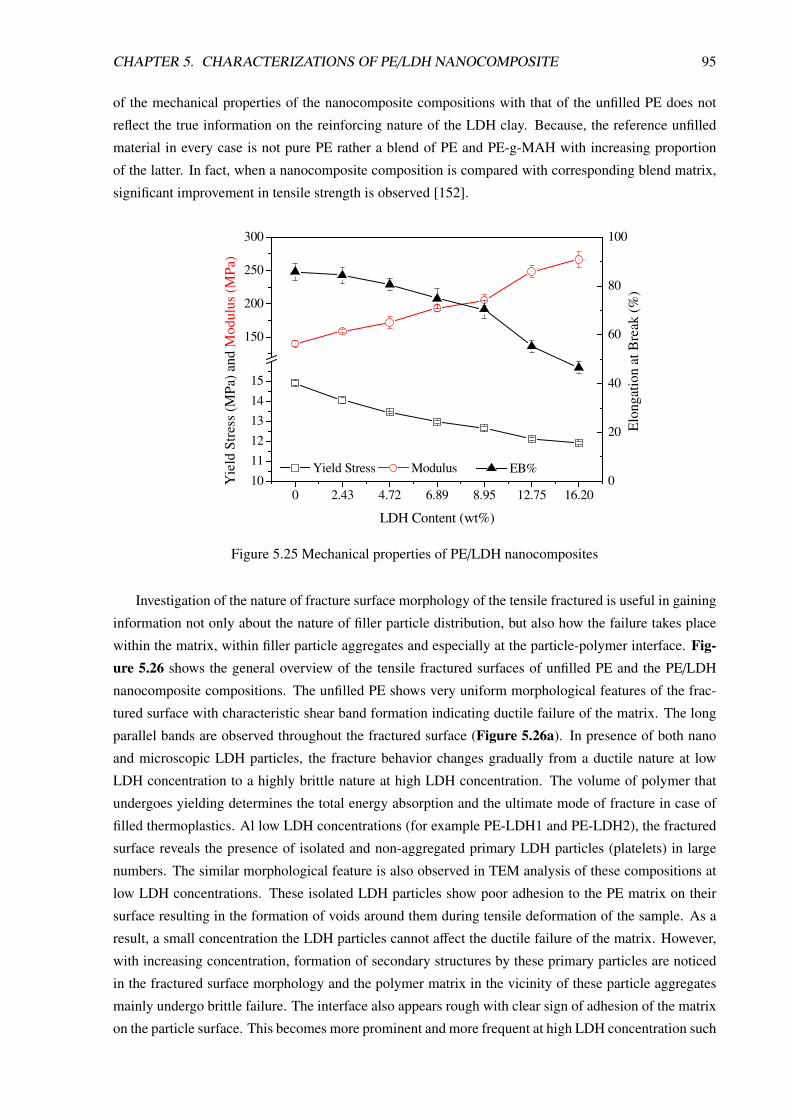
CHAPTER 5. CHARACTERIZATIONS OF PE/LDH NANOCOMPOSITE 95
of the mechanical properties of the nanocomposite compositions with that of the unfilled PE does not
reflect the true information on the reinforcing nature of the LDH clay. Because, the reference unfilled
material in every case is not pure PE rather a blend of PE and PE-g-MAH with increasing proportion
of the latter. In fact, when a nanocomposite composition is compared with corresponding blend matrix,
significant improvement in tensile strength is observed [152].
0 2.43 4.72 6.89 8.95 12.75 16.2010
11121314
15
150
200
250
300Y
ield
Str
ess
(MPa
) and
Mod
ulus
(MPa
)
LDH Content (wt%)
Yield Stress Modulus0
20
40
60
80
100
Elo
ngat
ion
at B
reak
(%)
EB%
Figure 5.25 Mechanical properties of PE/LDH nanocomposites
Investigation of the nature of fracture surface morphology of the tensile fractured is useful in gaining
information not only about the nature of filler particle distribution, but also how the failure takes place
within the matrix, within filler particle aggregates and especially at the particle-polymer interface. Fig-ure 5.26 shows the general overview of the tensile fractured surfaces of unfilled PE and the PE/LDH
nanocomposite compositions. The unfilled PE shows very uniform morphological features of the frac-
tured surface with characteristic shear band formation indicating ductile failure of the matrix. The long
parallel bands are observed throughout the fractured surface (Figure 5.26a). In presence of both nano
and microscopic LDH particles, the fracture behavior changes gradually from a ductile nature at low
LDH concentration to a highly brittle nature at high LDH concentration. The volume of polymer that
undergoes yielding determines the total energy absorption and the ultimate mode of fracture in case of
filled thermoplastics. Al low LDH concentrations (for example PE-LDH1 and PE-LDH2), the fractured
surface reveals the presence of isolated and non-aggregated primary LDH particles (platelets) in large
numbers. The similar morphological feature is also observed in TEM analysis of these compositions at
low LDH concentrations. These isolated LDH particles show poor adhesion to the PE matrix on their
surface resulting in the formation of voids around them during tensile deformation of the sample. As a
result, a small concentration the LDH particles cannot affect the ductile failure of the matrix. However,
with increasing concentration, formation of secondary structures by these primary particles are noticed
in the fractured surface morphology and the polymer matrix in the vicinity of these particle aggregates
mainly undergo brittle failure. The interface also appears rough with clear sign of adhesion of the matrix
on the particle surface. This becomes more prominent and more frequent at high LDH concentration such

CHAPTER 5. CHARACTERIZATIONS OF PE/LDH NANOCOMPOSITE 96
as in PE-LDH4, PE-LDH5 and PE-LDH6. As a result, the large scale plastic flow characteristics as ob-
served on the fractured surfaces of unfilled PE and the PE/LDH nanocomposite composition having low
LDH concentration are greatly reduced in case of the nanocomposites having high LDH concentration
Figure 5.26d-f.The low magnification SEM images of the composition PE-LDH2 as shown in Figure 5.27a), reveals
that the sub-micron sized LDH primary particles are discretely dispersed throughout the matrix. In addi-
(a) (b)
(c) (d)
(e) (f)
Figure 5.26 SEM micrographs showing the fracture surface morphology of PE/LDH nanocomposite:
(a) unfilled PE, (b) PE-LDH1, (c) PE-LDH2, (d) PE-LDH3, (e) PE-LDH4 and (f) PE-
LDH5

CHAPTER 5. CHARACTERIZATIONS OF PE/LDH NANOCOMPOSITE 97
(a)
(b)
(c) (d)
Figure 5.27 SEM images of fractured surface of PE-LDH2 sample showing morphology at different
region of the matrix: (a) overall morphology (magnification 200X), (b) at the interface
of particle rich and particle devoid regions (magnification 1KX), (c) particle devoid
region (magnification 20KX) and (d) particle rich region (magnification 30KX) (the
black arrows show the individual or small stacks of LDH platelets)

CHAPTER 5. CHARACTERIZATIONS OF PE/LDH NANOCOMPOSITE 98
tion, they also form large particle clusters of sizes ranging from few micrometer to above 100 micrometer
(similar features are observed more frequently at higher LDH concentration). The formation of large
cracks during tensile fracture at the interface between these clusters and the bulk matrix is also apparent
(Figure 5.27b). However, the high magnification SEM images show that these large clusters are actually
the regions or the domains of high concentration of LDH particles. These particles are present either as
single or small stacks of platelets in these domains and show strong adherence to the matrix. This can be
speculated from the nature of the interface in this region (Figure 5.27d). During the tensile yielding, the
particle-polymer interface is strained substantially and this causes the pulling out of the matrix adhered to
the LDH particle surface or entrapped withing large particle clusters. This often results in the formation
of pullout matrix strands that bridge the widening gap at the interface, which has been clearly demon-
strated in Figure 5.27d and Figure 5.28. The failures of matrix in the LDH particle rich domains and
the bulk matrix are distinctly different. In case of former, the failure is apparently brittle type and show
3 µm
1 µm
(a) (b)
Figure 5.28 The bridging effects at the interface between the particle rich region (indicated by arrow)
and particle devoid region in PE/LDH nanocomposite compositions containing (a) 4.72
wt% and (b) 16.20 wt % LDH
no large scale plastic flow around the LDH particles. In contrast, the bulk matrix, where discrete LDH
particles are dispersed suffers preferably a plastic deformation. The weak particle-polymer interaction in
these regions is evident from the appearance of smooth interface (Figure 5.27c). During tensile failure,
cracks are easily developed between these two regions indicating a weak interface that undergoes easy
failure during under stress. With increasing LDH concentration number of such concentrated particulate
domains increases, which may be the major cause of significant lowering of mechanical strength. The
question is what causes the formation of such concentrated particulate domains in the nanocomposite.
The answer probably lies in the preparation technique of these materials. Since, LDH is added to PE
not directly, but as its masterbatch (which is again the principle behind the most widely used techniques
for polyolefin based nanocomposite preparation by melt compounding) with functionalized polyethylene
(PE-g-MAH). The granules of LDH masterbatch and unfilled PE are melted and mixed in extruder. May
be the shearing action of the extruder screw cannot force homogeneous distribution of strongly associ-
ated LDH particles (present in a masterbatch containing 50.0 wt% LDH) between PE-g-MAH and PE
phases. Though, PE-g-MAH is used as the compatibilizer between LDH and matrix, homogeneous dis-
CHAPTER 5. CHARACTERIZATIONS OF PE/LDH NANOCOMPOSITE 99
tribution of LDH in the final composite matrix requires the complete melting of the masterbatch granules
and subsequent breakdown of the particle clusters present in the masterbatch followed by the distribu-
tion of LDH/PE-g-MAH association within PE matrix. Since, PE-g-MAH bonds more strongly to LDH
particle surface than polyethylene chains [178], a fraction of LDH/PE-g-MAH cluster might still remain
unbreakable after the extrusion process. It is therefore obvious that the extrusion conditions (tempera-
ture, feed rate, screw geometry and screw speed) should strongly influence the particle morphology in
polymer/clay nanocomposites [137]. In addition, during the injection molding process (used to prepare
tensile test specimen), a part of the fragmented or exfoliated LDH particles formed during extrusion may
undergo reagglomeration or orientation creating particle concentrated domains.
The nature of failure at the interface between a particulate domains and the bulk matrix varies widely.
Sometimes, the interface fails abruptly (as evident in Figure 5.27b) showing poor stress transfer between
these two regions. Often considerable extent of interpenetration of the matrix is also observed between
them. The typical representation of this is given in Figure 5.28. The bridging of the fractured interface
by stressed matrix strands is a clear evidence of interpenetration of the PE matrix within the particulate
regions or clusters, which is helpful for efficient stress transfer between the two regions. However, the
large size of these clusters along with strong particle-particle and particle-polymer interactions make
them brittle and thus explain lower mechanical strength of the composite as a whole,
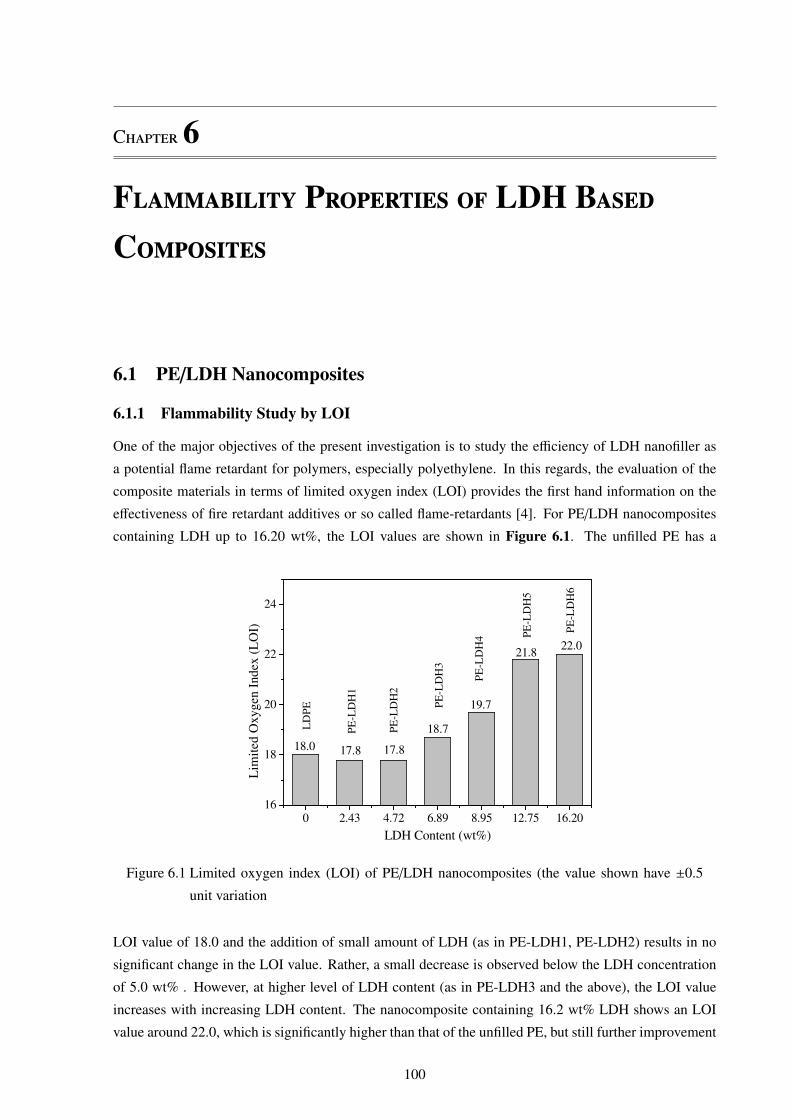
C6
F P LDH BC
6.1 PE/LDH Nanocomposites
6.1.1 Flammability Study by LOI
One of the major objectives of the present investigation is to study the efficiency of LDH nanofiller as
a potential flame retardant for polymers, especially polyethylene. In this regards, the evaluation of the
composite materials in terms of limited oxygen index (LOI) provides the first hand information on the
effectiveness of fire retardant additives or so called flame-retardants [4]. For PE/LDH nanocomposites
containing LDH up to 16.20 wt%, the LOI values are shown in Figure 6.1. The unfilled PE has a
0 2.43 4.72 6.89 8.95 12.75 16.2016
18
20
22
24
22.021.8
19.7
18.7
17.817.818.0
Lim
ited
Oxy
gen
Inde
x (L
OI)
LDH Content (wt%)
LD
PE
PE-L
DH
1
PE-L
DH
2
PE-L
DH
3
PE-L
DH
4 PE-L
DH
5
PE-L
DH
6
Figure 6.1 Limited oxygen index (LOI) of PE/LDH nanocomposites (the value shown have ±0.5
unit variation
LOI value of 18.0 and the addition of small amount of LDH (as in PE-LDH1, PE-LDH2) results in no
significant change in the LOI value. Rather, a small decrease is observed below the LDH concentration
of 5.0 wt% . However, at higher level of LDH content (as in PE-LDH3 and the above), the LOI value
increases with increasing LDH content. The nanocomposite containing 16.2 wt% LDH shows an LOI
value around 22.0, which is significantly higher than that of the unfilled PE, but still further improvement
100
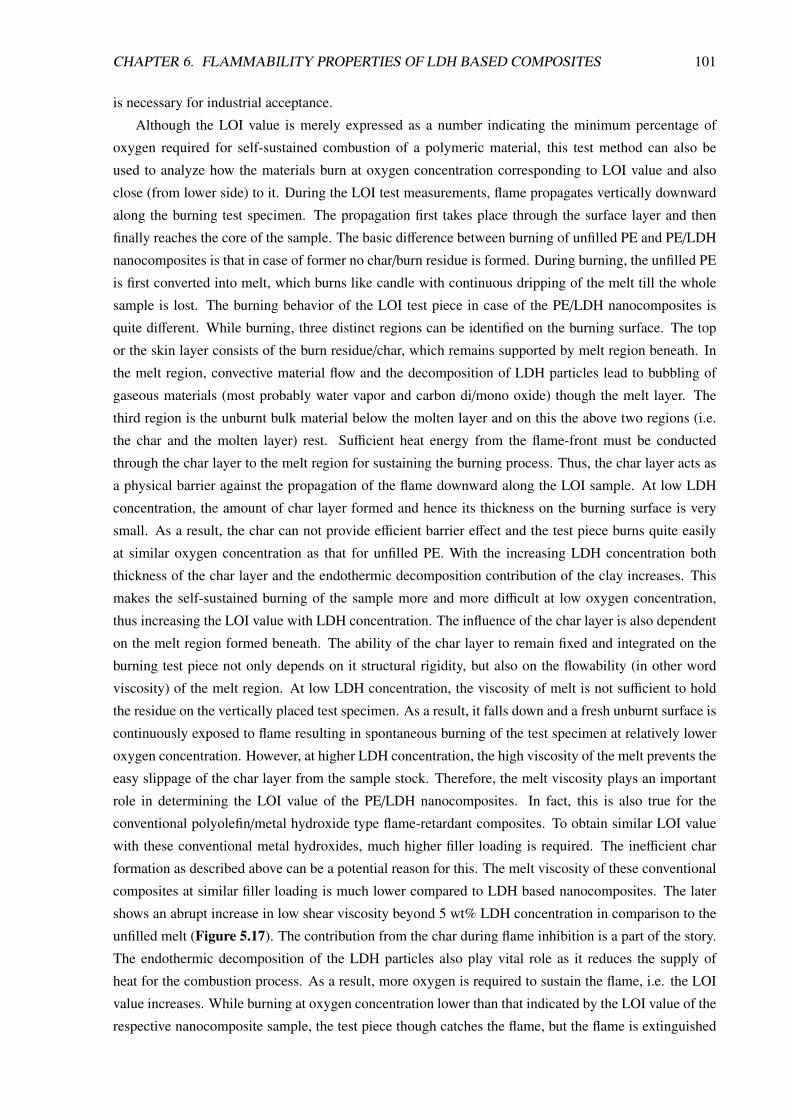
CHAPTER 6. FLAMMABILITY PROPERTIES OF LDH BASED COMPOSITES 101
is necessary for industrial acceptance.
Although the LOI value is merely expressed as a number indicating the minimum percentage of
oxygen required for self-sustained combustion of a polymeric material, this test method can also be
used to analyze how the materials burn at oxygen concentration corresponding to LOI value and also
close (from lower side) to it. During the LOI test measurements, flame propagates vertically downward
along the burning test specimen. The propagation first takes place through the surface layer and then
finally reaches the core of the sample. The basic difference between burning of unfilled PE and PE/LDH
nanocomposites is that in case of former no char/burn residue is formed. During burning, the unfilled PE
is first converted into melt, which burns like candle with continuous dripping of the melt till the whole
sample is lost. The burning behavior of the LOI test piece in case of the PE/LDH nanocomposites is
quite different. While burning, three distinct regions can be identified on the burning surface. The top
or the skin layer consists of the burn residue/char, which remains supported by melt region beneath. In
the melt region, convective material flow and the decomposition of LDH particles lead to bubbling of
gaseous materials (most probably water vapor and carbon di/mono oxide) though the melt layer. The
third region is the unburnt bulk material below the molten layer and on this the above two regions (i.e.
the char and the molten layer) rest. Sufficient heat energy from the flame-front must be conducted
through the char layer to the melt region for sustaining the burning process. Thus, the char layer acts as
a physical barrier against the propagation of the flame downward along the LOI sample. At low LDH
concentration, the amount of char layer formed and hence its thickness on the burning surface is very
small. As a result, the char can not provide efficient barrier effect and the test piece burns quite easily
at similar oxygen concentration as that for unfilled PE. With the increasing LDH concentration both
thickness of the char layer and the endothermic decomposition contribution of the clay increases. This
makes the self-sustained burning of the sample more and more difficult at low oxygen concentration,
thus increasing the LOI value with LDH concentration. The influence of the char layer is also dependent
on the melt region formed beneath. The ability of the char layer to remain fixed and integrated on the
burning test piece not only depends on it structural rigidity, but also on the flowability (in other word
viscosity) of the melt region. At low LDH concentration, the viscosity of melt is not sufficient to hold
the residue on the vertically placed test specimen. As a result, it falls down and a fresh unburnt surface is
continuously exposed to flame resulting in spontaneous burning of the test specimen at relatively lower
oxygen concentration. However, at higher LDH concentration, the high viscosity of the melt prevents the
easy slippage of the char layer from the sample stock. Therefore, the melt viscosity plays an important
role in determining the LOI value of the PE/LDH nanocomposites. In fact, this is also true for the
conventional polyolefin/metal hydroxide type flame-retardant composites. To obtain similar LOI value
with these conventional metal hydroxides, much higher filler loading is required. The inefficient char
formation as described above can be a potential reason for this. The melt viscosity of these conventional
composites at similar filler loading is much lower compared to LDH based nanocomposites. The later
shows an abrupt increase in low shear viscosity beyond 5 wt% LDH concentration in comparison to the
unfilled melt (Figure 5.17). The contribution from the char during flame inhibition is a part of the story.
The endothermic decomposition of the LDH particles also play vital role as it reduces the supply of
heat for the combustion process. As a result, more oxygen is required to sustain the flame, i.e. the LOI
value increases. While burning at oxygen concentration lower than that indicated by the LOI value of the
respective nanocomposite sample, the test piece though catches the flame, but the flame is extinguished
CHAPTER 6. FLAMMABILITY PROPERTIES OF LDH BASED COMPOSITES 102
after some time whereas it burns continuously at LOI.
6.1.2 Flammability Study by UL94
UL94 testing was carried out using two norms one vertical burn test (UL94V) and the other horizon-
tal burn test (UL94HB). The PE/LDH nanocomposites containing LDH up to 16.20 wt% did not pass
any of the UL94V test specification. All the samples start burning spontaneously after first 10 s flame
application, which continued until the test specimen was completely burned up to the sample holding
clamp. However, the UL94V burn test provides useful information regarding the dripping behavior of
these composite materials. The dripping of the burning melts can accelarate the spread of flame through
secondary flaming during a real life burning situation. Although all the PE/LDH nanocomposite samples
show dripping while burning, the time at which dripping starts is significantly delayed by the presence of
LDH. A parameter called time to start dripping is defined as the time after the first 10 s-flame-application
at which the dripping starts and the the piece of cotton kept underneath is ignited by the dripping melt.
As shown in Figure 6.2, the time to first dripping increases steadily with increasing LDH concentration
0 2 4 6 8 10 12 14 16 18
0
10
20
30
40
50
60
70
80
90
Tim
e to
sta
rt dr
ippi
ng (s
)
LDH content (wt%)
LDPE
PE-LDH1
PE-LDH2PE-LDH3
PE-LDH4
PE-LDH5
PE-LDH6
Figure 6.2 The effect of LDH loading on the dripping tendency of the PE/LDH nanocomposites
(Time to start dripping is the time after first 10 second flame application at which first
dripping occurs that ignites a piece of cotton underneath during UL94V testing)
in the nanocomposites and becomes more than ten times at 16.20 wt% LDH in PE-LDH6. Similar, trend
was also observed in case of polypropylene/layered silicate based nanocomposites, where the nanocom-
posite showed improved dripping behavior compared to unfilled polypropylene [68]. The slow and much
delayed dripping tendency in PE/LDH nanocomposites are caused by the high melt viscosity of the
nanocomposites, which increases with increasing LDH concentration. While in case of unfilled PE drip-
ping starts in the form of a continuous stream of burning melt, that in presence of LDH takes place in
the form of chunks of glowing residue. Figure 6.3 shows the typical dripping behavior of the unfilled
PE and a PE/LDH composition (PE-LDH5) at comparable time after the first 10s-flame-application. The
UL94 horizontal burn test showed better flammability performances of the PE/LDH nanocomposites as
compared to the pure polyethylene. The nanocomposites containing 4.72 wt% (PE-LDH2) or higher
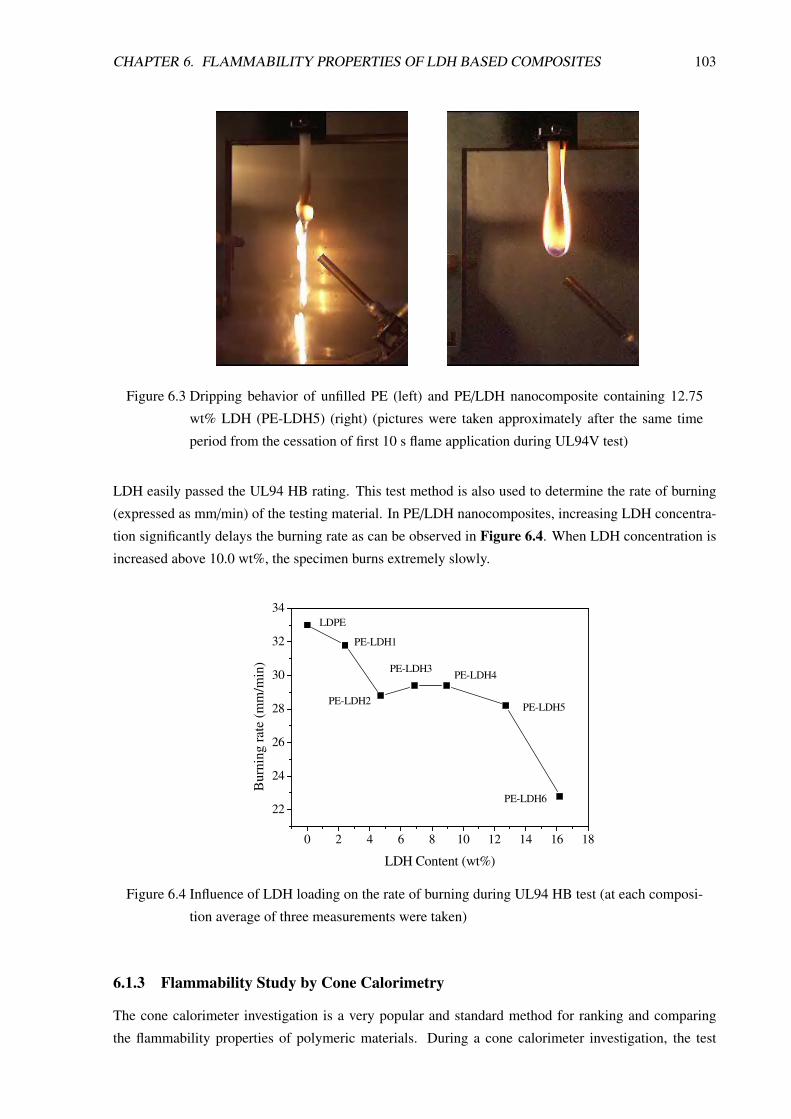
CHAPTER 6. FLAMMABILITY PROPERTIES OF LDH BASED COMPOSITES 103
Figure 6.3 Dripping behavior of unfilled PE (left) and PE/LDH nanocomposite containing 12.75
wt% LDH (PE-LDH5) (right) (pictures were taken approximately after the same time
period from the cessation of first 10 s flame application during UL94V test)
LDH easily passed the UL94 HB rating. This test method is also used to determine the rate of burning
(expressed as mm/min) of the testing material. In PE/LDH nanocomposites, increasing LDH concentra-
tion significantly delays the burning rate as can be observed in Figure 6.4. When LDH concentration is
increased above 10.0 wt%, the specimen burns extremely slowly.
0 2 4 6 8 10 12 14 16 18
22
24
26
28
30
32
34
Bur
ning
rate
(mm
/min
)
LDH Content (wt%)
LDPE
PE-LDH1
PE-LDH2
PE-LDH3PE-LDH4
PE-LDH5
PE-LDH6
Figure 6.4 Influence of LDH loading on the rate of burning during UL94 HB test (at each composi-
tion average of three measurements were taken)
6.1.3 Flammability Study by Cone Calorimetry
The cone calorimeter investigation is a very popular and standard method for ranking and comparing
the flammability properties of polymeric materials. During a cone calorimeter investigation, the test
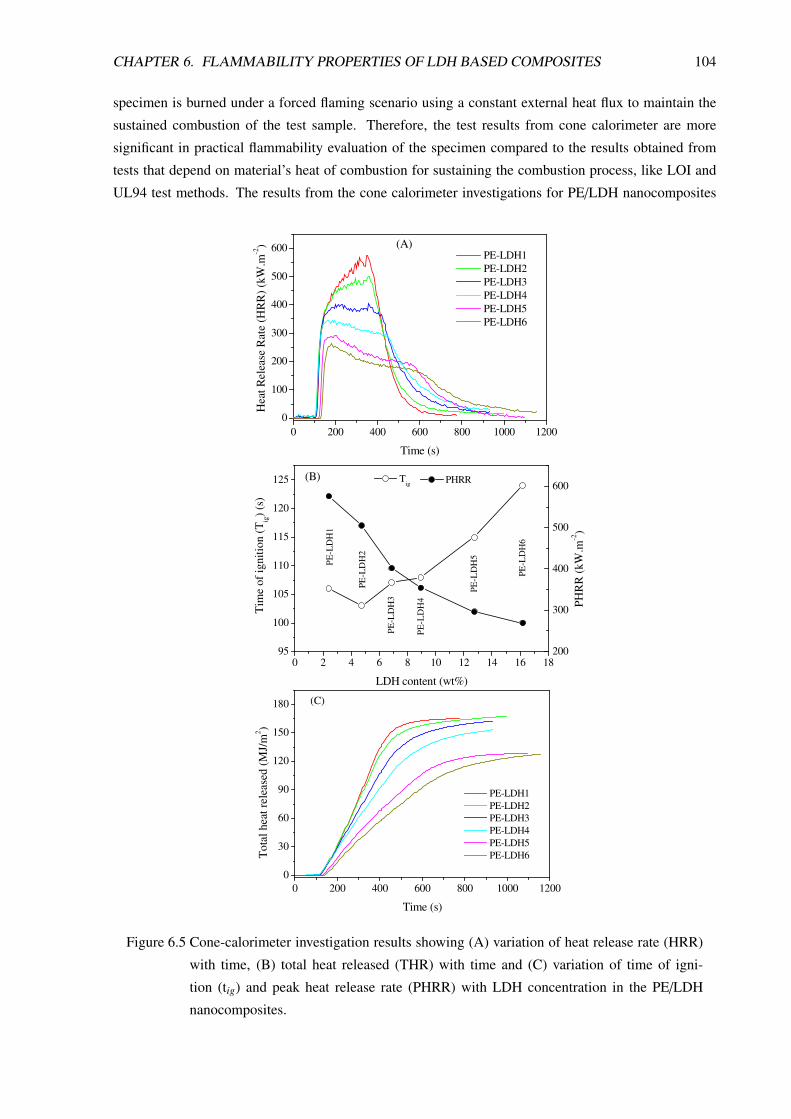
CHAPTER 6. FLAMMABILITY PROPERTIES OF LDH BASED COMPOSITES 104
specimen is burned under a forced flaming scenario using a constant external heat flux to maintain the
sustained combustion of the test sample. Therefore, the test results from cone calorimeter are more
significant in practical flammability evaluation of the specimen compared to the results obtained from
tests that depend on material’s heat of combustion for sustaining the combustion process, like LOI and
UL94 test methods. The results from the cone calorimeter investigations for PE/LDH nanocomposites
0 200 400 600 800 1000 12000
100
200
300
400
500
600 (A)H
eat R
elea
se R
ate
(HR
R) (
kW.m
-2)
Time (s)
PE-LDH1 PE-LDH2 PE-LDH3 PE-LDH4 PE-LDH5 PE-LDH6
0 2 4 6 8 10 12 14 16 1895
100
105
110
115
120
125
Tim
e of
igni
tion
(Tig) (
s)
LDH content (wt%)
Tig
PE-L
DH
1
PE-L
DH
2
PE-L
DH
3
PE-L
DH
4
PE-L
DH
5
PE-L
DH
6
200
300
400
500
600(B)
PHR
R (k
W.m
-2)
PHRR
0 200 400 600 800 1000 12000
30
60
90
120
150
180 (C)
Tot
al h
eat r
elea
sed
(MJ/
m2 )
Time (s)
PE-LDH1 PE-LDH2 PE-LDH3 PE-LDH4 PE-LDH5 PE-LDH6
Figure 6.5 Cone-calorimeter investigation results showing (A) variation of heat release rate (HRR)
with time, (B) total heat released (THR) with time and (C) variation of time of igni-
tion (tig) and peak heat release rate (PHRR) with LDH concentration in the PE/LDH
nanocomposites.

CHAPTER 6. FLAMMABILITY PROPERTIES OF LDH BASED COMPOSITES 105
are summarized in Figure 6.5 to 6.9. The testing unfilled polyethylene was deliberately avoided as
during its combustion mass loss occurred due to melt dripping, which was not possible to eliminate with
the used experimental set up. This mass loss due to melt dripping resulted incomplete combustion of the
test sample and hence results obtained were not conclusive.
Heat release rate (HRR) is the single most important variable, which controls how fast a fire can
reach an uncontrollable stage. This single parameter provides information regarding the size of the fire
and how fast it grows. The effectiveness of a fire retardant additive in polymer can also be assessed
with respect to this parameter. Figure 6.5 A and B, show that with increasing concentration of LDH in
PE/LDH nanocomposites, the maximum of HRR (called peak heat release rate or PHRR) is significantly
reduced. In addition to that, the HRR versus time plots shows a plateau effect with longer combustion
time with lower HRR. This means that the burning rate of the nanocompoites decreases significantly
with increasing LDH concentration. In case of unfilled PE, cone calorimeter investigation under similar
external heat flux (30 kW/m2 and 35 kW/m2) results in a PHRR value over 800 kW/m2 [179, 180]. The
addition of small amount of LDH causes a reduction in PHRR value below 600 kW/m2. At higher LDH
concentration (as in PE-LDH4, PE-LDH5 and PE-LDH6) the PHRR is further reduced to below 300
kW/m2. The ignition of unfilled PE is followed by the formation of molten surface layer on which the
flame floats. The ignition time (tig), parameter defined as the time at which the test specimen catches
the flame and it is sustained over the entire surface of the specimen, is also significantly increased with
increasing LDH content. A tig value below 100 s is observed in case of unfilled PE,, which increases
to above 120 s with 16.20 wt% of LDH content in the nanocomposites (PE-LDH6) (Figure 6.5B). This
indicates that the resistance against ignition is improved in presence of LDH and with increasing LDH
concentration. The total heat released (THR) is a parameter that determines the size of a fire. Once
the ignition takes place, THR steadily increases with burning time and attains a steady state before the
flameout occurs. The variation of THR with burning time is shown in Figure 6.5C. It is clear that THR
is progressively reduced with increasing LDH content. At 10 min, THR reduced by about 17.0 % and
44.0 % in the samples PE-LDH4 and PE-LDH6 in comparison to the sample PE-LDFH1.
The efficiency of a flame-retardant can be evaluated in terms of relative change of THR and the
ratio PHRR/tig with increasing flame-retarding concentration in the composite. The total heat released
(THR) is often taken as the measure of the propensity to sustain a long duration fire. An efficient flame-
retardant should reduce THR effectively when incorporated into a polymer. In this respect, LDH fillers
have definite advantage over layered silicate type nano fillers as flame-retardants. The presence of layered
silicate nano fillers in a polymer nanocomposite does not cause any significant change in the THR value
in comparison to unfilled polymer even if the concentration of the filler is increased [181]. This is
because the layered silicates are chemically inert and its inorganic content is not changed much during
the combustion of the composites. Hence the heat of combustion of the layered silicate based composites
remains the same as that of the unfilled polymer. They simply act as a physical barrier between the
flame front and the burning surface. On the other hand, LDH takes part actively in combustion process
through endothermic decomposition, which act as the heat sink reducing the total heat generated during
combustion. So it significantly reduces the total heat released. The ratio PHRR/tig gives a measure of how
fast a fire can grow during burning process or more precisely related to the propensity to cause fast growth
of fire. Like, having low THR, an efficient flame-retardant should also give a low value of this ratio. In
fact, when THR is plotted against PHRR/tig, the position of a good flame-retardant composites would

CHAPTER 6. FLAMMABILITY PROPERTIES OF LDH BASED COMPOSITES 106
be close to origin [107]. Figure 6.6 shows a comprehensive assessment of PE/LDH nanocomposites
using this principle. It is is obvious that increasing LDH concentration not only reduces the THR, but
also the PHRR/tig ratio. Beyond certain LDH concentration, the position of the nanocomposites in THR
versus PHRR/tig co-ordinate system, sharply bend toward origin with increasing LDH concentration.
This is certainly a promising development in comparison to the performances of layered silicate based
nanocomposites. In case of polyolefin/layered silicate based composites, it has been observed that with
increasing filler concentration PHRR/tig ratio decreases significantly. But, since the THR value remain
roughly constant, the positions of this system lies parallel to PHRR/tig axis in similar plots as in Figure6.6. These results shows LDH has definite advantage over inactive layered silicate type nanoclay as
flame-retardant in polymer.
0 1 2 3 4 5 650
100
150
Propensity to cause quick fire growth
Prop
ensi
ty to
pro
duce
long
dur
atio
n fi
re PE-LDH1
PE-LDH6
flame retardant effect shown by layered silicate type inactive inorganic fillers
efficient flame retardant effectT
HR
(MJm
-2)
PHRR/tig (kWm-2s-1)
LDPE/LDH nanocompoites
Figure 6.6 Graphical assessment of fire risk associated with PE/LDH nanocomposites, plotting THR
against PHRR/tig for different LDH concentration (the LDH concentration increases from
right to left as shown)
Figure 6.7 shows the influence of LDH loading on rate of carbon dioxide (CO2) and carbon monox-
ide (CO) emission during combustion. During first 500 s of combustion of the nanocomposites in
cone-calorimeter, the rates of release of CO2 and COare reduced significantly with increasing LDH
concentration. But, beyond 500 s, the unfilled PE and the PE/LDH compositions with low LDH concen-
tration show drastic drop in the release rates of these two gases. This is attributed to the increase in the
burn time with increasing LDH concentration, which results a steady but prolonged release of these two
gases. For examples the total burn time (the time at which flame-out takes place during cone-calorimeter
combustion test) in PE-LDH1 is about 660 s and that in case of PE-LDH6 is above 1000 s.
Like HRR, mass loss during combustion is an important aspect that indicate how fast the material
is burning. Usually, unfilled PE shows very rapid mass loss after the ignition of the test specimen. The
material first undergoes melting followed by the decomposition into volatile fragments, which escape
from the surface to the flame zone causing rapid mass loss. In presence of LDH, the endothermic de-
composition of hydroxide layer produces the cooling effect in the surrounding, which slows down the
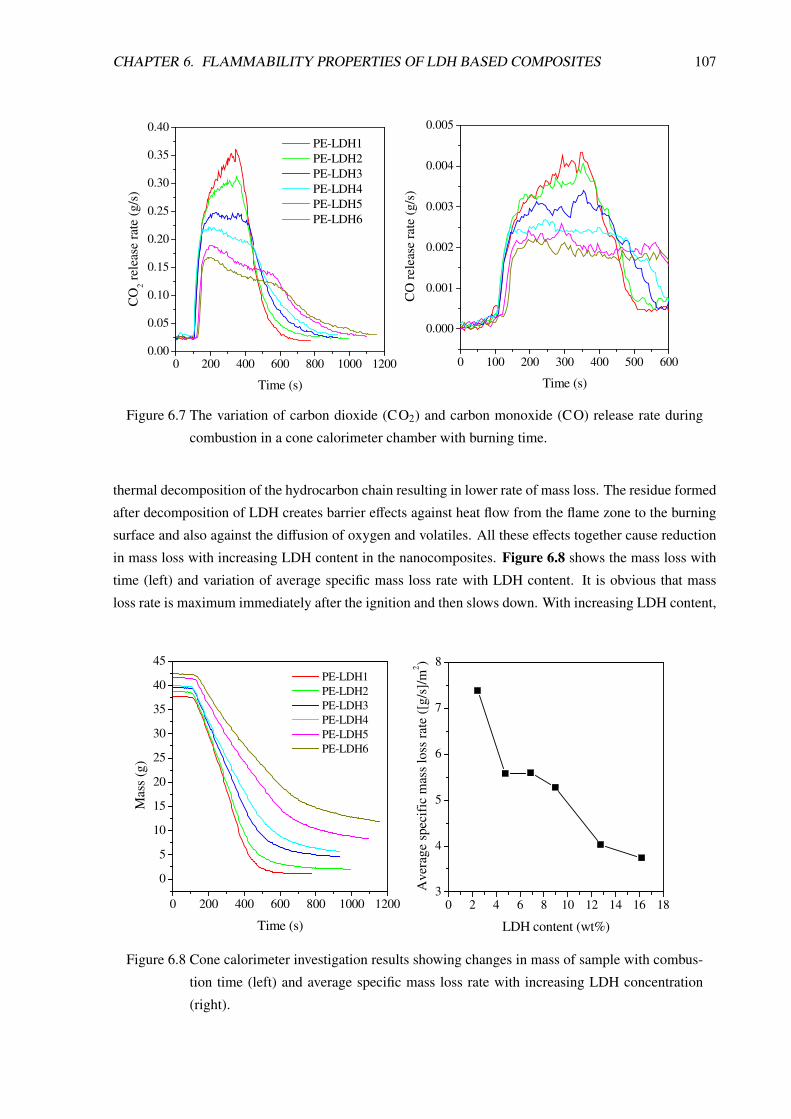
CHAPTER 6. FLAMMABILITY PROPERTIES OF LDH BASED COMPOSITES 107
0 100 200 300 400 500 600
0.000
0.001
0.002
0.003
0.004
0.005
0 200 400 600 800 1000 12000.00
0.05
0.10
0.15
0.20
0.25
0.30
0.35
0.40
CO
rele
ase
rate
(g/s
)
Time (s)
CO
2 rele
ase
rate
(g/s
)
Time (s)
PE-LDH1 PE-LDH2 PE-LDH3 PE-LDH4 PE-LDH5 PE-LDH6
Figure 6.7 The variation of carbon dioxide (CO2) and carbon monoxide (CO) release rate during
combustion in a cone calorimeter chamber with burning time.
thermal decomposition of the hydrocarbon chain resulting in lower rate of mass loss. The residue formed
after decomposition of LDH creates barrier effects against heat flow from the flame zone to the burning
surface and also against the diffusion of oxygen and volatiles. All these effects together cause reduction
in mass loss with increasing LDH content in the nanocomposites. Figure 6.8 shows the mass loss with
time (left) and variation of average specific mass loss rate with LDH content. It is obvious that mass
loss rate is maximum immediately after the ignition and then slows down. With increasing LDH content,
0 200 400 600 800 1000 1200
0
5
10
15
20
25
30
35
40
45
0 2 4 6 8 10 12 14 16 183
4
5
6
7
8
Mas
s (g
)
Time (s)
PE-LDH1 PE-LDH2 PE-LDH3 PE-LDH4 PE-LDH5 PE-LDH6
Ave
rage
spe
cifi
c m
ass
loss
rate
([g/
s]/m
2 )
LDH content (wt%)
Figure 6.8 Cone calorimeter investigation results showing changes in mass of sample with combus-
tion time (left) and average specific mass loss rate with increasing LDH concentration
(right).
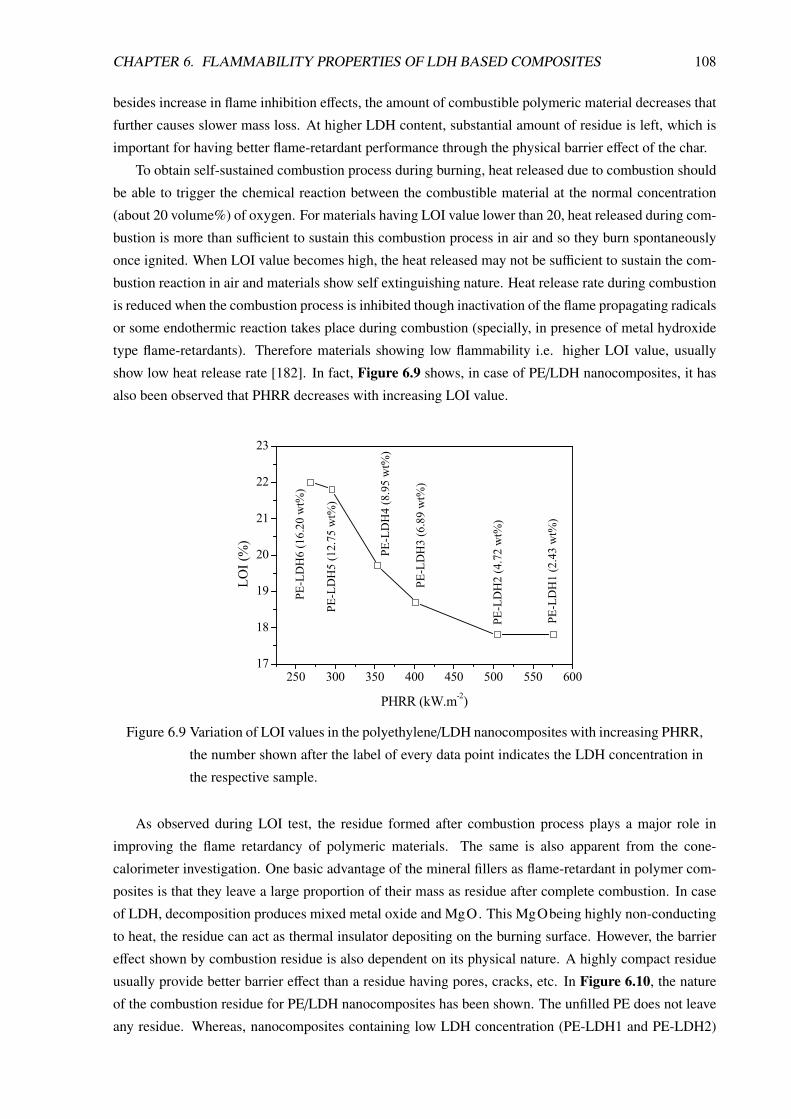
CHAPTER 6. FLAMMABILITY PROPERTIES OF LDH BASED COMPOSITES 108
besides increase in flame inhibition effects, the amount of combustible polymeric material decreases that
further causes slower mass loss. At higher LDH content, substantial amount of residue is left, which is
important for having better flame-retardant performance through the physical barrier effect of the char.
To obtain self-sustained combustion process during burning, heat released due to combustion should
be able to trigger the chemical reaction between the combustible material at the normal concentration
(about 20 volume%) of oxygen. For materials having LOI value lower than 20, heat released during com-
bustion is more than sufficient to sustain this combustion process in air and so they burn spontaneously
once ignited. When LOI value becomes high, the heat released may not be sufficient to sustain the com-
bustion reaction in air and materials show self extinguishing nature. Heat release rate during combustion
is reduced when the combustion process is inhibited though inactivation of the flame propagating radicals
or some endothermic reaction takes place during combustion (specially, in presence of metal hydroxide
type flame-retardants). Therefore materials showing low flammability i.e. higher LOI value, usually
show low heat release rate [182]. In fact, Figure 6.9 shows, in case of PE/LDH nanocomposites, it has
also been observed that PHRR decreases with increasing LOI value.
250 300 350 400 450 500 550 60017
18
19
20
21
22
23
PE-LDH1 (2.43 wt%)
PE-LDH2 (4.72 wt%)
PE-LDH3 (6.89 wt%)
PE-LDH4 (8.95 wt%)
PE-LDH5 (12.75 wt%)
PE-LDH6 (16.20 wt%)
LOI (%)
PHRR (kW.m-2)
Figure 6.9 Variation of LOI values in the polyethylene/LDH nanocomposites with increasing PHRR,
the number shown after the label of every data point indicates the LDH concentration in
the respective sample.
As observed during LOI test, the residue formed after combustion process plays a major role in
improving the flame retardancy of polymeric materials. The same is also apparent from the cone-
calorimeter investigation. One basic advantage of the mineral fillers as flame-retardant in polymer com-
posites is that they leave a large proportion of their mass as residue after complete combustion. In case
of LDH, decomposition produces mixed metal oxide and MgO. This MgObeing highly non-conducting
to heat, the residue can act as thermal insulator depositing on the burning surface. However, the barrier
effect shown by combustion residue is also dependent on its physical nature. A highly compact residue
usually provide better barrier effect than a residue having pores, cracks, etc. In Figure 6.10, the nature
of the combustion residue for PE/LDH nanocomposites has been shown. The unfilled PE does not leave
any residue. Whereas, nanocomposites containing low LDH concentration (PE-LDH1 and PE-LDH2)
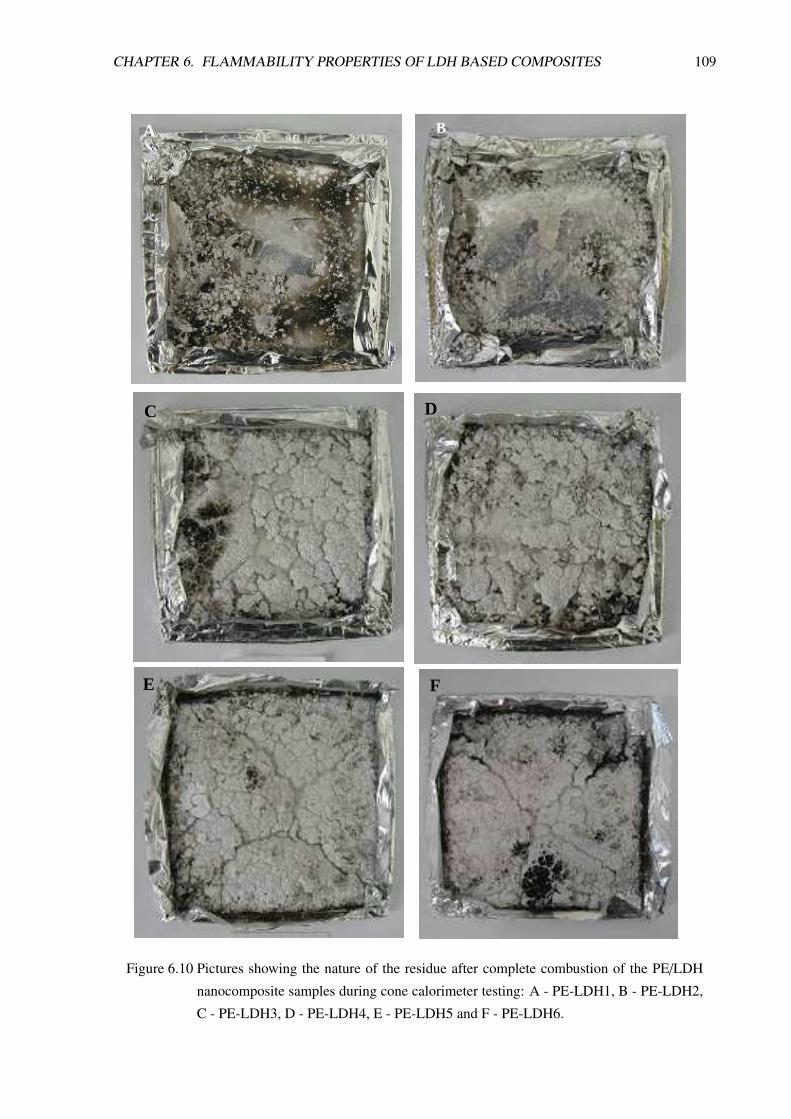
CHAPTER 6. FLAMMABILITY PROPERTIES OF LDH BASED COMPOSITES 109
A B
C D
E F
Figure 6.10 Pictures showing the nature of the residue after complete combustion of the PE/LDH
nanocomposite samples during cone calorimeter testing: A - PE-LDH1, B - PE-LDH2,
C - PE-LDH3, D - PE-LDH4, E - PE-LDH5 and F - PE-LDH6.
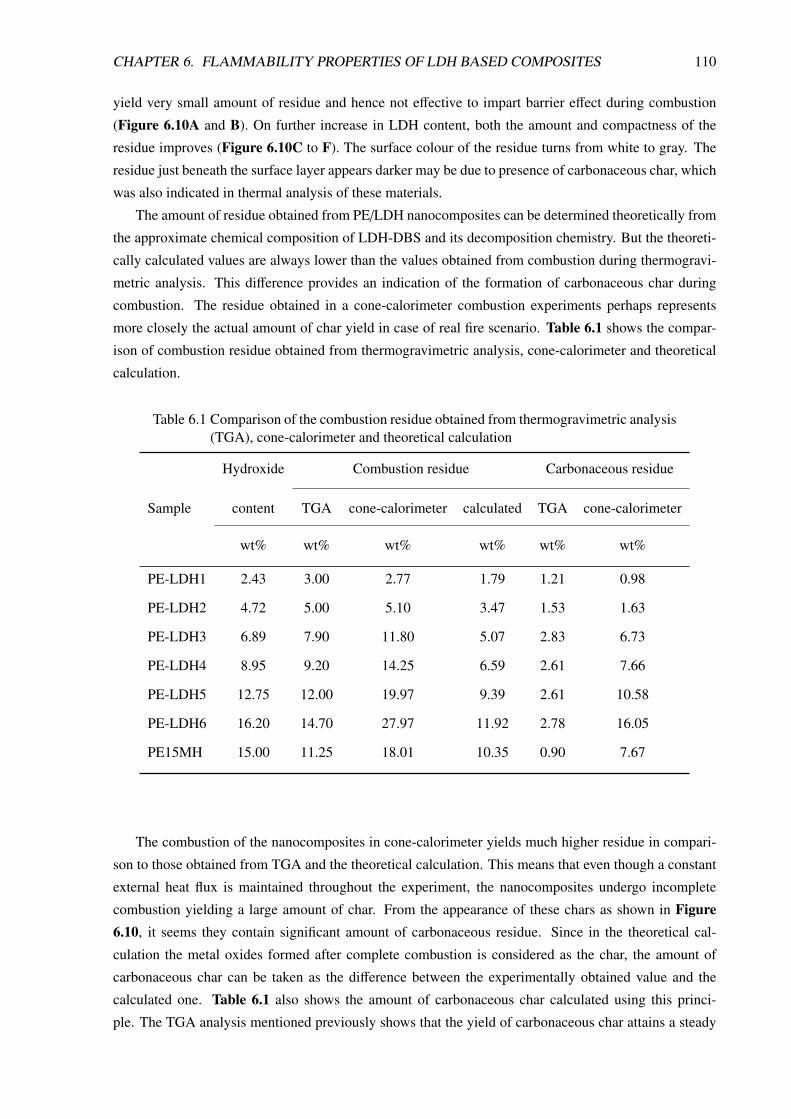
CHAPTER 6. FLAMMABILITY PROPERTIES OF LDH BASED COMPOSITES 110
yield very small amount of residue and hence not effective to impart barrier effect during combustion
(Figure 6.10A and B). On further increase in LDH content, both the amount and compactness of the
residue improves (Figure 6.10C to F). The surface colour of the residue turns from white to gray. The
residue just beneath the surface layer appears darker may be due to presence of carbonaceous char, which
was also indicated in thermal analysis of these materials.
The amount of residue obtained from PE/LDH nanocomposites can be determined theoretically from
the approximate chemical composition of LDH-DBS and its decomposition chemistry. But the theoreti-
cally calculated values are always lower than the values obtained from combustion during thermogravi-
metric analysis. This difference provides an indication of the formation of carbonaceous char during
combustion. The residue obtained in a cone-calorimeter combustion experiments perhaps represents
more closely the actual amount of char yield in case of real fire scenario. Table 6.1 shows the compar-
ison of combustion residue obtained from thermogravimetric analysis, cone-calorimeter and theoretical
calculation.
Table 6.1 Comparison of the combustion residue obtained from thermogravimetric analysis(TGA), cone-calorimeter and theoretical calculation
Hydroxide Combustion residue Carbonaceous residue
Sample content TGA cone-calorimeter calculated TGA cone-calorimeter
wt% wt% wt% wt% wt% wt%
PE-LDH1 2.43 3.00 2.77 1.79 1.21 0.98
PE-LDH2 4.72 5.00 5.10 3.47 1.53 1.63
PE-LDH3 6.89 7.90 11.80 5.07 2.83 6.73
PE-LDH4 8.95 9.20 14.25 6.59 2.61 7.66
PE-LDH5 12.75 12.00 19.97 9.39 2.61 10.58
PE-LDH6 16.20 14.70 27.97 11.92 2.78 16.05
PE15MH 15.00 11.25 18.01 10.35 0.90 7.67
The combustion of the nanocomposites in cone-calorimeter yields much higher residue in compari-
son to those obtained from TGA and the theoretical calculation. This means that even though a constant
external heat flux is maintained throughout the experiment, the nanocomposites undergo incomplete
combustion yielding a large amount of char. From the appearance of these chars as shown in Figure6.10, it seems they contain significant amount of carbonaceous residue. Since in the theoretical cal-
culation the metal oxides formed after complete combustion is considered as the char, the amount of
carbonaceous char can be taken as the difference between the experimentally obtained value and the
calculated one. Table 6.1 also shows the amount of carbonaceous char calculated using this princi-
ple. The TGA analysis mentioned previously shows that the yield of carbonaceous char attains a steady
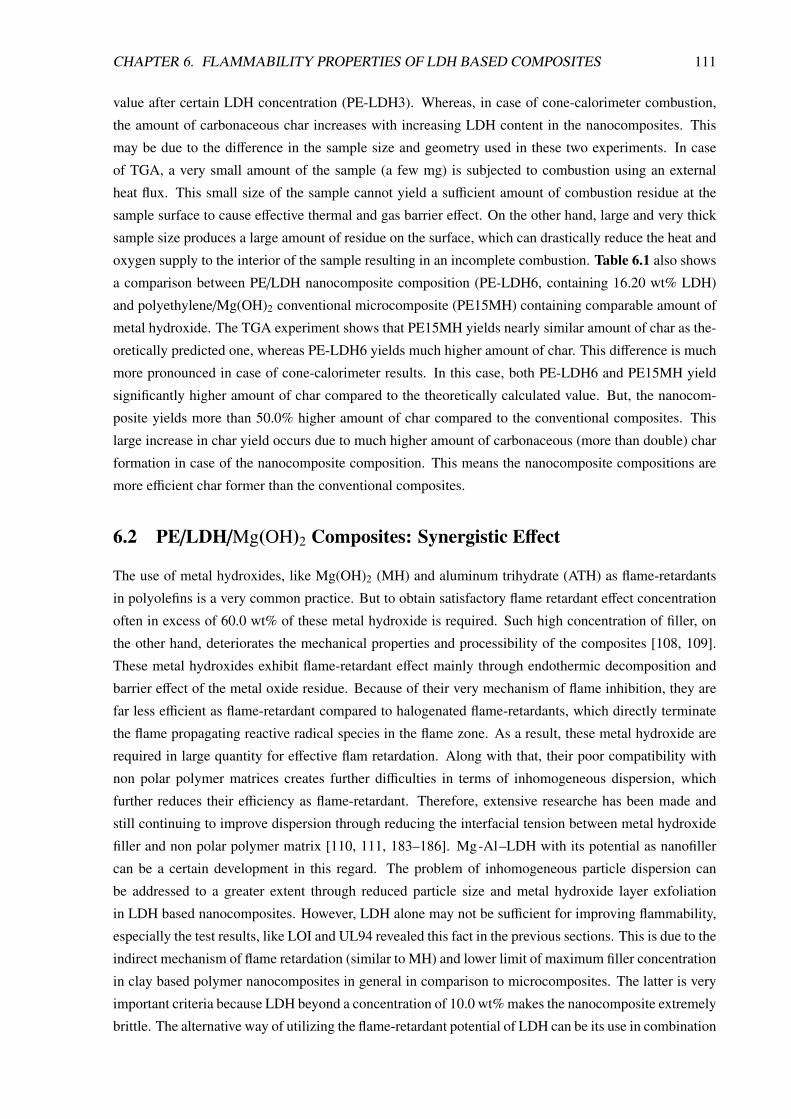
CHAPTER 6. FLAMMABILITY PROPERTIES OF LDH BASED COMPOSITES 111
value after certain LDH concentration (PE-LDH3). Whereas, in case of cone-calorimeter combustion,
the amount of carbonaceous char increases with increasing LDH content in the nanocomposites. This
may be due to the difference in the sample size and geometry used in these two experiments. In case
of TGA, a very small amount of the sample (a few mg) is subjected to combustion using an external
heat flux. This small size of the sample cannot yield a sufficient amount of combustion residue at the
sample surface to cause effective thermal and gas barrier effect. On the other hand, large and very thick
sample size produces a large amount of residue on the surface, which can drastically reduce the heat and
oxygen supply to the interior of the sample resulting in an incomplete combustion. Table 6.1 also shows
a comparison between PE/LDH nanocomposite composition (PE-LDH6, containing 16.20 wt% LDH)
and polyethylene/Mg(OH)2 conventional microcomposite (PE15MH) containing comparable amount of
metal hydroxide. The TGA experiment shows that PE15MH yields nearly similar amount of char as the-
oretically predicted one, whereas PE-LDH6 yields much higher amount of char. This difference is much
more pronounced in case of cone-calorimeter results. In this case, both PE-LDH6 and PE15MH yield
significantly higher amount of char compared to the theoretically calculated value. But, the nanocom-
posite yields more than 50.0% higher amount of char compared to the conventional composites. This
large increase in char yield occurs due to much higher amount of carbonaceous (more than double) char
formation in case of the nanocomposite composition. This means the nanocomposite compositions are
more efficient char former than the conventional composites.
6.2 PE/LDH/Mg(OH)2 Composites: Synergistic Effect
The use of metal hydroxides, like Mg(OH)2 (MH) and aluminum trihydrate (ATH) as flame-retardants
in polyolefins is a very common practice. But to obtain satisfactory flame retardant effect concentration
often in excess of 60.0 wt% of these metal hydroxide is required. Such high concentration of filler, on
the other hand, deteriorates the mechanical properties and processibility of the composites [108, 109].
These metal hydroxides exhibit flame-retardant effect mainly through endothermic decomposition and
barrier effect of the metal oxide residue. Because of their very mechanism of flame inhibition, they are
far less efficient as flame-retardant compared to halogenated flame-retardants, which directly terminate
the flame propagating reactive radical species in the flame zone. As a result, these metal hydroxide are
required in large quantity for effective flam retardation. Along with that, their poor compatibility with
non polar polymer matrices creates further difficulties in terms of inhomogeneous dispersion, which
further reduces their efficiency as flame-retardant. Therefore, extensive researche has been made and
still continuing to improve dispersion through reducing the interfacial tension between metal hydroxide
filler and non polar polymer matrix [110, 111, 183–186]. Mg-Al–LDH with its potential as nanofiller
can be a certain development in this regard. The problem of inhomogeneous particle dispersion can
be addressed to a greater extent through reduced particle size and metal hydroxide layer exfoliation
in LDH based nanocomposites. However, LDH alone may not be sufficient for improving flammability,
especially the test results, like LOI and UL94 revealed this fact in the previous sections. This is due to the
indirect mechanism of flame retardation (similar to MH) and lower limit of maximum filler concentration
in clay based polymer nanocomposites in general in comparison to microcomposites. The latter is very
important criteria because LDH beyond a concentration of 10.0 wt% makes the nanocomposite extremely
brittle. The alternative way of utilizing the flame-retardant potential of LDH can be its use in combination
CHAPTER 6. FLAMMABILITY PROPERTIES OF LDH BASED COMPOSITES 112
with MH with an aim to reduce the overall filler loading in a PE/MH type conventional flame-retardant
composites. In the present work, MH was partially replaced by an increasing amount of LDH and the
flammability performance of the composites were investigated. The maximum amount of LDH used for
such investigation was 10.0 wt%.
The LOI results for composites based on 40.0, 50.0 and 60.0 wt% MH are shown in Figure 6.11.
In each of these composites, MH is progressively replaced by LDH keeping the total amount of MH
and LDH concentration constant. The composites containing only MH are considered as the control
compounds for the respective series. It is apparent that as the combined systems show higher LOI values
than the control compounds and with increasing LDH proportion the LOI value also increases. Figure6.11 also shows that the composition PE/10LDH/30MH has similar LOI value as that of the composition
PE/50MH and the similar is true also in case of PE/10LDH/40MH and PE/60MH. This means that overall
filler loading in a PE/MH composite can be significantly reduced in presence of LDH to obtain desired
LOI values. The explanation of such synergism can be obtained if the burning process is observed
carefully. In case of composites containing only MH, the burn residue/char is held less firmly with the
sample stock. As a result, with increasing volume, the char falls down under its own weight exposing
fresh sample surface for burning. On the other hand, presence of LDH enhances the viscosity of the melt,
which support the growing char on its top and hence an efficient barrier effect is obtained. Additionaly,
the improved dispersion of LDH particles causes better distribution of cooling effects throughout the
matrix through endothermic decomposition during burning .
X=40 X=50 X=6018
21
24
27
30
33 32.0
29.0
27.227.8
25.924.725.0
23.722.7
Lim
ited
Oxy
gen
Inde
x (L
OI)
PE/LDH/MH composites
0LDH/XMH 5LDH/(X-5)MH 10LDH/(X-10)MH
Figure 6.11 Synergistic effect of LDH in Mg(OH)2 filled PE composites: LOI values have compared
between composites where magnesium hydroxide is being progressively replaced by
LDH (X represent total weight percent of filler i.e. Mg(OH)2 + LDH)
Thermogravimetric analysis shows that the thermo-oxidative degradation of PE/MH composites con-
taining 40 wt% MH starts at about 375 ℃ and continues up to about 475 ℃ (Figure 6.12). This decom-
position takes place in two distinct stages characterized by two decomposition peaks in differential plot
(Figure 6.12) at 400 ℃ and 460 ℃. During the first decomposition stage, which spans over an ap-
proximate range 375 – 425 ℃, PE/MH composites (containing 40.0 wt% MH) loses less than 25.0% of
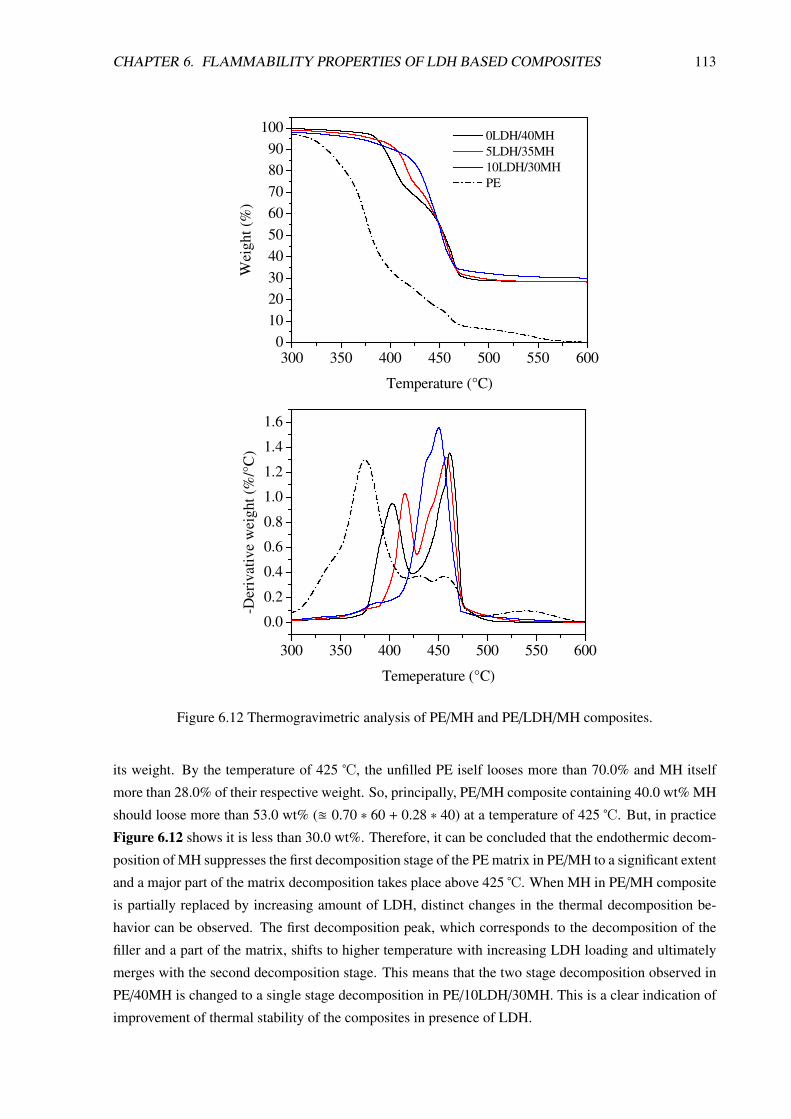
CHAPTER 6. FLAMMABILITY PROPERTIES OF LDH BASED COMPOSITES 113
300 350 400 450 500 550 6000
102030405060708090
100
300 350 400 450 500 550 600
0.0
0.2
0.4
0.6
0.8
1.0
1.2
1.4
1.6
Wei
ght (
%)
Temperature (°C)
0LDH/40MH 5LDH/35MH 10LDH/30MH PE
-Der
ivat
ive
wei
ght (
%/°
C)
Temeperature (°C)
Figure 6.12 Thermogravimetric analysis of PE/MH and PE/LDH/MH composites.
its weight. By the temperature of 425 ℃, the unfilled PE iself looses more than 70.0% and MH itself
more than 28.0% of their respective weight. So, principally, PE/MH composite containing 40.0 wt% MH
should loose more than 53.0 wt% (u 0.70 ∗ 60 + 0.28 ∗ 40) at a temperature of 425 ℃. But, in practice
Figure 6.12 shows it is less than 30.0 wt%. Therefore, it can be concluded that the endothermic decom-
position of MH suppresses the first decomposition stage of the PE matrix in PE/MH to a significant extent
and a major part of the matrix decomposition takes place above 425 ℃. When MH in PE/MH composite
is partially replaced by increasing amount of LDH, distinct changes in the thermal decomposition be-
havior can be observed. The first decomposition peak, which corresponds to the decomposition of the
filler and a part of the matrix, shifts to higher temperature with increasing LDH loading and ultimately
merges with the second decomposition stage. This means that the two stage decomposition observed in
PE/40MH is changed to a single stage decomposition in PE/10LDH/30MH. This is a clear indication of
improvement of thermal stability of the composites in presence of LDH.
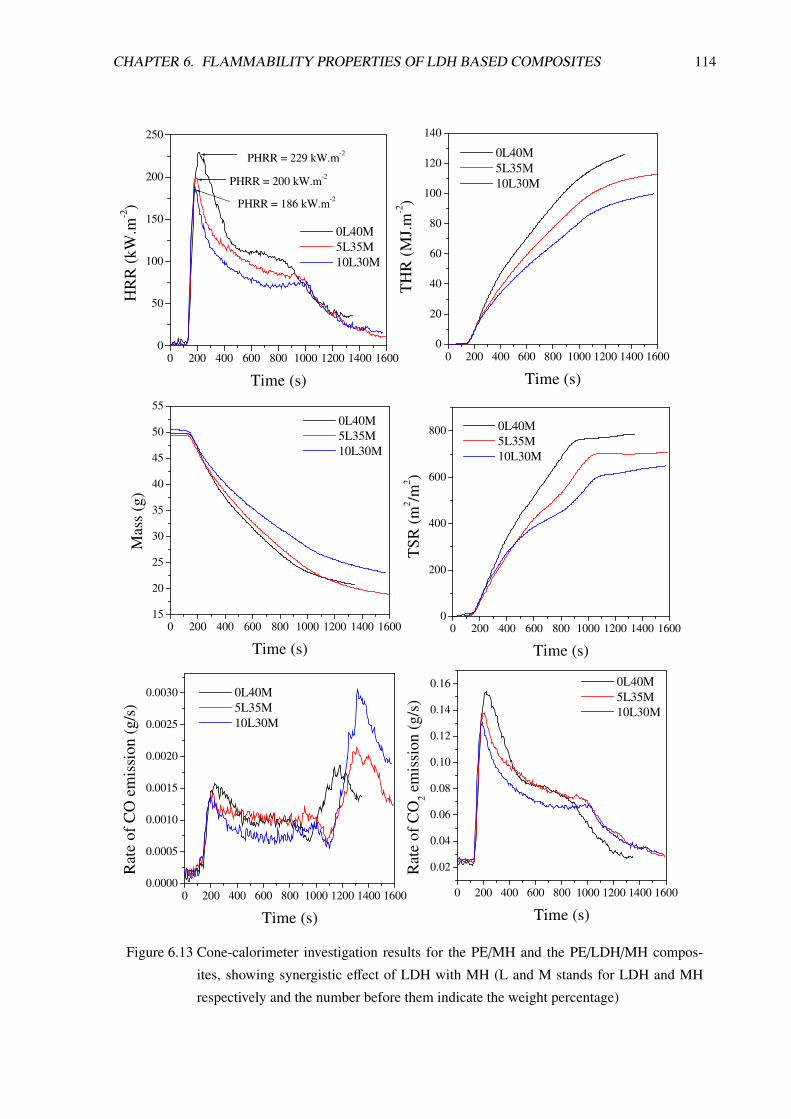
CHAPTER 6. FLAMMABILITY PROPERTIES OF LDH BASED COMPOSITES 114
0 200 400 600 800 1000 1200 1400 16000
50
100
150
200
250
0 200 400 600 800 1000 1200 1400 16000
20
40
60
80
100
120
140
PHRR = 186 kW.m-2
PHRR = 200 kW.m-2
PHRR = 229 kW.m-2
HR
R (k
W.m
-2)
Time (s)
0L40M 5L35M 10L30M
TH
R (M
J.m
-2)
Time (s)
0L40M 5L35M 10L30M
0 200 400 600 800 1000 1200 1400 160015
20
25
30
35
40
45
50
55
0 200 400 600 800 1000 1200 1400 16000
200
400
600
800
Mas
s (g
)
Time (s)
0L40M 5L35M 10L30M
TSR
(m2 /m
2 )
Time (s)
0L40M 5L35M 10L30M
0 200 400 600 800 1000 1200 1400 16000.0000
0.0005
0.0010
0.0015
0.0020
0.0025
0.0030
0 200 400 600 800 1000 1200 1400 1600
0.02
0.04
0.06
0.08
0.10
0.12
0.14
0.16
Rat
e of
CO
em
issi
on (g
/s)
Time (s)
0L40M 5L35M 10L30M
Rat
e of
CO
2 em
issi
on (g
/s)
Time (s)
0L40M 5L35M 10L30M
Figure 6.13 Cone-calorimeter investigation results for the PE/MH and the PE/LDH/MH compos-
ites, showing synergistic effect of LDH with MH (L and M stands for LDH and MH
respectively and the number before them indicate the weight percentage)
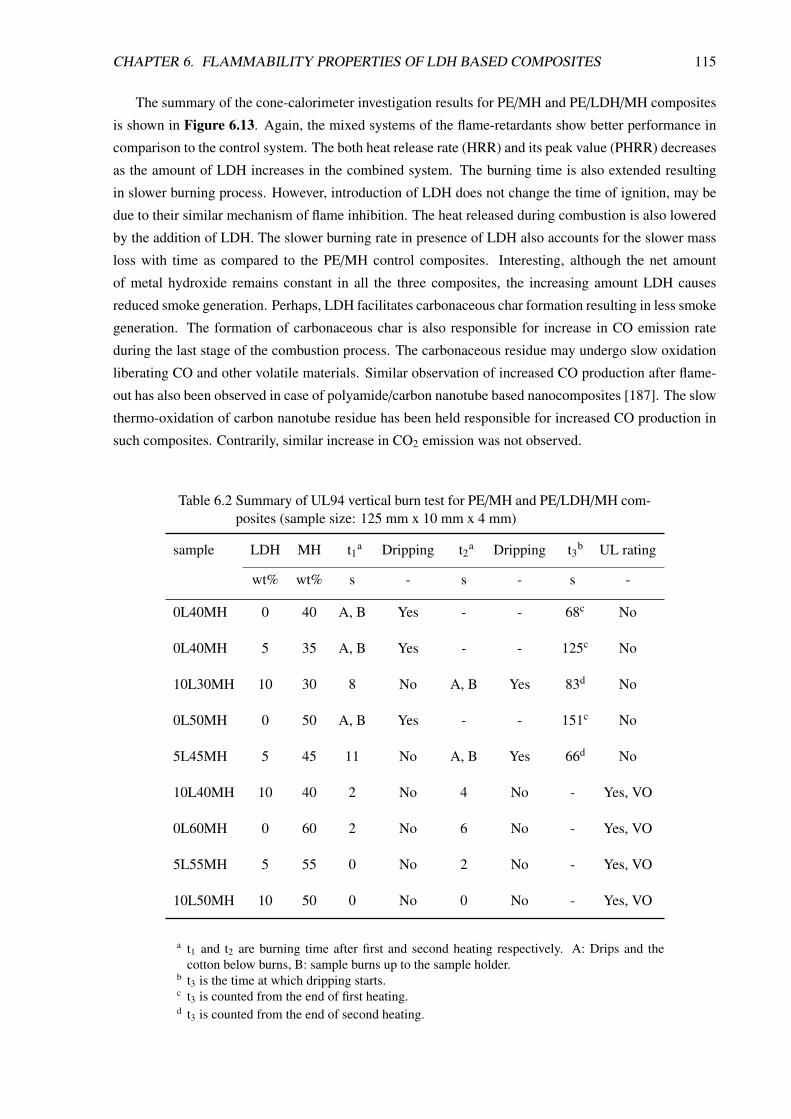
CHAPTER 6. FLAMMABILITY PROPERTIES OF LDH BASED COMPOSITES 115
The summary of the cone-calorimeter investigation results for PE/MH and PE/LDH/MH composites
is shown in Figure 6.13. Again, the mixed systems of the flame-retardants show better performance in
comparison to the control system. The both heat release rate (HRR) and its peak value (PHRR) decreases
as the amount of LDH increases in the combined system. The burning time is also extended resulting
in slower burning process. However, introduction of LDH does not change the time of ignition, may be
due to their similar mechanism of flame inhibition. The heat released during combustion is also lowered
by the addition of LDH. The slower burning rate in presence of LDH also accounts for the slower mass
loss with time as compared to the PE/MH control composites. Interesting, although the net amount
of metal hydroxide remains constant in all the three composites, the increasing amount LDH causes
reduced smoke generation. Perhaps, LDH facilitates carbonaceous char formation resulting in less smoke
generation. The formation of carbonaceous char is also responsible for increase in CO emission rate
during the last stage of the combustion process. The carbonaceous residue may undergo slow oxidation
liberating CO and other volatile materials. Similar observation of increased CO production after flame-
out has also been observed in case of polyamide/carbon nanotube based nanocomposites [187]. The slow
thermo-oxidation of carbon nanotube residue has been held responsible for increased CO production in
such composites. Contrarily, similar increase in CO2 emission was not observed.
Table 6.2 Summary of UL94 vertical burn test for PE/MH and PE/LDH/MH com-posites (sample size: 125 mm x 10 mm x 4 mm)
sample LDH MH t1a Dripping t2a Dripping t3b UL rating
wt% wt% s - s - s -
0L40MH 0 40 A, B Yes - - 68c No
0L40MH 5 35 A, B Yes - - 125c No
10L30MH 10 30 8 No A, B Yes 83d No
0L50MH 0 50 A, B Yes - - 151c No
5L45MH 5 45 11 No A, B Yes 66d No
10L40MH 10 40 2 No 4 No - Yes, VO
0L60MH 0 60 2 No 6 No - Yes, VO
5L55MH 5 55 0 No 2 No - Yes, VO
10L50MH 10 50 0 No 0 No - Yes, VO
a t1 and t2 are burning time after first and second heating respectively. A: Drips and thecotton below burns, B: sample burns up to the sample holder.
b t3 is the time at which dripping starts.c t3 is counted from the end of first heating.d t3 is counted from the end of second heating.
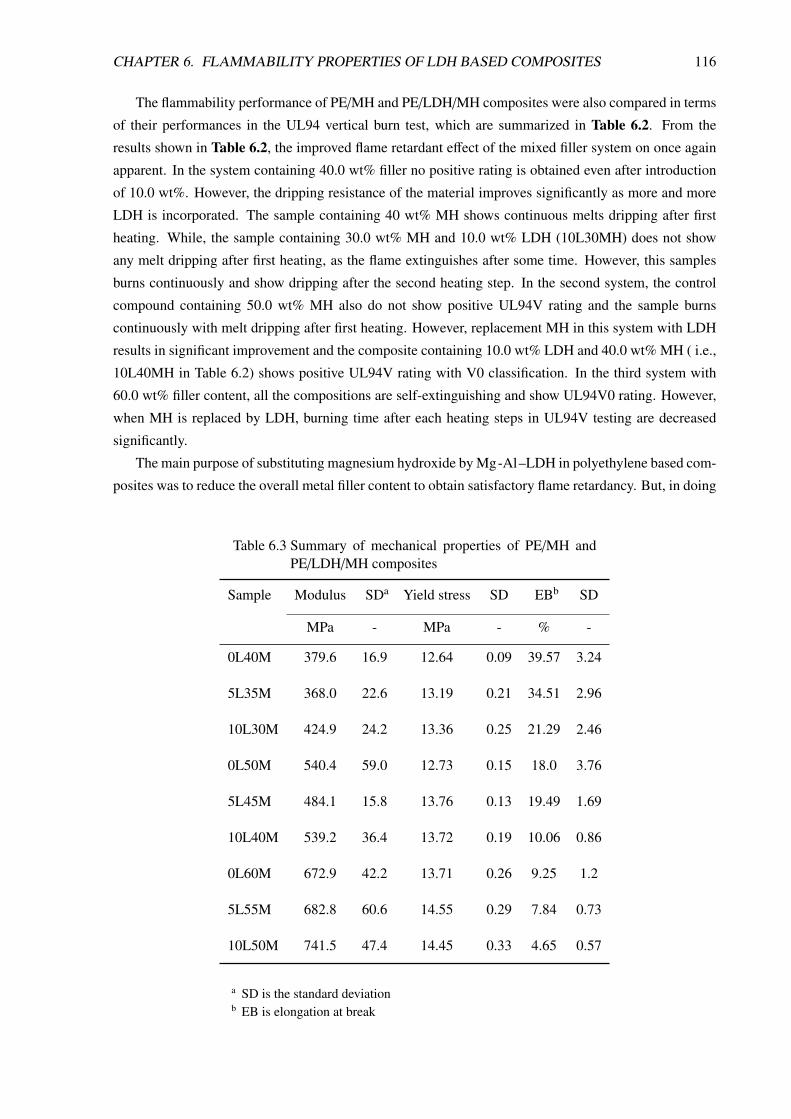
CHAPTER 6. FLAMMABILITY PROPERTIES OF LDH BASED COMPOSITES 116
The flammability performance of PE/MH and PE/LDH/MH composites were also compared in terms
of their performances in the UL94 vertical burn test, which are summarized in Table 6.2. From the
results shown in Table 6.2, the improved flame retardant effect of the mixed filler system on once again
apparent. In the system containing 40.0 wt% filler no positive rating is obtained even after introduction
of 10.0 wt%. However, the dripping resistance of the material improves significantly as more and more
LDH is incorporated. The sample containing 40 wt% MH shows continuous melts dripping after first
heating. While, the sample containing 30.0 wt% MH and 10.0 wt% LDH (10L30MH) does not show
any melt dripping after first heating, as the flame extinguishes after some time. However, this samples
burns continuously and show dripping after the second heating step. In the second system, the control
compound containing 50.0 wt% MH also do not show positive UL94V rating and the sample burns
continuously with melt dripping after first heating. However, replacement MH in this system with LDH
results in significant improvement and the composite containing 10.0 wt% LDH and 40.0 wt% MH ( i.e.,
10L40MH in Table 6.2) shows positive UL94V rating with V0 classification. In the third system with
60.0 wt% filler content, all the compositions are self-extinguishing and show UL94V0 rating. However,
when MH is replaced by LDH, burning time after each heating steps in UL94V testing are decreased
significantly.
The main purpose of substituting magnesium hydroxide by Mg-Al–LDH in polyethylene based com-
posites was to reduce the overall metal filler content to obtain satisfactory flame retardancy. But, in doing
Table 6.3 Summary of mechanical properties of PE/MH andPE/LDH/MH composites
Sample Modulus SDa Yield stress SD EBb SD
MPa - MPa - % -
0L40M 379.6 16.9 12.64 0.09 39.57 3.24
5L35M 368.0 22.6 13.19 0.21 34.51 2.96
10L30M 424.9 24.2 13.36 0.25 21.29 2.46
0L50M 540.4 59.0 12.73 0.15 18.0 3.76
5L45M 484.1 15.8 13.76 0.13 19.49 1.69
10L40M 539.2 36.4 13.72 0.19 10.06 0.86
0L60M 672.9 42.2 13.71 0.26 9.25 1.2
5L55M 682.8 60.6 14.55 0.29 7.84 0.73
10L50M 741.5 47.4 14.45 0.33 4.65 0.57
a SD is the standard deviationb EB is elongation at break
CHAPTER 6. FLAMMABILITY PROPERTIES OF LDH BASED COMPOSITES 117
so the effects on other properties should also be considered, such as mechanical properties and proces-
sibility. In fact the deterioration of these properties in the composites containing mixed filler system,
is not encouraging for their final applications. Therefore, increase in proportion of LDH in a MH/LDH
combination is limited by the processibility and the mechanical properties of the composites. Table 6.3shows the summary of the mechanical properties of various PE/LDH/MH compositions investigated in
the present work.
The incorporation of LDH up to 10.0 wt% does not deteriorate the modulus and yield strength of the
composites rather a small increase in both the properties were observed. However, at 10.0 wt% LDH
content, especially in composites with high total filler concentration (as in 10L50M), the flexibility of
final composites is affected significantly indicating the lowering of the impact strength of the materials.
To obtain a optimum combination of LDH and MH in polyethylene and other polyolefin matrices more
rigorous and detail investigation are necessary. May be the use of some compatibilizer or impact modifier
would be a potential solution for this limitation.

C7
C O
The present investigation is primarily aimed to investigate the potential of layered double hydroxide
based on aluminum and magnesium (Mg-Al–LDH) as a flame-retardant and nanofiller in a polyolefin
matrix, like low density polyethylene. The reason behind selection of Mg-Al–LDH is manifold. For
example, Mg-Al–LDH can be treated as a novel metal hydroxide type filler, which has close similarity
to both conventional metal hydroxides, like Mg(OH)2, Al(OH)3, etc (with respect to its endothermic
decomposition) and layered silicate type of nanofillers (with respect to its ability to intercalate with large
organic species). The similarity with Mg(OH)2 makes it a suitable material to improve the flame retar-
dancy of the filled polymeric composites mainly through endothermic decomposition and large amount
of non-conducting char formation. On the other hand, the similarity with layered silicate type of con-
ventional nanofillers can be explored through intercalation and exfoliation by the polymer chains to
obtain better dispersion of the filler particle in polymer matrix in comparison to the conventional metal
hydroxide. Besides, Mg-Al–LDH is a naturally occurring minerals and can also be synthesized in lab-
oratory in large scale by easy methods to obtain more homogeneity in structure and compositions. The
bio-compatible nature of this anionic clay is also suitable for designing an environment friendly flame-
retardant for polymers.
To make the unmodified Mg-Al–LDH clay a suitable precursor for the preparation of polymer nano-
composite, modification by anionic surfactants is necessary. In fact, a number of such surfactants were
used in the present study to modify Mg-Al–LDH in order to enlarge the interlayer distance and to ren-
der it more organophilic. The surfactants were selected based on their functionality, chain length, etc.
Although there are several method reported in literature for organic modification of LDH in general, the
regeneration technique was deliberately chosen because of its higher efficiency and simple procedure.
Other methods, like co-precipitation in presence of surfactant anions, direct ion exchange, etc would be
the better alternative can also be used for this purpose. The characterization of the organically modified
Mg-Al–LDH was carried out extensively using various analytical techniques, like XRD, FTIR, TGA,
SEM and surface tension measurements. The XRD analysis of the modified clay reveals that the sur-
factant anions are arranged as monolayer within the interlayer region of Mg-Al–LDH and enlarge the
interlayer distance according to the length of their hydrocarbon chain. Some water molecules are also
found to be present in the interlayer region in the modified LDH, which are usually arranged as mono-
layer in between surfactant and metal hydroxide sheet. However, in case of the surfactant having more
crowded hydrocarbon chain (for example, containing two hydrocarbon chains as in BEHP) no interlayer
water was detected in the modified sample. From the various functionalities of the surfactants, Mg-Al–
LDH shows more affinity to sulfate and sulfonate, which was confirmed from the purity of their WAXS
118
CHAPTER 7. CONCLUSIONS AND OUTLOOKS 119
pattern. In case of LDH-DS and LDH-DBS, no peak corresponding to the unmodified clay was detected.
However, with phosphate and carboxylate, formation of some unmodified LDH during regeneration pro-
cess was indicated from the presence its characteristic reflection maximum in WAXS pattern of the
modified materials. The original plate-like particle morphology of the unmodified LDH materials is not
changed after organic modification except the appearance surface roughness and disordered edges. The
intercalation of bigger anionic species into the interlayer space results swelling of the LDH platelets. The
thermal analysis reveals that unmodified Mg-Al–LDH show large decomposition peaks below 300℃ due
to the complete loss of interlayer water molecules and the partial loss of carbonate anions. The organic
modification, especially with SDBS, either significantly suppresses these peaks or shifts them to higher
temperature. The modified LDH materials in addition to modifying surfactant anions, also contain some
interlayer water and carbonate anions, which are incorporated during regeneration process. Surface en-
ergy measurements using capillary penetration method reveal that the organic modification makes the
LDH clay more hydrophobic, which results lowering of surface energy significantly in comparison to a
similar unmodified metal hydroxide particles (Mg(OH)2).
The primary aim of organic modification of unmodified Mg-Al–LDH was to render it suitable for
the polymer nanocomposite preparation. In this regard, LDH-DBS was chosen because it has the largest
interlayer distance among all the modified sample prepared. Also DBS shows higher efficiency of in-
tercalation compared to the other surfactants. Besides, the presence of aromatic moiety in its struc-
ture facilitates the formation of higher amount of carbonaceous char after combustion of the PE/LDH
nanocomposite. This becomes more important when modified clay contains large fraction of the inter-
calated surfactant, which is above 40% incase of LDH-DBS. To prepare nanocomposite based on PE
matrix using melt compounding method, conventional masterbatch technique was followed. This was an
obvious choice rather than an arbitrary one as a highly nonpolar PE matrix hardly intercalate itself within
the interlayer space of inorganic clays. Therefore, a functionalized polymer (PE-g-MAH) was used as
compatibilizer between the two. However, mixing in batch-mixture, like Brabender plasticorder, where
shearing force was less intense resulting in a lower degree of intercalation/exfoliation of the clay parti-
cles by polymer chains. The WAXS pattern of these nanocomposite did not show any change in position
of the basal reflection peaks corresponding to LDH-DBS. The TEM images reveal the partial exfoliated
and intercalated structure of the dispersed clay particles and also the presence of aggregated structures
among the primary clay particles. On the other hand, compounding in a co-rotating twin-screw extruder
results in a better dispersion of clay particles with higher degree of intercalation and exfoliation of the
clay platelets. Overall, in the nanocomposites hierarchy of structural features of the dispersed LDH par-
ticles was observed. The primary particles, which are single LDH platelet containing large number of
metal hydroxide sheets, not only undergo breakdown in smaller fragments through delamination of thin-
ner stacks from their surface, but also form aggregates that look more precisely like domains of closely
associated platelets. The exfoliated fragments or clay layers either remain scattered in the matrix or form
localized region of physically network structures.
The melt rheological analysis of PE/LDH nanocomposite shows flow behavior typical of poly-
mer/layered silicate nanocomposites, which have extensively been reported in literatures. This was not
only helpful to understand the flow behavior of the composite melts under different shearing conditions,
but was also useful in understanding the nature of LDH particle dispersion and possible filler-filler and
filler-polymer interaction in the nanocomposites. The dynamic oscillatory shearing in linear viscoelastic
CHAPTER 7. CONCLUSIONS AND OUTLOOKS 120
regime reveals that with increasing LDH concentration, the nanocomposite melts progressively deviate
from the low-frequency Newtonian behavior to a strong shear thinning behavior. Also the pseudo-solid
like behavior becomes more and more prominent with the appearance of apparent yield stress. Such
deviation in the low frequency flow behavior is caused by the dispersed LDH particles and their physical
networked structures, which creates an energy barrier against the relaxation of the polymer chains. This
also gives indirect evidence that polymer chains are interlocked on the LDH particle surface or within
clusters. The morphological analysis shows that the dispersed LDH particles form physically associated
structures in different scales. As a result, the response of these nanocomposite melts during shearing
in non-linear regime differs significantly from that of the unfilled PE melt. It is observed that steady
shearing causes breakdown of the filler structures until a steady state is reached. This is manifested in
the form of stress overshoot at the start-up flows during steady shear. Such behavior is also observed
in unfilled PE melt, but the time scale and magnitude of stress overshoot differ drastically from the
nanocomposites. Also, the non-linear behavior in the nanocomposite melts appear at lower shear rate
and strain. The ruptured filler structures are regenerated with time when shearing is stopped and the
melts are allowed to equilibrate. The structural regeneration progressively enhances the elastic nature
of the melt as indicated by a steady increase in storage modulus of the melt with time. This kind of
non-linear behavior is not commonly observed in conventional micro- or macrocomposites containing
inactive filler particles. To predict these non-linear flow behavior theoretically Wagner model was used
as starting tool as it quite satisfactorily describes the non-linear behavior of unfilled PE melt. The mod-
ification of the original model is made considering the non-linear parameter β being dependent on the
structure build-up in the nanocomposite melts. This parameter changes with time during steady shear
and upon cessation of steady shear. This gives a quantitative prediction of the stress overshoot behavior
of the nanocomposite melts and its dependence on rest period during a flow reversal experiment. How-
ever, to describe the experimentally observed behavior more precisely further investigation is necessary
regarding the dependence of β on shear rate, filler loading and temperature during steady shear.
The flammability studies of the PE/LDH nanocomposites showed improved flame retardancy in com-
parison to the ulfilled PE. The LOI value was progressively improved with increasing LDH concentration.
Though the nanocomposite compositions did not pass any UL94 testing standard, they exhibit stronger
resistance against the dripping tendency of the melt during burning process. The cone-calorimeter in-
vestigation results showed that LDH can suppress the combustion process and significantly reduces the
burning rate in comparison to unfilled PE. This is important as this type of behavior provides a longer
escape time during real life fire accidents. The peak heat release rate (PHRR) was significantly reduced
in nanocomposite compositions containing over 5 wt% LDH. The LDH materials also show synergistic
effect in presence of conventional flame-retardant Mg(OH)2 in PE. When the later is partially replaced
by organically modified Mg-Al–LDH (up to 10 wt% of the total composition was tried), the LOI index
is improved significantly. In comparison to only Mg(OH)2 based composites, such combinations also
results satisfactory flammability rating in UL94 testing at lower net filler concentrations. The mechan-
ical properties of the composites based on mixed system also show marginal improvement compared
to their counterparts. This is certainly a promising development as this may lead to the lowering filler
concentration required in the conventional metal hydroxide based flame-retardant polyolefin composites
without any compromise in flammability ratings and mechanical properties. This synergistic approach
has certainly a tremendous potential in reducing the total flame retardant concentration in polymer com-
CHAPTER 7. CONCLUSIONS AND OUTLOOKS 121
posites. The char forming ability of LDH has been demontrated in this study, which might be very useful
in combination with conventional active flame-retardants, like phosphates.
The potential of the Mg-Al–LDH clay as nanofiller in non-polar polymer, like polyethylene has been
demonstrated in the present study. The very target behind such application is to obtain high degree of ex-
foliation of the clay layers. However, the use of non-polar polymers always makes this task a challenging
one. The unfavorable thermodynamic compatibility between the clay particles and non-polar matrix al-
ways acts as a strong barrier not only against the penetration of the polymer chain within the clay layers,
but also against the formation of stable homogeneous distribution of the exfoliated clay layers through-
out the matrix. This also common in case of various layered silicate based polyolefin nanocomposites.
In spite of this difficulties some degree of exfoliation and better clay particle dispersions are achieved
with polyolefin in comparison to conventional inorganic fillers, like Mg(OH)2, hydrated Al(OH)3, etc.
The use of LDH as flame-retardant has certain advantage over layered silicate type cationic clays. Un-
like layered silicate, LDHs actively take part in flame inhibition through its endothermic decomposition,
which in addition to the physical barrier effect obtained from the inorganic combustion residue provides
extra measure against flame inhibition. Again, the inherent bio-compatible nature of the Mg-Al–LDH
may also make it attractive to flame-retardant industries as alternative to halogen containing chemicals.
The present study highlighted these perspectives with some significant property improvements, espe-
cially the flame retardancy at lower filler concentration. This study has also opened new possibilities of
investigations regarding the use of LDH type clays in polymer as nanofiller. The improvement of LDH
particle dispersion in polymer matrix is certainly desired for further improvement in properties, espe-
cially mechanical properties. Such improvements will certainly be helpful to develop flame-retardant
composites showing satisfactory mechanical properties and processibility, which are compromised in
case of conventional metal hydroxide type flame-retardants.
The selection of surfactants for organic modification needs more critical attention with respect to
their structural and chemical variations. Very low molecular weight functionalized polymer containing
carboxylate (like, copolymers of acrylic acids), sulfonate, etc can also be potential candidates for this
purpose. The cationic nature of the metal hydroxide layers in LDH makes the choice of organic species
more flexible. Organic species containing functional groups -OH, -COOH, -SO3H, etc shows favor-
able interaction with LDH clays. Therefore, LDH can be modified with wide range of organic species.
Such flexibility in selecting modifying anionic species makes LDH a suitable candidate for designing a
multifunctional nanohybrids filler for polymers. For example, LDH can be modified by organic species
having specific properties, like UV absorption [188], photo stabilization[189], antimicrobial effect [190],
fluorescent effect [85], etc. All these nanohybrids can be potential functionalized fillers for polymers to
develop novel composite materials.
References
[1] National fire protection association fire loss in the U.S. during 2005 abridged report
(http://www.usfa.dhs.gov/statistics/national/).
[2] A. R. Horrocks and D. Price (ed). Fire Retardant Materials. Woodhead Publishing Limited,
Cambridge, England, 2001.
[3] G. E. Zaikov and S. M. Lomakin. Ecological issue of polymer flame retardancy. Journal of
Applied Polymer Science, 86:2249 – 2462, 2002.
[4] S. M. Lomakin and G. E. Zaikov. Modern Polymer Flame Retardancy. VSP Publishers, Nether-
lands, 2003.
[5] F. Cavani, F. Trifiro, and A. Vaccari. Hydrotalcite-type anionic clays: Preparation, properties and
applications. Catalysis Today, 11:173 – 301, 1991.
[6] M. Meyn, K. Beneke, and G. Legaly. Anionic-exchange reactions of layered double hydroxides.
Inorganic Chemistry, 29:5201 – 5207, 1990.
[7] S. Miyata. Physico-chemical properties of synthetic hydrotalcites in relation to composition. Clays
and Clay Minerals, 28:50 – 56, 1980.
[8] M. D. Arco, E. Cebadera, S. Gutierrez, C. Martin, M. J. Montero, V. Rives, J. Rocha, and M. A.
Sevilla. Mg,Al layered double hydroxides with intercalated indomethacin: Synthesis, characteri-
zation, and pharmacological study. Journal of Pharmaceutical Sciences, 93:1649 – 1658, 2004.
[9] T. S. Stanimirova, G. Kirov, and E. Dinolova. Mechanism of hydrotalcite regeneration. Journal
of Material Science Letter, 20:453 – 455, 2001.
[10] W. T. Reichle. Synthesis of anionic clay minerals (mixed metal hydroxides, hydrotalcite. Solid
State Ionics, 22:135 – 141, 1986.
[11] O. Clause, M. Gazzano, F. Trifiro, A. Vaccari, and L. Zatroski. Preparation and thermal reactivity
of nickel/chromium and nickel/aluminium hydrotalcite-type precursors. Applied Catalysis, 73:217
– 236, 1991.
[12] O. Clause, B. Rebours, E. Merlen, F. Trifir, and A. Vaccari. Preparation and characterization of
nickel-aluminium mixed oxides obtained by thermal decomposition of hydrotalcite-type precur-
sors. Journal of Catalysis, 133:231 – 246, 1992.
122
REFERENCES 123
[13] M. Sychev, R. Prihodko, K. Erdmann, A. Mangel, and R. A. van Santen. Hydrotalcites: relation
between structural features, basicity and activity in the wittig reaction. Applied Clay Science,
18:103 – 110, 2001.
[14] U. Costantino, F. Marmottini, M. Nocchetti, and R. Vivani. New synthetic routes to hydrotalcite-
like compounds- characterization and properties of the obtained materials. Europian Journal of
Inorganic Chemistry, pages 1434 – 1446, 1998.
[15] M. Ogawa and H. Kaiho. Homogeneous precipitation of uniform hydrotalcite particles. Langmuir,
18:4240 – 4242, 2002.
[16] P. Yang, J. Yu, Z. Wang, Q. Liu, and T. Wu. Urea method for the synthesis of hydrotalcites. Reac.
Kinetics Catal. Lett., 83:275 – 282, 2004.
[17] A. I. Khan and D. O’Hare. Intercalation chemistry of layered double hydroxides: recent develop-
ments and applications. Journal of Materials Chemistry, 12:3191 – 3198, 2002.
[18] K. E. Malki, M. Guenane, C. Forano, A. De Roy, and J. P. Besse. Inorganic and organic anionic
pillars intercalated in lamellar double hydroxides. Material Science Forum, 91 – 93:171 – 176,
1992.
[19] R. P. Bontchev, S. Liu, J. L. Krumhansi, J. Voigt, and T. M. Nenoff. Synthesis, characterization,
and ion exchange properties of hydrotalcite Mg6Al2(OH)16(A)x(A’)2−x4H2O(A,A’ = Cl−,Br−, I−,
and NO3−, 2 ≥ x ≥ 0) derivatives. Chemistry of Materials, 15:3669 – 3675, 2003.
[20] G. Mascolo. Synthesis of anionic clays by hydrothermal crystallization of amorphous precursors.
Applied Clay Science, 10:21 – 30, 1995.
[21] V. Prevot, C. Forano, and J. P. Besse. Hybrid derivative of layered double hydroxides. Applied
Clay Science, 18:3 – 15, 2001.
[22] S. Carlino. The intercalation of carboxylic acids into layered double hydroxides: A critical review
of the different methods. Solid State Ionics, 98:73 – 84, 1997.
[23] F. Leroux and J. P. Besse. Polymer interleaved layered double hydroxide: A new emerging class
of nanocomposites. Chemisty of Materials, 13:3507 – 3515, 2001.
[24] N. T. Whilton, P. J. Vickers, and S. Mann. Bioinorganic clays: synthesis and characterization of
amino- and polyamino acid intercalated layered double hydroxide. Journal of Materials Chem-
istry, 7:1623 – 1629, 1997.
[25] C. Vaysse, L. Guerlou-Demourgues, E. Duguet, and C. Delmas. Acrylate intercalation and in situ
polymerization in iron-, cobalt-, or manganese-substituted nickel hydroxides. Inorganic Chem-
istry, 42:4559 – 4567, 2003.
[26] W. F. Lee and Y. C. Chen. Superabsorbent polymeric materials. xiv. preparation and water ab-
sorbancy of nanocomposite superabsorbents containing intercalated hydrotalcite. Journal of Ap-
plied Polymer Science, 94:2417 – 2424, 2004.
REFERENCES 124
[27] E. M. Moujahid, J. P. Besse, and F. Leroux. Synthesis and characterization of a polystyrene
sulfonate layered double hydroxide nanocomposite. in-situ polymerization vs. polymer incorpo-
ration. Journal of Materials Chemistry, 12:3324 – 3330, 2002.
[28] J. P. Besse E. M. Moujahid, M. Dubois and F. Leroux. Role of atmospheric oxygen for the
polymerization of interleaved aniline sulfonic acid in LDH. Chemisty of Materials, 14:3799 –
3807, 2002.
[29] M. Tanaka, I. Y. Park, K. Kuroda, and C. Kato. Formation of hydrotalcite-acrylate intercalation
compounds and their heat treated product. Bull. Chem. Soc. Jpn., 62:3442, 1989.
[30] V. P. Isupov, L. E. Chupakhina, M. A. Ozerova, V. G. Kostrovsky, and V. A. Poluboyarov. Poly-
merization of m-NH2C6H4COO anions in the intercalation compounds of aluminium hydroxide
[LiAl2(OH)6][m-NH2C6H4COO].nH2O. Solid States Ionics, 141-142:231 – 236, 2001.
[31] L. Vieille, C. Taviot-Gueho, J. P. Besse, and F. Leroux. Hydrocalumite and its polymer deriva-
tives. 2. polymer incorporation versus in situ polymerization of styrene-4-sulfonate. Chemisty of
Materials, 15:4369 – 4376, 2003.
[32] L. Vieille, E. M. Moujahid, C. Tavoit-Gueho, J. Cellier, J. P. Besse, and F. Leroux. In situ poly-
merization of interleaved monomers: a comparative study between hydrotalcite and hydrocalumite
host structuresq. Journal of Physics and Chemistry of Solids, 65:385 – 393, 2004.
[33] C. Roland-Swanson, J. P. Besse, and F. Leroux. Polymerization of sulfopropyl methacrylate, a
surface active monomer, withing layered double hydroxide. Chemisty of Materials, 16:5512 –
5517, 2004.
[34] G. A. Wang, C. C. Wang, and C. Y. Chen. The disorderly exfoliated LDHs/PMMA nanocomposite
synthesized by in situ bulk polymerization. Polymer, 46:5065 – 5074, 2005.
[35] G. A. Wang, C. C. Wang, and C. Y. Chen. Preparation and characterization of layered dou-
ble hydroxides - PMMA nanocomposites by solution polymerization. Journal of Inorganic and
Organometallic Polymers and Materials, 15:239 – 251, 2005.
[36] T. Challier and R. C. T. Slade. Nanocomposite materials: Polyaniline-intercalated layered double
hydroxides. Journal of Materials Chemistry, 4:367 – 371, 1994.
[37] Y. Sugahara, N. Yokoyama, K. Kuroda, and C. Kato. Preparation and properties of silica and
silicate gels by the alkoxide, colloidal and amine-silicate methods. Ceramic International, 14:163
– 167, 1988.
[38] H. B. Hsueh and C. Y. Chen. Preparation and properties of LDHs/polyimide nanocomposites.
Polymer, 44:1151 – 1161, 2003.
[39] S. O’Leary, D. O’Hare, and G. Seely. Delamination of layered double hydroxides in polar
monomers: new ldh-acrylate nanocomposites. Chemical Communication, 14:1506 – 1507, 2002.
[40] P. B. Messersmith and S. I. Stupp. High-temperature chemical and microstructural transformations
of a nanocomposite organoceramic. Chemisty of Materials, 7:454 – 560, 1995.

REFERENCES 125
[41] C. O. Oriakhi, I. V. Farr, and M. M. Lerner. Incorporation of poly (acrylic acid), poly (vinyl-
sulfonate) and poly (styrenesulfonate) within layered double hydroxides. Journal of Materials
Chemistry, 6:103 – 107, 1996.
[42] O. C. Wilson Jr., T. Olorunyolemi, A. Jaworski, L. Borum, D. Young, A. Siriwat, E. Dickens,
C. Oriakhi, and M. Lerner. Surface and interfacial properties of polymer-intercalated layered
double hydroxide nanocomposites. Applied Clay Science, 15:265 – 279, 1999.
[43] F. Leroux, P. Aranda, J. P. Besse, and E. Ruiz-Hitzky. Intercalation of poly(ethylene oxide) deriva-
tives into layered double hydroxides. Eur. J. Inorg. Chem., 6:1242 – 1251, 2003.
[44] M. Meyn, K. Beneke, and G. Legaly. Anionic-exchange reactions of hydroxy double salts. Inor-
ganic Chemistry, 32:1209 – 1215, 1993.
[45] Y. You, H. H. Zhao, and G. F. Vance. Surfactant-enhanced adsorption of organic compounds by
layered double hydroxide. Collid and Surf. A: Phys. Engg. Asp., 205:161 – 172, 2002.
[46] Y. You, H. H. Zhao, and G. F. Vance. Hybrid organic-inorganic derivatives of layered double
hydroxides and dodecylbenzenesulfonate: Preparation and adsorption characteristics. Journal of
Materials Chemistry, 12:907 – 912, 2002.
[47] W. Chen and B. Qu. Structural characteristics and thermal properties of PE-g-MA/MgAl-LDH
exfoliation nanocomposites synthesized by solution intercalation. Chemisty of Materials, 15:3208
– 3213, 2003.
[48] W. Chen, L. Feng, and B. Qu. Preparation of nanocomposites by exfoliation of ZnAl layered
double hydroxides in nonpolar LLDPE solution. Chemisty of Materials, 16:368 – 370, 2004.
[49] L. Qui, W. Chen, and B. Qu. Structural characterisation and thermal properties of exfoliated
polystyrene/ZnAl layered double hydroxide nanocomposites prepared via solution intercalation.
Polymer Degradation and Stability, 87:433 – 440, 2005.
[50] G. A. Buniak, W. H. Schreiner, N. Mattoso, and F. Wypych. Preparation of a new nanocomposite
of Al0.33Mg0.67(OH)2(C12H25SO4)0.33 and poly(ethyleneoxide). Langmuir, 18:5967 – 5970, 2002.
[51] C. S. Liao and W. B. Ye. Enhanced ionic conductivity in poly(eythyleneoxide)/layered double
hydroxide nanocomposite electrolytes. Journal of Polymer Research, 10:241 – 246, 2003.
[52] B. Li, Y. Hu, J. Liu, Z. Chen, and W. Fan. Preparation of poly(methyl methacrylate)/LDH
nanocomposite by exfoliation-adsorption process. Collidal Polymer Science, 281:998 – 1001,
2003.
[53] H. B. Hsueh and C. Y. Chen. Preparation and properties of LDHs/epoxy nanocomposites. Polymer,
44:5275 – 5283, 2003.
[54] Q. Z. Yang, D. J. Sun, C. G. Zhang, X. J. Wang, and W. A. Zhao. synthesis and characterization of
polyoxyethylene sulfate intercalated Mg-Al-nitrate layered double hydroxide. Langmuir, 19:5570
– 5574, 2003.

REFERENCES 126
[55] A. S. Costa, T. Imae, K. Takagi, and K. Kikuta. Intercalation of dendrimers in the interlayer of
hydrotalcite clay sheets. Progress in Colloidal Polymer Science, 128:113 – 119, 2004.
[56] L. van der Ven, M.L.M. van Gemert, L.F. Batenburg, J.J. Keern, L.H. Gielgens, T.P.M. Koster, and
H.R. Fischer. On the action of hydrotalcite-like clay materials as stabilizers in polyvinylchloride.
Applied Clay Science, 17:25 – 34, 2000.
[57] S. Miyata. Halogen-containing polyolefin composition, and methods for inactivating halogen
therein. US Patent, 4 379 882, 1983.
[58] S. Miyata, T. Hirose, and N. Iizima. Fire-retarding thermoplastic resin composition. US Patent, 4
085 088, 1978.
[59] K. L. Nichols and C. J. Chou. Polymer composite comprising a inorganic layered material and a
polymer matrix and a method for its preparation. US Patent, 5 952 093, 1999.
[60] M. Zammarano, S. Bellayer, J. W. Gilman, M. Franceschi, F. L. Beyer, R. H. Harris a, and S. Meri-
ani. Delamination of organo-modified layered double hydroxides in polyamide 6 by melt process-
ing. Polymer, 47:652 – 662, 2006.
[61] W. D. Lee, S. S. Im, H.-M. Lim, and K.-J. Kim. Preparation and properties of layered double
hydroxide/poly(ethyleneterephthalate) nanocomposites by direct melt compounding. Polymer,
47:1364 – 1371, 2006.
[62] P. Ding and B. Qu. Synthesis of exfoliated PP/LDH nanocomposites viamelt-intercalation: Struc-
ture, thermal properties, and photo-oxidative behavior in comparison with pp/mmt nanocompos-
ites. Polymer Engineering and Science, 10:1153 – 1159, 2006.
[63] L. Du and B. Qu. Structural characterization and thermal oxidation properties of LLDPE/MgAl-
LDH nanocomposites. Journal of Material Chemistry, 16:1549 – 1554, 2006.
[64] U. Costantino, A. Gallipoli, M. Nocchetti, G. Camino, F. Bellucci, and A. Frache. New nanocom-
posites constituted of polyethylene and organically modified znal-hydrotalcites. Polymer Degra-
dation and Stability, 90:586 – 590, 2005.
[65] G. A. Wang, C. C. Wang, and C. Y. Chen. The disorderly exfoliated LDHs/PMMA nanocomposite
synthesized by in situ bulk polymerization : The effects of LDH-U on thermal and mechanical
properties. Polymer Degradation and Stability, 91:2443 – 2450, 2006.
[66] J. C. A. A. Roelofs, J. A. van Bokhoven, A. Jos van Dillen, J. W. Geus, and K. P. de Jong. The
thermal decomposition of Mg-Al hydrotalcites: effects of interlayer anions and characteristics of
the final structure. Chem. Eur. J., 8:5571 – 5579, 2002.
[67] J. W. Gilman. Flammability and thermal stability studies of polymer-layered silicate (clay)
nanocomposites. Applied Clay Science, 15:31 – 49, 1999.
[68] U. Wagenknecht, B. Kretzschmar, and G. Reinhardt. Investigation of fire retardant properties of
polypropylene-clay nanocomposites. Macromolecular Symposium, 194:207 – 212, 2003.
REFERENCES 127
[69] M.S. Cho, B. Shin, S.D. Choi, and K.G. Song Y. Lee. Gel polymer electrolyte nanocomposites
PEGDA with MgAl layered double hydroxides. Electrochimica Acta, 50:331 – 334, 2004.
[70] C. S. Liao and W. B. Ye. Structure and conductive properties of poly(ethylene oxide)/layered
double hydroxide nanocomposite polymer electrolytes. Electrochimica Acta, 49:4993 – 4998,
2004.
[71] D. Tichit and B. Coq. Catalysis by hydrotalcites and related materials. Cattech, 7:206 – 217,
2003.
[72] C. D. Hoyo. Layered double hydroxides and human health: An overview. Appled Clay Science,
doi:10.1016/j.clay.2006.06.010, 2006.
[73] W. F. Lee and Y. C. Chen. Effect of hydrotalcite on the physical properties and drug-release
behavior of nanocomposite hydrogels based on poly[acrylic acid-co-poly(ethylene glycol) methyl
ether acrylate] gels. Journal of Applied Polymer Science, 94:692 – 699, 2004.
[74] J. H. Choy, S. Y. Kwak, J. S. Park, Y. J. Jeon, and J. Portier. Intercalative nanohybrids of nucleoside
monophosphates and dna in layered metal hydroxide. Journal of the American Chemical Society,
121:1399 – 1400, 1999.
[75] D. Shan, S. Cosnier, and C. Mousty. Layered double hydroxides: An attractive material for
electrochemical biosensor design. Analytical Chemistry, 75:3872 – 3879, 2003.
[76] J. V. de Melo, S. Cosnier, C. Mousty, C. martelet, and N. Jaffrezic-Renault. Urea biosensors based
on immobilization of urease into two oppositely charged clays (laponite and zn-al layered double
hydroxides). Analytical Chemistry, 74:4037 – 4043, 2002.
[77] Y. Lin, J. Wang, D. G. Evans, and D. Li. Layered and intercalated hydrotalcite-like materials as
thermal stabilizers in pvc resin. Journal Physics and Chemistry of Solids, 67:998 – 1001, 2006.
[78] L. Perioli, V. Ambrogi, C. Rossi, L. Latterini, M. Nocchetti, and U. Costantino. Use of anionic
clays for photoprotection and sunscreen photostability: Hydrotalcites and phenylbenzimidazole
sulfonic acid. Journal of Physics and Chemistry of Solids, 67:1079 – 1083, 2006.
[79] T. Kuwahara, H. Tagaya, and K. Chiba. Photochromism of spiropyran dye in Li-A1 layered double
hydroxide. Microporous Materials, 4:247 – 250, 1995.
[80] S. Guo, D. G. Evans, and D. Li. Preparation of C.I. pigment 52:1 anion-pillared layered double
hydroxide and the thermo- and photostability of the resulting intercalated material. Journal of
Physics and Chemistry of Solids, 67:1002 – 1006, 2006.
[81] Y. Feng, D. Li, Y. Wang, D. G. Evans, and X. Duan. Synthesis and characterization of a UV
absorbent-intercalated Zn-Al layered double hydroxide. Polymer Degradation and Stability,
91:789 – 794, 2006.
[82] Y. Tian, G. Wang, F. Li, and D. G. Evans. Synthesis and thermo-optical stability of o-methyl red-
intercalated NiFe layered double hydroxide material. Materials Letters, 61:1662 – 1666, 2007.
REFERENCES 128
[83] C. Taviot-Guehoa, A. Illaik, C. Vuillermoz, S. Commereuc, V. Verney, and F. Leroux. LDHdye
hybrid material as coloured filler into polystyrene: Structural characterization and rheological
properties. Journal of Physics and Chemistry of Solids, 68:1140 – 1146, 2007.
[84] N. G. Zhuravleva, A. A. Eliseev, A. V. Lukashin, U. Kynast, and Y. D. Tretyakov. Luminescent
materials based on Tb- and Eu-containing layered double hydroxides. Doklady Chemistry, 396:87
– 91, 2004.
[85] D. Evans Z. Chang and, X. Duan, P. Boutinaud, M. de Roy, and C. Forano. Preparation and char-
acterization of rare earth-containing layered double hydroxides. Journal of Physics and Chemistry
of Solids, 67:1054 – 1057, 2006.
[86] E. P. Giannelis. Polymer layered silicate nanocomposites. Advanced Materials, 8:29 – 35, 1996.
[87] J. W. Gilman, T. Kashiwagi, and J. D. LichtenhanD. Nanocomposites: A revolutionary new flame
retardant approach. SAMPE Journal, 33:40 – 46, 1997.
[88] J. W. Gilman, C. L. Jackson, A. B. Morgan, R. H. Harris (Jr.), E. Manias, E. P. Giannelis,
M. Wuthenow, D. Hilton, and S. H. Phillips. Flammability properties of polymer-layered-
silicate nanocomposites, polypropylene and polystyrene nanocomposites. Chemistry of Materials,
12:1866 – 1873, 2000.
[89] A. B. Morgan, L.-L. Chu, and J. D. Harris. A flammability performance comparison between
synthetic and natural clays in polystyrene nanocomposites. Fire Mater, 29:213 – 229, 2005.
[90] J. Zhu and C. A. Wilkie. Thermal and fire studies on polystyrene-clay nanocomposites. Polym
International, 49:1158 – 1163, 2000.
[91] M. Biswas and S. S. Ray. Recent progress in synthesis and evaluation of polymer- montmorillonite
nanocomposites. Advances in Polymer Science, 155:167 – 221, 2001.
[92] S. S. Ray and M. Okamoto. Polymer/layered silicate nanocomposites: a review frompreparation
to processing. Progress in Polymer Science, 28:1539 – 1641, 2003.
[93] Y. Kojima, A. Usuki, M. Kawasumi, A. Okada, Y. Fukushima, T. Kurauchi, and O. Kamigaito.
Mechanical properties of nylon 6-clay hybrid. Journal of Material Research, 8:1185 – 1189, 1993.
[94] A. Blumstein. Polymerization of adsorbed monolayers: II. thermal degradation of the inserted
polymers. Journal of Polymer Science, 3:2665 – 2673, 1965.
[95] E. P. Giannelis. Polymer-layered silicate nanocomposites: synthesis, properties and applications.
Appl Organomet Chem, 12:675 – 680, 1998.
[96] S. D. Burnside and E. P. Giannelis. Synthesis and properties of new poly(dimethylsiloxane)
nanocomposites. Chemistry of Materials, 7:1597 – 1600, 1995.
[97] T. Agag, T. Koga, and T. Takeichi. Studies on thermal and mechanical properties of polyimideclay
nanocomposites. Polymer, 42:3399 – 3408, 2001.
REFERENCES 129
[98] H.-L. Tyan, Y.-C. Liu, and K.-H. Wei. Thermally and mechanically enhanced clay/polyimide
nanocomposite via reactive organoclay. Chemistry of Materials, 11:1942 – 1947, 1999.
[99] Y. W. Chen-Yang, H. C. Yang, G. J. Li, and Y. K. Li. Thermal and anticorrosive properties of
polyurethane/clay nanocomposites. Journal of Polymer Research, 11:275 – 283, 2005.
[100] B. Lepoittevin, M. Devalckenaere, N. Pantoustier, M. Alexandre, D. Kubies, C. Calberg,
R. Jerome, and P. Dubois. Poly(1-caprolactone)/clay nanocomposites prepared by melt inter-
calation: mechanical, thermal and rheological properties. Polymer, 43:4017 – 4023, 2002.
[101] F. Dietsche and R. Muelhaupt. Thermal properties and flammability of acrylic nanocomposites
based upon organophilic layered silicates. Polymer Bulletin, 43:395 – 402, 1999.
[102] J. W. Gilman, T. Ksahiwagi, E. P. Giannelis, E. Manias, S. Lomakin, J. D. Lichtenhan, and
P. Jones. Flammability properties of polymer-layered silicate nanocomposites. In: Al-Malaika
S, Golovoy A, Wilkie CA, editors. Chemistry and technology of polymer additives. Oxford: Black-
well Science, 1999.
[103] J. W. Gilman, T. Kashiwagi, A. B. Morgan, R. H. Harris Jr., L. D. Brassell, M. R. VanLandingham,
and C. L. Jackson. Flammability of polymer clay nanocomposites consortium: Year one annual
report, July 2000.
[104] S. Miyata. Stabilized polyvinyl chloride resin composition. US Patent, 4751261, 1988.
[105] M. Zammarano, M. Franceschib, S. Bellayera, J. W. Gilmana, and S. Meriani. Preparation and
flame resistance properties of revolutionary self-extinguishing epoxy nanocomposites based on
layered double hydroxides. Polymer, 46:9314 – 9328, 2005.
[106] L. Qiu, W. Chen, and B. Qu. Morphology and thermal stabilization mechanism of LLDPE/MMT
and LLDPE/LDH nanocomposites. Polymer, 47:922 – 930, 2006.
[107] M. Bartholmai and B. Schartel. Layered silicate polymer nanocomposites: new approach or il-
lusion for fire retardancy? investigation of the potentials and the tasks using a model system.
Polymers for Advanced Technology, 15:355 – 364, 2004.
[108] R. N. Ronthon (ed). Particle-filled polymer composites. Longman Scientific, London, UK,, 1995.
[109] S. Zhu, Y. Zhang, and Y. Zhang. Deformation and fracture of Mg(OH)2-filled polyolefin compos-
ites under tensile stress. Journal of Applied Polymer Science, 89:3248 – 3255, 2003.
[110] B. Howarth, C. L. Raymond, and I. Sutherland. Polyethylene compounds containing mineral fillers
modified by acid coatings. 2: Factors influencing mechanical properties. Polymer Engineering
Science, 41:1345 – 1364, 2001.
[111] S. Kim. Flame retardancy and smoke suppression of magnesium hydroxide filled polyethylene.
Journal Polymer Science, Part B: Polymer Physics, 41:936 – 944, 2003.
[112] H. Hausmann and V. Flaris. Polymeric coupling agents as property enhancers in highly filled
polymer systems. Polym. Polym. Comp., 5:113 – 119, 1997.
REFERENCES 130
[113] S. Lipponen and J. Seppaelae. Ethylene/silane copolymers prepared with a metallocene catalyst
as polymeric additives in polyethylene/aluminum trihydroxide composites. Journal of Polymer
Science Part A: Polymer Chemistry, 43:5597 – 5608, 2005.
[114] S. M. Lomakin, S. V. Usachev, E. V. Koverzanova, L. V. Ruban, I. G. Kalinina, and G. E. Zaikov.
An investigation of thermal degradation of polymer flame retardant additives: triphenylphosphine
and modified/intercalated trimethylphosphine. In 10th annual conf. Recent Advances in the Fire
Retardancy of Polymeric Materials, Business Communication Co, Norwalk, USA, 1999.
[115] L. Ruban, S. Lomakin, and G. E. Zaikov. Polymer nanocomposites with participation of layer
aluminium silicates’ in Zaikov G E and Khalturinski N A (eds), 218 Fire retardant materials ’Low
Flammability Polymeric Materials. Nova Science Publishers, New York, 1999.
[116] C. Huggett. Estimation of rate of heat release by means of oxygen consumption measurements.
Fire and Materials, 4:61 – 65, 1980.
[117] V. Babrauskas. Development of the cone calorimeter-a bench-scale heat release rate apparatus
based on oxygen consumption. Fire and Materials, 8:81 – 95, 1984.
[118] L. J. Bellamy. The Infrared Spectra of Complex Molecules, volume 1. Chapman and Hall, 3rd
edition, 1986.
[119] D. L. Bish and G. W. Brindley. A reinvestigation of takovite, a nickel aluminumhydroxy-carbonate
of the pyroaurite group. Amer. Min., 62:458, 1977.
[120] K. Fuda, N. Sudo, S. Kawai, and T. Matsunaga. Preparation of zn/ga-layered double hydroxide
and its thermal decomposition behavior. Chemistry Letters, 22:777 – 780, 1993.
[121] M. J. Hernandez-Moreno, M. A. Ulibarri, J.L. Rendon, and C. J. Serna. Ir characteristics of
hydrotalcite-like compounds. Phys. Chem. Minerals, 12:34 – 38, 1985.
[122] J. T. Kloprogge, D. Wharton, L. Hickey, and R. L. Frost. Infrared and raman study of interlayer
anions 32, 3 , 4
2 and l4 in Mg/Al hydrotalcite. American Mineralogist, 87:623 – 629,
2002.
[123] J. Coates. Interpretation of Infrared Spectra, A Practical Approach in Encyclopedia of Analytical
Chemistry, R. A. Meyers (Ed). Jonh Wiley & Sons Ltd. Chichester, 2000.
[124] M. Borja and P. K. Dutta. Fatty acids in layered metal hydroxides: membrane-like structure and
dynamics. Journal of Physical Chemistry, 96:5434 – 5444, 1992.
[125] E. Kanezaki. Effect of atomic ratio mg/al in layers of mg and al layered double hydroxide on ther-
mal stability of hydrotalcite-like layered structure by means of in situ high temeperature powder
x-ray diffraction. Materials Research Bulletin, 33:773 – 778, 1998.
[126] P. Bera, M. Rajamathi, M. S. Hegde, and P. V. Kamath. Thermal behavior of hydroxides, hydrox-
ysalts and hydrotalcites. Bulletin of Material Science, 23:141 – 145, 2000.
[127] S. K. Yun and T. J. Pinnavaia. Water content and particle texture of synthetic hydrotalcite-like
layered double hydroxides. Chemisty of Materials, 7:348 –354, 1995.
REFERENCES 131
[128] F. Leroux, M. A. Pagano, M. Intissar, S. Chauviere, C. Rorano, and J. P. Besse. Delamination and
restacking of layered double hydroxides. Journal of Materials Chemistry, 11:105 – 112, 2001.
[129] K. Grundke, T. Bogumil, T. Gietzelt, H. J. Jacobasch, D. Y. Kwok, and A. W. Newman. Wetting
measurements on smooth, rough and porous solid surfaces. Prog. Colloid Polym. Sci., 101:58 –
68, 1996.
[130] K. Grundke and A. Augsburg. On the determination of the surface energetics of porous polymer
materials. Journal of Adhesion Science and Technololy, 14:765 – 776, 2000.
[131] A. Leuteritz, D. Pospiech, B. Kretzschmar, D. Jehnichen, U. Jentzsch, K. Grundke, and A. Janke.
Characterization and comparison of organically modified clay compounds and their nanocom-
posites with polypropylene. In Proc. Second World Congress Nanocomposites, San Diego, USA,
2002.
[132] T. Itoh, N. Ohta, T. Shichi, T. Yui, and K. Tagaki. The self-assembling properties of stearate ions
in hydrotalcite clay composites. Langmuir, 19:9120 – 9126, 2003.
[133] A. B. Morgan and J. W. Gilman. Characterization of polymer-layered silicate (clay) nanocompos-
ites by transmission electron microscopy and x-ray diffraction: A comparative study. Journal of
Applied Polymer Science, 87:1329 – 1338, 2003.
[134] R. A. Vaia and W. Liu. X-ray powder diffraction of polymer/layered silicate nanocomposites:
Model and practice. Journal of Polymer Science, Part B: Polymer Physics, 40:1590 – 1600, 2002.
[135] K. Wang, S. Liang, R. Du, Q. Zhang, and Q. Fu. The interplay of thermodynamics and shear on
the dispersion of polymer nanocomposite. Polymer, 45:7953 – 7960, 2004.
[136] H. R. Dennis, D. L. Hunter, D. Chang, S. Kim, J. L. White, J. W. Cho, and D. R. Paul. Effect
of melt processing conditions on the extent of exfoliation in organo-clay based nanocomposites.
Polymer, 42:9513 – 9522, 2001.
[137] W. Lertwimolnun and B. Vergnes. Influence of compatibilizer and processing conditions on the
dispersion of nanoclay in a polypropylene matrix. Polymer, 46:3462 – 3471, 2005.
[138] S. A. Solin, D. Hines, S. K. Yun, T. J. Pinnavaia, and M. F. Thorpe. Layer rigidity in 2D disordered
Ni-Al layer double hydroxides. Journal of Non-Crystalline Solids, 182:212 – 220, 1995.
[139] G. Liang, J. Xu, S. Bao, and W. Xu. Polyethylene/maleic anhydride grafted polyethylene/organic-
montmorillonite nanocomposites. i. preparation,microstructure, and mechanical properties. Jour-
nal of Applied Polymer Science, 91:3974 – 3980, 2004.
[140] T. G. Gopakumar, J. A. Lee, M. Kontopoulou, and J. S. Parent. Influence of clay exfoliation on the
physical properties of montmorilinite/polyethylene composites. Polymer, 43:5483 – 5491, 2002.
[141] A. C. Balazs, C. Singh, and E. Zhulina. Modeling the interaction between polymers and clay
surfaces through self-consistent field theory. Macromolecules, 31:8370 – 8381, 1998.

REFERENCES 132
[142] J. W. Gilman, A. B. Morgan, and R. Harris (Jr.). Polymer layered silicate nanocomposites:
Polyamide-6, polypropylene and polystyrene. In Proc. New Advances in Flame Retardant Tech-
nology. Proceedings. Fire Retardant Chemicals Association, Lancaster, PA, USA, pages 9 – 22,
1999.
[143] H. A. Barnes. Thixotropy - a review. Journal of Non-Newtonian Fluid Mechanics, 70:1 – 33,
1997.
[144] A. I. Leonov. On the rheology of filled polymers. J. Rheology, 34:1039 – 1068, 1990.
[145] C. W. Macosko. Rheology Principles, Measurements and Applications. VCH Publishers, USA,
1993.
[146] T. G. Mezger. The Rheology Handbook for users of rotational and oscillatory rheometer, edited
by Dr. Ulrich Zroll. Curl R. Vincentz Verlag, Hannover, Germany, 2002.
[147] J. Ren, A. S. Silva, and R. Krishnamoorti. Linear viscoelasticity of disordereed polystyrene-
polypropylene block copolymer based layered-silicate nanocomposites. Macromolecules, 33:3739
– 3746, 2000.
[148] R. Krishnamoorti, R. A. Vaia, and E. P. Giannelis. Structure and dynamics of polymer-layered
silicate, nanocomposites. Chemisty of Materials, 8:1728 – 1734, 1996.
[149] K. M. Lee and C. D. Han. Effect of hydrogen bonding on the rheology of polycarbon-
ate/organoclay nanocomposites. Polymer, 44:4573 – 4588, 2003.
[150] M. J. Solomon, A. S. Almusallam, K. F. Seefeldt, A Somwangthanaroj, and P. Vardan. Rheology
of polypropylene/clay hybrid materials. Macromolecules, 34:1864 – 1872, 2001.
[151] R. Krishnamoorti and E. P. Giannelis. Rheology of end-thethered polymer layered silicate
nanocomposites. Macromolecules, 30:4097 – 4102, 1997.
[152] F.R. Costa, B.K. Satapathy, U. Wagenknecht, R. Weidisch, and G. Heinrich. Morphology and
fracture behaviour of polyethylene/MgAl layered double hydroxide (LDH) nanocomposites. Eu-
ropean Polymer Journal, 42:2140 – 2152, 2006.
[153] M. Klueppel. The role of disorder in filler reinforcement of elastomers on various length scales.
Advances in Polymer Science, 164:1 – 86, 2003.
[154] R. Wagner and T. J. G. Reisinger. A rheological method to compare the degree of exfoliation of
nanocomposites. Polymer, 44:7513 – 7518, 2003.
[155] R.G. Larson. The structure and rheology of complex fluids. Oxford University Press, New York,
Oxford, 1999.
[156] G. Heinrich and M. Klueppel. Recent advances in the theory of filler networking in elastomers.
Advances in Polymer Science, 160:1 – 44, 2002.
[157] A. Subbotin, A . Semenov, E. Manias, G. Hadziioannou, and G. ten Brinke. Rheology of confined
polymer melts under shear flow: Strong adsorption limit. Macromolecules, 28:1511 – 1515, 1996.
REFERENCES 133
[158] R. Krishnamoorti, J. Ren, and A. S. Silva. Shear response of layered silicate nanocomposites. J.
Chem. Phys., 114:4968 – 4973, 2001.
[159] L. M. Walker, N. L. Wagner, R. G. Larson, P. A. Mirau, and P. Moldenaers. The rheology of
highly concentrated PBLG solutions. Journal of Rheology, 39:925 – 952, 1995.
[160] K. M. Lee and C. D. Han. Rheology of organoclay nanocomposites: Effects of polymer ma-
trix/organoclay compatibility and the gallery distance of organoclay. Macromolecules, 36:7165 –
7178, 2003.
[161] R. A. Stratton and A. F. Butcher. Stress relaxation upon cessation of steady flow and the overshoot
effect of polymer solutions. Journal of Polymer Science: Polymer Physics Edition, 11:1747 –
1758, 1973.
[162] M. Doi and S. F. Edward. Dynamics of concentrated polymer systems. part 4.-rheological proper-
ties. Journal of the Chemical Society, Faraday Transactions 2: Molecular and Chemical Physics,
75:38 – 54, 1979.
[163] M. Doi and S. F. Edwards. The theory of polymer dynamics. University Press, Oxford, 1986.
[164] M. Doi and S. F. Edwards. Dynamics of concentrated polymer systems part 2.-molecular motion
under flow. Journal of the Chemical Society, Faraday Transactions 2: Molecular and Chemical
Physics, 74:1802 – 1817, 1978.
[165] K. Osaki, T. Inoue, and T. Isomura. Stress overshoot of polymer solutions at high rates of shear.
Journal of Polymer Science Part B: Polymer Physics, 38:1917 – 1925, 2000.
[166] K. Osaki. On the damping function of shear relaxation modulus for entangled polymers. Rheo-
logica Acta, 32:429 – 437, 1993.
[167] M. H. Wagner. Analysis of time-dependent non-linear stress-growth data for shear and elonga-
tional flow of a low-density branched polyethylene melt. Rheological Acta, 15:136 – 142, 1976.
[168] T. C. B. McLeish and R. G. Larson. Molecular constitutive equations for a class of branched
polymers: The pom-pom polymer. Journal of Rheology, 42:81 – 110, 1998.
[169] M. Sobhanie and A. I. Isayev. Modelling and experimental investigation of shear flow of a filled
polymer. Journal of Non-Newtonian Fluid Mechanics, 85:189 – 212, 1999.
[170] J. Ren and R. Krishnamoorti. Nonlinear viscoelastic properties of layered -silicate-based interca-
lated nanocomposites. Macromolecules, 36:4443 – 4451, 2003.
[171] J. Li, C. Zhou, G. Wang, and D. Zhao. Study on rheological behavior of polypropylene/clay
nanocomposites. Journal of Applied Polymer Science, 89:3609 –3617, 2003.
[172] M. Barut, R. Lapasin, A. Zupancic, and M. Zumer. Time dependent rheological behaviors of tio2
suspensions. In Proc. XIIth Congr. on Rheology, August 18-23, Quebec City, Canada, page 578,
1996.
REFERENCES 134
[173] A. Mujumdar, A. N. Beris, and A. B. Metzner. Transient phenomena in thixotropic systems.
Journal of Non-Newtonian Fluid Mechanics, 102:157 – 178, 2002.
[174] M. Wagner. Zur Netzwerktheorie von Polymer-Schmelzen. Rheological Acta, 18:33 – 50, 1979.
[175] R.B.Bird, R. C. Armstrong, and O. Hassager. Dynamics of polymeric fluids, volume 1. John Wiley
and Sons, New York, 2nd edition, 1987.
[176] A. Lion, C. Kardelky, and P. Haupt. On the frequency and amplitude dependence of the Payne
effect: Theory and experiments. Rubber Chemistry and Technology, 76:533– 547, 2002.
[177] D. Acierno, F.P. La Mantia, G. Marrucai, G. Rizzo, and G. Titomanlio. A non-linear viscoelastic
model with structure-dependent relaxation times ii. comparison with l.d. polyethylene transient
stress results. Journal of Non-Newtonian Fluid Mechanics, 1:147 – 157, 1976.
[178] F. R. Costa, U. Wagenknecht, Dieter Jehnichen, M. Abdel-Goad, and G. Heinrich. Nanocompos-
ites based on polyethylene and Mg-Al layered double hydroxide: II. rheological characterization.
Polymer, 47:1649 – 1660, 2006.
[179] Z. Wang, B. Qu, W. Fan, and P. Huang. Combustion characteristics of halogen-free flame- retarded
polyethylene containing magnesium hydroxide and some synergists. Journal of Applied Polymer
Science, 81:206 – 214, 2001.
[180] M. J. Scudamore, P. J. Briggs, and F. H. Prager. Cone calorimetry-a review of tests carried out
on plastics for the association of plastic manufacturers in europe. Fire and Materials, 15:65 – 84,
1991.
[181] C. Zhao, H. Qin, F. Gong, M. Feng, S. Zhang, and M. Yang. Mechanical, thermal and flammability
properties of polyethylene/clay nanocomposites. Polymer Degradation and Stability, 87:183 –
189, 2005.
[182] J. Rychly and L. Costa. Modelling of polymer ignition and burning adopted for cone calorimeter
measurements: The correlation between the rate of heat release and oxygen index. Fire and
Materials, 19:215 – 220, 1995.
[183] J. H. Yeh, M. J. Yang, and S. H. Hsich. Combustion of polyethylenes filled with metallic hy-
droxides and ethylene vinyl acetate copolymer. Polymer Degradaton and Stability, 61:465 – 472,
1998.
[184] H. Hippi, J. Mattila, M. Korhonen, and J. Seppaelae. Compatibilization of polyethylene/aluminum
hydroxide (PE/ATH) and polyethylene/magnesium hydroxide (PE/MH) composites with function-
alized polyethylenes. Polymer, 44:1193 – 1201, 2003.
[185] S. Vornov, V. Tokarev, K. Oduola, and Y. Lasttukhin. Polyperoxide surfactants for interface modi-
fication and compatibilization of polymer colloidal systems. I. synthesis and properties of polyper-
oxide surfactants. Journal of Applied Polymer Science, 76:1217 – 1227, 2000.

REFERENCES 135
[186] S. Vornov, V. Tokarev, V. Datsyuk, V. Seredyuk, O. Bednarska, K. Oduolar, H. Adler, C. Puschke,
A. Pich, and U. Wagenknecht. Polyperoxidic surfactants for interface modification and compati-
bilization of polymer colloidal systems. II. design of compatibilizing layers. Journal of Applied
Polymer Science, 76:1228 – 1239, 2000.
[187] B. Schartel, P. Poetschke, U. Knoll, and M. Abdel-Goad. Fire behaviour of polyamide 6/multiwall
carbon nanotube nanocomposites. Europian Polymer Journal, 41:1061 – 1070, 2005.
[188] Y. Feng, D. Li, Y. Wang, D. G. Evans, and X. Duan. Synthesis and characterization of a
UV absorbent-intercalated Zn/Al layered double hydroxide. Polymer Degradation and Stability,
91:789 – 794, 2006.
[189] S. Guo, D. G. Evans, and D. Li. Preparation of C.I. pigment 52:1 anion-pillared layered double
hydroxide and the thermo- and photostability of the resulting intercalated material. Journal of
Physics and Chemistry of Solids, 67:1002 – 1006, 2006.
[190] W-. Z. Li, J-. S. Chen J. Lu, G-. D. Li, Y-. S. Jiang, L-. S. Li, and B-. Q. Huang.
Phenoxymethylpenicillin-intercalated hydrotalcite as bacteria inhibitor. Journal of Chemical Tech-
nology and Biotechnology, 81:89 – 93, 2006.
List of Figures
1.1 Schematic representation of polymer combustion process [2]. . . . . . . . . . . . . . . . 2
1.2 Schematic flame spread during of polymer combustion process [2]. . . . . . . . . . . . . 3
2.1 Schematic Representation comparing the crystal structure of brucite (A) and LDH (B) . 6
2.2 Schematic pathways of in-situ polymerization within LDH layers to synthesize polymer-
LDH nanocomposites . . . . . . . . . . . . . . . . . . . . . . . . . . . . . . . . . . . . 9
2.3 Preparation of LDH-polyimide (LDH-AB/PI) nanocomposites (LDH-AB: aminoben-
zoate intercalated LDH, ODA: 4,4’-oxydianiline, PMDA: pyromellitic anhydride [38]. . 11
2.4 XRD patterns of LDH and LDH nanocomposites: (a) LDH-PSS, (b) LDH-PVS and (c)
LDH-CO3 [41]. . . . . . . . . . . . . . . . . . . . . . . . . . . . . . . . . . . . . . . . 14
2.5 (left) The x-ray diffraction patterns of LDHs-aminolaurate (a), LDHs/Epoxy resin (b - e)
[(b) - stirred at room temperature for 60 min, (c) - at 55℃ for 30 min, (d) - at 55℃ for
60 min and (e) - 55℃ for 180 min] and LDHs/Epoxy/Curing agent (f - k) [(f) - stirred
at room temperature for 60min, (g) - at 75℃ for 30 min, (h) - at 75℃for 60 min, (i) - at
75℃ for 120 min, (j) - at 135℃ for 30 min and (k) - at 135℃ for 60 min.] [53]. (right)
The XRD patterns of at different stages during two-step bulk polymerization of MMA
in presence of organically pillared LDH (LDH-U) and catalysts (a) unmodified LDH-
U; (b) mixture of LDH-U, MMA and catalyst stirring at room temperature; at various
conversions of MMA during the prepolymerization process (c) 6.3 wt%, (d) 8.4 wt%, (e)
10.5 wt%, (f) 13.2 wt%, (g) 16.2 wt%, (h) 17.1 wt%, (i) 18.3 wt%, (j) 19.6 wt% and (k)
LDHs/PMMA nanocomposite [34]. . . . . . . . . . . . . . . . . . . . . . . . . . . . . 15
2.6 Change of XRD patterns with the different contents of LDH content in polystyrene/LDH
nanocomposite sample: (a) 100 wt%, (b) 50 wt%, (c) 20 wt%, (d) 10 wt%, (e) 5 wt% [49]. 16
2.7 TEM micrographs showing LDH particle dispersion in different polymer (a) PMMA
[34], (b) epoxy [53], (c) polyamide 6 [60] and (d) polystyrene containing 5 wt% LDH [49] 16
2.8 SEM micrographs of Zn-Al LDH prepared by co-precipitation method (A) and Zn-
Al/polystyrene sulfonate nanocomposites prepared by (a) in situ polymerization, (b) re-
construction, (c) direct exchange and (d) restacking. The bars represent 2µm. [23] . . . . 17
2.9 Effects of the LDHs content on the tensile properties (tensile strength, Young’s modulus
and strain at break) of the epoxy/LDH nanocomposites. [53] . . . . . . . . . . . . . . . 18
2.10 Left: TGA curves of LDH/polyimide nanocomposites with various LDH loadings, Right:
Effects of LDH content on the decomposition temperatures at 5 and 10 % weight loss of
LDH/polyimide nanocomposites [38]. . . . . . . . . . . . . . . . . . . . . . . . . . . . 20
136

LIST OF FIGURES 137
2.11 The effect of LDH on ionic conductivity of Poly(ethylene glycol diacrylate)/Mg-Al–
LDH/ LiClO4 based polymer nanocomposite [69]. . . . . . . . . . . . . . . . . . . . . 20
2.12 Various fields of application of LDH materials [5]. . . . . . . . . . . . . . . . . . . . . 21
2.13 Dependence of the effective activation energy (Ea) on the extent of conversion (α) for
the thermo-oxidative degradation of virgin LLDPE and its nanocomposites. (MMT NC
10 = LLDPE/montmorilinite, ZnAlNC 10 = LLDPE/Zn-Al–LDH and MgAlNC 10 =
LLDPE/Mg-Al–LDH; the filler contents are 10 wt%) [106] . . . . . . . . . . . . . . . . 26
3.1 Brabender plasticorder: (left) the mixing chamber and (right) sigma type screw used for
melt-compounding . . . . . . . . . . . . . . . . . . . . . . . . . . . . . . . . . . . . . 31
3.2 Shear cycle used during non-linear shear or flow reversal experiments . . . . . . . . . . 35
3.3 A typical LOI measuring instrument . . . . . . . . . . . . . . . . . . . . . . . . . . . . 36
3.4 Schematic representation of a cone calorimeter unit . . . . . . . . . . . . . . . . . . . . 37
3.5 Schematic representation of a UL–94 VB (top) and UL–94 HB (bottom) test methods . . 39
4.1 Different surfactants used for intercalation within the LDH gallery . . . . . . . . . . . . 41
4.2 XRD patterns of different Mg-Al–LDH clay materials without interlayer modification
(* indicates the unknown reflections in the industrial samples). . . . . . . . . . . . . . . 42
4.3 Comparison of the FTIR spectra of synthesized Mg-Al–LDH, CLDH, LDHR and an in-
dustrial Mg-Al–LDH showing the recovery of original structure LDH after regeneration
process. . . . . . . . . . . . . . . . . . . . . . . . . . . . . . . . . . . . . . . . . . . . 43
4.4 XRD patterns of modified LDH obtained using regeneration methods in presence of var-
ious surfactants. . . . . . . . . . . . . . . . . . . . . . . . . . . . . . . . . . . . . . . 44
4.5 FTIR spectra of the LDH modified by different anionic surfactants using regeneration
method (the assignments of various bands are given in Table 4.3) . . . . . . . . . . . . . 47
4.6 SEM micrographs of the LDH samples: A = unmodified Mg-Al–LDH, B = CLDH, C=
LDH-laurate, D = LDH-DS, E = LDH-DBS and F = LDH-BEHP (magnification bar 2µm) 49
4.7 High magnification SEM micrographs showing the finner details of the surface mor-
phology of the primary particles in LDH-laurate (A), LDH-DS (B) and LDH-DBS (C).
(magnification bar 2µm) . . . . . . . . . . . . . . . . . . . . . . . . . . . . . . . . . . 50
4.8 TG plots of LDH synthesized by urea method and it various modified forms. . . . . . . 51
4.9 DTG curves for LDH and its various modified forms showing major decomposition stages. 52
4.10 XRD patterns of unmodified LDH (left) and LDH-DBS (right) measured at different
temperature showing the change in structure with temperature . . . . . . . . . . . . . . 54
4.11 TGA analysis of LDH and LDH-DBS in different atmospheres . . . . . . . . . . . . . . 55
4.12 FTIR spectra of unmodified LDH (A-C) and LDH-DBS (D) taken at different tempera-
tures showing changes in the structure of the unmodified clay material. . . . . . . . . . . 57
4.13 Kγlvcosθ versus γlv plots of LDH, CLDH and LDH-DBS. The plot for Mg(OH)2 is also
shown for comparison. The maximum in each plot gives a measure of the surface tension
of the respective powdered sample. The parameter in the y axis is normalized against the
maximum value and the error bar in each points are omitted for having better visibility
of the maxima . . . . . . . . . . . . . . . . . . . . . . . . . . . . . . . . . . . . . . . . 58
LIST OF FIGURES 138
5.1 WAXS patterns (top) and representative TEM micrographs of PE/LDH nanocomposites
(below: LDH concentration are shown) prepared by melt-compounding in Brabender
plasticorder. . . . . . . . . . . . . . . . . . . . . . . . . . . . . . . . . . . . . . . . . . 61
5.2 High magnification TEM showing exfoliated LDH layers fragments (some indicated by
arrow marks) in PE/LDH nanocomposites containing low (left, 4.72 wt% ) and high
(right, 16.20 wt%) LDH concentration (magnification bar 100 nm). . . . . . . . . . . . . 62
5.3 WAXS patterns for PE/LDH compositions prepared in twin screw extruder . . . . . . . . 63
5.4 Morphological analysis of the LDH particles: A: SEM image of LDH-DBS and B-E:
low magnification TEM images of PE/LDH nanocomposites [B: PE-LDH2 (4.72 wt%),
C: PE-LDH3 (6.89 wt%), D: PE-LDH4 (8.95 wt%) and E: PE-LDH5 (12.75 wt%)] . . . 64
5.5 TEM micrographs showing that exfoliated LDH particles exist both in the bulk matrix
(A) and also in the vicinity of the originating bigger particles (B). . . . . . . . . . . . . 65
5.6 High magnification TEM micrograph showing that LDH particles also undergo exfolia-
tion into single layers (A: PE-LDH3 and B: PE-LDH4) . . . . . . . . . . . . . . . . . . 66
5.7 TEM images showing different types structural associations formed by the dispersed
LDH particle in PE/LDH nanocomposite matrix: (a) formation of aggregates by the
primary LDH platelets and (b) structural association among the exfoliated clay layers. . . 67
5.8 FTIR spectra for PE-g-MAH and PE-g-MAH/LDH composites showing changed occur-
ring in peaks characteristics of MAH functional groups in presence of LDH . . . . . . . 68
5.9 Thermogravimetric analysis of polyethylene/LDH nanocomposites prepared by melt-
mixing in extruder (the LDH concentration increases from 2.43 wt% in PE-LDH1 to
16.20 wt% in PE-LDH6) . . . . . . . . . . . . . . . . . . . . . . . . . . . . . . . . . . 69
5.10 The influence of LDH concentration on (A) the decomposition temperatures at 10%
weight loss (T0.1) and 50% weight loss (T0.5) (B) the amount of residue at 750 ℃ and its
comparison with theoretically calculated value . . . . . . . . . . . . . . . . . . . . . . . 71
5.11 Comparison of the Thermogravimetric analysis of PE/LDH nanocomposite under oxy-
gen and nitrogen atmosphere . . . . . . . . . . . . . . . . . . . . . . . . . . . . . . . . 72
5.12 Strain dependence of the in-phase component stress response (storage modulus, normal-
ized w.r.t. linear value) during an oscillatory shear experiment . . . . . . . . . . . . . . 73
5.13 Difference in the viscoelastic response (storage modulus, G′ and loss modulus G′′) of
unfilled polyethylene and high LDH filled nanocomposite in a dynamic oscillatory fre-
quency sweep experiment . . . . . . . . . . . . . . . . . . . . . . . . . . . . . . . . . . 74
5.14 Storage modulus (G′) versus frequency (ω) plots for unfilled PE and PE/LDH nano-
composite melts based on the results obtained from dynamic oscillatory measurements.
The table on right the relaxation exponents obtained by fitting low frequency data to the
power law model . . . . . . . . . . . . . . . . . . . . . . . . . . . . . . . . . . . . . . 75
5.15 Step strain experiment showing how the stress relaxation modulus varies decays with
time in unfilled PE and in the PE/LDH nanocomposite melts having different LDH con-
centrations . . . . . . . . . . . . . . . . . . . . . . . . . . . . . . . . . . . . . . . . . . 77
LIST OF FIGURES 139
5.16 Complex viscosity (|η∗|) versus frequency (ω) plots for unfilled PE and PE/LDH nanocom-
posite melts obtained from a dynamic oscillatory shear experiments. The table on the
right indicates the sample designation and also the value of the corresponding shear thin-
ning exponent n2. . . . . . . . . . . . . . . . . . . . . . . . . . . . . . . . . . . . . . . 78
5.17 Viscosity at low frequency (0.05 rad) as a function of LDH concentration in PE/LDH
nanocomposites . . . . . . . . . . . . . . . . . . . . . . . . . . . . . . . . . . . . . . . 79
5.18 Steady shear flow behavior of unfilled PE melt. (A) The influence of shear rate, (B)
corresponding strain scaling of the stress at different shear rates, (C) the inverse relation
between the shear rate and the time (ts) at which stress overshoot occurs and (D) the influ-
ence of rest period prior to shearing on the steady shear response. The melt temperature
was 240 ℃. . . . . . . . . . . . . . . . . . . . . . . . . . . . . . . . . . . . . . . . . . 82
5.19 Influence of low molecular weight functionalized polymer (PE-g-MAH) on the steady
shear viscosity of the unfilled PE melt (γ = 0.3s−1). . . . . . . . . . . . . . . . . . . . . 84
5.20 Effect of LDH concentration on the stress growth during the flow reversal step in the flow
reversal experiment (shearing was carried out for 600 s, but the steady state is reached
within 300 s; (γ = 0.3s−1). . . . . . . . . . . . . . . . . . . . . . . . . . . . . . . . . . 85
5.21 Effect of rest period on the stress overshoot during start-up flows in the second steady
shear step in a flow reversal experiments. . . . . . . . . . . . . . . . . . . . . . . . . . . 87
5.22 The experimental results showing how the storage modulus (measured by applying low
amplitude (1.0%) and low frequency (1 rad/s) dynamic oscillatory shearing during rest
period trest) changes with time (A) and the corresponding transient steady shear response
followed after the rest period (B). (The ratio shown in bracket indicates the ratio of LDH
and functionalized polymer in the nanocomposites) . . . . . . . . . . . . . . . . . . . . 88
5.23 Plots showing the variation of storage modulus with time during oscillatory shearing
in the non-linear viscoelastic regime (carried out at 50% strain amplitude and 1 rad/s
frequency) (A) and linear viscoelastic regime (carried out at 2% strain amplitude and 1
rad/s frequency) (B). . . . . . . . . . . . . . . . . . . . . . . . . . . . . . . . . . . . . 89
5.24 Reverse shear flow experiment for the nanocomposite PE-LDH2: |γ|. Symbols - exper-
iment; lines - modified Wagner model in which β(t) is given by eq. (5.11). βR = 0.14,
βst = 0.02, TR = 500s, β(trest) − βend = 0.02 , TB = 50s, λ0 = 30s . . . . . . . . . . . . . 94
5.25 Mechanical properties of PE/LDH nanocomposites . . . . . . . . . . . . . . . . . . . . 95
5.26 SEM micrographs showing the fracture surface morphology of PE/LDH nanocomposite:
(a) unfilled PE, (b) PE-LDH1, (c) PE-LDH2, (d) PE-LDH3, (e) PE-LDH4 and (f) PE-
LDH5 . . . . . . . . . . . . . . . . . . . . . . . . . . . . . . . . . . . . . . . . . . . . 96
5.27 SEM images of fractured surface of PE-LDH2 sample showing morphology at different
region of the matrix: (a) overall morphology (magnification 200X), (b) at the interface
of particle rich and particle devoid regions (magnification 1KX), (c) particle devoid re-
gion (magnification 20KX) and (d) particle rich region (magnification 30KX) (the black
arrows show the individual or small stacks of LDH platelets) . . . . . . . . . . . . . . . 97
5.28 The bridging effects at the interface between the particle rich region (indicated by arrow)
and particle devoid region in PE/LDH nanocomposite compositions containing (a) 4.72
wt% and (b) 16.20 wt % LDH . . . . . . . . . . . . . . . . . . . . . . . . . . . . . . . 98

LIST OF FIGURES 140
6.1 Limited oxygen index (LOI) of PE/LDH nanocomposites (the value shown have ±0.5
unit variation . . . . . . . . . . . . . . . . . . . . . . . . . . . . . . . . . . . . . . . . 100
6.2 The effect of LDH loading on the dripping tendency of the PE/LDH nanocomposites
(Time to start dripping is the time after first 10 second flame application at which first
dripping occurs that ignites a piece of cotton underneath during UL94V testing) . . . . . 102
6.3 Dripping behavior of unfilled PE (left) and PE/LDH nanocomposite containing 12.75
wt% LDH (PE-LDH5) (right) (pictures were taken approximately after the same time
period from the cessation of first 10 s flame application during UL94V test) . . . . . . . 103
6.4 Influence of LDH loading on the rate of burning during UL94 HB test (at each composi-
tion average of three measurements were taken) . . . . . . . . . . . . . . . . . . . . . . 103
6.5 Cone-calorimeter investigation results showing (A) variation of heat release rate (HRR)
with time, (B) total heat released (THR) with time and (C) variation of time of igni-
tion (tig) and peak heat release rate (PHRR) with LDH concentration in the PE/LDH
nanocomposites. . . . . . . . . . . . . . . . . . . . . . . . . . . . . . . . . . . . . . . . 104
6.6 Graphical assessment of fire risk associated with PE/LDH nanocomposites, plotting THR
against PHRR/tig for different LDH concentration (the LDH concentration increases from
right to left as shown) . . . . . . . . . . . . . . . . . . . . . . . . . . . . . . . . . . . . 106
6.7 The variation of carbon dioxide (CO2) and carbon monoxide (CO) release rate during
combustion in a cone calorimeter chamber with burning time. . . . . . . . . . . . . . . . 107
6.8 Cone calorimeter investigation results showing changes in mass of sample with combus-
tion time (left) and average specific mass loss rate with increasing LDH concentration
(right). . . . . . . . . . . . . . . . . . . . . . . . . . . . . . . . . . . . . . . . . . . . . 107
6.9 Variation of LOI values in the polyethylene/LDH nanocomposites with increasing PHRR,
the number shown after the label of every data point indicates the LDH concentration in
the respective sample. . . . . . . . . . . . . . . . . . . . . . . . . . . . . . . . . . . . . 108
6.10 Pictures showing the nature of the residue after complete combustion of the PE/LDH
nanocomposite samples during cone calorimeter testing: A - PE-LDH1, B - PE-LDH2,
C - PE-LDH3, D - PE-LDH4, E - PE-LDH5 and F - PE-LDH6. . . . . . . . . . . . . . . 109
6.11 Synergistic effect of LDH in Mg(OH)2 filled PE composites: LOI values have com-
pared between composites where magnesium hydroxide is being progressively replaced
by LDH (X represent total weight percent of filler i.e. Mg(OH)2 + LDH) . . . . . . . . . 112
6.12 Thermogravimetric analysis of PE/MH and PE/LDH/MH composites. . . . . . . . . . . 113
6.13 Cone-calorimeter investigation results for the PE/MH and the PE/LDH/MH composites,
showing synergistic effect of LDH with MH (L and M stands for LDH and MH respec-
tively and the number before them indicate the weight percentage) . . . . . . . . . . . . 114
B.1 ARES rheometer with parallel plate geometry used for rheological analysis . . . . . . . 145
C.1 Experimental setup for surface tension measurement of LDH materials using capillary
penetration method . . . . . . . . . . . . . . . . . . . . . . . . . . . . . . . . . . . . . 148

List of Tables
2.1 Selected cone calorimeter investigation results for polymer/layered silicate nanocompos-
ites at 35 kW/m2 heat flux [67] . . . . . . . . . . . . . . . . . . . . . . . . . . . . . . . 25
3.1 Various technical details of the commercial Mg-Al–LDH used in the present study . . . 28
3.2 Various technical details of the surfactants used for the modification of Mg-Al–LDH . . 29
3.3 Description of the different polymeric materials used . . . . . . . . . . . . . . . . . . . 30
3.4 Designation of PE/LDH nanocomposite composition and the actual metal hydroxide con-
tent in each composition . . . . . . . . . . . . . . . . . . . . . . . . . . . . . . . . . . 32
3.5 Different parameters measured during cone calorimeter tests . . . . . . . . . . . . . . . 38
3.6 UL-94 vertical and horizontal test criteria . . . . . . . . . . . . . . . . . . . . . . . . . 38
4.1 Assignment of various XRD reflections obtained for LDH and its modified forms . . . . 45
4.2 Comparison between theoretically calculated and experimentally observed values of the
basal spacing in the modified LDH materials . . . . . . . . . . . . . . . . . . . . . . . . 46
4.3 Assignment of FTIR bands in LDH modified with different surfactants by regeneration
method [19, 118, 123, 124] . . . . . . . . . . . . . . . . . . . . . . . . . . . . . . . . . 48
6.1 Comparison of the combustion residue obtained from thermogravimetric analysis (TGA),
cone-calorimeter and theoretical calculation . . . . . . . . . . . . . . . . . . . . . . . . 110
6.2 Summary of UL94 vertical burn test for PE/MH and PE/LDH/MH composites (sample
size: 125 mm x 10 mm x 4 mm) . . . . . . . . . . . . . . . . . . . . . . . . . . . . . . 115
6.3 Summary of mechanical properties of PE/MH and PE/LDH/MH composites . . . . . . 116
A.1 Compositional analysis of LDH materials . . . . . . . . . . . . . . . . . . . . . . . . . 143
141

Appendices
142

AA
T C CR
The general chemical formulation of Mg-Al–LDH or hydrotalcite is [Mg1−xAlx(OH)2] (CO3)x/2.nH2O,
where the value of n is usually taken as 0.4 and that of x lies between 0.25 to 0.33. The molar ratio of
MgOand Al2O3 in the commercial Mg-Al–LDH used in this study is about 2.3, which corresponds to a
value of x equal to 0.30. In SDBS modified LDH, the extent of SDBS intercalated was calculated from
the sulfur content of the modified sample. The Cand Hcontent of the sample was also compared, but
these values are less reliable as their values are influenced by the physically adsorbed H2Oand CO2. In
doing compositional analysis based on sulfur content in the modified samples, one assumption was made
that DBS (dodecylbenzenesulfonate) content in the modified in LDH corresponds to the stoichiometric
content. This means that all the DBS anions attached to LDH sheets to neutralize their unbalanced
charge. Table A1 shows the compositional analysis of Mg-Al–LDH and its SDBS modified form.
Table A.1 Compositional analysis of LDH materials
Material Molar mass Ccontent Hcontent Scontent
g/mol % % %
Calculated
Mg1−xAlx(OH)2] (CO3)x/2.nH2O 75.31 2.39 3.71 0.00
Mg1−xAlx(OH)2] (DBS)x .nH2O 163.81 35.16 5.31 5.86
Observed
Mg-Al–LDH - 2.37 3.92 0.00
SDBS modified Mg-Al–LDH - 30.39 6.11 4.45
From Table A1, it is obvious that the theoretical calculation of unmodified LDH shows close resem-
blance to the experimentally observed values (the observed values shown are the average of three mea-
143

APPENDIX A. THEORETICAL CALCULATION OF COMBUSTION RESIDUE 144
surements, which showed small variation). But, in case of SDBS modified form, the calculated values
for 100 % CO32− substitution by DBS anion are higher than that observed experimentally. This means
that modification by SDBS using regeneration method results partial substitution of CO32− by DBS an-
ions. Therefore, the probable chemical formula of the modified LDH can be written as [Mg1−xAlx(OH)2]
(DBS)y (CO3)(x−y)/2.nH2O, where y < x. The value of y can be obtained by trial and error method to
show closest similarity to the sulphur content in the modified sample determined experimentally. A value
of y equal to 0.18 gives sulphur content in the modified sample equal to 4.49 %, which is close to 4.45
% observed experimentally. The corresponding values for Cand Hcontents are 30.84 % and 6.25 %.
Therefore, the chemical composition of the SDBS modified LDH can be written as [Mg0.70Al0.30(OH)2]
(DBS)0.18(CO3)0.06.0.4H2O. According to this chemical composition the metal hydroxide content in the
SDBS modified LDH is about 46.0 wt% and based on this metal hydroxide content PE/LDH nanocom-
posites were prepared.
Mg-Al–LDH on thermal decomposition above 500 ℃ gives metal oxides, carbon dioxide and water
vapor. The generally accepted decomposition products of Mg-Al–LDH after thermal decomposition are
given below
[Mg1−xAlx(OH)2](CO3)(x/2.nH2O>500℃−→ x/2MgAl2O4 + (1− 3x/2)MgO + (n+ 1)H2O + x/2CO2
For the SDBS modified Mg-Al–LDH (LDH-DBS), if it is assumed that similar metal oxides are
formed after complete thermal decomposition in presence of oxygen, then following reaction scheme
can be written for LDH-DBS.
[Mg0.70Al0.30(OH)2] 0.18(C12H25C6H4SO3−) (CO3)0.06.0.4H2O
↓ > 500℃0.15MgAl2O4 + 0.55MgO+ 3.3CO2 + 0.18SO2 + 3.3H2O
In case of complete combustion of PE/LDH nanocomposite, it can be assumed that the residue left is
constituted by these metal oxides and all organic contents are converted into gaseous products, like CO2,
H2O, etc. Therefore from the above decomposition reaction of SDBS modified LDH one can easily
calculate the amount of residue formed after combustion of a nanocomposite combustion. For example,
the composition PE10LDH contains 8.95 g metal hydroxide per 100 g of the sample (see Table 3.4, page).
According to the above chemical scheme for thermal decomposition of SDBS modified LDH, 1.0 g metal
hydroxide in LDH-DBS yields about 73.61 wt% metal oxide residue. Therefore, the LDH-DBS amount
containing 8.95 g metal hydroxide would yield 6.59 g metal oxide residue. If, it is considered that in
case of nanocomposite compositions, all organic contents are lost after complete combustion, PE10LDH
would produce 6.59% of its initial weight as combustion residue. Using the similar procedure and Table
3.4, the combustion residue in other nanocomposite composition can also be calculated. Obviously, the
accuracy of this calculation depends on many factors, like the accuracy of metal hydroxide determination
in LDH and its modified form, the exact nature of the metal oxide residue and also the standard deviation
in the elemental analysis data.
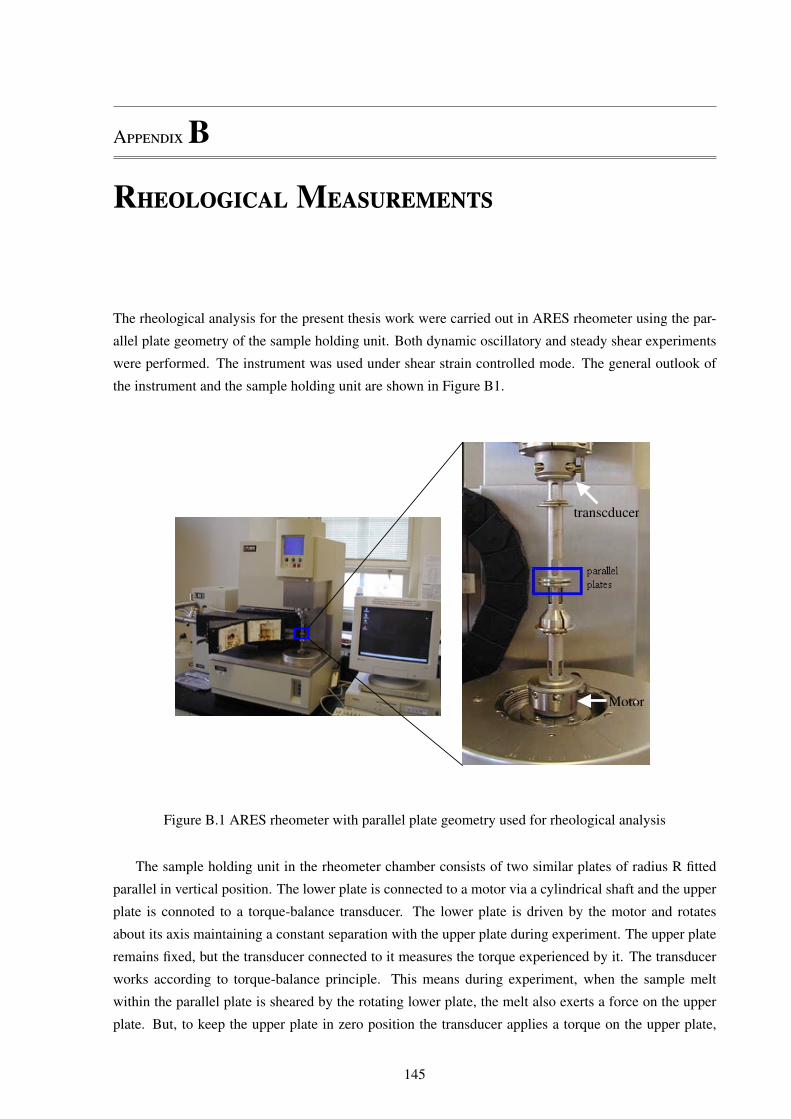
AB
RM
The rheological analysis for the present thesis work were carried out in ARES rheometer using the par-
allel plate geometry of the sample holding unit. Both dynamic oscillatory and steady shear experiments
were performed. The instrument was used under shear strain controlled mode. The general outlook of
the instrument and the sample holding unit are shown in Figure B1.
Motor
transcducer
Figure B.1 ARES rheometer with parallel plate geometry used for rheological analysis
The sample holding unit in the rheometer chamber consists of two similar plates of radius R fitted
parallel in vertical position. The lower plate is connected to a motor via a cylindrical shaft and the upper
plate is connoted to a torque-balance transducer. The lower plate is driven by the motor and rotates
about its axis maintaining a constant separation with the upper plate during experiment. The upper plate
remains fixed, but the transducer connected to it measures the torque experienced by it. The transducer
works according to torque-balance principle. This means during experiment, when the sample melt
within the parallel plate is sheared by the rotating lower plate, the melt also exerts a force on the upper
plate. But, to keep the upper plate in zero position the transducer applies a torque on the upper plate,
145
APPENDIX B. RHEOLOGICAL MEASUREMENTS 146
which balances the force exerted by the sample.
During both steady and dynamic measurement, the motor applies angular displacement to the upper
plate. The calculation of commanded strain and the corresponding stress developed are done using two
geometry dependent parameters: stress constant (Kγ and stress constant (Kτ).
γ = θKγ (B.1)
τ = MKτ (B.2)
where, γ is the commanded strain (desired sample deformation), θ is the angular displacement, τ is the
stress (force generated by the torque per unit area of the upper plate surface) and M is the torque.
For parallel-plate geometry of the instrument, with radius of the plates equal to R and distance be-
tween them equal to R, the strain and the stress constants are given by
Kγ =RH
(B.3)
Kτ =2(Gc)
π
( R10
)3 (B.4)
where, Gc is the gravitational constant
In case of dynamic oscillatory measurements, rheological responses are interpreted in terms of pa-
rameters, like storage modulus (G′), loss modulus (G′′), loss tangent (tanδ), etc. These parameters are
expressed as a function of stress (τ) and strain (γ) as follows.
G′ = cosδ(τ
γ
)(B.5)
G′′ = sinδ(τ
γ
)(B.6)
where, δ is the phase angle indicating the shift between the stress and strain vectors.
One disadvantage of using parallel-plate configuration is the inhomogeneous shear rate experienced
by the sample. From Equations B1 and B3, it is apparent that the shear rate is a function of R. As
a results, the value of shear varies in the radial direction from zero at the center of the plate to the
maximum at the edge. The calculations are usually based on the maximum shear rate experienced at
the edge. This problem can be easily avoided using cone-plate geometry of the instruments. But, with
high viscous melts, like those experienced in the present case with high LDH concentration, the sample
should be kept for long times often more than hours within the sample chamber at measuring temperature
for equilibration. This long exposure may often be detrimental to the materials, especially at high melt
temperature (say, 240℃ used in the present study). So the choice of parallel-plate geometry was obvious
in the present study. Also, the non-linear experiments with unfilled melt has shown, the operating shear
rate range does not exceeds the value where the position of the stress overshoot peak with respect to the
applied strain during the steady shearing does not vary with shear rate.

AC
S
The principle of the measurement of the surface tension of a porous medium using capillary penetration
method is based on Washburn equation, which describes dependence of the height rise with time of a
liquid into a porous materials column packed in a single vertical capillary of circular cross section. The
relation is given by equation
h2 =rt2ηγlv cosθ (C.1)
where, h is the height of the liquid front, t is the time required for the liquid to rise a distance h above
the liquid, r is the radius of the capillary, η is the viscosity of the liquid, θ is the contact angle, γlv is the
total surface tension of the liquid. To apply this relation one has to neglect the influence of the gravity
and assume the laminar flow of the liquid within the packed column.
The equation C.1 can be modified by replacing the height h with the weight M of the liquid that
penetrates into the capillary of cross sectional area A and density ρ. The modified equation looks like
M2
ρ2A2 =rt2ηγlv cosθ (C.2)
which after rearranging becomes
γlv cosθ =[
2A2r
] [η
ρ2
] [M2
t
](C.3)
The terms 2/(A2r) and η/ρ2 in equation C.3 are the geometric factor of the capillary tube and the
property of the test liquid used respectively. Whereas, the term M2/t is an experimentally measurable
quantity.
While measuring the surface tension of powdered materials like clay particles, the geometric factor of
the packed column is not known. However, if precise care is taken geometry of the packed column made
of powdered materials can be maintained roughly constant during preparation of such packed column.
In such case, the term 2/(A2r) can be replaced by an unknown constant K and rewrite equation C.3 as
K γlv cosθ =[η
ρ2
] [M2
t
](C.4)
Equation C.4 is the modified Washburn equation used for measuring the surface tension of LDH
materials with the assumptions: (1) laminar flow of the liquid within the capillary, (2) insignificant
147
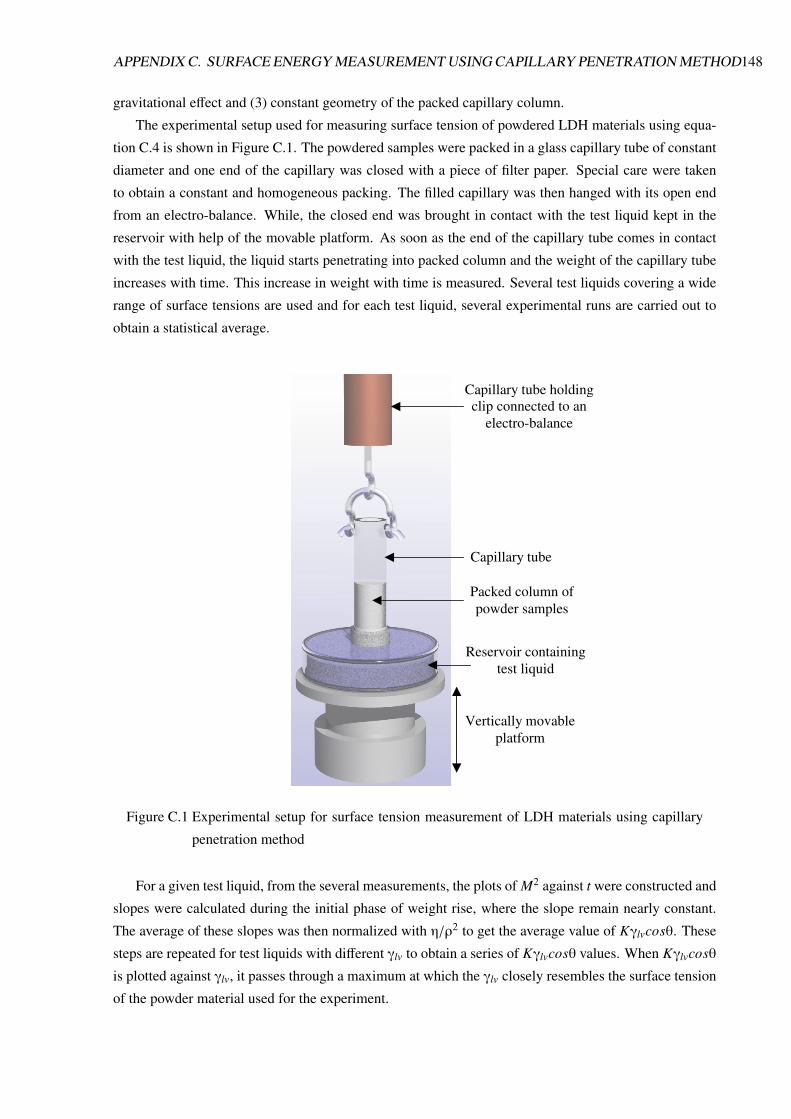
APPENDIX C. SURFACE ENERGY MEASUREMENT USING CAPILLARY PENETRATION METHOD148
gravitational effect and (3) constant geometry of the packed capillary column.
The experimental setup used for measuring surface tension of powdered LDH materials using equa-
tion C.4 is shown in Figure C.1. The powdered samples were packed in a glass capillary tube of constant
diameter and one end of the capillary was closed with a piece of filter paper. Special care were taken
to obtain a constant and homogeneous packing. The filled capillary was then hanged with its open end
from an electro-balance. While, the closed end was brought in contact with the test liquid kept in the
reservoir with help of the movable platform. As soon as the end of the capillary tube comes in contact
with the test liquid, the liquid starts penetrating into packed column and the weight of the capillary tube
increases with time. This increase in weight with time is measured. Several test liquids covering a wide
range of surface tensions are used and for each test liquid, several experimental runs are carried out to
obtain a statistical average.
Reservoir containing test liquid
Vertically movable platform
Packed column of powder samples
Capillary tube
Capillary tube holding clip connected to an
electro-balance
Figure C.1 Experimental setup for surface tension measurement of LDH materials using capillary
penetration method
For a given test liquid, from the several measurements, the plots of M2 against t were constructed and
slopes were calculated during the initial phase of weight rise, where the slope remain nearly constant.
The average of these slopes was then normalized with η/ρ2 to get the average value of Kγlvcosθ. These
steps are repeated for test liquids with different γlv to obtain a series of Kγlvcosθ values. When Kγlvcosθ
is plotted against γlv, it passes through a maximum at which the γlv closely resembles the surface tension
of the powder material used for the experiment.

AD
C V F R C
Personal Details:
Last Name Costa
First Name Francis Reny
Date of Birth 17th January, 1976
Nationality Indian
Marital Status Married to Swapna Costa Sarkar and has one daughter
Present Address Leibniz-Institute for Polymer Research
Hohe Strasse 6
01069 Dresden
Germany
Permanent Address 221B/1 M. G. Road
Prantik, P. O. Thakurpukur
Kolkata - 700063
West Bengal, India
Email Address [email protected], francis [email protected]
149
APPENDIX D. CURRICULUM VITAE OF FRANCIS RENY COSTA 150
Research Interests:
1. Polymer nanocomposites synthesis and characterization
2. Rheological analysis of polymeric materials using both experimental and theoretical approach
3. Layered double hydroxide type clay synthesis, organic modification and their applications as mul-
tifunctional filler in polymers
4. Flame retardancy of polymeric materials
5. Fracture mechanics
Academic Records:
Ph.D. Dissertation: Mg–AlLayered Double Hydroxide: A Potential Nanofiller and Flame-
(2003 – 2007) Retardant for Polyethylene
Supervisor: Prof. Dr.rer.nat.habil. Gert Henrich
Pursued at Leibniz-Institute of Polymer Research Dresden, Germany and as a regis-
tered student of Faculty of Mechanical Engineering, Technische Universitt Dresden,
Germany
M.Tech. Rubber Technology
(2000 – 2002) Indian Institute of Technology, Kharagpur, India, (Result: First Class, Rank 1)
Worked in Germany at Institute for Plastic Processing (IKV), RWTH Aachen for
M. Tech. project, which dealt with the application of PECVD (Plasma Enhanced
Chemical Vapor Deposition) technique to form gas barrier coating on PET film and
its characterization.
B.Tech. Polymer Science and Technology
(1997 – 2000) University of Calcutta, India, (Result: First Class).
B. Sc. Chemistry (as major), Physics and Mathematics
(1994 – 1997) St. Xavier’s College, Calcutta (under University of Calcutta), India, (Result: First
Class).
Work Experience:
2002 – 2003 Worked as project assistant in a consultancy project under Sponsored Research and
Industrial Consultancy (SRIC) at Indian Institute of Technology, Kharagpur, India
(Principal project invigilator Prof. A. K. Bhowmick).
The project dealt with the development of radiation curable NBR/CR based rubber
compounds for O-ring, gaskets and diaphragms for application in Indian railways.
APPENDIX D. CURRICULUM VITAE OF FRANCIS RENY COSTA 151
Academic Awards:
1. DAAD-Leibniz Scholarship: For Ph.D. research at Leibniz-Institute of Polymer Research, Dres-
den, Germany (2003 -2007)
2. DAAD Scholarship: Under sandwiched program (between Indian Institute of Technology and
German Academic Exchange Service) for Master Project in Germany (2001-2002)
3. Incab Rubber Prize: For the best CGPA in M.Tech. in Rubber Technology Center, Indian Institute
of Technology, Kharagpur (2002)
4. Modi Rubber Prize: For best Master project work in Rubber Technology Center Indian Institute of
Technology, Kharagpur (2002)
Publications:Book Chapter:
1. ’Industrial relevant Preparation, Characterization and Application of Polymer Nanocomposites’ by
Andreas Leuteritz, Bernd Kretzschmar, Doris Pospiech, Francis Reny Costa, Udo Wagenknecht
and Gert Heinrich; Chapter 19 in ”Polymeric Nanostructures and Their Applications” edited by H.
S. Nalwa, American Scientific Publisher, 2006.
2. ’Thermoplastic Elastomers’ by F. R. Costa, N. K. Datta, N. Roy Choudhury, and A. K. Bhowmick
in ”Current Topics Of Elastomer Research” edited by A. K. Bhowmick, CRC Press-Taylor and
Francis Group, LLC.
Journals:
1. Layered Double Hydroxide Based Polymer Nanocomposites. F. R. Costa, M. Saphiannikova, U.
Wagenknecht and G. Heinrich; Advances in Polymer Science, 210 (2008) 101 - 168, online from
October 2007.
2. Nonlinear Behaviour of Polyethylene/Layered Double Hydroxide Nanocomposites Under Shear
Flow; M. Saphiannikova, F. R. Costa, U. Wagenknecht, G. Heinrich; 2007, accepted in Polymer
Science.
3. Intercalation of Mg–Albased layered double hydroxide by anionic surfactants containing differ-
ent functionalities using regeneration method; F. R. Costa, A. Leuteritz, U. Wagenknecht, D.
Jehnichen, L. Haussler and G. Heinrich; 2007, article in press in Applied Clay Science.
4. LDPE/Mg–Allayered double hydroxide nanocomposite:Thermal and flammability properties; F.
R. Costa, U. Wagenknecht and G. Heinrich; Polymer Degradation and Stability, 92 (2007) 1813 –
1823.
5. Polyethylene/Mg–AlLayered Double hydroxide Based Nanocomposites: II. Rheological Charac-
terization; F. R. Costa, M. A. Goad, U. Wagenknecht and G. Heinrich; Polymer, 47 (2006) 1649 –
1660.
APPENDIX D. CURRICULUM VITAE OF FRANCIS RENY COSTA 152
6. Microwave Assisted HMDSO/Oxygen Plasma Coated Polyethyleneterepthalate Films: Effects
of Process Parameters and Uni-axial Strain on Gas Barrier Properties, Surface Morphology and
Chemical Composition; E. Schmachtenberg, F. R. Costa and S. Goebel, J. Appl. Polym. Sci., 99
(2006) 1485 – 1495.
7. Morphology and fracture behaviour of polyethylene/Mg–Allayered double hydroxide (LDH) nano-
composites; F. R. Costa, B. K. Satapathy, U. Wagenknecht, R. Weidisch and G. Heinrich; European
Polymer Journal, 42 (2006), 2140 – 2152.
8. Nanocomposites Based on Polyethylene and Mg–AlLayered Double Hydroxide: Characteriza-
tion of the Modified Clay, Morphological and Rheological Analysis of the Nanocomposites; F.
R. Costa, U. Wagenknecht and G. Heinrich; Plastic Rubber and Composites: Macromolecular
Engineering, 35 (2006), 139 – 148.
9. Polyethylene/Mg–AlLayered Double hydroxide Based Nanocomposites: I. Synthesis and Char-
acterization; F. R. Costa, M. A. Goad, U. Wagenknecht and G. Heinrich; Polymer, 46 (2005) 4447
– 4453.
10. Structural Kinetics in Filled Elastomers and PE/LDH Composites, G. Heinrich, V. Hrtel, J. Tschim-
mel, M. Kluppel, F. R. Costa, M. Abdel-Goad, U. Wagenknecht, A. L. Sviskov, B. Lauke; Kautschuk
Gummi Kunststoffe, 4 (2005) 163 – 167.
11. Influence of electron beam irradiation as one of the mixed crosslinking systems on the structure and
properties of nitrile rubber, V. Vijaybaskar, F. R. Costa and Anil K. Bhowmick; Rubber Chemistry
and Technology, 77 (4) (2004), 624 – 645.
Conference:
1. Strain Behavior of Plasma-Polymerized Permeation Barrier Layers on Plastics Films; W. Michaeli,
S. Gbel, F. Costa; PPS 18 (18th Annual Meeting of Polymer Processing Society), Portugal, June
2002 (Proceeding).
2. Flame Retardancy plus Mechanical Improvement - a New Way of Materials Design; U. Wa-
genknecht and F. R. Costa; PPS 20, 2004, Akron, USA (Proceeding).
3. Structural Kinetics in Filled Elastomers and PE/LDH composites; G. Heinrich, F. R. Costa, M.
A. Goad and U. Wagenknecht; 6th Fall Rubber Colloquium (KHK), Hanover (G), November 10th
-13th, 2004 (Proceeding).
4. Nanocomposites Based on Polyethylene and Mg-Al-Layered Double Hydroxide - Potential Envi-
ronment Friendly flame-retardant Composites; F. R. Costa and U. Wagenknecht; Polymerwerk-
stoffe 2004, Halle, Germany (Proceeding).
5. Nanocomposites Based on Polyethylene and Mg–Al-Layered Double Hydroxide: Rheological
Characterization; F. R. Costa, M. A. Goad, U. Wagenknecht and G. Heinrich; PPS 21 (21th Annual
Meeting of Polymer Processing Society), Leipzig, Germany, June 2005 (Proceeding).
APPENDIX D. CURRICULUM VITAE OF FRANCIS RENY COSTA 153
6. Flame-Retardant Polyolefin Composites with Improved Mechanical Properties using Reinforcing
flame-retardants; U. Wagenknecht and F. R. Costa; PPS - 2005, America’s Regional Meeting,
August 14 - 17, 2005, Quebec City, Canada (Proceeding).
7. Layered Double Hydroxides (LDH) als verstarkende Flammhemmer; F. R. Costa, U. Wagenknecht,
G. Heinrich, S. Reinemann; TECHNOMER 2005 (19th Fachtagung ber Verarbeitung und Anwen-
dung von Polymeren), 10 - 12th November, Chemnitz, Germany (Proceeding).
8. Nonlinear shear response of the PE-LDH nanocomposites; M. Grenzer, F. R. Costa, U. Wa-
genknecht and G. Heinrich; Euromech Colloquium 487 ”Structure sensitive mechanics of poly-
mer materials: physical and mechanical aspects”, 10 – 13th October, 2006 Strasbourg, France
(Proceeding).
9. Flame Retardancy and Mechanical Properties of Mg(OH)2 Filled Polyethylene Composites: Po-
tential Development on an Unavoidable Compromise; F. R. Costa, U. Wagenknecht and G. Hein-
rich; European Meeting on Fire Retardancy and Protection of Materials (FRPM’05) (10th Euro-
pean Conference on Fire Retardant Polymers) BAM, Berlin, Germany, 7 - 9th September, 2005
(Poster).
10. Polyolefin-inorganic filler based flame-retardant composites: prospective development in improve-
ment in mechanical properties; U. Wagenknecht, F. R. Costa and G. Heinrich; 8th European Sym-
posium on Polymer Blends (Eurofillers 2005), May 9 to 12, 2005, Bruges, Belgium (Poster).
11. Complex shear response of the PE-LDH nanocomposites; M. Grenzer, F. R. Costa, U. Wagenknecht
and G. Heinrich; Jlich soft matter days 2006, 14 – 17th November, 2006, Bonn, Germany (Poster).