METTLER methods for the DL15, DL22 F&B and DL28bikeitech.com/DATAS/es_free3/f_49780c1f5e3bf.pdf ·...
104
METTLER TOLEDO Titrators METTLER methods for the DL15, DL22 F&B and DL28 Application brochure 33
-
Upload
phunghuong -
Category
Documents
-
view
222 -
download
6
Transcript of METTLER methods for the DL15, DL22 F&B and DL28bikeitech.com/DATAS/es_free3/f_49780c1f5e3bf.pdf ·...

METTLER TOLEDO Titrators
METTLER methodsfor the DL15, DL22 F&B and DL28
Application brochure 33

Editorial
Dear Reader This application brochure represents another step in the tradition of METTLER TOLEDO’s comprehensive titration documentation on practical, every-day examples, and will surely support your analytical work with our new titrators DL15, D22 F&B and DL28. The DL15 titrator is mainly used to determine the acid and base content of a sample. The DL15 is the ideal solution for all requirements in the food and beverage industry, water/wastewater analysis, and the chemical industry when all that is needed is an endpoint titration or a pH measurement. The DL22 Food & Beverage Analyzer has been developed specially for the requirements of the food and beverage industry. It includes predefined methods for the applications most commonly used in these industries. When selecting the control parameters for the titration, you need only to select one of the three settings. No further modifications are necessary. “Fast”, “Normal” and “Cautious”: the choice is up to you! The DL28 Titrator is an easy-to-use, compact endpoint and equivalence point titrator for the food and beverage industry, water/wastewater analysis and the chemical industry. The most relevant methods from these areas have been included to make analyses as simple as possible to perform. Accuracy, precision, speed, GLP compliant documentation, and ease-of-use: these are some of the points we have improved in these new titrators to help you increase productivity. These titrators feature intuitive user guidance so that, for instance, simply pressing the Run button twice starts the method you last ran. Analytical methods have been developed, extensively tested and run on real samples by the applications chemists of the Market Support Group Analytical Chemistry. As a result, the optimized parameters of the titration methods were stored in the titrator as METTLER methods. These represent a great help for the user since they can be immediately run without additional method development work. They also represent a very good base to start with when a new method has to be created. Detailed methods, clear procedures, step-by-step guidance, and literature references: it is with great pleasure that we present you this collection of titration methods. We wish you much success titrating with the METTLER TOLEDO DL15, DL22 F&B and DL28.
Beat Flachsmann Cosimo A. De Caro Product Manager Titration Senior Applications Chemist


Contents Method Title Page
M388 Determination of acid content 1
M389 Determination of base content 4
M390 pH determination: General method 7
M330 Tartaric acid in wine 10
M331 Citric acid in orange juice 13
M332 Determination of malic acid in apple juice 16
M333 Acetic acid content in vinegar 19
M334 Acid number determination in milk 22
M335 Chloride content determination 25
M336 Free sulphur dioxide determination in wines 28
M337 Vitamin C: Voltametric determination 31
M338 Nitrogen determination according to Kjeldahl 34
M339 Determination of calcium and magnesium 37
M340 Reducing sugars determination in beverages according to Rebelein 40
M341 Back value determination for reducing sugars according to Rebelein 43
M342 Standardization value for reducing sugars det. according to Rebelein 46
M343 Iodine number in edible oils and fats according to Wijs 49
M344 Back value of Wijs solution 52
M345 Acid number of edible oils 55
M346 Peroxide number in edible oils and fats 58
M347 Total hardness of water 61
M348a p-value of water 64
M348b m-value of water 67
M349 Potassium content determination by direct measurement 70
M380 TAN Acid number determination according to ASTM D664 73
M381 TAN Blank determination according to ASTM D664 76
M382 TBN Base number determination according to ASTM D4739 79
M383 TBN Blank determination according to ASTM D4739 82
M384 TBN Base number determination according to ASTM D2896 85
M385 Copper content determination in aqueous solutions 88
M386 Nickel content determination in aqueous solutions 91
M387 Potassium content determination by direct measurement 94


M388
Hydrochloric acid, HClM(HCl)=36.46, z=1
50 mL deionized water
Sodium hydroxide, NaOHc(NaOH) = 0.1 mol/L
DL15, DL22 F&B, DL28OKI B4250 Printer(parallel cable ME-51108780)
HCl + NaOH = NaCl + H2O
Titration beakers ME-101974
METTLER TOLEDO
--Wastedisposal
Preparation and Procedures5 mL 0.1 M hydrochloric acidSample
Substance
Chemicals
Titrant
Instruments
Results
Chemistry
Accessories
DG115-SCIndication
Determination of acid content
1) 5 mL 0.1 mol/L hydrochloric acid are added to 50 mLdeionized water.
2) DG115-SC pH glass electrode:The electrode is adjusted using pH buffers 4.01, 7.00, and9.21.
3) The sample is titrated with sodium hydroxide to pH 7.0.
General method for the determination of acid content(alkalimetry).
Remarks
R1: Content (g/L)Calculation
General method for the acid content determination by endpoint titration to pH 7.0 with sodium hydroxide(alkalimetry).
Standard Potassium hydrogen phthalate, 80 mg
Albert AichertAuthor
1

Table of measured values
-------------------------------------------------------------------Method ID 920 Title Acid content EP25-04-2005 17:15 Author A. Aichert-------------------------------------------------------------------
All resultsSample Sample ID Result Calculat. Value Unit-------------------------------------------------------------------1 HCl 1 Cont. 0.36306 [%]
2 HCl 1 Cont. 0.36291 [%]
3 HCl 1 Cont. 0.36289 [%]
4 HCl 1 Cont. 0.36290 [%]
5 HCl 1 Cont. 0.36298 [%]
6 HCl 1 Cont. 0.36288 [%]
Statistics reportResult n x s Unit srel [%]-------------------------------------------------------------------1 6 0.36294 0.00007 [%] 0.019
ResultsActive sample Deleted samples-------------------------------------------------------------------123456
Titration curve
Results
2

Method ID 920 Title Acid content EP25-04-2005 17:15 Author A. Aichert
Sample para. Sample ID . . . . . . . . . . . . . . . HCl Entry type . . . . . . . . . . . . . . Volume Minimum [mL] . . . . . . . . . . . . . 0.1 Maximum [mL] . . . . . . . . . . . . . 10.0 Density [g/mL] . . . . . . . . . . . . 1.0 Mol.m. [g/mol] . . . . . . . . . . . . 36.458 Equival. number z . . . . . . . . . . . 1 Temp.sensor . . . . . . . . . . . . . . Manual Temp. [°C] . . . . . . . . . . . . . . 25.0Stir Speed [%] . . . . . . . . . . . . . . . 35 Mixing time [s] . . . . . . . . . . . . 10EP titration Titrant . . . . . . . . . . . . . . . . NaOH 0.1 Conc.[mol/L] . . . . . . . . . . . . 0.1 Sensor . . . . . . . . . . . . . . . . DG115 Unit . . . . . . . . . . . . . . . . pH Blank . . . . . . . . . . . . . . . . . Entry Value [mmol] . . . . . . . . . . . . 0.00 Predis.[mL] . . . . . . . . . . . . . . 3.0 Back value [mmol] . . . . . . . . . . . 0.00 Control parameters Set of parameters . . . . . . . . . User Addition . . . . . . . . . . . . . . Dynamic dE(set) [mV] . . . . . . . . . . . . 14 dVmin [mL] . . . . . . . . . . . . . 0.002 dVmax [mL] . . . . . . . . . . . . . 0.5 Measure mode . . . . . . . . . . . . EQU controlled dE[mV] . . . . . . . . . . . . . . . 0.5 dt[s] . . . . . . . . . . . . . . . 1 t(min) [s] . . . . . . . . . . . . . 3 t(max) [s] . . . . . . . . . . . . . 30 Recognition Tendency . . . . . . . . . . . . . . Positive Termination param. Vmax [mL] . . . . . . . . . . . . . 20.0 Evaluation Numb. EPs . . . . . . . . . . . . . 1 End point 1 . . . . . . . . . . . . Absolute Potential 1 [pH] . . . . . . . . . . 7.00Calculation 1 Calculation . . . . . . . . . . . . . . Cont. Type . . . . . . . . . . . . . . . . . Cont. Unit . . . . . . . . . . . . . . . . . % Which EQP . . . . . . . . . . . . . . . 1 Decimal places . . . . . . . . . . . . 5 Result limits . . . . . . . . . . . . . No Statistics . . . . . . . . . . . . . . YesCalculation 2 Calculation . . . . . . . . . . . . . . NoneCalculation 3 Calculation . . . . . . . . . . . . . . NoneReport Output . . . . . . . . . . . . . . . . Printer Results . . . . . . . . . . . . . . . . GLP Meas. val. table . . . . . . . . . . . Yes E - V curve . . . . . . . . . . . . . . Yes dE/dV curve . . . . . . . . . . . . . . Yes
MethodOther Control parameters
Set of parameters . . . . . . . Fast Addition . . . . . . . . . . . . Dynamic dE(set) [mV] . . . . . . . . . . 18 dVmin [mL] . . . . . . . . . . . 0.004 dVmax [mL] . . . . . . . . . . . 0.75 Measure mode . . . . . . . . . . EQU controlled dE[mV] . . . . . . . . . . . . . 1.0 dt[s] . . . . . . . . . . . . . 1 t(min) [s] . . . . . . . . . . . 2 t(max) [s] . . . . . . . . . . . 20
Set of parameters . . . . . . . Cautious Addition . . . . . . . . . . . . Dynamic dE(set) [mV] . . . . . . . . . . 8 dVmin [mL] . . . . . . . . . . . 0.002 dVmax [mL] . . . . . . . . . . . 0.25 Measure mode . . . . . . . . . . EQU controlled dE[mV] . . . . . . . . . . . . . 0.5 dt[s] . . . . . . . . . . . . . 2 t(min) [s] . . . . . . . . . . . 5 t(max) [s] . . . . . . . . . . . 30
3

M389
Sodium hydroxide, NaOHM(NaOH)= 40.00, z=1
50 mL deionized water
Hydrochloric acid, HClc(HCl) = 0.1 mol/L
DL15, DL22 F&B, DL28OKI B4250 Printer(parallel cable ME-51108780)
HCl + NaOH = NaCl + H2O
Titration beakers ME-101974
METTLER TOLEDO
--Wastedisposal
Preparation and Procedures5 mL 0.1 M sodium hydroxideSample
Substance
Chemicals
Titrant
Instruments
Results
Chemistry
Accessories
DG115-SCIndication
Determination of base content
1) 5 mL 0.1 mol/L sodium hydroxide are added to 50 mLdeionized water.
2) DG115-SC pH glass electrode:The electrode is adjusted using pH buffers 4.01, 7.00, and9.21.
3) The sample is titrated with hydrochloric acid to pH 7.0.
General method for the determination of base content(acidimetry).
Remarks
R1: Content (%)Calculation
General method for the base content determination by endpoint titration to pH 7.0 with hydrochloric acid(acidimetry).
Standard THAM, approx. 50 mg
Albert AichertAuthor
4

Table of measured values
-------------------------------------------------------------------Method ID 921 Title Base content EP26-04-2005 08:55 Author A. Aichert-------------------------------------------------------------------
All resultsSample Sample ID Result Calculat. Value Unit-------------------------------------------------------------------1 NaOH 1 Cont. 0.40286 [%]
2 NaOH 1 Cont. 0.40342 [%]
3 NaOH 1 Cont. 0.40362 [%]
4 NaOH 1 Cont. 0.40360 [%]
5 NaOH 1 Cont. 0.40321 [%]
Statistics reportResult n x s Unit srel [%]-------------------------------------------------------------------1 5 0.40334 0.00032 [%] 0.079
ResultsActive sample Deleted samples-------------------------------------------------------------------12345
Titration curve
Results
5

Method ID 921 Title Base content EP26-04-2005 08:55 Author A. Aichert
Sample para. Sample ID . . . . . . . . . . . . . . . NaOH Entry type . . . . . . . . . . . . . . Volume Minimum [mL] . . . . . . . . . . . . . 0.1 Maximum [mL] . . . . . . . . . . . . . 10.0 Density [g/mL] . . . . . . . . . . . . 1.0 Mol.m. [g/mol] . . . . . . . . . . . . 36.458 Equival. number z . . . . . . . . . . . 1 Temp.sensor . . . . . . . . . . . . . . Manual Temp. [°C] . . . . . . . . . . . . . . 25.0Stir Speed [%] . . . . . . . . . . . . . . . 35 Mixing time [s] . . . . . . . . . . . . 10EP titration Titrant . . . . . . . . . . . . . . . . NaOH 0.1 Conc.[mol/L] . . . . . . . . . . . . 0.1 Sensor . . . . . . . . . . . . . . . . DG115 Unit . . . . . . . . . . . . . . . . pH Blank . . . . . . . . . . . . . . . . . Entry Value [mmol] . . . . . . . . . . . . 0.00 Predis.[mL] . . . . . . . . . . . . . . 3.0 Back value [mmol] . . . . . . . . . . . 0.00 Control parameters Set of parameters . . . . . . . . . User Addition . . . . . . . . . . . . . . Dynamic dE(set) [mV] . . . . . . . . . . . . 14 dVmin [mL] . . . . . . . . . . . . . 0.010 dVmax [mL] . . . . . . . . . . . . . 0.5 Measure mode . . . . . . . . . . . . EQU controlled dE[mV] . . . . . . . . . . . . . . . 0.5 dt[s] . . . . . . . . . . . . . . . 1 t(min) [s] . . . . . . . . . . . . . 3 t(max) [s] . . . . . . . . . . . . . 30 Recognition Tendency . . . . . . . . . . . . . . Negative Termination param. Vmax [mL] . . . . . . . . . . . . . 20.0 Evaluation Numb. EPs . . . . . . . . . . . . . 1 End point 1 . . . . . . . . . . . . Absolute Potential 1 [pH] . . . . . . . . . . 7.00Calculation 1 Calculation . . . . . . . . . . . . . . Cont. Type . . . . . . . . . . . . . . . . . Cont. Unit . . . . . . . . . . . . . . . . . % Which EQP . . . . . . . . . . . . . . . 1 Decimal places . . . . . . . . . . . . 5 Result limits . . . . . . . . . . . . . No Statistics . . . . . . . . . . . . . . YesCalculation 2 Calculation . . . . . . . . . . . . . . NoneCalculation 3 Calculation . . . . . . . . . . . . . . NoneReport Output . . . . . . . . . . . . . . . . Printer Results . . . . . . . . . . . . . . . . GLP Meas. val. table . . . . . . . . . . . Yes E - V curve . . . . . . . . . . . . . . Yes dE/dV curve . . . . . . . . . . . . . . Yes
MethodOther Control parameters
Set of parameters . . . . . . . Fast Addition . . . . . . . . . . . . Dynamic dE(set) [mV] . . . . . . . . . . 18 dVmin [mL] . . . . . . . . . . . 0.020 dVmax [mL] . . . . . . . . . . . 0.75 Measure mode . . . . . . . . . . EQU controlled dE[mV] . . . . . . . . . . . . . 1.0 dt[s] . . . . . . . . . . . . . 1 t(min) [s] . . . . . . . . . . . 2 t(max) [s] . . . . . . . . . . . 20
Set of parameters . . . . . . . Cautious Addition . . . . . . . . . . . . Dynamic dE(set) [mV] . . . . . . . . . . 8 dVmin [mL] . . . . . . . . . . . 0.010 dVmax [mL] . . . . . . . . . . . 0.25 Measure mode . . . . . . . . . . EQU controlled dE[mV] . . . . . . . . . . . . . 0.5 dt[s] . . . . . . . . . . . . . 2 t(min) [s] . . . . . . . . . . . 5 t(max) [s] . . . . . . . . . . . 30
6

M390
--
--
--
DL15, DL22 F&B, DL28OKI B4250 Printer(parallel cable ME-51108780)
--
Titration beakers ME-101974
METTLER TOLEDO
--Wastedisposal
Preparation and ProceduresVarious aqueous solutions, 50 mLSample
Substance
Chemicals
Titrant
Instruments
Results
Chemistry
Accessories
DG115-SCIndication
pH determination: General method
1) 50 mL sample solution are added into the beaker.
2) DG115-SC pH glass electrode:The electrode is adjusted using pH buffers 4.01, 7.00, and9.21.
3) The electrode is thoroughly cleaned after each sample withdeionized water.
General method for the determination of pH value in differentaqueous sample solutions.
Remarks
R1: pH
pH = -log(H+)
H+ : activity of hydrogen ions
Calculation
General method for the determination of pH values in different aqueous solutions.
Standard --
MSG AnaChemAuthor
7

Table of measured values
-------------------------------------------------------------------Method ID 926 Title pH measure00-00-0000 00:00 Author-------------------------------------------------------------------Sensor DG115 Unit pH-------------------------------------------------------------------Sample 6Sample ID WineEntry type MassMass [g] 60Minimum [g] 0.01Maximum [g] 10Density [g/mL] 1.0Mol.m. [g/mol] 1.00Equival. number z 1Mixing time [s] 10Duration [min:s] 0:03Temp. [°C] 25.0
Result Calculat. Value Unit-------------------------------------------------------------------1 Meas. val. 3.602 [pH]
Statistics reportResult n x s Unit srel [%]-------------------------------------------------------------------1 6 3.603 0.001 [pH] 0.018
Other samples
Milk:Statistics reportResult n x s Unit srel [%]-------------------------------------------------------------------1 8 6.754 0.003 [pH] 0.043
pH 9.21 buffer solution:Statistics reportResult n x s Unit srel [%]-------------------------------------------------------------------1 10 9.226 0.001 [pH] 0.006
Titration curve
Results
8
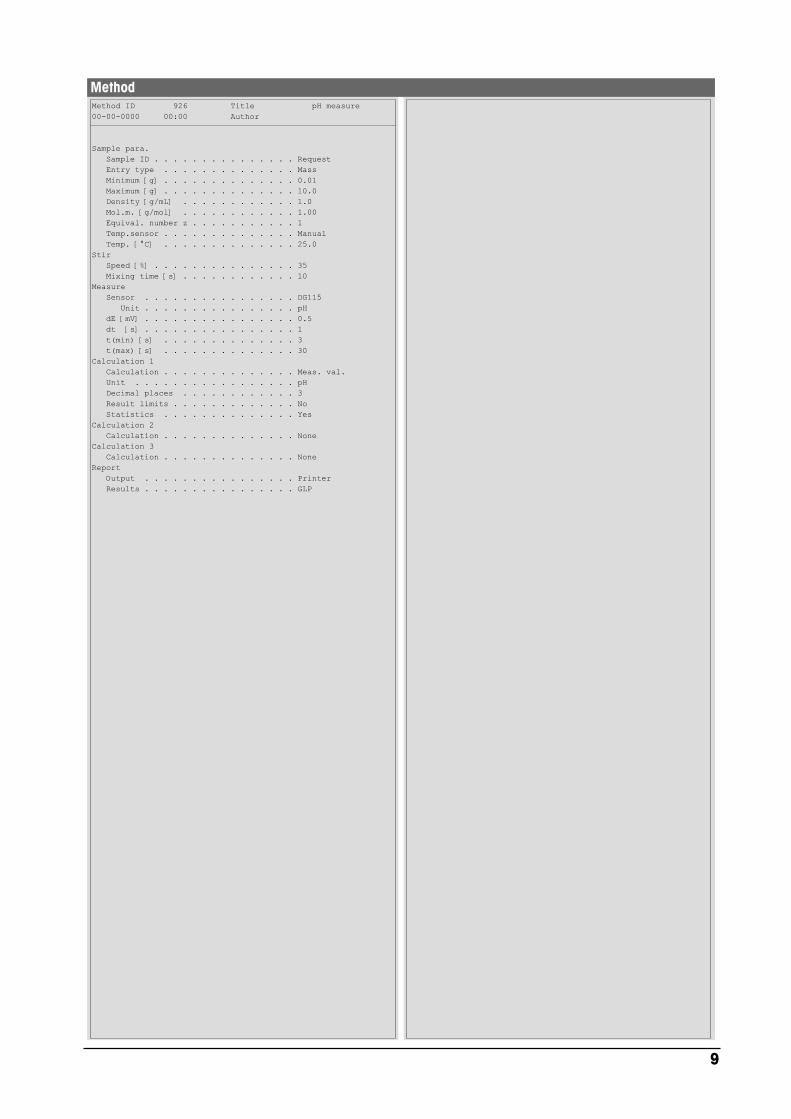
Method ID 926 Title pH measure00-00-0000 00:00 Author
Sample para. Sample ID . . . . . . . . . . . . . . . Request Entry type . . . . . . . . . . . . . . Mass Minimum [g] . . . . . . . . . . . . . . 0.01 Maximum [g] . . . . . . . . . . . . . . 10.0 Density [g/mL] . . . . . . . . . . . . 1.0 Mol.m. [g/mol] . . . . . . . . . . . . 1.00 Equival. number z . . . . . . . . . . . 1 Temp.sensor . . . . . . . . . . . . . . Manual Temp. [°C] . . . . . . . . . . . . . . 25.0Stir Speed [%] . . . . . . . . . . . . . . . 35 Mixing time [s] . . . . . . . . . . . . 10Measure Sensor . . . . . . . . . . . . . . . . DG115 Unit . . . . . . . . . . . . . . . . pH dE [mV] . . . . . . . . . . . . . . . . 0.5 dt [s] . . . . . . . . . . . . . . . . 1 t(min) [s] . . . . . . . . . . . . . . 3 t(max) [s] . . . . . . . . . . . . . . 30Calculation 1 Calculation . . . . . . . . . . . . . . Meas. val. Unit . . . . . . . . . . . . . . . . . pH Decimal places . . . . . . . . . . . . 3 Result limits . . . . . . . . . . . . . No Statistics . . . . . . . . . . . . . . YesCalculation 2 Calculation . . . . . . . . . . . . . . NoneCalculation 3 Calculation . . . . . . . . . . . . . . NoneReport Output . . . . . . . . . . . . . . . . Printer Results . . . . . . . . . . . . . . . . GLP
Method
9
M330
Tartaric acid, (CHOH)2(COOH)2 ;M=150.09 g/mol; z= 2
--
Sodium hydroxide, NaOHc(NaOH) = 1.0 mol/L;
DL22 F&B, DL28OKI B4250 Printer(parallel cable ME-51108780)
H2C4H4O6 + 2NaOH = Na2C4H4O6 +2H2O
Titration beakers ME-101974
METTLER TOLEDO
No special treatment is necessary.Wastedisposal
Preparation and Procedures50 mL wine from grapesSample
Substance
Chemicals
Titrant
Instruments
Results
Chemistry
Accessories
DG115-SCIndication
Tartaric acid in wine
The samples should be degassed in an ultrasonic bath for fiveminutes to get rid of CO2.
Before the analysis a three point calibration of the electrode wasperformed using METTLER TOLEDO buffers of pH 4.01, 7.00and 9.21.
The principle acids found in grapes are tartaric and malic acids.Their proportions vary depending on the variety of grapes,however in the wine tartaric dominates.
Unripe grapes are sour due to the high concentration of tartaricacid. When the grapes ripen, much of this acid is converted tosugar. Then during the fermentation process the yeasts thenconvert these sugars into ethanol and carbon dioxide.
In the determination of total acidity in wine all the acid isassumed to be tartaric, so that the result is expressed as gramstartaric acid per liter of wine.
Total acidity of the wine affects taste, color, as well as resistanceto microbial spoilage.
Remarks
Tartaric acid is chosen to express theacid content in g/L in wine because it isthe predominantly present acid.
Calculation
General method for the determination of acidity of wines
Standard Potassium hydrogen phthalate, 80 mg
M. BiberAuthor
10
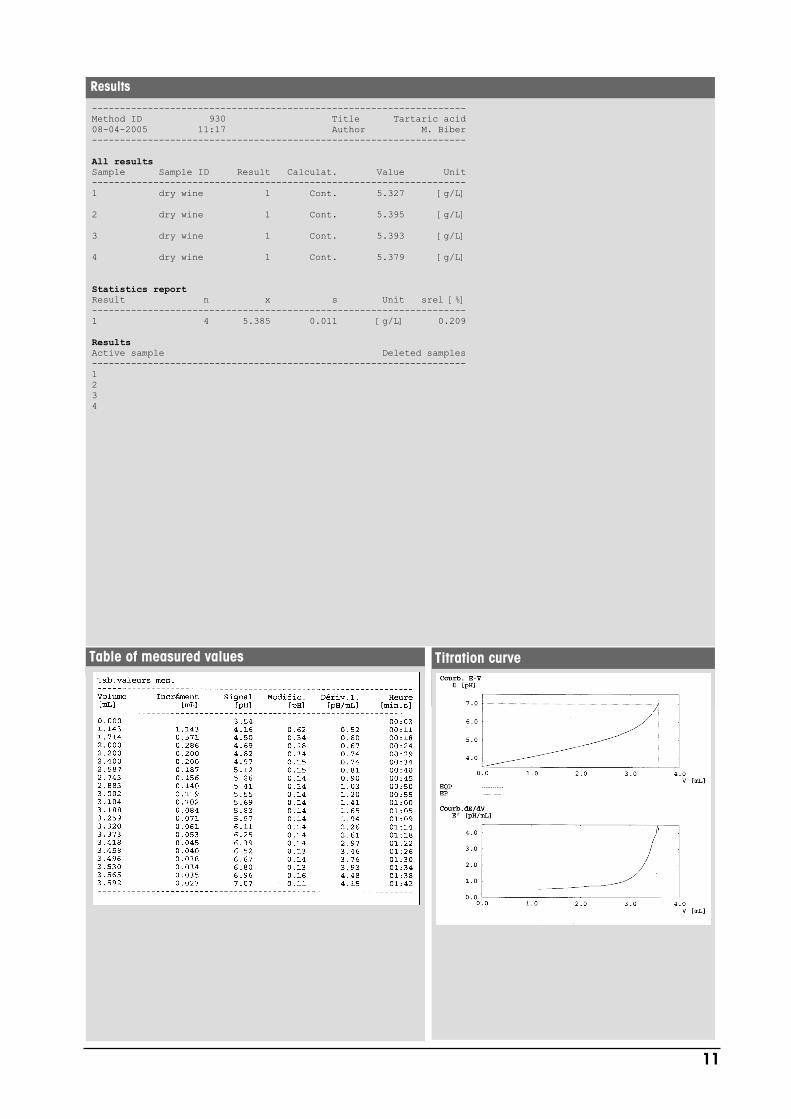
Table of measured values
-------------------------------------------------------------------Method ID 930 Title Tartaric acid08-04-2005 11:17 Author M. Biber-------------------------------------------------------------------
All resultsSample Sample ID Result Calculat. Value Unit-------------------------------------------------------------------1 dry wine 1 Cont. 5.327 [g/L]
2 dry wine 1 Cont. 5.395 [g/L]
3 dry wine 1 Cont. 5.393 [g/L]
4 dry wine 1 Cont. 5.379 [g/L]
Statistics reportResult n x s Unit srel [%]-------------------------------------------------------------------1 4 5.385 0.011 [g/L] 0.209
ResultsActive sample Deleted samples-------------------------------------------------------------------1234
Titration curve
Results
11

Method ID 930 Title Tartaric acid08-04-2005 11:17 Author M. Biber
Sample para. Sample ID . . . . . . . . . . . . . . . dry wine Entry type . . . . . . . . . . . . . . Volume Volume [mL] . . . . . . . . . . . . . . 50.0 Density [g/mL] . . . . . . . . . . . . 1.0 Mol.m. [g/mol] . . . . . . . . . . . . 150.09 Equival. number z . . . . . . . . . . . 2 Temp.sensor . . . . . . . . . . . . . . Manual Temp. [°C] . . . . . . . . . . . . . . 25.0Stir Speed [%] . . . . . . . . . . . . . . . 35 Mixing time [s] . . . . . . . . . . . . 10EP titration Titrant . . . . . . . . . . . . . . . . NaOH 1.0 Conc.[mol/L] . . . . . . . . . . . . 1.0 Sensor . . . . . . . . . . . . . . . . DG115 Unit . . . . . . . . . . . . . . . . pH Blank . . . . . . . . . . . . . . . . . Entry Value [mmol] . . . . . . . . . . . . 0.00 Predis.[mL] . . . . . . . . . . . . . . 2.0 Back value [mmol] . . . . . . . . . . . 0.00 Control parameters Set of parameters . . . . . . . . . User Addition . . . . . . . . . . . . . . Dynamic dE(set) [mV] . . . . . . . . . . . . 8 dVmin [mL] . . . . . . . . . . . . . 0.020 dVmax [mL] . . . . . . . . . . . . . 0.2 Measure mode . . . . . . . . . . . . EQU controlled dE[mV] . . . . . . . . . . . . . . . 0.5 dt[s] . . . . . . . . . . . . . . . 1 t(min) [s] . . . . . . . . . . . . . 3 t(max) [s] . . . . . . . . . . . . . 30 Recognition Tendency . . . . . . . . . . . . . . Positive Termination param. Vmax [mL] . . . . . . . . . . . . . 10.0 Evaluation Numb. EPs . . . . . . . . . . . . . 1 End point 1 . . . . . . . . . . . . Absolute Potential 1 [pH] . . . . . . . . . . 7.00Calculation 1 Calculation . . . . . . . . . . . . . . Cont. Type . . . . . . . . . . . . . . . . . Cont. Unit . . . . . . . . . . . . . . . . . g/L Which EQP . . . . . . . . . . . . . . . 1 Decimal places . . . . . . . . . . . . 3 Result limits . . . . . . . . . . . . . No Statistics . . . . . . . . . . . . . . YesCalculation 2 Calculation . . . . . . . . . . . . . . NoneCalculation 3 Calculation . . . . . . . . . . . . . . NoneReport Output . . . . . . . . . . . . . . . . Printer Results . . . . . . . . . . . . . . . . GLP Meas. val. table . . . . . . . . . . . Yes E - V curve . . . . . . . . . . . . . . Yes dE/dV curve . . . . . . . . . . . . . . Yes
MethodOther Control parameters
Set of parameters . . . . . . . Fast Addition . . . . . . . . . . . . Dynamic dE(set) [mV] . . . . . . . . . . 16 dVmin [mL] . . . . . . . . . . . 0.05 dVmax [mL] . . . . . . . . . . . 0.4 Measure mode . . . . . . . . . . EQU controlled dE[mV] . . . . . . . . . . . . . 1.0 dt[s] . . . . . . . . . . . . . 1 t(min) [s] . . . . . . . . . . . 2 t(max) [s] . . . . . . . . . . . 20
Set of parameters . . . . . . . Cautious Addition . . . . . . . . . . . . Dynamic dE(set) [mV] . . . . . . . . . . 8 dVmin [mL] . . . . . . . . . . . 0.02 dVmax [mL] . . . . . . . . . . . 0.2 Measure mode . . . . . . . . . . EQU controlled dE[mV] . . . . . . . . . . . . . 0.5 dt[s] . . . . . . . . . . . . . 2 t(min) [s] . . . . . . . . . . . 7 t(max) [s] . . . . . . . . . . . 40
12

M331
Citric acid, M=192.13 g/mol; z=3HOOC-CH2-COH(COOH)-CH2-COOH
50 mL deionized water
Sodium hydroxide, NaOHc(NaOH) = 0.1 mol/L;
DL22 F&B, DL28OKI B4250 Printer(parallel cable ME-51108780)
H3C6H5O7 + 3NaOH =Na3C6H5O7 + 3H2O
Titration beakers ME-101974
METTLER TOLEDO
No special treatment is necessary.Wastedisposal
Preparation and Procedures5 mL orange juiceSample
Substance
Chemicals
Titrant
Instruments
Results
Chemistry
Accessories
DG115-SCIndication
Citric acid in orange juice
1) 5 mL orange juice are added to 50 mL deionized water.
2) The samples should be degassed in an ultrasonic bath forfive minutes to get rid of CO2.
3) DG115-SC pH glass electrode:The electrode is adjusted using pH buffers 4.01, 7.00, and9.21.
4) The sample is titrated with sodium hydroxide to pH 8.1 .
The principle acid found in orange juice is citric acid. In thedetermination of total acidity all the acid is assumed to be citric,so that the result is expressed as grams citric acid per liter ofjuice.
Literature
1) Titration Applications Brochure 19,"Determination in Beverages"Memory Card Application PackageME-51725013 (see applications M561-M562).
2) Endpoint titration to pH 8.1:Schweizerisches Lebensmittelbuch (Swiss Food Handbook),5th Edition, Volume 3, Chap. 28A (1994).
Remarks
R1 = Content (g/L)Calculation
Method for the determination of citric acid in orange juice by endpoint titration to pH 8.1
Standard Potassium hydrogen phthalate, 80 mg
Albert AichertAuthor
13
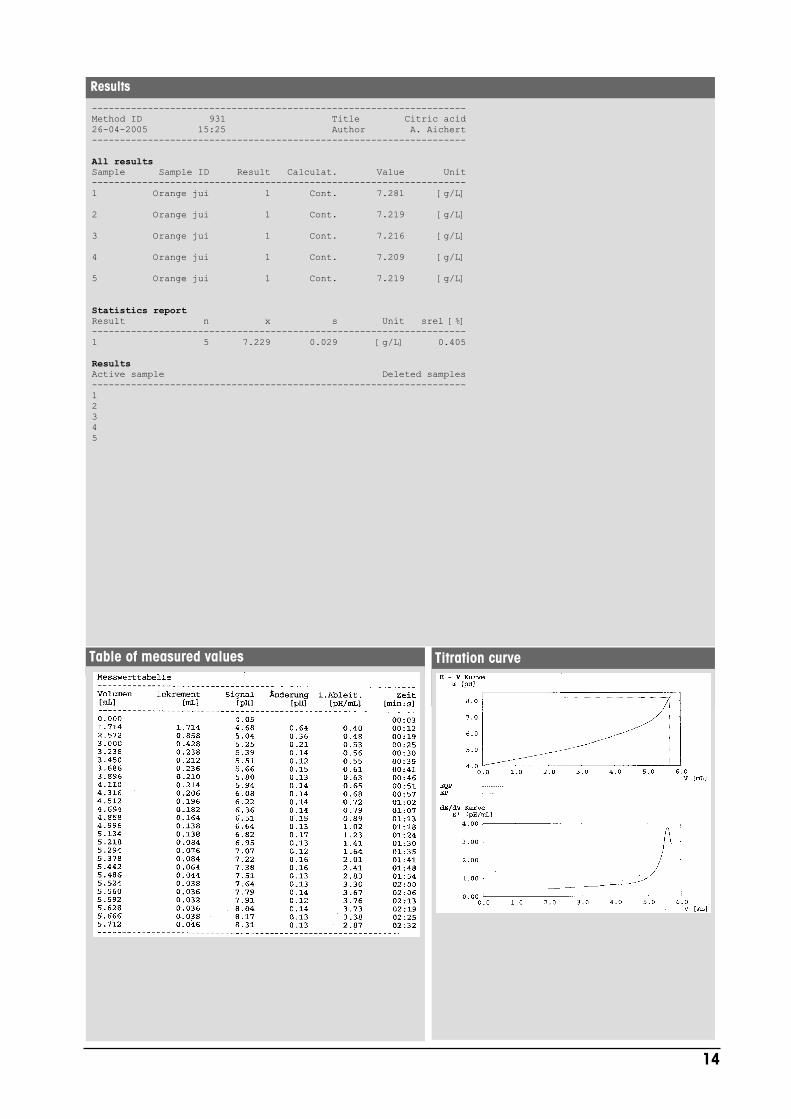
Table of measured values
-------------------------------------------------------------------Method ID 931 Title Citric acid26-04-2005 15:25 Author A. Aichert-------------------------------------------------------------------
All resultsSample Sample ID Result Calculat. Value Unit-------------------------------------------------------------------1 Orange jui 1 Cont. 7.281 [g/L]
2 Orange jui 1 Cont. 7.219 [g/L]
3 Orange jui 1 Cont. 7.216 [g/L]
4 Orange jui 1 Cont. 7.209 [g/L]
5 Orange jui 1 Cont. 7.219 [g/L]
Statistics reportResult n x s Unit srel [%]-------------------------------------------------------------------1 5 7.229 0.029 [g/L] 0.405
ResultsActive sample Deleted samples-------------------------------------------------------------------12345
Titration curve
Results
14
Method ID 930 Title Citric acid26-04-2005 15:25 Author A. Aichert
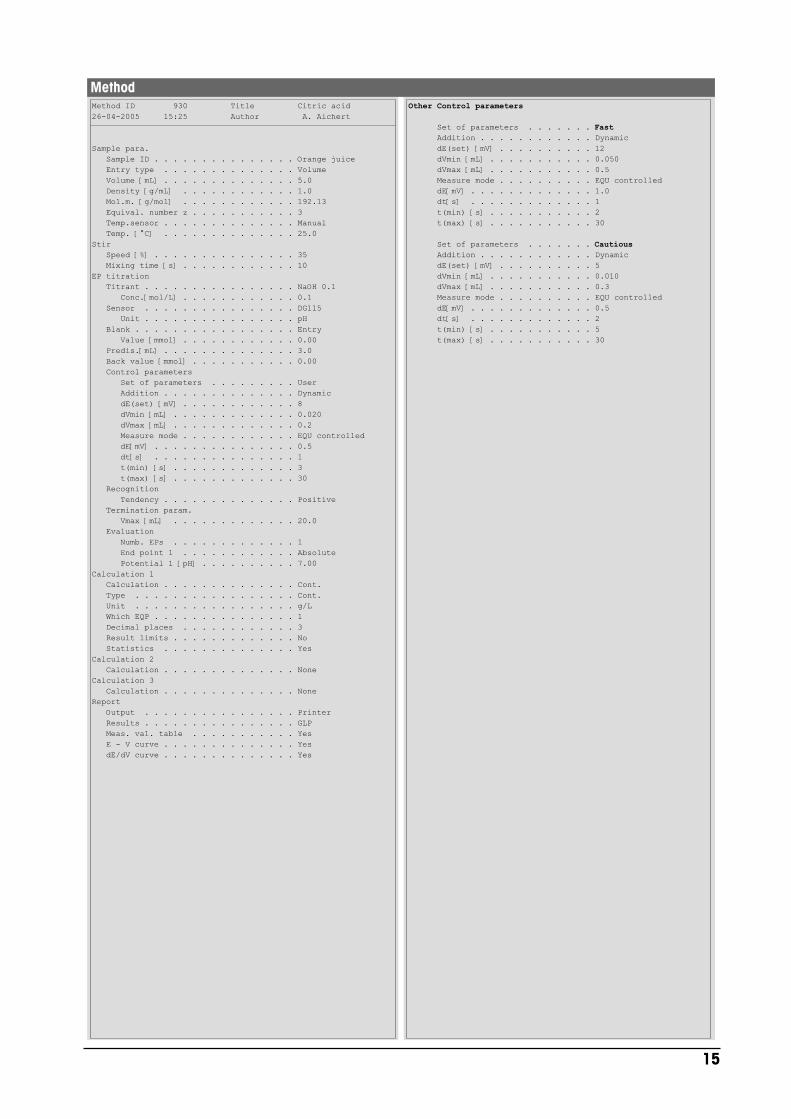
Sample para. Sample ID . . . . . . . . . . . . . . . Orange juice Entry type . . . . . . . . . . . . . . Volume Volume [mL] . . . . . . . . . . . . . . 5.0 Density [g/mL] . . . . . . . . . . . . 1.0 Mol.m. [g/mol] . . . . . . . . . . . . 192.13 Equival. number z . . . . . . . . . . . 3 Temp.sensor . . . . . . . . . . . . . . Manual Temp. [°C] . . . . . . . . . . . . . . 25.0Stir Speed [%] . . . . . . . . . . . . . . . 35 Mixing time [s] . . . . . . . . . . . . 10EP titration Titrant . . . . . . . . . . . . . . . . NaOH 0.1 Conc.[mol/L] . . . . . . . . . . . . 0.1 Sensor . . . . . . . . . . . . . . . . DG115 Unit . . . . . . . . . . . . . . . . pH Blank . . . . . . . . . . . . . . . . . Entry Value [mmol] . . . . . . . . . . . . 0.00 Predis.[mL] . . . . . . . . . . . . . . 3.0 Back value [mmol] . . . . . . . . . . . 0.00 Control parameters Set of parameters . . . . . . . . . User Addition . . . . . . . . . . . . . . Dynamic dE(set) [mV] . . . . . . . . . . . . 8 dVmin [mL] . . . . . . . . . . . . . 0.020 dVmax [mL] . . . . . . . . . . . . . 0.2 Measure mode . . . . . . . . . . . . EQU controlled dE[mV] . . . . . . . . . . . . . . . 0.5 dt[s] . . . . . . . . . . . . . . . 1 t(min) [s] . . . . . . . . . . . . . 3 t(max) [s] . . . . . . . . . . . . . 30 Recognition Tendency . . . . . . . . . . . . . . Positive Termination param. Vmax [mL] . . . . . . . . . . . . . 20.0 Evaluation Numb. EPs . . . . . . . . . . . . . 1 End point 1 . . . . . . . . . . . . Absolute Potential 1 [pH] . . . . . . . . . . 7.00Calculation 1 Calculation . . . . . . . . . . . . . . Cont. Type . . . . . . . . . . . . . . . . . Cont. Unit . . . . . . . . . . . . . . . . . g/L Which EQP . . . . . . . . . . . . . . . 1 Decimal places . . . . . . . . . . . . 3 Result limits . . . . . . . . . . . . . No Statistics . . . . . . . . . . . . . . YesCalculation 2 Calculation . . . . . . . . . . . . . . NoneCalculation 3 Calculation . . . . . . . . . . . . . . NoneReport Output . . . . . . . . . . . . . . . . Printer Results . . . . . . . . . . . . . . . . GLP Meas. val. table . . . . . . . . . . . Yes E - V curve . . . . . . . . . . . . . . Yes dE/dV curve . . . . . . . . . . . . . . Yes
MethodOther Control parameters
Set of parameters . . . . . . . Fast Addition . . . . . . . . . . . . Dynamic dE(set) [mV] . . . . . . . . . . 12 dVmin [mL] . . . . . . . . . . . 0.050 dVmax [mL] . . . . . . . . . . . 0.5 Measure mode . . . . . . . . . . EQU controlled dE[mV] . . . . . . . . . . . . . 1.0 dt[s] . . . . . . . . . . . . . 1 t(min) [s] . . . . . . . . . . . 2 t(max) [s] . . . . . . . . . . . 30
Set of parameters . . . . . . . Cautious Addition . . . . . . . . . . . . Dynamic dE(set) [mV] . . . . . . . . . . 5 dVmin [mL] . . . . . . . . . . . 0.010 dVmax [mL] . . . . . . . . . . . 0.3 Measure mode . . . . . . . . . . EQU controlled dE[mV] . . . . . . . . . . . . . 0.5 dt[s] . . . . . . . . . . . . . 2 t(min) [s] . . . . . . . . . . . 5 t(max) [s] . . . . . . . . . . . 30
15
M332
Malic acid, HOOC-CH2-CH(OH)-COOHM = 134.09 g/mol, z=2
50 mL deionized water
Sodium hydroxide, NaOHc(NaOH) = 0.1 mol/L
DL22 F&B, DL28OKI B4250 Printer(parallel cable ME-51108780)
C4H6O5 + 2 NaOH =
C4H4O52- + 2 H2O + 2 Na+
Titration beakers ME-101974
METTLER TOLEDO
Neutralization before final disposal.Wastedisposal
Preparation and Procedures5 mL apple juiceSample
Substance
Chemicals
Titrant
Instruments
Results
Chemistry
Accessories
DG115-SCIndication
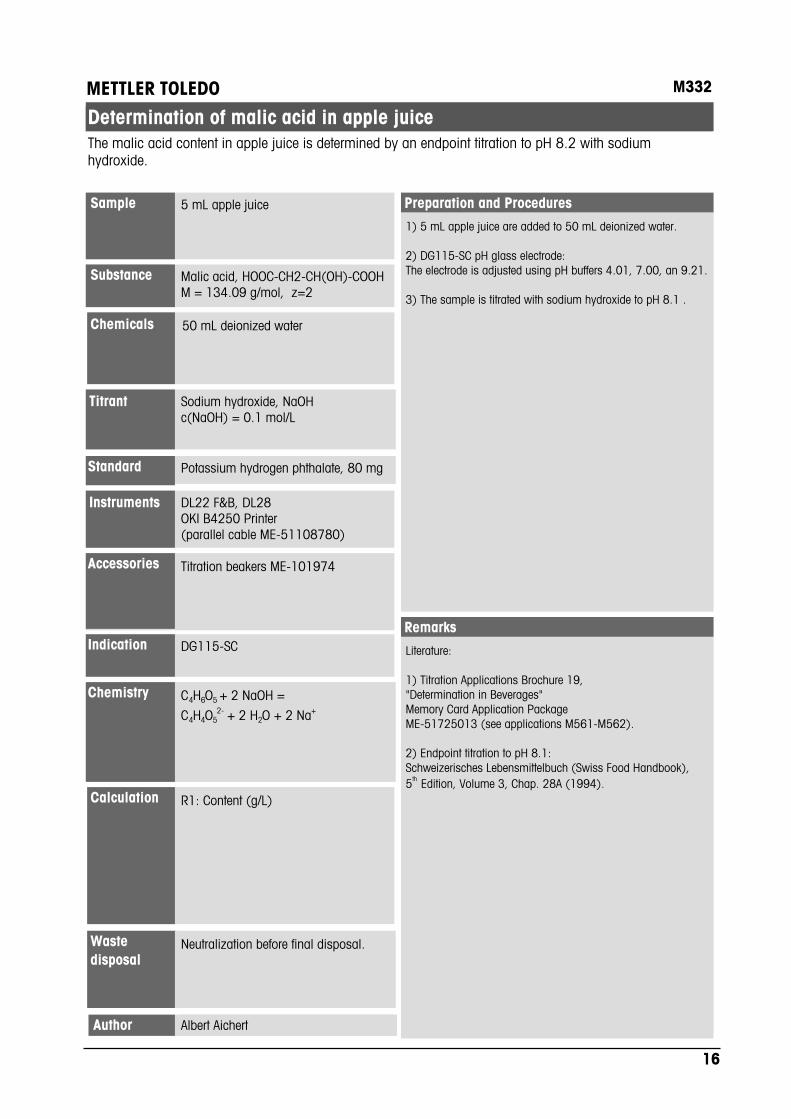
Determination of malic acid in apple juice
1) 5 mL apple juice are added to 50 mL deionized water.
2) DG115-SC pH glass electrode:The electrode is adjusted using pH buffers 4.01, 7.00, an 9.21.
3) The sample is titrated with sodium hydroxide to pH 8.1 .
Literature:
1) Titration Applications Brochure 19,"Determination in Beverages"Memory Card Application PackageME-51725013 (see applications M561-M562).
2) Endpoint titration to pH 8.1:Schweizerisches Lebensmittelbuch (Swiss Food Handbook),5th Edition, Volume 3, Chap. 28A (1994).
Remarks
R1: Content (g/L)Calculation
The malic acid content in apple juice is determined by an endpoint titration to pH 8.2 with sodiumhydroxide.
Standard Potassium hydrogen phthalate, 80 mg
Albert AichertAuthor
16

Table of measured values
-------------------------------------------------------------------Method ID 932 Title Malic acid24-04-2005 20:06 Author A. Aichert-------------------------------------------------------------------
All resultsSample Sample ID Result Calculat. Value Unit-------------------------------------------------------------------1 PrId Fix 1 Cont. 3.478 [g/L]
2 PrId Fix 1 Cont. 3.531 [g/L]
3 PrId Fix 1 Cont. 3.503 [g/L]
4 PrId Fix 1 Cont. 3.511 [g/L]
5 PrId Fix 1 Cont. 3.526 [g/L]
6 PrId Fix 1 Cont. 3.520 [g/L]
Statistics reportResult n x s Unit srel [%]-------------------------------------------------------------------1 5 3.518 0.011 [g/L] 0.324
ResultsActive sample Deleted samples-------------------------------------------------------------------23456
Titration curve
Results
17

Method ID 932 Title Malic acid24-04-2005 20:06 Author A. Aichert
Sample para. Sample ID . . . . . . . . . . . . . . . PrID Fix Entry type . . . . . . . . . . . . . . Volume Volume [mL] . . . . . . . . . . . . . . 5 Density [g/mL] . . . . . . . . . . . . 1.0 Mol.m. [g/mol] . . . . . . . . . . . . 134.09 Equival. number z . . . . . . . . . . . 2 Temp.sensor . . . . . . . . . . . . . . Manual Temp. [°C] . . . . . . . . . . . . . . 25.0Stir Speed [%] . . . . . . . . . . . . . . . 35 Mixing time [s] . . . . . . . . . . . . 10EP titration Titrant . . . . . . . . . . . . . . . . NaOH 0.1 Conc.[mol/L] . . . . . . . . . . . . 0.1 Sensor . . . . . . . . . . . . . . . . DG115 Unit . . . . . . . . . . . . . . . . pH Blank . . . . . . . . . . . . . . . . . Entry Value [mmol] . . . . . . . . . . . . 0.00 Predis.[mL] . . . . . . . . . . . . . . 3 Back value [mmol] . . . . . . . . . . . 0.00 Control parameters Set of parameters . . . . . . . . . User Addition . . . . . . . . . . . . . . Dynamic dE(set) [mV] . . . . . . . . . . . . 12 dVmin [mL] . . . . . . . . . . . . . 0.010 dVmax [mL] . . . . . . . . . . . . . 0.5 Measure mode . . . . . . . . . . . . EQU controlled dE[mV] . . . . . . . . . . . . . . . 0.5 dt[s] . . . . . . . . . . . . . . . 1 t(min) [s] . . . . . . . . . . . . . 3 t(max) [s] . . . . . . . . . . . . . 30 Recognition Tendency . . . . . . . . . . . . . . Positive Termination param. Vmax [mL] . . . . . . . . . . . . . 20.0 Evaluation Numb. EPs . . . . . . . . . . . . . 1 End point 1 . . . . . . . . . . . . Absolute Potential 1 [pH] . . . . . . . . . . 8.10Calculation 1 Calculation . . . . . . . . . . . . . . Cont. Type . . . . . . . . . . . . . . . . . Cont. Unit . . . . . . . . . . . . . . . . . g/L Which EQP . . . . . . . . . . . . . . . 1 Decimal places . . . . . . . . . . . . 3 Result limits . . . . . . . . . . . . . No Statistics . . . . . . . . . . . . . . YesCalculation 2 Calculation . . . . . . . . . . . . . . NoneCalculation 3 Calculation . . . . . . . . . . . . . . NoneReport Output . . . . . . . . . . . . . . . . Printer Results . . . . . . . . . . . . . . . . GLP Meas. val. table . . . . . . . . . . . Yes E - V curve . . . . . . . . . . . . . . Yes dE/dV curve . . . . . . . . . . . . . . Yes
MethodOther Control parameters
Set of parameters . . . . . . . Fast Addition . . . . . . . . . . . . Dynamic dE(set) [mV] . . . . . . . . . . 16 dVmin [mL] . . . . . . . . . . . 0.02 dVmax [mL] . . . . . . . . . . . 0.7 Measure mode . . . . . . . . . . EQU controlled dE[mV] . . . . . . . . . . . . . 1 dt[s] . . . . . . . . . . . . . 1 t(min) [s] . . . . . . . . . . . 2 t(max) [s] . . . . . . . . . . . 20
Set of parameters . . . . . . . Cautious Addition . . . . . . . . . . . . Dynamic dE(set) [mV] . . . . . . . . . . 10 dVmin [mL] . . . . . . . . . . . 0.010 dVmax [mL] . . . . . . . . . . . 0.3 Measure mode . . . . . . . . . . EQU controlled dE[mV] . . . . . . . . . . . . . 0.3 dt[s] . . . . . . . . . . . . . 2 t(min) [s] . . . . . . . . . . . 5 t(max) [s] . . . . . . . . . . . 30
18
M333
Acetic acid, CH3COOH,M = 60.05 g/mol, z = 1
50 mL deionized water
Sodium hydroxide, NaOHc(NaOH) = 0.1 mol/L
DL22 F&B, DL28OKI B4250 Printer(parallel cable ME-51108780)
CH3COOH + NaOH =CH3COONa + H2O
Titration beaker ME-101974
METTLER TOLEDO
Neutralization before final disposal.Wastedisposal
Preparation and ProceduresVinegar, ca. 1 g.Sample
Substance
Chemicals
Titrant
Instruments
Results
Chemistry
Accessories
DG115-SCIndication
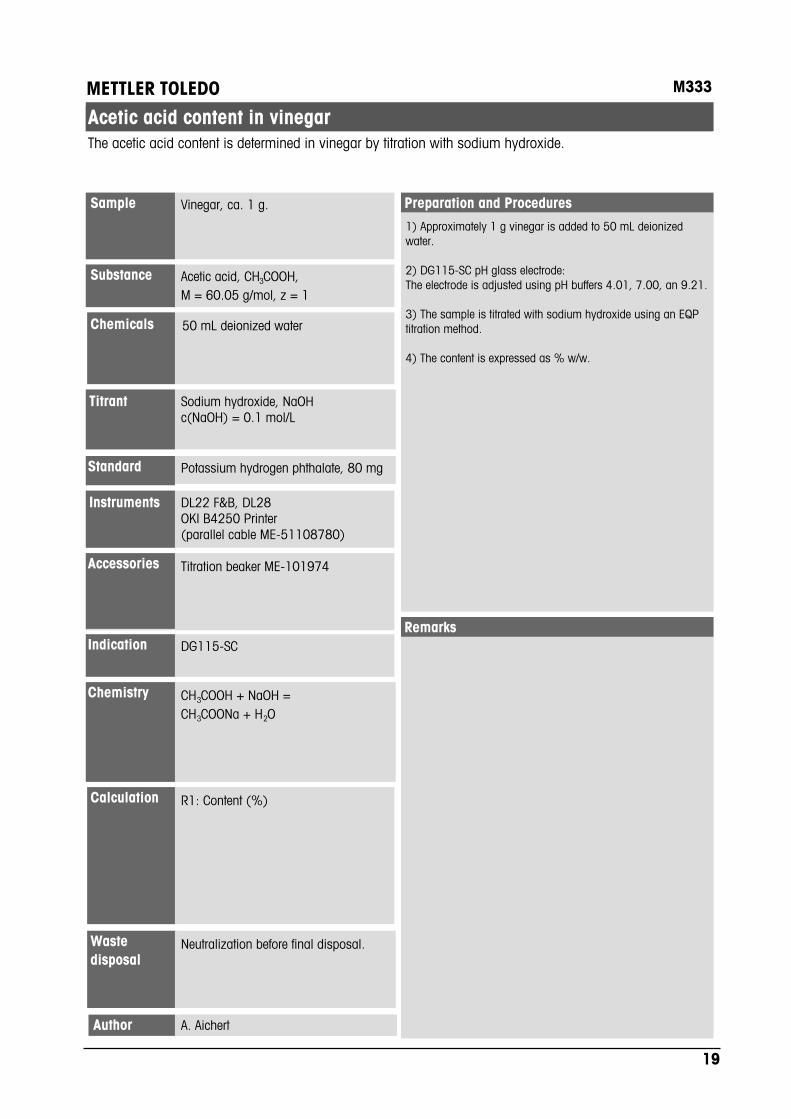
Acetic acid content in vinegar
1) Approximately 1 g vinegar is added to 50 mL deionizedwater.
2) DG115-SC pH glass electrode:The electrode is adjusted using pH buffers 4.01, 7.00, an 9.21.
3) The sample is titrated with sodium hydroxide using an EQPtitration method.
4) The content is expressed as % w/w.
Remarks
R1: Content (%)Calculation
The acetic acid content is determined in vinegar by titration with sodium hydroxide.
Standard Potassium hydrogen phthalate, 80 mg
A. AichertAuthor
19

Table of measured values
-------------------------------------------------------------------Method ID 933 Title Acetic acid24-04-2005 17:53 Author A. Aichert-------------------------------------------------------------------
All resultsSample Sample ID Result Calculat. Value Unit-------------------------------------------------------------------1 Vinegar 1 Cont. 4.944 [%]
2 Vinegar 1 Cont. 4.929 [%]
3 Vinegar 1 Cont. 4.955 [%]
Statistics reportResult n x s Unit srel [%]-------------------------------------------------------------------1 3 4.942 0.013 [%] 0.265
ResultsActive sample Deleted samples-------------------------------------------------------------------123
Titration curve
Results
20

Method ID 933 Title Acetic acid24-04-2005 17:53 Author A. Aichert
Sample para. Sample ID . . . . . . . . . . . . . . Vinegar Entry type . . . . . . . . . . . . . Mass Minimum [g] . . . . . . . . . . . . . 1.0 Maximum [g] . . . . . . . . . . . . . 10 Density [g/mL] . . . . . . . . . . . 1.0 Mol.m. [g/mol] . . . . . . . . . . . 60.05 Equival. number z . . . . . . . . . . 1 Temp.sensor . . . . . . . . . . . . . Manual Temp. [°C] . . . . . . . . . . . . . 25.0Stir Speed [%] . . . . . . . . . . . . . . 35 Mixing time [s] . . . . . . . . . . . 10EQP titration Titrant . . . . . . . . . . . . . . . NaOH 0.1 Conc.[mol/L] . . . . . . . . . . . 0.1 Sensor . . . . . . . . . . . . . . . DG115 Unit . . . . . . . . . . . . . . . pH Blank . . . . . . . . . . . . . . . . Entry Value [mmol] . . . . . . . . . . . 0.00 Predis.[mL] . . . . . . . . . . . . . 1.000 Back value [mmol] . . . . . . . . . . 0.00 Control parameters Set of parameters . . . . . . . . Normal Addition . . . . . . . . . . . . . Dynamic dE(set) [mV] . . . . . . . . . . . 14.0 dVmin [mL] . . . . . . . . . . . . 0.002 dVmax [mL] . . . . . . . . . . . . 0.5 Measure mode . . . . . . . . . . . EQU controlled dE[mV] . . . . . . . . . . . . . . 0.5 dt[s] . . . . . . . . . . . . . . 1 t(min) [s] . . . . . . . . . . . . 3 t(max) [s] . . . . . . . . . . . . 30 Recognition Tendency . . . . . . . . . . . . . Positive Min Relevance . . . . . . . . . . 30.0 Threshold [pH/mL]. . . . . . . . . 5.0 St. jump only . . . . . . . . . . No Termination param. Numb. EQPs . . . . . . . . . . . . 1 Vmax [mL] . . . . . . . . . . . . 20.0 Evaluation Numb. Potentials . . . . . . . . . 0Calculation 1 Calculation . . . . . . . . . . . . . Cont. Type . . . . . . . . . . . . . . . . Cont. Unit . . . . . . . . . . . . . . . . % Which EQP . . . . . . . . . . . . . . 1 Decimal places . . . . . . . . . . . 3 Result limits . . . . . . . . . . . . No Statistics . . . . . . . . . . . . . YesCalculation 2 Calculation . . . . . . . . . . . . . NoneCalculation 3 Calculation . . . . . . . . . . . . . NoneReport Output . . . . . . . . . . . . . . . Printer Results . . . . . . . . . . . . . . . GLP Meas. val. table . . . . . . . . . . Yes E - V curve . . . . . . . . . . . . . Yes dE/dV curve . . . . . . . . . . . . . Yes
MethodOther Control parameters
Set of parameters . . . . . . . Fast Addition . . . . . . . . . . . . Dynamic dE(set) [mV] . . . . . . . . . . 18 dVmin [mL] . . . . . . . . . . . 0.002 dVmax [mL] . . . . . . . . . . . 0.75 Measure mode . . . . . . . . . . EQU controlled dE[mV] . . . . . . . . . . . . . 1.0 dt[s] . . . . . . . . . . . . . 1 t(min) [s] . . . . . . . . . . . 2 t(max) [s] . . . . . . . . . . . 20
Set of parameters . . . . . . . Cautious Addition . . . . . . . . . . . . Dynamic dE(set) [mV] . . . . . . . . . . 10 dVmin [mL] . . . . . . . . . . . 0.002 dVmax [mL] . . . . . . . . . . . 0.3 Measure mode . . . . . . . . . . EQU controlled dE[mV] . . . . . . . . . . . . . 0.5 dt[s] . . . . . . . . . . . . . 2 t(min) [s] . . . . . . . . . . . 3 t(max) [s] . . . . . . . . . . . 30
21

M334
Lactic acid, CH3-CHOH-COOH;M(C3H6O3)=90.0 g/mol; z=1
Sodium hydroxide, NaOHc(NaOH) = 0.1 mol/L;
DL22 F&B, DL28OKI B4250 Printer(parallel cable ME-51108780)
HC3H5O3 + NaOH = NaC3H5O3 + H2O
Titration beakers ME-101974
METTLER TOLEDO
Neutralize the slightly alkaline wastebefore disposal.
Wastedisposal
Preparation and Procedures50 mL Whole milkSample
Substance
Chemicals
Titrant
Instruments
Results
Chemistry
Accessories
DG115-SCIndication
Acid number determination in milk
Do not dilute the sample, otherwise less tri-calcium phosphatewill precipitate and the resulting acid number will be too low.
Before the analysis a three point calibration of the electrode wasperformed using METTLER TOLEDO buffers of pH 4.01, 7.00and 9.21.
The titratable acidity in milk is expressed as percent lactic acid.Bacteria growing in milk produce mainly lactic and acetic acids,however, bacterial count must increase millionfold before it isreflected in the acidity.
The acidity of fresh milk results from OH- uptake of phosphates,citrates, casein, whey proteins, and carbon dioxide, as well asfrom the fermentation by-products of lactic acid bacteria.
Titratable acidity is determined by titrating pH 8.30. Thisendpoint was chosen because it corresponds to the colorchange of the phenolphthalein indicator historically used. Thetitrant consumption in this determination, multiplied by 20,yields the acid number.
Rancid or sour milk will have an acid number which is too high.Udder health also influences acidity, with mastitis yielding lowacid numbers.
References:1) Schweizerisches Lebensmittelbuch, Band I, Chap. 1, Sect.2.32) Dairy Connection, Inc.: dairyconnection.com3) Dairy Research and Information Center, Department of FoodScience & Technology, University of California, Davis, seehttp://www.ucdavis.edu/academics/academic_depts.html
Remarks
The Swiss Food Handbook defines the acidnumber of milk as 20*a, where a = titrantconsumption (mL).
Calculation
Acid number is determined in milk by an endpoint titration to pH 8.3
Standard Potassium hydrogen phthalate
M. BiberAuthor
22

Table of measured values
-------------------------------------------------------------------Method ID 934 Title Acid number in milk09-03-2005 09:09 Author M. Biber-------------------------------------------------------------------
All resultsSample Sample ID Result Calculat. Value Unit-------------------------------------------------------------------1 whole milk 1 Cont. 151.859
2 whole milk 1 Cont. 150.093
3 whole milk 1 Cont. 150.402
4 whole milk 1 Cont. 150.281
5 whole milk 1 Cont. 150.344
Statistics reportResult n x s Unit srel [%]-------------------------------------------------------------------1 5 150.596 0.714 0.474
ResultsActive sample Deleted samples-------------------------------------------------------------------12345
Titration curve
Results
23

Method ID 934 Title Acid number milk09-03-2005 09:09 Author M. Biber
Sample para. Sample ID . . . . . . . . . . . . . . . milk Entry type . . . . . . . . . . . . . . Volume Volume [mL] . . . . . . . . . . . . . . 50.0 Density [g/mL] . . . . . . . . . . . . 1.0 Mol.m. [g/mol] . . . . . . . . . . . . 90.0 Equival. number z . . . . . . . . . . . 1 Temp.sensor . . . . . . . . . . . . . . Manual Temp. [°C] . . . . . . . . . . . . . . 25.0Stir Speed [%] . . . . . . . . . . . . . . . 35 Mixing time [s] . . . . . . . . . . . . 3EP titration Titrant . . . . . . . . . . . . . . . . NaOH 0.1 Conc.[mol/L] . . . . . . . . . . . . 0.1 Sensor . . . . . . . . . . . . . . . . DG115 Unit . . . . . . . . . . . . . . . . pH Blank . . . . . . . . . . . . . . . . . Entry Value [mmol] . . . . . . . . . . . . 0.00 Predis.[mL] . . . . . . . . . . . . . . 0.00 Back value [mmol] . . . . . . . . . . . 0.00 Control parameters Set of parameters . . . . . . . . . User Addition . . . . . . . . . . . . . . Dynamic dE(set) [mV] . . . . . . . . . . . . 8 dVmin [mL] . . . . . . . . . . . . . 0.020 dVmax [mL] . . . . . . . . . . . . . 0.2 Measure mode . . . . . . . . . . . . EQU ontrolled dE[mV] . . . . . . . . . . . . . . . 0.5 dt[s] . . . . . . . . . . . . . . . 1 t(min) [s] . . . . . . . . . . . . . 3 t(max) [s] . . . . . . . . . . . . . 30 Recognition Tendency . . . . . . . . . . . . . . Positive Termination param. Vmax [mL] . . . . . . . . . . . . . 10.0 Evaluation Numb. EPs . . . . . . . . . . . . . 1 End point 1 . . . . . . . . . . . . Absolute Potential 1 [pH] . . . . . . . . . . 8.30Calculation 1 Calculation . . . . . . . . . . . . . . Acid number Formula . . . . . . . . . . . . . . . . R=VEQ C . . . . . . . . . . . . . . . . . . . 1.0 Factor . . . . . . . . . . . . . . . . 20.0 Name . . . . . . . . . . . . . . . . . Acid number Unit . . . . . . . . . . . . . . . . . none Which EQP . . . . . . . . . . . . . . . 1 Decimal places . . . . . . . . . . . . 3 Result limits . . . . . . . . . . . . . No Statistics . . . . . . . . . . . . . . YesCalculation 2 Calculation . . . . . . . . . . . . . . NoneCalculation 3 Calculation . . . . . . . . . . . . . . NoneReport Output . . . . . . . . . . . . . . . . Printer Results . . . . . . . . . . . . . . . . GLP Meas. val. table . . . . . . . . . . . Yes E - V curve . . . . . . . . . . . . . . Yes dE/dV curve . . . . . . . . . . . . . . Yes
MethodOther Control parameters
Set of parameters . . . . . . . Fast Addition . . . . . . . . . . . . Dynamic dE(set) [mV] . . . . . . . . . . 16 dVmin [mL] . . . . . . . . . . . 0.05 dVmax [mL] . . . . . . . . . . . 0.4 Measure mode . . . . . . . . . . EQU controlled dE[mV] . . . . . . . . . . . . . 1.0 dt[s] . . . . . . . . . . . . . 1 t(min) [s] . . . . . . . . . . . 2 t(max) [s] . . . . . . . . . . . 20
Set of parameters . . . . . . . Cautious Addition . . . . . . . . . . . . Dynamic dE(set) [mV] . . . . . . . . . . 8 dVmin [mL] . . . . . . . . . . . 0.02 dVmax [mL] . . . . . . . . . . . 0.2 Measure mode . . . . . . . . . . EQU controlled dE[mV] . . . . . . . . . . . . . 0.5 dt[s] . . . . . . . . . . . . . 2 t(min) [s] . . . . . . . . . . . 7 t(max) [s] . . . . . . . . . . . 40
24
M335
Sodium chloride, NaCl,M = 58.44 g/mol, z = 1
50 mL H2SO4 (0.02 mol/L)
Silver nitrate c(AgNO3) = 0.1 mol/L;
DL22 F&B, DL28OKI B4250 Printer(parallel cable ME-51108780)
NaCl + AgNO3 = AgCl + NaNO3
Titration beaker ME-101974,
METTLER TOLEDO
Filtration. The precipitate (AgCl) has tobe classified as special waste.The liquid has to be neutralized to pH 7before final disposal.
Wastedisposal
Preparation and ProceduresKetchup, 0.5 - 2 gSample
Substance
Chemicals
Titrant
Instruments
Results
Chemistry
Accessories
DM141-SCIndication
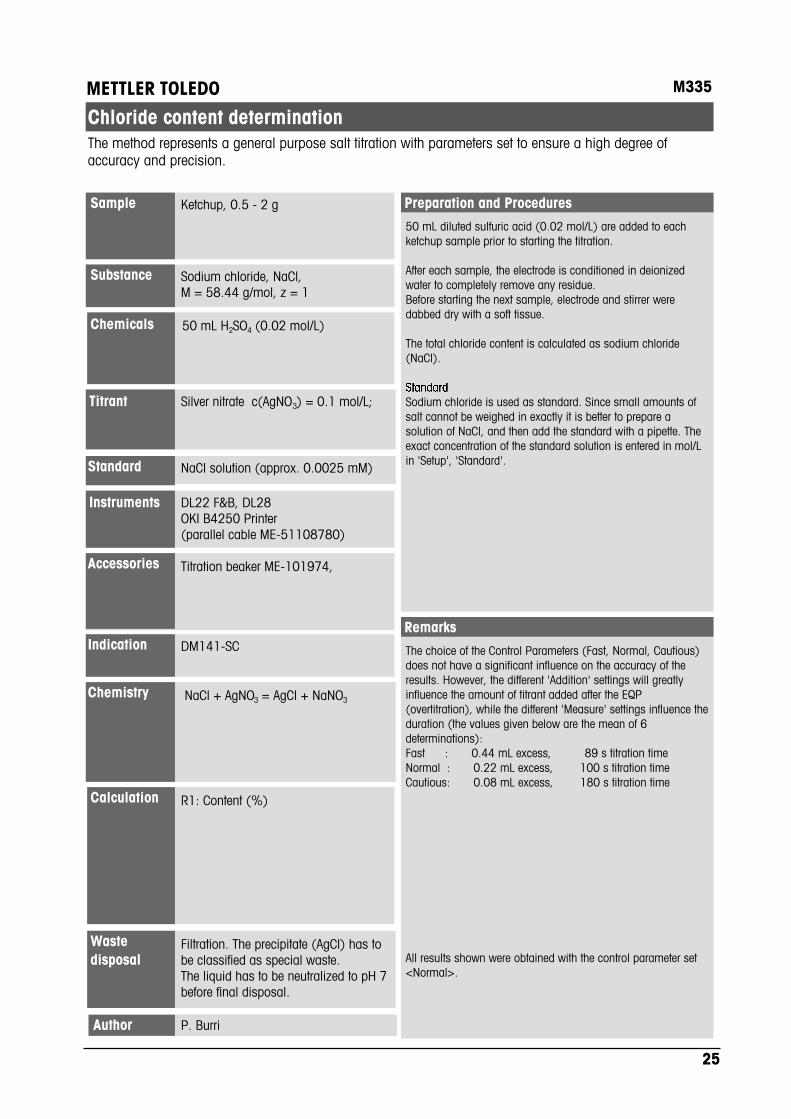
Chloride content determination
50 mL diluted sulfuric acid (0.02 mol/L) are added to eachketchup sample prior to starting the titration.
After each sample, the electrode is conditioned in deionizedwater to completely remove any residue.Before starting the next sample, electrode and stirrer weredabbed dry with a soft tissue.
The total chloride content is calculated as sodium chloride(NaCl).
Sodium chloride is used as standard. Since small amounts ofsalt cannot be weighed in exactly it is better to prepare asolution of NaCl, and then add the standard with a pipette. Theexact concentration of the standard solution is entered in mol/Lin 'Setup', 'Standard'.
The choice of the Control Parameters (Fast, Normal, Cautious)does not have a significant influence on the accuracy of theresults. However, the different 'Addition' settings will greatlyinfluence the amount of titrant added after the EQP(overtitration), while the different 'Measure' settings influence theduration (the values given below are the mean of 6determinations):Fast : 0.44 mL excess, 89 s titration timeNormal : 0.22 mL excess, 100 s titration timeCautious: 0.08 mL excess, 180 s titration time
All results shown were obtained with the control parameter set<Normal>.
Remarks
R1: Content (%)Calculation
The method represents a general purpose salt titration with parameters set to ensure a high degree ofaccuracy and precision.
Standard NaCl solution (approx. 0.0025 mM)
P. BurriAuthor
25

Table of measured values
-------------------------------------------------------------------Method ID 935 Title Chloride content05-04-2005 10:39 Author P. Burri-------------------------------------------------------------------
All resultsSample Sample ID Result Calculat. Value Unit-------------------------------------------------------------------1 Ketchup 1 Cont. 3.155 [%]
2 Ketchup 1 Cont. 3.154 [%]
3 Ketchup 1 Cont. 3.149 [%]
4 Ketchup 1 Cont. 3.148 [%]
5 Ketchup 1 Cont. 3.151 [%]
6 Ketchup 1 Cont. 3.152 [%]
Statistics reportResult n x s Unit srel [%]-------------------------------------------------------------------1 6 3.152 0.003 [mg/L] 0.087
ResultsActive sample Deleted samples-------------------------------------------------------------------123456
Titration curve
Results
26

Method ID 935 Title Chloride content05-04-2005 10:39 Author P. Burri
Sample para. Sample ID . . . . . . . . . . . . . . Ketchup Entry type . . . . . . . . . . . . . Mass Minimum [g] . . . . . . . . . . . . . 0.5 Maximum [g] . . . . . . . . . . . . . 2 Density [g/mL] . . . . . . . . . . . 1.0 Mol.m. [g/mol] . . . . . . . . . . . 58.44 Equival. number z . . . . . . . . . . 1 Temp.sensor . . . . . . . . . . . . . Manual Temp. [°C] . . . . . . . . . . . . . 25.0Stir Speed [%] . . . . . . . . . . . . . . 35 Mixing time [s] . . . . . . . . . . . 3EQP titration Titrant . . . . . . . . . . . . . . . AgNO3 0.1 Conc.[mol/L] . . . . . . . . . . . 0.1 Sensor . . . . . . . . . . . . . . . DM141 Unit . . . . . . . . . . . . . . . mV Blank . . . . . . . . . . . . . . . . Entry Value [mmol] . . . . . . . . . . . 0.00 Predis.[mL] . . . . . . . . . . . . . 1.000 Back value [mmol] . . . . . . . . . . 0.00 Control parameters Set of parameters . . . . . . . . Normal Addition . . . . . . . . . . . . . Dynamic dE(set) [mV] . . . . . . . . . . . 9 dVmin [mL] . . . . . . . . . . . . 0.008 dVmax [mL] . . . . . . . . . . . . 0.4 Measure mode . . . . . . . . . . . EQU controlled dE[mV] . . . . . . . . . . . . . . 0.5 dt[s] . . . . . . . . . . . . . . 1 t(min) [s] . . . . . . . . . . . . 3 t(max) [s] . . . . . . . . . . . . 30 Recognition Tendency . . . . . . . . . . . . . Positive Min Relevance . . . . . . . . . . 30 Threshold [mV/mL]. . . . . . . . . 250 St. jump only . . . . . . . . . . No Termination param. Numb. EQPs . . . . . . . . . . . . 1 Vmax [mL] . . . . . . . . . . . . 20.0 Evaluation Numb. Potentials . . . . . . . . . 0Calculation 1 Calculation . . . . . . . . . . . . . Cont. Type . . . . . . . . . . . . . . . . Cont. Unit . . . . . . . . . . . . . . . . % Which EQP . . . . . . . . . . . . . . 1 Decimal places . . . . . . . . . . . 3 Result limits . . . . . . . . . . . . No Statistics . . . . . . . . . . . . . YesCalculation 2 Calculation . . . . . . . . . . . . . NoneCalculation 3 Calculation . . . . . . . . . . . . . NoneReport Output . . . . . . . . . . . . . . . Printer Results . . . . . . . . . . . . . . . GLP Meas. val. table . . . . . . . . . . Yes E - V curve . . . . . . . . . . . . . Yes dE/dV curve . . . . . . . . . . . . . Yes
MethodOther Control parameters
Set of parameters . . . . . . . Fast Addition . . . . . . . . . . . . Dynamic dE(set) [mV] . . . . . . . . . . 12 dVmin [mL] . . . . . . . . . . . 0.01 dVmax [mL] . . . . . . . . . . . 0.5 Measure mode . . . . . . . . . . EQU controlled dE[mV] . . . . . . . . . . . . . 1 dt[s] . . . . . . . . . . . . . 1 t(min) [s] . . . . . . . . . . . 3 t(max) [s] . . . . . . . . . . . 20
Set of parameters . . . . . . . Cautious Addition . . . . . . . . . . . . Dynamic dE(set) [mV] . . . . . . . . . . 6 dVmin [mL] . . . . . . . . . . . 0.006 dVmax [mL] . . . . . . . . . . . 0.3 Measure mode . . . . . . . . . . EQU controlled dE[mV] . . . . . . . . . . . . . 0.5 dt[s] . . . . . . . . . . . . . 2 t(min) [s] . . . . . . . . . . . 3 t(max) [s] . . . . . . . . . . . 30
27

M336
Sulphur dioxide (SO2)M = 64.06 g/mol; z = 2
5 mL KI (10%)5 mL H2SO4 (25%)
Iodine, c(1/2 I2) = 0.02 mol/L
DL22 F&B, DL28OKI B4250 Printer(parallel cable ME-51108780)
SO2 + I2 + 2 H2O = H2SO4 + 2 HI
Titration beakers ME-101974
METTLER TOLEDO
Neutralization before final disposal.Wastedisposal
Preparation and ProceduresVarious wines, 50mLSample
Substance
Chemicals
Titrant
Instruments
Results
Chemistry
Accessories
DM143-SCIndication
Free sulphur dioxide in wines
1) In order to avoid loss of SO2, the samples must be takenfrom a freshly opened bottle. After opening the bottle, free SO2
can evaporate with CO2 or be oxidized while in contact with airresulting in too low results.
2) It is known that iodine is also reduced by other componentsin the wine. These competing reactions can partly be delayed bythe addition of 5 mL KI (10%)
3) The potassium iodide solution is prepared by dissolving 10gpotassium iodide in 100 mL deioized water and has to be keptin the dark.
4) The reaction only takes place in acidic medium. Therefore 5mL H2SO4 (25%) must be added immediately before titration.
Sulphur dioxide is added to wine as an antioxidant, anti-fermantation agent and to prevent microbiological degradation. Atoo high content causes an unpleasant odor in wine and has anadverse toxic effect on the person drinking it.
The upper limit is regulated by law, while the antioxidant andantiseptic activity resulting in a fresh taste is only achievedabove a certain value.
The free sulphur dioxide content in wine is determined by aniodometric titration. Iodine oxidizes SO2 according to the Bunsenequation.
Remarks
R1: Consumption (mL)R2: Content (mg/L)
Calculation
Iodometric method for determination of free sulphur dioxide in wines.
Standard Ascorbic acid (C6H8O6)
Lukas CandreiaAuthor
28
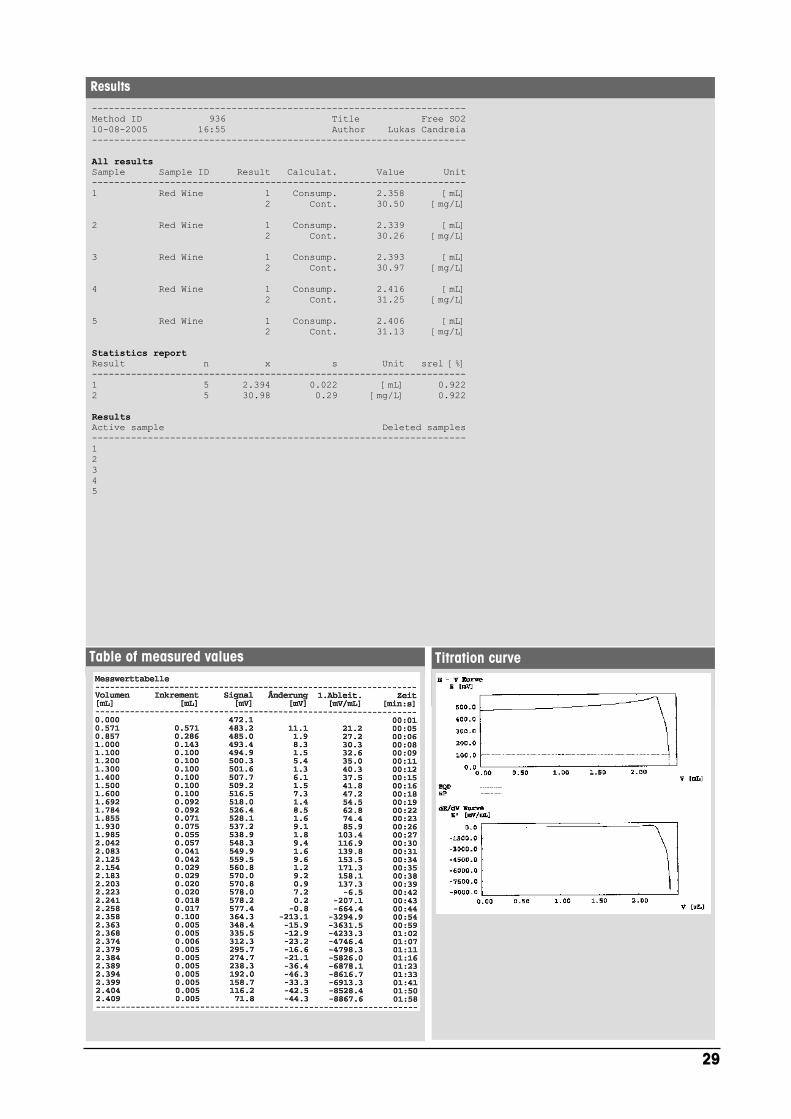
Table of measured values
-------------------------------------------------------------------Method ID 936 Title Free SO210-08-2005 16:55 Author Lukas Candreia-------------------------------------------------------------------
All resultsSample Sample ID Result Calculat. Value Unit-------------------------------------------------------------------1 Red Wine 1 Consump. 2.358 [mL] 2 Cont. 30.50 [mg/L]
2 Red Wine 1 Consump. 2.339 [mL] 2 Cont. 30.26 [mg/L]
3 Red Wine 1 Consump. 2.393 [mL] 2 Cont. 30.97 [mg/L]
4 Red Wine 1 Consump. 2.416 [mL] 2 Cont. 31.25 [mg/L]
5 Red Wine 1 Consump. 2.406 [mL] 2 Cont. 31.13 [mg/L]
Statistics reportResult n x s Unit srel [%]-------------------------------------------------------------------1 5 2.394 0.022 [mL] 0.9222 5 30.98 0.29 [mg/L] 0.922
ResultsActive sample Deleted samples-------------------------------------------------------------------12345
Titration curve
Results
29

Method ID 936 Title Free SO210-08-2005 16:55 Author Lukas Candreia
Sample parameters Sample ID . . . . . . . . . . . . . . . Red Wine Entry type . . . . . . . . . . . . . . Volume Volume [mL] . . . . . . . . . . . . . . 50 Density [g/mL] . . . . . . . . . . . . 1.0 Mol.m. [g/mol] . . . . . . . . . . . . 64.062 Equival. number z . . . . . . . . . . . 2 Temp.sensor . . . . . . . . . . . . . . Manual Temp. [°C] . . . . . . . . . . . . . . 25.0Stir Speed [%] . . . . . . . . . . . . . . . 30 Mixing time [s] . . . . . . . . . . . . 30EP titration Titrant . . . . . . . . . . . . . . . . 1/2 I2 0.02 Conc.[mol/L] . . . . . . . . . . . . 0.02 Sensor . . . . . . . . . . . . . . . . DM143 Unit . . . . . . . . . . . . . . . . mV
Pol. Curr. [ A]. . . . . . . . . . . 1.0 Blank . . . . . . . . . . . . . . . . . Entry Value [mmol] . . . . . . . . . . . . 0.0 Predis.[mL] . . . . . . . . . . . . . . 0.5 Back v. [mmol]. . . . . . . . . . . . . 0.0 Control parameters Set of parameters . . . . . . . . . Normal Addition . . . . . . . . . . . . . . Dynamic dE(set) [mV] . . . . . . . . . . . . 12 dVmin [mL] . . . . . . . . . . . . . 0.005 dVmax [mL] . . . . . . . . . . . . . 0.1 Measure. . . . . . . . . . . . . . . EQU controlled dE[mV] . . . . . . . . . . . . . . . 2.0 dt[s] . . . . . . . . . . . . . . . 1 t(min) [s] . . . . . . . . . . . . . 1 t(max) [s] . . . . . . . . . . . . . 10 Recognition Tendency . . . . . . . . . . . . . . Negative Termination param. Vmax [mL] . . . . . . . . . . . . . 20.0 Evaluation Numb. EPs . . . . . . . . . . . . . 1 End point 1 . . . . . . . . . . . . Absolute Potential 1 [mV] . . . . . . . . . . 100.0Calculation 1 Calculation . . . . . . . . . . . . . . Consump. Type . . . . . . . . . . . . . . . . . Consump. Unit . . . . . . . . . . . . . . . . . mL Which EP . . . . . . . . . . . . . . . 1 Decimal places . . . . . . . . . . . . 3 Result limits . . . . . . . . . . . . . No Statistics . . . . . . . . . . . . . . YesCalculation 2 Calculation . . . . . . . . . . . . . . Cont. Type . . . . . . . . . . . . . . . . . Cont. Unit . . . . . . . . . . . . . . . . . mg/L Which EP . . . . . . . . . . . . . . . 1 Decimal places . . . . . . . . . . . . 2 Result limits . . . . . . . . . . . . . No Statistics . . . . . . . . . . . . . . YesCalculation 3 Calculation . . . . . . . . . . . . . . NoneReport Output . . . . . . . . . . . . . . . . Printer Results . . . . . . . . . . . . . . . . GLP Meas. val. table . . . . . . . . . . . Yes E - V curve . . . . . . . . . . . . . . Yes dE/dV curve . . . . . . . . . . . . . . Yes
MethodOther Control parameters
Set of parameters . . . . . . . . Fast Addition . . . . . . . . . . . . . Dynamic dE(set) [mV] . . . . . . . . . . . 12 dVmin [mL] . . . . . . . . . . . . 0.005 dVmax [mL] . . . . . . . . . . . . 0.1 Measure . . . . . . . . . . . . . Fixed time Time incr. [s] . . . . . . . . . . 1
Set of parameters . . . . . . . . Cautious Addition . . . . . . . . . . . . . Dynamic dE(set) [mV] . . . . . . . . . . . 8 dVmin [mL] . . . . . . . . . . . . 0.005 dVmax [mL] . . . . . . . . . . . . 0.05 Measure . . . . . . . . . . . . . EQU controlled dE[mV] . . . . . . . . . . . . . . 1.0 dt[s] . . . . . . . . . . . . . . 2 t(min) [s] . . . . . . . . . . . . 2 t(max) [s] . . . . . . . . . . . . 10
30

M337
L(+)-Ascorbic acid,M = 176.13g/mol, z = 2
50 mL deionized waterOxalic acid 2%NaOH 0.1 mol/L
2,6-Dichlorophenolindophenol (DPI), c(1/2 DPI) = 0.01mol/L
DL22 F&B, DL28OKI B4250 Printer(parallel cable ME-51108780)
C6H8O6 + DPI = C6H6O6 + H2-DPIAscorbic acid is oxidized by DPI:C6H8O6 = C6H6O6 + 2H+ + 2 e-
Red titration beakers ME-25777
METTLER TOLEDO
No special treatment is necessaryWastedisposal
Preparation and ProceduresFruit juice, ca. 0.5 - 10gSample
Substance
Chemicals
Titrant
Instruments
Results
Chemistry
Accessories
DM143Indication
Vitamin C: Voltametric determination
Ascorbic acid is sensitive to light, temperature and oxygen. Thesample should therefore not be exposed to these influences.Titration beakers with light protection as well as use of purgegas are recommended.
0.36 g (1.25 mmol) 2,6-Dichlorophenolindophenol (DPI)sodium salt monohydrate (M = 290.08 g/mol) is weighed in a250 mL volumetric flask, which is filled up with deionised waterto obtain a titrant concentration of 0.01 mol/L 1/2 DPI.If 2,6-Dichlorophenolindophenol sodium salt dihydrate is used,an excess has to be weighed in due to its bad solubility and thetitrant has to be filtrated prior to use.The DPI titrant has to be prepared fresh daily. It has to be storedin brown glass bottles to protect it from light.
The sample size depends on the amount of vitamin C present inthe sample. 1-15 mg vitamin C lead to a consumption of 0.5 -8.5 mL DPI. The juice samples were weighed directly into thetitration beaker, without special treatment such as filtration. Evena relatively high pulp content does not disturb the titration. Afteraddition of 50mL deionised water the sample can be purgedwith nitrogen to avoit oxidation of Vitamin C.
This method describes the oxidimetric titration of ascorbic acidwith 2,6-Dichlorophenolindophenol (DPI) as titrant. Theendpoint is indicated voltametrically: A constant polarisationcurrent of 1.0 μA is applied to a double pin platinum electrode(DM143). Potential readings allow the indication of theequivalence point thanks to a potential jump at the EQP.
Prior to analysis the pH of the sample solution has to beadjusted to 3.0 by either oxalic acid (2%) for samples with ahigher initial pH-value or with NaOH 0.1 mol/L for samples withan initial pH lower than 3.0 using an EP titration (Mettler method919).
A fresh 0.01 mol/L standard solution of ascorbic acid is used fortiter determination and kept in the dark.
1) Titration Applications Brochure 19,"Determinations in Beverages", ME-51725013.
Remarks
R1: Content (mg/100g)R2: Content (mmol/L)R3: Consumption (mL)
Calculation
The Vitamin C (ascorbic acid) content is determined by titration with 2,6-Dichlorophenolindophenol (DPI)and voltametric detection.
Standard L(+)-Ascorbic acid solution 0.01 mol/L
Lukas CandreiaAuthor
31

Table of measured values
-------------------------------------------------------------------Method ID 937 Title Vitamin C07-04-2005 09:22 Author Lukas Candreia-------------------------------------------------------------------
All resultsSample Sample ID Result Calculat. Value Unit-------------------------------------------------------------------1 Orange juice 1 Vitamin C 49.860 [mg/100g] 2 Cont. 2.831 [mmol/L] 3 Consump. 3.616 [mL]
2 Orange juice 1 Vitamin C 49.869 [mg/100g] 2 Cont. 2.831 [mmol/L] 3 Consump. 3.626 [mL]
3 Orange juice 1 Vitamin C 49.989 [mg/100g] 2 Cont. 2.838 [mmol/L] 3 Consump. 3.619 [mL]
Statistics reportResult n x s Unit srel [%]-------------------------------------------------------------------1 3 49.906 0.072 [mg/100g] 0.1442 3 2.833 0.004 [mmol/L] 0.1443 3 3.620 0.005 [mL] 0.137
ResultsActive sample Deleted samples-------------------------------------------------------------------123
Titration curve
Results
32

Method ID 937 Title Vitamin C07-04-2005 09:22 Author Lukas Candreia
Sample parameters Sample ID . . . . . . . . . . . . . . . Fruit juice Entry type . . . . . . . . . . . . . . Mass Minimum [g] . . . . . . . . . . . . . . 0.1 Maximum [g] . . . . . . . . . . . . . . 10 Density [g/mL] . . . . . . . . . . . . 1.0 Mol.m. [g/mol] . . . . . . . . . . . . 176.13 Equival. number z . . . . . . . . . . . 2 Temp.sensor . . . . . . . . . . . . . . Manual Temp. [°C] . . . . . . . . . . . . . . 25.0Stir Speed [%] . . . . . . . . . . . . . . . 30 Mixing time [s] . . . . . . . . . . . . 3EQP titration Titrant . . . . . . . . . . . . . . . . 1/2 DPI 0.01 Conc.[mol/L] . . . . . . . . . . . . 0.01 Sensor . . . . . . . . . . . . . . . . DM143 Unit . . . . . . . . . . . . . . . . mV Pol. Curr. [µA]. . . . . . . . . . . 1.0 Blank . . . . . . . . . . . . . . . . . Entry Value [mmol] . . . . . . . . . . . . 0.0 Predis.[mL] . . . . . . . . . . . . . . 1.0 Back v. [mmol]. . . . . . . . . . . . . 0.0 Control parameters Set of parameters . . . . . . . . . Normal Addition . . . . . . . . . . . . . . Incremental Increment. . . . . . . . . . . . . . 0.05 Measure. . . . . . . . . . . . . . . EQU controlled dE[mV] . . . . . . . . . . . . . . . 2 dt[s] . . . . . . . . . . . . . . . 1 t(min) [s] . . . . . . . . . . . . . 2 t(max) [s] . . . . . . . . . . . . . 30 Recognition Tendency . . . . . . . . . . . . . . Negative Min Relevance. . . . . . . . . . . . 30 Threshold [mV/mL]. . . . . . . . . . 600.0 St. jump only. . . . . . . . . . . . No Termination param. Numb. EQPs . . . . . . . . . . . . . 1 Vmax [mL]. . . . . . . . . . . . . . 20.0 Evaluation Number Potentials. . . . . . . . . . 0Calculation 1 Calculation . . . . . . . . . . . . . . User def. Name. . . . . . . . . . . . . . . . . . Vitamin C Formula . . . . . . . . . . . . . . . . R=Q*C/m C . . . . . . . . . . . . . . . . . . . 1.0 Factor. . . . . . . . . . . . . . . . . 8806.5 Unit . . . . . . . . . . . . . . . . . mg/100g Which EQP . . . . . . . . . . . . . . . 1 Decimal places . . . . . . . . . . . . 3 Result limits . . . . . . . . . . . . . No Statistics . . . . . . . . . . . . . . YesCalculation 2 Calculation . . . . . . . . . . . . . . Cont. Type . . . . . . . . . . . . . . . . . Cont. Unit . . . . . . . . . . . . . . . . . mmol/L Which EQP . . . . . . . . . . . . . . . 1 Decimal places . . . . . . . . . . . . 3 Result limits . . . . . . . . . . . . . No Statistics . . . . . . . . . . . . . . YesCalculation 3 Calculation . . . . . . . . . . . . . . Consumpt. Unit . . . . . . . . . . . . . . . . . mL Which EQP . . . . . . . . . . . . . . . 1 Decimal places . . . . . . . . . . . . 3 Result limits . . . . . . . . . . . . . No Statistics . . . . . . . . . . . . . . YesReport Output . . . . . . . . . . . . . . . . Printer Results . . . . . . . . . . . . . . . . GLP Meas. val. table . . . . . . . . . . . Yes E - V curve . . . . . . . . . . . . . . Yes dE/dV curve . . . . . . . . . . . . . . Yes
MethodOther Control parameters
Set of parameters . . . . . . . Fast Addition . . . . . . . . . . . . Incremental Increment. . . . . . . . . . . . 0.1 Measure. . . . . . . . . . . . . EQU controlled dE[mV] . . . . . . . . . . . . . 2 dt[s] . . . . . . . . . . . . . 1 t(min) [s] . . . . . . . . . . . 2 t(max) [s] . . . . . . . . . . . 10
Set of parameters . . . . . . . Cautious Addition . . . . . . . . . . . . Incremental Increment. . . . . . . . . . . . 0.03 Measure. . . . . . . . . . . . . EQU controlled dE[mV] . . . . . . . . . . . . . 1 dt[s] . . . . . . . . . . . . . 1 t(min) [s] . . . . . . . . . . . 3 t(max) [s] . . . . . . . . . . . 30
33

M338
Nitrogen, N, M = 14.01 g/mol, z=1
50 mL deionized water2% boric acid solution (collectingsolution for distilled ammonia).
Sulphuric acid, 1/2 H2SO4
c(1/2 H2SO4) = 0.1 mol/L
DL22 F&B, DL28OKI B4250 Printer(parallel cable ME-51108780)
2 NH4[B(OH)4] + H2SO4 =(NH4)2SO4 + 2 H[B(OH)4]
Titration beakers ME-101974
METTLER TOLEDO
Neutralization before final disposal.Wastedisposal
Preparation and Procedures5 mL ammonium borate solution, NH4
(B(OH)4)approx. 0.1 mol/L
Sample
Substance
Chemicals
Titrant
Instruments
Results
Chemistry
Accessories
DG115-SCIndication
Nitrogen determination according to Kjeldahl
1) The ammonium borate solution was prepared by addingpowdered boric acid into ammonium hydroxide solution toreach a concentration of approx. 0.1 mol/L in a 1 L volumetricflask.
2) 50 mL deionized water are added to the sample.
3) DG115-SC pH glass electrode:The electrode is adjusted using pH buffers 4.01, 7.00, an 9.21.
4) The sample is titrated with sulphuric acid to pH 4.6 .
5) If necessary, a blank titration has to be performed.
Literature:
1) Titration Applications Brochure 13,"Nitrogen determination by Kjeldahl Digestion"ME-51724769 (see applications M120-M122).
2) Endpoint titration to pH 4.6: seeSchweizerisches Lebensmittelbuch, 5th Edition, Volume 2.
3) See also:http://pb.merck.de/servlet/PB/menu/1045480/index.html
Remarks
R1: Content (mg/L)R2: Content (mmol/L)R3: Consumption (mL)
Calculation
The nitrogen content is determined according to Kjeldahl: The sample is first digested in sulphuric acidgiving ammonium sulfate which is distilled after addition of sodium hydroxide. Ammonia is released andcollected in a 2% boric acid solution. This solution is titrated to pH 4.6 with sulphuric acid.
Standard THAM, approx. 50 mg
C. De CaroAuthor
34

Table of measured values
-------------------------------------------------------------------Method ID 938 Title Nitrogen Kjeldahl23-03-2005 15:48 Author C. De Caro-------------------------------------------------------------------
All resultsSample Sample ID Result Calculat. Value Unit-------------------------------------------------------------------1 Ammonium 1 Cont. 1342.146 [mg/L] 2 Cont. 95.799 [mmol/L] 3 Consump. 5.4537 [mL]
2 Ammonium 1 Cont. 1344.030 [mg/L] 2 Cont. 95.934 [mmol/L] 3 Consump. 5.4613 [mL]
3 Ammonium 1 Cont. 1343.484 [mg/L] 2 Cont. 95.895 [mmol/L] 3 Consump. 5.4591 [mL]
4 Ammonium 1 Cont. 1338.986 [mg/L] 2 Cont. 95.574 [mmol/L] 3 Consump. 5.4408 [mL]
5 Ammonium 1 Cont. 1342.230 [mg/L] 2 Cont. 95.805 [mmol/L] 3 Consump. 5.4540 [mL]
6 Ammonium 1 Cont. 1343.502 [mg/L] 2 Cont. 95.896 [mmol/L] 3 Consump. 5.4592 [mL]
Statistics reportResult n x s Unit srel [%]-------------------------------------------------------------------1 6 1342.396 1.844 [mg/L] 0.1372 6 95.817 0.128 [mmol/L] 0.1343 6 5.4547 0.0072 [mL] 0.132
ResultsActive sample Deleted samples-------------------------------------------------------------------123456
Titration curve
Results
35
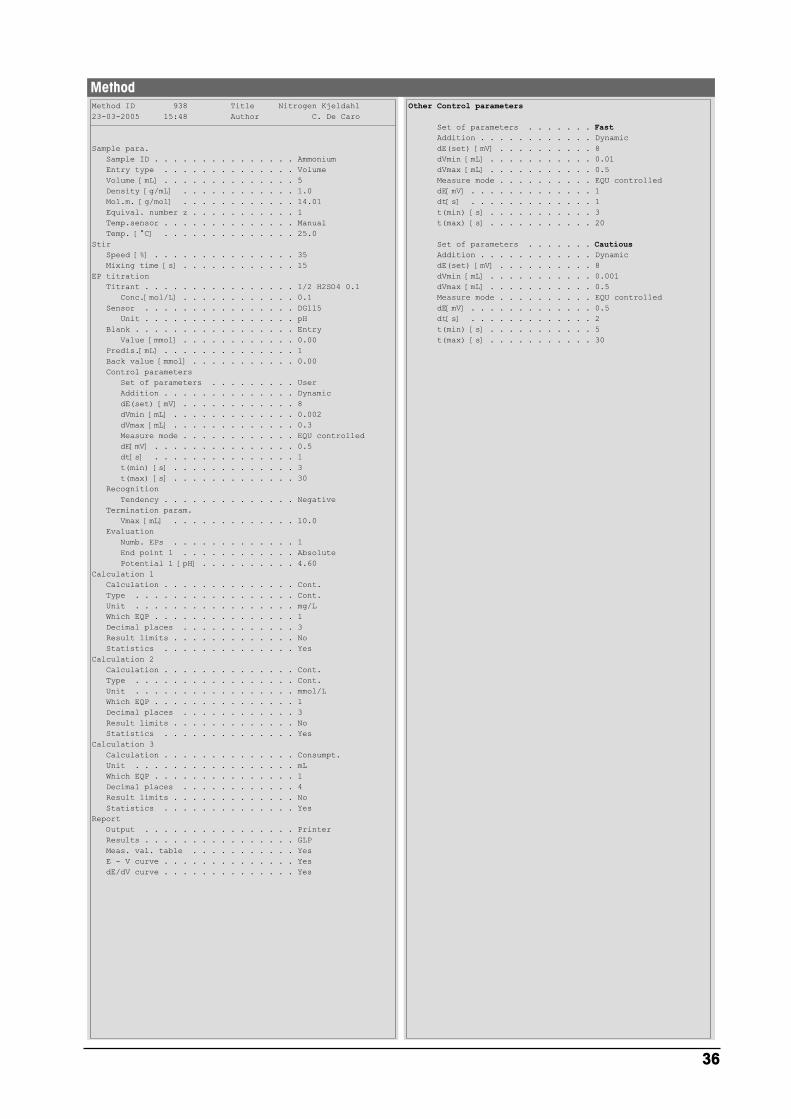
Method ID 938 Title Nitrogen Kjeldahl23-03-2005 15:48 Author C. De Caro
Sample para. Sample ID . . . . . . . . . . . . . . . Ammonium Entry type . . . . . . . . . . . . . . Volume Volume [mL] . . . . . . . . . . . . . . 5 Density [g/mL] . . . . . . . . . . . . 1.0 Mol.m. [g/mol] . . . . . . . . . . . . 14.01 Equival. number z . . . . . . . . . . . 1 Temp.sensor . . . . . . . . . . . . . . Manual Temp. [°C] . . . . . . . . . . . . . . 25.0Stir Speed [%] . . . . . . . . . . . . . . . 35 Mixing time [s] . . . . . . . . . . . . 15EP titration Titrant . . . . . . . . . . . . . . . . 1/2 H2SO4 0.1 Conc.[mol/L] . . . . . . . . . . . . 0.1 Sensor . . . . . . . . . . . . . . . . DG115 Unit . . . . . . . . . . . . . . . . pH Blank . . . . . . . . . . . . . . . . . Entry Value [mmol] . . . . . . . . . . . . 0.00 Predis.[mL] . . . . . . . . . . . . . . 1 Back value [mmol] . . . . . . . . . . . 0.00 Control parameters Set of parameters . . . . . . . . . User Addition . . . . . . . . . . . . . . Dynamic dE(set) [mV] . . . . . . . . . . . . 8 dVmin [mL] . . . . . . . . . . . . . 0.002 dVmax [mL] . . . . . . . . . . . . . 0.3 Measure mode . . . . . . . . . . . . EQU controlled dE[mV] . . . . . . . . . . . . . . . 0.5 dt[s] . . . . . . . . . . . . . . . 1 t(min) [s] . . . . . . . . . . . . . 3 t(max) [s] . . . . . . . . . . . . . 30 Recognition Tendency . . . . . . . . . . . . . . Negative Termination param. Vmax [mL] . . . . . . . . . . . . . 10.0 Evaluation Numb. EPs . . . . . . . . . . . . . 1 End point 1 . . . . . . . . . . . . Absolute Potential 1 [pH] . . . . . . . . . . 4.60Calculation 1 Calculation . . . . . . . . . . . . . . Cont. Type . . . . . . . . . . . . . . . . . Cont. Unit . . . . . . . . . . . . . . . . . mg/L Which EQP . . . . . . . . . . . . . . . 1 Decimal places . . . . . . . . . . . . 3 Result limits . . . . . . . . . . . . . No Statistics . . . . . . . . . . . . . . YesCalculation 2 Calculation . . . . . . . . . . . . . . Cont. Type . . . . . . . . . . . . . . . . . Cont. Unit . . . . . . . . . . . . . . . . . mmol/L Which EQP . . . . . . . . . . . . . . . 1 Decimal places . . . . . . . . . . . . 3 Result limits . . . . . . . . . . . . . No Statistics . . . . . . . . . . . . . . YesCalculation 3 Calculation . . . . . . . . . . . . . . Consumpt. Unit . . . . . . . . . . . . . . . . . mL Which EQP . . . . . . . . . . . . . . . 1 Decimal places . . . . . . . . . . . . 4 Result limits . . . . . . . . . . . . . No Statistics . . . . . . . . . . . . . . YesReport Output . . . . . . . . . . . . . . . . Printer Results . . . . . . . . . . . . . . . . GLP Meas. val. table . . . . . . . . . . . Yes E - V curve . . . . . . . . . . . . . . Yes dE/dV curve . . . . . . . . . . . . . . Yes
MethodOther Control parameters
Set of parameters . . . . . . . Fast Addition . . . . . . . . . . . . Dynamic dE(set) [mV] . . . . . . . . . . 8 dVmin [mL] . . . . . . . . . . . 0.01 dVmax [mL] . . . . . . . . . . . 0.5 Measure mode . . . . . . . . . . EQU controlled dE[mV] . . . . . . . . . . . . . 1 dt[s] . . . . . . . . . . . . . 1 t(min) [s] . . . . . . . . . . . 3 t(max) [s] . . . . . . . . . . . 20
Set of parameters . . . . . . . Cautious Addition . . . . . . . . . . . . Dynamic dE(set) [mV] . . . . . . . . . . 8 dVmin [mL] . . . . . . . . . . . 0.001 dVmax [mL] . . . . . . . . . . . 0.5 Measure mode . . . . . . . . . . EQU controlled dE[mV] . . . . . . . . . . . . . 0.5 dt[s] . . . . . . . . . . . . . 2 t(min) [s] . . . . . . . . . . . 5 t(max) [s] . . . . . . . . . . . 30
36

M339
Ca2+ M = 40.08 g/molMg2+ M = 24.31 g/mol
2 - 5 mL buffer solution pH 8.5:Acetylacetone (AcAc) 0.3 mol/L,tris(hydroxymethyl)-aminomethane(THAM) 0.2 mol/L
EDTA 0.1 mol/L
DL22 F&B, DL28OKI B4250 Printer(parallel cable ME-51108780)
Ca2+ + EDTA = Ca-EDTAMg-AcAc + EDTA = Mg-EDTA + AcAc
Titration beakers ME-101974
METTLER TOLEDO
No special treatment is necessaryWastedisposal
Preparation and ProceduresWaterSample
Substance
Chemicals
Titrant
Instruments
Results
Chemistry
Accessories
DX240 Ca-ISE, DX200 Ref. electrodeIndication
Determination of calcium and magnesium
Depending on the Ca and Mg concentration the sample has tobe diluted with deionised water. Before titration 2 - 5 mL buffersolution is added with a pipette.
24 g (0.20 mol) tris(hydroxymethyl)-aminomethane (TRIS) isdissolved in deionised water, 30 g (0.30 mol) Acetylacetone(AcAc) is added and the volume adjusted to 1000 mL in avolumetric flask. To improve the shape of the titration curve theAcAc mass can be adjusted.
1 - 8 mL Calcium carbonate standard solution 0.2 mol/L isused.
In alkaline buffered solutions Calcium and Magnesium ions canbe titrated sequentially with a solution of a complexing agent likeEDTA. To improve the difference between the two complexbuilding constants an auxiliary complexing agent likeAcetylacetone (AcAc) is added that only forms a relatively weakcomplex with Magnesium, but not with Calcium.
The concentration of the auxiliary complexing agent influencesthe shape of the curve strongly. A high concentration of AcAcamplifies the calcium jump while the magnesium jump isdiminished. A small AcAc concentration results in the oppositeeffect. The AcAc and buffer concentrations given in thisapplication might be the subject of changes to optmize the curveshape of other samples.
Remarks
R1: Ca Cont. (mg/L)R2: Mg Cont. (mg/L)
Calculation
Method for the determination of Calcium and Magnesium using a Calcium selective electrode
Standard Calcium carbonate
Lukas CandreiaAuthor
37
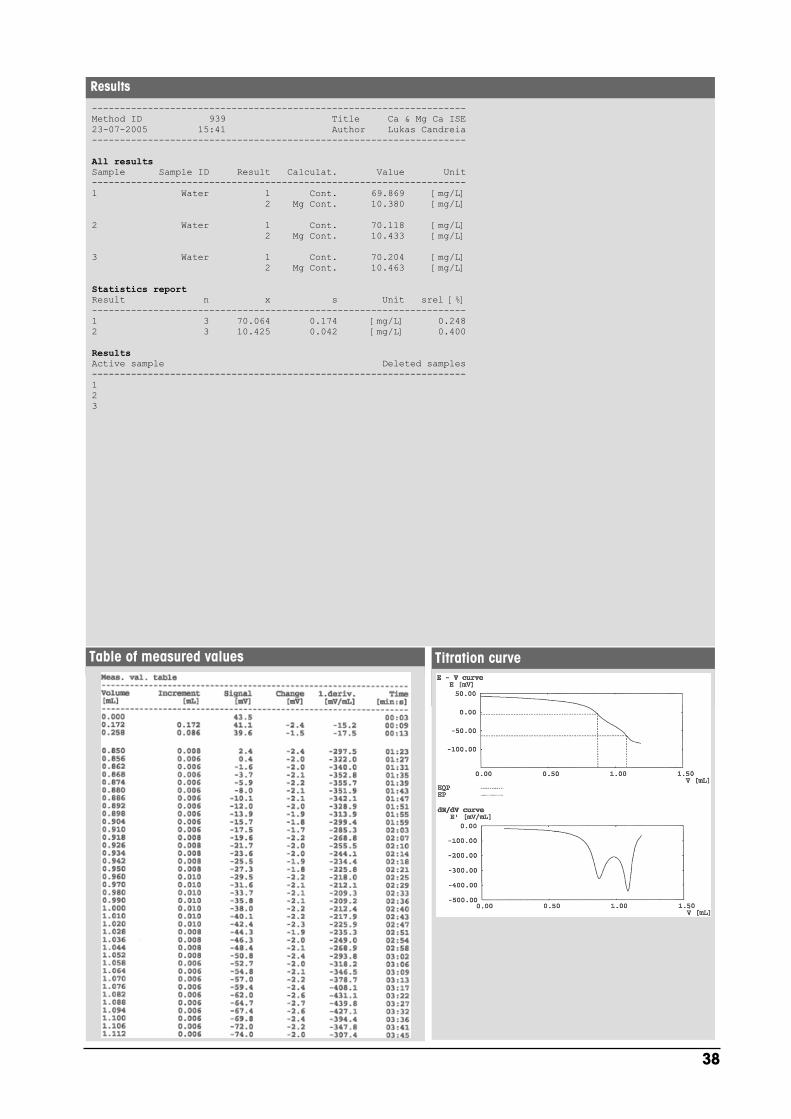
Table of measured values
-------------------------------------------------------------------Method ID 939 Title Ca & Mg Ca ISE23-07-2005 15:41 Author Lukas Candreia-------------------------------------------------------------------
All resultsSample Sample ID Result Calculat. Value Unit-------------------------------------------------------------------1 Water 1 Cont. 69.869 [mg/L] 2 Mg Cont. 10.380 [mg/L]
2 Water 1 Cont. 70.118 [mg/L] 2 Mg Cont. 10.433 [mg/L]
3 Water 1 Cont. 70.204 [mg/L] 2 Mg Cont. 10.463 [mg/L]
Statistics reportResult n x s Unit srel [%]-------------------------------------------------------------------1 3 70.064 0.174 [mg/L] 0.2482 3 10.425 0.042 [mg/L] 0.400
ResultsActive sample Deleted samples-------------------------------------------------------------------123
Titration curve
Results
38

Method ID 939 Title Ca & Mg Ca ISE23-07-2005 15:41 Author Lukas Candreia
Sample parameters Sample ID . . . . . . . . . . . . . . . Water Entry type . . . . . . . . . . . . . . Volume Minimum [mL] . . . . . . . . . . . . . 0.001 Maximum [mL] . . . . . . . . . . . . . 50 Density [g/mL] . . . . . . . . . . . . 1.0 Mol.m. [g/mol] . . . . . . . . . . . . 40.08 Equival. number z . . . . . . . . . . . 1 Temp.sensor . . . . . . . . . . . . . . Manual Temp. [°C] . . . . . . . . . . . . . . 25.0Stir Speed [%] . . . . . . . . . . . . . . . 35 Mixing time [s] . . . . . . . . . . . . 3EQP titration Titrant . . . . . . . . . . . . . . . . EDTA 0.1 Conc.[mol/L] . . . . . . . . . . . . 0.1 Sensor . . . . . . . . . . . . . . . . DX240 Unit . . . . . . . . . . . . . . . . mV Blank . . . . . . . . . . . . . . . . . Entry Value [mmol] . . . . . . . . . . . . 0.0 Predis.[mL] . . . . . . . . . . . . . . 1.0 Back v. [mmol]. . . . . . . . . . . . . 0.0 Control parameters Set of parameters . . . . . . . . . Normal Addition . . . . . . . . . . . . . . Dynamic dE(set) [mV] . . . . . . . . . . . . 2 dVmin [mL] . . . . . . . . . . . . . 0.006 dVmax [mL] . . . . . . . . . . . . . 0.3 Measure. . . . . . . . . . . . . . . EQU controlled dE[mV] . . . . . . . . . . . . . . . 0.5 dt[s] . . . . . . . . . . . . . . . 2 t(min) [s] . . . . . . . . . . . . . 3 t(max) [s] . . . . . . . . . . . . . 20 Recognition Tendency . . . . . . . . . . . . . . Negative Min Relevance. . . . . . . . . . . . 1 Threshold [mV/mL]. . . . . . . . . . 30.0 St. jump only. . . . . . . . . . . . No Termination param. Numb. EQPs . . . . . . . . . . . . . 2 Vmax [mL]. . . . . . . . . . . . . . 20 Evaluation Number Potentials. . . . . . . . . . 0Calculation 1 Calculation . . . . . . . . . . . . . . Cont. Type . . . . . . . . . . . . . . . . . Cont. Unit . . . . . . . . . . . . . . . . . mg/L Which EQP . . . . . . . . . . . . . . . 1 Decimal places . . . . . . . . . . . . 3 Result limits . . . . . . . . . . . . . No Statistics . . . . . . . . . . . . . . YesCalculation 2 Calculation . . . . . . . . . . . . . . User def. Name. . . . . . . . . . . . . . . . . . Mg Cont. Formula . . . . . . . . . . . . . . . . R=Q*C/m C . . . . . . . . . . . . . . . . . . . 24.31 Factor. . . . . . . . . . . . . . . . . 1000.0 Unit . . . . . . . . . . . . . . . . . mg/L Which EQP . . . . . . . . . . . . . . . 2 Decimal places . . . . . . . . . . . . 3 Result limits . . . . . . . . . . . . . No Statistics . . . . . . . . . . . . . . YesCalculation 3 Calculation . . . . . . . . . . . . . . NoneReport Output . . . . . . . . . . . . . . . . Printer Results . . . . . . . . . . . . . . . . GLP Meas. val. table . . . . . . . . . . . Yes E - V curve . . . . . . . . . . . . . . Yes dE/dV curve . . . . . . . . . . . . . . Yes
MethodOther Control parameters
Set of parameters . . . . . . . . Fast Addition . . . . . . . . . . . . . Dynamic dE(set) [mV] . . . . . . . . . . . 6 dVmin [mL] . . . . . . . . . . . . 0.01 dVmax [mL] . . . . . . . . . . . . 0.3 Measure. . . . . . . . . . . . . . EQU controlled dE[mV] . . . . . . . . . . . . . . 1.0 dt[s] . . . . . . . . . . . . . . 2 t(min) [s] . . . . . . . . . . . . 3 t(max) [s] . . . . . . . . . . . . 10
Set of parameters . . . . . . . . Cautious Addition . . . . . . . . . . . . . Dynamic dE(set) [mV] . . . . . . . . . . . 1 dVmin [mL] . . . . . . . . . . . . 0.006 dVmax [mL] . . . . . . . . . . . . 0.3 Measure. . . . . . . . . . . . . . EQU controlled dE[mV] . . . . . . . . . . . . . . 0.5 dt[s] . . . . . . . . . . . . . . 3 t(min) [s] . . . . . . . . . . . . 4 t(max) [s] . . . . . . . . . . . . 30
39
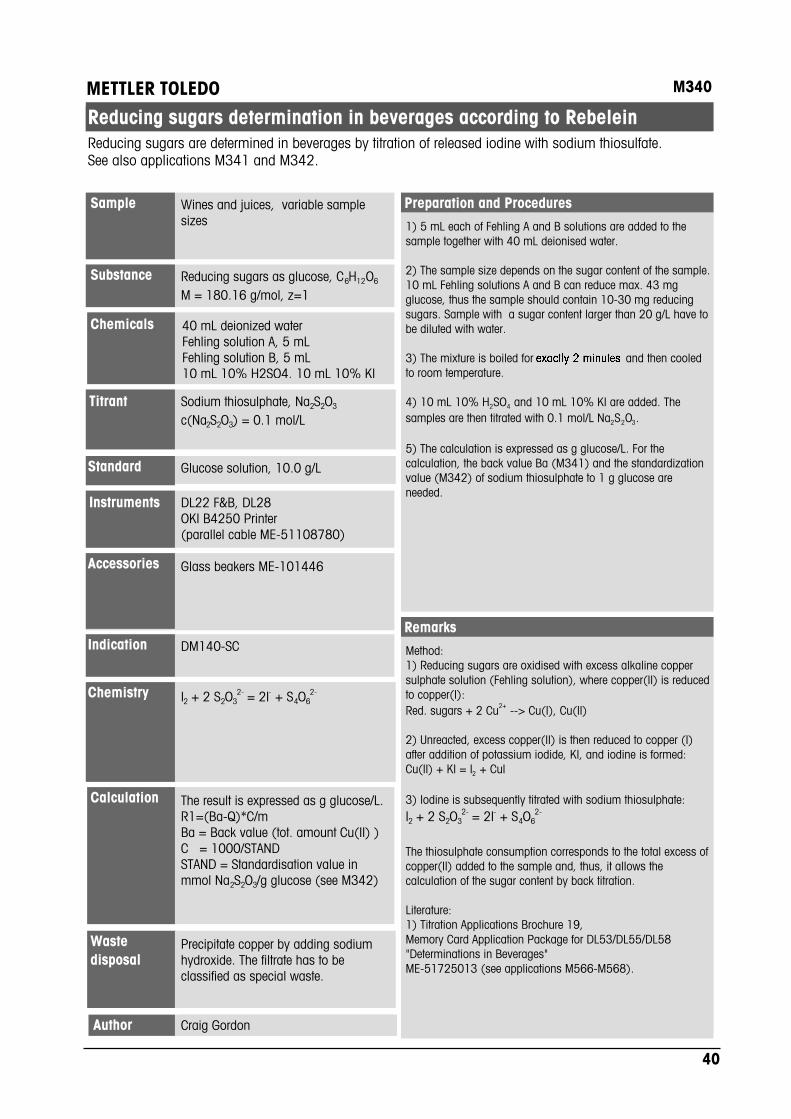
M340
Reducing sugars as glucose, C6H12O6
M = 180.16 g/mol, z=1
40 mL deionized waterFehling solution A, 5 mLFehling solution B, 5 mL10 mL 10% H2SO4, 10 mL 10% KI
Sodium thiosulphate, Na2S2O3
c(Na2S2O3) = 0.1 mol/L
DL22 F&B, DL28OKI B4250 Printer(parallel cable ME-51108780)
I2 + 2 S2O32- = 2I- + S4O6
2-
Glass beakers ME-101446
METTLER TOLEDO
Precipitate copper by adding sodiumhydroxide. The filtrate has to beclassified as special waste.
Wastedisposal
Preparation and ProceduresWines and juices, variable samplesizes
Sample
Substance
Chemicals
Titrant
Instruments
Results
Chemistry
Accessories
DM140-SCIndication
Reducing sugars determination in beverages according to Rebelein
1) 5 mL each of Fehling A and B solutions are added to thesample together with 40 mL deionised water.
2) The sample size depends on the sugar content of the sample.10 mL Fehling solutions A and B can reduce max. 43 mgglucose, thus the sample should contain 10-30 mg reducingsugars. Sample with a sugar content larger than 20 g/L have tobe diluted with water.
3) The mixture is boiled for and then cooledto room temperature.
4) 10 mL 10% H2SO4 and 10 mL 10% KI are added. Thesamples are then titrated with 0.1 mol/L Na2S2O3.
5) The calculation is expressed as g glucose/L. For thecalculation, the back value Ba (M341) and the standardizationvalue (M342) of sodium thiosulphate to 1 g glucose areneeded.
Method:1) Reducing sugars are oxidised with excess alkaline coppersulphate solution (Fehling solution), where copper(II) is reducedto copper(I):Red. sugars + 2 Cu2+ --> Cu(I), Cu(II)
2) Unreacted, excess copper(II) is then reduced to copper (I)after addition of potassium iodide, KI, and iodine is formed:Cu(II) + KI = I2 + CuI
3) Iodine is subsequently titrated with sodium thiosulphate:I2 + 2 S2O3
2- = 2I- + S4O62-
The thiosulphate consumption corresponds to the total excess ofcopper(II) added to the sample and, thus, it allows thecalculation of the sugar content by back titration.
Literature:1) Titration Applications Brochure 19,Memory Card Application Package for DL53/DL55/DL58"Determinations in Beverages"ME-51725013 (see applications M566-M568).
Remarks
The result is expressed as g glucose/L.R1=(Ba-Q)*C/mBa = Back value (tot. amount Cu(II) )C = 1000/STANDSTAND = Standardisation value inmmol Na2S2O3/g glucose (see M342)
Calculation
Reducing sugars are determined in beverages by titration of released iodine with sodium thiosulfate.See also applications M341 and M342.
Standard Glucose solution, 10.0 g/L
Craig GordonAuthor
40

Table of measured values
-------------------------------------------------------------------Method ID 940 Title Reducing sugars00-00-0000 00:00 Author-------------------------------------------------------------------
All resultsSample Sample ID Result Calculat. Value Unit-------------------------------------------------------------------1 Rosé Wine 1 Content. 2.3755 [g/L]
2 Rosé Wine 1 Content. 2.3696 [g/L]
3 Rosé Wine 1 Content. 2.3316 [g/L]
Statistics reportResult n x s Unit srel [%]-------------------------------------------------------------------1 3 2.3589 0.0238 [g/L] 1.009
ResultsActive sample Deleted samples-------------------------------------------------------------------123
Other results:
White wineStatistics reportResult n x s Unit srel [%]-------------------------------------------------------------------1 3 1.5895 0.0168 [g/L] 1.056
Red wineStatistics reportResult n x s Unit srel [%]-------------------------------------------------------------------1 3 2.5158 0.0559 [g/L] 2.221
Titration curve
Results
41

Method ID 940 Title Reducing sugars00-00-0000 00:00
Sample para. Sample ID . . . . . . . . . . . . . . . Request Entry type . . . . . . . . . . . . . . Volume Minimum [mL] . . . . . . . . . . . . . 2 Maximum [mL] . . . . . . . . . . . . . 20 Density [g/mL] . . . . . . . . . . . . 1.0 Mol.m. [g/mol] . . . . . . . . . . . . 180 Equival. number z . . . . . . . . . . . 1 Temp.sensor . . . . . . . . . . . . . . Manual Temp. [°C] . . . . . . . . . . . . . . 25.0Stir Speed [%] . . . . . . . . . . . . . . . 40 Mixing time [s] . . . . . . . . . . . . 10EP titration Titrant . . . . . . . . . . . . . . . . Na2S2O3 0.1 Conc.[mol/L] . . . . . . . . . . . . 0.1 Sensor . . . . . . . . . . . . . . . . DM140 Unit . . . . . . . . . . . . . . . . mV Blank . . . . . . . . . . . . . . . . . Entry Value [mmol] . . . . . . . . . . . . 0.00 Predis.[mL] . . . . . . . . . . . . . . 1.000 Back value [mmol] . . . . . . . . . . . Request Control parameters Set of parameters . . . . . . . . . Normal Addition . . . . . . . . . . . . . . Dynamic dE(set) [mV] . . . . . . . . . . . . 8 dVmin [mL] . . . . . . . . . . . . . 0.02 dVmax [mL] . . . . . . . . . . . . . 0.5 Measure mode . . . . . . . . . . . . EQU controlled dE[mV] . . . . . . . . . . . . . . . 0.5 dt[s] . . . . . . . . . . . . . . . 1 t(min) [s] . . . . . . . . . . . . . 3 t(max) [s] . . . . . . . . . . . . . 30 Recognition Tendency . . . . . . . . . . . . . . Negative Min Relevance . . . . . . . . . . . 30 Threshold [mV/mL] . . . . . . . . . 100.0 St. jump only . . . . . . . . . . . No Termination param. Numb. EQPs . . . . . . . . . . . . . 1 Vmax [mL] . . . . . . . . . . . . . 20.0 Evaluation Number potentials . . . . . . . . . 0Calculation 1 Calculation . . . . . . . . . . . . . . User def. Name . . . . . . . . . . . . . . . . . Content Formula . . . . . . . . . . . . . . . . R=(Ba-Q)*C/m C . . . . . . . . . . . . . . . . . . . 33.227 Factor . . . . . . . . . . . . . . . . 1.0 Unit . . . . . . . . . . . . . . . . . mg/L Which EQP . . . . . . . . . . . . . . . 1 Decimal places . . . . . . . . . . . . 3 Result limits . . . . . . . . . . . . . No Statistics . . . . . . . . . . . . . . YesCalculation 2 Calculation . . . . . . . . . . . . . . Cont. Type . . . . . . . . . . . . . . . . . Cont. Unit . . . . . . . . . . . . . . . . . mmol/L Which EQP . . . . . . . . . . . . . . . 1 Decimal places . . . . . . . . . . . . 3 Result limits . . . . . . . . . . . . . No Statistics . . . . . . . . . . . . . . YesCalculation 3 Calculation . . . . . . . . . . . . . . Consumpt. Unit . . . . . . . . . . . . . . . . . mL Which EQP . . . . . . . . . . . . . . . 1 Decimal places . . . . . . . . . . . . 4 Result limits . . . . . . . . . . . . . No Statistics . . . . . . . . . . . . . . YesReport Output . . . . . . . . . . . . . . . . Printer Results . . . . . . . . . . . . . . . . GLP Meas. val. table . . . . . . . . . . . No E - V curve . . . . . . . . . . . . . . Yes dE/dV curve . . . . . . . . . . . . . . Yes
MethodOther Control parameters
Set of parameters . . . . . . . Fast Addition . . . . . . . . . . . . Dynamic dE(set) [mV] . . . . . . . . . . 8 dVmin [mL] . . . . . . . . . . . 0.03 dVmax [mL] . . . . . . . . . . . 0.4 Measure mode . . . . . . . . . . EQU controlled dE[mV] . . . . . . . . . . . . . 0.5 dt[s] . . . . . . . . . . . . . 1 t(min) [s] . . . . . . . . . . . 2 t(max) [s] . . . . . . . . . . . 15
Set of parameters . . . . . . . Cautious Addition . . . . . . . . . . . . Dynamic dE(set) [mV] . . . . . . . . . . 8 dVmin [mL] . . . . . . . . . . . 0.01 dVmax [mL] . . . . . . . . . . . 0.2 Measure mode . . . . . . . . . . EQU controlled dE[mV] . . . . . . . . . . . . . 0.5 dt[s] . . . . . . . . . . . . . 2 t(min) [s] . . . . . . . . . . . 3 t(max) [s] . . . . . . . . . . . 30
42
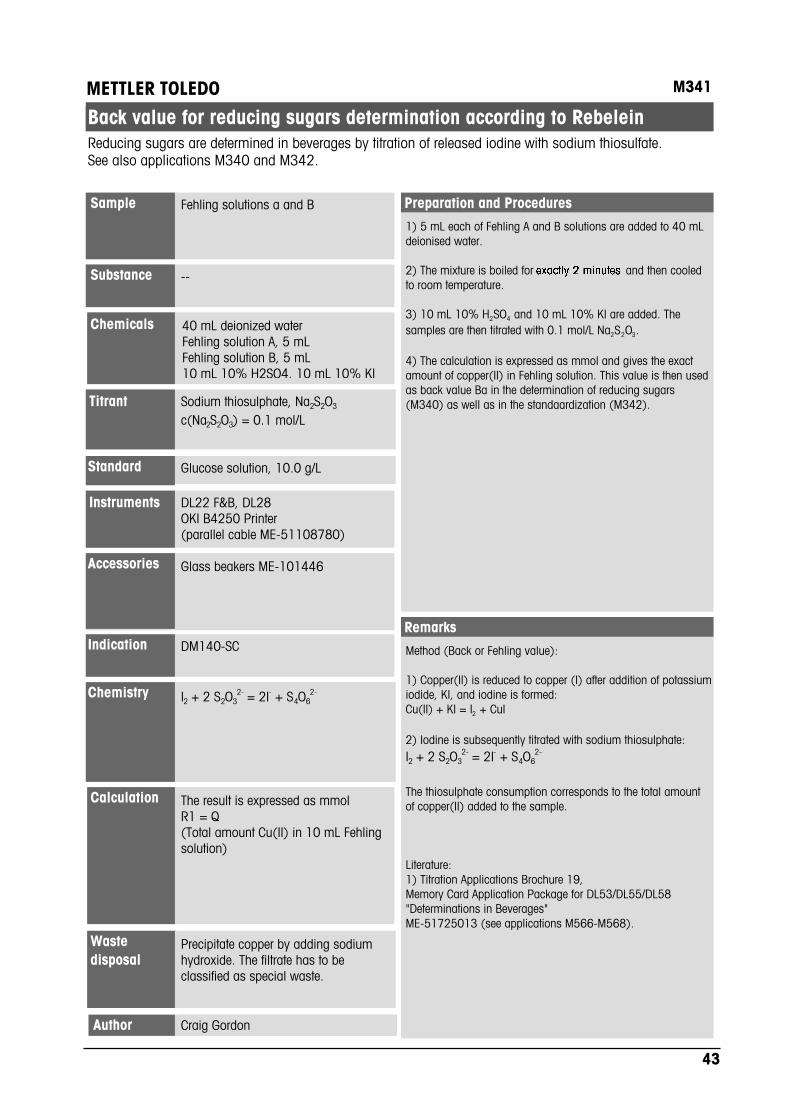
M341
--
40 mL deionized waterFehling solution A, 5 mLFehling solution B, 5 mL10 mL 10% H2SO4, 10 mL 10% KI
Sodium thiosulphate, Na2S2O3
c(Na2S2O3) = 0.1 mol/L
DL22 F&B, DL28OKI B4250 Printer(parallel cable ME-51108780)
I2 + 2 S2O32- = 2I- + S4O6
2-
Glass beakers ME-101446
METTLER TOLEDO
Precipitate copper by adding sodiumhydroxide. The filtrate has to beclassified as special waste.
Wastedisposal
Preparation and ProceduresFehling solutions a and BSample
Substance
Chemicals
Titrant
Instruments
Results
Chemistry
Accessories
DM140-SCIndication
Back value for reducing sugars determination according to Rebelein
1) 5 mL each of Fehling A and B solutions are added to 40 mLdeionised water.
2) The mixture is boiled for and then cooledto room temperature.
3) 10 mL 10% H2SO4 and 10 mL 10% KI are added. Thesamples are then titrated with 0.1 mol/L Na2S2O3.
4) The calculation is expressed as mmol and gives the exactamount of copper(II) in Fehling solution. This value is then usedas back value Ba in the determination of reducing sugars(M340) as well as in the standaardization (M342).
Method (Back or Fehling value):
1) Copper(II) is reduced to copper (I) after addition of potassiumiodide, KI, and iodine is formed:Cu(II) + KI = I2 + CuI
2) Iodine is subsequently titrated with sodium thiosulphate:I2 + 2 S2O3
2- = 2I- + S4O62-
The thiosulphate consumption corresponds to the total amountof copper(II) added to the sample.
Literature:1) Titration Applications Brochure 19,Memory Card Application Package for DL53/DL55/DL58"Determinations in Beverages"ME-51725013 (see applications M566-M568).
Remarks
The result is expressed as mmolR1 = Q(Total amount Cu(II) in 10 mL Fehlingsolution)
Calculation
Reducing sugars are determined in beverages by titration of released iodine with sodium thiosulfate.See also applications M340 and M342.
Standard Glucose solution, 10.0 g/L
Craig GordonAuthor
43

Table of measured values
-------------------------------------------------------------------Method ID 941 Title Fehling value00-00-0000 00:00 Author-------------------------------------------------------------------
All resultsSample Sample ID Result Calculat. Value Unit-------------------------------------------------------------------1 Back value 1 Consump. 1.3746 [mmol]
2 Back value 1 Consump. 1.3685 [mmol]
3 Back value 1 Consump. 1.3762 [mmol]
Statistics reportResult n x s Unit srel [%]-------------------------------------------------------------------1 3 1.3731 0.0041 [mmol] 0.296
ResultsActive sample Deleted samples-------------------------------------------------------------------123
Titration curve
Results
44

Method ID 941 Title Fehling value00-00-0000 00:00
Sample para. Sample ID . . . . . . . . . . . . . . . Back value Entry type . . . . . . . . . . . . . . Volume Volume [mL] . . . . . . . . . . . . . . 10 Density [g/mL] . . . . . . . . . . . . 1.0 Mol.m. [g/mol] . . . . . . . . . . . . 180 Equival. number z . . . . . . . . . . . 1 Temp.sensor . . . . . . . . . . . . . . Manual Temp. [°C] . . . . . . . . . . . . . . 25.0Stir Speed [%] . . . . . . . . . . . . . . . 40 Mixing time [s] . . . . . . . . . . . . 10EP titration Titrant . . . . . . . . . . . . . . . . Na2S2O3 0.1 Conc.[mol/L] . . . . . . . . . . . . 0.1 Sensor . . . . . . . . . . . . . . . . DM140 Unit . . . . . . . . . . . . . . . . mV Blank . . . . . . . . . . . . . . . . . Entry Value [mmol] . . . . . . . . . . . . 0.00 Predis.[mL] . . . . . . . . . . . . . . 10.000 Back value [mmol] . . . . . . . . . . . Request Control parameters Set of parameters . . . . . . . . . Normal Addition . . . . . . . . . . . . . . Dynamic dE(set) [mV] . . . . . . . . . . . . 8 dVmin [mL] . . . . . . . . . . . . . 0.02 dVmax [mL] . . . . . . . . . . . . . 0.5 Measure mode . . . . . . . . . . . . EQU controlled dE[mV] . . . . . . . . . . . . . . . 0.5 dt[s] . . . . . . . . . . . . . . . 1 t(min) [s] . . . . . . . . . . . . . 3 t(max) [s] . . . . . . . . . . . . . 30 Recognition Tendency . . . . . . . . . . . . . . Negative Min Relevance . . . . . . . . . . . 30 Threshold [mV/mL] . . . . . . . . . 100.0 St. jump only . . . . . . . . . . . No Termination param. Numb. EQPs . . . . . . . . . . . . . 1 Vmax [mL] . . . . . . . . . . . . . 20.0 Evaluation Number potentials . . . . . . . . . 0Calculation 1 Calculation . . . . . . . . . . . . . . Consump. Unit . . . . . . . . . . . . . . . . . mmol Which EQP . . . . . . . . . . . . . . . 1 Decimal places . . . . . . . . . . . . 4 Result limits . . . . . . . . . . . . . No Statistics . . . . . . . . . . . . . . YesCalculation 2 Calculation . . . . . . . . . . . . . . NoneCalculation 3 Calculation . . . . . . . . . . . . . . NoneReport Output . . . . . . . . . . . . . . . . Printer Results . . . . . . . . . . . . . . . . GLP Meas. val. table . . . . . . . . . . . No E - V curve . . . . . . . . . . . . . . Yes dE/dV curve . . . . . . . . . . . . . . Yes
MethodOther Control parameters
Set of parameters . . . . . . . Fast Addition . . . . . . . . . . . . Dynamic dE(set) [mV] . . . . . . . . . . 8 dVmin [mL] . . . . . . . . . . . 0.03 dVmax [mL] . . . . . . . . . . . 0.4 Measure mode . . . . . . . . . . EQU controlled dE[mV] . . . . . . . . . . . . . 0.5 dt[s] . . . . . . . . . . . . . 1 t(min) [s] . . . . . . . . . . . 2 t(max) [s] . . . . . . . . . . . 15
Set of parameters . . . . . . . Cautious Addition . . . . . . . . . . . . Dynamic dE(set) [mV] . . . . . . . . . . 8 dVmin [mL] . . . . . . . . . . . 0.01 dVmax [mL] . . . . . . . . . . . 0.2 Measure mode . . . . . . . . . . EQU controlled dE[mV] . . . . . . . . . . . . . 0.5 dt[s] . . . . . . . . . . . . . 2 t(min) [s] . . . . . . . . . . . 3 t(max) [s] . . . . . . . . . . . 30
45

M342
Reducing sugars as glucose, C6H12O6
M = 180.16 g/mol, z=1
40 mL deionized waterFehling solution A, 5 mLFehling solution B, 5 mL10 mL 10% H2SO4, 10 mL 10% KI
Sodium thiosulphate, Na2S2O3
c(Na2S2O3) = 0.1 mol/L
DL22 F&B, DL28OKI B4250 Printer(parallel cable ME-51108780)
I2 + 2 S2O32- = 2I- + S4O6
2-
Glass beakers ME-101446
METTLER TOLEDO
Precipitate copper by adding sodiumhydroxide. The filtrate has to beclassified as special waste.
Wastedisposal
Preparation and Procedures2 mL Glucose solution, 10 g/L(= 20 mg glucose/sample)
Sample
Substance
Chemicals
Titrant
Instruments
Results
Chemistry
Accessories
DM140-SCIndication
Standardisation value for reducing sugars det. according to Rebelein
1) 5 mL each of Fehling A and B solutions are added to thesample together with 40 mL deionised water.
2) The sample size depends on the sugar content of the sample.10 mL Fehling solutions A and B can reduce max. 43 mgglucose, thus the sample should contain 10-30 mg reducingsugars. Sample with a sugar content larger than 20 g/L have tobe diluted with water.
2) The mixture is boiled for and then cooledto room temperature.
3) 10 mL 10% H2SO4 and 10 mL 10% KI are added. Thesamples are then titrated with 0.1 mol/L Na2S2O3.
4) The result is expressed as mmol Na2S2O3 / g glucose. Thisvalue is used in the calculation for the reducing sugardetermination (M340).
Method:1) Reducing sugars are oxidised with excess alkaline coppersulphate solution (Fehling solution), where copper(II) is reducedto copper(I):Red. sugars + 2 Cu2+ --> Cu(I), Cu(II)
2) Unreacted, excess copper(II) is then reduced to copper (I)after addition of potassium iodide, KI, and iodine is formed:Cu(II) + KI = I2 + CuI
3) Iodine is subsequently titrated with sodium thiosulphate:I2 + 2 S2O3
2- = 2I- + S4O62-
The thiosulphate consumption corresponds to the total excess ofcopper(II) added to the sample and, thus, it allows thecalculation of the sugar content by back titration
Literature:1) Titration Applications Brochure 19,Memory Card Application Package for DL53/DL55/DL58"Determinations in Beverages"ME-51725013 (see applications M566-M568).
Remarks
The result is expressed as mmol/gR1= Content
Calculation
Reducing sugars are determined in beverages by titration of released iodine with sodium thiosulfate.See also applications M340 and M341.
Standard Glucose solution, 10.0 g/L
Craig GordonAuthor
46

Table of measured values
-------------------------------------------------------------------Method ID 942 Title Glucose standard00-00-0000 00:00 Author-------------------------------------------------------------------
All resultsSample Sample ID Result Calculat. Value Unit-------------------------------------------------------------------1 Glucose St 1 Cont. back 30.5688 [mmol/g] d
2 Glucose St 1 Cont. back 29.9899 [mmol/g] d
3 Glucose St 1 Cont. back 29.7293 [mmol/g] d
Statistics reportResult n x s Unit srel [%]-------------------------------------------------------------------1 3 30.0960 0.4297 [mmol/g] 1.428
ResultsActive sample Deleted samples-------------------------------------------------------------------123
Titration curve
Results
47
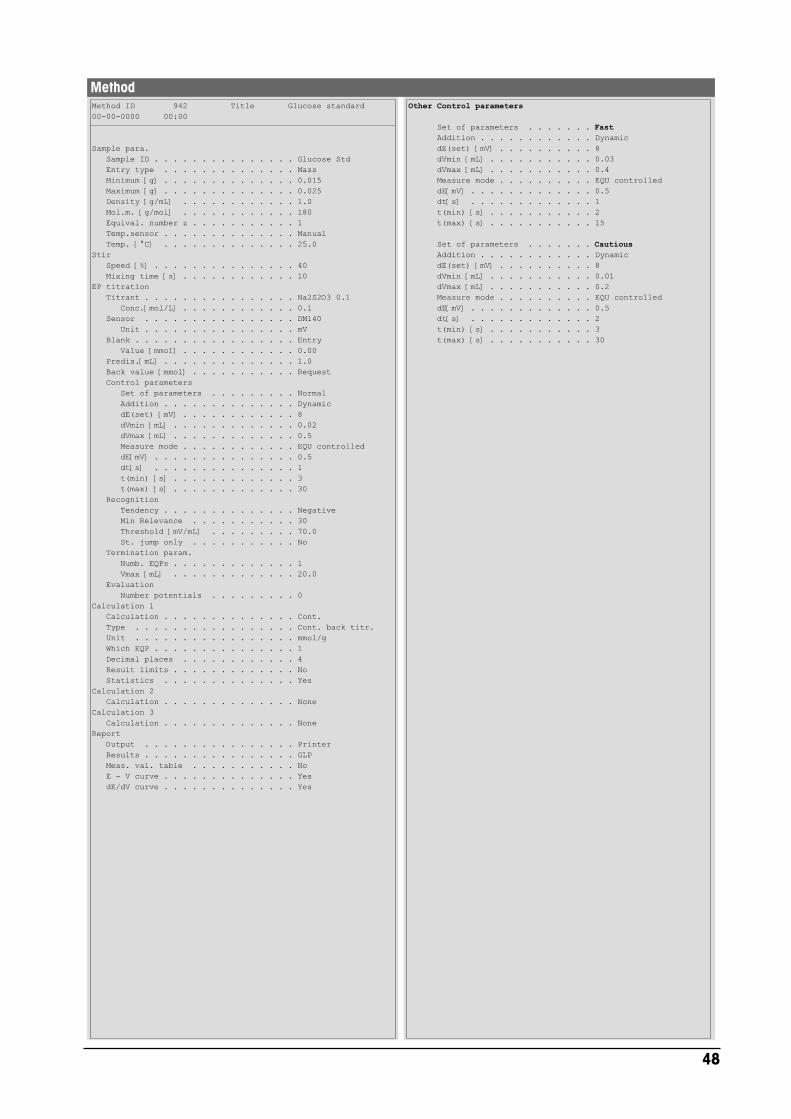
Method ID 942 Title Glucose standard00-00-0000 00:00
Sample para. Sample ID . . . . . . . . . . . . . . . Glucose Std Entry type . . . . . . . . . . . . . . Mass Minimum [g] . . . . . . . . . . . . . . 0.015 Maximum [g] . . . . . . . . . . . . . . 0.025 Density [g/mL] . . . . . . . . . . . . 1.0 Mol.m. [g/mol] . . . . . . . . . . . . 180 Equival. number z . . . . . . . . . . . 1 Temp.sensor . . . . . . . . . . . . . . Manual Temp. [°C] . . . . . . . . . . . . . . 25.0Stir Speed [%] . . . . . . . . . . . . . . . 40 Mixing time [s] . . . . . . . . . . . . 10EP titration Titrant . . . . . . . . . . . . . . . . Na2S2O3 0.1 Conc.[mol/L] . . . . . . . . . . . . 0.1 Sensor . . . . . . . . . . . . . . . . DM140 Unit . . . . . . . . . . . . . . . . mV Blank . . . . . . . . . . . . . . . . . Entry Value [mmol] . . . . . . . . . . . . 0.00 Predis.[mL] . . . . . . . . . . . . . . 1.0 Back value [mmol] . . . . . . . . . . . Request Control parameters Set of parameters . . . . . . . . . Normal Addition . . . . . . . . . . . . . . Dynamic dE(set) [mV] . . . . . . . . . . . . 8 dVmin [mL] . . . . . . . . . . . . . 0.02 dVmax [mL] . . . . . . . . . . . . . 0.5 Measure mode . . . . . . . . . . . . EQU controlled dE[mV] . . . . . . . . . . . . . . . 0.5 dt[s] . . . . . . . . . . . . . . . 1 t(min) [s] . . . . . . . . . . . . . 3 t(max) [s] . . . . . . . . . . . . . 30 Recognition Tendency . . . . . . . . . . . . . . Negative Min Relevance . . . . . . . . . . . 30 Threshold [mV/mL] . . . . . . . . . 70.0 St. jump only . . . . . . . . . . . No Termination param. Numb. EQPs . . . . . . . . . . . . . 1 Vmax [mL] . . . . . . . . . . . . . 20.0 Evaluation Number potentials . . . . . . . . . 0Calculation 1 Calculation . . . . . . . . . . . . . . Cont. Type . . . . . . . . . . . . . . . . . Cont. back titr. Unit . . . . . . . . . . . . . . . . . mmol/g Which EQP . . . . . . . . . . . . . . . 1 Decimal places . . . . . . . . . . . . 4 Result limits . . . . . . . . . . . . . No Statistics . . . . . . . . . . . . . . YesCalculation 2 Calculation . . . . . . . . . . . . . . NoneCalculation 3 Calculation . . . . . . . . . . . . . . NoneReport Output . . . . . . . . . . . . . . . . Printer Results . . . . . . . . . . . . . . . . GLP Meas. val. table . . . . . . . . . . . No E - V curve . . . . . . . . . . . . . . Yes dE/dV curve . . . . . . . . . . . . . . Yes
MethodOther Control parameters
Set of parameters . . . . . . . Fast Addition . . . . . . . . . . . . Dynamic dE(set) [mV] . . . . . . . . . . 8 dVmin [mL] . . . . . . . . . . . 0.03 dVmax [mL] . . . . . . . . . . . 0.4 Measure mode . . . . . . . . . . EQU controlled dE[mV] . . . . . . . . . . . . . 0.5 dt[s] . . . . . . . . . . . . . 1 t(min) [s] . . . . . . . . . . . 2 t(max) [s] . . . . . . . . . . . 15
Set of parameters . . . . . . . Cautious Addition . . . . . . . . . . . . Dynamic dE(set) [mV] . . . . . . . . . . 8 dVmin [mL] . . . . . . . . . . . 0.01 dVmax [mL] . . . . . . . . . . . 0.2 Measure mode . . . . . . . . . . EQU controlled dE[mV] . . . . . . . . . . . . . 0.5 dt[s] . . . . . . . . . . . . . 2 t(min) [s] . . . . . . . . . . . 3 t(max) [s] . . . . . . . . . . . 30
48

M343
Unsaturated compounds (doublebonds)
Wijs solution, 10mLPure acetic acid, 20 mLPotassium iodine 20%, 10 mL
Sodium thiosulfate, Na2S2O3
c(Na2S2O3) = 0.1 mol/L
DL22 F&B, DL28OKI B4250 Printer(parallel cable ME-51108780)
ICl3 + I2 = 3IClICl + KI = I2 + KCl2Na2S2O3 + I2 = 2NaI + Na2(S4O6)
Titration beakers ME-101974
METTLER TOLEDO
Halogenated organic solventsWastedisposal
Preparation and ProceduresOils, fatsSample
Substance
Chemicals
Titrant
Instruments
Results
Chemistry
Accessories
DM140-SCIndication
Iodine number in edible oils and fats according to Wijs
1) Dissolve the sample in 20 mL pure acetic acid.
2) Add 10 mL Wijs solution and stir for 5 minutes.
3) Add 10 mL 20% potassium iodine.
4) Titrate inmediately with 0.1 mol/L sodium thiosulfate.
Note:To completely dissolve fat, margarine or butter, add 10 mL ofcyclohexane to the samples.
Back titration
the determination of the iodine value is done by back titration.Therefore the capacity of the Wijs solution, ICl3 solution in aceticacid, has to be determinated first. This is done with the method944 Back Iodine value. The mean value of 3 capacitydetermination is used in this method.
According to the Schweizerisches Lebensmittelbuch and mostinternational standards an incubation of one hour isrecommended after the Wijs solution is added to the sample.If the expected iodine value is higher than 150 g I2/100gsample, an incubation of two hours even is required.For this application the standard was modified. Instead ofincubating the samples, acetic acid is added. Afterwards thesample is stirred for five minutes, which guarantees that thedouble bonds react with the iodine monochloride.
Remarks
Back value determination (Meth. 944):R1 = Q
Iodine value det. (Method 943):R1 = (Ba-Q)*C/mC1 = 126.96Factor = 0.1
Calculation
General method for the determination of iodine value in oils and fats
Standard Potassium iodate
MJ SchmidAuthor
49
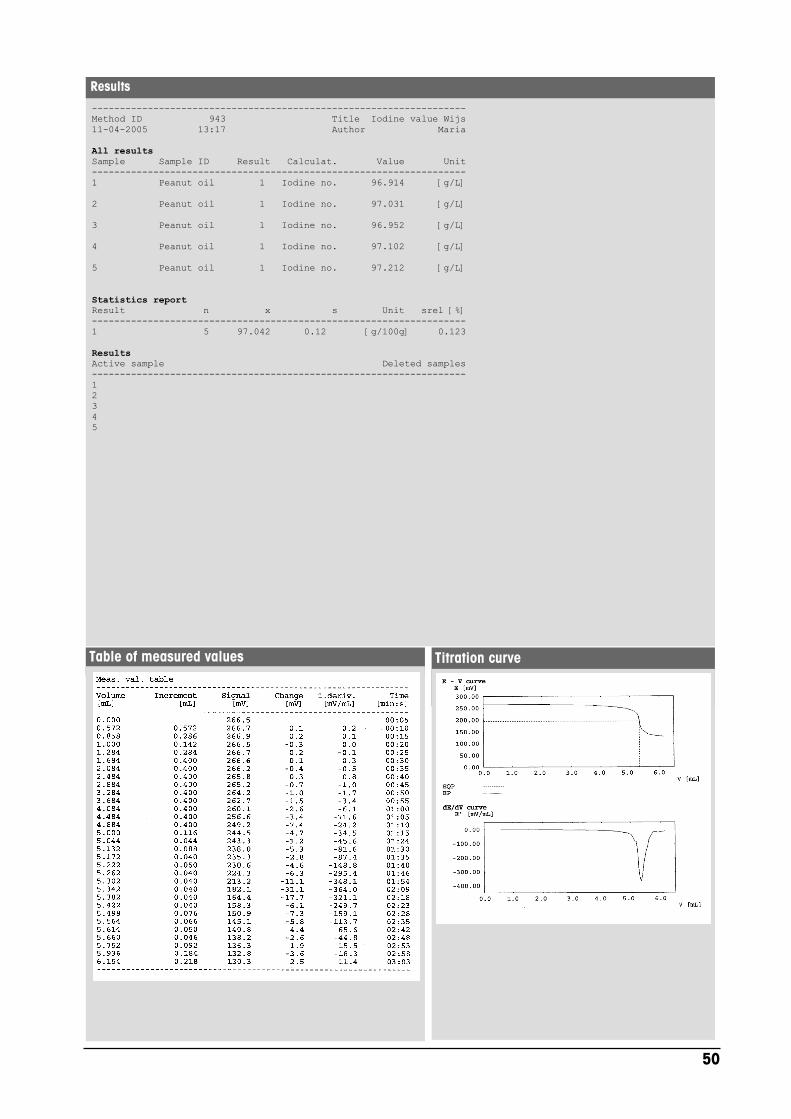
Table of measured values
-------------------------------------------------------------------Method ID 943 Title Iodine value Wijs11-04-2005 13:17 Author Maria
All resultsSample Sample ID Result Calculat. Value Unit-------------------------------------------------------------------1 Peanut oil 1 Iodine no. 96.914 [g/L]
2 Peanut oil 1 Iodine no. 97.031 [g/L]
3 Peanut oil 1 Iodine no. 96.952 [g/L]
4 Peanut oil 1 Iodine no. 97.102 [g/L]
5 Peanut oil 1 Iodine no. 97.212 [g/L]
Statistics reportResult n x s Unit srel [%]-------------------------------------------------------------------1 5 97.042 0.12 [g/100g] 0.123
ResultsActive sample Deleted samples-------------------------------------------------------------------12345
Titration curve
Results
50

Method ID 943 Title Iodine value Wijs11-04-2005 13:17 Author Maria
Sample para. Sample ID . . . . . . . . . . . . . . Request Entry type . . . . . . . . . . . . . Mass Minimum [g] . . . . . . . . . . . . . 0.05 Maximum [g] . . . . . . . . . . . . . 4.00 Density [g/mL] . . . . . . . . . . . 1.0 Mol.m. [g/mol] . . . . . . . . . . . 253.80 Equival. number z . . . . . . . . . . 2 Temp.sensor . . . . . . . . . . . . . Manual Temp. [°C] . . . . . . . . . . . . . 25.0Stir Speed [%] . . . . . . . . . . . . . . 35 Mixing time [s] . . . . . . . . . . . RequestEQP titration Titrant . . . . . . . . . . . . . . . Na2S2O3 0.1 Conc.[mol/L] . . . . . . . . . . . 0.1 Sensor . . . . . . . . . . . . . . . DM140 Unit . . . . . . . . . . . . . . . mV Blank . . . . . . . . . . . . . . . . Entry Value [mmol] . . . . . . . . . . . 0.00 Predis.[mL] . . . . . . . . . . . . . Request Back value [mmol] . . . . . . . . . . Request Control parameters Set of parameters . . . . . . . . Normal Addition . . . . . . . . . . . . . Dynamic dE(set) [mV] . . . . . . . . . . . 4 dVmin [mL] . . . . . . . . . . . . 0.04 dVmax [mL] . . . . . . . . . . . . 0.4 Measure mode . . . . . . . . . . . EQU controlled dE[mV] . . . . . . . . . . . . . . 1 dt[s] . . . . . . . . . . . . . . 1 t(min) [s] . . . . . . . . . . . . 5 t(max) [s] . . . . . . . . . . . . 30 Recognition Tendency . . . . . . . . . . . . . Negative Min Relevance . . . . . . . . . . 30.0 Threshold . . . . . . . . . . . . 100.0 Termination param. Vmax [mL] . . . . . . . . . . . . 15.0 Numb. EQPs . . . . . . . . . . . 1 Evaluation Numb. potentials . . . . . . . . . 0Calculation 1 Calculation . . . . . . . . . . . . . User def. Name . . . . . . . . . . . . . . . . Iodine value Formula . . . . . . . . . . . . . . . R=(Ba-Q)*C/m C . . . . . . . . . . . . . . . . . . 126.96 Factor . . . . . . . . . . . . . . . 0.1 Unit . . . . . . . . . . . . . . . . gI2/100g Which EQP . . . . . . . . . . . . . . 1 Decimal places . . . . . . . . . . . 3 Result limits . . . . . . . . . . . . No Statistics . . . . . . . . . . . . . YesCalculation 2 Calculation . . . . . . . . . . . . . NoneCalculation 3 Calculation . . . . . . . . . . . . . NoneReport Output . . . . . . . . . . . . . . . Printer Results . . . . . . . . . . . . . . . GLP Meas. val. table . . . . . . . . . . Yes E - V curve . . . . . . . . . . . . . Yes dE/dV curve . . . . . . . . . . . . . Yes
MethodOther Control parameters
Set of parameters . . . . . . . Fast Addition . . . . . . . . . . . . Dynamic dE(set) [mV] . . . . . . . . . . 4 dVmin [mL] . . . . . . . . . . . 0.05 dVmax [mL] . . . . . . . . . . . 0.5 Measure mode . . . . . . . . . . EQU controlled dE[mV] . . . . . . . . . . . . . 1 dt[s] . . . . . . . . . . . . . 1 t(min) [s] . . . . . . . . . . . 5 t(max) [s] . . . . . . . . . . . 30
Set of parameters . . . . . . . Cautious Addition . . . . . . . . . . . . Dynamic dE(set) [mV] . . . . . . . . . . 4 dVmin [mL] . . . . . . . . . . . 0.04 dVmax [mL] . . . . . . . . . . . 0.4 Measure mode . . . . . . . . . . EQU controlled dE[mV] . . . . . . . . . . . . . 0.5 dt[s] . . . . . . . . . . . . . 1 t(min) [s] . . . . . . . . . . . 5 t(max) [s] . . . . . . . . . . . 15
51

M344
0.1 mol/L ICl3 solution in acetic acid
Pure acetic acid, 20 mLPotassium iodine 20%, 10 mL
Sodium thiosulfate, Na2S2O3
c(Na2S2O3) = 0.1 mol/L;
DL22 F&B, DL28OKI B4250 Printer(parallel cable ME-51108780)
ICl3 + I2 = 3IClICl + KI = I2 + KCl2Na2S2O3 + I2 = 2NaI + Na2S4O6
Titration beakers ME-101974
METTLER TOLEDO
Halogenated organic solventsWastedisposal
Preparation and ProceduresWijs solution, 10 mLSample
Substance
Chemicals
Titrant
Instruments
Results
Chemistry
Accessories
DM140-SCIndication
Back value of Wijs Solution
1) Fill a beaker with 20 mL pure acetic acid
2) Add 10 mL Wijs solution and stir for 5 minutes.
3) Add 10 mL 20% potassium iodine.
4) Titrate inmediately with 0.1 mol/L sodium thiosulfate.
1) The determination of the iodine value is done by backtitration. Therefore the capacity of the Wijs solution, i.e. a ICl3solution in acetic acid, has to be determinated first. This isdescribed in this method.
2) The mean value of 3 capacity determination is then used inapplication M343 (iodine value determination).
Remarks
Back determination (Method 944):R1 = Q
Calculation
Method for the determination the capacity of the Wijs solution
Standard Potassium iodate
MJ SchmidAuthor
52

Table of measured values
-------------------------------------------------------------------Method ID 944 Title Back Iodine value03-03-2005 15:27 Author Maria-------------------------------------------------------------------
All resultsSample Sample ID Result Calculat. Value Unit-------------------------------------------------------------------1 Wijs solution 1 Consumpt. 1.915 [mmol]
2 Wijs solution 1 Consumpt. 1.914 [mmol]
3 Wijs solution 1 Consumpt. 1.918 [mmol]
Statistics reportResult n x s Unit srel [%]-------------------------------------------------------------------1 3 1.916 0.002 [mmol] 0.114
ResultsActive sample Deleted samples-------------------------------------------------------------------123
Titration curve
Results
53
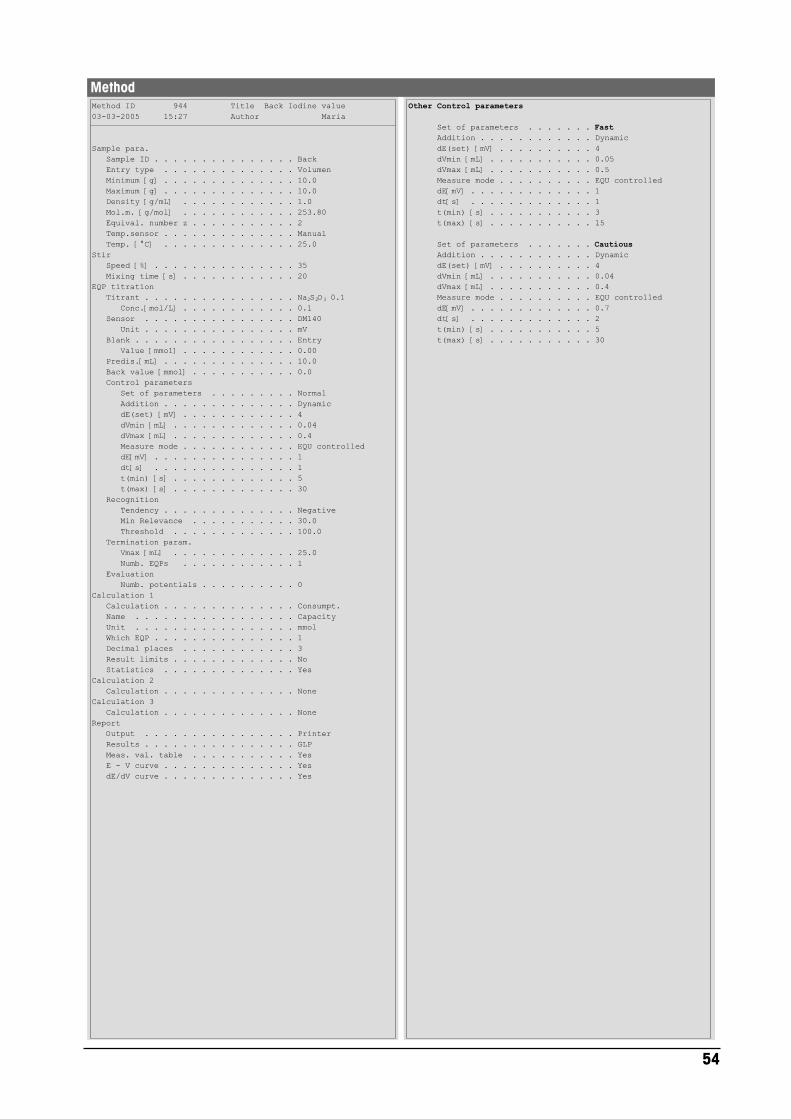
Method ID 944 Title Back Iodine value03-03-2005 15:27 Author Maria
Sample para. Sample ID . . . . . . . . . . . . . . . Back Entry type . . . . . . . . . . . . . . Volumen Minimum [g] . . . . . . . . . . . . . . 10.0 Maximum [g] . . . . . . . . . . . . . . 10.0 Density [g/mL] . . . . . . . . . . . . 1.0 Mol.m. [g/mol] . . . . . . . . . . . . 253.80 Equival. number z . . . . . . . . . . . 2 Temp.sensor . . . . . . . . . . . . . . Manual Temp. [°C] . . . . . . . . . . . . . . 25.0Stir Speed [%] . . . . . . . . . . . . . . . 35 Mixing time [s] . . . . . . . . . . . . 20EQP titration Titrant . . . . . . . . . . . . . . . . Na2S2O3 0.1 Conc.[mol/L] . . . . . . . . . . . . 0.1 Sensor . . . . . . . . . . . . . . . . DM140 Unit . . . . . . . . . . . . . . . . mV Blank . . . . . . . . . . . . . . . . . Entry Value [mmol] . . . . . . . . . . . . 0.00 Predis.[mL] . . . . . . . . . . . . . . 10.0 Back value [mmol] . . . . . . . . . . . 0.0 Control parameters Set of parameters . . . . . . . . . Normal Addition . . . . . . . . . . . . . . Dynamic dE(set) [mV] . . . . . . . . . . . . 4 dVmin [mL] . . . . . . . . . . . . . 0.04 dVmax [mL] . . . . . . . . . . . . . 0.4 Measure mode . . . . . . . . . . . . EQU controlled dE[mV] . . . . . . . . . . . . . . . 1 dt[s] . . . . . . . . . . . . . . . 1 t(min) [s] . . . . . . . . . . . . . 5 t(max) [s] . . . . . . . . . . . . . 30 Recognition Tendency . . . . . . . . . . . . . . Negative Min Relevance . . . . . . . . . . . 30.0 Threshold . . . . . . . . . . . . . 100.0 Termination param. Vmax [mL] . . . . . . . . . . . . . 25.0 Numb. EQPs . . . . . . . . . . . . 1 Evaluation Numb. potentials . . . . . . . . . . 0Calculation 1 Calculation . . . . . . . . . . . . . . Consumpt. Name . . . . . . . . . . . . . . . . . Capacity Unit . . . . . . . . . . . . . . . . . mmol Which EQP . . . . . . . . . . . . . . . 1 Decimal places . . . . . . . . . . . . 3 Result limits . . . . . . . . . . . . . No Statistics . . . . . . . . . . . . . . YesCalculation 2 Calculation . . . . . . . . . . . . . . NoneCalculation 3 Calculation . . . . . . . . . . . . . . NoneReport Output . . . . . . . . . . . . . . . . Printer Results . . . . . . . . . . . . . . . . GLP Meas. val. table . . . . . . . . . . . Yes E - V curve . . . . . . . . . . . . . . Yes dE/dV curve . . . . . . . . . . . . . . Yes
MethodOther Control parameters
Set of parameters . . . . . . . Fast Addition . . . . . . . . . . . . Dynamic dE(set) [mV] . . . . . . . . . . 4 dVmin [mL] . . . . . . . . . . . 0.05 dVmax [mL] . . . . . . . . . . . 0.5 Measure mode . . . . . . . . . . EQU controlled dE[mV] . . . . . . . . . . . . . 1 dt[s] . . . . . . . . . . . . . 1 t(min) [s] . . . . . . . . . . . 3 t(max) [s] . . . . . . . . . . . 15
Set of parameters . . . . . . . Cautious Addition . . . . . . . . . . . . Dynamic dE(set) [mV] . . . . . . . . . . 4 dVmin [mL] . . . . . . . . . . . 0.04 dVmax [mL] . . . . . . . . . . . 0.4 Measure mode . . . . . . . . . . EQU controlled dE[mV] . . . . . . . . . . . . . 0.7 dt[s] . . . . . . . . . . . . . 2 t(min) [s] . . . . . . . . . . . 5 t(max) [s] . . . . . . . . . . . 30
54

M345
Acidic components, free fatty acids
Ethanol/diethyether 1:1, 60 mL
KOH in ethanol, c(KOH) = 0.02 mol/L
DL22 F&B, DL28OKI B4250 Printer(parallel cable ME-51108780)
R-COOH + OH- = R-COO- + H2O
Titration beaker ME-101974Glass beaker ME-101446 (for titer)
METTLER TOLEDO
Organic solvent wasteWastedisposal
Preparation and ProceduresSunflower oil, 10 - 20 gOlive oil, 2 - 4 g
Sample
Substance
Chemicals
Titrant
Instruments
Results
Chemistry
Accessories
DG113-SCIndication
Acid number of edible oils
As with every titration, the standardization of the titrant has to beperformed first. The standardization of KOH with benzoic acidshows a steep jump in the E-V curve, which makes this analysisvery reliable.
The required amount of sample is weighed in. Then 60 mL ofthe solvent are added and the titration is started.
The standard benzoic acid was weighed in instead of adding asolution because it would have to be dissolved in ethanol oracetone (insoluble in water). Since the sample size has to berather small we recommend to use a balance with a resolutionof at least 0.1 mg. The standardization was performed in glassbeakers to reduce electrostatic effects during weighing.
Benzoic acid is an aggressive substance. Therefore, contact withskin, and eyes particularly, should be avoided.
1) The acid number is a measure of the decomposition by lipaseenzyme of the glycerides in oil ands fats. The decomposition isaccelerated by heat and light. Rancidity idue to decomposition isusually accompanied by free fatty acid formation.
2) Blank determination: Acidic impurities in the solvent are takeninto account by determining the solvent blank.
3) Electrode conditioning: To ensure hydration of the membraneglass, the DG113 electrode is stored over night in water. Beforetitraiton, clean the electrode with solvent.
4) Difficult samples: Samples can show a rather flat curve, andnoise can appear. Adding 1 mL 0.05 mol/L benzoic acid to oneliter solvent solves the problem.This also helps if the blank determination should not be possiblebecause the jump comes too early.
All results shown were obtained with the control parameter set<Normal>.
Remarks
R1: Acid Number [mg KOH/g]R2: FFA (oleic acid) [ g/100 g]
In the user formula the molecularweight is entered as constant C.The factor f is used for the unitconversion.
Calculation
Determination of the acid number and free fatty acids of edible oils.
Standard Benzoic acid
P. BurriAuthor
55

Table of measured values
-------------------------------------------------------------------Method ID 945 Title AN non aqu.14-04-2005 13:28 Author P. Burri-------------------------------------------------------------------
All resultsSample Sample ID Result Calculat. Value Unit-------------------------------------------------------------------1 Olive oil 1 AN (KOH) 0.71625 [mg KOH/g] 2 FFA (oleic) 0.36057 [g/100 g]
2 Olive oil 1 AN (KOH) 0.71424 [mg KOH/g] 2 FFA (oleic) 0.35956 [g/100 g]
3 Olive oil 1 AN (KOH) 0.71194 [mg KOH/g] 2 FFA (oleic) 0.35840 [g/100 g]
4 Olive oil 1 AN (KOH) 0.71537 [mg KOH/g] 2 FFA (oleic) 0.36013 [g/100 g]
5 Olive oil 1 AN (KOH) 0.72333 [mg KOH/g] 2 FFA (oleic) 0.36414 [g/100 g]
Statistics reportResult n x s Unit srel [%]-------------------------------------------------------------------1 5 0.71622 0.00429 [mg KOH/g] 0.5982 5 0.36056 0.00216 [g/100 g] 0.598
ResultsActive sample Deleted samples-------------------------------------------------------------------12345
Titration curve
Results
56
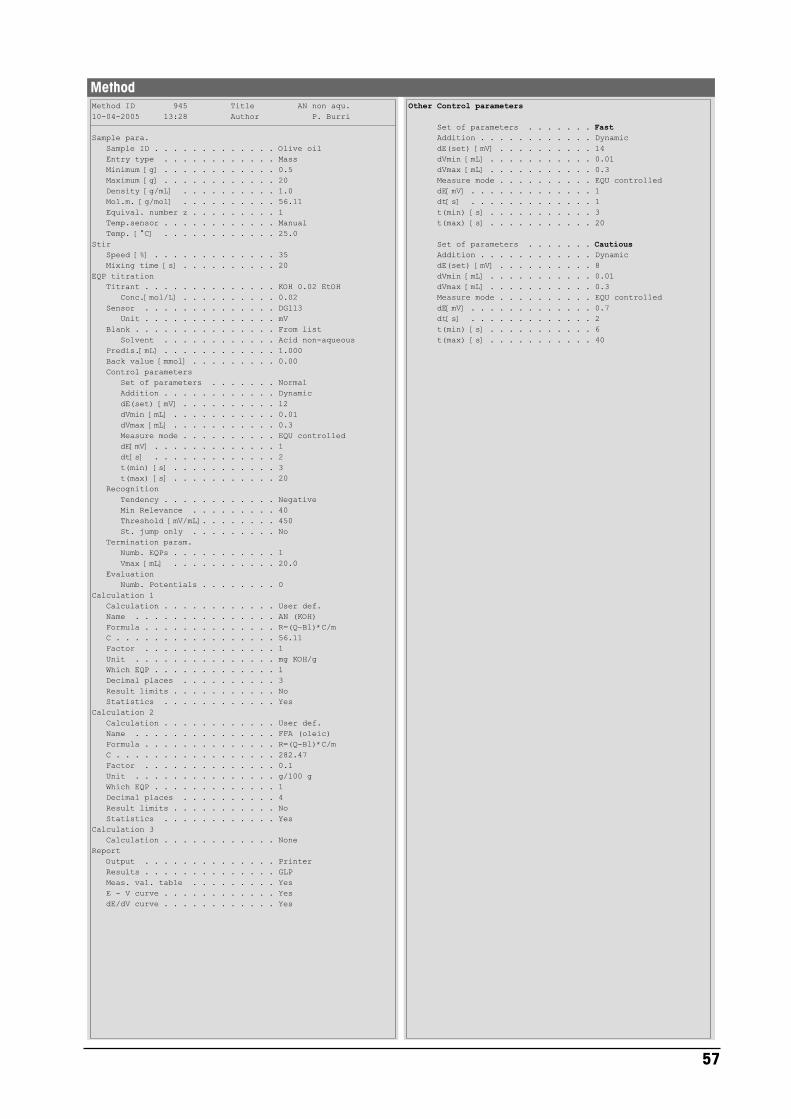
Method ID 945 Title AN non aqu.10-04-2005 13:28 Author P. Burri
Sample para. Sample ID . . . . . . . . . . . . . Olive oil Entry type . . . . . . . . . . . . Mass Minimum [g] . . . . . . . . . . . . 0.5 Maximum [g] . . . . . . . . . . . . 20 Density [g/mL] . . . . . . . . . . 1.0 Mol.m. [g/mol] . . . . . . . . . . 56.11 Equival. number z . . . . . . . . . 1 Temp.sensor . . . . . . . . . . . . Manual Temp. [°C] . . . . . . . . . . . . 25.0Stir Speed [%] . . . . . . . . . . . . . 35 Mixing time [s] . . . . . . . . . . 20EQP titration Titrant . . . . . . . . . . . . . . KOH 0.02 EtOH Conc.[mol/L] . . . . . . . . . . 0.02 Sensor . . . . . . . . . . . . . . DG113 Unit . . . . . . . . . . . . . . mV Blank . . . . . . . . . . . . . . . From list Solvent . . . . . . . . . . . . Acid non-aqueous Predis.[mL] . . . . . . . . . . . . 1.000 Back value [mmol] . . . . . . . . . 0.00 Control parameters Set of parameters . . . . . . . Normal Addition . . . . . . . . . . . . Dynamic dE(set) [mV] . . . . . . . . . . 12 dVmin [mL] . . . . . . . . . . . 0.01 dVmax [mL] . . . . . . . . . . . 0.3 Measure mode . . . . . . . . . . EQU controlled dE[mV] . . . . . . . . . . . . . 1 dt[s] . . . . . . . . . . . . . 2 t(min) [s] . . . . . . . . . . . 3 t(max) [s] . . . . . . . . . . . 20 Recognition Tendency . . . . . . . . . . . . Negative Min Relevance . . . . . . . . . 40 Threshold [mV/mL]. . . . . . . . 450 St. jump only . . . . . . . . . No Termination param. Numb. EQPs . . . . . . . . . . . 1 Vmax [mL] . . . . . . . . . . . 20.0 Evaluation Numb. Potentials . . . . . . . . 0Calculation 1 Calculation . . . . . . . . . . . . User def. Name . . . . . . . . . . . . . . . AN (KOH) Formula . . . . . . . . . . . . . . R=(Q-Bl)*C/m C . . . . . . . . . . . . . . . . . 56.11 Factor . . . . . . . . . . . . . . 1 Unit . . . . . . . . . . . . . . . mg KOH/g Which EQP . . . . . . . . . . . . . 1 Decimal places . . . . . . . . . . 3 Result limits . . . . . . . . . . . No Statistics . . . . . . . . . . . . YesCalculation 2 Calculation . . . . . . . . . . . . User def. Name . . . . . . . . . . . . . . . FFA (oleic) Formula . . . . . . . . . . . . . . R=(Q-Bl)*C/m C . . . . . . . . . . . . . . . . . 282.47 Factor . . . . . . . . . . . . . . 0.1 Unit . . . . . . . . . . . . . . . g/100 g Which EQP . . . . . . . . . . . . . 1 Decimal places . . . . . . . . . . 4 Result limits . . . . . . . . . . . No Statistics . . . . . . . . . . . . YesCalculation 3 Calculation . . . . . . . . . . . . NoneReport Output . . . . . . . . . . . . . . Printer Results . . . . . . . . . . . . . . GLP Meas. val. table . . . . . . . . . Yes E - V curve . . . . . . . . . . . . Yes dE/dV curve . . . . . . . . . . . . Yes
MethodOther Control parameters
Set of parameters . . . . . . . Fast Addition . . . . . . . . . . . . Dynamic dE(set) [mV] . . . . . . . . . . 14 dVmin [mL] . . . . . . . . . . . 0.01 dVmax [mL] . . . . . . . . . . . 0.3 Measure mode . . . . . . . . . . EQU controlled dE[mV] . . . . . . . . . . . . . 1 dt[s] . . . . . . . . . . . . . 1 t(min) [s] . . . . . . . . . . . 3 t(max) [s] . . . . . . . . . . . 20
Set of parameters . . . . . . . Cautious Addition . . . . . . . . . . . . Dynamic dE(set) [mV] . . . . . . . . . . 8 dVmin [mL] . . . . . . . . . . . 0.01 dVmax [mL] . . . . . . . . . . . 0.3 Measure mode . . . . . . . . . . EQU controlled dE[mV] . . . . . . . . . . . . . 0.7 dt[s] . . . . . . . . . . . . . 2 t(min) [s] . . . . . . . . . . . 6 t(max) [s] . . . . . . . . . . . 40
57

M346
Peroxide, ROOR
20 mL acetic acid/chloroform (3:2)1 mL saturated KI solution50 mL deion. water
Sodium thiosulfate, Na2S2O3
c(Na2S2O3)= 0.01mol/L;
DL22 F&B, DL28OKI B4250 Printer(parallel cable ME-51108780)
R-OOH + KI = R-OH + KOH + I2
I2 + 2Na2S2O3 = 2NaI + Na2S4O6
Red titration beaker ME-25777
METTLER TOLEDO
The waste contains halogenatedorganic solvents and has to bedisposed of accordingly.
Wastedisposal
Preparation and ProceduresSunflower oil, 1 - 5 gOlive oil, 1 - 5 g
Sample
Substance
Chemicals
Titrant
Instruments
Results
Chemistry
Accessories
DM140-SCIndication
Peroxide number in edible oils and fats
1) Beakers have to be cleaned very well. Invisible fat residues ormetal traces can affect the result strongly.Red beakers are used to protect the reaction from light.
2) To about 1 - 5 g of sample 20 mL of glacial acetic acid/chloroform (3:2) solvent was added.
3) Immediately afterwards 1 mL of saturated potassium iodidesolution was added manually. The solution is gently shaken andleft standing in the dark for exactly 60 seconds, for thegeneration of iodine.
4) 50 mL deionized water are added manually to the samplesolution, and the titration of the liberated iodine startedimmediately.
127 g KI were dissolved in 100 mL water to obtain thesaturated KI solution. The solution has to be kept in the dark.
Impurities of the solvent are taken into account by a blank valuedetermination. The blank value determination is done under thesame conditions as the peroxide value determination itself.
Fats and oils undergo changes during storage due to oxidationwith air (oxidative rancidity). The compounds formed react asperoxides. Their content is commonly expressed as the "peroxidevalue" in milliequivalents peroxidic oxygen per kg of sample.Peroxide values higher than 10 to 20 meq O2/kg are commonlyinterpreted as rancidity.Unrefined oils have higher peroxide values. They are usually inthe range between 5 to 20 meq O2/kg.
Exactly 60 seconds were allowed for the generation of iodine, asis requested by the official method (AOAC No. 28.022). Earlierstudies, however, had indicated that the generation is notcomplete yet at this time. 200 to 300 seconds were found toyield the highest results. Longer generation times resulted in lowresults (secondary reactions between iodine and the oil).The duration of the generation time (time between 'adding the KIsolution' and 'adding the water + starting the titration') is thecritical point for repeatable results.
All results shown were obtained with the control parameter set<Normal>.
Remarks
R = (Q-Bl)*C/mC=1,Factor = 1000, meq/kg
Calculation
Method for the determination of the peroxide value in oil, fat and margarine.
Standard Potassium iodate, KIO3 0.1 mol/L
P. BurriAuthor
58
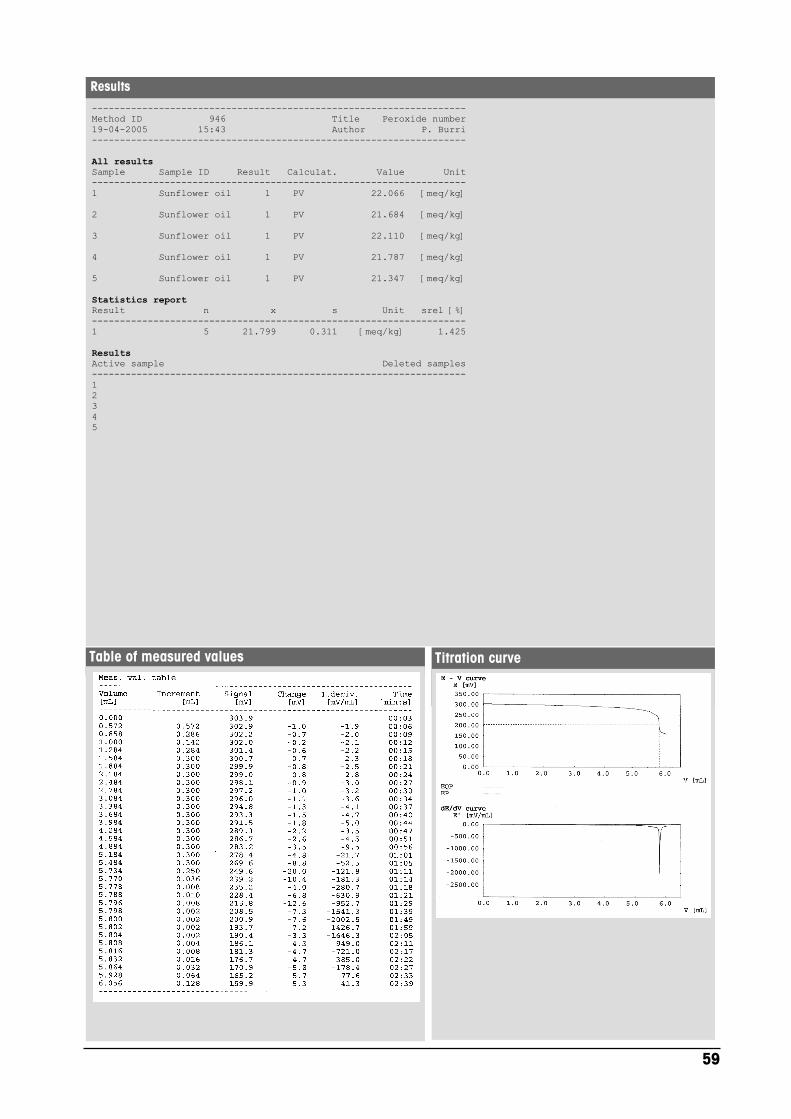
Table of measured values
-------------------------------------------------------------------Method ID 946 Title Peroxide number19-04-2005 15:43 Author P. Burri-------------------------------------------------------------------
All resultsSample Sample ID Result Calculat. Value Unit-------------------------------------------------------------------1 Sunflower oil 1 PV 22.066 [meq/kg]
2 Sunflower oil 1 PV 21.684 [meq/kg]
3 Sunflower oil 1 PV 22.110 [meq/kg]
4 Sunflower oil 1 PV 21.787 [meq/kg]
5 Sunflower oil 1 PV 21.347 [meq/kg]
Statistics reportResult n x s Unit srel [%]-------------------------------------------------------------------1 5 21.799 0.311 [meq/kg] 1.425
ResultsActive sample Deleted samples-------------------------------------------------------------------12345
Titration curve
Results
59

Method ID 946 Title Peroxide number19-04-2005 15:43 Author P. Burri
Sample para. Sample ID . . . . . . . . . . . . . Olive oil Entry type . . . . . . . . . . . . Mass Minimum [g] . . . . . . . . . . . . 0.5 Maximum [g] . . . . . . . . . . . . 20 Density [g/mL] . . . . . . . . . . 1.0 Mol.m. [g/mol] . . . . . . . . . . 1.00 Equival. number z . . . . . . . . . 1 Temp.sensor . . . . . . . . . . . . Manual Temp. [°C] . . . . . . . . . . . . 25.0Stir Speed [%] . . . . . . . . . . . . . 35 Mixing time [s] . . . . . . . . . . 3EQP titration Titrant . . . . . . . . . . . . . . Na2S2O3 0.01 Conc.[mol/L] . . . . . . . . . . 0.01 Sensor . . . . . . . . . . . . . . DM140 Unit . . . . . . . . . . . . . . mV Blank . . . . . . . . . . . . . . . From list Solvent . . . . . . . . . . . . Peroxide number Predis.[mL] . . . . . . . . . . . . 1.000 Back value [mmol] . . . . . . . . . 0.00 Control parameters Set of parameters . . . . . . . Normal Addition . . . . . . . . . . . . Dynamic dE(set) [mV] . . . . . . . . . . 8 dVmin [mL] . . . . . . . . . . . 0.002 dVmax [mL] . . . . . . . . . . . 0.3 Measure mode . . . . . . . . . . EQU controlled dE[mV] . . . . . . . . . . . . . 1 dt[s] . . . . . . . . . . . . . 2 t(min) [s] . . . . . . . . . . . 3 t(max) [s] . . . . . . . . . . . 30 Recognition Tendency . . . . . . . . . . . . Negative Min Relevance . . . . . . . . . 30 Threshold [mV/mL]. . . . . . . . 500 St. jump only . . . . . . . . . No Termination param. Numb. EQPs . . . . . . . . . . . 1 Vmax [mL] . . . . . . . . . . . 20.0 Evaluation Numb. Potentials . . . . . . . . 0Calculation 1 Calculation . . . . . . . . . . . . User def. Name . . . . . . . . . . . . . . . PN Formula . . . . . . . . . . . . . . R=(Q-Bl)*C/m C . . . . . . . . . . . . . . . . . 1 Factor . . . . . . . . . . . . . . 1000 Unit . . . . . . . . . . . . . . . meq/kg Which EQP . . . . . . . . . . . . . 1 Decimal places . . . . . . . . . . 2 Result limits . . . . . . . . . . . No Statistics . . . . . . . . . . . . YesCalculation 2 Calculation . . . . . . . . . . . . NoneCalculation 3 Calculation . . . . . . . . . . . . NoneReport Output . . . . . . . . . . . . . . Printer Results . . . . . . . . . . . . . . GLP Meas. val. table . . . . . . . . . Yes E - V curve . . . . . . . . . . . . Yes dE/dV curve . . . . . . . . . . . . Yes
MethodOther Control parameters
Set of parameters . . . . . . . Fast Addition . . . . . . . . . . . . Dynamic dE(set) [mV] . . . . . . . . . . 8 dVmin [mL] . . . . . . . . . . . 0.002 dVmax [mL] . . . . . . . . . . . 0.3 Measure mode . . . . . . . . . . EQU controlled dE[mV] . . . . . . . . . . . . . 1 dt[s] . . . . . . . . . . . . . 1 t(min) [s] . . . . . . . . . . . 2 t(max) [s] . . . . . . . . . . . 20
Set of parameters . . . . . . . Cautious Addition . . . . . . . . . . . . Dynamic dE(set) [mV] . . . . . . . . . . 6 dVmin [mL] . . . . . . . . . . . 0.002 dVmax [mL] . . . . . . . . . . . 0.3 Measure mode . . . . . . . . . . EQU controlled dE[mV] . . . . . . . . . . . . . 0.5 dt[s] . . . . . . . . . . . . . 2 t(min) [s] . . . . . . . . . . . 3 t(max) [s] . . . . . . . . . . . 40
60

M347
Magnesium (Mg2+) and calcium(Ca2+) as CaCO3, M=100.09; z = 1
--
EDTA,c(EDTA) = 0.1 mol/L
DL22 F&B, DL28OKI B4250 Printer(parallel cable ME-51108780)
Ca2+ + EDTA-2H+ = Ca-EDTA + 2H+
Mg2+ + EDTA-2H+ = Mg-EDTA + 2H+
Titration beakers ME-101974
METTLER TOLEDO
Neutralization with hydrochloric acidbefore final disposal.
Wastedisposal
Preparation and Procedures50 mL drinking or surface waterSample
Substance
Chemicals
Titrant
Instruments
Results
Chemistry
Accessories
DP5TM, wavelength 660 nm.Indication
Total hardness of water
1) Add 1 mL indicator (0.1% Eriochrome black T solution inethanol)
2) Add 10 mL 5% NH3 buffer solution. May use borate bufferinstead; Borate puffer pH10: Dissolve 40 g sodium hydroxide(NaOH) in 500 mL water (Caution: Solution gets hot!), add 65g boric acid (H3BO3) and fill up to 1000 mL with water.
3) Rinse with 0.01 mol/L hydrochloric acid if there is indicatorresidue on the DP5 mirror
4) Rinse with water.
Add the NH3 buffer only immediately beforetitration.
Always check the transmission of the phototrode in deion. waterbefore titrating: set it to 1000 mV.Avoid the formation of air bubbles during titration since theydisturb the photometric indication.The phototrode DP5 can be set to 550 nm instead of 660.
Literature:
1) Titration Applications Brochure 5,"Determination of the Total Hardness, the Ca2+ and Mg2+
Content" ME-51724634 (see applications M069, M513,M514).
Remarks
The total hardness (magnesium andcalcium) is expressed as calciumcarbonate (CaCO3).1 ppm CaCO3 = 1°US (USAhardness degree);10 mg/L CaCO3 = 1°f (Frenchhardness degree).
Calculation
The total hardness, Ca2+ and Mg2+ content of water is determined by titrating calcium and magnesium at pH10 with EDTA. The color change of the Erio T indicator (violet to blue) at the equivalence point is sensed bya phototrode.
Standard Zinc sulfate solution 0.1 mol/L
M. BiberAuthor
61

Table of measured values
-------------------------------------------------------------------Method ID 947 Title Total hardness08-04-2005 11:17 Author M. Biber-------------------------------------------------------------------
All resultsSample Sample ID Result Calculat. Value Unit-------------------------------------------------------------------1 Water 1 Cont. 214.65 [ppm]
2 Water 1 Cont. 214.61 [ppm]
3 Water 1 Cont. 214.41 [ppm]
4 Water 1 Cont. 214.00 [ppm]
5 Water 1 Cont. 214.63 [ppm]
Statistics reportResult n x s Unit srel [%]-------------------------------------------------------------------1 5 214.40 0.259 [ppm] 0.121
ResultsActive sample Deleted samples-------------------------------------------------------------------12345
Titration curve
Results
62

Method ID 947 Title Total Hardness08-04-2005 11:17 Author M. Biber
Sample para. Sample ID . . . . . . . . . . . . . . . Water Entry type . . . . . . . . . . . . . . Volume Volume [mL] . . . . . . . . . . . . . . 50.0 Density [g/mL] . . . . . . . . . . . . 1.0 Mol.m. [g/mol] . . . . . . . . . . . . 100.09 Equival. number z . . . . . . . . . . . 1 Temp.sensor . . . . . . . . . . . . . . Manual Temp. [°C] . . . . . . . . . . . . . . 25.0Stir Speed [%] . . . . . . . . . . . . . . . 35 Mixing time [s] . . . . . . . . . . . . 3EQP titration Titrant . . . . . . . . . . . . . . . . EDTA 0.1 Conc.[mol/L] . . . . . . . . . . . . 0.1 Sensor . . . . . . . . . . . . . . . . DP5 Unit . . . . . . . . . . . . . . . . mV Blank . . . . . . . . . . . . . . . . . Entry Value [mmol] . . . . . . . . . . . . 0.00 Predis.[mL] . . . . . . . . . . . . . . 0.500 Back value [mmol] . . . . . . . . . . . 0.00 Control parameters Set of parameters . . . . . . . . . User Addition . . . . . . . . . . . . . . Incremental Increment . . . . . . . . . . . . . 0.02 Measure mode . . . . . . . . . . . . EQU controlled dE[mV] . . . . . . . . . . . . . . . 1.0 dt[s] . . . . . . . . . . . . . . . 1 t(min) [s] . . . . . . . . . . . . . 3 t(max) [s] . . . . . . . . . . . . . 30 Recognition Tendency . . . . . . . . . . . . . . none Min Relevance . . . . . . . . . . . 30 Threshold . . . . . . . . . . . . . 1000.0 Termination param. Numb. EQPs . . . . . . . . . . . . . 1 Vmax [mL] . . . . . . . . . . . . . 10.0 Evaluation No. of potentials . . . . . . . . . 0Calculation 1 Calculation . . . . . . . . . . . . . . Cont. Type . . . . . . . . . . . . . . . . . Cont. Unit . . . . . . . . . . . . . . . . . ppm Which EQP . . . . . . . . . . . . . . . 1 Decimal places . . . . . . . . . . . . 2 Result limits . . . . . . . . . . . . . No Statistics . . . . . . . . . . . . . . YesCalculation 2 Calculation . . . . . . . . . . . . . . NoneReport Output . . . . . . . . . . . . . . . . Printer Results . . . . . . . . . . . . . . . . GLP Meas. val. table . . . . . . . . . . . Yes E - V curve . . . . . . . . . . . . . . Yes dE/dV curve . . . . . . . . . . . . . . Yes
MethodOther Control parameters
Set of parameters . . . . . . . . . Fast Addition . . . . . . . . . . . . . . Incremental Increment . . . . . . . . . . . . . 0.04 Measure mode . . . . . . . . . . . . EQU controlled dE[mV] . . . . . . . . . . . . . . . 2.0 dt[s] . . . . . . . . . . . . . . . 1 t(min) [s] . . . . . . . . . . . . . 3 t(max) [s] . . . . . . . . . . . . . 20
Set of parameters . . . . . . . . . Cautious Addition . . . . . . . . . . . . . . Incremental Increment . . . . . . . . . . . . . 0.01 Measure mode . . . . . . . . . . . . EQU controlled dE[mV] . . . . . . . . . . . . . . . 0.5 dt[s] . . . . . . . . . . . . . . . 2 t(min) [s] . . . . . . . . . . . . . 5 t(max) [s] . . . . . . . . . . . . . 40
63

M348a
--
--
Sodium hydroxide, NaOHc(NaOH) = 0.1 mol/L
DL22 F&B, DL28OKI B4250 Printer(parallel cable ME-51108780)
HCl + NaOH = NaCl + H2O
Titration beakers ME-101974
METTLER TOLEDO
Neutralize the slightly alkaline wastebefore disposal.
Wastedisposal
Preparation and Procedures50 mL tap waterSample
Substance
Chemicals
Titrant
Instruments
Results
Chemistry
Accessories
DG115-SCIndication
p-Value of Water
Before the analysis a three-point calibration of the electrode wasperformed using METTLER TOLEDO buffers of pH 4.01, 7.00and 9.21.
Fill a (preferably) PE bottle to the brim with the water to beanalyzed. Keep it closed and at sampling temperature.Pour 50 mL into the titration beaker shortly before each titration.If there is no automatic temperature compensation, enter thecorrect temperature manually.For best results if the pH lies close to the end potential, use alower concentration of the corresponding titrant.
p values are determined in many different samples e.g. drinkingwater, waste water, caustic wash solutions.
p value, or total acidity, expresses the base neutralizing capacityof the water.
The name p value originates from the phenolphthalein indicatorformerly used in this titration. Phenolphthalein turns pink at pH8.2 and above.
The pH value and the acid and base capacity depend on theequilibrium of free CO2, bicarbonate, and carbonate in thecorresponding water and therefore on its temperature.
Remarks
Total acidity or phenolphthalein acidity (p value)is expressed in mg/L CaCO3 or mmol/L.
Calculation
The p value of water is determined by an EQP titration to pH 8.20 with sodium hydroxide.
Standard Potassium hydrogen phthalate
M. BiberAuthor
64

Table of measured values
-------------------------------------------------------------------Method ID 948 Title p value in water07-03-2005 11:08 Author M. Biber-------------------------------------------------------------------
All resultsSample Sample ID Result Calculat. Value Unit-------------------------------------------------------------------1 water 1 Cont. 0.285 mmol/L
2 water 1 Cont. 0.244 mmol/L
3 water 1 Cont. 0.241 mmol/L
4 water 1 Cont. 0.242 mmol/L
5 water 1 Cont. 0.234 mmol/L
Statistics reportResult n x s Unit srel [%]-------------------------------------------------------------------1 5 0.249 0.021 mmol/L 8.271
ResultsActive sample Deleted samples-------------------------------------------------------------------12345
Titration curve
Results
65
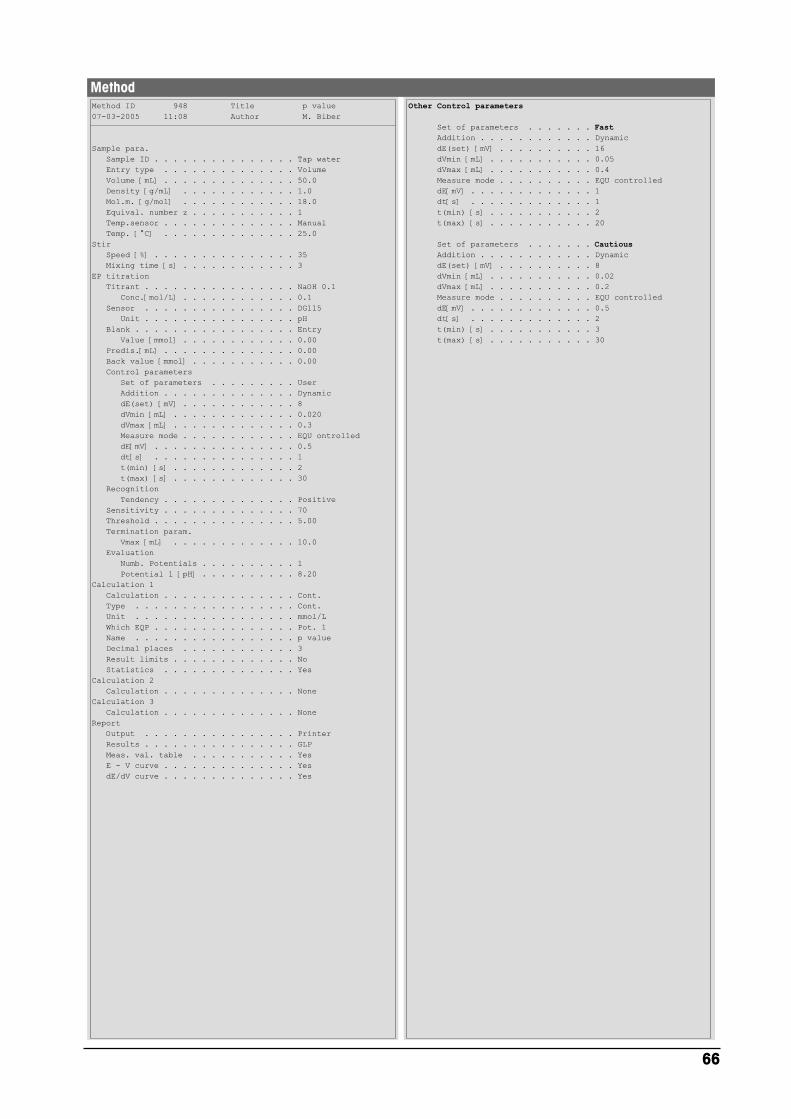
Method ID 948 Title p value07-03-2005 11:08 Author M. Biber
Sample para. Sample ID . . . . . . . . . . . . . . . Tap water Entry type . . . . . . . . . . . . . . Volume Volume [mL] . . . . . . . . . . . . . . 50.0 Density [g/mL] . . . . . . . . . . . . 1.0 Mol.m. [g/mol] . . . . . . . . . . . . 18.0 Equival. number z . . . . . . . . . . . 1 Temp.sensor . . . . . . . . . . . . . . Manual Temp. [°C] . . . . . . . . . . . . . . 25.0Stir Speed [%] . . . . . . . . . . . . . . . 35 Mixing time [s] . . . . . . . . . . . . 3EP titration Titrant . . . . . . . . . . . . . . . . NaOH 0.1 Conc.[mol/L] . . . . . . . . . . . . 0.1 Sensor . . . . . . . . . . . . . . . . DG115 Unit . . . . . . . . . . . . . . . . pH Blank . . . . . . . . . . . . . . . . . Entry Value [mmol] . . . . . . . . . . . . 0.00 Predis.[mL] . . . . . . . . . . . . . . 0.00 Back value [mmol] . . . . . . . . . . . 0.00 Control parameters Set of parameters . . . . . . . . . User Addition . . . . . . . . . . . . . . Dynamic dE(set) [mV] . . . . . . . . . . . . 8 dVmin [mL] . . . . . . . . . . . . . 0.020 dVmax [mL] . . . . . . . . . . . . . 0.3 Measure mode . . . . . . . . . . . . EQU ontrolled dE[mV] . . . . . . . . . . . . . . . 0.5 dt[s] . . . . . . . . . . . . . . . 1 t(min) [s] . . . . . . . . . . . . . 2 t(max) [s] . . . . . . . . . . . . . 30 Recognition Tendency . . . . . . . . . . . . . . Positive Sensitivity . . . . . . . . . . . . . . 70 Threshold . . . . . . . . . . . . . . . 5.00 Termination param. Vmax [mL] . . . . . . . . . . . . . 10.0 Evaluation Numb. Potentials . . . . . . . . . . 1 Potential 1 [pH] . . . . . . . . . . 8.20Calculation 1 Calculation . . . . . . . . . . . . . . Cont. Type . . . . . . . . . . . . . . . . . Cont. Unit . . . . . . . . . . . . . . . . . mmol/L Which EQP . . . . . . . . . . . . . . . Pot. 1 Name . . . . . . . . . . . . . . . . . p value Decimal places . . . . . . . . . . . . 3 Result limits . . . . . . . . . . . . . No Statistics . . . . . . . . . . . . . . YesCalculation 2 Calculation . . . . . . . . . . . . . . NoneCalculation 3 Calculation . . . . . . . . . . . . . . NoneReport Output . . . . . . . . . . . . . . . . Printer Results . . . . . . . . . . . . . . . . GLP Meas. val. table . . . . . . . . . . . Yes E - V curve . . . . . . . . . . . . . . Yes dE/dV curve . . . . . . . . . . . . . . Yes
MethodOther Control parameters
Set of parameters . . . . . . . Fast Addition . . . . . . . . . . . . Dynamic dE(set) [mV] . . . . . . . . . . 16 dVmin [mL] . . . . . . . . . . . 0.05 dVmax [mL] . . . . . . . . . . . 0.4 Measure mode . . . . . . . . . . EQU controlled dE[mV] . . . . . . . . . . . . . 1 dt[s] . . . . . . . . . . . . . 1 t(min) [s] . . . . . . . . . . . 2 t(max) [s] . . . . . . . . . . . 20
Set of parameters . . . . . . . Cautious Addition . . . . . . . . . . . . Dynamic dE(set) [mV] . . . . . . . . . . 8 dVmin [mL] . . . . . . . . . . . 0.02 dVmax [mL] . . . . . . . . . . . 0.2 Measure mode . . . . . . . . . . EQU controlled dE[mV] . . . . . . . . . . . . . 0.5 dt[s] . . . . . . . . . . . . . 2 t(min) [s] . . . . . . . . . . . 3 t(max) [s] . . . . . . . . . . . 30
66

M348b
--
--
Hydrochloric acid, HClc(HCl) = 0.1 mol/L
DL22 F&B, DL28OKI B4250 Printer(parallel cable ME-51108780)
HCl + NaOH = NaCl + H2O
HCl + CO32- = HCO3
- + Cl-
HCl + HCO3- = CO2 + H2O + Cl-
Titration beakers ME-101974
METTLER TOLEDO
Neutralize the slightly alkaline wastebefore disposal.
Wastedisposal
Preparation and Procedures50 mL tap waterSample
Substance
Chemicals
Titrant
Instruments
Results
Chemistry
Accessories
DG115-SCIndication
m-Value of Water
Before the analysis a three-point calibration of the electrode wasperformed using METTLER TOLEDO buffers of pH 4.01, 7.00and 9.21.
Fill a (preferably) PE bottle to the brim with the water to beanalyzed. Keep it closed and at sampling temperature.Pour 50 mL into the titration beaker shortly before each titration.If there is no automatic temperature compensation, enter thecorrect temperature manually.For best results if the pH lies close to the end potential, use alower concentration of the corresponding titrant.
The m value, or total alkalinity, represents the acid neutralizingcapacity of a water and is determined in many different samplese.g. drinking water, waste water, caustic wash solutions.
This acid capacity allows surface waters to resist suddenchanges in pH, e.g. due to organic acid waste, acid minedrainage, groundwater discharge or industrial waste, or due tonatural sources such as bacteria, Fe3+, hydrated Al3+, H2S, fattyacids, proteins, phosphoric acid, and CO2.
The acid capacity depends on the equilibrium of free CO2,bicarbonate, and carbonate in the corresponding water andtherefore on its temperature.Mineral weathering buffers groundwaters, e.g. limestone rockCaCO3 (s) + CO2 (g) = Ca2+ (aq) + 2 HCO3
- (aq)The bicarbonate ion then acts as a base to neutralize acids:HCO3
- (aq) + H+ (aq) = CO2 (g) + H2O (l)
The name m value originates from the methyl orange indicator(red to yellow-orange at pH 4.3) formerly used in this titration.
Increased acidity can affect corrosion, soil leaching, disinfectionprocesses, and aquatic life in general.
References:http://nas.cl.uh.edu/zhang/3431_04S/05_Acid-Base.ppt
Remarks
Total alkalinity or methyl orangealkalinity (m value) is expressed asmg/L CaCO3 or mmol/L
Calculation
The m value of water is determined by an EQP titration to pH 4.30 with hydrochloric acid.
Standard Tris(hydroxymethyl)-aminomethane
M. BiberAuthor
67

Table of measured values
-------------------------------------------------------------------Method ID 948 Title m value in water19-03-2005 08:39 Author M. Biber-------------------------------------------------------------------
All resultsSample Sample ID Result Calculat. Value Unit-------------------------------------------------------------------1 water 1 Cont. 3.821 mmol/L
2 water 1 Cont. 3.819 mmol/L
3 water 1 Cont. 3.831 mmol/L
4 water 1 Cont. 3.822 mmol/L
5 water 1 Cont. 3.832 mmol/L
Statistics reportResult n x s Unit srel [%]-------------------------------------------------------------------1 5 3.825 0.006 mmol/L 0.153
ResultsActive sample Deleted samples-------------------------------------------------------------------12345
Titration curve
Results
68

Method ID 948 Title m value19-03-2005 08:39 Author M. Biber
Sample para. Sample ID . . . . . . . . . . . . . . . Tap water Entry type . . . . . . . . . . . . . . Volume Volume [mL] . . . . . . . . . . . . . . 50.0 Density [g/mL] . . . . . . . . . . . . 1.0 Mol.m. [g/mol] . . . . . . . . . . . . 18.0 Equival. number z . . . . . . . . . . . 1 Temp.sensor . . . . . . . . . . . . . . Manual Temp. [°C] . . . . . . . . . . . . . . 25.0Stir Speed [%] . . . . . . . . . . . . . . . 35 Mixing time [s] . . . . . . . . . . . . 3EP titration Titrant . . . . . . . . . . . . . . . . HCl 0.1 Conc.[mol/L] . . . . . . . . . . . . 0.1 Sensor . . . . . . . . . . . . . . . . DG115 Unit . . . . . . . . . . . . . . . . pH Blank . . . . . . . . . . . . . . . . . Entry Value [mmol] . . . . . . . . . . . . 0.00 Predis.[mL] . . . . . . . . . . . . . . 0.00 Back value [mmol] . . . . . . . . . . . 0.00 Control parameters Set of parameters . . . . . . . . . User Addition . . . . . . . . . . . . . . Dynamic dE(set) [mV] . . . . . . . . . . . . 8 dVmin [mL] . . . . . . . . . . . . . 0.020 dVmax [mL] . . . . . . . . . . . . . 0.3 Measure mode . . . . . . . . . . . . EQU ontrolled dE[mV] . . . . . . . . . . . . . . . 0.5 dt[s] . . . . . . . . . . . . . . . 1 t(min) [s] . . . . . . . . . . . . . 2 t(max) [s] . . . . . . . . . . . . . 30 Recognition Tendency . . . . . . . . . . . . . . Positive Sensitivity . . . . . . . . . . . . . . 70 Threshold . . . . . . . . . . . . . . . 5.00 Termination param. Vmax [mL] . . . . . . . . . . . . . 10.0 Evaluation Numb. Potentials . . . . . . . . . 1 Potential 1 [pH] . . . . . . . . . . 4.30Calculation 1 Calculation . . . . . . . . . . . . . . Cont. Type . . . . . . . . . . . . . . . . . Cont. Unit . . . . . . . . . . . . . . . . . mmol/L Which EQP . . . . . . . . . . . . . . . Pot. 1 Name . . . . . . . . . . . . . . . . . m value Decimal places . . . . . . . . . . . . 3 Result limits . . . . . . . . . . . . . No Statistics . . . . . . . . . . . . . . YesCalculation 2 Calculation . . . . . . . . . . . . . . NoneCalculation 3 Calculation . . . . . . . . . . . . . . NoneReport Output . . . . . . . . . . . . . . . . Printer Results . . . . . . . . . . . . . . . . GLP Meas. val. table . . . . . . . . . . . Yes E - V curve . . . . . . . . . . . . . . Yes dE/dV curve . . . . . . . . . . . . . . Yes
MethodOther Control parameters
Set of parameters . . . . . . . Fast Addition . . . . . . . . . . . . Dynamic dE(set) [mV] . . . . . . . . . . 16 dVmin [mL] . . . . . . . . . . . 0.05 dVmax [mL] . . . . . . . . . . . 0.4 Measure mode . . . . . . . . . . EQU controlled dE[mV] . . . . . . . . . . . . . 1 dt[s] . . . . . . . . . . . . . 1 t(min) [s] . . . . . . . . . . . 2 t(max) [s] . . . . . . . . . . . 20
Set of parameters . . . . . . . Cautious Addition . . . . . . . . . . . . Dynamic dE(set) [mV] . . . . . . . . . . 8 dVmin [mL] . . . . . . . . . . . 0.02 dVmax [mL] . . . . . . . . . . . 0.2 Measure mode . . . . . . . . . . EQU controlled dE[mV] . . . . . . . . . . . . . 0.5 dt[s] . . . . . . . . . . . . . 2 t(min) [s] . . . . . . . . . . . 3 t(max) [s] . . . . . . . . . . . 30
69
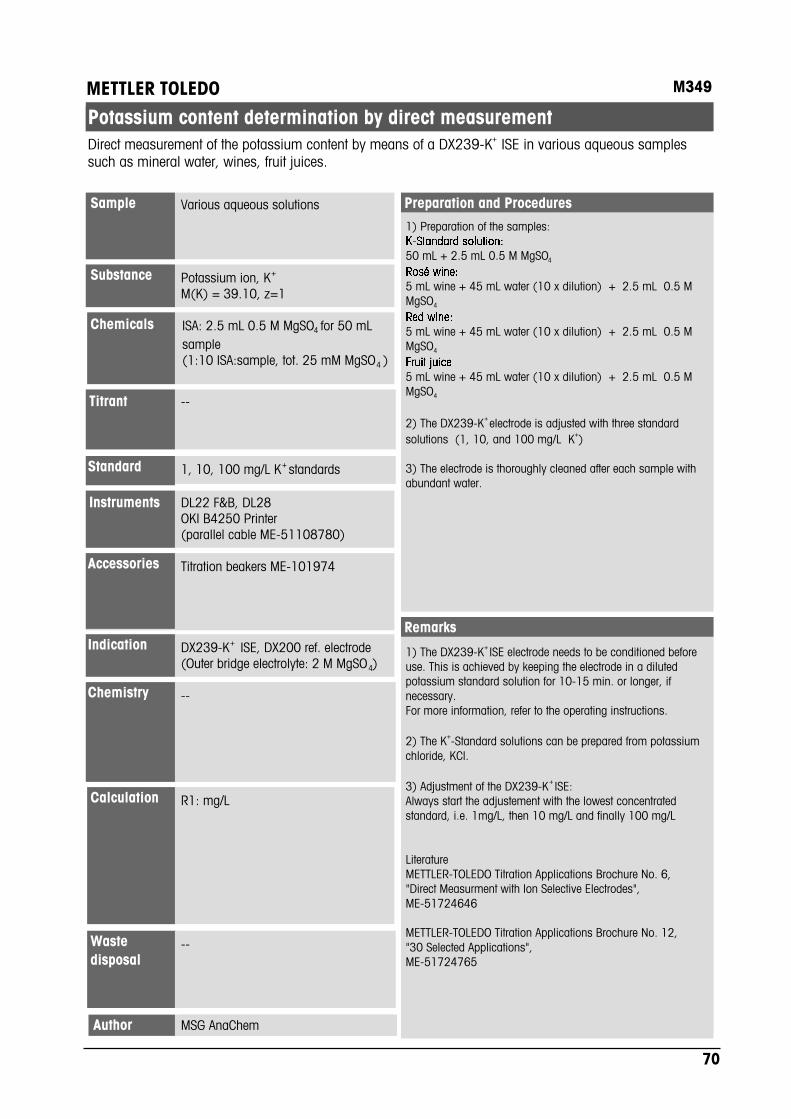
M349
Potassium ion, K+
M(K) = 39.10, z=1
ISA: 2.5 mL 0.5 M MgSO4 for 50 mLsample(1:10 ISA:sample, tot. 25 mM MgSO4 )
--
DL22 F&B, DL28OKI B4250 Printer(parallel cable ME-51108780)
--
Titration beakers ME-101974
METTLER TOLEDO
--Wastedisposal
Preparation and ProceduresVarious aqueous solutionsSample
Substance
Chemicals
Titrant
Instruments
Results
Chemistry
Accessories
DX239-K+ ISE, DX200 ref. electrode(Outer bridge electrolyte: 2 M MgSO4)
Indication
Potassium content determination by direct measurement
1) Preparation of the samples:
50 mL + 2.5 mL 0.5 M MgSO4
5 mL wine + 45 mL water (10 x dilution) + 2.5 mL 0.5 MMgSO4
5 mL wine + 45 mL water (10 x dilution) + 2.5 mL 0.5 MMgSO4
5 mL wine + 45 mL water (10 x dilution) + 2.5 mL 0.5 MMgSO4
2) The DX239-K+ electrode is adjusted with three standardsolutions (1, 10, and 100 mg/L K+)
3) The electrode is thoroughly cleaned after each sample withabundant water.
1) The DX239-K+ ISE electrode needs to be conditioned beforeuse. This is achieved by keeping the electrode in a dilutedpotassium standard solution for 10-15 min. or longer, ifnecessary.For more information, refer to the operating instructions.
2) The K+-Standard solutions can be prepared from potassiumchloride, KCl.
3) Adjustment of the DX239-K+ ISE:Always start the adjustement with the lowest concentratedstandard, i.e. 1mg/L, then 10 mg/L and finally 100 mg/L
LiteratureMETTLER-TOLEDO Titration Applications Brochure No. 6,"Direct Measurment with Ion Selective Electrodes",ME-51724646
METTLER-TOLEDO Titration Applications Brochure No. 12,"30 Selected Applications",ME-51724765
Remarks
R1: mg/LCalculation
Direct measurement of the potassium content by means of a DX239-K+ ISE in various aqueous samplessuch as mineral water, wines, fruit juices.
Standard 1, 10, 100 mg/L K+ standards
MSG AnaChemAuthor
70

Table of measured values
-------------------------------------------------------------------Method ID 949 Title Potassium content00-00-0000 00:00 Author-------------------------------------------------------------------All resultsSample Sample ID Result Calculat. Value Unit-------------------------------------------------------------------1 Rose wine 1 Messwert 239.568 [mg/L]
2 Rose wine 1 Messwert 240.297 [mg/L]
3 Rose wine 1 Messwert 240.297 [mg/L]
4 Rose wine 1 Messwert 241.028 [mg/L]
5 Rose wine 1 Messwert 241.761 [mg/L]
6 Rose wine 1 Messwert 242.496 [mg/L]Statistics reportResult n x s Unit srel [%]-------------------------------------------------------------------1 6 240.908 1.078 [mg/L] 0.447
ResultsActive sample Deleted samples-------------------------------------------------------------------123456
Other samplesRed wine:Statistics reportResult n x s Unit srel [%]-------------------------------------------------------------------1 6 248.211 0.778 [mg/L] 0.314
Fruit juice:Statistics reportResult n x s Unit srel [%]-------------------------------------------------------------------1 7 505.775 0.000 [mg/L] 0.000
K+-solution (approx. 200 mg/L):Statistics reportResult n x s Unit srel [%]-------------------------------------------------------------------1 6 236 804 2 378 [mg/L] 1 004
Titration curve
Results
71

Method ID 949 Title Potassium content00-00-0000 00:00
Sample para. Sample ID . . . . . . . . . . . . . . . Request Entry type . . . . . . . . . . . . . . Mass Minimum [g] . . . . . . . . . . . . . . 0.01 Maximum [g] . . . . . . . . . . . . . . 10.0 Density [g/mL] . . . . . . . . . . . . 1.0 Mol.m. [g/mol] . . . . . . . . . . . . 1.00 Equival. number z . . . . . . . . . . . 1 Temp.sensor . . . . . . . . . . . . . . Manual Temp. [°C] . . . . . . . . . . . . . . 25.0Stir Speed [%] . . . . . . . . . . . . . . . 35 Mixing time [s] . . . . . . . . . . . . 10Measure Sensor . . . . . . . . . . . . . . . . DX239 Unit . . . . . . . . . . . . . . . . mV dE [mV] . . . . . . . . . . . . . . . . 0.5 dt [s] . . . . . . . . . . . . . . . . 1 t(min) [s] . . . . . . . . . . . . . . 100 t(max) [s] . . . . . . . . . . . . . . 120Calculation 1 Calculation . . . . . . . . . . . . . . User def. Name . . . . . . . . . . . . . . . . . Messwert Formula . . . . . . . . . . . . . . . . R=pw(-pX)*1000 C . . . . . . . . . . . . . . . . . . . 1.0 Factor . . . . . . . . . . . . . . . . 1.0 Unit . . . . . . . . . . . . . . . . . mg/L Decimal places . . . . . . . . . . . . 3 Result limits . . . . . . . . . . . . . No Statistics . . . . . . . . . . . . . . YesCalculation 2 Calculation . . . . . . . . . . . . . . NoneCalculation 3 Calculation . . . . . . . . . . . . . . NoneReport Output . . . . . . . . . . . . . . . . Printer Results . . . . . . . . . . . . . . . . GLP
Method
72

M380
Acidic content in oil as mg KOH/g oilM = 56.11 g/mol, z = 1
60 mL solvent 664toluene/2-propanol/water= 500:495:5
Potassium hydroxide,KOH in 2-propanolc(KOH) = 0.1 mol/L
DL28OKI B4250 Printer(parallel cable ME-51108780)
--
Titration beaker ME-101974
METTLER TOLEDO
Organic solventsWastedisposal
Preparation and ProceduresMotor oil, ca. 5 g.Sample
Substance
Chemicals
Titrant
Instruments
Results
Chemistry
Accessories
DG113-SCIndication
TAN Acid number determination according to ASTM D664
Sample size depends on the expected AN:
AN expected Sample sizemg KOH/g0.05 - 0.9 20 g1.0 - 5.0 5 g5.0 - 19 1 g20 - 100 0.25 g100 - 200 0.1 g
Well homogenized sample is very important.
Before the analysis determine the buffer potential, using MERCKbuffer pH 11
Remarks
R1: AN (mg/g) EQPR2: SAN (mg/g) bufferpotential 1R3: AN (mg/g) bufferpotential 2
Calculation
Determination Acid number in mineraloil according ASTM D664
Standard Potassium hydrogen phthalate, 80 mg
A. AichertAuthor
73

Table of measured values
-------------------------------------------------------------------Method ID 980 Title TAN ASTM 66408-03-2005 15:02 Author A. Aichert-------------------------------------------------------------------
All resultsSample Sample ID Result Calculat. Value Unit-------------------------------------------------------------------1 Oil 1 Cont.w.B 1.687 [mg/g] 2 Cont.w.B -0.059 [mg/g] 3 Cont.w.B 2.750 [mg/g]
2 Oil 1 Cont.w.B 1.433 [mg/g] 2 Cont.w.B -0.065 [mg/g] 3 Cont.w.B 2.806 [mg/g]
3 Oil 1 Cont.w.B 1.396 [mg/g] 2 Cont.w.B -0.060 [mg/g] 3 Cont.w.B 2.640 [mg/g]
4 Oil 1 Cont.w.B 1.482 [mg/g] 2 Cont.w.B -0.042 [mg/g] 3 Cont.w.B 2.592 [mg/g]Statistics reportResult n x s Unit srel [%]-------------------------------------------------------------------1 4 1.500 0.130 [mg/g] 8.6722 4 -0.056 0.010 [mg/g] 17.8343 4 2.697 0.098 [mg/g] 3.640
ResultsActive sample Deleted samples-------------------------------------------------------------------1234
Titration curve
Results
74
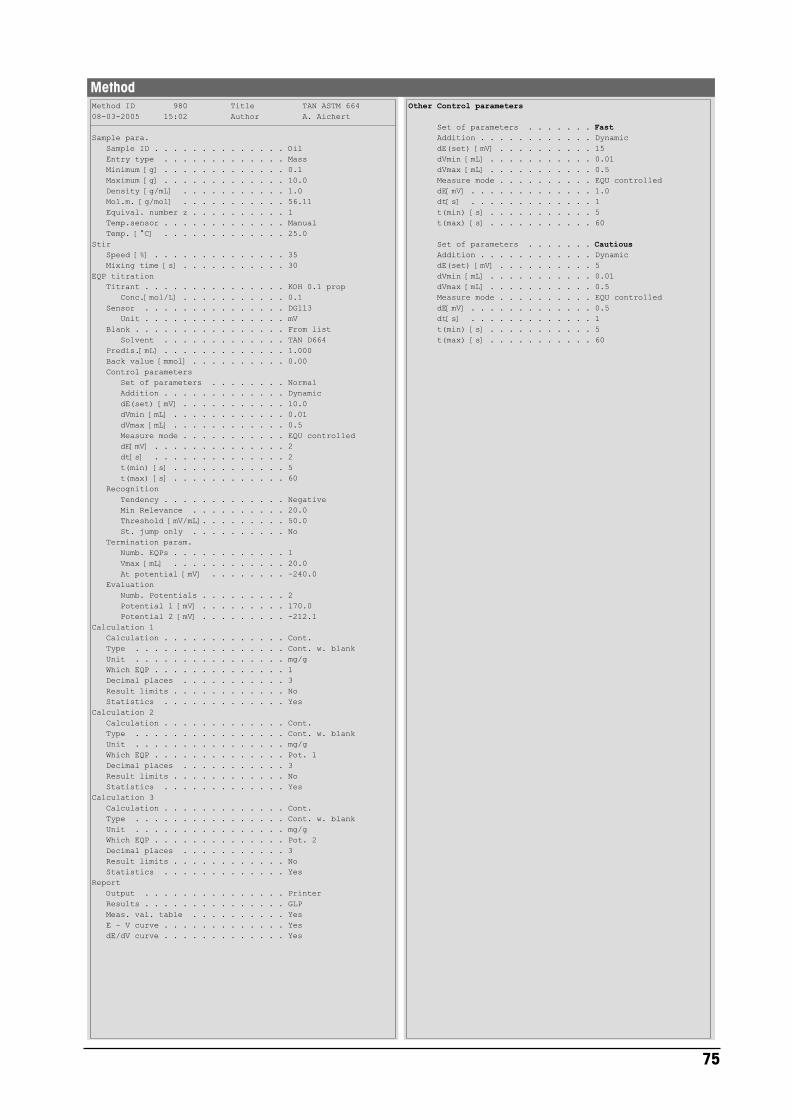
Method ID 980 Title TAN ASTM 66408-03-2005 15:02 Author A. Aichert
Sample para. Sample ID . . . . . . . . . . . . . . Oil Entry type . . . . . . . . . . . . . Mass Minimum [g] . . . . . . . . . . . . . 0.1 Maximum [g] . . . . . . . . . . . . . 10.0 Density [g/mL] . . . . . . . . . . . 1.0 Mol.m. [g/mol] . . . . . . . . . . . 56.11 Equival. number z . . . . . . . . . . 1 Temp.sensor . . . . . . . . . . . . . Manual Temp. [°C] . . . . . . . . . . . . . 25.0Stir Speed [%] . . . . . . . . . . . . . . 35 Mixing time [s] . . . . . . . . . . . 30EQP titration Titrant . . . . . . . . . . . . . . . KOH 0.1 prop Conc.[mol/L] . . . . . . . . . . . 0.1 Sensor . . . . . . . . . . . . . . . DG113 Unit . . . . . . . . . . . . . . . mV Blank . . . . . . . . . . . . . . . . From list Solvent . . . . . . . . . . . . . TAN D664 Predis.[mL] . . . . . . . . . . . . . 1.000 Back value [mmol] . . . . . . . . . . 0.00 Control parameters Set of parameters . . . . . . . . Normal Addition . . . . . . . . . . . . . Dynamic dE(set) [mV] . . . . . . . . . . . 10.0 dVmin [mL] . . . . . . . . . . . . 0.01 dVmax [mL] . . . . . . . . . . . . 0.5 Measure mode . . . . . . . . . . . EQU controlled dE[mV] . . . . . . . . . . . . . . 2 dt[s] . . . . . . . . . . . . . . 2 t(min) [s] . . . . . . . . . . . . 5 t(max) [s] . . . . . . . . . . . . 60 Recognition Tendency . . . . . . . . . . . . . Negative Min Relevance . . . . . . . . . . 20.0 Threshold [mV/mL]. . . . . . . . . 50.0 St. jump only . . . . . . . . . . No Termination param. Numb. EQPs . . . . . . . . . . . . 1 Vmax [mL] . . . . . . . . . . . . 20.0 At potential [mV] . . . . . . . . -240.0 Evaluation Numb. Potentials . . . . . . . . . 2 Potential 1 [mV] . . . . . . . . . 170.0 Potential 2 [mV] . . . . . . . . . -212.1Calculation 1 Calculation . . . . . . . . . . . . . Cont. Type . . . . . . . . . . . . . . . . Cont. w. blank Unit . . . . . . . . . . . . . . . . mg/g Which EQP . . . . . . . . . . . . . . 1 Decimal places . . . . . . . . . . . 3 Result limits . . . . . . . . . . . . No Statistics . . . . . . . . . . . . . YesCalculation 2 Calculation . . . . . . . . . . . . . Cont. Type . . . . . . . . . . . . . . . . Cont. w. blank Unit . . . . . . . . . . . . . . . . mg/g Which EQP . . . . . . . . . . . . . . Pot. 1 Decimal places . . . . . . . . . . . 3 Result limits . . . . . . . . . . . . No Statistics . . . . . . . . . . . . . YesCalculation 3 Calculation . . . . . . . . . . . . . Cont. Type . . . . . . . . . . . . . . . . Cont. w. blank Unit . . . . . . . . . . . . . . . . mg/g Which EQP . . . . . . . . . . . . . . Pot. 2 Decimal places . . . . . . . . . . . 3 Result limits . . . . . . . . . . . . No Statistics . . . . . . . . . . . . . YesReport Output . . . . . . . . . . . . . . . Printer Results . . . . . . . . . . . . . . . GLP Meas. val. table . . . . . . . . . . Yes E - V curve . . . . . . . . . . . . . Yes dE/dV curve . . . . . . . . . . . . . Yes
MethodOther Control parameters
Set of parameters . . . . . . . Fast Addition . . . . . . . . . . . . Dynamic dE(set) [mV] . . . . . . . . . . 15 dVmin [mL] . . . . . . . . . . . 0.01 dVmax [mL] . . . . . . . . . . . 0.5 Measure mode . . . . . . . . . . EQU controlled dE[mV] . . . . . . . . . . . . . 1.0 dt[s] . . . . . . . . . . . . . 1 t(min) [s] . . . . . . . . . . . 5 t(max) [s] . . . . . . . . . . . 60
Set of parameters . . . . . . . Cautious Addition . . . . . . . . . . . . Dynamic dE(set) [mV] . . . . . . . . . . 5 dVmin [mL] . . . . . . . . . . . 0.01 dVmax [mL] . . . . . . . . . . . 0.5 Measure mode . . . . . . . . . . EQU controlled dE[mV] . . . . . . . . . . . . . 0.5 dt[s] . . . . . . . . . . . . . 1 t(min) [s] . . . . . . . . . . . 5 t(max) [s] . . . . . . . . . . . 60
75
M381
--
--
Potassium hydroxide, KOH in 2-propanol;c(KOH) = 0.1 mol/L
DL28OKI B4250 Printer(parallel cable ME-51108780)
--
Titration beakers ME-101974
METTLER TOLEDO
Organic solventsWastedisposal
Preparation and Procedures60 mL solvent 664toluene/2-propanol/water= 500:495:5
Sample
Substance
Chemicals
Titrant
Instruments
Results
Chemistry
Accessories
DG113-SCIndication
TAN Blank determination according to ASTM D664
1) Before the analysis determine the buffer potential, usingMERCK buffer pH 11
2) Run it as blank determination, so the blank value isautomatically stored in the list of blank values.
Remarks
Consumption in mmol.Calculation
Method for the TAN blank determination according ASTM D664
Standard Potassium hydrogen phthalate, 80 mg
A.AichertAuthor
76

Table of measured values
-------------------------------------------------------------------Method ID 981 Title Blank TAN ASTM 66407-03-2005 14:54 Author A.Aichert-------------------------------------------------------------------
All resultsSample Sample ID Result Calculat. Value Unit-------------------------------------------------------------------1 Solvent 664 1 Blank 0.00495 [mmol]
2 Solvent 664 1 Blank 0.00478 [mmol]
3 Solvent 664 1 Blank 0.00489 [mmol]
Statistics reportResult n x s Unit srel [%]-------------------------------------------------------------------1 3 0.00487 0.00009 [mmol] 1.745
ResultsActive sample Deleted samples-------------------------------------------------------------------123
Titration curve
Results
77

Method ID 981 Title Blank TAN ASTM 66407-03-2005 14:54 Author A. Aichert
Sample para. Sample ID . . . . . . . . . . . . . . . Solvent 664 Entry type . . . . . . . . . . . . . . Volume Volume [mL] . . . . . . . . . . . . . . 60.0 Density [g/mL] . . . . . . . . . . . . 1.0 Mol.m. [g/mol] . . . . . . . . . . . . 56.11 Equival. number z . . . . . . . . . . . 1 Temp.sensor . . . . . . . . . . . . . . Manual Temp. [°C] . . . . . . . . . . . . . . 25.0Stir Speed [%] . . . . . . . . . . . . . . . 35 Mixing time [s] . . . . . . . . . . . . 10EP titration Titrant . . . . . . . . . . . . . . . . KOH 0.1 prop Conc.[mol/L] . . . . . . . . . . . . 0.1 Sensor . . . . . . . . . . . . . . . . DG113 Unit . . . . . . . . . . . . . . . . mV Blank . . . . . . . . . . . . . . . . . Entry Value [mmol] . . . . . . . . . . . . 0.00 Predis.[mL] . . . . . . . . . . . . . . 0.00 Back value [mmol] . . . . . . . . . . . 0.00 Control parameters Set of parameters . . . . . . . . . Normal Addition . . . . . . . . . . . . . . Dynamic dE(set) [mV] . . . . . . . . . . . . 10.0 dVmin [mL] . . . . . . . . . . . . . 0.004 dVmax [mL] . . . . . . . . . . . . . 0.05 Measure mode . . . . . . . . . . . . EQU controlled dE[mV] . . . . . . . . . . . . . . . 2 dt[s] . . . . . . . . . . . . . . . 2 t(min) [s] . . . . . . . . . . . . . 5 t(max) [s] . . . . . . . . . . . . . 60 Recognition Tendency . . . . . . . . . . . . . . Negative Termination param. Vmax [mL] . . . . . . . . . . . . . 2.0 Evaluation Numb. EPs . . . . . . . . . . . . . 1 End point 1 . . . . . . . . . . . . Absolute Potential 1 [pH] . . . . . . . . . . -208.1Calculation 1 Calculation . . . . . . . . . . . . . . Consump. Unit . . . . . . . . . . . . . . . . . mmol Which EQP . . . . . . . . . . . . . . . 1 Decimal places . . . . . . . . . . . . 5 Result limits . . . . . . . . . . . . . No Statistics . . . . . . . . . . . . . . YesCalculation 2 Calculation . . . . . . . . . . . . . . NoneCalculation 3 Calculation . . . . . . . . . . . . . . NoneReport Output . . . . . . . . . . . . . . . . Printer Results . . . . . . . . . . . . . . . . GLP Meas. val. table . . . . . . . . . . . Yes E - V curve . . . . . . . . . . . . . . Yes dE/dV curve . . . . . . . . . . . . . . Yes
MethodOther Control parameters
Control parameters Set of parameters . . . . . . . . . Fast Addition . . . . . . . . . . . . . . Dynamic dE(set) [mV] . . . . . . . . . . . . 15.0 dVmin [mL] . . . . . . . . . . . . . 0.004 dVmax [mL] . . . . . . . . . . . . . 0.05 Measure mode . . . . . . . . . . . . EQU controlled dE[mV] . . . . . . . . . . . . . . . 1 dt[s] . . . . . . . . . . . . . . . 1 t(min) [s] . . . . . . . . . . . . . 5 t(max) [s] . . . . . . . . . . . . . 60
Control parameters Set of parameters . . . . . . . . . Cautions Addition . . . . . . . . . . . . . . Incremental Increment . . . . . . . . . . . . . 0.002 Measure mode . . . . . . . . . . . . EQU controlled dE[mV] . . . . . . . . . . . . . . . 0.5 dt[s] . . . . . . . . . . . . . . . 1 t(min) [s] . . . . . . . . . . . . . 15 t(max) [s] . . . . . . . . . . . . . 60
78

M382
Acid capacity in oil as mg KOH/g oilM = 56.11 g/mol, z = 1
60 mL solvent 4739toluene/2-propanol/chloroform/water=10:10:10:0.3
Hydrochloric acid,HCl in 2-propanolc(HCl) = 0.1 mol/L
DL28OKI B4250 Printer(parallel cable ME-51108780)
--
Titration beaker ME-101974
METTLER TOLEDO
Halogenated organic solventsWastedisposal
Preparation and ProceduresMotor oil, ca. 2.5 g.Sample
Substance
Chemicals
Titrant
Instruments
Results
Chemistry
Accessories
DG113-SCIndication
TBN Base number determination according to ASTM D4739
1) The sample size depends on the expected BN:Sample size (g) = 7 / expected BN
2) Before starting the analysis, it is necessary to determine thebuffer potential using MERCK buffer pH 3
3) Use a well homogenized sample to get accurate results.
Remarks
R1: BN (mg/g) EQPR2: SBN (mg/g) buffer potential 1R3: BN (mg/g) buffer potential 2
Calculation
Determination base number in mineral oil according ASTM D4739
Standard Standardized KOH in 2-propanol
A. AichertAuthor
79
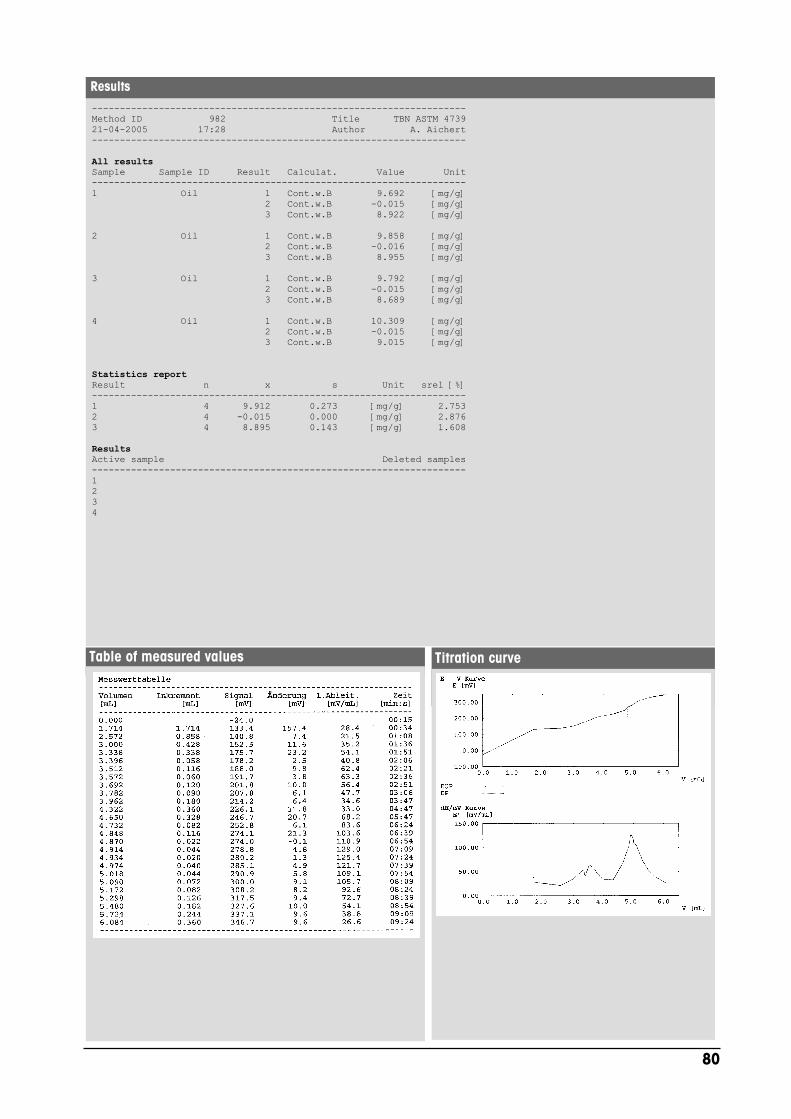
Table of measured values
-------------------------------------------------------------------Method ID 982 Title TBN ASTM 473921-04-2005 17:28 Author A. Aichert-------------------------------------------------------------------
All resultsSample Sample ID Result Calculat. Value Unit-------------------------------------------------------------------1 Oil 1 Cont.w.B 9.692 [mg/g] 2 Cont.w.B -0.015 [mg/g] 3 Cont.w.B 8.922 [mg/g]
2 Oil 1 Cont.w.B 9.858 [mg/g] 2 Cont.w.B -0.016 [mg/g] 3 Cont.w.B 8.955 [mg/g]
3 Oil 1 Cont.w.B 9.792 [mg/g] 2 Cont.w.B -0.015 [mg/g] 3 Cont.w.B 8.689 [mg/g]
4 Oil 1 Cont.w.B 10.309 [mg/g] 2 Cont.w.B -0.015 [mg/g] 3 Cont.w.B 9.015 [mg/g]
Statistics reportResult n x s Unit srel [%]-------------------------------------------------------------------1 4 9.912 0.273 [mg/g] 2.7532 4 -0.015 0.000 [mg/g] 2.8763 4 8.895 0.143 [mg/g] 1.608
ResultsActive sample Deleted samples-------------------------------------------------------------------1234
Titration curve
Results
80

Method ID 982 Title TAN ASTM 473921-04-2005 17:28 Author A. Aichert
Sample para. Sample ID . . . . . . . . . . . . . . Oil Entry type . . . . . . . . . . . . . Mass Minimum [g] . . . . . . . . . . . . . 0.1 Maximum [g] . . . . . . . . . . . . . 10.0 Density [g/mL] . . . . . . . . . . . 1.0 Mol.m. [g/mol] . . . . . . . . . . . 56.11 Equival. number z . . . . . . . . . . 1 Temp.sensor . . . . . . . . . . . . . Manual Temp. [°C] . . . . . . . . . . . . . 25.0Stir Speed [%] . . . . . . . . . . . . . . 35 Mixing time [s] . . . . . . . . . . . 30EQP titration Titrant . . . . . . . . . . . . . . . HCl 0.1 prop Conc.[mol/L] . . . . . . . . . . . 0.1 Sensor . . . . . . . . . . . . . . . DG113 Unit . . . . . . . . . . . . . . . mV Blank . . . . . . . . . . . . . . . . From list Solvent . . . . . . . . . . . . . TAN D4739 Predis.[mL] . . . . . . . . . . . . . 3.000 Back value [mmol] . . . . . . . . . . 0.00 Control parameters Set of parameters . . . . . . . . Normal Addition . . . . . . . . . . . . . Dynamic dE(set) [mV] . . . . . . . . . . . 10.0 dVmin [mL] . . . . . . . . . . . . 0.01 dVmax [mL] . . . . . . . . . . . . 0.4 Measure mode . . . . . . . . . . . EQU controlled dE[mV] . . . . . . . . . . . . . . 1 dt[s] . . . . . . . . . . . . . . 3 t(min) [s] . . . . . . . . . . . . 15 t(max) [s] . . . . . . . . . . . . 60 Recognition Tendency . . . . . . . . . . . . . Positive Min Relevance . . . . . . . . . . 20.0 Threshold [mV/mL]. . . . . . . . . 90.0 St. jump only . . . . . . . . . . No Termination param. Numb. EQPs . . . . . . . . . . . . 1 Vmax [mL] . . . . . . . . . . . . 20.0 At potential [mV] . . . . . . . . 250.0 Evaluation Numb. Potentials . . . . . . . . . 2 Potential 1 [mV] . . . . . . . . . -208.00 Potential 2 [mV] . . . . . . . . . 233.0Calculation 1 Calculation . . . . . . . . . . . . . Cont. Type . . . . . . . . . . . . . . . . Cont. w. blank Unit . . . . . . . . . . . . . . . . mg/g Which EQP . . . . . . . . . . . . . . 1 Decimal places . . . . . . . . . . . 3 Result limits . . . . . . . . . . . . No Statistics . . . . . . . . . . . . . YesCalculation 2 Calculation . . . . . . . . . . . . . Cont. Type . . . . . . . . . . . . . . . . Cont. w. blank Unit . . . . . . . . . . . . . . . . mg/g Which EQP . . . . . . . . . . . . . . Pot. 1 Decimal places . . . . . . . . . . . 3 Result limits . . . . . . . . . . . . No Statistics . . . . . . . . . . . . . YesCalculation 3 Calculation . . . . . . . . . . . . . Cont. Type . . . . . . . . . . . . . . . . Cont. w. blank Unit . . . . . . . . . . . . . . . . mg/g Which EQP . . . . . . . . . . . . . . Pot. 2 Decimal places . . . . . . . . . . . 3 Result limits . . . . . . . . . . . . No Statistics . . . . . . . . . . . . . YesReport Output . . . . . . . . . . . . . . . Printer Results . . . . . . . . . . . . . . . GLP Meas. val. table . . . . . . . . . . Yes E - V curve . . . . . . . . . . . . . Yes dE/dV curve . . . . . . . . . . . . . Yes
MethodOther Control parameters
Set of parameters . . . . . . . Fast Addition . . . . . . . . . . . . Dynamic dE(set) [mV] . . . . . . . . . . 15 dVmin [mL] . . . . . . . . . . . 0.01 dVmax [mL] . . . . . . . . . . . 0.5 Measure mode . . . . . . . . . . EQU controlled dE[mV] . . . . . . . . . . . . . 1.0 dt[s] . . . . . . . . . . . . . 1 t(min) [s] . . . . . . . . . . . 5 t(max) [s] . . . . . . . . . . . 60
Set of parameters . . . . . . . Cautious Addition . . . . . . . . . . . . Dynamic dE(set) [mV] . . . . . . . . . . 8 dVmin [mL] . . . . . . . . . . . 0.01 dVmax [mL] . . . . . . . . . . . 0.2 Measure mode . . . . . . . . . . EQU controlled dE[mV] . . . . . . . . . . . . . 0.5 dt[s] . . . . . . . . . . . . . 6 t(min) [s] . . . . . . . . . . . 30 t(max) [s] . . . . . . . . . . . 60
81
M383
--
--
Hydrochloric acid,HCl in 2-propanolc(HCl) = 0.1 mol/L;
DL28OKI B4250 Printer(parallel cable ME-51108780)
--
Titration beakers ME-101974
METTLER TOLEDO
Halogenated organic solventsWastedisposal
Preparation and Procedures60 mL solvent 4739toluene/2-propanol/Chloroform/water=10:10:10:0.3
Sample
Substance
Chemicals
Titrant
Instruments
Results
Chemistry
Accessories
DG113-SCIndication
TBN Blank determination according to ASTM D4739
1) Before the analysis determine the buffer potential, usingMERCK buffer pH 3
2) Run it as blank determination, so the blank value isautomatically stored in the list of blank values.
Remarks
Consumption in mmol.Calculation
Method for the TBN blank determination according ASTM D4739
Standard Potassium hydrogen phthalate, 80 mg
A.AichertAuthor
82

Table of measured values
-------------------------------------------------------------------Method ID 983 Title Blank TAN ASTM 473919-04-2005 10:28 Author A.Aichert-------------------------------------------------------------------
All resultsSample Sample ID Result Calculat. Value Unit-------------------------------------------------------------------1 Solvent 4739 1 Blank 0.00081 [mmol]
2 Solvent 4739 1 Blank 0.00078 [mmol]
3 Solvent 4739 1 Blank 0.00079 [mmol]
4 Solvent 4739 1 Blank 0.00077 [mmol]
Statistics reportResult n x s Unit srel [%]-------------------------------------------------------------------1 3 0.00079 0.00002 [mmol] 2.342
ResultsActive sample Deleted samples-------------------------------------------------------------------1234
Titration curve
Results
83
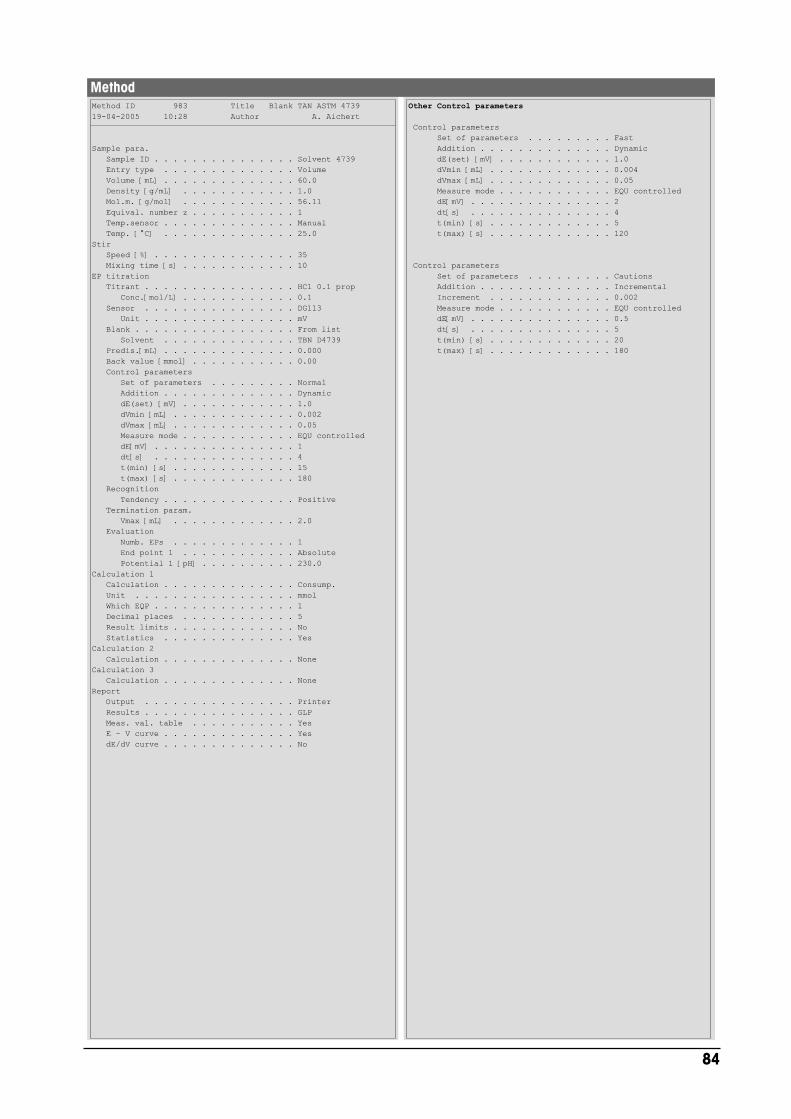
Method ID 983 Title Blank TAN ASTM 473919-04-2005 10:28 Author A. Aichert
Sample para. Sample ID . . . . . . . . . . . . . . . Solvent 4739 Entry type . . . . . . . . . . . . . . Volume Volume [mL] . . . . . . . . . . . . . . 60.0 Density [g/mL] . . . . . . . . . . . . 1.0 Mol.m. [g/mol] . . . . . . . . . . . . 56.11 Equival. number z . . . . . . . . . . . 1 Temp.sensor . . . . . . . . . . . . . . Manual Temp. [°C] . . . . . . . . . . . . . . 25.0Stir Speed [%] . . . . . . . . . . . . . . . 35 Mixing time [s] . . . . . . . . . . . . 10EP titration Titrant . . . . . . . . . . . . . . . . HCl 0.1 prop Conc.[mol/L] . . . . . . . . . . . . 0.1 Sensor . . . . . . . . . . . . . . . . DG113 Unit . . . . . . . . . . . . . . . . mV Blank . . . . . . . . . . . . . . . . . From list Solvent . . . . . . . . . . . . . . TBN D4739 Predis.[mL] . . . . . . . . . . . . . . 0.000 Back value [mmol] . . . . . . . . . . . 0.00 Control parameters Set of parameters . . . . . . . . . Normal Addition . . . . . . . . . . . . . . Dynamic dE(set) [mV] . . . . . . . . . . . . 1.0 dVmin [mL] . . . . . . . . . . . . . 0.002 dVmax [mL] . . . . . . . . . . . . . 0.05 Measure mode . . . . . . . . . . . . EQU controlled dE[mV] . . . . . . . . . . . . . . . 1 dt[s] . . . . . . . . . . . . . . . 4 t(min) [s] . . . . . . . . . . . . . 15 t(max) [s] . . . . . . . . . . . . . 180 Recognition Tendency . . . . . . . . . . . . . . Positive Termination param. Vmax [mL] . . . . . . . . . . . . . 2.0 Evaluation Numb. EPs . . . . . . . . . . . . . 1 End point 1 . . . . . . . . . . . . Absolute Potential 1 [pH] . . . . . . . . . . 230.0Calculation 1 Calculation . . . . . . . . . . . . . . Consump. Unit . . . . . . . . . . . . . . . . . mmol Which EQP . . . . . . . . . . . . . . . 1 Decimal places . . . . . . . . . . . . 5 Result limits . . . . . . . . . . . . . No Statistics . . . . . . . . . . . . . . YesCalculation 2 Calculation . . . . . . . . . . . . . . NoneCalculation 3 Calculation . . . . . . . . . . . . . . NoneReport Output . . . . . . . . . . . . . . . . Printer Results . . . . . . . . . . . . . . . . GLP Meas. val. table . . . . . . . . . . . Yes E - V curve . . . . . . . . . . . . . . Yes dE/dV curve . . . . . . . . . . . . . . No
MethodOther Control parameters
Control parameters Set of parameters . . . . . . . . . Fast Addition . . . . . . . . . . . . . . Dynamic dE(set) [mV] . . . . . . . . . . . . 1.0 dVmin [mL] . . . . . . . . . . . . . 0.004 dVmax [mL] . . . . . . . . . . . . . 0.05 Measure mode . . . . . . . . . . . . EQU controlled dE[mV] . . . . . . . . . . . . . . . 2 dt[s] . . . . . . . . . . . . . . . 4 t(min) [s] . . . . . . . . . . . . . 5 t(max) [s] . . . . . . . . . . . . . 120
Control parameters Set of parameters . . . . . . . . . Cautions Addition . . . . . . . . . . . . . . Incremental Increment . . . . . . . . . . . . . 0.002 Measure mode . . . . . . . . . . . . EQU controlled dE[mV] . . . . . . . . . . . . . . . 0.5 dt[s] . . . . . . . . . . . . . . . 5 t(min) [s] . . . . . . . . . . . . . 20 t(max) [s] . . . . . . . . . . . . . 180
84
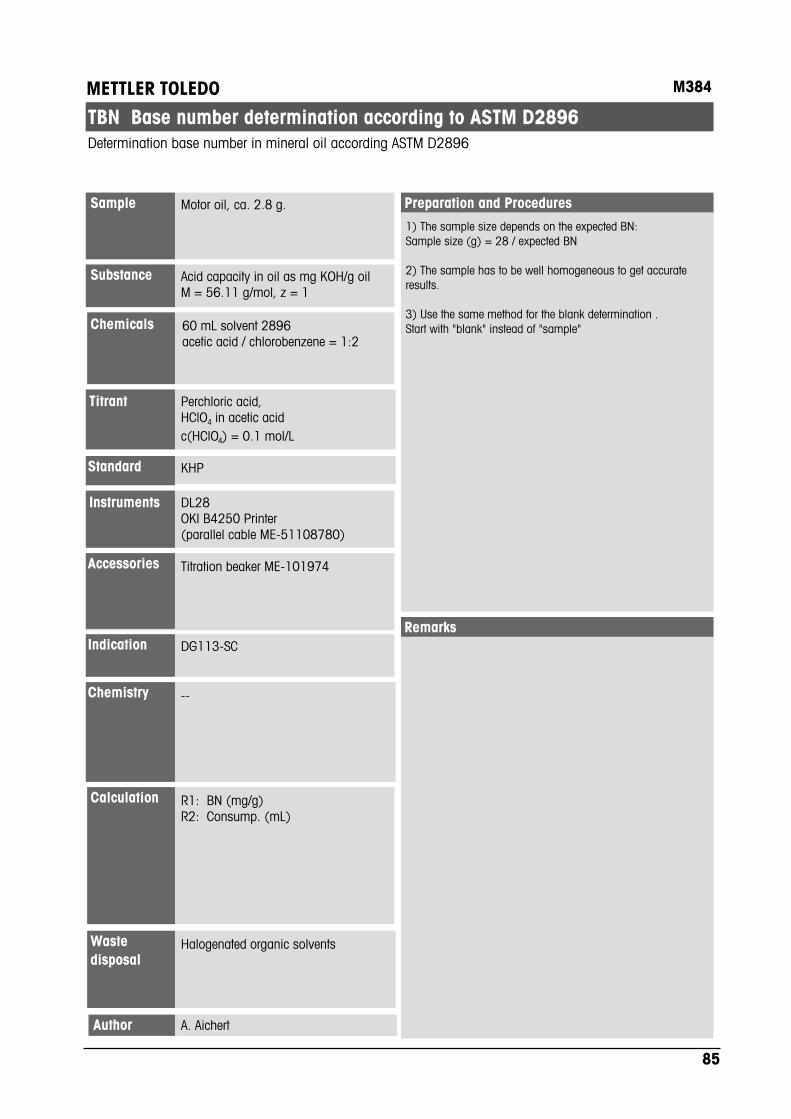
M384
Acid capacity in oil as mg KOH/g oilM = 56.11 g/mol, z = 1
60 mL solvent 2896acetic acid / chlorobenzene = 1:2
Perchloric acid,HClO4 in acetic acidc(HClO4) = 0.1 mol/L
DL28OKI B4250 Printer(parallel cable ME-51108780)
--
Titration beaker ME-101974
METTLER TOLEDO
Halogenated organic solventsWastedisposal
Preparation and ProceduresMotor oil, ca. 2.8 g.Sample
Substance
Chemicals
Titrant
Instruments
Results
Chemistry
Accessories
DG113-SCIndication
TBN Base number determination according to ASTM D2896
1) The sample size depends on the expected BN:Sample size (g) = 28 / expected BN
2) The sample has to be well homogeneous to get accurateresults.
3) Use the same method for the blank determination .Start with "blank" instead of "sample"
Remarks
R1: BN (mg/g)R2: Consump. (mL)
Calculation
Determination base number in mineral oil according ASTM D2896
Standard KHP
A. AichertAuthor
85

Table of measured values
Sample determination-------------------------------------------------------------------Method ID 984 Title TBN ASTM 289618-04-2005 07:33 Author A. Aichert-------------------------------------------------------------------
All resultsSample Sample ID Result Calculat. Value Unit-------------------------------------------------------------------1 Oil 1 Cont.w.B 10.420 [mg/g] 2 Consump. 5.351 [mL]
2 Oil 1 Cont.w.B 10.401 [mg/g] 2 Consump. 5.383 [mL]
3 Oil 1 Cont.w.B 10.440 [mg/g] 2 Consump. 5.396 [mL]
4 Oil 1 Cont.w.B 10.454 [mg/g] 2 Consump. 5.396 [mL]
Statistics reportResult n x s Unit srel [%]-------------------------------------------------------------------1 4 10.429 0.023171 [mg/g] 0.222
Blank determination-------------------------------------------------------------------Method ID 984 Title TBN ASTM 289613-04-2005 13:56 Author A. Aichert-------------------------------------------------------------------
All resultsSample Sample ID Result Calculat. Value Unit-------------------------------------------------------------------1 Oil 1 Blank 0.00143 [mmol] 2 Consump. 0.014 [mL]
2 Oil 1 Cont.w.B 0.00150 [mmol] 2 Consump. 0.015 [mL]
3 Oil 1 Cont.w.B 0.00142 [mg/g] 2 Consump. 0.014 [mL]
Statistics reportResult n x s Unit srel [%]-------------------------------------------------------------------1 3 0.00145 0.00005 [mmol] 3.187
Titration curve
Results
86

Method ID 984 Title TAN ASTM 289618-04-2005 07:33 Author A. Aichert
Sample para. Sample ID . . . . . . . . . . . . . . Oil Entry type . . . . . . . . . . . . . Mass Minimum [g] . . . . . . . . . . . . . 0.1 Maximum [g] . . . . . . . . . . . . . 10.0 Density [g/mL] . . . . . . . . . . . 1.0 Mol.m. [g/mol] . . . . . . . . . . . 56.11 Equival. number z . . . . . . . . . . 1 Temp.sensor . . . . . . . . . . . . . Manual Temp. [°C] . . . . . . . . . . . . . 25.0Stir Speed [%] . . . . . . . . . . . . . . 35 Mixing time [s] . . . . . . . . . . . 60EQP titration Titrant . . . . . . . . . . . . . . . HClO4 0.1 prop Conc.[mol/L] . . . . . . . . . . . 0.1 Sensor . . . . . . . . . . . . . . . DG113 Unit . . . . . . . . . . . . . . . mV Blank . . . . . . . . . . . . . . . . From list Solvent . . . . . . . . . . . . . TAN D2896 Predis.[mL] . . . . . . . . . . . . . 3.000 Back value [mmol] . . . . . . . . . . 0.00 Control parameters Set of parameters . . . . . . . . Normal Addition . . . . . . . . . . . . . Dynamic dE(set) [mV] . . . . . . . . . . . 8.0 dVmin [mL] . . . . . . . . . . . . 0.002 dVmax [mL] . . . . . . . . . . . . 0.3 Measure mode . . . . . . . . . . . EQU controlled dE[mV] . . . . . . . . . . . . . . 0.5 dt[s] . . . . . . . . . . . . . . 1 t(min) [s] . . . . . . . . . . . . 10 t(max) [s] . . . . . . . . . . . . 60 Recognition Tendency . . . . . . . . . . . . . None Min Relevance . . . . . . . . . . 10.0 Threshold [mV/mL]. . . . . . . . . 100.0 St. jump only . . . . . . . . . . No Termination param. Numb. EQPs . . . . . . . . . . . . 1 Vmax [mL] . . . . . . . . . . . . 20.0 Evaluation Numb. Potentials . . . . . . . . . 0Calculation 1 Calculation . . . . . . . . . . . . . Cont. Type . . . . . . . . . . . . . . . . Cont. w. blank Unit . . . . . . . . . . . . . . . . mg/g Which EQP . . . . . . . . . . . . . . 1 Decimal places . . . . . . . . . . . 3 Result limits . . . . . . . . . . . . No Statistics . . . . . . . . . . . . . YesCalculation 2 Calculation . . . . . . . . . . . . . Conump. Type . . . . . . . . . . . . . . . . Cont. w. blank Unit . . . . . . . . . . . . . . . . mL Which EQP . . . . . . . . . . . . . . 1 Decimal places . . . . . . . . . . . 3 Result limits . . . . . . . . . . . . No Statistics . . . . . . . . . . . . . NoReport Output . . . . . . . . . . . . . . . Printer Results . . . . . . . . . . . . . . . GLP Meas. val. table . . . . . . . . . . Yes E - V curve . . . . . . . . . . . . . Yes dE/dV curve . . . . . . . . . . . . . Yes
MethodOther Control parameters
Set of parameters . . . . . . . Fast Addition . . . . . . . . . . . . Dynamic dE(set) [mV] . . . . . . . . . . 11 dVmin [mL] . . . . . . . . . . . 0.002 dVmax [mL] . . . . . . . . . . . 0.5 Measure mode . . . . . . . . . . EQU controlled dE[mV] . . . . . . . . . . . . . 1.0 dt[s] . . . . . . . . . . . . . 1 t(min) [s] . . . . . . . . . . . 7 t(max) [s] . . . . . . . . . . . 60
Set of parameters . . . . . . . Cautious Addition . . . . . . . . . . . . Dynamic dE(set) [mV] . . . . . . . . . . 6 dVmin [mL] . . . . . . . . . . . 0.002 dVmax [mL] . . . . . . . . . . . 0.2 Measure mode . . . . . . . . . . EQU controlled dE[mV] . . . . . . . . . . . . . 0.5 dt[s] . . . . . . . . . . . . . 2 t(min) [s] . . . . . . . . . . . 15 t(max) [s] . . . . . . . . . . . 60
87

M385
Cu2+, M = 63.546 g/mol, z=1
1-2 g potassium iodide, KI50 mL 0.1 mol/L hydrochloric acid,
Sodium thiosulphate, Na2S2O3
c(Na2S2O3) = 0.1 mol/L
DL28OKI B4250 Printer(parallel cable ME-51108780)
2 Cu2+ + 4I- = 2 CuI + I2
I2 + 2S2O32- = 2I- + S4O6
2-
Titration beakers ME-101974
METTLER TOLEDO
Neutralization before final disposal asspecial waste.
Wastedisposal
Preparation and ProceduresAqueous copper solution, 5 mL(conc.: 0.1 mol/L)
Sample
Substance
Chemicals
Titrant
Instruments
Results
Chemistry
Accessories
DM140-SCIndication
Copper content determination in aqueous solutions
1) Add 1-2 g potassium iodide to the sample beaker containingthe sample,
2) Add 50 mL 0.1 mol/L HCl,
3) Iodine is immediately generated after addition of hydrochloricacid,
4) To avoid loss of iodine, a low stirrer speed is applied (30%).
5) The electrode, the stirrer and the titration tube are cleanedwith deionized water. If needed, these parts are cleaned with apaper tissue.
Literature:
1) Titration Applications Brochure 12, "30 Selected Applications"ME-51724765 (see applications M509 and M510).
2) Titration Applications Brochure 18, "Standardizations ofTitrants", ME-51724917 (see application M526).
Remarks
R1: Content (g/L)R2: Consumption (mL)R3: Content (mol/L)
Calculation
The determination of copper in electroplating baths is perfomed by titration of generated iodine with sodiumthiosulphate after addition of iodide to the sample.
Standard Potassium iodate, 20-30 mg
C. De CaroAuthor
88

Table of measured values
EQP titration------------------------------------------------------------------------------Method ID 985 Title Cu cont. normal10-02-2005 15:59 Author C. De Caro------------------------------------------------------------------------------Titrant Na2S2O3 0.1 Sensor DM140Conc.[mol/L] 0.1 Unit mV------------------------------------------------------------------------------Sample 6Sample ID 0.1 M Cu solutionVolume V [mL] 5Density [g/mL] 1.0Mol.m. [g/mol] 63.546Equival. number z 1Predisp.[mL] 1Mixing time [s] 90Init.pot. [mV] 340.6Consumption [mV] 5.610Duration [min:s] 3:20Temp.[°C] 25.0Termination param. All points reachedBlank [mmol] 0.00Black value [mmol] 0.00
Result EQP Calculat. Value Unit------------------------------------------------------------------------------1 1 Cont. 6.3141 [g/L]2 1 Consumpt. 4.968 [mL]3 1 Cont. 0.0994 [mol/L]
Statistics reportResult n x s Unit srel------------------------------------------------------------------------------1 6 6.2975 0.0116 [g/L] 0.184 [%]2 6 4.955 0.009 [mL] 0.183 [%]3 6 0.0991 0.0002 [mol/L] 0.187 [%]
Titration curve
Results
89

Method ID 985 Title Cu cont. normal10-02-2005 15:59 Author C. De Caro
Sample para. Sample ID . . . . . . . . . . . . . . . 0.1M Cu solution Entry type . . . . . . . . . . . . . . Volume Volume [mL] . . . . . . . . . . . . . . 5 Density [g/mL] . . . . . . . . . . . . 1.0 Mol.m. [g/mol] . . . . . . . . . . . . 63.546 Equival. number z . . . . . . . . . . . 1 Temp.sensor . . . . . . . . . . . . . . Manual Temp. [°C] . . . . . . . . . . . . . . 25.0Stir Speed [%] . . . . . . . . . . . . . . . 30 Mixing time [s] . . . . . . . . . . . . 90EQP titration Titrant . . . . . . . . . . . . . . . . Na2S2O3 0.1 Conc.[mol/L] . . . . . . . . . . . . 0.1 Sensor . . . . . . . . . . . . . . . . DM140 Unit . . . . . . . . . . . . . . . . mV Blank . . . . . . . . . . . . . . . . . Entry Value [mmol] . . . . . . . . . . . . 0.00 Predis.[mL] . . . . . . . . . . . . . . 1 Back value [mmol] . . . . . . . . . . . 0.00 Control parameters Set of parameters . . . . . . . . . User Addition . . . . . . . . . . . . . . Dynamic dE(set) [mV] . . . . . . . . . . . . 8 dVmin [mL] . . . . . . . . . . . . . 0.01 dVmax [mL] . . . . . . . . . . . . . 0.5 Measure mode . . . . . . . . . . . . EQU controlled dE[mV] . . . . . . . . . . . . . . . 1 dt[s] . . . . . . . . . . . . . . . 3 t(min) [s] . . . . . . . . . . . . . 3 t(max) [s] . . . . . . . . . . . . . 30 Recognition Tendency . . . . . . . . . . . . . . Negative Min. relevance . . . . . . . . . . . 30 Threshold [mV/mL] . . . . . . . . . 500.0 St. Jump only . . . . . . . . . . . No Termination param. Vmax [mL] . . . . . . . . . . . . . 10.0 Evaluation Numb. EQP's . . . . . . . . . . . . 1 Number Potentials . . . . . . . . . 0Calculation 1 Calculation . . . . . . . . . . . . . . Cont. Type . . . . . . . . . . . . . . . . . Cont. Unit . . . . . . . . . . . . . . . . . g/L Which EQP . . . . . . . . . . . . . . . 1 Decimal places . . . . . . . . . . . . 4 Result limits . . . . . . . . . . . . . No Statistics . . . . . . . . . . . . . . YesCalculation 2 Calculation . . . . . . . . . . . . . . Consumpt. Unit . . . . . . . . . . . . . . . . . g/L Which EQP . . . . . . . . . . . . . . . 1 Decimal places . . . . . . . . . . . . 3 Result limits . . . . . . . . . . . . . No Statistics . . . . . . . . . . . . . . YesCalculation 3 Calculation . . . . . . . . . . . . . . Cont. Type . . . . . . . . . . . . . . . . . Cont. Unit . . . . . . . . . . . . . . . . . mol/L Which EQP . . . . . . . . . . . . . . . 1 Decimal places . . . . . . . . . . . . 4 Result limits . . . . . . . . . . . . . No Statistics . . . . . . . . . . . . . . YesReport Output . . . . . . . . . . . . . . . . Printer Results . . . . . . . . . . . . . . . . GLP Meas. val. table . . . . . . . . . . . Yes E - V curve . . . . . . . . . . . . . . Yes dE/dV curve . . . . . . . . . . . . . . Yes
MethodOther Control parameters
Set of parameters . . . . . . . Fast Addition . . . . . . . . . . . . Dynamic dE(set) [mV] . . . . . . . . . . 8 dVmin [mL] . . . . . . . . . . . 0.01 dVmax [mL] . . . . . . . . . . . 0.5 Measure mode . . . . . . . . . . EQU controlled dE[mV] . . . . . . . . . . . . . 1 dt[s] . . . . . . . . . . . . . 2 t(min) [s] . . . . . . . . . . . 3 t(max) [s] . . . . . . . . . . . 20
Set of parameters . . . . . . . Cautious Addition . . . . . . . . . . . . Dynamic dE(set) [mV] . . . . . . . . . . 6 dVmin [mL] . . . . . . . . . . . 0.01 dVmax [mL] . . . . . . . . . . . 0.5 Measure mode . . . . . . . . . . EQU controlled dE[mV] . . . . . . . . . . . . . 1 dt[s] . . . . . . . . . . . . . 5 t(min) [s] . . . . . . . . . . . 3 t(max) [s] . . . . . . . . . . . 30
90
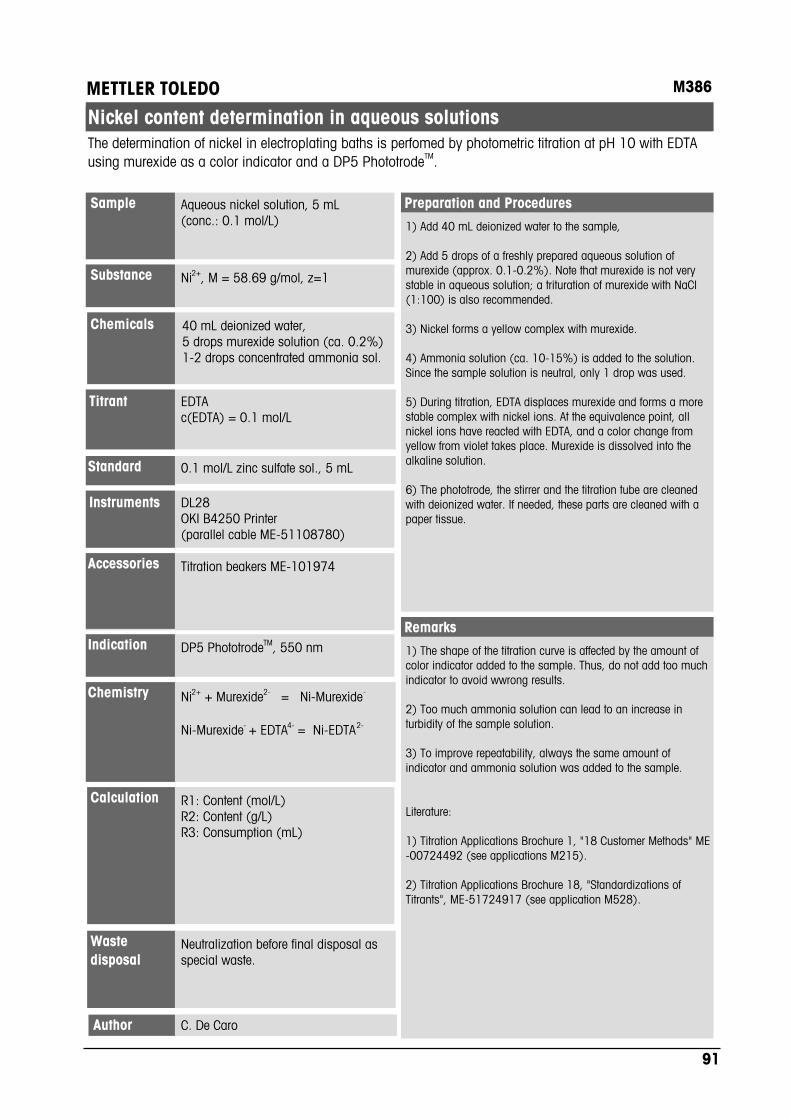
M386
Ni2+, M = 58.69 g/mol, z=1
40 mL deionized water,5 drops murexide solution (ca. 0.2%)1-2 drops concentrated ammonia sol.
EDTAc(EDTA) = 0.1 mol/L
DL28OKI B4250 Printer(parallel cable ME-51108780)
Ni2+ + Murexide2- = Ni-Murexide-
Ni-Murexide- + EDTA4- = Ni-EDTA2-
Titration beakers ME-101974
METTLER TOLEDO
Neutralization before final disposal asspecial waste.
Wastedisposal
Preparation and ProceduresAqueous nickel solution, 5 mL(conc.: 0.1 mol/L)
Sample
Substance
Chemicals
Titrant
Instruments
Results
Chemistry
Accessories
DP5 PhototrodeTM, 550 nmIndication
Nickel content determination in aqueous solutions
1) Add 40 mL deionized water to the sample,
2) Add 5 drops of a freshly prepared aqueous solution ofmurexide (approx. 0.1-0.2%). Note that murexide is not verystable in aqueous solution; a trituration of murexide with NaCl(1:100) is also recommended.
3) Nickel forms a yellow complex with murexide.
4) Ammonia solution (ca. 10-15%) is added to the solution.Since the sample solution is neutral, only 1 drop was used.
5) During titration, EDTA displaces murexide and forms a morestable complex with nickel ions. At the equivalence point, allnickel ions have reacted with EDTA, and a color change fromyellow from violet takes place. Murexide is dissolved into thealkaline solution.
6) The phototrode, the stirrer and the titration tube are cleanedwith deionized water. If needed, these parts are cleaned with apaper tissue.
1) The shape of the titration curve is affected by the amount ofcolor indicator added to the sample. Thus, do not add too muchindicator to avoid wwrong results.
2) Too much ammonia solution can lead to an increase inturbidity of the sample solution.
3) To improve repeatability, always the same amount ofindicator and ammonia solution was added to the sample.
Literature:
1) Titration Applications Brochure 1, "18 Customer Methods" ME-00724492 (see applications M215).
2) Titration Applications Brochure 18, "Standardizations ofTitrants", ME-51724917 (see application M528).
Remarks
R1: Content (mol/L)R2: Content (g/L)R3: Consumption (mL)
Calculation
The determination of nickel in electroplating baths is perfomed by photometric titration at pH 10 with EDTAusing murexide as a color indicator and a DP5 PhototrodeTM.
Standard 0.1 mol/L zinc sulfate sol., 5 mL
C. De CaroAuthor
91
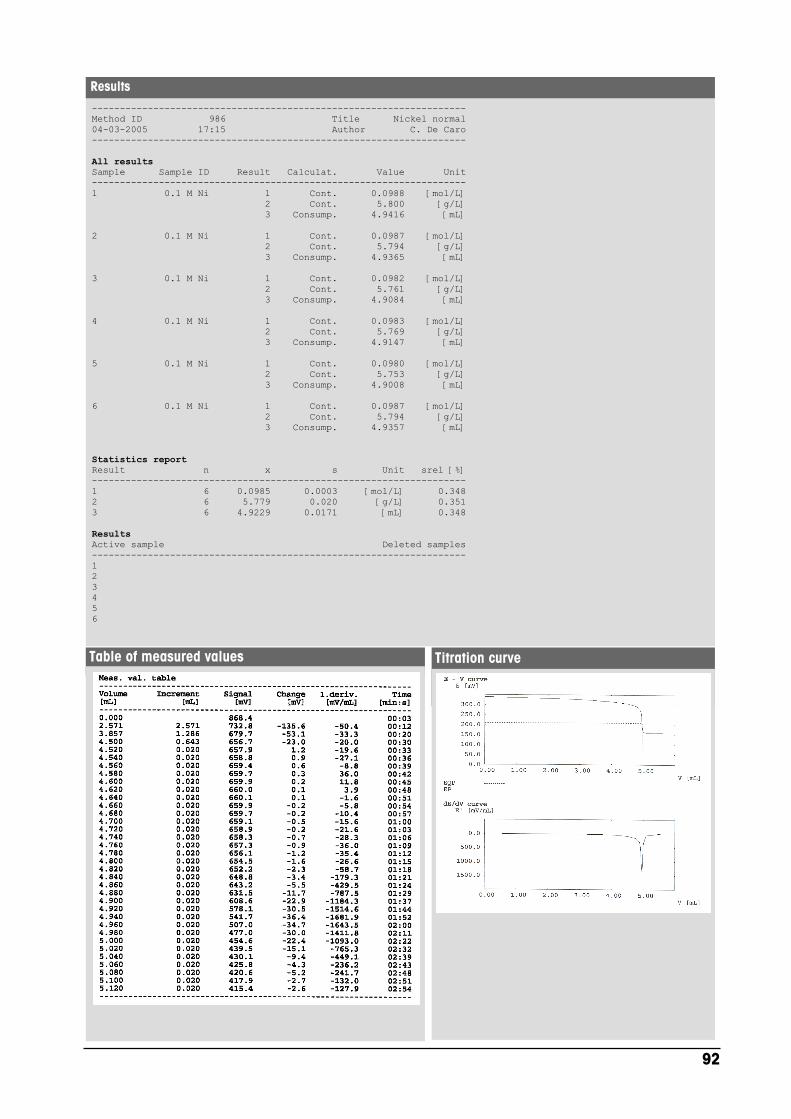
Table of measured values
-------------------------------------------------------------------Method ID 986 Title Nickel normal04-03-2005 17:15 Author C. De Caro-------------------------------------------------------------------
All resultsSample Sample ID Result Calculat. Value Unit-------------------------------------------------------------------1 0.1 M Ni 1 Cont. 0.0988 [mol/L] 2 Cont. 5.800 [g/L] 3 Consump. 4.9416 [mL]
2 0.1 M Ni 1 Cont. 0.0987 [mol/L] 2 Cont. 5.794 [g/L] 3 Consump. 4.9365 [mL]
3 0.1 M Ni 1 Cont. 0.0982 [mol/L] 2 Cont. 5.761 [g/L] 3 Consump. 4.9084 [mL]
4 0.1 M Ni 1 Cont. 0.0983 [mol/L] 2 Cont. 5.769 [g/L] 3 Consump. 4.9147 [mL]
5 0.1 M Ni 1 Cont. 0.0980 [mol/L] 2 Cont. 5.753 [g/L] 3 Consump. 4.9008 [mL]
6 0.1 M Ni 1 Cont. 0.0987 [mol/L] 2 Cont. 5.794 [g/L] 3 Consump. 4.9357 [mL]
Statistics reportResult n x s Unit srel [%]-------------------------------------------------------------------1 6 0.0985 0.0003 [mol/L] 0.3482 6 5.779 0.020 [g/L] 0.3513 6 4.9229 0.0171 [mL] 0.348
ResultsActive sample Deleted samples-------------------------------------------------------------------123456
Titration curve
Results
92

Method ID 186 Title Nickel normal04-03-2005 17:15 Author C. De Caro
Sample para. Sample ID . . . . . . . . . . . . . . . 0.1 M Ni Entry type . . . . . . . . . . . . . . Volume Volume [mL] . . . . . . . . . . . . . . 5 Density [g/mL] . . . . . . . . . . . . 1.0 Mol.m. [g/mol] . . . . . . . . . . . . 58.69 Equival. number z . . . . . . . . . . . 1 Temp.sensor . . . . . . . . . . . . . . Manual Temp. [°C] . . . . . . . . . . . . . . 25.0Stir Speed [%] . . . . . . . . . . . . . . . 35 Mixing time [s] . . . . . . . . . . . . 10EQP titration Titrant . . . . . . . . . . . . . . . . EDTA 0.1 Conc.[mol/L] . . . . . . . . . . . . 0.1 Sensor . . . . . . . . . . . . . . . . DP5 Unit . . . . . . . . . . . . . . . . mV Blank . . . . . . . . . . . . . . . . . Entry Value [mmol] . . . . . . . . . . . . 0.00 Predis.[mL] . . . . . . . . . . . . . . 4.5 Back value [mmol] . . . . . . . . . . . 0.00 Control parameters Set of parameters . . . . . . . . . User Addition . . . . . . . . . . . . . . Incremental Increment . . . . . . . . . . . . . 0.02 Measure mode . . . . . . . . . . . . EQU controlled dE[mV] . . . . . . . . . . . . . . . 1.0 dt[s] . . . . . . . . . . . . . . . 1 t(min) [s] . . . . . . . . . . . . . 3 t(max) [s] . . . . . . . . . . . . . 30 Recognition Tendency . . . . . . . . . . . . . . Negative Min. Relevance . . . . . . . . . . . 30 Threshold [mV/mL] . . . . . . . . . 400.0 St. jump only . . . . . . . . . . . No Termination param. Numb. EQP's . . . . . . . . . . . . 1 Vmax [mL] . . . . . . . . . . . . . 10.0 Evaluation Number Potentials . . . . . . . . . 0Calculation 1 Calculation . . . . . . . . . . . . . . Cont. Type . . . . . . . . . . . . . . . . . Cont. Unit . . . . . . . . . . . . . . . . . mol/L Which EQP . . . . . . . . . . . . . . . 1 Decimal places . . . . . . . . . . . . 4 Result limits . . . . . . . . . . . . . No Statistics . . . . . . . . . . . . . . YesCalculation 2 Calculation . . . . . . . . . . . . . . Cont. Type . . . . . . . . . . . . . . . . . Cont. Unit . . . . . . . . . . . . . . . . . g/L Which EQP . . . . . . . . . . . . . . . 1 Decimal places . . . . . . . . . . . . 3 Result limits . . . . . . . . . . . . . No Statistics . . . . . . . . . . . . . . YesCalculation 3 Calculation . . . . . . . . . . . . . . Consumpt. Unit . . . . . . . . . . . . . . . . . mL Which EQP . . . . . . . . . . . . . . . 1 Decimal places . . . . . . . . . . . . 4 Result limits . . . . . . . . . . . . . No Statistics . . . . . . . . . . . . . . YesReport Output . . . . . . . . . . . . . . . . Printer Results . . . . . . . . . . . . . . . . GLP Meas. val. table . . . . . . . . . . . Yes E - V curve . . . . . . . . . . . . . . Yes dE/dV curve . . . . . . . . . . . . . . Yes
MethodOther Control parameters
Set of parameters . . . . . . . . . Fast Addition . . . . . . . . . . . . . . Incremental Increment . . . . . . . . . . . . . 0.04 Measure mode . . . . . . . . . . . . EQU controlled dE[mV] . . . . . . . . . . . . . . . 1.0 dt[s] . . . . . . . . . . . . . . . 1 t(min) [s] . . . . . . . . . . . . . 3 t(max) [s] . . . . . . . . . . . . . 15
Set of parameters . . . . . . . . . Cautious Addition . . . . . . . . . . . . . . Incremental Increment . . . . . . . . . . . . . 0.01 Measure mode . . . . . . . . . . . . EQU controlled dE[mV] . . . . . . . . . . . . . . . 1.0 dt[s] . . . . . . . . . . . . . . . 2 t(min) [s] . . . . . . . . . . . . . 3 t(max) [s] . . . . . . . . . . . . . 40
93

M387
Fluoride, F-
M(F) = 19.00, z=1
5 mL TISAB III (ME-51340064) for 50mL sample
--
DL28OKI B4250 Printer(parallel cable ME-51108780)
--
Titration beakers ME-101974
METTLER TOLEDO
--Wastedisposal
Preparation and ProceduresVarious aqueous solutions, 50 mLSample
Substance
Chemicals
Titrant
Instruments
Results
Chemistry
Accessories
DX219-F- ISE, DX200 ref. electrode(Outer bridge electrolyte: 3 M KCl)
Indication
Fluoride content determination by direct measurement
1) Preparation of the samples:
50 mL + 5 mL TISAB III
50 mL + 5 mL TISAB III
50 mL wine + 5 mL TISAB IIIToothpaste:ca. 10 g dissolved in 40 mL water, dilute to 50 mL withdeionised water, add 5 mL TISAB III.
2) The DX219-F- electrode is adjusted with three standardsolutions (1, 10, and 100 mg/L F-)
3) The electrode is thoroughly cleaned after each sample withabundant water.
1) The DX219-F- ISE electrode needs to be conditioned beforeuse. This is achieved by keeping the electrode in a dilutedfluoride standard solution for 10-15 min. or longer, if necessary.For more information, refer to the operating instructions.
2) The F--Standard solutions can be prepared from sodiumfluoride, KCl.
3) Adjustment of the DX219-F- ISE:Always start the adjustement with the lowest concentratedstandard, i.e. 1mg/L, then 10 mg/L and finally 100 mg/L
LiteratureMETTLER-TOLEDO Titration Applications Brochure No. 6,"Direct Measurment with Ion Selective Electrodes",ME-51724646
METTLER-TOLEDO Titration Applications Brochure No. 12,"30 Selected Applications",ME-51724765
Remarks
R1: ppmCalculation
Direct measurement of the fluoride content by means of a DX219-F- ISE in various aqueous samples.
Standard 1, 10, 100 mg/L F- standards
MSG AnaChemAuthor
94
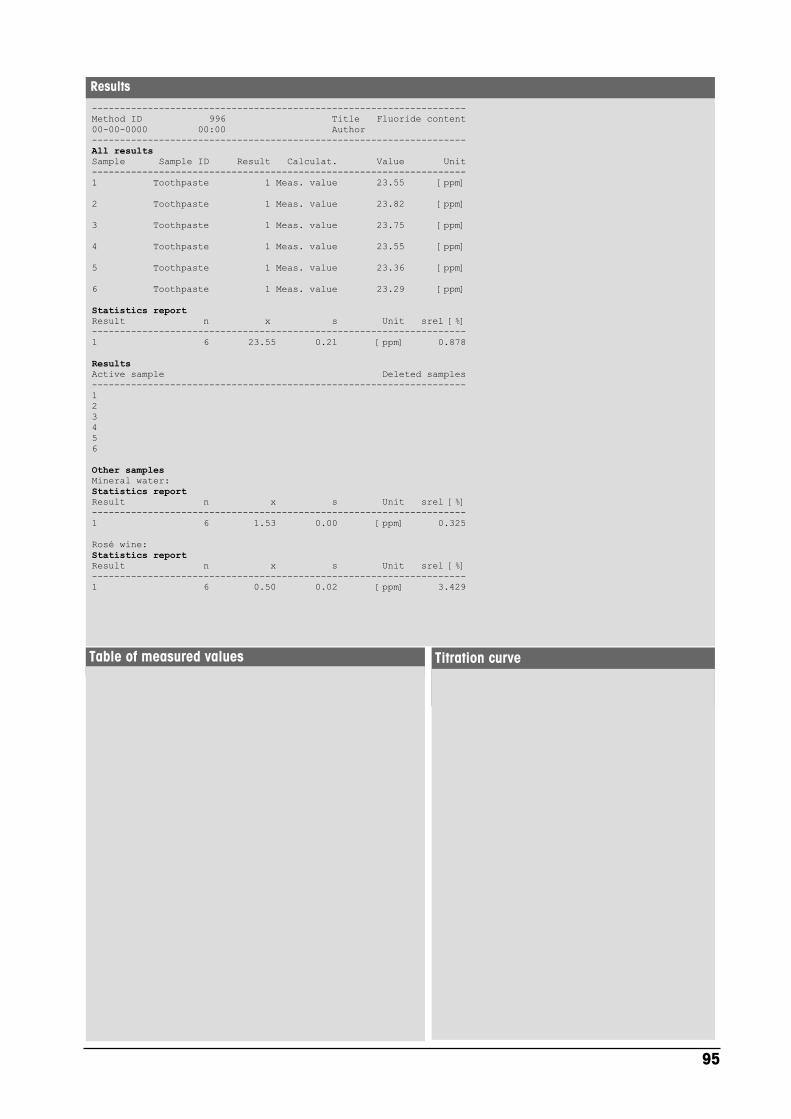
Table of measured values
-------------------------------------------------------------------Method ID 996 Title Fluoride content00-00-0000 00:00 Author-------------------------------------------------------------------All resultsSample Sample ID Result Calculat. Value Unit-------------------------------------------------------------------1 Toothpaste 1 Meas. value 23.55 [ppm]
2 Toothpaste 1 Meas. value 23.82 [ppm]
3 Toothpaste 1 Meas. value 23.75 [ppm]
4 Toothpaste 1 Meas. value 23.55 [ppm]
5 Toothpaste 1 Meas. value 23.36 [ppm]
6 Toothpaste 1 Meas. value 23.29 [ppm]
Statistics reportResult n x s Unit srel [%]-------------------------------------------------------------------1 6 23.55 0.21 [ppm] 0.878
ResultsActive sample Deleted samples-------------------------------------------------------------------123456
Other samplesMineral water:Statistics reportResult n x s Unit srel [%]-------------------------------------------------------------------1 6 1.53 0.00 [ppm] 0.325
Rosé wine:Statistics reportResult n x s Unit srel [%]-------------------------------------------------------------------1 6 0.50 0.02 [ppm] 3.429
Titration curve
Results
95

Method ID 996 Title Fluoride content00-00-0000 00:00 Author
Sample para. Sample ID . . . . . . . . . . . . . . . Request Entry type . . . . . . . . . . . . . . Mass Minimum [g] . . . . . . . . . . . . . . 0.01 Maximum [g] . . . . . . . . . . . . . . 10.0 Density [g/mL] . . . . . . . . . . . . 1.0 Mol.m. [g/mol] . . . . . . . . . . . . 1.00 Equival. number z . . . . . . . . . . . 1 Temp.sensor . . . . . . . . . . . . . . Manual Temp. [°C] . . . . . . . . . . . . . . 25.0Stir Speed [%] . . . . . . . . . . . . . . . 35 Mixing time [s] . . . . . . . . . . . . 3Measure Sensor . . . . . . . . . . . . . . . . DX219 Unit . . . . . . . . . . . . . . . . mV dE [mV] . . . . . . . . . . . . . . . . 0.5 dt [s] . . . . . . . . . . . . . . . . 1 t(min) [s] . . . . . . . . . . . . . . 100 t(max) [s] . . . . . . . . . . . . . . 120Calculation 1 Calculation . . . . . . . . . . . . . . Meas. val. Unit . . . . . . . . . . . . . . . . . ppm Decimal places . . . . . . . . . . . . 2 Result limits . . . . . . . . . . . . . No Statistics . . . . . . . . . . . . . . YesCalculation 2 Calculation . . . . . . . . . . . . . . NoneCalculation 3 Calculation . . . . . . . . . . . . . . NoneReport Output . . . . . . . . . . . . . . . . Printer Results . . . . . . . . . . . . . . . . GLP
Method
96

The methods in this brochure represent selected, possible application examples. These have been tested with all possible care with the analytical instruments mentioned in the brochure. The experiments were conducted and the resulting data evaluated based on our current state of knowledge.
However, the applications do not absolve you from personally testing their suitability for your intended methods, instruments and purposes. As the use and transfer of an application example are beyond our control, we cannot accept responsibility therefore.
When chemicals and solvents are used, the general safety rules and the directions of the manufacturer must be observed.

Subject to technical changes© 08/05 Mettler-Toledo GmbH, ME-51725065Printed in Switzerland.
Mettler-Toledo GmbH, AnalyticalCH-8603 Schwerzenbach, SwitzerlandPhone +41-44-806 77 11, Fax +41-44-806 73 50Internet: http://www.mt.com
AT Mettler-Toledo Ges.m.b.H., A-1100 Wien Tel. +43-1-604 19 80, Fax +43-1-604 28 80
AU Mettler-Toledo Ltd., Port Melbourne, Victoria, 3207 Tel. +61-3- 9644 5700, Fax +61-3-9645 3935
BE N.V. Mettler-Toledo S.A., B-1932 Zaventem Tel. +32-2-334 02 11, Fax +32-2-334 03 34
CA Mettler-Toledo, Inc., Mississauga, Ontario L4V 1J2 Tel. +1-800-638 8537, Fax +1-905 612 8094
CH Mettler-Toledo (Schweiz) AG, CH-8606 Greifensee Tel. +41-44-944 45 45, Fax +41-44-944 45 10
CN Mettler-Toledo (Shanghai) Ltd., 200233 Shanghai Tel. +86-21-6485 0435, Fax +86-21-6485 3351
CZ Mettler-Toledo, spol. s.r.o., CZ-10000 Praha 10 Tel. +420-272 123 150, Fax +420-272 123 170
DE Mettler-Toledo GmbH, D-35353 Giessen Tel. +49-6-41 50 70, Fax +49-6-41 507 319
DK Mettler-Toledo A/S, DK-2600 Glostrup Tel. +45-4327 0800, Fax +45-4327 0828
ES Mettler-Toledo S.A.E., E-08908 L´Hospitalet del Llobregat Tel. +34-93-223 76 00, Fax +34-93-223 76 01
FR Mettler-Toledo S.A., F-78220 Viroflay Cedex Tel. +33-130 971 717, Fax +33-130 971 773
HK Mettler-Toledo HK Ltd., Cheung Sha Wan Kowloon Tel. +852-2744 1221, Fax +852-2744 6878
HR Mettler-Toledo, d.o.o., HR-10000 Zagreb Tel. +38-512 920 633, Fax +38-512 958 140
HU Mettler-Toledo, Kereskedelmi Kft, H-1139 Budapest Tel. +36-1-288 40 40, Fax +36-1-288 40 50
IN Mettler-Toledo India Pvt. Ltd, 400 072 Mumbai Tel. +91-22-285 708 08, Fax +91-22-285 750 71
IT Mettler-Toledo S.p.A., I-20026 Novate Milanese Tel. +39-2-233 33 21, Fax +39-2-356 29 73
JP Mettler-Toledo K.K., 143-0006 Ohta-ku, Tokyo Tel. +81-3-5762 0606, Fax +81-3-5762 0756
KR Mettler-Toledo (Korea) Ltd., 137-130 Seoul Tel. +82-2-3498 3500, Fax +82-2-3498 3555
KZ Mettler-Toledo C.A., 480009 Almaty Tel. +7-3272-980 834, Fax +7-3272-980 835
MY Mettler-Toledo (M) Sdn. Bhd. 40150 Shah Alam Tel. +60-3-7845 5773, Fax +60-3-7845 8773
MX Mettler-Toledo S.A. de C.V., 06430 Mèxico C.P. Tel. +52-55-554 75700, Fax +52-55 554 12366
NL Mettler-Toledo B.V., NL-4004 Tiel Tel. +31-344 63 8363, Fax +31-344 63 8390
NO Mettler-Toledo A/S, N-1081 Oslo Tel. +47-22 30 44 90, Fax +47-22 32 70 02
PL Mettler-Toledo, Sp. z. o.o., PL-02-822 Warszawa Tel. +48-22-545 06 80, Fax +48-22-545 06 88
RU Mettler-Toledo C.I.S., 101000 Moscow Tel. +70-959 219 211, Fax +70-959 216 353
SE Mettler-Toledo AB, S-12008 Stockholm Tel. +46-8-702 50 00, Fax +46-8-642 45 62
SG Mettler-Toledo (S) Pte. Ltd., 139959 Singapore Tel. +65-689 000 11, Fax +65-689 000 12
SK Mettler-Toledo s.r.o, SK-82104 Bratislava Tel. +421-43 42 74 96, Fax +421-43 33 71 90
SI Mettler-Toledo, d.o.o., SI-1236 Trzin Tel. +386-1-562 18 01, Fax +386-1-562 17 89
TH Mettler-Toledo (Thailand), 10310 Huy Kwang Bangkok Tel. +66-2-723 0300, Fax +66-2-719 6479
TW Mettler-Toledo PacRim AG, 114 Taipei Tel. +886-2-2657 8898, Fax +886-2-2657 0776
UK Mettler-Toledo Ltd., Leicester, LE4 1AW Tel. +44-116-235 70 70, Fax +44-116-236 36 99
US Mettler-Toledo, Inc., Columbus, OH 43240-2020 Tel. +1-614-438 4511, Fax +1-614-438 4900
For all other countries: Mettler-Toledo GmbHPO Box VI-400, CH-8606 GreifenseePhone +41-44-944 22 11, Fax +41-44-944 31 70