
Falcon Highlands Metropolitan District Financial Statement ...
Metropolitan Planning AuthorityAnnual Report2015-2016

ISSN: 2205-6289
© State of Victoria, Victorian Planning Authority 2016. This publication is copyright. No part may be reproduced by any process except in accordance with the provisions of the Copyright Act 1968.
Disclaimer
This publication may be of assistance to you but the State of Victoria and its employees do not guarantee that the publication is without flaw of any kind or is wholly appropriate for your particular purposes and therefore disclaims all liability for any error, loss or other consequence which may arise from you relying on any information in this publication.
Metropolitan Planning Authority Annual Report 2015-2016
1Metropolitan Planning Authority Annual Report 2015-2016
ContentsMinister for Planning 2
Responsible Body Declaration 2
Mission and Values 3
Message from the Acting Chair 4
Members of the MPA 5
Chief Executive Officer’s Report 7
Victoria’s Growth Areas 10
The Metropolitan Planning Authority 11
Authority Performance 13
Growth Areas Infrastructure Contribution 16
Infrastructure Contribution Reporting 20
MPA Organisation and Staff as at 30 June 2016 21
Additional Information 24
Risk Management 27
Summary of the Financial Results 28
Disclosure Index 29
Annual Financial Statements – 30 June 2016 31
Metropolitan Planning Authority Statutory Certification 70
Auditor-General’s Report 71
2 Metropolitan Planning Authority Annual Report 2015-2016
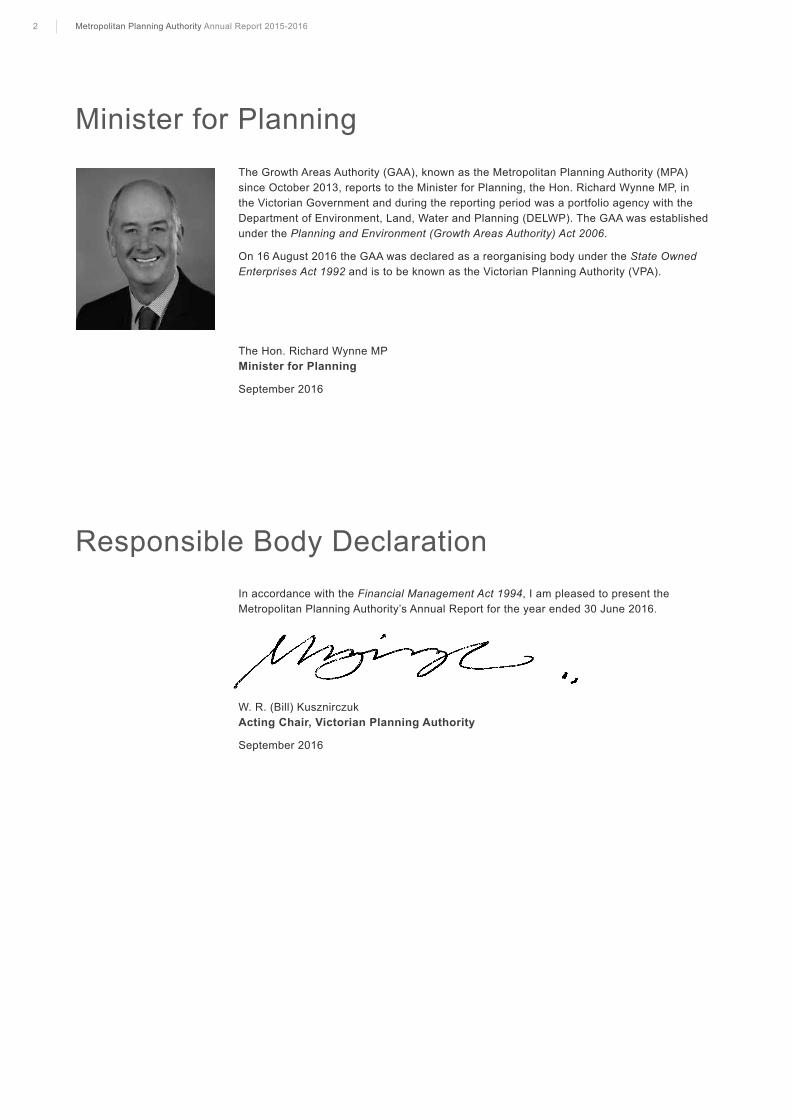
Minister for Planning The Growth Areas Authority (GAA), known as the Metropolitan Planning Authority (MPA) since October 2013, reports to the Minister for Planning, the Hon. Richard Wynne MP, in the Victorian Government and during the reporting period was a portfolio agency with the Department of Environment, Land, Water and Planning (DELWP). The GAA was established under the Planning and Environment (Growth Areas Authority) Act 2006.
On 16 August 2016 the GAA was declared as a reorganising body under the State Owned Enterprises Act 1992 and is to be known as the Victorian Planning Authority (VPA).
The Hon. Richard Wynne MP Minister for Planning
September 2016
Responsible Body DeclarationIn accordance with the Financial Management Act 1994, I am pleased to present the Metropolitan Planning Authority’s Annual Report for the year ended 30 June 2016.
W. R. (Bill) Kusznirczuk Acting Chair, Victorian Planning Authority
September 2016
3Metropolitan Planning Authority Annual Report 2015-2016
Mission and Values
Mission of the Metropolitan Planning AuthorityTo be an active partner in ensuring Melbourne’s and Victoria’s affordable, sustainable and liveable new communities are of the highest international standard.
Values and Behaviours of the Metropolitan Planning AuthorityIn all its work, the MPA demonstrates the following values and behaviours:
Value Behaviours
Leadership We provide clarity and certainty, develop new and innovative solutions to problems, provide authoritative advice and lead by example to get things done and make a positive difference.
Partnership We work in collaboration with our stakeholders through genuine consultation, sharing of information, and harnessing their expertise and resources.
Professionalism We act with honesty and openness, are accountable for our actions, are respected for our expertise and high quality and balanced advice.
Responsiveness We are aware of the needs of our stakeholders and strive to provide a high level of service and advice at all times.
4
Message from the Acting ChairThis report outlines the Metropolitan Planning Authority’s (MPA) development throughout the past 12 months. The MPA had a very productive year working closely with our key stakeholders to plan new suburbs, stimulate growth of commercial centres, drive
urban renewal in strategically important locations and improve housing affordability.
2015/16 was the organisation’s second full year as the MPA and I sincerely thank my authority colleagues and wish to acknowledge the contribution made by retiring board members Leonie Hemingway (Chair) and Laurinda Gardner (Deputy Chair).
The Minister for Planning set a number of important priorities for the MPA; planning for significant sites and precincts; key inner city planning roles, planning for the Arden precinct in North Melbourne, planning support for development of the Fishermans Bend precincts, and preparation of an Inner City Framework Plan. Planning new suburbs in Melbourne’s growth areas remained a strong focus. The Authority also did significant planning work in regional Victoria.
In August 2016, the Minister for Planning announced the establishment of the Victorian Planning Authority (VPA). I congratulate my colleagues who have been appointed to this Board. They bring with them important skills and expertise.
Victoria is growing, with a projected population of up to 10 million people by 2051. It is the VPA’s task to manage this growth so that Melbourne and our regional towns and cities continue to be great places to live, work and play. Next year in particular, the VPA will need to prepare to facilitate innovative, integrated land and infrastructure planning. These tasks will be underpinned by a vision for long term planning of our State to ensure Victorians have great places to live, good access to employment, public transport, attractive open spaces, and affordable housing. The Authority will also need a clear planning focus on mitigating the potential effects of climate change.
I congratulate the Minister for Planning on creating the new Victorian Planning Authority, this action was the first step in this vision and I have every confidence that the VPA with its wider mandate will be in a strong position to embrace this important challenge of planning for the future growth of Victoria.
Finally, I express my appreciation to the CEO of the authority, Mr. Peter Seamer, and all staff. I look forward to working with the Minister, my authority colleagues, the VPA staff, industry, state government departments, local councils and the Victorian community.
W. R. (Bill) Kusznirczuk Acting Chair, Victorian Planning Authority
September 2016
5Metropolitan Planning Authority Annual Report 2015-2016
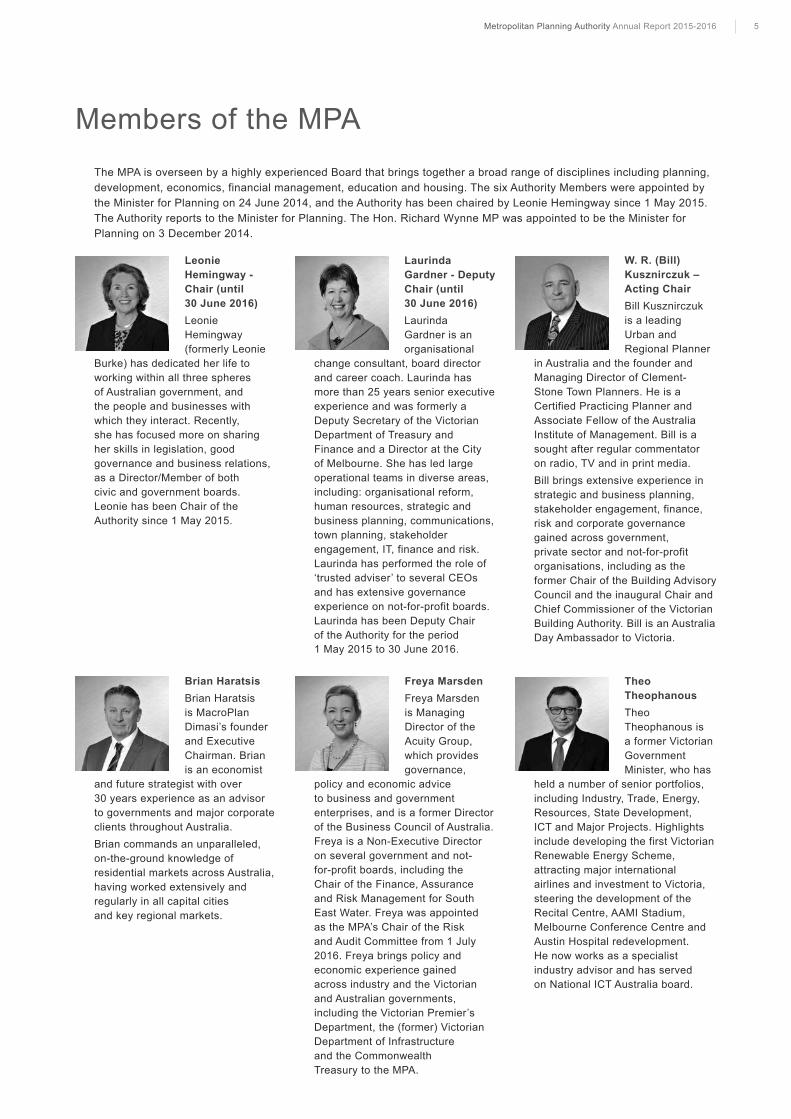
Members of the MPAThe MPA is overseen by a highly experienced Board that brings together a broad range of disciplines including planning, development, economics, financial management, education and housing. The six Authority Members were appointed by the Minister for Planning on 24 June 2014, and the Authority has been chaired by Leonie Hemingway since 1 May 2015. The Authority reports to the Minister for Planning. The Hon. Richard Wynne MP was appointed to be the Minister for Planning on 3 December 2014.
Leonie Laurinda W. R. (Bill) Hemingway - Gardner - Deputy Kusznirczuk – Chair (until Chair (until Acting Chair30 June 2016) 30 June 2016) Bill Kusznirczuk Leonie Laurinda is a leading Hemingway Gardner is an Urban and (formerly Leonie organisational Regional Planner
Burke) has dedicated her life to change consultant, board director in Australia and the founder and working within all three spheres and career coach. Laurinda has Managing Director of Clement-of Australian government, and more than 25 years senior executive Stone Town Planners. He is a the people and businesses with experience and was formerly a Certified Practicing Planner and which they interact. Recently, Deputy Secretary of the Victorian Associate Fellow of the Australia she has focused more on sharing Department of Treasury and Institute of Management. Bill is a her skills in legislation, good Finance and a Director at the City sought after regular commentator governance and business relations, of Melbourne. She has led large on radio, TV and in print media.as a Director/Member of both operational teams in diverse areas, Bill brings extensive experience in civic and government boards. including: organisational reform, strategic and business planning, Leonie has been Chair of the human resources, strategic and stakeholder engagement, finance, Authority since 1 May 2015. business planning, communications, risk and corporate governance
town planning, stakeholder gained across government, engagement, IT, finance and risk. private sector and not-for-profit Laurinda has performed the role of organisations, including as the ‘trusted adviser’ to several CEOs former Chair of the Building Advisory and has extensive governance Council and the inaugural Chair and experience on not-for-profit boards. Chief Commissioner of the Victorian Laurinda has been Deputy Chair Building Authority. Bill is an Australia of the Authority for the period Day Ambassador to Victoria.1 May 2015 to 30 June 2016.
Brian HaratsisBrian Haratsis is MacroPlan Dimasi’s founder and Executive Chairman. Brian is an economist
and future strategist with over 30 years experience as an advisor to governments and major corporate clients throughout Australia. Brian commands an unparalleled, on-the-ground knowledge of residential markets across Australia, having worked extensively and regularly in all capital cities and key regional markets.
Freya MarsdenFreya Marsden is Managing Director of the Acuity Group, which provides governance,
policy and economic advice to business and government enterprises, and is a former Director of the Business Council of Australia. Freya is a Non-Executive Director on several government and not-for-profit boards, including the Chair of the Finance, Assurance and Risk Management for South East Water. Freya was appointed as the MPA’s Chair of the Risk and Audit Committee from 1 July 2016. Freya brings policy and economic experience gained across industry and the Victorian and Australian governments, including the Victorian Premier’s Department, the (former) Victorian Department of Infrastructure and the Commonwealth Treasury to the MPA.
Theo TheophanousTheo Theophanous is a former Victorian Government Minister, who has
held a number of senior portfolios, including Industry, Trade, Energy, Resources, State Development, ICT and Major Projects. Highlights include developing the first Victorian Renewable Energy Scheme, attracting major international airlines and investment to Victoria, steering the development of the Recital Centre, AAMI Stadium, Melbourne Conference Centre and Austin Hospital redevelopment. He now works as a specialist industry advisor and has served on National ICT Australia board.
6
Members of the VPAIn July 2016 the Minister announced that the GAA, currently trading as the MPA, would be declared a reorganising body under the State Owned Enterprises Act 1994.
The Board Membership of the Authority changed with this declaration, with Leonie Hemingway and Laurinda Garner retiring, and Jennifer Cunich and Trevor Budge being appointed as new Authority Members on 16 August 2016. Bill Kusznirczuk was appointed as the Deputy Chair, and also as the Acting Chair from that date.
Risk and Audit CommitteeThe Risk and Audit Committee ensures that the MPA discharges its responsibilities as prescribed in the Financial Management Act 1994 and Audit Act 1994, other relevant legislation and prescribed requirements.
The Committee comprises all members of the Authority and was chaired by Laurinda Gardner during the financial year. The Risk and Audit Committee members are all independent of the operations of the Authority.
Executive Remuneration CommitteeThis Committee oversees the development of executive remuneration policy and practices within the MPA, and approves individual executive remuneration packages.
This Committee comprises all members of the Authority and was chaired by Bill Kusznirczuk during the financial year.
7Metropolitan Planning Authority Annual Report 2015-2016
Chief Executive Officer’s ReportThe MPA has created new employment opportunities, improved housing affordability and articulated a clear response to climate change throughout the 2015/16 financial year.
The Minister for Planning provides the MPA with an approved program of priority works on an annual basis, which can be viewed on the MPA’s website. This year, the MPA expanded its focus by allocating more resources to planning for inner Melbourne and regional Victoria, while continuing to design sustainable new suburbs in Melbourne’s greenfield growth areas.
Reflecting on our time as the GAA and the MPA, we are very proud of the impact we have had on housing affordability. The continuing planning for many new communities has meant Victoria has had ample supply of housing. This has driven both competition, and the quality of design of dwellings available for home buyers in greenfield growth areas. Indeed, serviced lots in Victoria’s greenfield growth areas are, on average, $200,000 cheaper than those in Sydney. Being able to maintain that affordability edge is something we hope to also bring to our work in Melbourne’s urban renewal areas and Victoria’s regions.
The Minister for Planning has been progressing the review of Plan Melbourne to recognise changes to Melbourne’s transport system and reflect a clearer focus on government priorities such as affordable housing and combatting climate change. The MPA has had input into this review process, and the refreshed Plan Melbourne is expected to be released in the 2016/17 financial year. The revised Plan Melbourne will provide direction for the MPA’s future work program, as we evolve into the VPA.
The MPA is undertaking planning to accommodate Victoria’s population expected to reach 10.1 million by 2051 under recent Victoria in Future projections:
• The growth in Victoria will be significant, both in Melbourne and in Victoria’s regions
• These released projections showing upward trends in birth rates, life expectancy and migration for Victoria, as the state continues to thrive
• There will need to be an additional 2.2 million dwellings to house the population
• Recognising both the challenges and opportunities this change brings, the Government will soon release an updated Plan Melbourne
• The key to managing this change is ensuring we provide housing choice – from the inner city to new and established suburbs and our great regional cities
• Victorians don’t all want the same type of houses and we need to make sure we provide options that suit different incomes and different lifestyles
• Planning also needs to recognise the changing accommodation needs of people over their lives.
The MPA has a substantial role to play in planning for this population growth. We do this by working closely with councils, government agencies and the planning and development community on integrated land use and infrastructure coordination for strategically important development sites and precincts. Our major tasks include:
• Unlocking land for housing by designing appealing and well serviced new suburbs through exemplary planning
• Facilitating job creation by planning for Melbourne’s six National Employment Clusters and central city
• Help cater for population growth in regional cities and towns by unlocking land for housing and jobs
• Working closely with councils and other government agencies to consider and determine infrastructure and service needs
The Minister for Planning’s Priorities for the MPA for 2015/16During the 2015/16 financial year the MPA made progress on all four of its key primary priorities, including:
1. Significant Development Sites and Precincts
Plan Melbourne identified places of strategic significance for Melbourne, including six suburban job hubs referred to as National Employment Clusters (NECs). The NECs include the established clusters of Monash, Parkville and Dandenong South and the emerging clusters of Sunshine, La Trobe and East Werribee.
Under the direction of the Minister, the MPA has focused its recent activities in four of the NECs: Monash, Sunshine, La Trobe and the emerging employment precinct of East Werribee. All of these NECs are expected to evolve into contemporary, mixed-use areas that feature high-density living in close proximity to a range of businesses, hospitals and educational institutions. They will offer Melbournians the chance to work closer to where they live – reducing congestion and giving people back precious family time.
The Monash NEC is the largest jobs hub outside of Melbourne’s CBD and the MPA sees the potential for this area to be as vibrant and economically competitive as Parramatta, in Sydney.
The Monash NEC is home to several groundbreaking, nationally significant employment institutions such as Monash University, the Australian Synchrotron and the Monash Medical Centre. It is also a manufacturing heartland for several major international companies, such as Bosch.
However, while the Monash NEC’s economic output is strong, its transport connections and overall amenity needs to be improved if it is to successfully expand and evolve in coming years.

8
After conducting extensive research and collaborating closely with the cities of Monash, Kingston and Dandenong, the MPA launched its key ideas for enhancing the Monash NEC’s attractiveness in May 2016.
Upon releasing these ideas, the MPA consulted with the area’s existing business community for a period of four weeks, and is now in the process of developing a draft land use plan that will be released for public comment.
Similarly, the MPA has also completed the initial round of community consultation about its key ideas for improving amenity in Sunshine and La Trobe, and is now preparing Framework Plans for these areas as well, which will be released in early 2017.
Over the past year the MPA has continued to facilitate the development of the East Werribee Employment Precinct. The Victorian Government is undertaking due diligence to assess market-based proposals for the 400-hectare site known as the East Werribee Development Parcel.
As the MPA awaits the outcome of this process, we are taking action to dramatically enhance the area’s accessibility, by coordinating a $71 million suite of planning work, the majority of which consists of transport planning. In May 2016, the MPA was proud to be part of the opening of the new city-bound ramps on the Princes Freeway and a new bridge at the Sneydes Road Interchange, which will significantly improve traffic flow in Melbourne’s south-west. It is anticipated the full-diamond interchange will be completed by the end of the calendar year, when the Geelong-bound ramps are opened. The cost of this interchange work was $45 million.
In addition to planning for the NECs, the MPA is also overseeing a number of noteworthy urban renewal projects in selected strategic sites across Melbourne, including in Broadmeadows. These sites largely consist of land that is currently under-utilised and has the potential to benefit the wider community by providing housing, jobs and infrastructure.
2. Inner Melbourne
The Minister’s strategic project list for the MPA for the 2015/16 year set out the MPA’s key inner city planning activities. This included undertaking planning for the Arden precinct in North Melbourne; providing support to the new Fishermans Bend Taskforce; and preparing a draft Inner City Framework.
The Minister tasked the MPA with progressing the vital planning work for the Arden precinct in support of the Melbourne Metro Rail Authority and the Department of Economic Development, Jobs, Transport and Resources (DEDJTR). Arden will be a city-shaping precinct that will become an extension of central Melbourne. Over the past year, the MPA has been working hard to produce a Draft Vision and Framework for Arden. This planning project is progressing well and is expected to be released shortly for public consultation.
3. Melbourne’s Growth Areas
Since its inception, the MPA has been planning Melbourne’s greenfield suburbs, which are essential to our city’s overall housing affordability and the supply of zoned land. Over the next 40 years, new communities in Melbourne’s greenfield growth areas will be accommodated in an additional 536,000 dwellings. These communities will also feature well-designed town centres and commercial spaces, parks and recreation facilities, community facilities and key transport links.
At the current time, the MPA has completed 56 Precinct Structure Plans (PSPs) for greenfield areas. A further 24 are under preparation and others are being progressed by councils,with the support of the MPA.
The MPA completed five PSPs in 2015/16. In the past financial year the Minister for Planning approved and gazetted plans for the Lake Narracan, Lincoln Heath South, Paynes Road, Blackforest Road North and English Street precincts.
In May 2016 the MPA publicly exhibited the McPherson PSP, a new suburb in Melbourne’s south-east that will accommodate 28,000 residents. In June 2016 we released the PSPs for Kororoit and Plumpton, two new suburbs that will collectively house 55,000 residents. Several other large PSPs are now at the stage of being ready for consideration for approval and public exhibition.
The MPA’s PSP activities are constantly evolving and improving, and consultation in respect of new draft PSP Guidelines is expected to get underway in the coming financial year. Recently completed PSPs in the greenfield growth areas will facilitate even better outcomes for new communities, such as more innovative intersection design, dedicated pedestrian paths and open space amounting to up to 20% of the net developable area.
4. Regional Victoria
Regional Victoria is currently growing at a much slower rate than Melbourne, with 90% of new residents choosing to move to our capital, rather than our regional towns and cities. This is a concerning trend that, if it continues, will put immense pressure on Melbourne and cause our regions to miss out on the economic opportunities presented by population growth.
The Victorian Government is therefore prioritising growth in regional Victoria, and the MPA is playing a vital role in realising this ambition.
The MPA was directed by the Minister for Planning to assist the Latrobe, Greater Shepparton, Wodonga, Moorabool and Surf Coast regional councils in developing their own future vision for the urban parts of these critically important regional cities.
9Metropolitan Planning Authority Annual Report 2015-2016
The MPA assisted the Latrobe Council to prepare the Lake Narracan PSP, Native Vegetation Precinct Plan (NVPP) and Development Contributions Plan (DCP), all of which were approved in December 2015 and gazetted. Long-term development of land identified in the Lake Narracan PSP will create approximately 3700 new homes, two new village centres and 18 hectares of open space for parks and sporting facilities.
Furthermore, the MPA has worked closely with the Surf Coast Shire in assisting the development of a draft Precinct Structure Plan for Spring Creek, which will result in almost 1800 new dwellings being created near Torquay on Victoria’s Surf Coast. This PSP is at the post-public exhibition stage.
In Northern Victoria, the MPA has developed a PSP for Leneva-Baranduda, a new community in Wodonga, which is being prepared for public exhibition. This development is expected to yield 6000 lots and house 15,500 residents.
Regional cities offer a positive and exciting alternative to Melbourne’s inner or outer areas. The character, style and living options in regional cities will be an important focus of our future work.
Developer contributionsThe Government has introduced a new infrastructure contribution framework that will provide a standard approach to funding of community infrastructure across the state, with a focus on early delivery of basic and essential infrastructure. The Planning and Environment Amendment (Infrastructure Contributions) Act 2016 became effective in June 2016, and the MPA has incorporated the additional reporting requirements in this year’s annual report.
Victorian Planning Authority On 16 August 2016, the Authority was declared a reorganising body under the State Owned Enterprises Act 1992. The MPA is now known as the Victorian Planning Authority (VPA), the existing MPA members’ appointments to the MPA Board ceased, and new Authority member appointments were made.
The MPA expresses its thanks to Leonie Hemingway and Laurinda Gardner, whose terms as Chair and Deputy Chair ceased as at 30 June 2016. In addition, Ms Hemingway and Ms Gardner subsequently ceased to be members of the Authority on 16 August 2016. At the announcement of the VPA, the Minister publicly thanked Ms Hemingway and Ms Gardner for their service, and congratulated the MPA Board on the work that it had successfully undertaken.
Future FundingTo help the VPA implement its ambitious program, the Government has provided it an additional $4.1 million in funding for the 2016/17 year. This will enable the VPA to work in partnership with councils to unlock the growth potential of our regional cities and key urban renewal areas in Melbourne. This will provide people with greater choices about where to live, work or start a business.
This additional budget funding will support strategic planning work in metropolitan and regional councils by:
• Implementing and improving the eight Regional Growth Plans in partnership with Regional Development Victoria.
• Assisting with streamlining planning processes after PSP approvals.
• Enabling master planning for strategic sites that provide opportunities for jobs growth, deliver investment and improve housing diversity and affordability; and
• Providing grants, staffing support and assistance to councils to efficiently facilitate and manage growth and deliver investment.
Organisation restructureIn order to best address its evolving mandate, the Authority has broadened its senior management structure, and now has 13 Directors to support the Chief Executive Officer. To facilitate additional senior staff overseeing structure planning, the eight structure planning directors are grouped into three groups that align with the Minister’s direction for the VPA, namely: Regional, Urban Renewal and Greenfield.
This change has been well received, and the Authority is expecting to be well placed to deal with the planning challenges facing it over the coming years.
ConclusionThe 2015/16 financial year has been productive, with the MPA expanding its scope to support planning and development activities across regional Victoria and in Melbourne’s inner and middle ring suburbs, while continuing our active greenfields planning.
I would like to thank the Minister for Planning, the MPA’s Authority Members and new VPA Authority Members, DELWP officers, government, council and industry partners for their support and guidance in our work.
We look forward to working with you in 2016/17.
Peter Seamer Chief Executive Officer September 2016
10
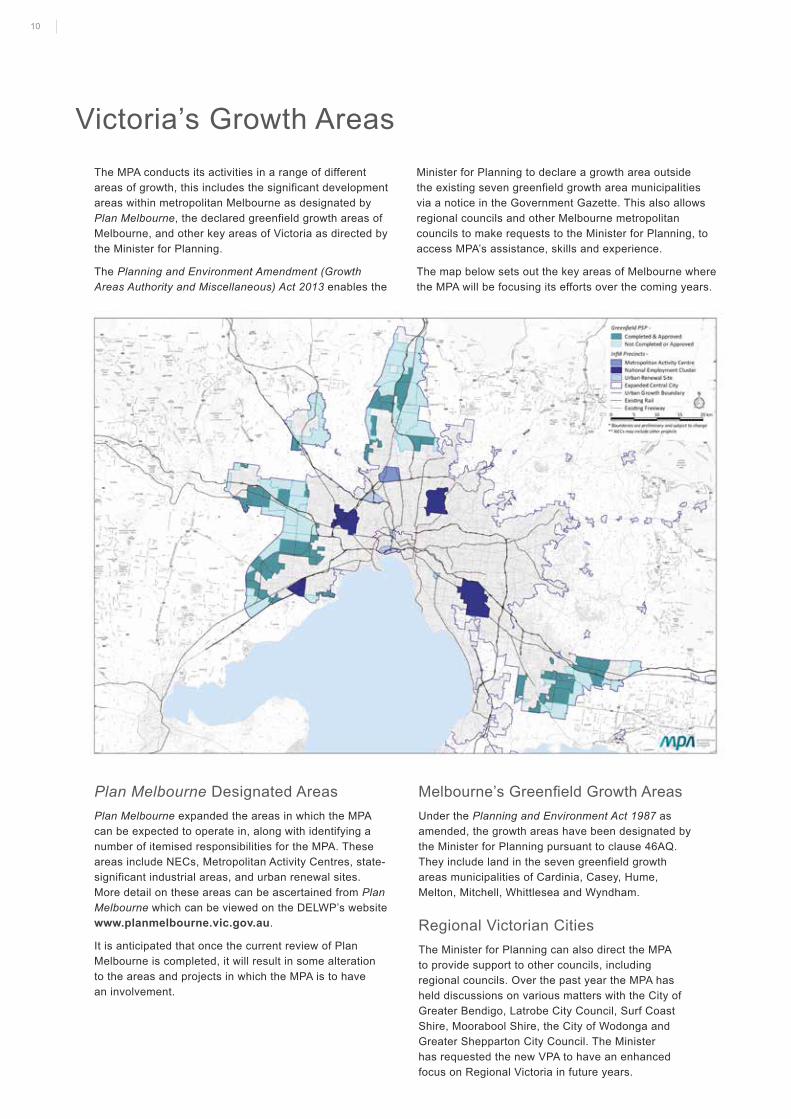
Victoria’s Growth AreasThe MPA conducts its activities in a range of different areas of growth, this includes the significant development areas within metropolitan Melbourne as designated by Plan Melbourne, the declared greenfield growth areas of Melbourne, and other key areas of Victoria as directed by the Minister for Planning.
The Planning and Environment Amendment (Growth Areas Authority and Miscellaneous) Act 2013 enables the
Minister for Planning to declare a growth area outside the existing seven greenfield growth area municipalities via a notice in the Government Gazette. This also allows regional councils and other Melbourne metropolitan councils to make requests to the Minister for Planning, to access MPA’s assistance, skills and experience.
The map below sets out the key areas of Melbourne where the MPA will be focusing its efforts over the coming years.
Plan Melbourne Designated AreasPlan Melbourne expanded the areas in which the MPA can be expected to operate in, along with identifying a number of itemised responsibilities for the MPA. These areas include NECs, Metropolitan Activity Centres, state-significant industrial areas, and urban renewal sites. More detail on these areas can be ascertained from Plan Melbourne which can be viewed on the DELWP’s website www.planmelbourne.vic.gov.au.
It is anticipated that once the current review of Plan Melbourne is completed, it will result in some alteration to the areas and projects in which the MPA is to have an involvement.
Melbourne’s Greenfield Growth AreasUnder the Planning and Environment Act 1987 as amended, the growth areas have been designated by the Minister for Planning pursuant to clause 46AQ. They include land in the seven greenfield growth areas municipalities of Cardinia, Casey, Hume, Melton, Mitchell, Whittlesea and Wyndham.
Regional Victorian CitiesThe Minister for Planning can also direct the MPA to provide support to other councils, including regional councils. Over the past year the MPA has held discussions on various matters with the City of Greater Bendigo, Latrobe City Council, Surf Coast Shire, Moorabool Shire, the City of Wodonga and Greater Shepparton City Council. The Minister has requested the new VPA to have an enhanced focus on Regional Victoria in future years.
11Metropolitan Planning Authority Annual Report 2015-2016
The Metropolitan Planning AuthorityThe MPA was launched in October 2013 to plan for jobs, housing and investment, and to manage Melbourne’s growth. This includes working with councils, State Government departments and agencies.
Having been formed from the GAA, the MPA’s expanded role includes high-level planning and infrastructure coordination to promote housing affordability and create jobs across Melbourne and in regional centres.
The GAA (the commonly used name of the Authority until October 2013) was established in 2006. The Authority was formally established by amendments made to the Planning and Environment Act 1987 on 1 September 2006 through the Planning and Environment (Growth Areas Authority) Act 2006.
ObjectivesThe Planning and Environment Act 1987 states that the Authority is to achieve the following objectives (under section 46AR of the Planning and Environment Act 1987):
• 46AR(a) To ensure that development in growth areas occurs in a coordinated and timely manner
• 46AR(aa) To integrate land use and transport to enable the coordinated provision of a sustainable transport system for the benefit of the community
• 46AR(b) To ensure that infrastructure, services and facilities are provided in the growth areas in a coordinated and timely manner
• 46AR(c) To promote sustainable development of land in growth areas
• 46AR(d) To promote housing diversity and affordability in growth areas
• 46AR(e) To promote employment opportunities in growth areas
• 46AR(f) To ensure that land is provided for commercial and industrial purposes in growth areas in a coordinated and timely manner
• 46AR(g) To foster the development of communities in growth areas
• 46AR(h) To ensure advice provided is consistent with the objectives of planning in Victoria.
Functions and PowersThe MPA provides advice to the Minister for Planning on development and planning issues in Melbourne and Victoria’s growth areas and monitors, advises and partners with key stakeholders on a range of planning issues.
The MPA’s functions and powers are set out in Sections 46AS and 46AT of the Planning and Environment Act 1987. The Planning and Environment Amendment (Growth Areas Authority and Miscellaneous) Act 2013 came into force on 22 July 2013. This legislation expanded the geographic range of the activities of the MPA when directed to do so by the Minister for Planning and also amended some of the Authority’s objectives and functions.
The MPA’s key functions are to:
• make recommendations and report to the Minister on:
- the planning, use, development and protection of land in growth areas
- the use and expenditure of levies collected in the growth areas under development contribution plans
- if requested by the Minister, any matter relating to the functions and powers of the Authority
- the Minister’s functions and powers under the Act in relation to growth areas
• carry out any function conferred to the Authority in relation to the Growth Areas Infrastructure Contribution (GAIC)
• carry out any other function conferred on the Authority under the Act.
Nature and range of services providedThe Minister for Planning has recently implemented a review of Plan Melbourne, and it can be expected that the role and extent of the MPA’s operations may be further modified as an outcome of that review.
The MPA continues to work in Melbourne’s greenfield growth areas, whilst shifting our main focus on the areas for urban development identified in Plan Melbourne. The Minister for Planning is also able to declare a growth area outside of the existing growth area municipalities via a notice in the Government Gazette.
Melbourne is already a very large city, with a population of approximately 4.2 million. Victoria’s latest projections indicate that the city’s population could increase to 7.8 million by 2051, which requires significant early urban planning in order to shape how our city’s infrastructure, housing stock and employment opportunities will evolve. The MPA on the direction of the Minister for Planning is examining opportunities to unlock land capacity to identify strategic urban renewal and greenfields sites.
12
Up to 1.4 million new dwellings will be required between 2015 and 2050 to house Melbourne’s growing population. Additional housing will be required in regional centres. It is important that we start planning now for this growth to ensure we can accommodate increased demand, while maintaining housing quality and Melbourne’s status as the world’s most liveable city. This approach includes planning for diversity of housing stock, making use of the Government’s new residential zoning across all of Melbourne and providing jobs and services close to home.
Along with relevant municipal councils, the MPA is actively involved in significant planning activities for the following areas:
• Arden
• Berwick Health and Education Precinct
• Broadmeadows Major Activity Centre
• Caulfield Station Precinct
• East Werribee Employment Precinct
• Expanded Central City
• Support to the Fishermans Bend Taskforce
• La Trobe Employment Cluster
• Monash Employment Cluster
• Sunshine Employment Cluster
• 21 greenfield precincts
• 5 regional city precincts
The MPA is also carrying out support activities in a number of other areas identified within Plan Melbourne.
Planning reform
A key activity of the MPA is the review and reform of the planning provisions and processes as they relate to the greenfield growth areas and growth area development. The MPA also has a major role to play in coordinating State and council infrastructure for the growth areas. The MPA is currently working with its key stakeholders in a review and streamlining of the existing PSP Guidelines. This document provides a comprehensive template for the preparation of the key strategic urban planning tool, the PSP. It is anticipated that a new document will be available for release in the 2016/17 financial year.
Infrastructure planning
The MPA works closely with state government departments, a range of state government agencies such as Public Transport Victoria, VicRoads, Parks Victoria, the Environment Protection Authority and Melbourne Water, and local councils in planning the future infrastructure requirements for Melbourne and its environs.
Coordination and liaison
The MPA plays a key role in co-ordinating the activities and efforts of various government bodies, local authorities and landowners and developers in areas of urban development.
The MPA also works with peak organisations such as the Planning Institute of Australia, the Property Council of Australia, the Municipal Association of Victoria, the Urban Development Institute of Australia, the Victorian Planning and Environmental Law Association and the Victorian Local Governance Association.
13Metropolitan Planning Authority Annual Report 2015-2016
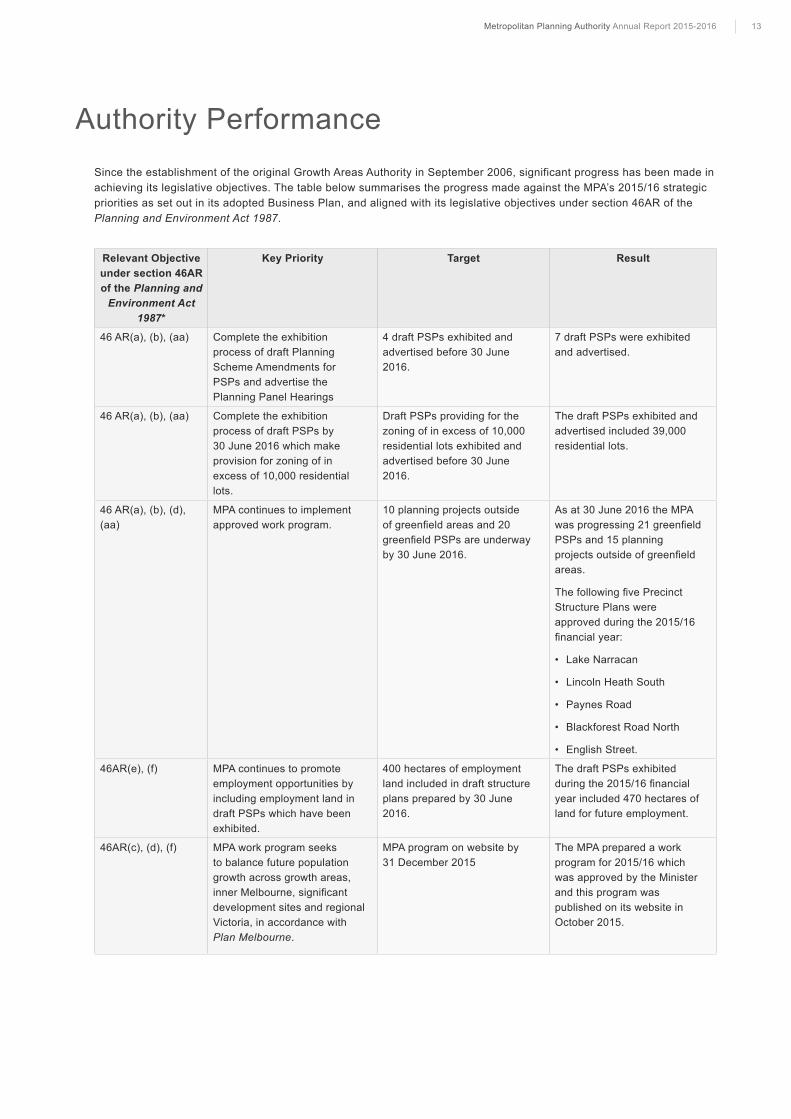
Authority PerformanceSince the establishment of the original Growth Areas Authority in September 2006, significant progress has been made in achieving its legislative objectives. The table below summarises the progress made against the MPA’s 2015/16 strategic priorities as set out in its adopted Business Plan, and aligned with its legislative objectives under section 46AR of the Planning and Environment Act 1987.
Relevant Objective under section 46AR of the Planning and
Environment Act 1987*
Key Priority Target Result
46 AR(a), (b), (aa) Complete the exhibition process of draft Planning Scheme Amendments for PSPs and advertise the Planning Panel Hearings
4 draft PSPs exhibited and advertised before 30 June 2016.
7 draft PSPs were exhibited and advertised.
46 AR(a), (b), (aa) Complete the exhibition process of draft PSPs by 30 June 2016 which make provision for zoning of in excess of 10,000 residential lots.
Draft PSPs providing for the zoning of in excess of 10,000 residential lots exhibited and advertised before 30 June 2016.
The draft PSPs exhibited and advertised included 39,000 residential lots.
46 AR(a), (b), (d), (aa)
MPA continues to implement approved work program.
10 planning projects outside of greenfield areas and 20 greenfield PSPs are underway by 30 June 2016.
As at 30 June 2016 the MPA was progressing 21 greenfield PSPs and 15 planning projects outside of greenfield areas.
The following five Precinct Structure Plans were approved during the 2015/16 financial year:
• Lake Narracan
• Lincoln Heath South
• Paynes Road
• Blackforest Road North
• English Street.
46AR(e), (f) MPA continues to promote employment opportunities by including employment land in draft PSPs which have been exhibited.
400 hectares of employment land included in draft structure plans prepared by 30 June 2016.
The draft PSPs exhibited during the 2015/16 financial year included 470 hectares of land for future employment.
46AR(c), (d), (f) MPA work program seeks to balance future population growth across growth areas, inner Melbourne, significant development sites and regional Victoria, in accordance with Plan Melbourne.
MPA program on website by 31 December 2015
The MPA prepared a work program for 2015/16 which was approved by the Minister and this program was published on its website in October 2015.
14
Relevant Objective under section 46AR of the Planning and
Environment Act 1987*
Key Priority Target Result
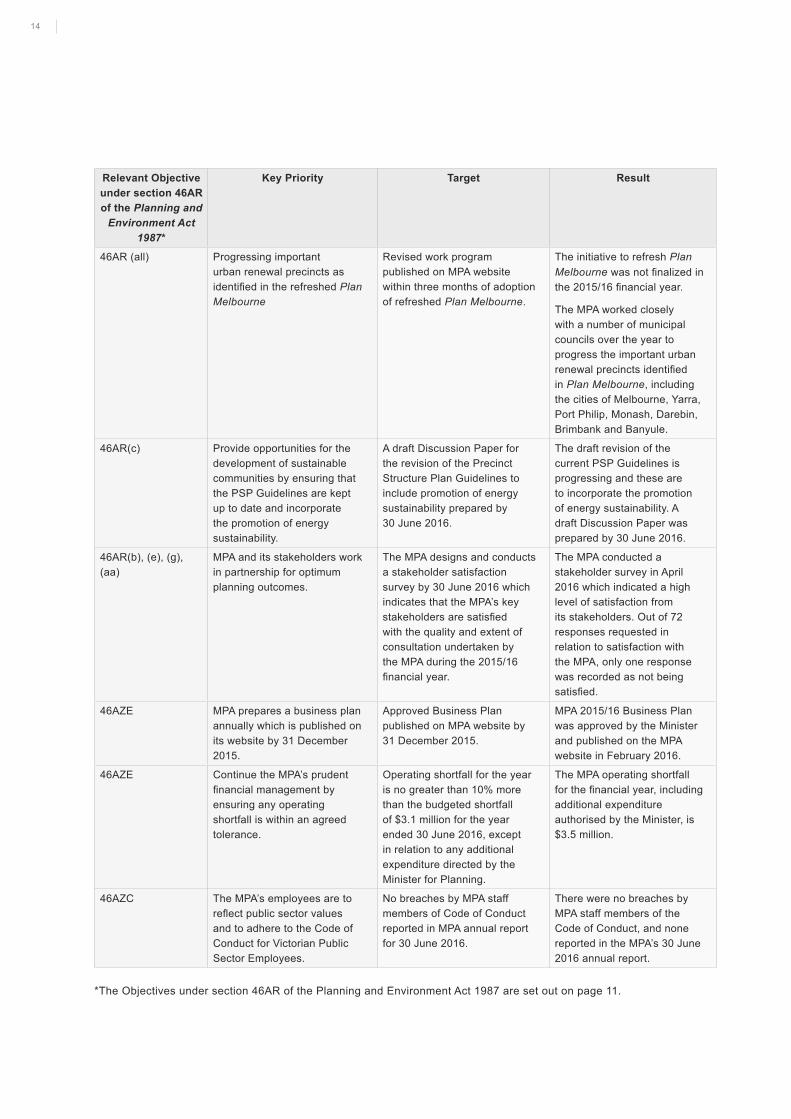
46AR (all) Progressing important urban renewal precincts as identified in the refreshed Plan Melbourne
Revised work program published on MPA website within three months of adoption of refreshed Plan Melbourne.
The initiative to refresh Plan Melbourne was not finalized in the 2015/16 financial year.
The MPA worked closely with a number of municipal councils over the year to progress the important urban renewal precincts identified in Plan Melbourne, including the cities of Melbourne, Yarra, Port Philip, Monash, Darebin, Brimbank and Banyule.
46AR(c) Provide opportunities for the development of sustainable communities by ensuring that the PSP Guidelines are kept up to date and incorporate the promotion of energy sustainability.
A draft Discussion Paper for the revision of the Precinct Structure Plan Guidelines to include promotion of energy sustainability prepared by 30 June 2016.
The draft revision of the current PSP Guidelines is progressing and these are to incorporate the promotion of energy sustainability. A draft Discussion Paper was prepared by 30 June 2016.
46AR(b), (e), (g), (aa)
MPA and its stakeholders work in partnership for optimum planning outcomes.
The MPA designs and conducts a stakeholder satisfaction survey by 30 June 2016 which indicates that the MPA’s key stakeholders are satisfied with the quality and extent of consultation undertaken by the MPA during the 2015/16 financial year.
The MPA conducted a stakeholder survey in April 2016 which indicated a high level of satisfaction from its stakeholders. Out of 72 responses requested in relation to satisfaction with the MPA, only one response was recorded as not being satisfied.
46AZE MPA prepares a business plan annually which is published on its website by 31 December 2015.
Approved Business Plan published on MPA website by 31 December 2015.
MPA 2015/16 Business Plan was approved by the Minister and published on the MPA website in February 2016.
46AZE Continue the MPA’s prudent financial management by ensuring any operating shortfall is within an agreed tolerance.
Operating shortfall for the year is no greater than 10% more than the budgeted shortfall of $3.1 million for the year ended 30 June 2016, except in relation to any additional expenditure directed by the Minister for Planning.
The MPA operating shortfall for the financial year, including additional expenditure authorised by the Minister, is $3.5 million.
46AZC The MPA’s employees are to reflect public sector values and to adhere to the Code of Conduct for Victorian Public Sector Employees.
No breaches by MPA staff members of Code of Conduct reported in MPA annual report for 30 June 2016.
There were no breaches by MPA staff members of the Code of Conduct, and none reported in the MPA’s 30 June 2016 annual report.
*The Objectives under section 46AR of the Planning and Environment Act 1987 are set out on page 11.
15Metropolitan Planning Authority Annual Report 2015-2016
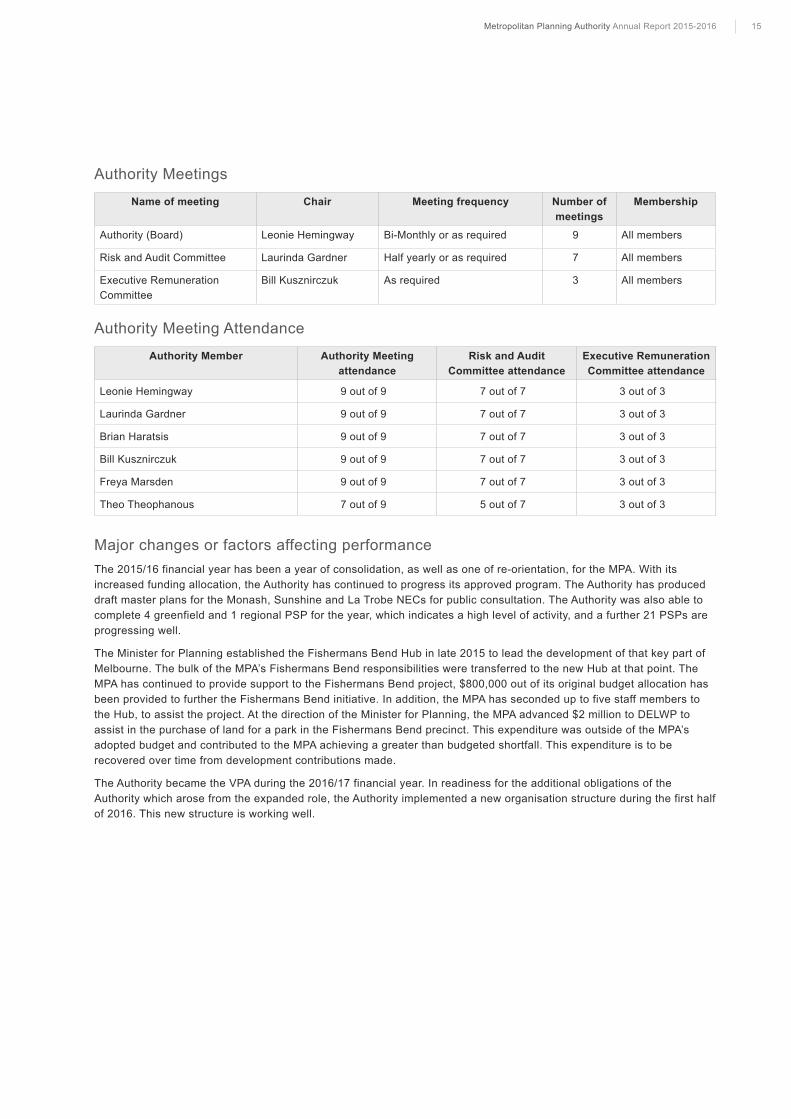
Authority Meetings
Name of meeting Chair Meeting frequency Number of meetings
Membership
Authority (Board) Leonie Hemingway Bi-Monthly or as required 9 All members
Risk and Audit Committee Laurinda Gardner Half yearly or as required 7 All members
Executive Remuneration Committee
Bill Kusznirczuk As required 3 All members
Authority Meeting Attendance
Authority Member Authority Meeting attendance
Risk and Audit Committee attendance
Executive Remuneration Committee attendance
Leonie Hemingway 9 out of 9 7 out of 7 3 out of 3
Laurinda Gardner 9 out of 9 7 out of 7 3 out of 3
Brian Haratsis 9 out of 9 7 out of 7 3 out of 3
Bill Kusznirczuk 9 out of 9 7 out of 7 3 out of 3
Freya Marsden 9 out of 9 7 out of 7 3 out of 3
Theo Theophanous 7 out of 9 5 out of 7 3 out of 3
Major changes or factors affecting performanceThe 2015/16 financial year has been a year of consolidation, as well as one of re-orientation, for the MPA. With its increased funding allocation, the Authority has continued to progress its approved program. The Authority has produced draft master plans for the Monash, Sunshine and La Trobe NECs for public consultation. The Authority was also able to complete 4 greenfield and 1 regional PSP for the year, which indicates a high level of activity, and a further 21 PSPs are progressing well.
The Minister for Planning established the Fishermans Bend Hub in late 2015 to lead the development of that key part of Melbourne. The bulk of the MPA’s Fishermans Bend responsibilities were transferred to the new Hub at that point. The MPA has continued to provide support to the Fishermans Bend project, $800,000 out of its original budget allocation has been provided to further the Fishermans Bend initiative. In addition, the MPA has seconded up to five staff members to the Hub, to assist the project. At the direction of the Minister for Planning, the MPA advanced $2 million to DELWP to assist in the purchase of land for a park in the Fishermans Bend precinct. This expenditure was outside of the MPA’s adopted budget and contributed to the MPA achieving a greater than budgeted shortfall. This expenditure is to be recovered over time from development contributions made.
The Authority became the VPA during the 2016/17 financial year. In readiness for the additional obligations of the Authority which arose from the expanded role, the Authority implemented a new organisation structure during the first half of 2016. This new structure is working well.
16
Growth Areas Infrastructure ContributionPart 9B of the Planning and Environment Act 1987 (the Act) came into effect on 1 July 2010. GAIC information is available on DELWP, MPA and State Revenue Office (SRO) websites. GAIC applies to particular land in Melbourne metropolitan growth areas.
The MPA is responsible under the Act to notify SRO and the Registrar of Titles of the properties that fall within the GAIC area.
The SRO retains a record of those properties liable for GAIC, and is responsible for determining and collecting any GAIC liability.
The Registrar of Titles is responsible for placing a GAIC notice on each affected property title and will not allow any land dealings, in relation to those properties, without receipt of an appropriate GAIC certificate and notice, as issued by SRO.
The MPA investigates any planning and zoning anomalies that may be raised as they relate to GAIC, and progresses staged payment agreement (SPA) inquiries and applications from landowners subdividing land in Melbourne’s growth areas.
The MPA provides secretarial support to the GAIC Hardship Relief Board (HRB). The HRB meets when required to consider applications for hardship relief. During the year ended 30 June 2016 the Board made no decisions on hardship applications and at 30 June 2016 there were no active applications before the Board (as at 30 June 2015 – nil).
Under section 45 of the Financial Management Act 1994 and section 201VC of the Act the MPA and DELWP are required to report annually on the operation of the GAIC.
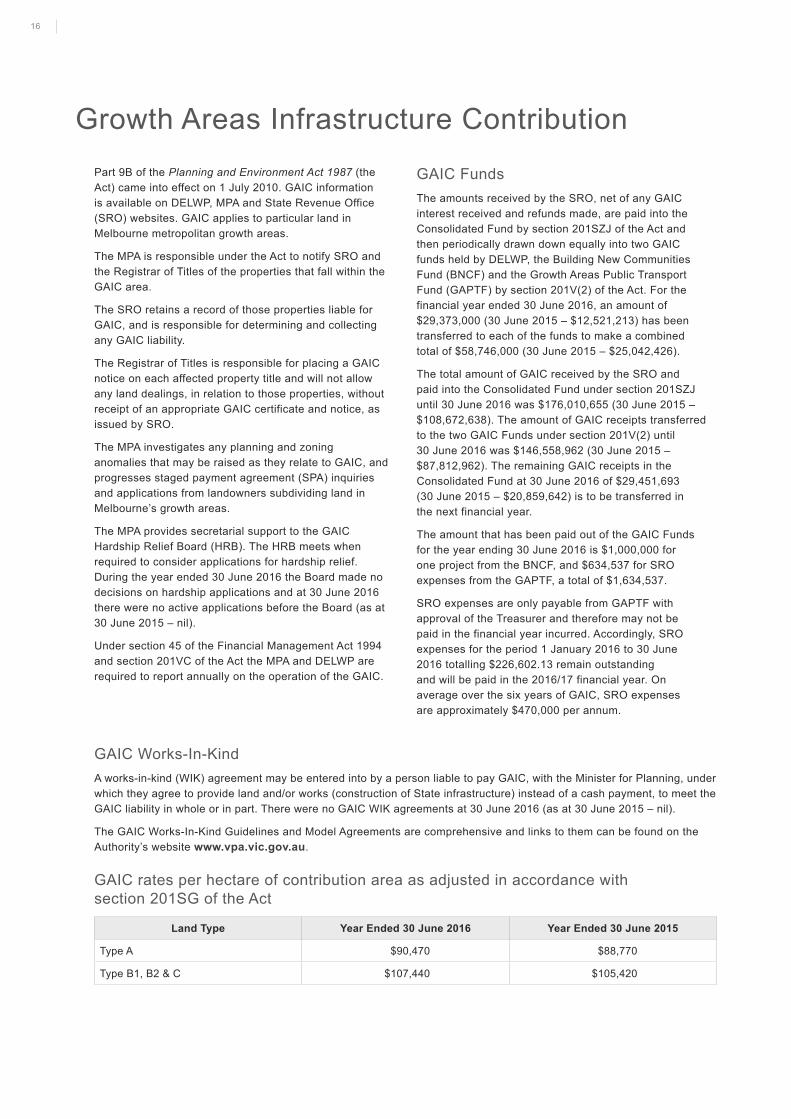
GAIC FundsThe amounts received by the SRO, net of any GAIC interest received and refunds made, are paid into the Consolidated Fund by section 201SZJ of the Act and then periodically drawn down equally into two GAIC funds held by DELWP, the Building New Communities Fund (BNCF) and the Growth Areas Public Transport Fund (GAPTF) by section 201V(2) of the Act. For the financial year ended 30 June 2016, an amount of $29,373,000 (30 June 2015 – $12,521,213) has been transferred to each of the funds to make a combined total of $58,746,000 (30 June 2015 – $25,042,426).
The total amount of GAIC received by the SRO and paid into the Consolidated Fund under section 201SZJ until 30 June 2016 was $176,010,655 (30 June 2015 – $108,672,638). The amount of GAIC receipts transferred to the two GAIC Funds under section 201V(2) until 30 June 2016 was $146,558,962 (30 June 2015 – $87,812,962). The remaining GAIC receipts in the Consolidated Fund at 30 June 2016 of $29,451,693 (30 June 2015 – $20,859,642) is to be transferred in the next financial year.
The amount that has been paid out of the GAIC Funds for the year ending 30 June 2016 is $1,000,000 for one project from the BNCF, and $634,537 for SRO expenses from the GAPTF, a total of $1,634,537.
SRO expenses are only payable from GAPTF with approval of the Treasurer and therefore may not be paid in the financial year incurred. Accordingly, SRO expenses for the period 1 January 2016 to 30 June 2016 totalling $226,602.13 remain outstanding and will be paid in the 2016/17 financial year. On average over the six years of GAIC, SRO expenses are approximately $470,000 per annum.
GAIC Works-In-KindA works-in-kind (WIK) agreement may be entered into by a person liable to pay GAIC, with the Minister for Planning, under which they agree to provide land and/or works (construction of State infrastructure) instead of a cash payment, to meet the GAIC liability in whole or in part. There were no GAIC WIK agreements at 30 June 2016 (as at 30 June 2015 – nil).
The GAIC Works-In-Kind Guidelines and Model Agreements are comprehensive and links to them can be found on the Authority’s website www.vpa.vic.gov.au.
GAIC rates per hectare of contribution area as adjusted in accordance with section 201SG of the Act
Land Type Year Ended 30 June 2016 Year Ended 30 June 2015
Type A $90,470 $88,770
Type B1, B2 & C $107,440 $105,420
17Metropolitan Planning Authority Annual Report 2015-2016
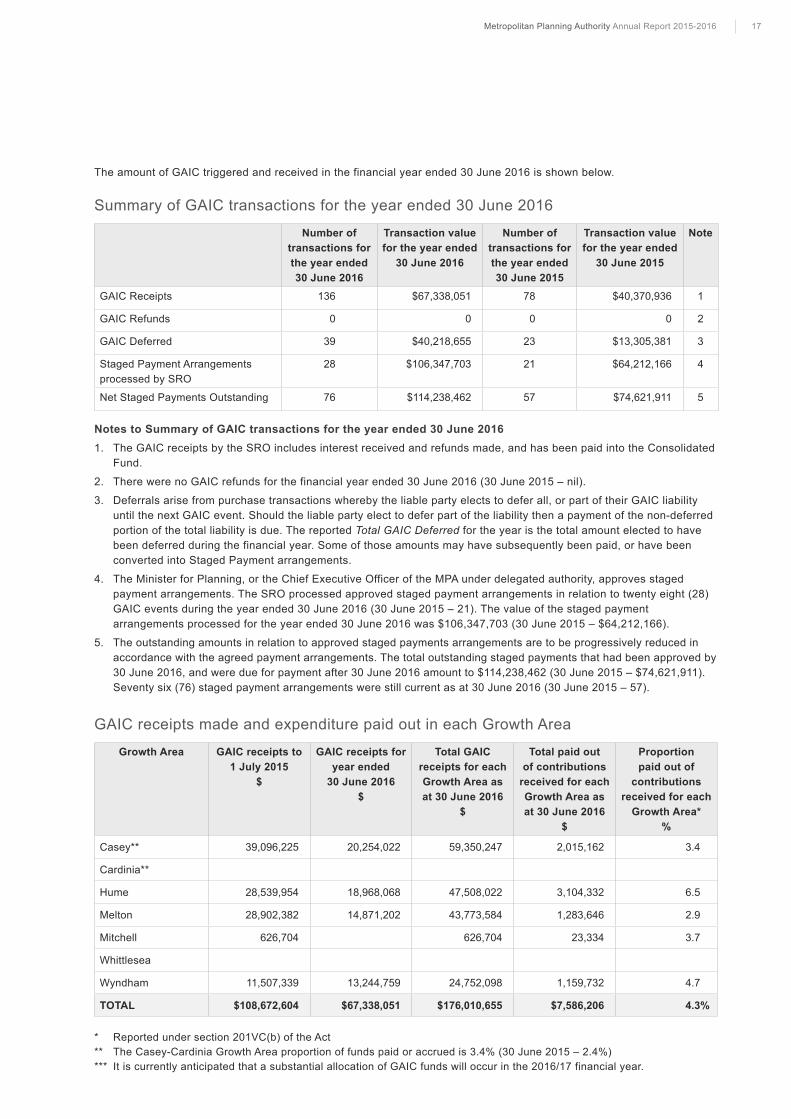
The amount of GAIC triggered and received in the financial year ended 30 June 2016 is shown below.
Summary of GAIC transactions for the year ended 30 June 2016
Number of transactions for the year ended 30 June 2016
Transaction value for the year ended
30 June 2016
Number of transactions for the year ended 30 June 2015
Transaction value for the year ended
30 June 2015
Note
GAIC Receipts 136 $67,338,051 78 $40,370,936 1
GAIC Refunds 0 0 0 0 2
GAIC Deferred 39 $40,218,655 23 $13,305,381 3
Staged Payment Arrangements processed by SRO
28 $106,347,703 21 $64,212,166 4
Net Staged Payments Outstanding 76 $114,238,462 57 $74,621,911 5
Notes to Summary of GAIC transactions for the year ended 30 June 20161. The GAIC receipts by the SRO includes interest received and refunds made, and has been paid into the Consolidated
Fund.
2. There were no GAIC refunds for the financial year ended 30 June 2016 (30 June 2015 – nil).
3. Deferrals arise from purchase transactions whereby the liable party elects to defer all, or part of their GAIC liability until the next GAIC event. Should the liable party elect to defer part of the liability then a payment of the non-deferred portion of the total liability is due. The reported Total GAIC Deferred for the year is the total amount elected to have been deferred during the financial year. Some of those amounts may have subsequently been paid, or have been converted into Staged Payment arrangements.
4. The Minister for Planning, or the Chief Executive Officer of the MPA under delegated authority, approves staged payment arrangements. The SRO processed approved staged payment arrangements in relation to twenty eight (28) GAIC events during the year ended 30 June 2016 (30 June 2015 – 21). The value of the staged payment arrangements processed for the year ended 30 June 2016 was $106,347,703 (30 June 2015 – $64,212,166).
5. The outstanding amounts in relation to approved staged payments arrangements are to be progressively reduced in accordance with the agreed payment arrangements. The total outstanding staged payments that had been approved by 30 June 2016, and were due for payment after 30 June 2016 amount to $114,238,462 (30 June 2015 – $74,621,911). Seventy six (76) staged payment arrangements were still current as at 30 June 2016 (30 June 2015 – 57).
GAIC receipts made and expenditure paid out in each Growth Area
Growth Area GAIC receipts to 1 July 2015
$
GAIC receipts for year ended
30 June 2016 $
Total GAIC receipts for each Growth Area as at 30 June 2016
$
Total paid out of contributions
received for each Growth Area as at 30 June 2016
$
Proportion paid out of
contributions received for each
Growth Area* %
Casey** 39,096,225 20,254,022 59,350,247 2,015,162 3.4
Cardinia**
Hume 28,539,954 18,968,068 47,508,022 3,104,332 6.5
Melton 28,902,382 14,871,202 43,773,584 1,283,646 2.9
Mitchell 626,704 626,704 23,334 3.7
Whittlesea
Wyndham 11,507,339 13,244,759 24,752,098 1,159,732 4.7
TOTAL $108,672,604 $67,338,051 $176,010,655 $7,586,206 4.3%
* Reported under section 201VC(b) of the Act** The Casey-Cardinia Growth Area proportion of funds paid or accrued is 3.4% (30 June 2015 – 2.4%)*** It is currently anticipated that a substantial allocation of GAIC funds will occur in the 2016/17 financial year.
18
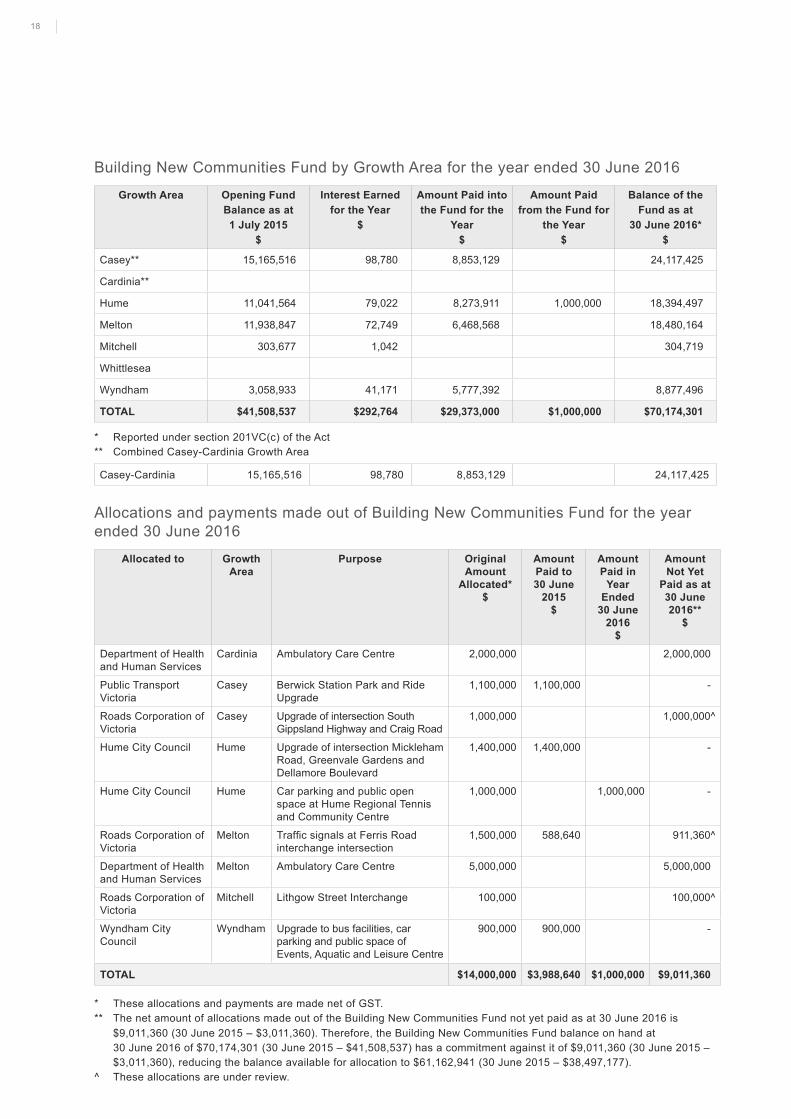
Building New Communities Fund by Growth Area for the year ended 30 June 2016
Growth Area Opening Fund Balance as at 1 July 2015
$
Interest Earned for the Year
$
Amount Paid into the Fund for the
Year $
Amount Paid from the Fund for
the Year $
Balance of the Fund as at
30 June 2016* $
Casey** 15,165,516 98,780 8,853,129 24,117,425
Cardinia**
Hume 11,041,564 79,022 8,273,911 1,000,000 18,394,497
Melton 11,938,847 72,749 6,468,568 18,480,164
Mitchell 303,677 1,042 304,719
Whittlesea
Wyndham 3,058,933 41,171 5,777,392 8,877,496
TOTAL $41,508,537 $292,764 $29,373,000 $1,000,000 $70,174,301
* Reported under section 201VC(c) of the Act** Combined Casey-Cardinia Growth Area
Casey-Cardinia 15,165,516 98,780 8,853,129 24,117,425
Allocations and payments made out of Building New Communities Fund for the year ended 30 June 2016
Allocated to Growth Area
Purpose Original Amount
Allocated* $
Amount Paid to 30 June
2015 $
Amount Paid in
Year Ended
30 June 2016
$
Amount Not Yet
Paid as at 30 June 2016**
$
Department of Health and Human Services
Cardinia Ambulatory Care Centre 2,000,000 2,000,000
Public Transport Victoria
Casey Berwick Station Park and Ride Upgrade
1,100,000 1,100,000 -
Roads Corporation of Victoria
Casey Upgrade of intersection South Gippsland Highway and Craig Road
1,000,000 1,000,000^
Hume City Council Hume Upgrade of intersection Mickleham Road, Greenvale Gardens and Dellamore Boulevard
1,400,000 1,400,000 -
Hume City Council Hume Car parking and public open space at Hume Regional Tennis and Community Centre
1,000,000 1,000,000 -
Roads Corporation of Victoria
Melton Traffic signals at Ferris Road interchange intersection
1,500,000 588,640 911,360^
Department of Health and Human Services
Melton Ambulatory Care Centre 5,000,000 5,000,000
Roads Corporation of Victoria
Mitchell Lithgow Street Interchange 100,000 100,000^
Wyndham City Council
Wyndham Upgrade to bus facilities, car parking and public space of Events, Aquatic and Leisure Centre
900,000 900,000 -
TOTAL $14,000,000 $3,988,640 $1,000,000 $9,011,360
* These allocations and payments are made net of GST.** The net amount of allocations made out of the Building New Communities Fund not yet paid as at 30 June 2016 is
$9,011,360 (30 June 2015 – $3,011,360). Therefore, the Building New Communities Fund balance on hand at 30 June 2016 of $70,174,301 (30 June 2015 – $41,508,537) has a commitment against it of $9,011,360 (30 June 2015 – $3,011,360), reducing the balance available for allocation to $61,162,941 (30 June 2015 – $38,497,177).
^ These allocations are under review.
19Metropolitan Planning Authority Annual Report 2015-2016
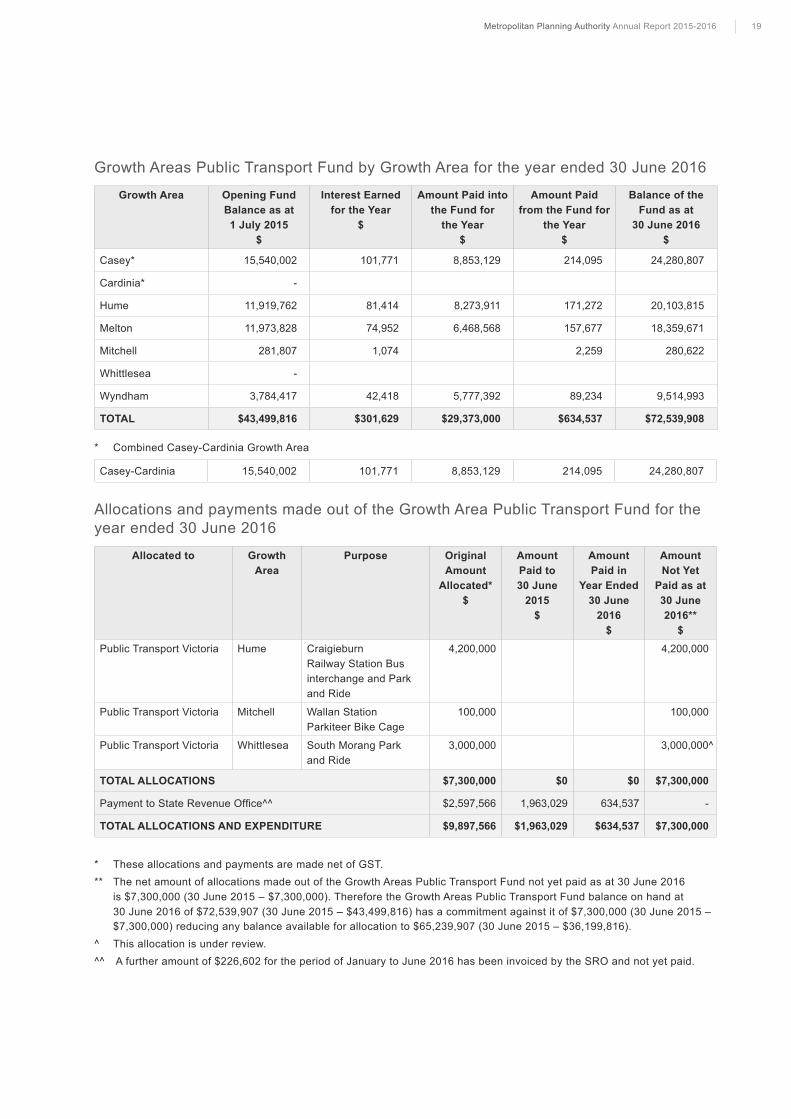
Growth Areas Public Transport Fund by Growth Area for the year ended 30 June 2016
Growth Area Opening Fund Balance as at 1 July 2015
$
Interest Earned for the Year
$
Amount Paid into the Fund for
the Year $
Amount Paid from the Fund for
the Year $
Balance of the Fund as at
30 June 2016 $
Casey* 15,540,002 101,771 8,853,129 214,095 24,280,807
Cardinia* -
Hume 11,919,762 81,414 8,273,911 171,272 20,103,815
Melton 11,973,828 74,952 6,468,568 157,677 18,359,671
Mitchell 281,807 1,074 2,259 280,622
Whittlesea -
Wyndham 3,784,417 42,418 5,777,392 89,234 9,514,993
TOTAL $43,499,816 $301,629 $29,373,000 $634,537 $72,539,908
* Combined Casey-Cardinia Growth Area
Casey-Cardinia 15,540,002 101,771 8,853,129 214,095 24,280,807
Allocations and payments made out of the Growth Area Public Transport Fund for the year ended 30 June 2016
Allocated to Growth Area
Purpose Original Amount
Allocated* $
Amount Paid to 30 June
2015 $
Amount Paid in
Year Ended 30 June
2016 $
Amount Not Yet
Paid as at 30 June 2016**
$Public Transport Victoria Hume Craigieburn
Railway Station Bus interchange and Park and Ride
4,200,000 4,200,000
Public Transport Victoria Mitchell Wallan Station Parkiteer Bike Cage
100,000 100,000
Public Transport Victoria Whittlesea South Morang Park and Ride
3,000,000 3,000,000^
TOTAL ALLOCATIONS $7,300,000 $0 $0 $7,300,000
Payment to State Revenue Office^^ $2,597,566 1,963,029 634,537 -
TOTAL ALLOCATIONS AND EXPENDITURE $9,897,566 $1,963,029 $634,537 $7,300,000
* These allocations and payments are made net of GST.** The net amount of allocations made out of the Growth Areas Public Transport Fund not yet paid as at 30 June 2016
is $7,300,000 (30 June 2015 – $7,300,000). Therefore the Growth Areas Public Transport Fund balance on hand at 30 June 2016 of $72,539,907 (30 June 2015 – $43,499,816) has a commitment against it of $7,300,000 (30 June 2015 – $7,300,000) reducing any balance available for allocation to $65,239,907 (30 June 2015 – $36,199,816).
^ This allocation is under review.^^ A further amount of $226,602 for the period of January to June 2016 has been invoiced by the SRO and not yet paid.
20
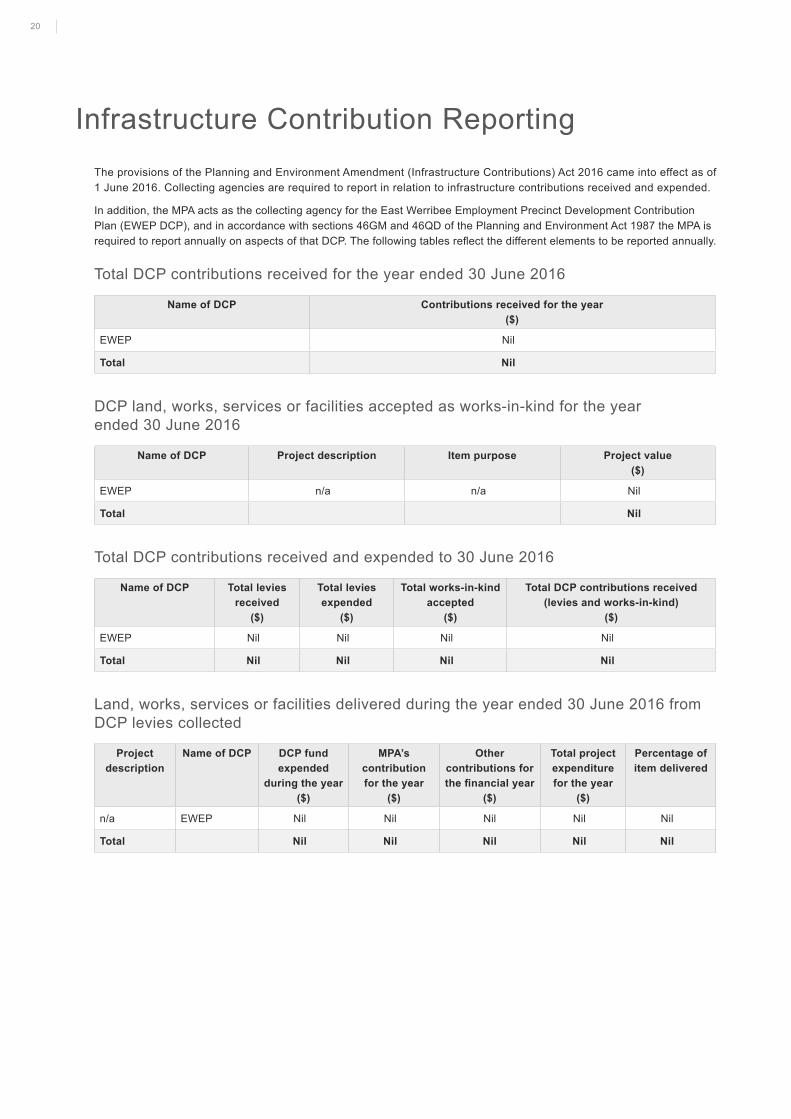
Infrastructure Contribution ReportingThe provisions of the Planning and Environment Amendment (Infrastructure Contributions) Act 2016 came into effect as of 1 June 2016. Collecting agencies are required to report in relation to infrastructure contributions received and expended.
In addition, the MPA acts as the collecting agency for the East Werribee Employment Precinct Development Contribution Plan (EWEP DCP), and in accordance with sections 46GM and 46QD of the Planning and Environment Act 1987 the MPA is required to report annually on aspects of that DCP. The following tables reflect the different elements to be reported annually.
Total DCP contributions received for the year ended 30 June 2016
Name of DCP Contributions received for the year ($)
EWEP Nil
Total Nil
DCP land, works, services or facilities accepted as works-in-kind for the year ended 30 June 2016
Name of DCP Project description Item purpose Project value ($)
EWEP n/a n/a Nil
Total Nil
Total DCP contributions received and expended to 30 June 2016
Name of DCP Total levies received
($)
Total levies expended
($)
Total works-in-kind accepted
($)
Total DCP contributions received (levies and works-in-kind)
($)
EWEP Nil Nil Nil Nil
Total Nil Nil Nil Nil
Land, works, services or facilities delivered during the year ended 30 June 2016 from DCP levies collected
Project description
Name of DCP DCP fund expended
during the year ($)
MPA’s contribution for the year
($)
Other contributions for the financial year
($)
Total project expenditure for the year
($)
Percentage of item delivered
n/a EWEP Nil Nil Nil Nil Nil
Total Nil Nil Nil Nil Nil
21Metropolitan Planning Authority Annual Report 2015-2016
MPA Organisation and Staff as at 30 June 2016A
UTH
OR
ITY
MEM
BER
SLe
onie
Hem
ingw
ay (C
hair)
Laur
inda
Gar
dner
, Bria
n H
arat
sis,
Bill
Kus
nirc
zuk,
Fr
eya
Mar
sden
, the
Hon
.The
o Th
eoph
anou
s
CEO
Pet
er S
eam
erD
IREC
TOR
INN
OVA
TIO
N
& R
EFO
RM
Ja
ne M
onk
DIR
ECTO
R P
AR
TNER
SHIP
S &
CO
MM
UN
ICAT
ION
Rac
hel D
apira
n
CH
IEF
OF
STA
FFJe
nni T
esm
er
TEC
HN
ICA
L SE
RVI
CES
UR
BA
N R
ENEW
AL
GR
OW
TH A
REA
SR
EGIO
NA
L
CO
RPO
RAT
E SE
RVI
CES
(LEA
D)
Ed
Sm
all
DIR
ECTO
R
UR
BA
N
REN
EWA
L(L
EAD
)S
teve
Dun
n
DIR
ECTO
R
GR
OW
TH
AR
EAS
(LEA
D)
Pau
l Byr
ne
DIR
ECTO
R
REG
ION
AL
PLA
NN
ING
(L
EAD
)Ti
m P
eggi
e
TEC
HN
ICA
L SE
RVI
CES
Mar
k K
nuds
en
STR
ATEG
IC
PLA
NN
ING
D
IREC
TOR
Em
ily
Mot
tram
STR
ATEG
IC
PLA
NN
ING
D
IREC
TOR
Pau
l Cas
sidy
STR
ATEG
IC
PLA
NN
ING
D
IREC
TOR
Kar
olin
e W
are
STR
ATEG
IC
PLA
NN
ING
D
IREC
TOR
Emily
H
illebr
and
STR
ATEG
IC
PLA
NN
ING
D
IREC
TOR
Mar
tina
John
son
TEC
HN
ICA
L SU
PPO
RT:
• Tr
ansp
ort P
lann
ing
• In
frast
ruct
ure
Pla
nnin
g •
Wat
er M
anag
emen
t•
Com
mun
ity In
frast
ruct
ure
• G
raph
ics
STAT
UTO
RY P
LAN
NIN
G
GA
IC/ F
UN
DIN
G C
OO
RD
INAT
ION
FIN
AN
CE
HU
MA
N R
ESO
UR
CES
INFO
RM
ATIO
N T
ECH
NO
LOG
Y
DAT
A A
ND
EC
ON
OM
IC P
LAN
NIN
G
UR
BA
N R
ENEW
AL
• M
onas
h C
lust
er•
La T
robe
Clu
ster
• S
unsh
ine/
St A
lban
s C
lust
er•
Bro
adm
eado
ws
MA
C•
Ess
endo
n Te
chno
logy
Pre
cinc
t•
Cau
lfi el
d•
Ber
wic
k H
ealth
INN
ER C
ITY
FRA
MEW
OR
K P
LAN
AR
DEN
PR
ECIN
CT
AFF
OR
DA
BLE
HO
USI
NG
OPE
N S
PAC
E PL
AN
NIN
G
PSP
GU
IDEL
INES
REF
RES
H
GR
OW
TH C
OR
RID
OR
S•
Wyn
dham
• M
elto
n•
Hum
e/M
itche
ll•
Whi
ttles
ea•
Cas
ey/C
ardi
nia
EAST
WER
RIB
EE
REG
ION
AL
• B
endi
go•
Bac
chus
Mar
sh•
Latro
be•
She
ppar
ton
• W
odon
ga•
Torq
uay
CO
UN
CIL
SU
PPO
RT
PRO
GR
AM
(Thi
s gr
oup
will
als
o pl
an
Sun
bury
and
Wal
lan
in th
e H
ume
Cor
ridor
)
RES
EAR
CH
Pau
l Byr
ne
22
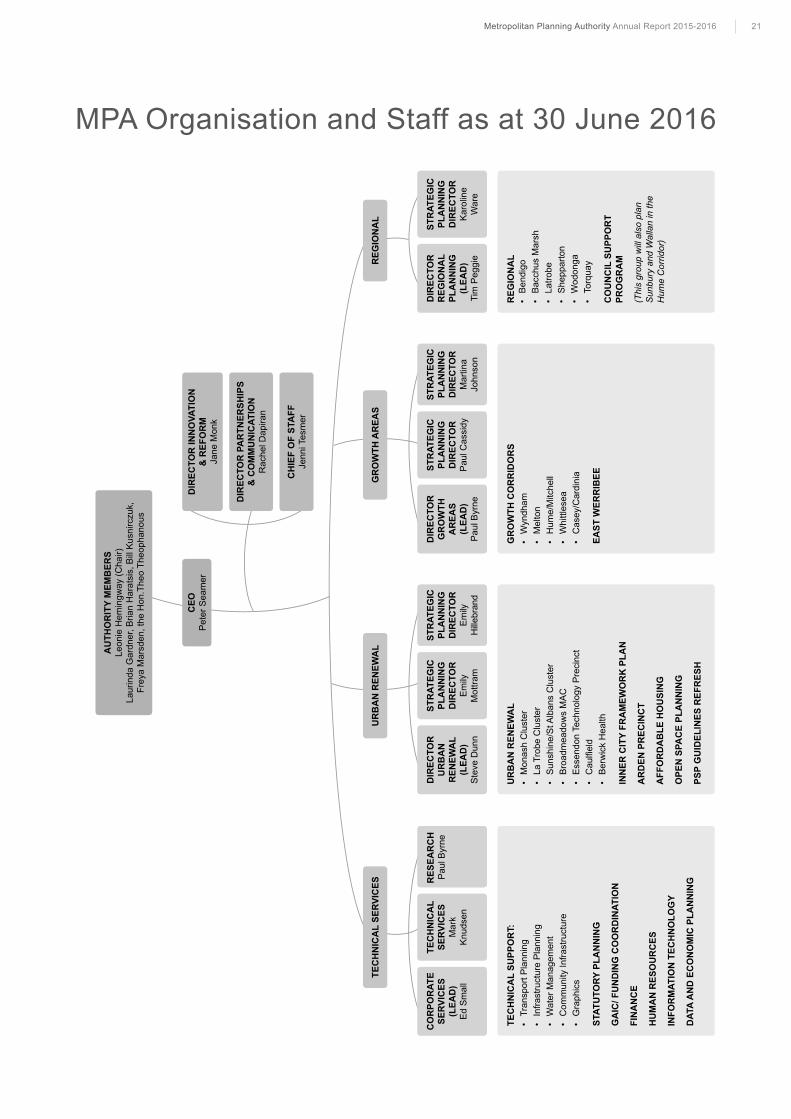
Organisational structure of the MPA reflects the key strategic areas of its workThe MPA is structured around four groups that reflect the key activity streams of the soon to be established VPA. The groups are now organised into 11 teams, in a manner that optimises the capacity of VPA to conduct its activities.
The Regional Group comprises two teams and is responsible for working closely with the local councils and DELWP for preparing master plans to assist in optimising economic, employment and housing opportunities for identified regional projects. This group is continuing working with the relevant Councils in the Bacchus Marsh, Bendigo, Surf Coast, Wodonga and Shepparton areas. These teams also have responsibility for providing planning assistance, when requested by the Minister, to regional Victoria.
The Urban Renewal Group is responsible for preparing employment PSPs and also for developing planning and design approaches for town and city centres. It comprises of three teams. The Group manages PSP preparation for industrial and town centres in metropolitan Melbourne. This group is active in the key NECs and Major Activity Centres of Broadmeadows, Monash, La Trobe and Sunshine, and also the renewal of the Arden Precinct.
The Growth Areas Group is responsible for strategic planning in Melbourne’s greenfield Growth Areas. This Group comprises three teams. These teams work in partnership with the local council to complete PSPs for land within the existing urban growth boundary in accordance with the program approved by the Minister. This team completed four PSPs in 2015/16. The responsibility for the rollout of the development of the East Werribee Employment Precinct also falls within this group, but is expected to transfer away from the Authority during 2016/17.
The Technical Services Group incorporates, the Technical Services Team, the Corporate and Statutory Services Team and the Research Team.
• The Technical Services Team is responsible for supporting the planning and other operations of the VPA through the provision of technical advice, infrastructure coordination planning and graphics, GIS and drafting support. This Team also focuses on Local Infrastructure Planning.
• The Corporate and Statutory Services Team is responsible for the governance activities at the VPA (including finance, human resources, administrative and information technology functions). These activities incorporate the VPA’s administration of the GAIC and providing support for the GAIC Hardship Relief Board. This team also has responsibility for corporate wide activities, such as insurance, risk management and the costs of the VPA offices. This team also conducts the organisation’s statutory planning activities, and also has the important responsibility for ensuring that the VPA is appropriately prepared for Planning Panels.
• This Group also includes a small Research Team which coordinates the VPA’s economic research and design activities.
Two other smaller teams, which report directly to the Chief Executive Officer complete the VPA organisational structure.
The Partnerships and Communication Team has the key role of managing and coordinating the interaction with all government authorities, policy input, relationship building and this team also has the responsibility for the organisation’s media and communication activities.
The Innovation and Reform Team is charged with the responsibility of identifying and implementing streamlining opportunities for post-PSP planning.
People at the MPA
People Management Strategy
The MPA has a small core of staff to meet its operational needs and to provide expert assistance in key areas.
The MPA has invested major effort in the recruitment of experienced professional staff in the areas of statutory and strategic urban planning, policy development and corporate support. The MPA has comprehensive policies and systems to ensure the ongoing development of its overall capability.
Occupational Health and Safety
The MPA has a clear commitment to OH&S compliance as well as general staff health and well-being, set out in its A Healthy, Safe and Supportive Workplace Policy.
The MPA maintains an internal staff and management Occupational Health and Safety Committee which meets regularly during the year. The Authority receives regular reports in relation to OHS matters through its Board meetings.
The MPA’s OHS performance target is to have zero OHS incidents for the year. The results are:
2015-2016
2014-2015
2013-2014
Reported Incidents 0 2 0
Claims with Lost Time 0 2 0
Days Lost 0 4 0
Average Cost per Claim 0 $1,296 $0
During the reporting year the Authority had up to 89 staff and:• 58 staff received influenza vaccinations• 0 incidents relating to our premises reported to WorkSafe• 3 comprehensive internally conducted workplace
inspections• appointed 2 new trained fire wardens• appointed 2 new OHS Committee employee
representative members• 46 staff received ergonomic work station assessments.
23Metropolitan Planning Authority Annual Report 2015-2016
Managing and Valuing Diversity and MeritThe MPA promotes equal employment opportunity through diversity in its policies and practices. A flexible and supportive workplace is provided through flexible working hours and leave arrangements.
MPA policies and programs consider issues relating to women, youth, and people from indigenous, culturally and linguistically diverse backgrounds. Activities relating to diversity included staff holding ‘A Taste of Harmony’ lunch during Harmony Week in March 2016.
The Chief Executive Officer made 8 internal appointments and 22 external appointments based on merit during the period.
Number of MPA Staff (headcount) as at 30 June 2016Employees have been classified in workforce data collection as below.
Category Staff 2016 Staff 2015
VPS 1-7 Staff
Male 35 34
Female 46 42
Other 0 0
Executive Staff*
Male 6 6
Female 2 2
Other 0 0
Total Staff 89 84
Category Staff 2016 Staff 2015
All Staff
Male 41 40
Female 48 44
Other 0 0
Total 89 84
* These are staff employed under Executive Officer contracts. The MPA’s senior staff members are shown on page 21.
The MPA is currently operating under the GAA Enterprise Agreement 2012 which had a nominal expiry date of 31 December 2015. The negotiations for a new enterprise agreement are progressing well, and it is anticipated that the MPA staff will be requested to vote on the acceptance of a draft agreement early in the 2016/17 financial year.
Upholding Public Sector ConductThe MPA is responsible for promoting high standards of integrity and conduct in the public sector. Staff observe, and are fully informed about, the Code of Conduct for the Victorian Public Sector and the Public Administration Act 2004 regarding “Upholding public sector conduct”.
The Public Administration Act 2004 provides the following employment and conduct principles:
Employers must ensure: Employees must:
Decisions are made on merit Act with impartiality
Employees are treated fairly and reasonably
Display integrity, including avoiding real or apparent conflicts of interest
Equal employment opportunity is provided
Show accountability for actions
Reasonable avenues of redress exist against unfair and unreasonable treatment.
Provide responsive service.
New staff are required to undertake online training in regard to conflicts of interest, privacy and ethical behavior, and existing staff also have access to this online training to update their knowledge in these areas. Staff were also provided with an annual refresher training in June 2015 on code of conduct, protected disclosures (whistleblowers), probity, conflict of interest, record keeping, privacy, freedom of information, bullying and harassment, equal opportunity and human rights.
Any aspects which may arise in relation to these matters are reported at Authority Meetings.
Disability Action PlanThe MPA formally endorsed the implementation of its Disability Action Plan on 7 September 2015. Our comprehensive plan sets out how we can reduce barriers for those with a disability who wish to participate or engage with our key activities. Actions set out in this plan apply to all aspects of our organisation, including employment, community consultation and planning for new communities as well as urban renewal and the evolution of regional centres. We continue to implement action items from within the plan across the organisation. The plan can be accessed via www.vpa.vic.gov.au/about/disability-action-plan.
24
Additional Information
Environment StrategyThe MPA is committed to working towards environmental sustainability in both its operations and in the planning of new communities. It will do this by:
1. Striving to be an environmentally responsible organisation in its own operations.
2. Working towards improving the liveability and sustainability of the natural and built environment within new communities.
The 2015/16 Business Plan includes the promotion of the sustainable development of land and the integration of land use and transport to enable the coordinated provision of a sustainable transport system as key objectives of the MPA. Results against the Business Plan measures are reported in the Authority Performance segment of the Annual Report.
Office Based Targets and InitiativesThe MPA reports annually against a number of indicators. The measures for 2015/16 are set out in the table below:
INDICATOR 2015-2016 Actual
Estimated Carbon
Equivalent (Tonnes)
2014-2015 Actual
Estimated Carbon
Equivalent (Tonnes)
Net % Change
Notes
ELECTRICITY
Total electricity used (kWh) 111,420 104.73 84,103 73.17 43% 1
PAPER
Daily paper ream use per employee 0.061 7.25 0.048 5.54 31% 2
TRANSPORT
Annual total Hybrid Pool Vehicle travel (km) 40.426 4.47 24.487 3.27 37% 3
New staff taking up public transport options for travel
100% Data N/A 100% Data N/A 0% 4
Other transport per employee per year (Km) 151 2.25 279 5.32 -58% 5
Number of flights taken - national 6 1.38 2 2.14 -36%
Number of flights taken - international 0 0 0 0 0%
WATER
Total water used (kL) Data N/A Data N/A 6
TOTAL EMISSIONS (Carbon Equivalent Tonnes) 120.08 89.44 34%
Notes to Office Based Targets and Initiatives1. Electricity consumption – in 2016/17 the MPA is to be a contributor to the GreenPower program.
2. Printing controls –The increase in paper usage is partially due to the increased use of Planning Panels over the past 12 months, and the Panels’ requirements for multiple copies of extensive documents.
3. There has been an increased organisational focus on regional planning with resulting increases in travel.
4. Public transport – Of new staff for the 2015/16 year, 42% make use of the myki commuter club program through the MPA, while the remainder either use their own existing myki or cycle to work. This results in 99% of staff not driving to work on a regular basis.
5. The MPA has sought to reduce the use of hire cars and taxis over the year.
6. Water consumption – Water consumption is centrally managed by AMP building management. The information was not available on a tenancy basis.
25Metropolitan Planning Authority Annual Report 2015-2016
Waste ManagementThe Authority continues to participate in enhanced waste management programs and recycling initiatives to dispose of redundant electronic equipment, through Collins Place Management. The enhanced waste management program incorporates:
• Expanded co-mingled recycling, including recycling boxes at all staff desks
• Removal of rubbish bins from all staff desks
• Introduction of separate bin and collection for organic waste
Freedom of InformationVictoria’s Freedom of Information Act 1982 (FOI Act) gives members of the public the right to apply for access to documents held by an agency, including the MPA. In accordance with Part II of the FOI Act, this Information Statement outlines the role of the MPA, documents held by the MPA, and how these can be accessed under the FOI Act.
Organisation and Functions
The MPA is the State’s strategic planning authority, and is responsible for preparing planning scheme amendments for areas of state significance. The functions of the MPA are described on page 11 of this Report. In carrying out these functions, the MPA consults widely with local councils, other government agencies, local communities and the development industry. Proposed planning scheme amendments are exhibited on the MPA’s website in line with the requirements of the Planning and Environment Act 1987.
Categories of Documents
A majority of documents held by the MPA relate to the preparation of strategic plans for particular precincts. Documents typically include correspondence, meeting records, background reports and maps. The MPA also holds correspondence and meeting records regarding our involvement in the development of government policy on planning related issues, and documents regarding our administrative functions. The MPA uses an electronic document and records management system to store and manage all documents electronically.
FOI Arrangements
A freedom of information request must be made in writing to the agency that holds the documents being requested. The MPA officer responsible for receiving and initially actioning requests made under the FOI Act is Ed Small, who can be contacted on 03 9651 9600 or [email protected]. As from 1 July 2016, there is a fee of $27.90 payable for each FOI application (30 June 2016 – $27.20).
The Department of Justice also provides general information on its website, FOI online, about making FOI requests. A copy of the FOI Act is available at www.foi.vic.gov.au.
Publications
The MPA publishes a range of documents on our website, including approved PSPs, draft PSPs released for consultation, and background reports prepared for each PSP. A regular newsletter is also published on our website. Other information which is available on request under the Minister of Finance’s standing directions is outlined below.
Rules, Policies and Procedures
The preparation of PSPs is governed by the MPA’s Precinct Structure Planning Guidelines, which are published on the MPA website.
Report Literature
The MPA typically engages a range of expert consultants to produce background reports on different aspects of each PSP (e.g. traffic, cultural heritage, water, community infrastructure, etc.). These reports are generally published on the MPA website when the draft PSP is released for consultation.
FOI Requests for 2015/16
During the year ended 30 June 2016 six new requests were received by the MPA (to 30 June 2015 – four were received). All requests related to activities of government. Two requests were from the media, two were from a community group, one was from a landowner, and one was from a business. For all six requests, documents were released in part. There were no appeals to VCAT by FOI applicants.
Other information required to be available in accordance with FRD22G and Freedom of Information Act 1982The following information, where it relates to the MPA and is relevant to the financial year ended 30 June 2016, is available to the Minister for Planning, Members of Parliament and the public on request:
a. a statement that declarations of pecuniary interests have been duly completed by all relevant officers
b. changes in fees, charges, rates or levies charged
c. details of publications produced by the entity, about the entity, and the places where the publications can be obtained
d. details of any major external reviews carried out on the entity
e. details of any major research and development activities undertaken by the entity
26
f. details of major promotional, public relations and marketing activities undertaken by the entity to develop community awareness of the entity and the services it provides
g. details of assessments and measures undertaken to improve the occupational health and safety of employees, not otherwise detailed in the Report of Operations
h. a general statement on industrial relations within the entity and details of time lost through industrial action and disputes
i. a list of major committees sponsored by the entity, the purposes of each committee, and the extent to which the purposes have been achieved.
j. details of all consultancies and contractors including: - consultants/contractors engaged - services provided - expenditure committed to for each engagement
The following information is not relevant to the MPA for the reasons set out below:a. details of shares held by a senior officer as nominee or
held beneficially in a statutory authority or subsidiary (no shares have ever been issued in the MPA)
b. details of overseas visits undertaken including a summary of the objectives and outcomes of each visit (no overseas visits were undertaken as part of MPA business)
Protected Disclosures Act 2012The Protected Disclosures Act 2012 (PD Act) forms part of the integrity system for Victoria. The PD Act aims to provide a system for people to disclose improper conduct by public officers and public bodies as well as protection from detrimental action.
The MPA encourages the reporting of known or suspected incidences of improper conduct or detrimental actions to the Independent Broad-based Anti-corruption Commission (IBAC). The contact at the MPA is Ed Small, on (03) 9651 9600. Alternatively, IBAC contacts are via www.ibac.vic.gov.au, or 1300 735 135.
During the year ended 30 June 2016 there were no disclosures or investigations of improper conduct or detrimental actions made to the MPA or any referred to IBAC (30 June 2015 – nil).
The MPA has adopted a Protected Disclosures Policy and Procedures.
Improving AccessibilityThe MPA is committed to providing access to information to all members of the community. In relation to the access to material on the MPA’s website, the MPA provides detailed information on how to access and read MPA documents, and provides a contact facility for resolving any queries, by way of the e-mail address of [email protected].
Extent and compliance with the Building Act 1993The MPA complies with the building and maintenance provisions of the Building Act 1993 in its capacity as an occupant of leased premises.
Victorian Industry Participation Policy (VIPP) and disclosure of major contractsDuring the reporting period, the MPA did not commence or conclude any contracts to which VIPP applied.
National Competition PolicyAs a portfolio agency, the MPA’s information on compliance is included in DELWP’s Annual Report.
Competitive neutrality seeks to enable fair competition between government and private sector businesses. Any advantages or disadvantages that government businesses may experience simply as a result of government ownership, should be neutralised. The MPA continues to implement and apply this principle to its business undertakings where applicable.
Contracts and ConsultanciesDuring the financial year ended 30 June 2016, there were 101 consultancy engagements (30 June 2015 – 55) for which services were provided and/or were effective or operational during the reporting period that were individually valued at $10,000 or greater (exclusive of GST). Details of these consultancy engagements have been made available on the MPA’s website at www.vpa.vic.gov.au.
In addition to contracts valued at over $10,000, there were 55 contracts for consultancies that were individually valued at less than $10,000 (exclusive of GST) (30 June 2015 – 50). Total expenditure relating to these contracts amounted to $198,873 for the financial year (30 June 2015 – $183,181).
The MPA did not award any major contracts (valued at $10 million or more) during 2015/16.
Government Advertising ExpenditureMPA’s expenditure on government advertising did not exceed $100,000 during the 30 June 2016 reporting period.
Information and Communication Technology (ICT) ExpenditureFor the 2015/16 reporting period, the MPA had a total ICT expenditure of $258,983. This comprises Business As Usual ICT expenditure of $218,373 (this relates to operating and maintaining the current ICT capability), and Non Business As Usual ICT expenditure of $40,610 (this relates to extending or enhancing current ICT capabilities).
27Metropolitan Planning Authority Annual Report 2015-2016
Risk ManagementThe MPA has a Risk Management Plan and Risk Register in place prepared in accordance with the Australian Standard AS/NZS ISO 31000:2009. The Risk Register was prepared from risks identified through workshops with MPA staff members and the contribution of Authority Members. The Risk and Audit Committee regularly monitor the risk management and risk mitigation progress. The MPA has ensured that the risk profile has been reviewed regularly, both internally and externally.
These processes have enabled the Risk and Audit Committee at its meeting of 22 June 2016 to endorse the MPA’s Chair, as the attester of risk management processes contained in this annual report.
Attestation by Chair in relation to Risk Management at the MPAI, Bill Kusznirczuk, certify that the Growth Areas Authority (known as the Metropolitan Planning Authority) has complied with the Ministerial Standing Direction 4.5.5 - Risk Management Framework and Processes. The Risk and Audit Committee of the Metropolitan Planning Authority verifies this assurance.
W.R. (Bill) Kusznirczuk Acting Chair Victorian Planning Authority
21 September 2016
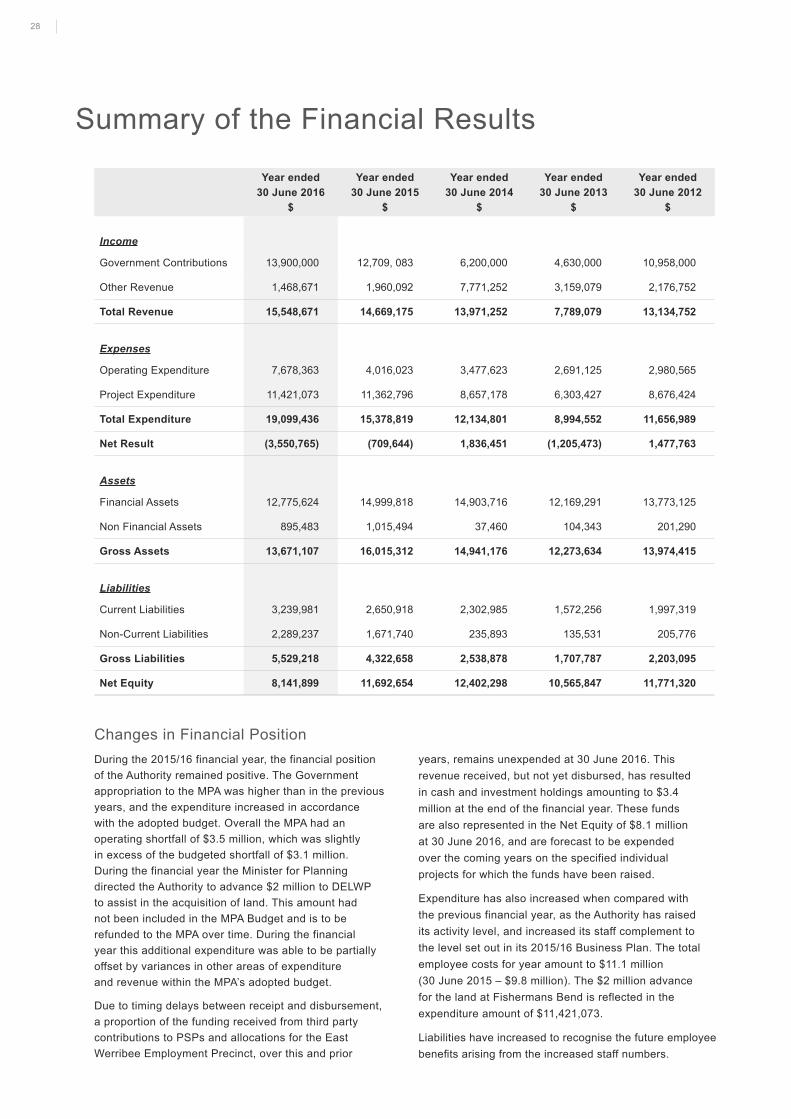
28
Summary of the Financial Results
Year ended 30 June 2016
$
Year ended 30 June 2015
$
Year ended 30 June 2014
$
Year ended 30 June 2013
$
Year ended 30 June 2012
$
Income
Government Contributions 13,900,000 12,709, 083 6,200,000 4,630,000 10,958,000
Other Revenue 1,468,671 1,960,092 7,771,252 3,159,079 2,176,752
Total Revenue 15,548,671 14,669,175 13,971,252 7,789,079 13,134,752
Expenses
Operating Expenditure 7,678,363 4,016,023 3,477,623 2,691,125 2,980,565
Project Expenditure 11,421,073 11,362,796 8,657,178 6,303,427 8,676,424
Total Expenditure 19,099,436 15,378,819 12,134,801 8,994,552 11,656,989
Net Result (3,550,765) (709,644) 1,836,451 (1,205,473) 1,477,763
Assets
Financial Assets 12,775,624 14,999,818 14,903,716 12,169,291 13,773,125
Non Financial Assets 895,483 1,015,494 37,460 104,343 201,290
Gross Assets 13,671,107 16,015,312 14,941,176 12,273,634 13,974,415
Liabilities
Current Liabilities 3,239,981 2,650,918 2,302,985 1,572,256 1,997,319
Non-Current Liabilities 2,289,237 1,671,740 235,893 135,531 205,776
Gross Liabilities 5,529,218 4,322,658 2,538,878 1,707,787 2,203,095
Net Equity 8,141,899 11,692,654 12,402,298 10,565,847 11,771,320
Changes in Financial PositionDuring the 2015/16 financial year, the financial position of the Authority remained positive. The Government appropriation to the MPA was higher than in the previous years, and the expenditure increased in accordance with the adopted budget. Overall the MPA had an operating shortfall of $3.5 million, which was slightly in excess of the budgeted shortfall of $3.1 million. During the financial year the Minister for Planning directed the Authority to advance $2 million to DELWP to assist in the acquisition of land. This amount had not been included in the MPA Budget and is to be refunded to the MPA over time. During the financial year this additional expenditure was able to be partially offset by variances in other areas of expenditure and revenue within the MPA’s adopted budget.
Due to timing delays between receipt and disbursement, a proportion of the funding received from third party contributions to PSPs and allocations for the East Werribee Employment Precinct, over this and prior
years, remains unexpended at 30 June 2016. This revenue received, but not yet disbursed, has resulted in cash and investment holdings amounting to $3.4 million at the end of the financial year. These funds are also represented in the Net Equity of $8.1 million at 30 June 2016, and are forecast to be expended over the coming years on the specified individual projects for which the funds have been raised.
Expenditure has also increased when compared with the previous financial year, as the Authority has raised its activity level, and increased its staff complement to the level set out in its 2015/16 Business Plan. The total employee costs for year amount to $11.1 million (30 June 2015 – $9.8 million). The $2 million advance for the land at Fishermans Bend is reflected in the expenditure amount of $11,421,073.
Liabilities have increased to recognise the future employee benefits arising from the increased staff numbers.
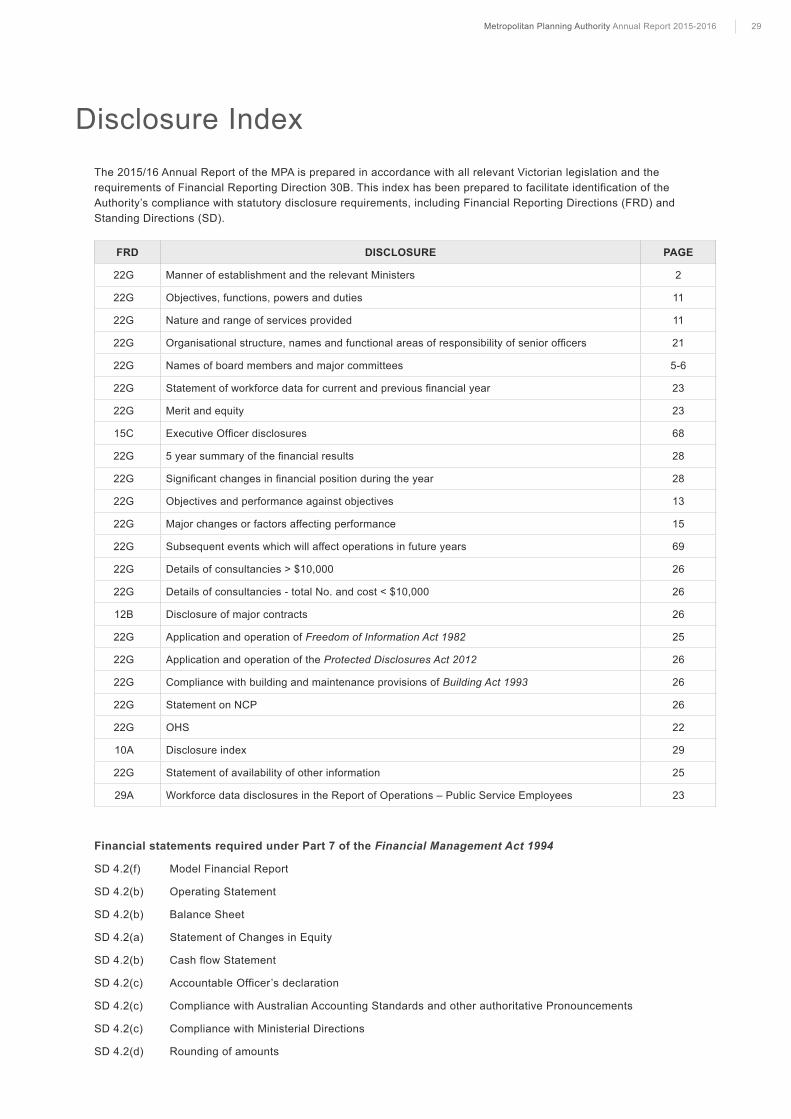
29Metropolitan Planning Authority Annual Report 2015-2016
Disclosure IndexThe 2015/16 Annual Report of the MPA is prepared in accordance with all relevant Victorian legislation and the requirements of Financial Reporting Direction 30B. This index has been prepared to facilitate identification of the Authority’s compliance with statutory disclosure requirements, including Financial Reporting Directions (FRD) and Standing Directions (SD).
FRD DISCLOSURE PAGE
22G Manner of establishment and the relevant Ministers 2
22G Objectives, functions, powers and duties 11
22G Nature and range of services provided 11
22G Organisational structure, names and functional areas of responsibility of senior officers 21
22G Names of board members and major committees 5-6
22G Statement of workforce data for current and previous financial year 23
22G Merit and equity 23
15C Executive Officer disclosures 68
22G 5 year summary of the financial results 28
22G Significant changes in financial position during the year 28
22G Objectives and performance against objectives 13
22G Major changes or factors affecting performance 15
22G Subsequent events which will affect operations in future years 69
22G Details of consultancies > $10,000 26
22G Details of consultancies - total No. and cost < $10,000 26
12B Disclosure of major contracts 26
22G Application and operation of Freedom of Information Act 1982 25
22G Application and operation of the Protected Disclosures Act 2012 26
22G Compliance with building and maintenance provisions of Building Act 1993 26
22G Statement on NCP 26
22G OHS 22
10A Disclosure index 29
22G Statement of availability of other information 25
29A Workforce data disclosures in the Report of Operations – Public Service Employees 23
Financial statements required under Part 7 of the Financial Management Act 1994
SD 4.2(f) Model Financial Report
SD 4.2(b) Operating Statement
SD 4.2(b) Balance Sheet
SD 4.2(a) Statement of Changes in Equity
SD 4.2(b) Cash flow Statement
SD 4.2(c) Accountable Officer’s declaration
SD 4.2(c) Compliance with Australian Accounting Standards and other authoritative Pronouncements
SD 4.2(c) Compliance with Ministerial Directions
SD 4.2(d) Rounding of amounts
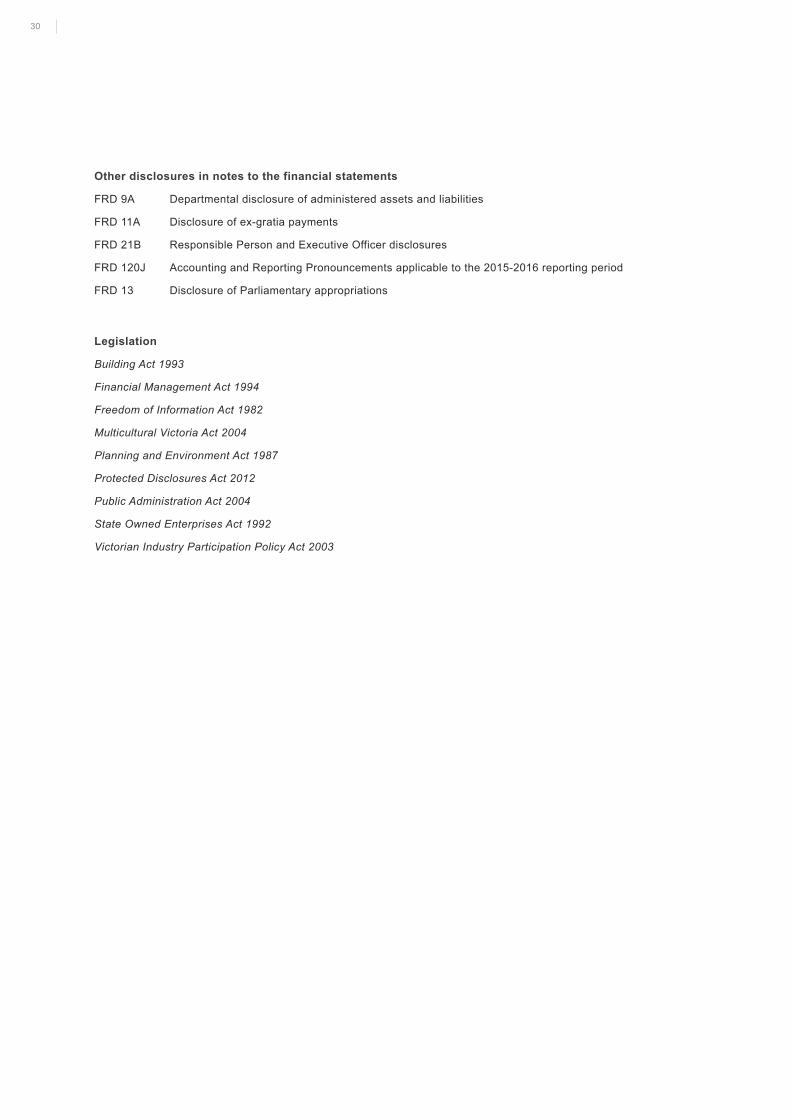
30
Other disclosures in notes to the financial statements
FRD 9A Departmental disclosure of administered assets and liabilities
FRD 11A Disclosure of ex-gratia payments
FRD 21B Responsible Person and Executive Officer disclosures
FRD 120J Accounting and Reporting Pronouncements applicable to the 2015-2016 reporting period
FRD 13 Disclosure of Parliamentary appropriations
Legislation
Building Act 1993
Financial Management Act 1994
Freedom of Information Act 1982
Multicultural Victoria Act 2004
Planning and Environment Act 1987
Protected Disclosures Act 2012
Public Administration Act 2004
State Owned Enterprises Act 1992
Victorian Industry Participation Policy Act 2003
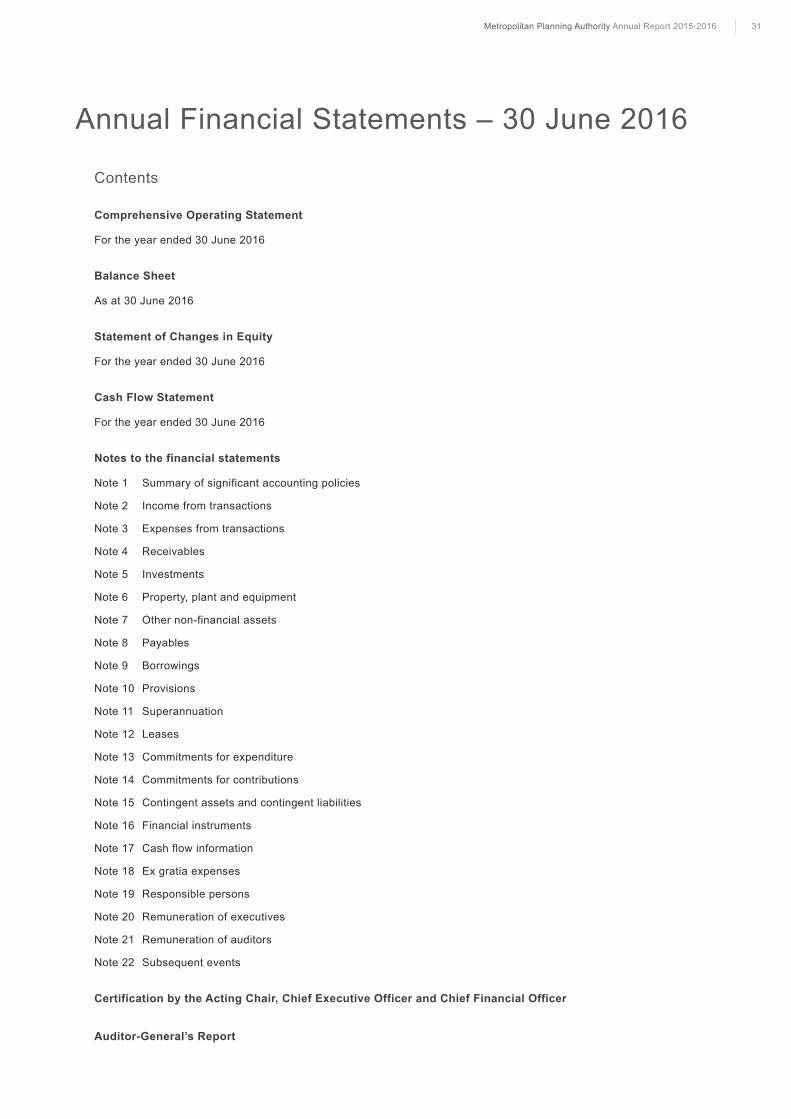
31Metropolitan Planning Authority Annual Report 2015-2016
Annual Financial Statements – 30 June 2016
Contents
Comprehensive Operating Statement
For the year ended 30 June 2016
Balance Sheet
As at 30 June 2016
Statement of Changes in Equity
For the year ended 30 June 2016
Cash Flow Statement
For the year ended 30 June 2016
Notes to the financial statements
Note 1 Summary of significant accounting policies
Note 2 Income from transactions
Note 3 Expenses from transactions
Note 4 Receivables
Note 5 Investments
Note 6 Property, plant and equipment
Note 7 Other non-financial assets
Note 8 Payables
Note 9 Borrowings
Note 10 Provisions
Note 11 Superannuation
Note 12 Leases
Note 13 Commitments for expenditure
Note 14 Commitments for contributions
Note 15 Contingent assets and contingent liabilities
Note 16 Financial instruments
Note 17 Cash flow information
Note 18 Ex gratia expenses
Note 19 Responsible persons
Note 20 Remuneration of executives
Note 21 Remuneration of auditors
Note 22 Subsequent events
Certification by the Acting Chair, Chief Executive Officer and Chief Financial Officer
Auditor-General’s Report
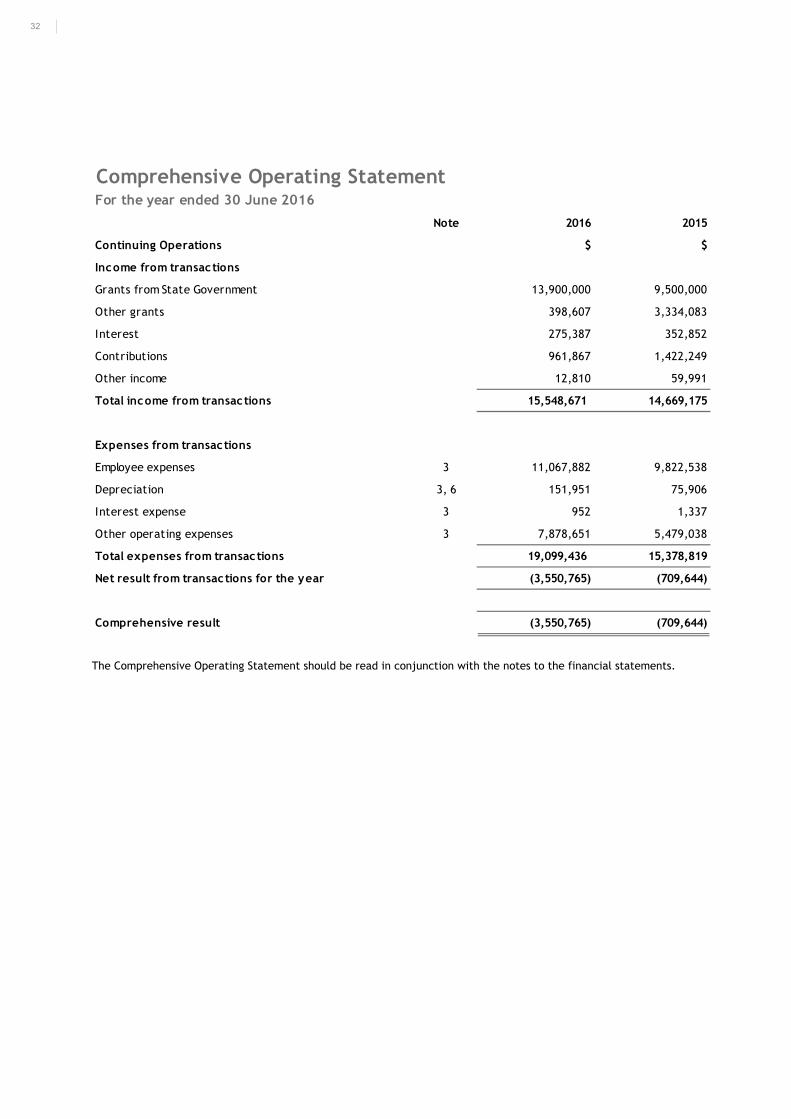
32
The Comprehensive Operating Statement should be read in conjunction with the notes to the financial statements.
Comprehensive Operating StatementFor the year ended 30 June 2016
Note 2016 2015
Continuing Operations $ $
Income from transactions
Grants from State Government 13,900,000 9,500,000
Other grants 398,607 3,334,083
Interest 275,387 352,852
Contributions 961,867 1,422,249
Other income 12,810 59,991
Total income from transactions 15,548,671 14,669,175
Expenses from transactions
Employee expenses 3 11,067,882 9,822,538
Depreciation 3, 6 151,951 75,906
Interest expense 3 952 1,337
Other operating expenses 3 7,878,651 5,479,038
Total expenses from transactions 19,099,436 15,378,819
Net result from transactions for the year (3,550,765) (709,644)
Comprehensive result (3,550,765) (709,644)
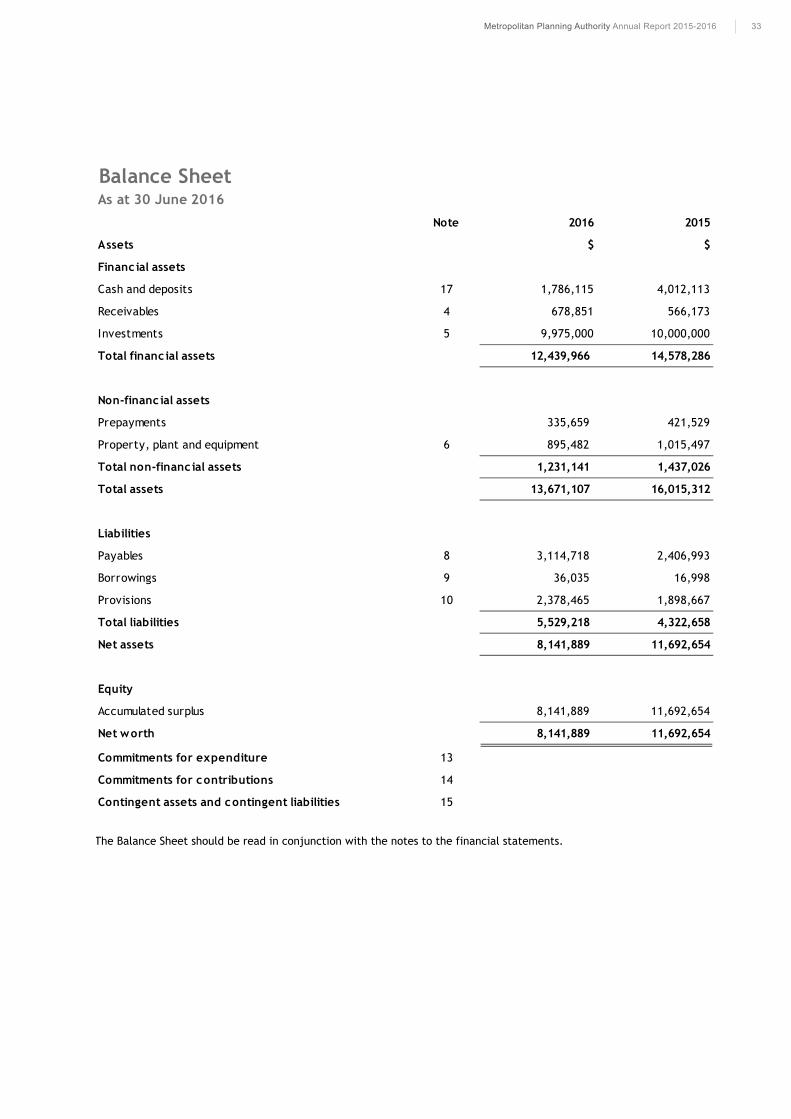
33Metropolitan Planning Authority Annual Report 2015-2016
The Balance Sheet should be read in conjunction with the notes to the financial statements.
Balance SheetAs at 30 June 2016
Note 2016 2015
Assets $ $
Financ ial assets
Cash and deposits 17 1,786,115 4,012,113
Receivables 4 678,851 566,173
Investments 5 9,975,000 10,000,000
Total financial assets 12,439,966 14,578,286
Non-financ ial assets
Prepayments 335,659 421,529
Property, plant and equipment 6 895,482 1,015,497
Total non-financ ial assets 1,231,141 1,437,026
Total assets 13,671,107 16,015,312
Liabilities
Payables 8 3,114,718 2,406,993
Borrowings 9 36,035 16,998
Provisions 10 2,378,465 1,898,667
Total liabilities 5,529,218 4,322,658
Net assets 8,141,889 11,692,654
Equity
Accumulated surplus 8,141,889 11,692,654
Net worth 8,141,889 11,692,654
Commitments for expenditure 13
Commitments for contributions 14
Contingent assets and contingent liabilities 15
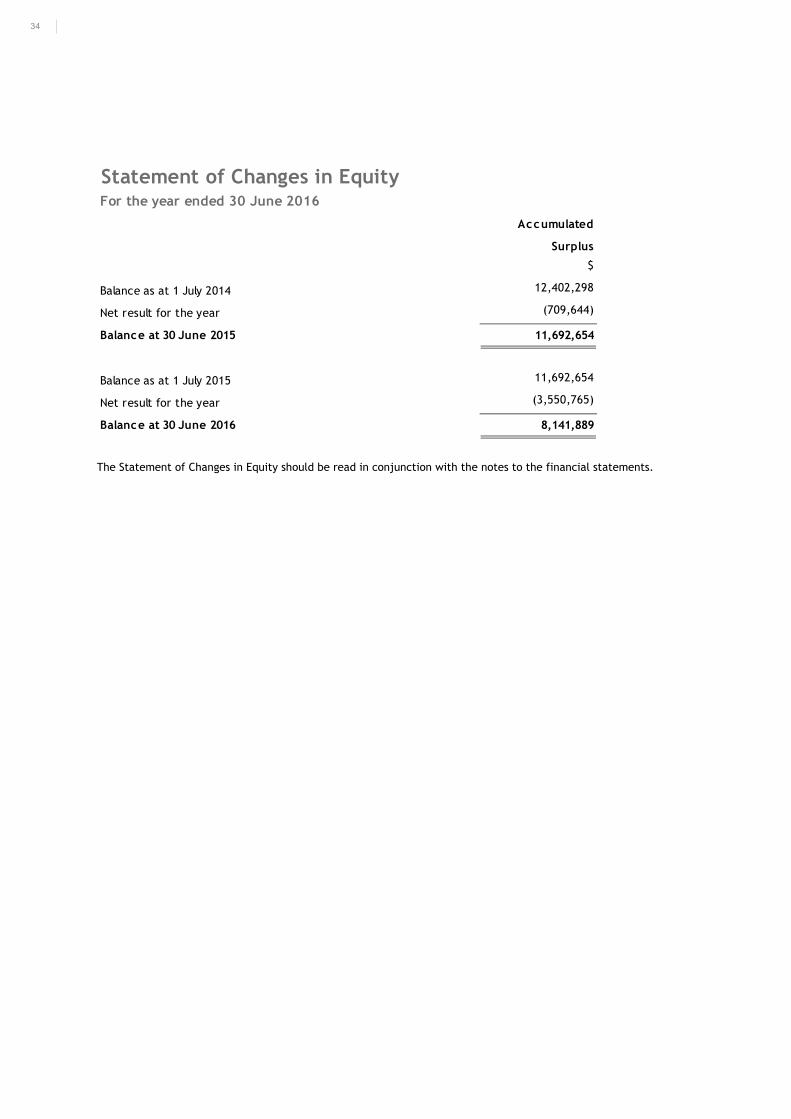
34
The Statement of Changes in Equity should be read in conjunction with the notes to the financial statements.
Statement of Changes in EquityFor the year ended 30 June 2016
Accumulated
Surplus
$
Balance as at 1 July 2014 12,402,298
Net result for the year (709,644)
11,692,654
Balance as at 1 July 2015 11,692,654
Net result for the year (3,550,765)
8,141,889
Balance at 30 June 2015
Balance at 30 June 2016
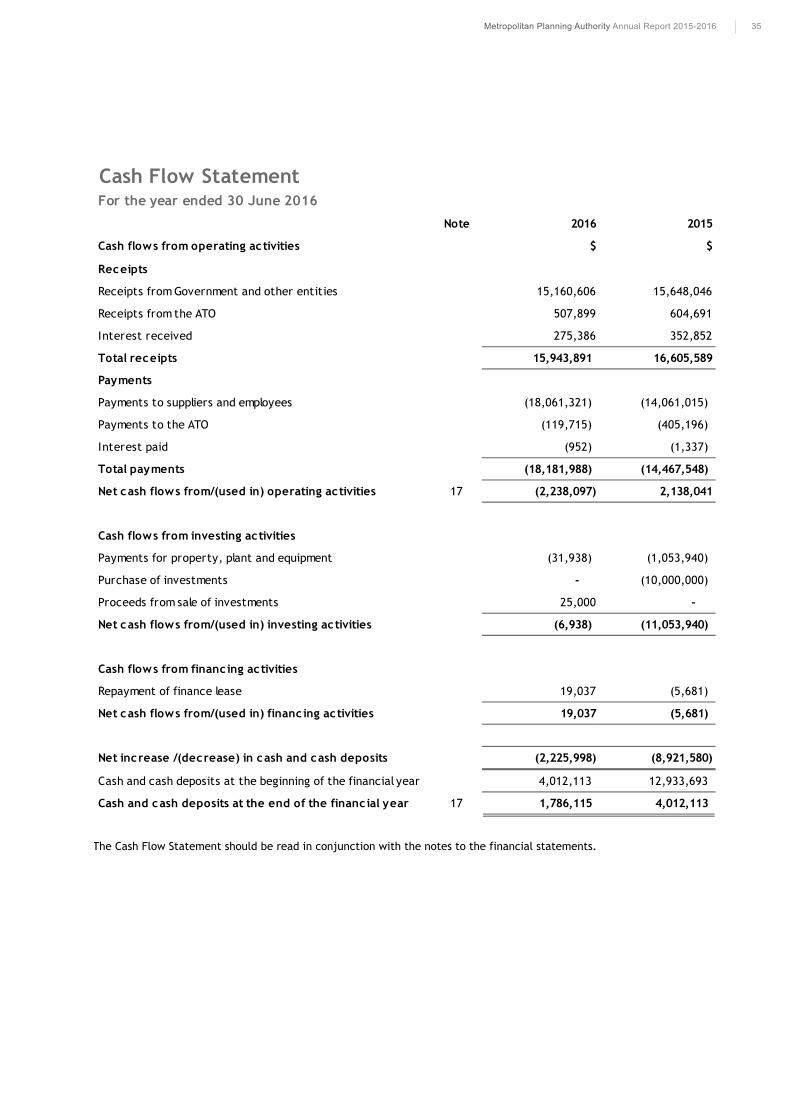
35Metropolitan Planning Authority Annual Report 2015-2016
The Cash Flow Statement should be read in conjunction with the notes to the financial statements.
Cash Flow StatementFor the year ended 30 June 2016
Note 2016 2015
Cash flows from operating activities $ $
Receipts
Receipts from Government and other entities 15,160,606 15,648,046
Receipts from the ATO 507,899 604,691
Interest received 275,386 352,852
Total receipts 15,943,891 16,605,589
Payments
Payments to suppliers and employees (18,061,321) (14,061,015)
Payments to the ATO (119,715) (405,196)
Interest paid (952) (1,337)
Total payments (18,181,988) (14,467,548)
Net cash flows from/(used in) operating activities 17 (2,238,097) 2,138,041
Cash flows from investing activities
Payments for property, plant and equipment (31,938) (1,053,940)
Purchase of investments - (10,000,000)
Proceeds from sale of investments 25,000 -
Net cash flows from/(used in) investing activities (6,938) (11,053,940)
Cash flows from financing activities
Repayment of finance lease 19,037 (5,681)
Net cash flows from/(used in) financing activities 19,037 (5,681)
Net increase /(decrease) in cash and cash deposits (2,225,998) (8,921,580)
Cash and cash deposits at the beginning of the financial year 4,012,113 12,933,693
Cash and cash deposits at the end of the financial year 17 1,786,115 4,012,113
36
Notes to the Financial Statements For the year ended 30 June 2016
Note 1. Summary of significant accounting policies
These annual financial statements include all controlled activities of the Growth Areas Authority, trading as the Metropolitan Planning Authority (the Authority). The Authority was proclaimed on 1 September 2006 and this report is for the year from 1 July 2015 to 30 June 2016. The purpose of the report is to provide users with information about the Authority’s stewardship of the resources entrusted to it.
(a) Statement of Compliance
These general purpose financial statements have been prepared in accordance with the Financial Management Act 1994 (FMA), Financial Reporting Directions (FRD) and applicable Australian Accounting Standards (AAS) including Interpretations issued by the Australian Accounting Standards Board (AASB). In particular, they are presented in a manner consistent with the requirements of AASB 1049 Whole of Government and General Government Sector Financial Reporting.
Accounting policies are selected and applied in a manner which ensures that the resulting financial information satisfies the concepts of relevance and reliability, thereby ensuring that the substance of the underlying transactions or other events is reported.
These annual financial statements were authorised for issue by the Board of the Authority on 21 September 2016.
(b) Basis of Accounting
The accrual basis of accounting has been applied in the preparation of these financial statements whereby assets, liabilities, equity, income and expenses are recognised in the reporting period to which they relate, regardless of when the cash is received or paid.
Judgements, estimates and assumptions are required to be made about the carrying values for assets and liabilities that are not readily apparent from other sources. The estimates and associated assumptions are based on professional judgements derived from historical experience and various other factors that are believed to be reasonable under the circumstances. Actual results may differ from these estimates.
Revisions to accounting estimates are recognised in the period in which the estimate is revised and also in future periods that are affected by the revision. Judgements and assumptions made by management in the application of AASs that have significant effect on the financial statements and estimates relate to:
the fair value of property, plant and equipment, superannuation expense (refer to Note 1(g)), and assumptions for employee benefit provision based on likely tenure of existing staff, patterns of leave claims, future
salary movements and future discount rates (refer to Note 1(l)).
These financial statements are presented in Australian dollars, and prepared in accordance with the historical cost convention except for non-financial physical assets which, subsequent to acquisition, are measured at their fair value at balance date, less any subsequent accumulated depreciation and subsequent impairment losses. Revaluations are made when required to ensure that their carrying amounts do not materially differ from their fair value.
Consistent with AASB 13 Fair Value Measurement, the Authority determines the policies and procedures for recurring fair value measurement such as property, equipment and vehicles and financial instruments in accordance with the requirements of AASB 13 and the relevant Financial Reporting Directions.
All assets and liabilities for which fair value is measured or disclosed in the financial statements are categorised within the fair value hierarchy, described as follows, based on the lowest level input that is significant to the fair value measurement as a whole:
Level 1 – Quoted (unadjusted) market prices in active markets for identical assets and liabilities, Level 2 – Valuation techniques for which the lowest level input that is significant to the fair value measurement is
directly or indirectly observable, and Level 3 – Valuation techniques for which the lowest level input that is significant to the fair value measurement is
unobservable.
For the purpose of fair value disclosures, the Authority has determined classes of assets and liabilities on the basis of the nature, characteristics and risks of the asset or liability and the level of the fair value hierarchy as explained above.
In addition, the Authority determines whether transfers have occurred between levels in the hierarchy by reassessing categorisation (based on the lowest level input that is significant to the fair value measurement as a whole) at the end of each reporting period.
(c) Reporting entity
The financial statements cover the Authority, as an individual reporting entity.
The Authority is a portfolio agency of the Department of Land, Water, Environment and Planning (DELWP) in the State of Victoria, established under the Planning and Environment Act (Growth Areas Authority) Act 2006.
Its principal address is:
Metropolitan Planning Authority Level 25, 35 Collins Street Melbourne VIC 3000
37Metropolitan Planning Authority Annual Report 2015-2016
The financial statements include all the activities of the Authority. The Authority does not have any controlled entities.
A description of the nature of the Authority’s operations and its principal activities is included in the report of operations, which does not form part of these financial statements.
Administered items
Certain resources are administered by the Authority on behalf of the State. While the Authority is accountable for the transactions involving administered items, specifically Growth Areas Infrastructure Contribution (GAIC), it does not have discretion to deploy the resources for its own benefit or the achievement of its objectives. Accordingly, transactions and balances relating to administered items are not recognised as Authority income, expenses, assets or liabilities in the body of the financial statements.
(d) Scope and presentation of financial statements
Comprehensive Operating Statement
The Comprehensive Operating Statement comprises two components, being ‘net result from transactions’ and ‘other economic flows included in the net result’. The sum of the two together represents the comprehensive result.
The comprehensive result is equivalent to profit or loss derived in accordance with AASs.
This classification is consistent with the whole of government reporting format and is allowed under AASB 101 Presentation of Financial Statements.
Balance Sheet
Assets and liabilities are presented in liquidity order with the assets aggregated into financial assets and non-financial assets.
Current and non-current assets and liabilities are disclosed in the notes, where relevant. In general, non-current assets or liabilities are expected to be recovered or settled more than 12 months after the reporting period, except for the provision of employee benefits, which is classified as current liabilities if the Authority does not have the unconditional right to defer the settlement of the liabilities within 12 months after the end of the reporting period.
Cash Flow Statement
Cash flows are classified according to whether or not they arise from operating, investing activities or financing activities. The classification is consistent with requirements of AASB 107 Statement of Cash Flows.
Statement of Changes in Equity
The Statement of Changes in Equity presents reconciliations of each non-owner and owner changes in equity from opening balances at the beginning of the reporting period to the closing balances at the end of the reporting period. It also shows separately changes due to amounts recognised in the ‘comprehensive result’ and amounts recognised in other comprehensive income related to other non-owner changes in equity.
Rounding
Amounts in the financial report have been rounded to the nearest dollar. Figures in the financial statements may not equate due to rounding.
38
(e) Changes in accounting policies
In the current financial year there have been no new or revised Standards adopted for the first time.
(f) Income from transactions
Income is recognised to the extent that it is probable that the economic benefits will flow to the entity and the income can be reliably measured at fair value.
Grants from State Government
The Authority is funded by Parliamentary appropriations for the provision of outcomes through DELWP. Income is recognised when the Authority obtains control over the contribution.
Other Grants including Government funding
Other grants are Government (State and Commonwealth) allocations for a specific purpose. These grants are recognised when the Authority obtains control over the funds.
Interest
Interest income includes interest received on bank term deposits and other investments. Interest income is recognised using the effective interest method which allocates the interest over the relevant period.
Contributions
Contributions received from third parties (including councils or developers) relates to funding received for specific projects or tasks. These funds are recognised as income when the Authority obtains control over the contribution, refer to Note 14.
Other income
Other income relates to prescribed fees and any income not defined above. These funds are recognised when billed.
39Metropolitan Planning Authority Annual Report 2015-2016
(g) Expenses from transactions
Expenses from transactions are recognised as they are incurred and reported in the financial year to which they relate.
Employee benefits
Refer to Note 1 (l) regarding employee benefits.
These expenses includes all forms of consideration (other than superannuation which is accounted for separately) given by the Authority in exchange for service rendered by employees or for the termination of employment. This includes wages and salaries, fringe benefits tax, leave entitlements, termination payments and WorkCover premiums.
Superannuation
The expense recognised in the Comprehensive Operating Statement is the employer contributions for members of both defined benefit and defined contribution superannuation plans that are paid or payable during the reporting period.
The Department of Treasury and Finance (DTF), in their annual financial statements, disclose on behalf of the State as the sponsoring employer the net defined benefit cost related to the members of these plans as an administered liability. Refer to DTF’s annual financial statements for more detailed disclosures in relation to these plans.
Depreciation
All plant and equipment and other non-financial physical assets (excluding items under operating leases) that have finite useful lives are depreciated. Depreciation is calculated on a straight-line basis, at rates that allocate the asset’s value, less any estimated residual value, over its estimated useful life.
The estimated useful lives, residual values and depreciation method are reviewed at the end of each annual reporting period, and adjustments are made where appropriate.
The useful lives for the relevant financial periods are: 2016 2015
Computer software and hardware 3 years 3 years Leasehold improvements 10 years 10 years Furniture and equipment 5 years 5 years Motor vehicles 3 years 3 years
Interest expense
Interest expense represents costs incurred in connection with borrowings. For the Authority, this directly refers to the interest components of finance lease repayments. Interest expense is recognised in the period in which it is incurred.
Other operating expenses
Other operating expenses generally represent the day-to-day running costs incurred in normal operations and include:
Supplies and services
Supplies and services costs are recognised as an expense in the reporting period in which they are incurred.
Bad and doubtful debts
Refer to Note 1(j) Impairment of financial assets.
(h) Other economic flows included in the net result
Other economic flows are changes in the volume or value of an asset or liability that does not result from transactions.
Impairment of non-financial assets
All non-financial assets are assessed annually for indication of impairment.
If there is an indication of impairment, the asset concerned is tested as to whether its carrying value exceeds its recoverable amount. Where an asset’s carrying value exceeds its recoverable amount, the difference is written off as another economic flow, except to the extent that the write down can be debited to an asset revaluation reserve amount applicable to that class of asset. The recoverable amount for most assets is measured at their higher of depreciated replacement cost and fair value less costs to sell.
There are no instances of this during the 2015/16 financial year (2014/15: nil).
Refer to Note 1(k) in relation to the recognition and measurement of non-financial assets.
(i) Financial instruments
Financial instruments arise out of contractual agreements that give rise to a financial asset of one entity and a financial liability or equity instrument of another entity. Due to the nature of the Authority’s activities, certain financial assets and financial liabilities arise under statute rather than a contract. Such financial assets and financial liabilities do not meet the definition of financial instruments in AASB 132 Financial Instruments: Presentation. For example, statutory receivables arising from taxes, fines and penalties do not meet the definition of financial instruments as they do not arise under contract.
Where relevant, for note disclosure purposes, a distinction is made between those financial assets and financial liabilities that meet the definition of financial instruments in accordance with AASB 132 and those that do not.
The following refers to financial instruments unless otherwise stated.
Categories of non-derivative financial instruments
40
Receivables
Receivables are financial instrument assets with fixed and determinable payments that are not quoted on an active market. These assets are initially recognised at fair value plus any attributable transaction costs. The receivables category includes cash and term deposits, trade and other receivables, but not statutory receivables.
Financial liabilities at amortised cost
Financial instrument liabilities are initially recognised on the date they originated. They are initially measured at fair value plus any directly attributable transaction costs. Subsequent to initial recognition, these financial instruments are measured at amortised cost with any difference between initial recognised amount and the redemption value being recognised in profit and loss over the period of the interest-bearing liability, using the effective interest rate method (refer to Note 16).
Financial instrument liabilities measured at amortised cost include all of the Authority’s contractual payables and interest bearing arrangements.
(j) Financial assets
Cash and deposits
Cash and cash deposits comprise cash on hand and cash at bank, deposits at call and those highly liquid investments (with an original maturity of three months or less), which are held for the purpose of meeting short term cash commitments rather than for investment purposes, and are readily convertible to known amounts of cash with an insignificant risk of changes in value.
Receivables
Receivables consist of:
contractual receivables, such as debtors in relation to goods and services and accrued investment income; and statutory receivables, such as amounts owing from the Victorian Government and Goods and Services Tax (GST)
input tax credits recoverable.
Contractual receivables are classified as financial instruments and categorised as receivables (refer to Note 1(i) for recognition and measurement). Statutory receivables are recognised and measured similarly to contractual receivables (except for impairment), but are not classified as financial instruments because they do not arise from a contract.
Receivables are subject to impairment testing. A provision for doubtful receivables is recognised when there is objective evidence that the debts may not be collected, and bad debts are written off when identified.
For the measurement principle of receivables, refer to Note 1(i).
Impairment of financial assets
At the end of each reporting period, the Authority assesses whether there is objective evidence that a financial asset or group of financial assets is impaired.
Receivables are assessed for bad and doubtful debts on a regular basis. Those bad debts considered as written off by mutual consent are classified as a transaction expense. Bad debts not written off by mutual consent and the allowance for doubtful receivables are classified as other economic flows in the net result.
In assessing impairment of statutory (non-contractual) financial assets, which are not financial instruments, professional judgement is applied in assessing materiality using estimates, averages and other computational methods in accordance with AASB 136 Impairment of Assets.
41Metropolitan Planning Authority Annual Report 2015-2016
(k) Non-financial assets
Property, plant and equipment
All non-financial physical assets are measured initially at cost and subsequently revalued at fair value less accumulated depreciation and impairment. Individual items of $5,000 or more are capitalised. Where an asset is acquired for no or nominal cost, the cost is its fair value at the date of acquisition. Assets transferred as part of a machinery of government change are transferred at their carrying amount.
The initial cost for non-financial physical assets under a finance lease (refer to Note 1(m)) is measured at amounts equal to the fair value of the leased asset or, if lower, the present value of the minimum lease payments, each determined at the inception of the lease.
The fair value of property, plant and equipment is normally determined by reference to the asset’s depreciated replacement cost.
For the accounting policy on impairment of non-financial physical assets, refer to the impairment of non-financial assets under Note 1(h).
More details about the valuation techniques and inputs used in determining the fair value of non-financial physical assets are discussed in Note 6 Property, plant and equipment.
Leasehold improvements
The cost of leasehold improvements is capitalised as an asset and depreciated over the shorter of the remaining term of the lease or the estimated useful life of the improvements.
Prepayments
Other non-financial assets include prepayments which represent payments in advance of the receipt of goods or services or that part of expenditure made in one accounting period covering a term extending beyond that period.
(l) Liabilities Payables
Payables consist of:
contractual payables, such as accounts payable and unearned income. Accounts payable represent liabilities for goods and services provided to the Authority prior to the end of the financial year that are unpaid, and arise when the Authority becomes obliged to make future payments in respect of the purchase of those goods and services, and
statutory payables, such as goods and services tax and fringe benefits tax payables.
Contractual payables are classified as financial instruments and categorised as financial liabilities at amortised cost (refer to Note 1(i)). Statutory payables are recognised and measured similarly to contractual payables, but are not classified as financial instruments and are not included in the category of financial liabilities at amortised cost, because they do not arise from a contract.
Borrowings
All interest bearing liabilities are initially recognised at the fair value of the consideration received; less directly attributable transaction costs, refer to Note 1(m).
Provisions
Provisions are recognised when the Authority has a present obligation, the future sacrifice of economic benefits is probable, and the amount of the provision can be measured reliably.
The amount recognised as a provision is the best estimate of the consideration required to settle the present obligation at reporting date, taking into account the risks and uncertainties surrounding the obligation. Where a provision is measured using the cash flows estimated to settle the present obligation, its carrying amount is the present value of those cash flows, using the discount rate that reflects the time value of money and risks specific to the provision.
42
Employee benefits
Provision is made for benefits to employees in respect of wages and salaries, annual leave and long service leave (LSL) for services rendered to the reporting date.
(i) Wages and salaries and annual leave
Liabilities for wages and salaries, including non-monetary benefits and annual leave are recognised in the provision for employee benefits as ‘current liabilities’, because the Authority does not have an unconditional right to defer settlements of these liabilities.
Depending on the expectation of the timing of settlement, liabilities for wage and salaries and annual leave are measured at:
nominal value – if the Authority expects to wholly settle within 12 months, or present value – if the Authority does not expect to wholly settle within 12 months.
Due to changes in the analysis of annual leave, the allocation of the annual leave liability between being expected to settle within 12 months and after 12 months is distributed differently as at 30 June 2016 to that shown in the 2014/15 financial statements.
(ii) Long Service Leave
Liability for LSL is recognised in the provision for employee benefits.
Unconditional LSL is disclosed in the notes to the financial statements as a current liability, even where the Authority does not expect to settle the liability within 12 months because it will not have the unconditional right to defer the settlement of the entitlement should an employee take leave within 12 months.
The components of this current LSL liability are measured at:
nominal value – if the Authority expects to wholly settle within 12 months; and present value – if the Authority does not expect to wholly settle within 12 months.
Conditional LSL is disclosed as a non-current liability as there is an unconditional right to defer the settlement of the entitlement until the employee has completed the requisite years of service. This non-current LSL liability is measured at present value.
The LSL expense includes the revaluation of the present value of the LSL liability due to changes in the bond interest rates.
On-costs related to employee expenses
On costs such as payroll tax and workers compensation are recognised separately within the provision for employee benefits.
43Metropolitan Planning Authority Annual Report 2015-2016
(m) Leases
A lease is a right to use an asset for an agreed period of time in exchange for payment.
Leases are classified at their inception as either operating or finance leases based on the economic substance of the agreement so as to reflect the risks and rewards incidental to ownership. Leases of infrastructure, property, plant and equipment are classified as finance infrastructure leases whenever the terms of the lease transfer substantially all the risks and rewards of ownership from the lessor to the lessee. All other leases are classified as operating leases.
Finance leases
Authority as lessee
At the commencement of the lease term, finance leases are initially recognised as assets and liabilities at amounts equal to the fair value of the lease property or, if lower, the present value of the minimum lease payment, each determined at the inception of the lease. The lease asset is accounted for as a non-financial physical asset. If there is certainty that the Authority will obtain ownership of the lease asset by the end of the lease term, the asset shall be depreciated over the useful life of the asset. If there is no reasonable certainty that the lessee will obtain ownership by the end of the lease term, the asset shall be fully depreciated over the shorter of the lease term and its useful life.
Minimum finance lease payments are apportioned between a reduction of the outstanding lease liability and periodic finance expense which is calculated using the interest rate implicit in the lease and recorded as an expense in the Comprehensive Operating Statement.
Operating leases
Authority as lessee
Operating lease payments, including any contingent rentals, are recognised as an expense on a straight-line basis over the lease term, except where another systematic basis is more representative of the time pattern of the benefits derived from the use of the leased asset. The leased asset is not recognised in the Balance Sheet.
All incentives for the agreement of a new or renewed operating lease are recognised as an integral part of the net consideration agreed for the use of the leased asset, irrespective of the incentive’s nature or form or the timing of payments.
In the event that lease incentives are received to enter into operating leases, the aggregate cost of incentives are recognised as a reduction of rental expense of the lease term on a straight-line basis, unless another systematic basis is more representative of the time pattern in which economic benefits from the leased asset are consumed.
(n) Commitments
Commitments for future expenditure include operating and capital commitments arising from contracts. These commitments are disclosed by way of a note (refer to Note 13) at their nominal value and inclusive of the GST payable.
In addition, where it is considered appropriate and provides additional relevant information to users, the net present value of significant individual projects are stated. These future expenditures cease to be disclosed as commitments once the related liabilities are recognised in the balance sheet.
(o) Contingent assets and contingent liabilities
Contingent assets and contingent liabilities are not recognised in the Balance Sheet, but are disclosed by way of note (refer to Note 15) and, if quantifiable, are measured at nominal value. Contingent assets and liabilities are presented inclusive of GST receivable or payable respectively.
(p) Accounting for the goods and services tax
Income, expenses and assets are recognised net of the amount of associated goods and services tax (GST), except where the amount of GST incurred is not recoverable from the Australian Taxation Office (ATO). In this case, the GST payable is recognised as part of the cost of the acquisition of an asset or as part of the expense.
Receivables and payables are stated inclusive of the amount of GST receivable or payable. The net amount of GST recoverable from, or payable to, the ATO is included with other receivables or payables in the balance sheet.
Cash flows are presented on a gross basis. The GST components of cash flows arising from investing or financing activities which is recoverable from, or payable to, the ATO, are presented as operating cash flow.
Commitments (refer to Note 1 (n)) and contingent assets and liabilities (refer to Note 1 (o)) are also stated inclusive of GST.
44
(q) Events after the reporting period
Assets, liabilities, income or expenses arise from past transactions or other past events. Where the transactions result from an agreement between the Authority and other parties, the transactions are only recognised when the agreement is irrevocable at or before the end of the reporting period. Adjustments are made to amounts recognised in the financial statements for events which occur between the end of the reporting period and the date when the financial statements are authorised for issue, where those events provide information about conditions which existed at the reporting date. Note disclosure is made about events between the end of the reporting period and the date the financial statements are authorised for issue where the events relate to conditions which arose after the end of the reporting period that are considered to be of material interest.
(r) Australian Accounting Standards issued that are not yet effective Certain new Australian Accounting Standards (AASs) have been published that are not mandatory for the 30 June 2016 reporting period. DTF assesses the impact of these new standards and advises the Authority of their applicability and early adoption where applicable.
The following accounting pronouncements effective from the 2015/16 reporting period are considered to have insignificant impacts on public sector reporting:
AASB 1048 Interpretation of Standards AASB 2013-9 Amendments to Australian Accounting Standards [Part C Financial Instruments] AASB 2014-8 Amendments to Australian Accounting Standards arising from AASB 9 – Application of AASB 9
(December 2009) and AASB 9 (December 2020) [AASB 9 (2009 & 2010)] AASB 2015-3 Amendments to Australian Accounting Standards arising from the Withdrawal of AASB 1031 Materiality
Future reporting periods
The table below outlines the accounting standards that have been issued that are not effective for 2015/16, which may result in potential impacts for the Authority’s reporting for future reporting periods.
Topic Key requirements Effective date
AASB 9 Financial Instruments
The key changes include the simplified requirements for the classification and measurement of financial assets, a new hedging accounting model and a revised impairment loss model to recognise impairment losses earlier, as opposed to the current approach that recognises impairment only when incurred.
1 January 2018
AASB 15 Revenue from Contracts with Customers
The core principle of AASB 15 requires an entity to recognise revenue when the entity satisfies a performance obligation by transferring a promised good or service to a customer. Note that amending standard AASB 2015-8 Amendments to Australian Accounting Standards – Effective Date of AASB 15 has deferred the effective date of AASB 15 to annual reporting periods beginning on or after 1 January 2018, instead of 1 January 2017.
1 January 2018
AASB 16 Leases The key changes introduced by AASB 16 include the recognition of most operating leases (which are currently not recognised) on balance sheet.
1 January 2019
AASB 2010-7 Amendments to Australian Accounting Standards arising from AASB 9 (December 2010) [AASB 1, 3, 4, 5, 7, 101, 102, 108, 112, 118, 120, 121, 127, 128, 131, 132, 136, 137, 139, 1023 & 1038 and Interpretations 2, 5, 10, 12, 19 & 127]
The requirements for classifying and measuring financial liabilities were added to AASB 9. The existing requirements for the classification of financial liabilities and the ability to use the fair value option have been retained. However, where the fair value option is used for financial liabilities the change in fair value is accounted for as follows: the change in fair value attributable to changes in credit
risk is presented in other comprehensive income (OCI); and
other fair value changes are presented in profit or loss. If this approach creates or enlarges an accounting mismatch in the profit or loss, the effect of the changes in credit risk are also presented in profit or loss.
1 January 2018
AASB 2014-1 Amendments to Australian Accounting Standards [Part E Financial Instruments]
Amends various AASs to reflect the AASB’s decision to defer the mandatory application date of AASB 9 to annual reporting periods beginning on or after 1 January 2018; as a consequence of Chapter 6; and to amend reduced disclosure requirements.
1 January 2018
AASB 2014-4 Amendments to Australian Accounting Standards – Clarification of Acceptable Methods of Depreciation and Amortisation [AASB 116 & AASB 138]
AASB 2014-4 amends AASB 116 and AASB 138 to: establish the principle for the basis of depreciation and
amortisation as being the expected pattern of consumption of the future economic benefits of an asset;
clarify that the use of revenue-based methods to calculate the depreciation of an asset is not appropriate because revenue generated by an activity that includes the use of an asset generally reflects factors other than the consumption of the economic benefits embodied in the asset; and
clarify that revenue is generally presumed to be an inappropriate basis for measuring the consumption of the economic benefits embodied in an intangible asset. This presumption, however, can be rebutted in certain limited circumstances.
1 January 2016
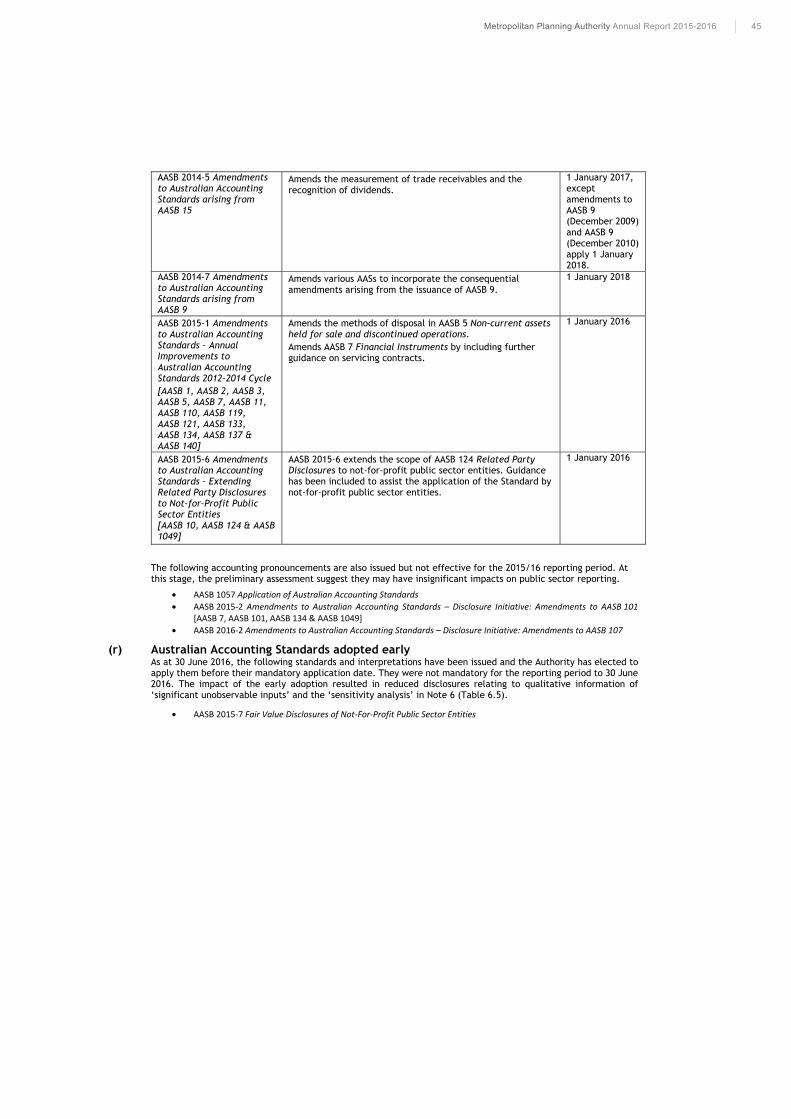
45Metropolitan Planning Authority Annual Report 2015-2016
AASB 2014-5 Amendments to Australian Accounting Standards arising from AASB 15
Amends the measurement of trade receivables and the recognition of dividends.
1 January 2017, except amendments to AASB 9 (December 2009) and AASB 9 (December 2010) apply 1 January 2018.
AASB 2014-7 Amendments to Australian Accounting Standards arising from AASB 9
Amends various AASs to incorporate the consequential amendments arising from the issuance of AASB 9.
1 January 2018
AASB 2015-1 Amendments to Australian Accounting Standards – Annual Improvements to Australian Accounting Standards 2012–2014 Cycle [AASB 1, AASB 2, AASB 3, AASB 5, AASB 7, AASB 11, AASB 110, AASB 119, AASB 121, AASB 133, AASB 134, AASB 137 & AASB 140]
Amends the methods of disposal in AASB 5 Non-current assets held for sale and discontinued operations. Amends AASB 7 Financial Instruments by including further guidance on servicing contracts.
1 January 2016
AASB 2015-6 Amendments to Australian Accounting Standards – Extending Related Party Disclosures to Not-for-Profit Public Sector Entities [AASB 10, AASB 124 & AASB 1049]
AASB 2015-6 extends the scope of AASB 124 Related Party Disclosures to not-for-profit public sector entities. Guidance has been included to assist the application of the Standard by not-for-profit public sector entities.
1 January 2016
The following accounting pronouncements are also issued but not effective for the 2015/16 reporting period. At this stage, the preliminary assessment suggest they may have insignificant impacts on public sector reporting.
AASB 1057 Application of Australian Accounting Standards AASB 2015-2 Amendments to Australian Accounting Standards – Disclosure Initiative: Amendments to AASB 101
[AASB 7, AASB 101, AASB 134 & AASB 1049] AASB 2016-2 Amendments to Australian Accounting Standards – Disclosure Initiative: Amendments to AASB 107
(r) Australian Accounting Standards adopted early As at 30 June 2016, the following standards and interpretations have been issued and the Authority has elected to apply them before their mandatory application date. They were not mandatory for the reporting period to 30 June 2016. The impact of the early adoption resulted in reduced disclosures relating to qualitative information of ‘significant unobservable inputs’ and the ‘sensitivity analysis’ in Note 6 (Table 6.5).
AASB 2015-7 Fair Value Disclosures of Not-For-Profit Public Sector Entities
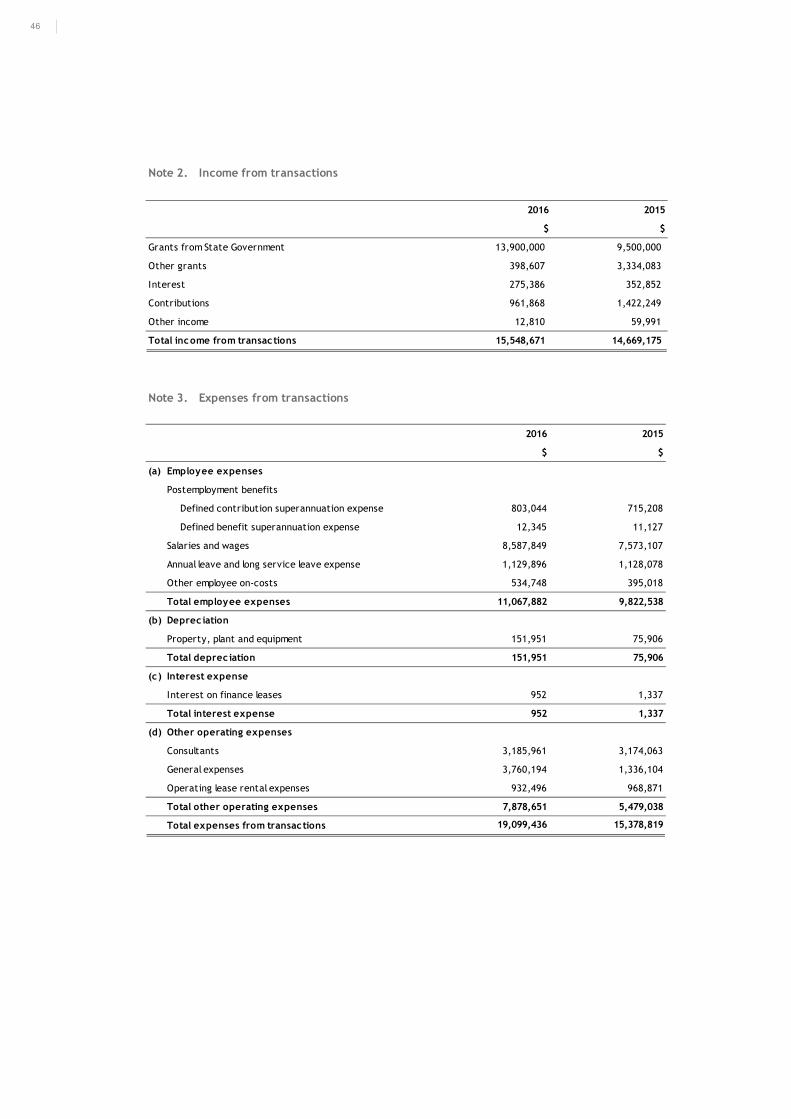
46
Note 2. Income from transactions
2016 2015
$ $
Grants from State Government 13,900,000 9,500,000
Other grants 398,607 3,334,083
Interest 275,386 352,852
Contributions 961,868 1,422,249
Other income 12,810 59,991
Total income from transactions 15,548,671 14,669,175
Note 3. Expenses from transactions
2016 2015
$ $
(a) Employee expenses
Postemployment benefits
Defined contribution superannuation expense 803,044 715,208
Defined benefit superannuation expense 12,345 11,127
Salaries and wages 8,587,849 7,573,107
Annual leave and long service leave expense 1,129,896 1,128,078
Other employee on-costs 534,748 395,018
Total employee expenses 11,067,882 9,822,538
(b) Deprec iation
Property, plant and equipment 151,951 75,906
Total deprec iation 151,951 75,906
(c) Interest expense
Interest on finance leases 952 1,337
Total interest expense 952 1,337
(d) Other operating expenses
Consultants 3,185,961 3,174,063
General expenses 3,760,194 1,336,104
Operating lease rental expenses 932,496 968,871
Total other operating expenses 7,878,651 5,479,038
Total expenses from transactions 19,099,436 15,378,819
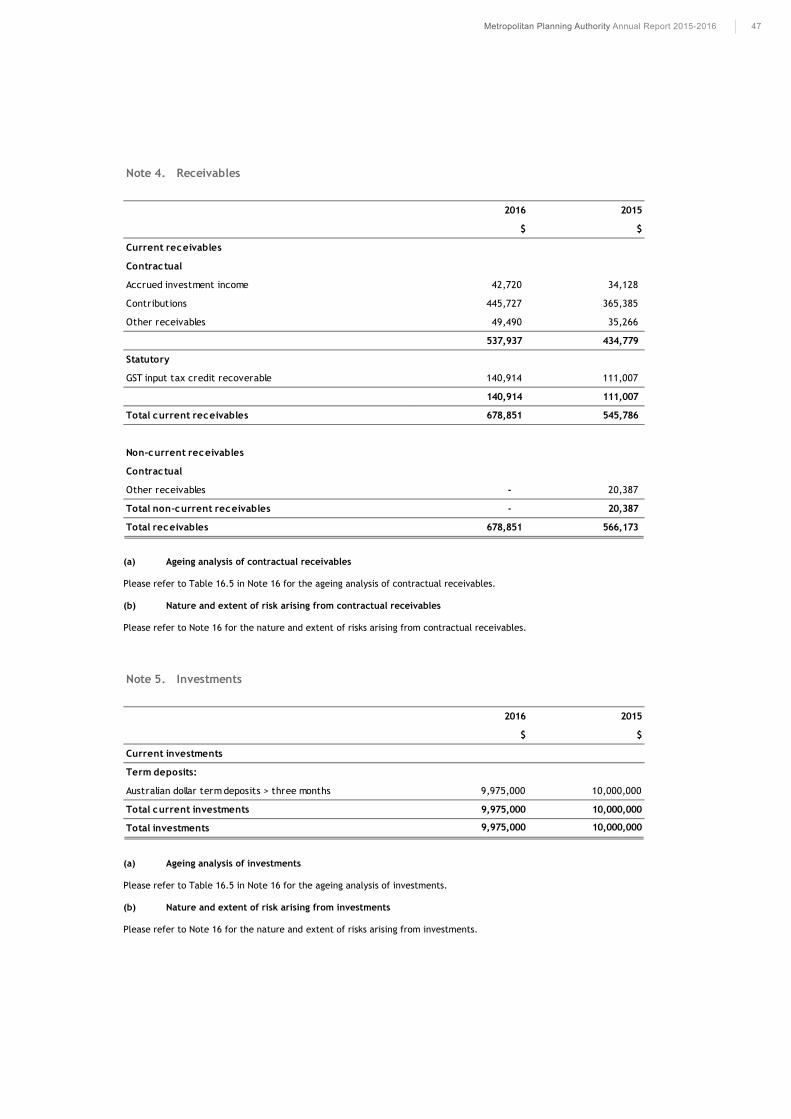
47Metropolitan Planning Authority Annual Report 2015-2016
(a) Ageing analysis of contractual receivables
Please refer to Table 16.5 in Note 16 for the ageing analysis of contractual receivables.
(b) Nature and extent of risk arising from contractual receivables
Please refer to Note 16 for the nature and extent of risks arising from contractual receivables.
(a) Ageing analysis of investments
Please refer to Table 16.5 in Note 16 for the ageing analysis of investments.
(b) Nature and extent of risk arising from investments
Please refer to Note 16 for the nature and extent of risks arising from investments.
Note 4. Receivables
2016 2015
$ $
Current receivables
Contractual
Accrued investment income 42,720 34,128
Contributions 445,727 365,385
Other receivables 49,490 35,266
537,937 434,779
Statutory
GST input tax credit recoverable 140,914 111,007
140,914 111,007
Total current receivables 678,851 545,786
Non-current receivables
Contractual
Other receivables - 20,387
Total non-current receivables - 20,387
Total receivables 678,851 566,173
Note 5. Investments
2016 2015
$ $
Current investments
Term deposits:
Australian dollar term deposits > three months 9,975,000 10,000,000
Total current investments 9,975,000 10,000,000
Total investments 9,975,000 10,000,000
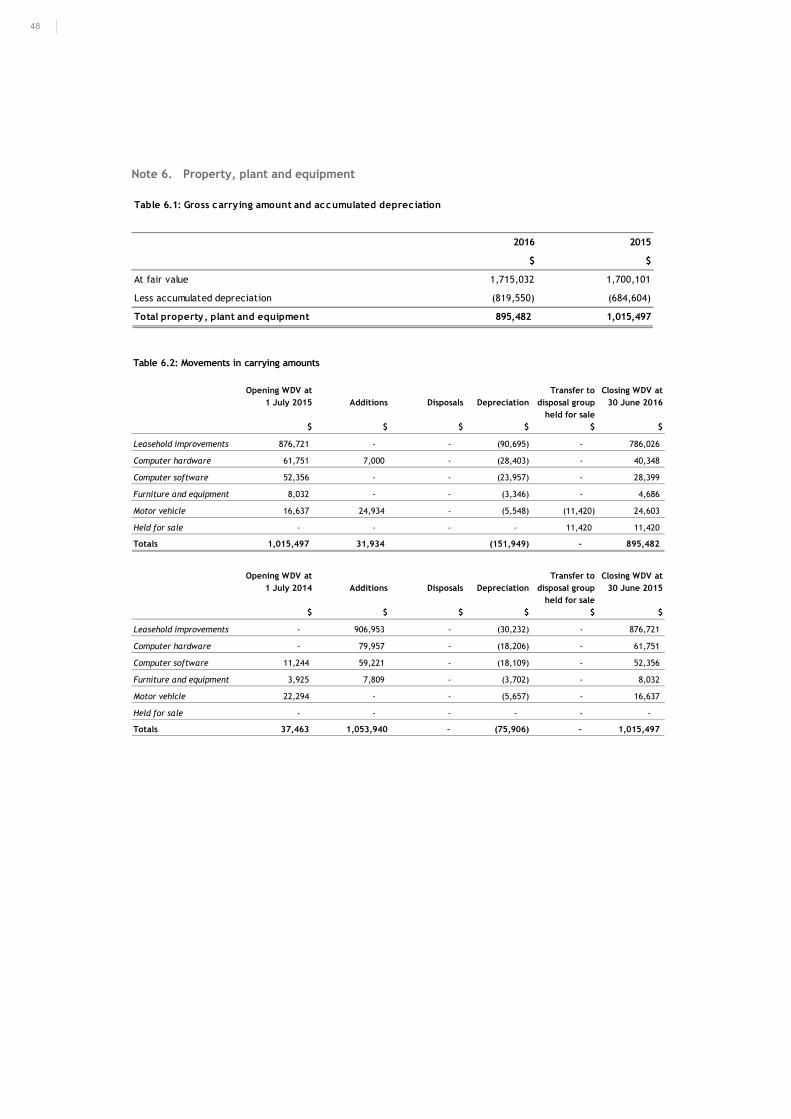
48
Note 6. Property, plant and equipment
Table 6.1: Gross carrying amount and accumulated depreciation
2016 2015
$ $
At fair value 1,715,032 1,700,101
Less accumulated depreciation (819,550) (684,604)
Total property, plant and equipment 895,482 1,015,497
Table 6.2: Movements in carrying amounts
Opening WDV at
1 July 2015 Additions Disposals Deprec iation
Transfer to
disposal group
held for sale
Closing WDV at
30 June 2016
$ $ $ $ $ $
Leasehold improvements 876,721 - - (90,695) - 786,026
Computer hardware 61,751 7,000 - (28,403) - 40,348
Computer software 52,356 - - (23,957) - 28,399
Furniture and equipment 8,032 - - (3,346) - 4,686
Motor vehicle 16,637 24,934 - (5,548) (11,420) 24,603
Held for sale - - - - 11,420 11,420
Totals 1,015,497 31,934 (151,949) - 895,482
Opening WDV at
1 July 2014 Additions Disposals Deprec iation
Transfer to
disposal group
held for sale
Closing WDV at
30 June 2015
$ $ $ $ $ $
Leasehold improvements - 906,953 - (30,232) - 876,721
Computer hardware - 79,957 - (18,206) - 61,751
Computer software 11,244 59,221 - (18,109) - 52,356
Furniture and equipment 3,925 7,809 - (3,702) - 8,032
Motor vehicle 22,294 - - (5,657) - 16,637
Held for sale - - - - - -
Totals 37,463 1,053,940 - (75,906) - 1,015,497
Opening WDV at 1 July 2015 Additions Disposals Depreciation
Transfer to disposal group
held for sale
Closing WDV at 30 June 2016
$ $ $ $ $ $
Leasehold improvements 876,721 - - (90,695) - 786,026
Computer hardware 61,751 7,000 - (28,403) - 40,348
Computer software 52,356 - - (23,957) - 28,399
Furniture and equipment 8,032 - - (3,346) - 4,686
Motor vehicle 16,637 24,934 - (5,548) (11,420) 24,603
Held for sale - - - - 11,420 11,420
Totals 1,015,497 31,934 (151,949) - 895,482
Opening WDV at 1 July 2014 Additions Disposals Depreciation
Transfer to disposal group
held for sale
Closing WDV at 30 June 2015
$ $ $ $ $ $
Leasehold improvements - 906,953 - (30,232) - 876,721
Computer hardware - 79,957 - (18,206) - 61,751
Computer software 11,244 59,221 - (18,109) - 52,356
Furniture and equipment 3,925 7,809 - (3,702) - 8,032
Motor vehicle 22,294 - - (5,657) - 16,637
Held for sale - - - - - -
Totals 37,463 1,053,940 - (75,906) - 1,015,497
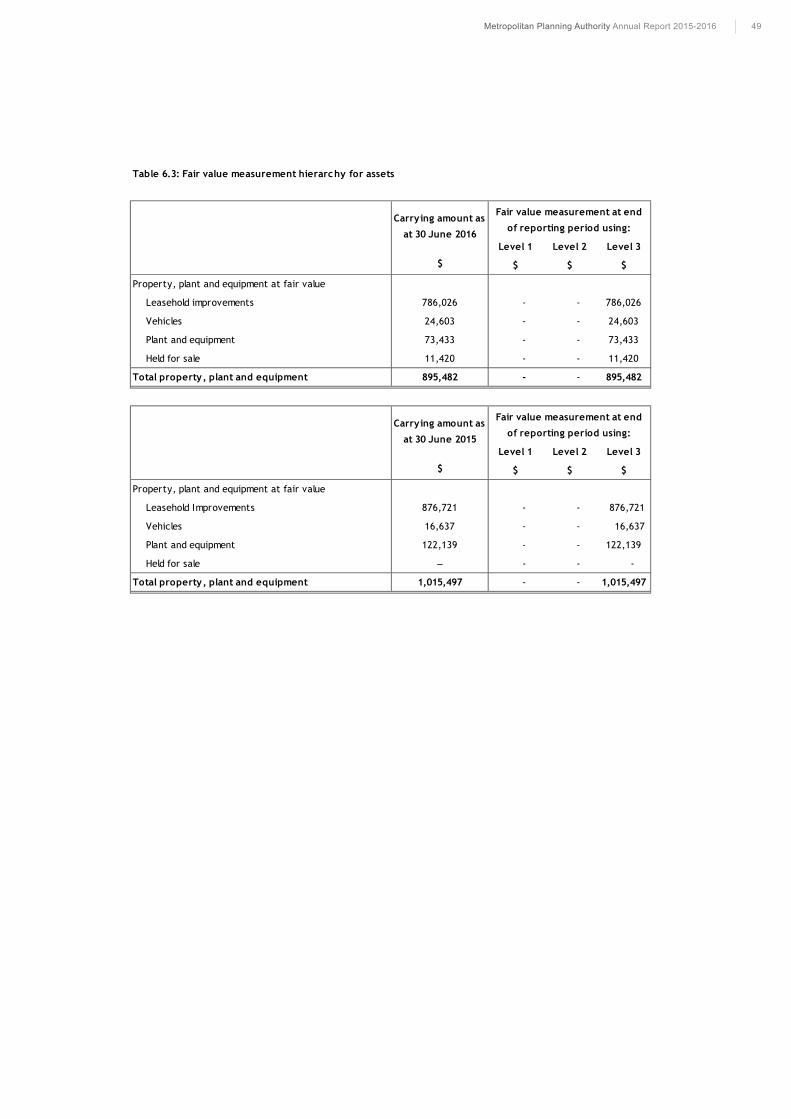
49Metropolitan Planning Authority Annual Report 2015-2016
Table 6.3: Fair value measurement hierarchy for assets
Level 1 Level 2 Level 3
$ $ $ $
Property, plant and equipment at fair value
Leasehold improvements 786,026 - - 786,026
Vehicles 24,603 - - 24,603
Plant and equipment 73,433 - - 73,433
Held for sale 11,420 - - 11,420
Total property, plant and equipment 895,482 - - 895,482
Level 1 Level 2 Level 3
$ $ $ $
Property, plant and equipment at fair value
Leasehold Improvements 876,721 - - 876,721
Vehicles 16,637 - - 16,637
Plant and equipment 122,139 - - 122,139
Held for sale ‒ - - -
Total property, plant and equipment 1,015,497 - - 1,015,497
Carrying amount as
at 30 June 2015
Fair value measurement at end
of reporting period using:
Carrying amount as
at 30 June 2016
Fair value measurement at end
of reporting period using:
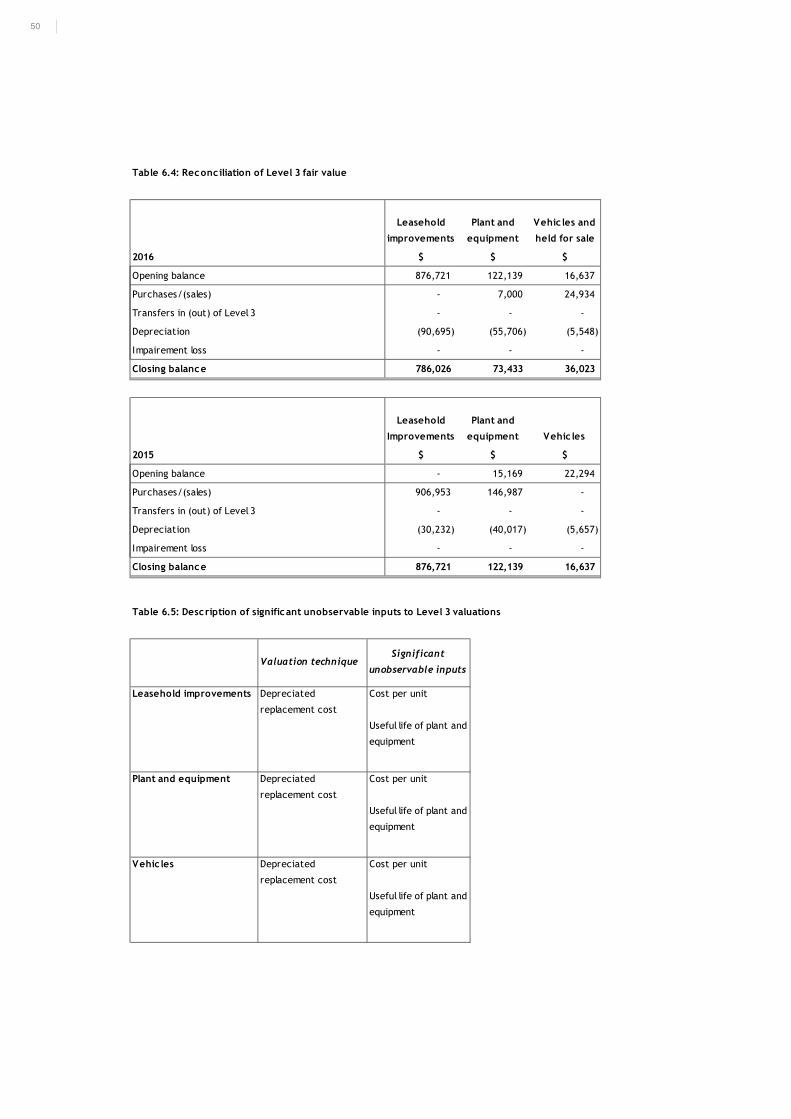
50
Table 6.4: Reconciliation of Level 3 fair value
Leasehold
improvements
Plant and
equipment
Vehic les and
held for sale
2016 $ $ $
Opening balance 876,721 122,139 16,637
Purchases/(sales) - 7,000 24,934
Transfers in (out) of Level 3 - - -
Depreciation (90,695) (55,706) (5,548)
Impairement loss - - -
Closing balance 786,026 73,433 36,023
Leasehold
Improvements
Plant and
equipment Vehic les
2015 $ $ $
Opening balance - 15,169 22,294
Purchases/(sales) 906,953 146,987 -
Transfers in (out) of Level 3 - - -
Depreciation (30,232) (40,017) (5,657)
Impairement loss - - -
Closing balance 876,721 122,139 16,637
Table 6.5: Description of significant unobservable inputs to Level 3 valuations
Valuation techniqueSignificant
unobservable inputs
Leasehold improvements Depreciated
replacement cost
Cost per unit
Useful life of plant and
equipment
Plant and equipment Depreciated
replacement cost
Cost per unit
Useful life of plant and
equipment
Vehic les Depreciated
replacement cost
Cost per unit
Useful life of plant and
equipment
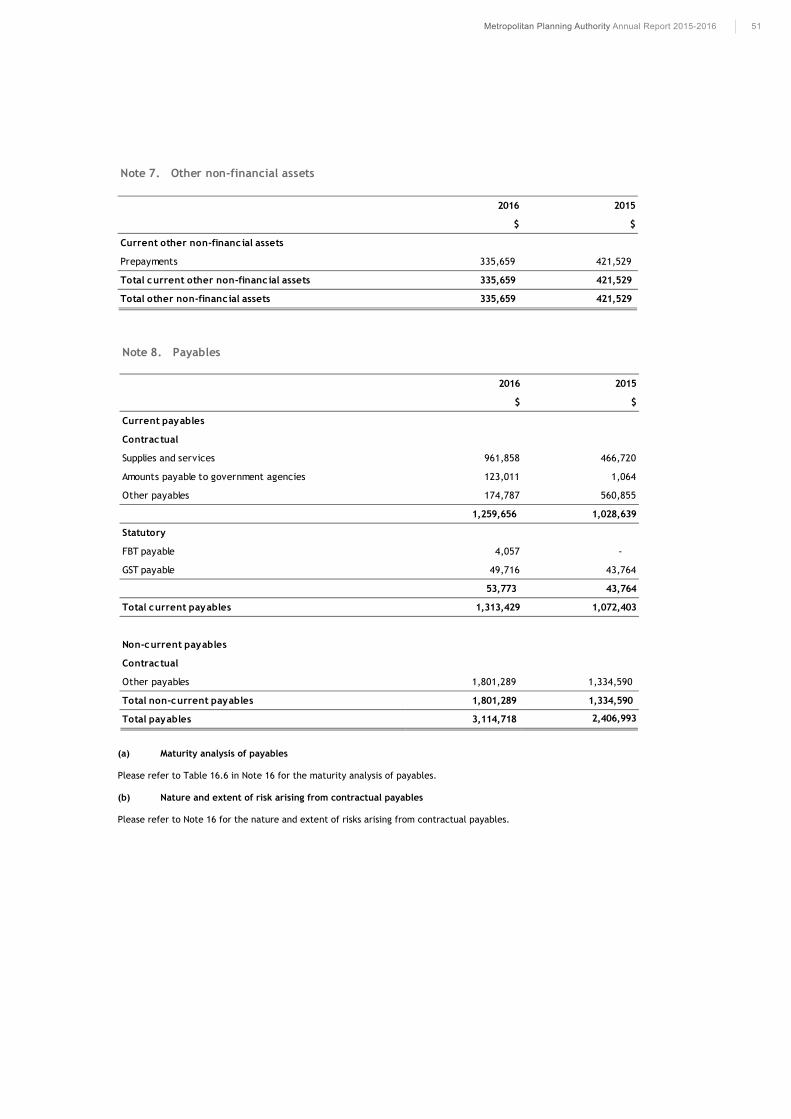
51Metropolitan Planning Authority Annual Report 2015-2016
(a) Maturity analysis of payables
Please refer to Table 16.6 in Note 16 for the maturity analysis of payables.
(b) Nature and extent of risk arising from contractual payables
Please refer to Note 16 for the nature and extent of risks arising from contractual payables.
Note 7. Other non-financial assets
2016 2015
$ $
Current other non-financ ial assets
Prepayments 335,659 421,529
Total current other non-financ ial assets 335,659 421,529
Total other non-financial assets 335,659 421,529
Note 8. Payables
2016 2015
$ $
Current payables
Contractual
Supplies and services 961,858 466,720
Amounts payable to government agencies 123,011 1,064
Other payables 174,787 560,855
1,259,656 1,028,639
Statutory
FBT payable 4,057 -
GST payable 49,716 43,764
53,773 43,764
Total current payables 1,313,429 1,072,403
Non-current payables
Contractual
Other payables 1,801,289 1,334,590
Total non-current payables 1,801,289 1,334,590
Total payables 3,114,718 2,406,993
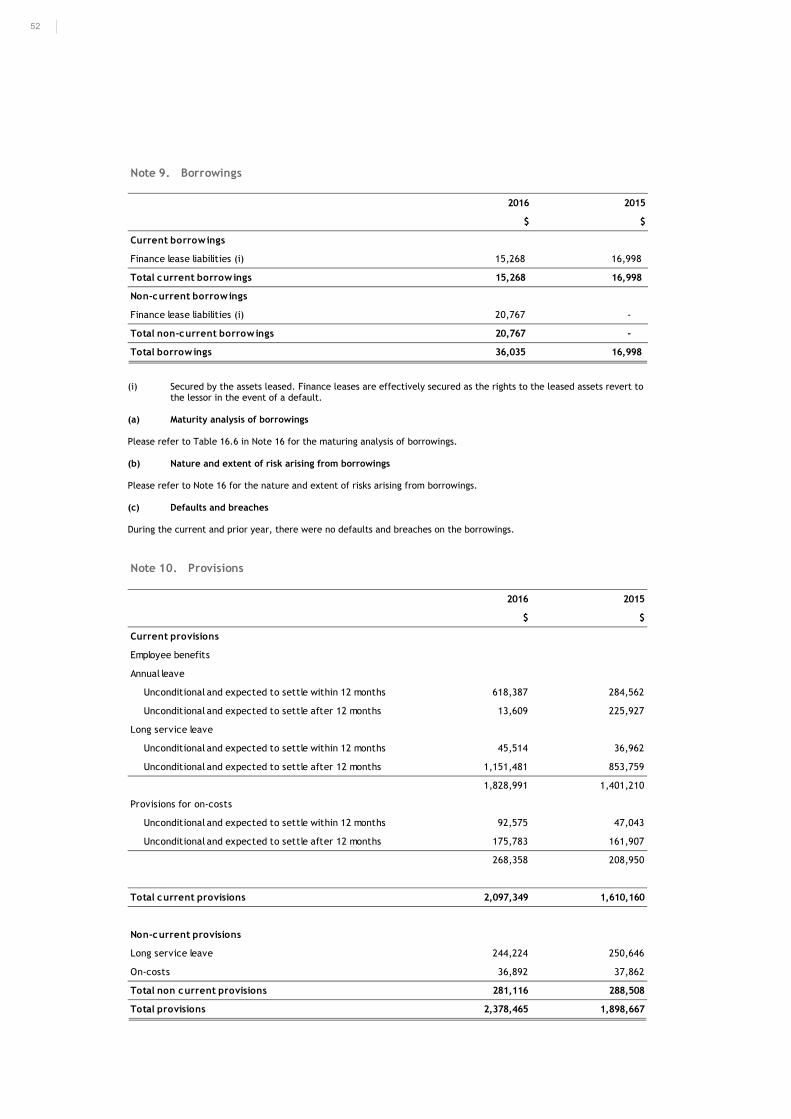
52
(i) Secured by the assets leased. Finance leases are effectively secured as the rights to the leased assets revert to the lessor in the event of a default.
(a) Maturity analysis of borrowings
Please refer to Table 16.6 in Note 16 for the maturing analysis of borrowings.
(b) Nature and extent of risk arising from borrowings
Please refer to Note 16 for the nature and extent of risks arising from borrowings.
(c) Defaults and breaches
During the current and prior year, there were no defaults and breaches on the borrowings.
Note 9. Borrowings
2016 2015
$ $
Current borrowings
Finance lease liabilities (i) 15,268 16,998
Total current borrowings 15,268 16,998
Non-current borrowings
Finance lease liabilities (i) 20,767 -
Total non-current borrowings 20,767 -
Total borrowings 36,035 16,998
Note 10. Provisions
2016 2015
$ $
Current provisions
Employee benefits
Annual leave
Unconditional and expected to settle within 12 months 618,387 284,562
Unconditional and expected to settle after 12 months 13,609 225,927
Long service leave
Unconditional and expected to settle within 12 months 45,514 36,962
Unconditional and expected to settle after 12 months 1,151,481 853,759
1,828,991 1,401,210
Provisions for on-costs
Unconditional and expected to settle within 12 months 92,575 47,043
Unconditional and expected to settle after 12 months 175,783 161,907
268,358 208,950
Total current provisions 2,097,349 1,610,160
Non-current provisions
Long service leave 244,224 250,646
On-costs 36,892 37,862
Total non current provisions 281,116 288,508
Total provisions 2,378,465 1,898,667
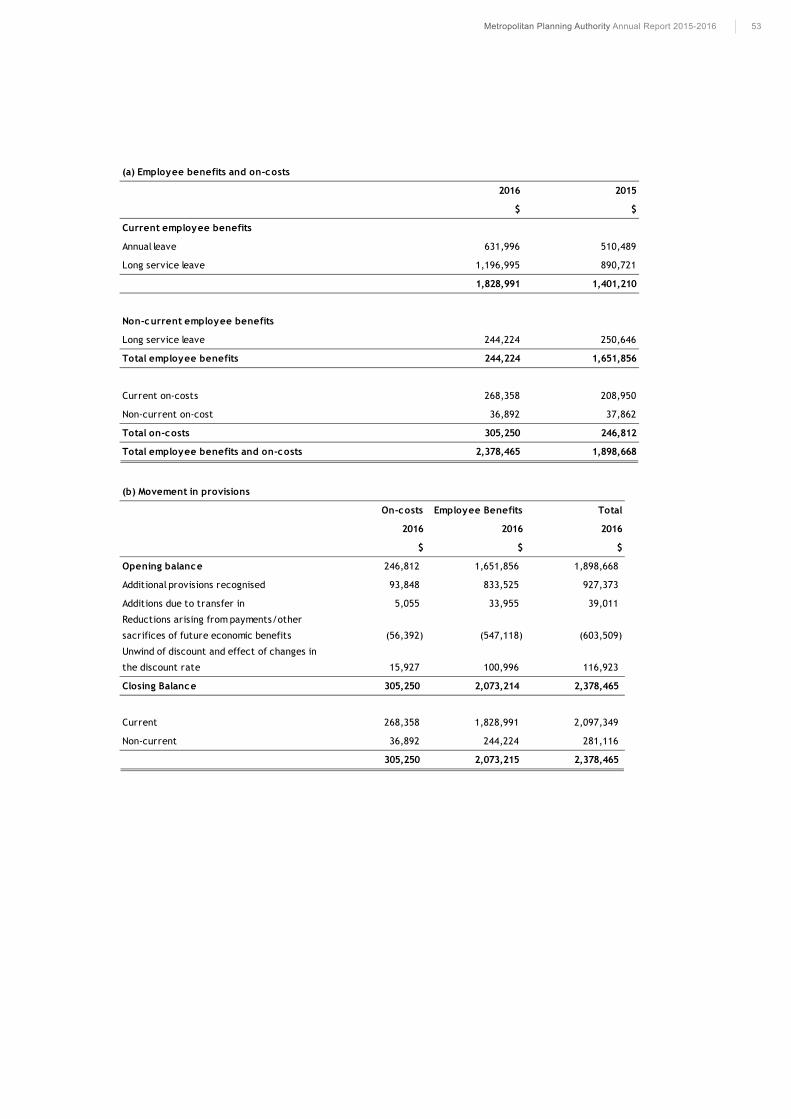
53Metropolitan Planning Authority Annual Report 2015-2016
(a) Employee benefits and on-costs
2016 2015
$ $
Current employee benefits
Annual leave 631,996 510,489
Long service leave 1,196,995 890,721
1,828,991 1,401,210
Non-current employee benefits
Long service leave 244,224 250,646
Total employee benefits 244,224 1,651,856
Current on-costs 268,358 208,950
Non-current on-cost 36,892 37,862
Total on-costs 305,250 246,812
Total employee benefits and on-costs 2,378,465 1,898,668
(b) Movement in provisions
On-costs Employee Benefits Total
2016 2016 2016
$ $ $
Opening balance 246,812 1,651,856 1,898,668
Additional provisions recognised 93,848 833,525 927,373
Additions due to transfer in 5,055 33,955 39,011
Reductions arising from payments/other
sacrifices of future economic benefits (56,392) (547,118) (603,509)
Unwind of discount and effect of changes in
the discount rate 15,927 100,996 116,923
Closing Balance 305,250 2,073,214 2,378,465
Current 268,358 1,828,991 2,097,349
Non-current 36,892 244,224 281,116
305,250 2,073,215 2,378,465
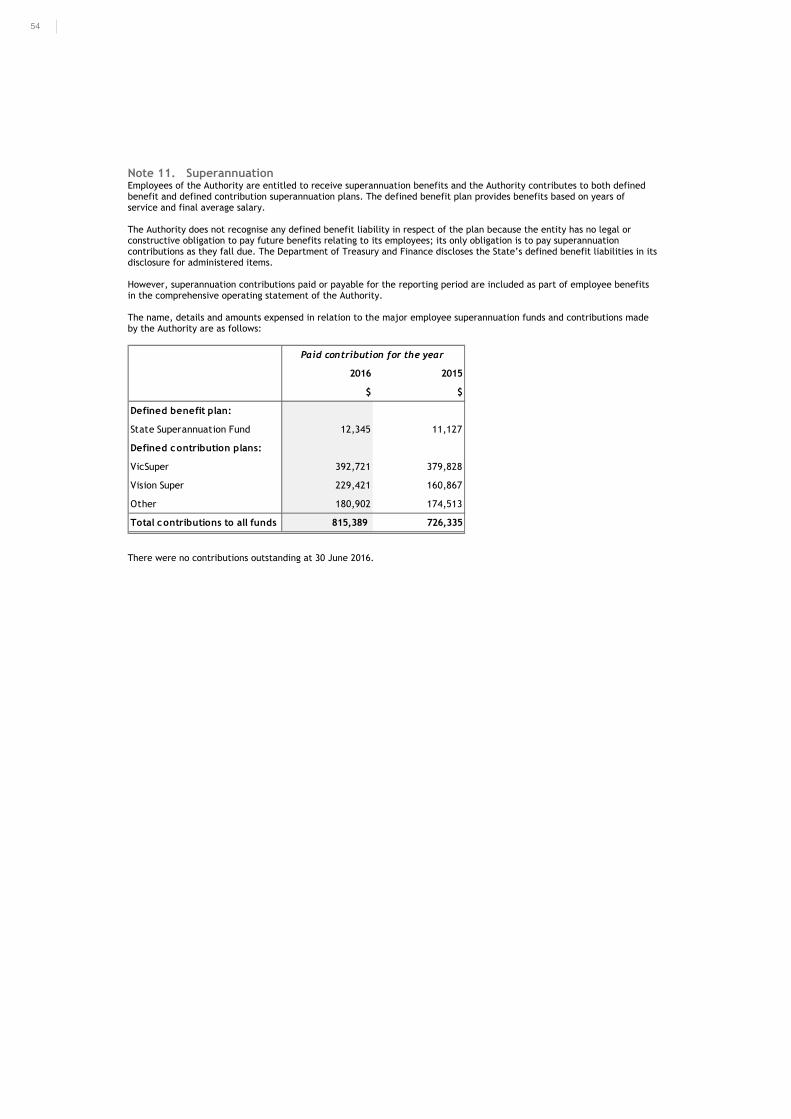
54
Note 11. Superannuation Employees of the Authority are entitled to receive superannuation benefits and the Authority contributes to both defined benefit and defined contribution superannuation plans. The defined benefit plan provides benefits based on years of service and final average salary.
The Authority does not recognise any defined benefit liability in respect of the plan because the entity has no legal or constructive obligation to pay future benefits relating to its employees; its only obligation is to pay superannuation contributions as they fall due. The Department of Treasury and Finance discloses the State’s defined benefit liabilities in its disclosure for administered items.
However, superannuation contributions paid or payable for the reporting period are included as part of employee benefits in the comprehensive operating statement of the Authority.
The name, details and amounts expensed in relation to the major employee superannuation funds and contributions made by the Authority are as follows:
There were no contributions outstanding at 30 June 2016.
2016 2015
$ $
Defined benefit plan:
State Superannuation Fund 12,345 11,127
Defined contribution plans:
VicSuper 392,721 379,828
Vision Super 229,421 160,867
Other 180,902 174,513
Total contributions to all funds 815,389 726,335
Paid contribution for the year
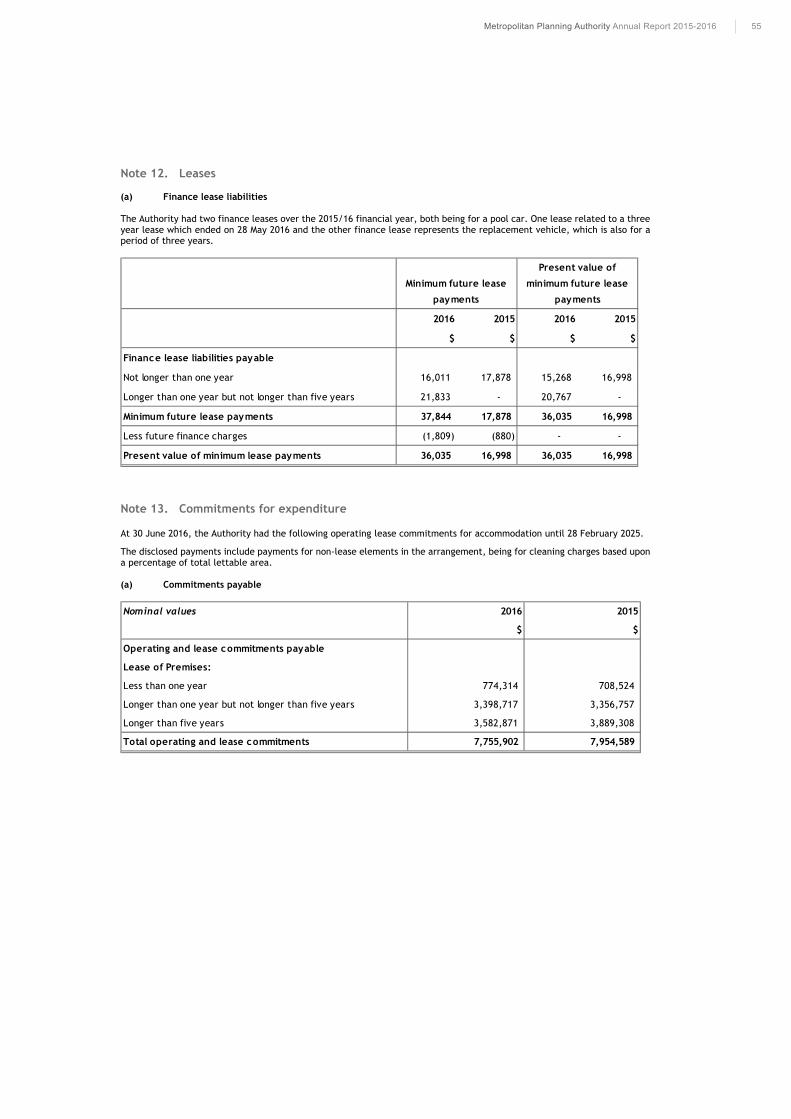
55Metropolitan Planning Authority Annual Report 2015-2016
Note 12. Leases
(a) Finance lease liabilities
The Authority had two finance leases over the 2015/16 financial year, both being for a pool car. One lease related to a three year lease which ended on 28 May 2016 and the other finance lease represents the replacement vehicle, which is also for a period of three years.
Note 13. Commitments for expenditure
At 30 June 2016, the Authority had the following operating lease commitments for accommodation until 28 February 2025.
The disclosed payments include payments for non-lease elements in the arrangement, being for cleaning charges based upon a percentage of total lettable area.
(a) Commitments payable
2016 2015 2016 2015
$ $ $ $
Finance lease liabilities payable
Not longer than one year 16,011 17,878 15,268 16,998
Longer than one year but not longer than five years 21,833 - 20,767 -
Minimum future lease payments 37,844 17,878 36,035 16,998
Less future finance charges (1,809) (880) - -
Present value of minimum lease payments 36,035 16,998 36,035 16,998
Minimum future lease
payments
Present value of
minimum future lease
payments
Nominal values 2016 2015
$ $
Operating and lease commitments payable
Lease of Premises:
Less than one year 774,314 708,524
Longer than one year but not longer than five years 3,398,717 3,356,757
Longer than five years 3,582,871 3,889,308
Total operating and lease commitments 7,755,902 7,954,589
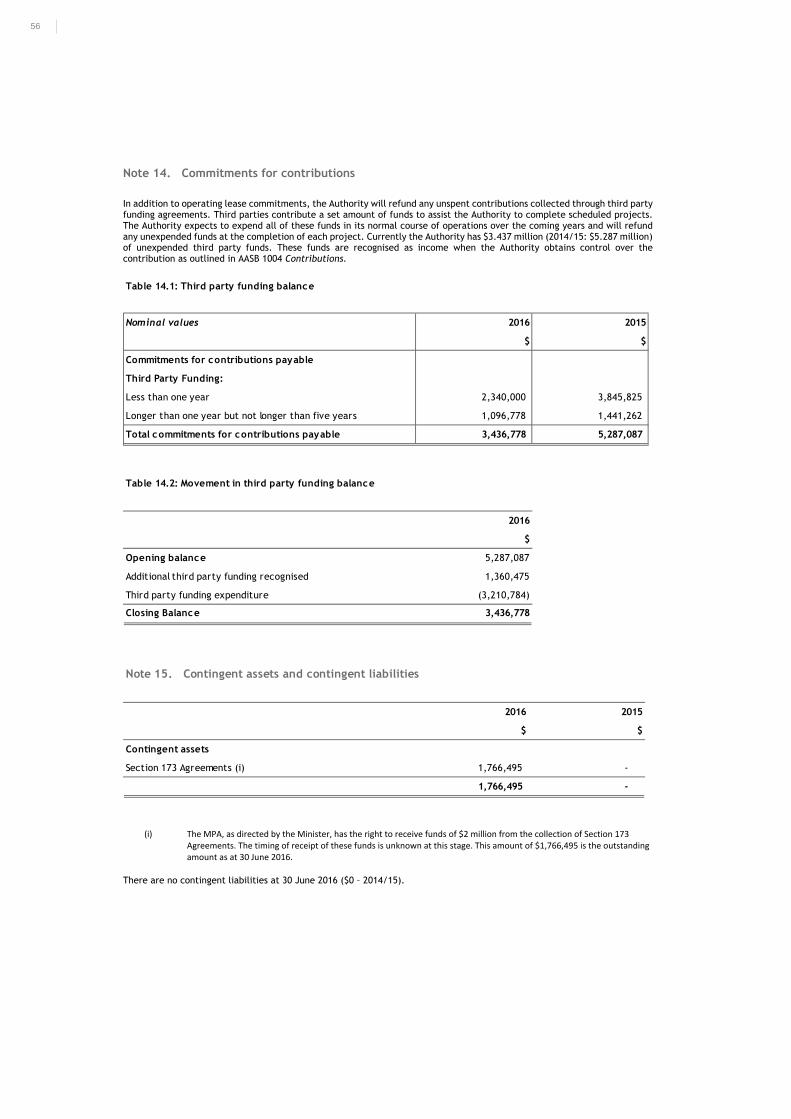
56
Note 14. Commitments for contributions
In addition to operating lease commitments, the Authority will refund any unspent contributions collected through third party funding agreements. Third parties contribute a set amount of funds to assist the Authority to complete scheduled projects. The Authority expects to expend all of these funds in its normal course of operations over the coming years and will refund any unexpended funds at the completion of each project. Currently the Authority has $3.437 million (2014/15: $5.287 million) of unexpended third party funds. These funds are recognised as income when the Authority obtains control over the contribution as outlined in AASB 1004 Contributions.
(i) The MPA, as directed by the Minister, has the right to receive funds of $2 million from the collection of Section 173 Agreements. The timing of receipt of these funds is unknown at this stage. This amount of $1,766,495 is the outstanding amount as at 30 June 2016.
There are no contingent liabilities at 30 June 2016 ($0 – 2014/15).
Table 14.1: Third party funding balance
Nominal values 2016 2015
$ $
Commitments for contributions payable
Third Party Funding:
Less than one year 2,340,000 3,845,825
Longer than one year but not longer than five years 1,096,778 1,441,262
Total commitments for contributions payable 3,436,778 5,287,087
Table 14.2: Movement in third party funding balance
2016
$
Opening balance 5,287,087
Additional third party funding recognised 1,360,475
Third party funding expenditure (3,210,784)
Closing Balance 3,436,778
Note 15. Contingent assets and contingent liabilities
2016 2015
$ $
Contingent assets
Section 173 Agreements (i) 1,766,495 -
1,766,495 -
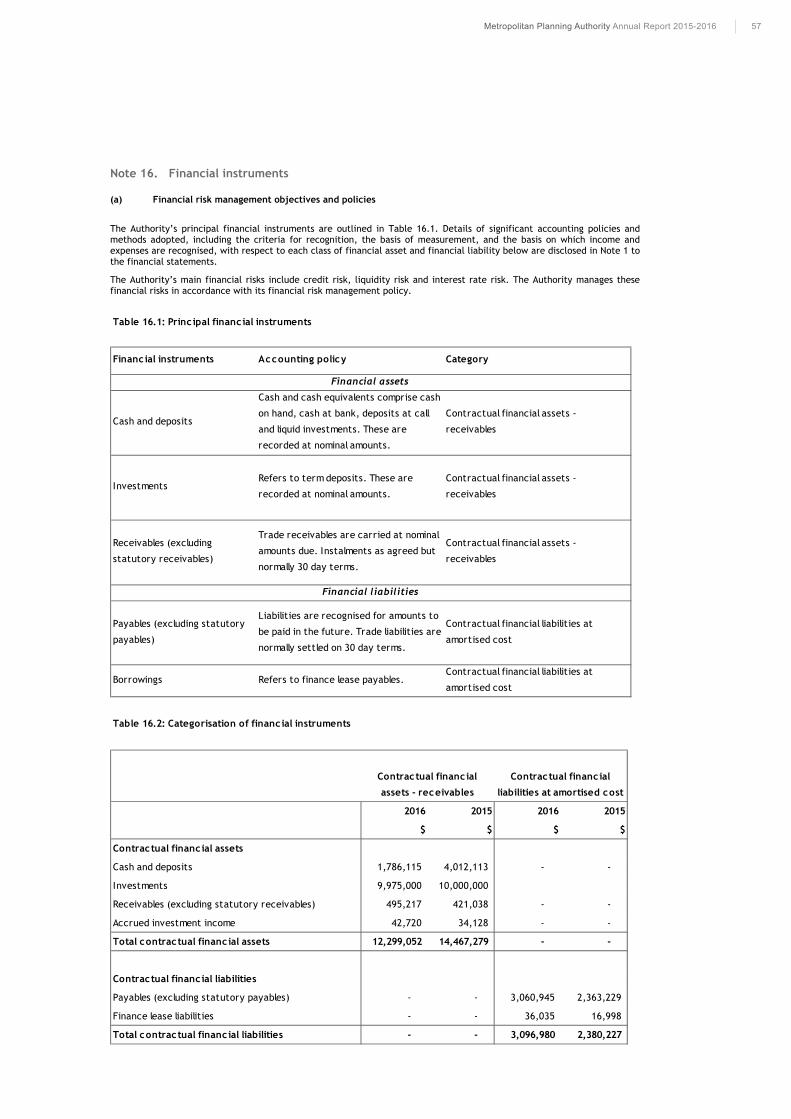
57Metropolitan Planning Authority Annual Report 2015-2016
Note 16. Financial instruments
(a) Financial risk management objectives and policies
The Authority’s principal financial instruments are outlined in Table 16.1. Details of significant accounting policies and methods adopted, including the criteria for recognition, the basis of measurement, and the basis on which income and expenses are recognised, with respect to each class of financial asset and financial liability below are disclosed in Note 1 to the financial statements.
The Authority’s main financial risks include credit risk, liquidity risk and interest rate risk. The Authority manages these financial risks in accordance with its financial risk management policy.
Table 16.1: Princ ipal financial instruments
Financial instruments Accounting policy Category
Cash and deposits
Cash and cash equivalents comprise cash
on hand, cash at bank, deposits at call
and liquid investments. These are
recorded at nominal amounts.
Contractual financial assets -
receivables
InvestmentsRefers to term deposits. These are
recorded at nominal amounts.
Contractual financial assets -
receivables
Receivables (excluding
statutory receivables)
Trade receivables are carried at nominal
amounts due. Instalments as agreed but
normally 30 day terms.
Contractual financial assets -
receivables
Payables (excluding statutory
payables)
Liabilities are recognised for amounts to
be paid in the future. Trade liabilities are
normally settled on 30 day terms.
Contractual financial liabilities at
amortised cost
Borrowings Refers to finance lease payables.Contractual financial liabilities at
amortised cost
Financial assets
Financial liabilities
Table 16.2: Categorisation of financial instruments
2016 2015 2016 2015
$ $ $ $
Contractual financial assets
Cash and deposits 1,786,115 4,012,113 - -
Investments 9,975,000 10,000,000
Receivables (excluding statutory receivables) 495,217 421,038 - -
Accrued investment income 42,720 34,128 - -
Total contractual financial assets 12,299,052 14,467,279 - -
Contractual financial liabilities
Payables (excluding statutory payables) - - 3,060,945 2,363,229
Finance lease liabilities - - 36,035 16,998
Total contractual financial liabilities - - 3,096,980 2,380,227
Contractual financial
assets - receivables
Contractual financial
liabilities at amortised cost
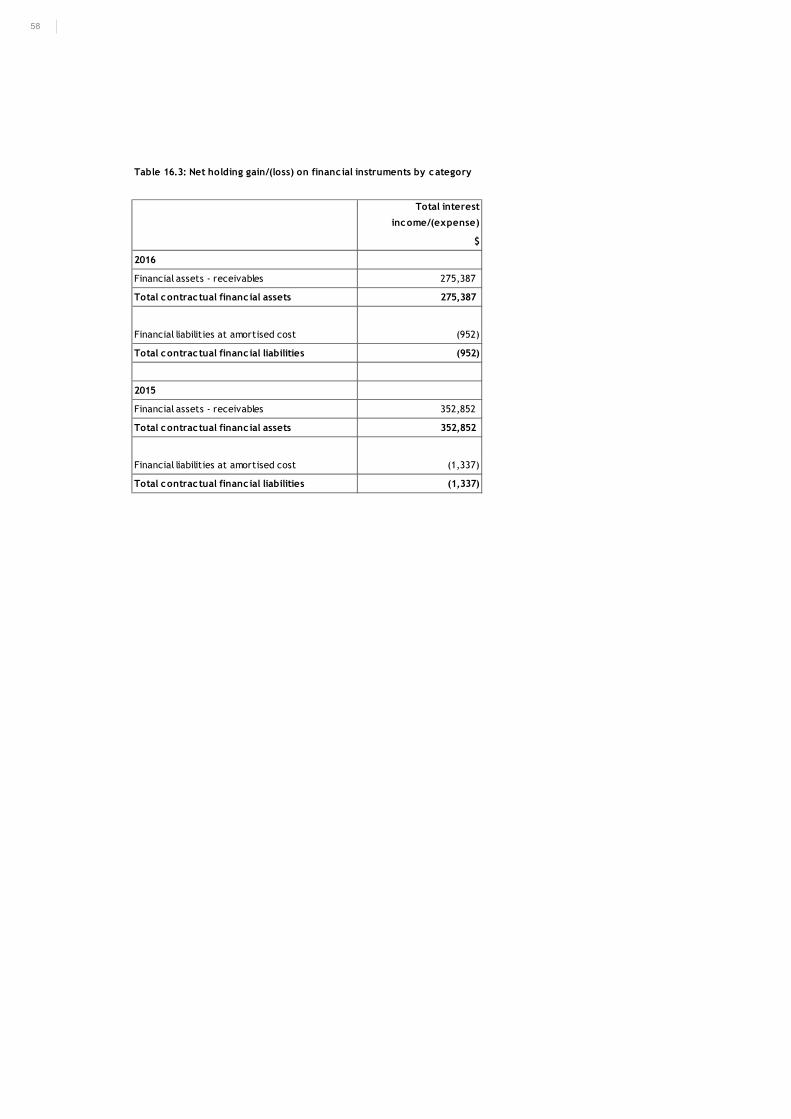
58
Table 16.3: Net holding gain/(loss) on financial instruments by category
Total interest
income/(expense)
$
2016
Financial assets - receivables 275,387
Total contractual financial assets 275,387
Financial liabilities at amortised cost (952)
Total contractual financial liabilities (952)
2015
Financial assets - receivables 352,852
Total contractual financial assets 352,852
Financial liabilities at amortised cost (1,337)
Total contractual financial liabilities (1,337)
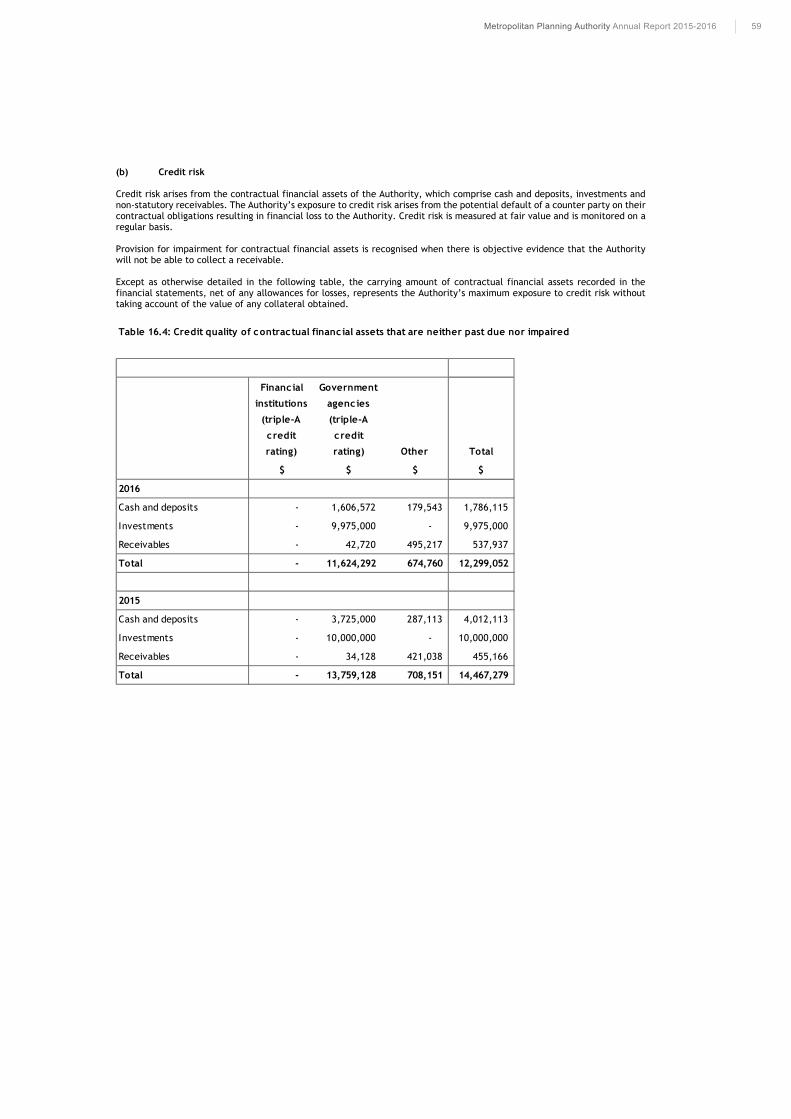
59Metropolitan Planning Authority Annual Report 2015-2016
(b) Credit risk
Credit risk arises from the contractual financial assets of the Authority, which comprise cash and deposits, investments and non-statutory receivables. The Authority’s exposure to credit risk arises from the potential default of a counter party on their contractual obligations resulting in financial loss to the Authority. Credit risk is measured at fair value and is monitored on a regular basis.
Provision for impairment for contractual financial assets is recognised when there is objective evidence that the Authority will not be able to collect a receivable.
Except as otherwise detailed in the following table, the carrying amount of contractual financial assets recorded in the financial statements, net of any allowances for losses, represents the Authority’s maximum exposure to credit risk without taking account of the value of any collateral obtained.
Table 16.4: Credit quality of contractual financial assets that are neither past due nor impaired
Financial
institutions
(triple-A
credit
rating)
Government
agencies
(triple-A
credit
rating) Other Total
$ $ $ $
2016
Cash and deposits - 1,606,572 179,543 1,786,115
Investments - 9,975,000 - 9,975,000
Receivables - 42,720 495,217 537,937
Total - 11,624,292 674,760 12,299,052
2015
Cash and deposits - 3,725,000 287,113 4,012,113
Investments - 10,000,000 - 10,000,000
Receivables - 34,128 421,038 455,166
Total - 13,759,128 708,151 14,467,279
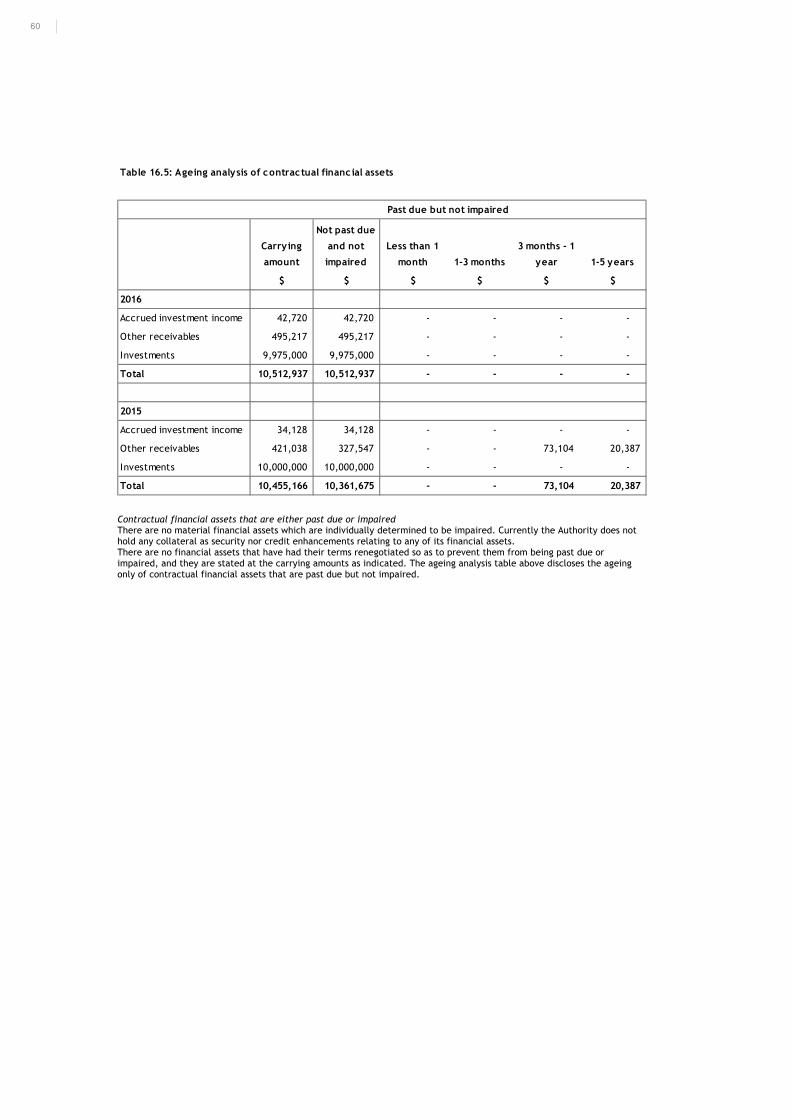
60
Contractual financial assets that are either past due or impaired There are no material financial assets which are individually determined to be impaired. Currently the Authority does not hold any collateral as security nor credit enhancements relating to any of its financial assets. There are no financial assets that have had their terms renegotiated so as to prevent them from being past due or impaired, and they are stated at the carrying amounts as indicated. The ageing analysis table above discloses the ageing only of contractual financial assets that are past due but not impaired.
Table 16.5: Ageing analysis of contractual financ ial assets
Carrying
amount
Not past due
and not
impaired
Less than 1
month 1-3 months
3 months - 1
year 1-5 years
$ $ $ $ $ $
2016
Accrued investment income 42,720 42,720 - - - -
Other receivables 495,217 495,217 - - - -
Investments 9,975,000 9,975,000 - - - -
Total 10,512,937 10,512,937 - - - -
2015
Accrued investment income 34,128 34,128 - - - -
Other receivables 421,038 327,547 - - 73,104 20,387
Investments 10,000,000 10,000,000 - - - -
Total 10,455,166 10,361,675 - - 73,104 20,387
Past due but not impaired
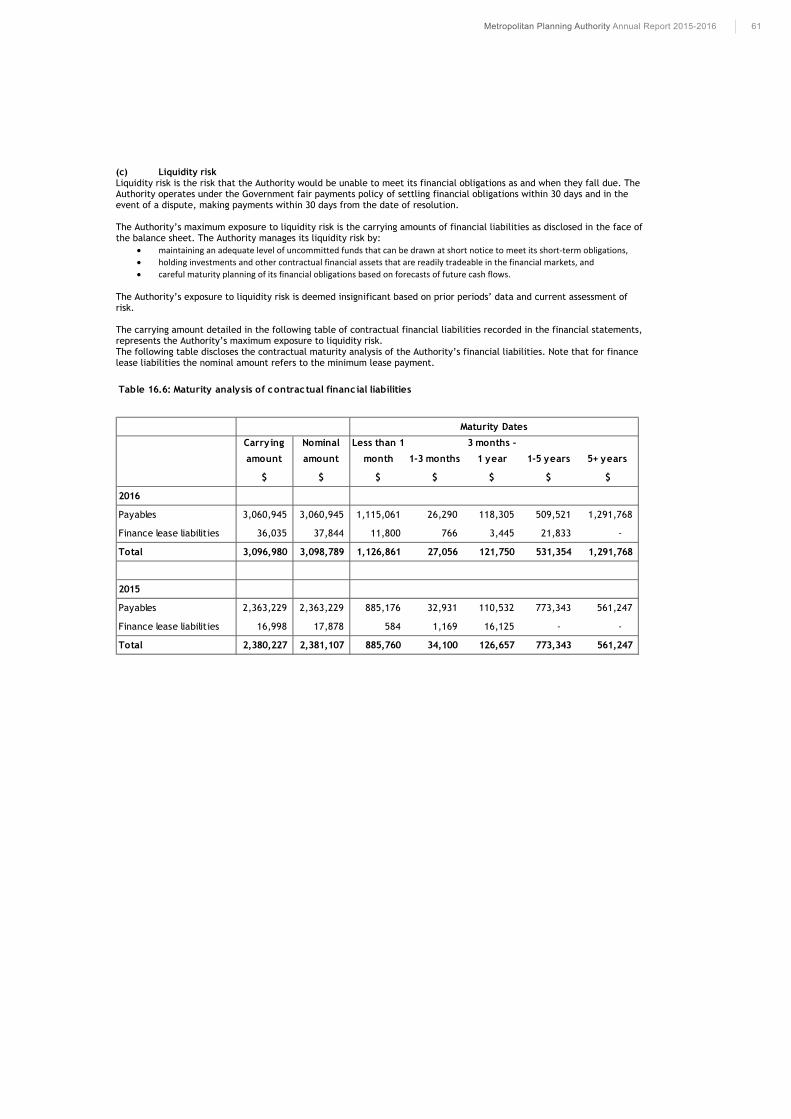
61Metropolitan Planning Authority Annual Report 2015-2016
(c) Liquidity risk Liquidity risk is the risk that the Authority would be unable to meet its financial obligations as and when they fall due. The Authority operates under the Government fair payments policy of settling financial obligations within 30 days and in the event of a dispute, making payments within 30 days from the date of resolution.
The Authority’s maximum exposure to liquidity risk is the carrying amounts of financial liabilities as disclosed in the face of the balance sheet. The Authority manages its liquidity risk by:
maintaining an adequate level of uncommitted funds that can be drawn at short notice to meet its short-term obligations, holding investments and other contractual financial assets that are readily tradeable in the financial markets, and careful maturity planning of its financial obligations based on forecasts of future cash flows.
The Authority’s exposure to liquidity risk is deemed insignificant based on prior periods’ data and current assessment of risk.
The carrying amount detailed in the following table of contractual financial liabilities recorded in the financial statements, represents the Authority’s maximum exposure to liquidity risk. The following table discloses the contractual maturity analysis of the Authority’s financial liabilities. Note that for finance lease liabilities the nominal amount refers to the minimum lease payment.
Table 16.6: Maturity analysis of contractual financial liabilities
Carrying
amount
Nominal
amount
Less than 1
month 1-3 months
3 months -
1 year 1-5 years 5+ years
$ $ $ $ $ $ $
2016
Payables 3,060,945 3,060,945 1,115,061 26,290 118,305 509,521 1,291,768
Finance lease liabilities 36,035 37,844 11,800 766 3,445 21,833 -
Total 3,096,980 3,098,789 1,126,861 27,056 121,750 531,354 1,291,768
2015
Payables 2,363,229 2,363,229 885,176 32,931 110,532 773,343 561,247
Finance lease liabilities 16,998 17,878 584 1,169 16,125 - -
Total 2,380,227 2,381,107 885,760 34,100 126,657 773,343 561,247
Maturity Dates
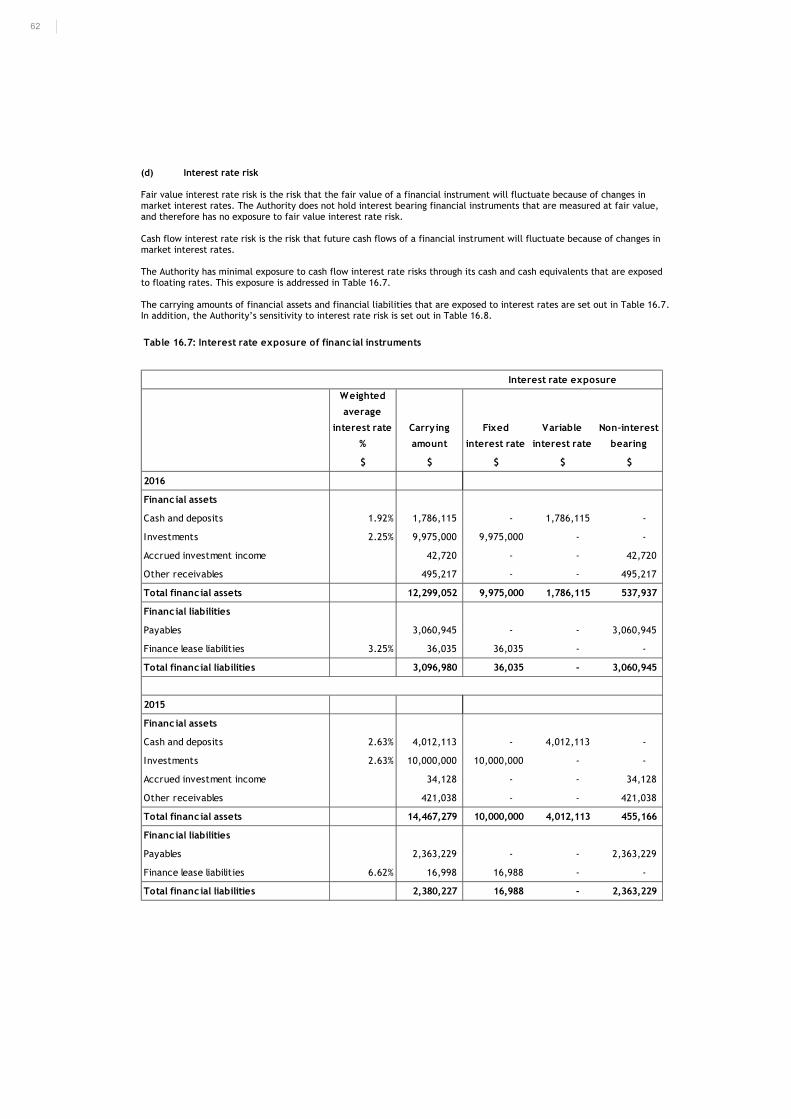
62
(d) Interest rate risk
Fair value interest rate risk is the risk that the fair value of a financial instrument will fluctuate because of changes in market interest rates. The Authority does not hold interest bearing financial instruments that are measured at fair value, and therefore has no exposure to fair value interest rate risk.
Cash flow interest rate risk is the risk that future cash flows of a financial instrument will fluctuate because of changes in market interest rates.
The Authority has minimal exposure to cash flow interest rate risks through its cash and cash equivalents that are exposed to floating rates. This exposure is addressed in Table 16.7.
The carrying amounts of financial assets and financial liabilities that are exposed to interest rates are set out in Table 16.7. In addition, the Authority’s sensitivity to interest rate risk is set out in Table 16.8.
Table 16.7: Interest rate exposure of financ ial instruments
Weighted
average
interest rate
%
Carrying
amount
Fixed
interest rate
Variable
interest rate
Non-interest
bearing
$ $ $ $ $
2016
Financial assets
Cash and deposits 1.92% 1,786,115 - 1,786,115 -
Investments 2.25% 9,975,000 9,975,000 - -
Accrued investment income 42,720 - - 42,720
Other receivables 495,217 - - 495,217
Total financial assets 12,299,052 9,975,000 1,786,115 537,937
Financial liabilities
Payables 3,060,945 - - 3,060,945
Finance lease liabilities 3.25% 36,035 36,035 - -
Total financial liabilities 3,096,980 36,035 - 3,060,945
2015
Financial assets
Cash and deposits 2.63% 4,012,113 - 4,012,113 -
Investments 2.63% 10,000,000 10,000,000 - -
Accrued investment income 34,128 - - 34,128
Other receivables 421,038 - - 421,038
Total financial assets 14,467,279 10,000,000 4,012,113 455,166
Financial liabilities
Payables 2,363,229 - - 2,363,229
Finance lease liabilities 6.62% 16,998 16,988 - -
Total financial liabilities 2,380,227 16,988 - 2,363,229
Interest rate exposure
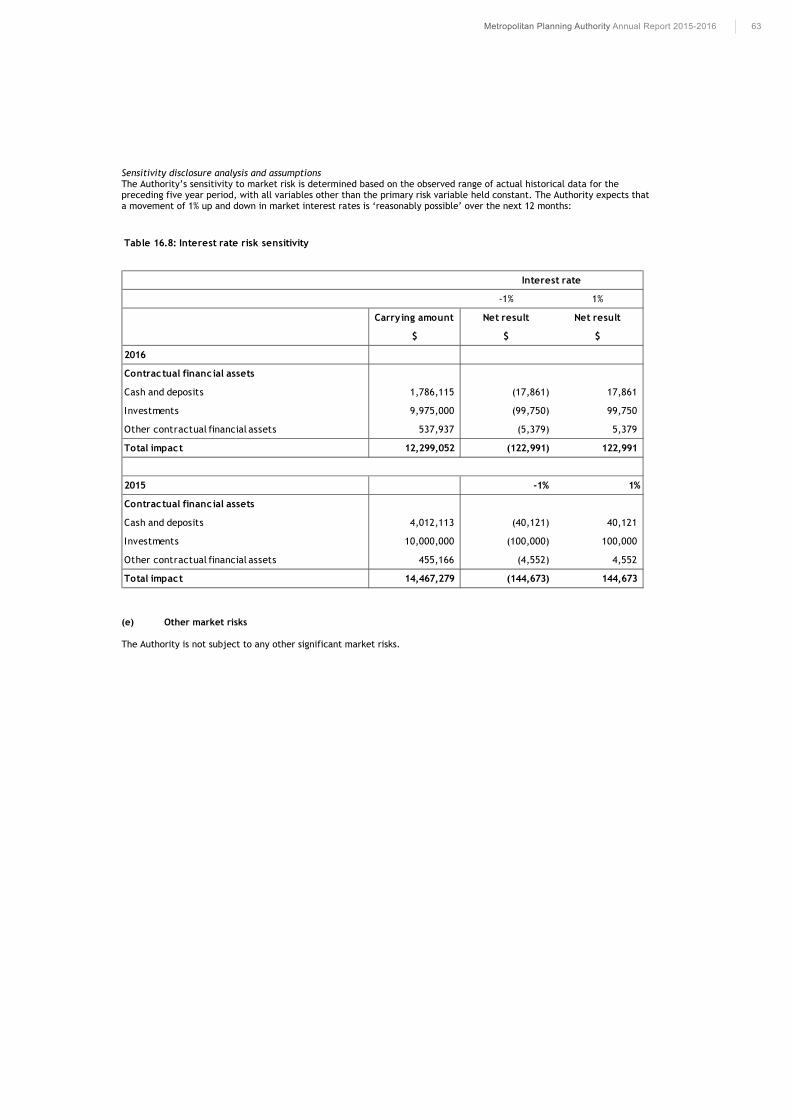
63Metropolitan Planning Authority Annual Report 2015-2016
Sensitivity disclosure analysis and assumptions The Authority’s sensitivity to market risk is determined based on the observed range of actual historical data for the preceding five year period, with all variables other than the primary risk variable held constant. The Authority expects that a movement of 1% up and down in market interest rates is ‘reasonably possible’ over the next 12 months:
(e) Other market risks
The Authority is not subject to any other significant market risks.
Table 16.8: Interest rate risk sensitivity
-1% 1%
Carrying amount Net result Net result
$ $ $
2016
Contractual financial assets
Cash and deposits 1,786,115 (17,861) 17,861
Investments 9,975,000 (99,750) 99,750
Other contractual financial assets 537,937 (5,379) 5,379
Total impact 12,299,052 (122,991) 122,991
2015 -1% 1%
Contractual financial assets
Cash and deposits 4,012,113 (40,121) 40,121
Investments 10,000,000 (100,000) 100,000
Other contractual financial assets 455,166 (4,552) 4,552
Total impact 14,467,279 (144,673) 144,673
Interest rate
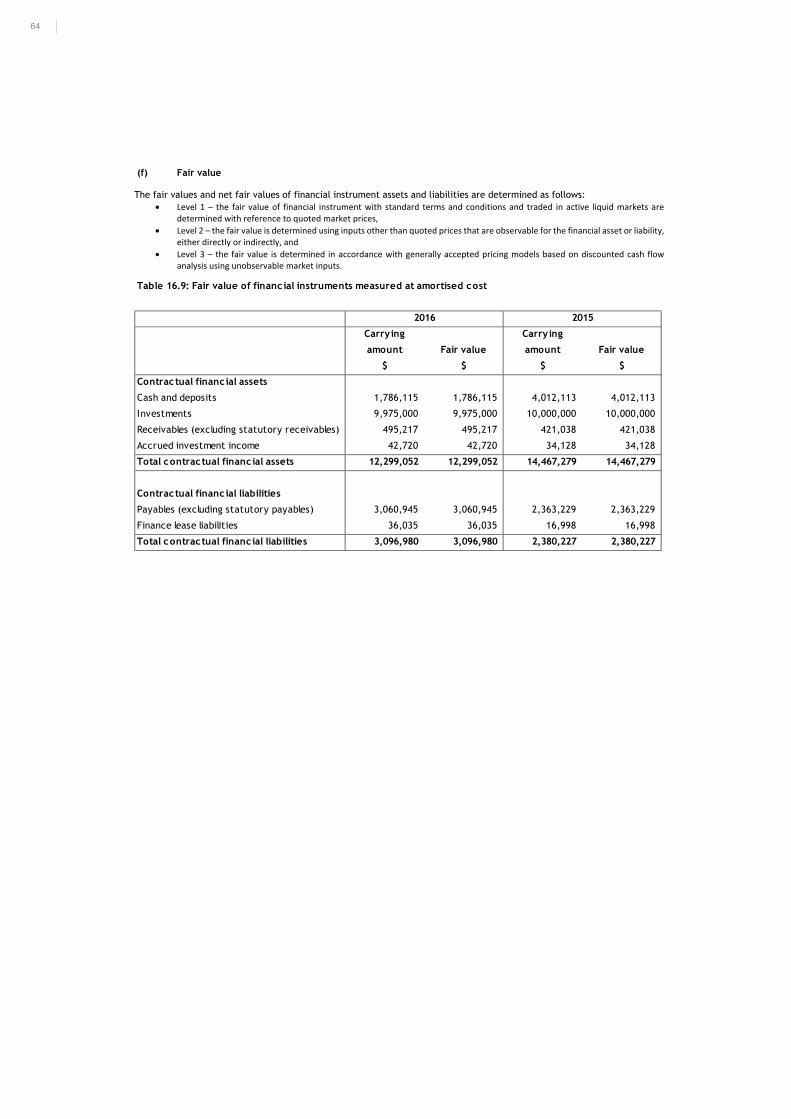
64
(f) Fair value
The fair values and net fair values of financial instrument assets and liabilities are determined as follows: Level 1 – the fair value of financial instrument with standard terms and conditions and traded in active liquid markets are
determined with reference to quoted market prices, Level 2 – the fair value is determined using inputs other than quoted prices that are observable for the financial asset or liability,
either directly or indirectly, and Level 3 – the fair value is determined in accordance with generally accepted pricing models based on discounted cash flow
analysis using unobservable market inputs.
Table 16.9: Fair value of financ ial instruments measured at amortised cost
Carrying
amount Fair value
Carrying
amount Fair value
$ $ $ $
Contractual financial assets
Cash and deposits 1,786,115 1,786,115 4,012,113 4,012,113
Investments 9,975,000 9,975,000 10,000,000 10,000,000
Receivables (excluding statutory receivables) 495,217 495,217 421,038 421,038
Accrued investment income 42,720 42,720 34,128 34,128
Total contractual financial assets 12,299,052 12,299,052 14,467,279 14,467,279
Contractual financial liabilities
Payables (excluding statutory payables) 3,060,945 3,060,945 2,363,229 2,363,229
Finance lease liabilities 36,035 36,035 16,998 16,998
Total contractual financial liabilities 3,096,980 3,096,980 2,380,227 2,380,227
20152016
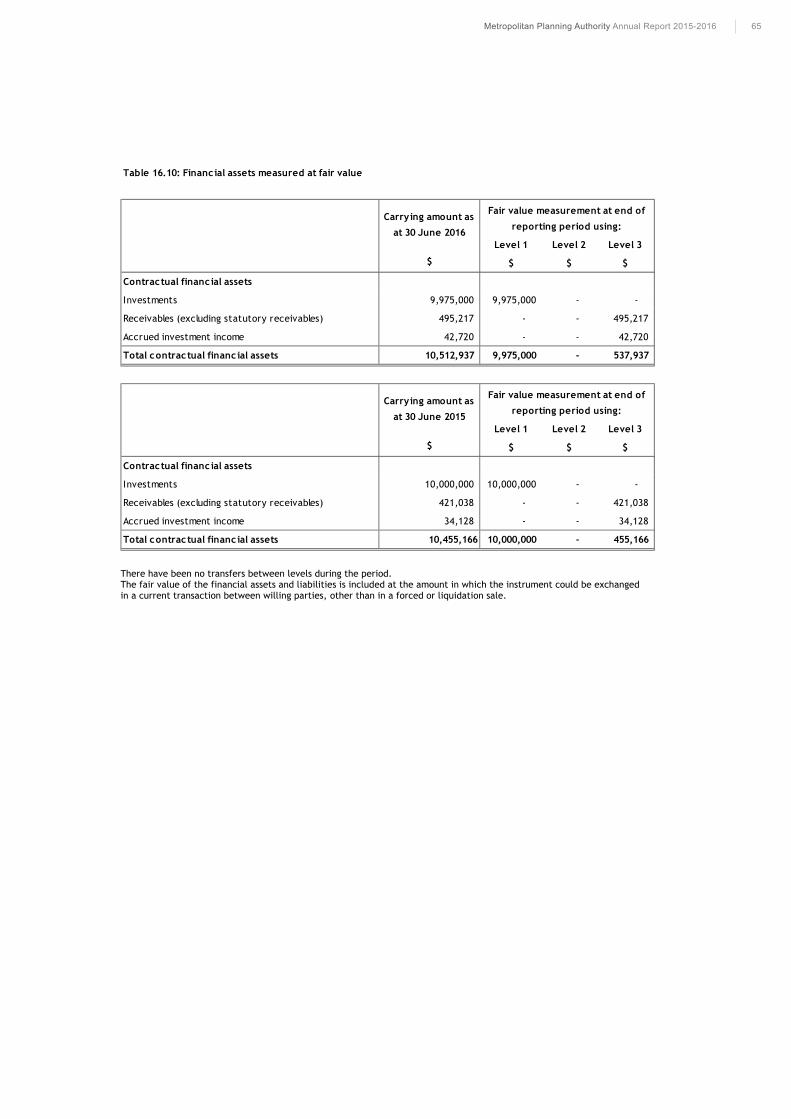
65Metropolitan Planning Authority Annual Report 2015-2016
There have been no transfers between levels during the period. The fair value of the financial assets and liabilities is included at the amount in which the instrument could be exchanged in a current transaction between willing parties, other than in a forced or liquidation sale.
Table 16.10: Financial assets measured at fair value
Level 1 Level 2 Level 3
$ $ $ $
Contractual financial assets
Investments 9,975,000 9,975,000 - -
Receivables (excluding statutory receivables) 495,217 - - 495,217
Accrued investment income 42,720 - - 42,720
Total contractual financ ial assets 10,512,937 9,975,000 - 537,937
Level 1 Level 2 Level 3
$ $ $ $
Contractual financial assets
Investments 10,000,000 10,000,000 - -
Receivables (excluding statutory receivables) 421,038 - - 421,038
Accrued investment income 34,128 - - 34,128
Total contractual financ ial assets 10,455,166 10,000,000 - 455,166
Carrying amount as
at 30 June 2015
Fair value measurement at end of
reporting period using:
Carrying amount as
at 30 June 2016
Fair value measurement at end of
reporting period using:
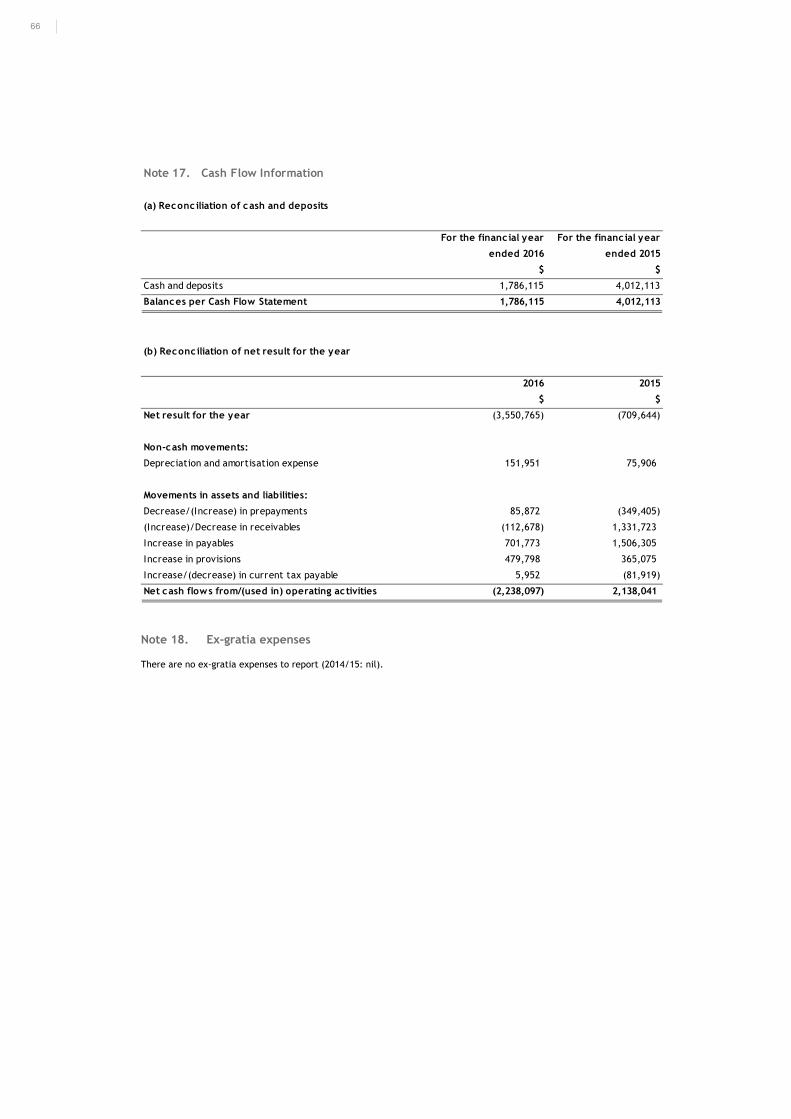
66
Note 18. Ex-gratia expenses There are no ex-gratia expenses to report (2014/15: nil).
Note 17. Cash Flow Information
(a) Reconc iliation of cash and deposits
For the financial year
ended 2016
For the financ ial year
ended 2015
$ $
Cash and deposits 1,786,115 4,012,113
Balances per Cash Flow Statement 1,786,115 4,012,113
(b) Reconciliation of net result for the year
2016 2015
$ $
Net result for the year (3,550,765) (709,644)
Non-cash movements:
Depreciation and amortisation expense 151,951 75,906
Movements in assets and liabilities:
Decrease/(Increase) in prepayments 85,872 (349,405)
(Increase)/Decrease in receivables (112,678) 1,331,723
Increase in payables 701,773 1,506,305
Increase in provisions 479,798 365,075
Increase/(decrease) in current tax payable 5,952 (81,919)
Net cash flows from/(used in) operating activities (2,238,097) 2,138,041
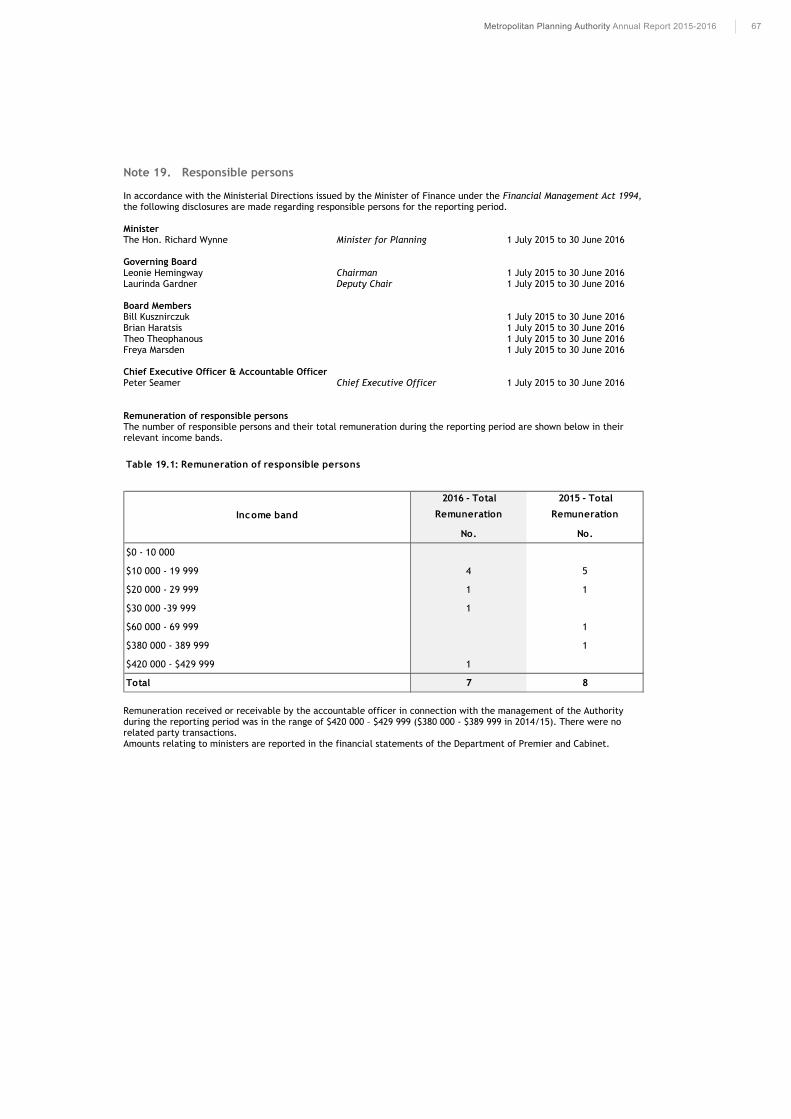
67Metropolitan Planning Authority Annual Report 2015-2016
Note 19. Responsible persons
In accordance with the Ministerial Directions issued by the Minister of Finance under the Financial Management Act 1994, the following disclosures are made regarding responsible persons for the reporting period.
Minister The Hon. Richard Wynne Minister for Planning 1 July 2015 to 30 June 2016
Governing Board Leonie Hemingway Chairman 1 July 2015 to 30 June 2016 Laurinda Gardner Deputy Chair 1 July 2015 to 30 June 2016
Board Members Bill Kusznirczuk 1 July 2015 to 30 June 2016Brian Haratsis 1 July 2015 to 30 June 2016Theo Theophanous 1 July 2015 to 30 June 2016Freya Marsden 1 July 2015 to 30 June 2016
Chief Executive Officer & Accountable Officer Peter Seamer Chief Executive Officer 1 July 2015 to 30 June 2016
Remuneration of responsible persons The number of responsible persons and their total remuneration during the reporting period are shown below in their relevant income bands.
Remuneration received or receivable by the accountable officer in connection with the management of the Authority during the reporting period was in the range of $420 000 – $429 999 ($380 000 - $389 999 in 2014/15). There were no related party transactions.Amounts relating to ministers are reported in the financial statements of the Department of Premier and Cabinet.
Table 19.1: Remuneration of responsible persons
2016 - Total
Remuneration
2015 - Total
Remuneration
No. No.
$0 - 10 000
$10 000 - 19 999 4 5
$20 000 - 29 999 1 1
$30 000 -39 999 1
$60 000 - 69 999 1
$380 000 - 389 999 1
$420 000 - $429 999 1
Total 7 8
Income band
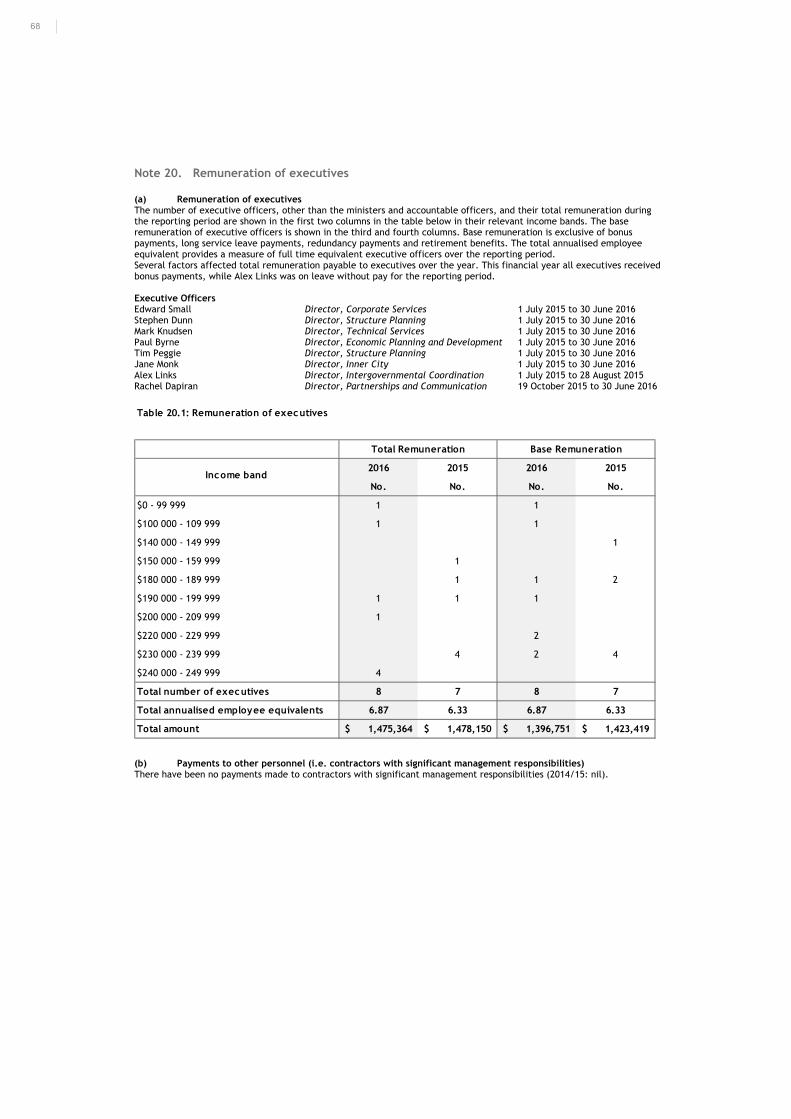
68
Note 20. Remuneration of executives (a) Remuneration of executives The number of executive officers, other than the ministers and accountable officers, and their total remuneration during the reporting period are shown in the first two columns in the table below in their relevant income bands. The base remuneration of executive officers is shown in the third and fourth columns. Base remuneration is exclusive of bonus payments, long service leave payments, redundancy payments and retirement benefits. The total annualised employee equivalent provides a measure of full time equivalent executive officers over the reporting period. Several factors affected total remuneration payable to executives over the year. This financial year all executives received bonus payments, while Alex Links was on leave without pay for the reporting period. Executive Officers Edward Small Director, Corporate Services 1 July 2015 to 30 June 2016 Stephen Dunn Director, Structure Planning 1 July 2015 to 30 June 2016 Mark Knudsen Director, Technical Services 1 July 2015 to 30 June 2016 Paul Byrne Director, Economic Planning and Development 1 July 2015 to 30 June 2016 Tim Peggie Director, Structure Planning 1 July 2015 to 30 June 2016 Jane Monk Director, Inner City 1 July 2015 to 30 June 2016 Alex Links Director, Intergovernmental Coordination 1 July 2015 to 28 August 2015 Rachel Dapiran Director, Partnerships and Communication 19 October 2015 to 30 June 2016
(b) Payments to other personnel (i.e. contractors with significant management responsibilities) There have been no payments made to contractors with significant management responsibilities (2014/15: nil).
Table 20.1: Remuneration of executives
2016 2015 2016 2015
No. No. No. No.
$0 - 99 999 1 1
$100 000 - 109 999 1 1
$140 000 - 149 999 1
$150 000 - 159 999 1
$180 000 - 189 999 1 1 2
$190 000 - 199 999 1 1 1
$200 000 - 209 999 1
$220 000 - 229 999 2
$230 000 - 239 999 4 2 4
$240 000 - 249 999 4
Total number of executives 8 7 8 7
Total annualised employee equivalents 6.87 6.33 6.87 6.33
Total amount 1,475,364$ 1,478,150$ 1,396,751$ 1,423,419$
Total Remuneration Base Remuneration
Income band
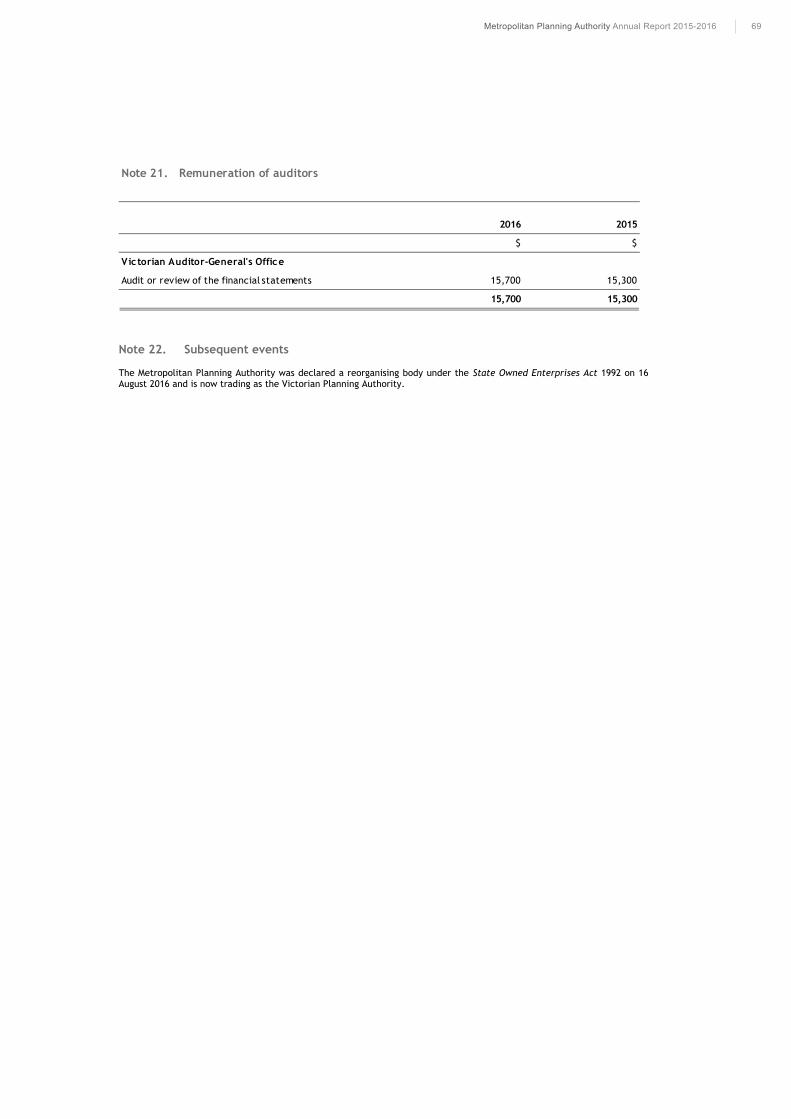
69Metropolitan Planning Authority Annual Report 2015-2016
Note 22. Subsequent events The Metropolitan Planning Authority was declared a reorganising body under the State Owned Enterprises Act 1992 on 16 August 2016 and is now trading as the Victorian Planning Authority.
Note 21. Remuneration of auditors
2016 2015
$ $
Victorian Auditor-General's Office
Audit or review of the financial statements 15,700 15,300
15,700 15,300
70
Metropolitan Planning Authority Statutory Certification
We certify that the attached financial statements for the Growth Areas Authority (trading as the Metropolitan Planning Authority) have been prepared in accordance with Standing Direction 4.2 of the Financial Management Act 1994, applicable Financial Reporting Directions, Australian Accounting Standards including Interpretations and other mandatory professional reporting requirements.
We further state that, in our opinion, the information set out in the comprehensive operating statement, balance sheet, statement of changes in equity, cash flow statement and accompanying notes, presents fairly the financial transactions during the year ended 30 June 2016 and financial position of the Authority at 30 June 2016.
At the time of signing we are not aware of any circumstance which would render any particulars included in the financial statements to be misleading or inaccurate.
We authorise the attached financial statements for issue on 21 September 2016.
Peter Seamer Chief Executive Officer
Melbourne September 2016
W. R. (Bill) Kusnirczuk Acting Chair
Melbourne September 2016
Edward Small Chief Financial Officer
Melbourne September 2016
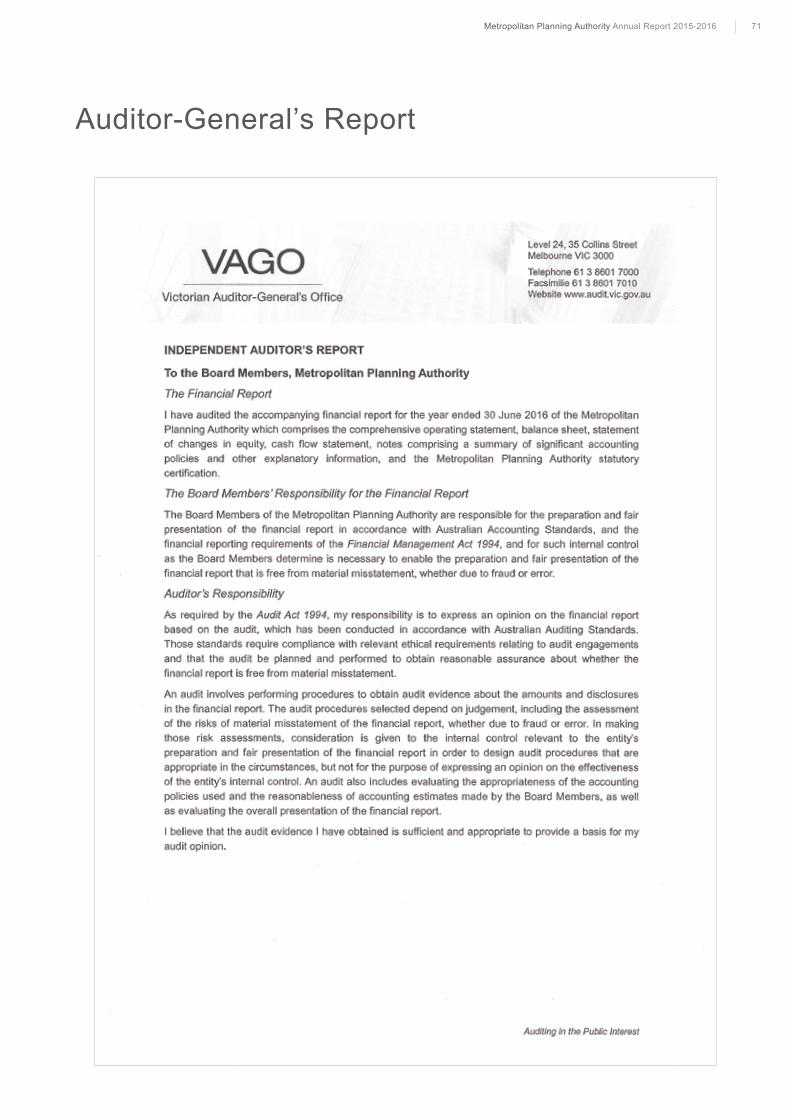
71Metropolitan Planning Authority Annual Report 2015-2016
Auditor-General’s Report
72

Victorian Planning Authority Level 25, 35 Collins Street Melbourne Victoria 3000
Telephone: 03 9651 9600 Facsimile: 03 9651 9623
www.vpa.vic.gov.au
Metropolitan Planning Authority Annual Report 2015-2016

partners in planning and infrastructure coordination