Metrology of sensor networks: uncertainty evaluation, self ... · Metrology of sensor networks:...
44
Metrology of sensor networks: uncertainty evaluation, self-validation, timing and data fusion T J Esward Emerging Topics in Mathematics for Metrology – from Measurement Uncertainty to Metrology of Complex Systems, June 21-22 2010, PTB Berlin
Transcript of Metrology of sensor networks: uncertainty evaluation, self ... · Metrology of sensor networks:...

Metrology of sensor networks: uncertainty evaluation, self-validation, timing and data fusion
T J Esward
Emerging Topics in Mathematics for Metrology – from Measurement Uncertainty to Metrology of Complex Systems, June 21-22 2010, PTB Berlin
Sunday, 13 June 2010
2
Aim
• Introduce metrology of networks and distributed systems
• Review examples from NPL’s current and recent work– uncertainty evaluation– self-validation– timing and synchronisation– sensor and data fusion
• Conclusions

Sunday, 13 June 2010
3
Background

Sunday, 13 June 2010
4
Building effective sensor networks
• Wireless sensor networks set to become significant enabling technology in many areas of measurement, security, and environmental monitoring
• New developments are leading to autonomous sensor networks that know where they are and adapt to their environment

Sunday, 13 June 2010
5
Advantages of distributed sensing
• Distinctive aspect of sensor networks compared with traditional single sensor is distributed sensing
• In a distributed system, measurement tasks may be collaborative measurements by several sensors
• Data from various sensors are aggregated to produce better information than from a single sensor

Sunday, 13 June 2010
6
Consequences
• Improved uncertainty– best combined estimate (BCE) of the measurement is
obtained through data fusion applied to multiple sensors, and uncertainty associated with BCE is better than for a single sensor
• Increased confidence– measurement confidence is increased as measurement from
one sensor is confirmed by measurements from other sensors
• Higher robustness and reliability– distributed sensing can use data redundancy so that system
can still provide information even in case of partial failure

Sunday, 13 June 2010
7
NPL’s work in sensor and data fusion

Sunday, 13 June 2010
8
Some key NPL papers• Cox M G (2007) The evaluation of key comparison data:
determining a largest consistent sub-set Metrologia 44 187-200
• Collett M A, Cox M G, Esward T J, Harris P M and Sousa J A (2007) Aggregating measurement data influenced by common effects Metrologia 44(5) 308-318
• Collett M A, Cox M G, Duta M, Esward T J, Harris P M and Henry M P (2008) The application of self-validation to wireless sensor networks Measurement Science and Technology 19(12) 125201
• Collett M A, Matthews C E, Esward T J and Whibberley P B (2010) Measurement and simulation of clock errors from resource-constrained embedded systems Measurement Science and Technology 21 075203

Sunday, 13 June 2010
9
Collaboration• External: Oxford University Engineering Science
Department– Duta M D and Henry M P (2005) The fusion of redundant
SEVA measurements IEEE Transactions on Control Systems Technology 13 173-184
• NPL– Communication Technologies Group– Time & Security Group– Mathematics & Scientific Computing
• Funding programmes– Software Support for Metrology (SSfM)– Measurements for Emerging Technologies– NPL Strategic Research

Sunday, 13 June 2010
10
Self-validation

Sunday, 13 June 2010
11
Can networks be made self-validating?
• Self-validation has already been applied successfully to single instruments by Engineering Science Department at Oxford University and others
• Fault-tolerance is a highly desirable property for any control system – fault-tolerant controllers typically rely on some sort of fault
detection algorithm
• SEVA devices extend this concept– supply user with an estimate of measurement reliability as
well as measurement value and its associated uncertainty

Sunday, 13 June 2010
12
Single MICAz mote

Sunday, 13 June 2010
13
MICAz WSN developer kit motes

Sunday, 13 June 2010
14
Sensors vary in performance• Motes are quite poor at ranging acoustically. Over
distances up to a metre they can be tens of centimetres out. Some are worse than others– seems to arise from a mixture of hardware and software
limitations• Our solution
– do a “black-box" calibration of pairs of motes– use largest consistent sub-set methodology to study a
network of sensors with a common measurement task• Task was to measure radius of circle with a mote at
centre and six motes around the circle– use key features of mote behaviour to investigate self-
validation methods

Sunday, 13 June 2010
15
Calibration set-up

Sunday, 13 June 2010
16
Measurement set-up

Sunday, 13 June 2010
17
Individual sensors vary in their accuracy

Sunday, 13 June 2010
18
An inaccurate but precise sensor

Sunday, 13 June 2010
19
Largest consistent sub-set (LCS)
• Methodology developed originally at NPL to study key comparison data in interlaboratorycomparisons
• Aim is to give mathematically sound basis to identification of inconsistent data and evaluation of reference values and associated uncertainties
• Applied originally to independent (uncorrelated) measurements of quantity of interest, but now extended to logically correlated measurements

Sunday, 13 June 2010
20
What can LCS tell us about the network?
• Does the calibration process correct the data successfully?
• Each receiver at a particular position makes several measurements of range - are these consistent?
• Are the measurements made by an individual receiver in different configurations consistent?
• Are the six receivers consistent with each other?

Sunday, 13 June 2010
21
Self-consistent sensor?

Sunday, 13 June 2010
22
But sometimes it’s not that simple
Sunday, 13 June 2010
23
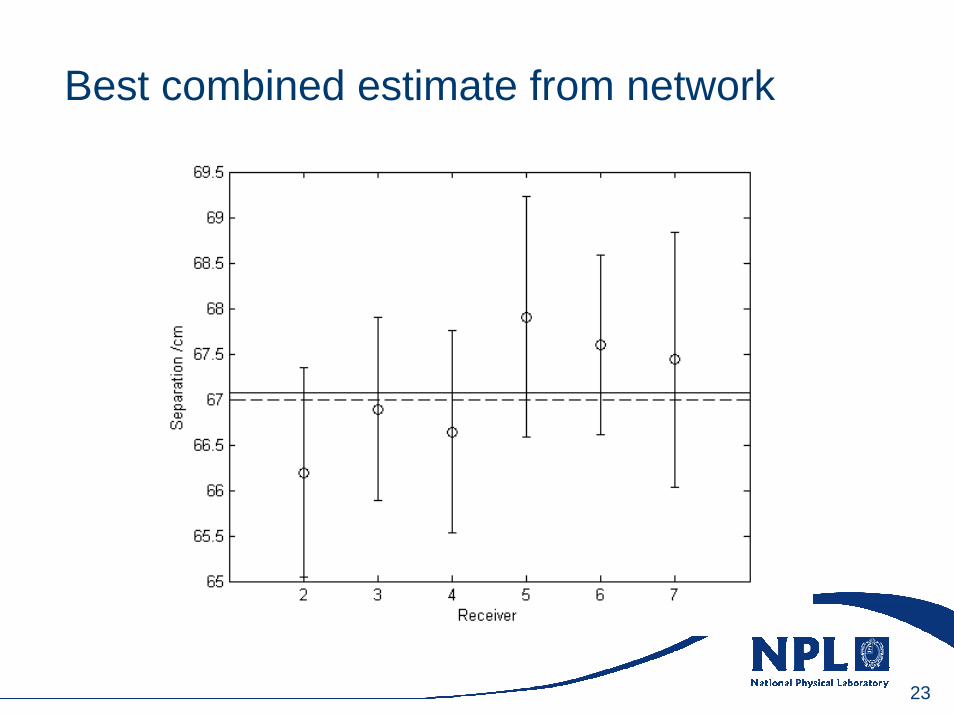
Best combined estimate from network

Sunday, 13 June 2010
24
Self-validating network: conclusions
• Showed that for demonstrator network that has been given the task of acoustic location of a target, self-validation can be built into the distributed measurement task
• Combined with simple calibration methods, the network was capable of more accurate location measurement than would be possible with a single sensor, and can report when the output of specific sensors is unreliable

Sunday, 13 June 2010
25
Timing in networks
Sunday, 13 June 2010
26
Why is timing important in networks?• Multiple sensors must be synchronised to sufficient
precision and accuracy to allow comparison of data gathered across the network
• Order in which measured values are collected must be accurately known if certain types of data fusion are to be carried out
• Many WSN capabilities rely on precise synchronization, such as time division multiplexing to share communications bandwidth, reliable hibernation for power saving, and accurate timing of signal arrival measurements for node localisation or target tracking

Sunday, 13 June 2010
27
The MICAz mote again
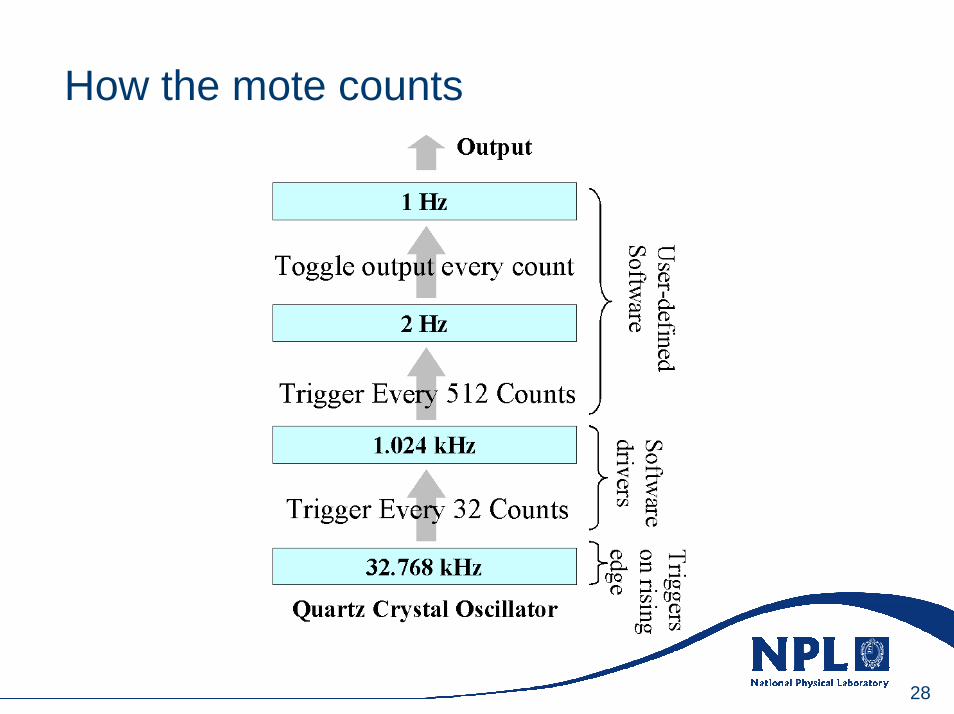
• Investigated via measurement and simulation the output of onboard clock of a Crossbow MICAz testbed– quartz oscillator accessed via a combination of
hardware and software • Showed that clock output available to user
suffers a number of instabilities and errors• Using a simple software simulation of the
system based upon a series of nested loops we identified source of each component of the error
Sunday, 13 June 2010
28
How the mote counts

Sunday, 13 June 2010
29
Simulation assumptions
• Timing is a counting process• Can simulate errors in timing by simulating
an imperfect counting system• Assume two types of basic counting errors
– counter misses a count or counts– counter records one event twice or more times
• Associate probability distributions with these error sources and apply Monte Carlo method

Sunday, 13 June 2010
30
How the simulation software counts

Sunday, 13 June 2010
31
Instantaneous frequency: measured

Sunday, 13 June 2010
32
Instantaneous frequency: simulated

Sunday, 13 June 2010
33
Timing: conclusions
• Simple phenomenological simulation method was able to account for– long-term drift– temperature effects– trigger threshold effects– jitter

Sunday, 13 June 2010
34
Data fusion in networks

Sunday, 13 June 2010
35
Design of small network of sensors
• How to design an effective network for environmental monitoring?
• Topics of interest– comparing data fusion algorithms– uncertainty evaluation– effects of faulty sensors– largest consistent sub-set of sensors
• Implement in Matlab– source code available to users
Sunday, 13 June 2010
36
Key features of system: 1
• 5 independent temperature sensors, 5 independent pressure sensors, but performance of pressure sensors is temperature dependent
• Each sensor can be defined by calibration information– some sensor outputs are noisier than others
• Sensors can develop faults during simulation
• Two fusion methods compared

Sunday, 13 June 2010
37
Key features of system: 2
• Simulate underlying temperature and pressure history– sample this with each sensor
• Obtain individual sensor estimates of quantity of interest and associated uncertainty
• Produce best combined estimate of temperature and pressure and associated uncertainties using two fusion methods
Sunday, 13 June 2010
38
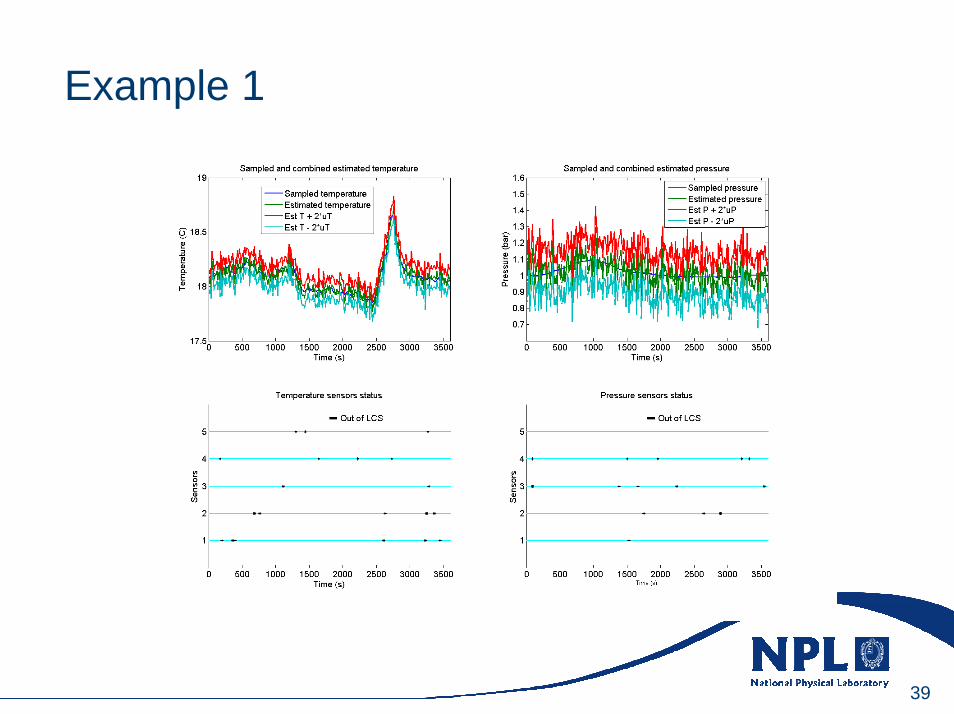
Example results for NPL’s LCS method • Example 1: all sensors assumed to operate at all
times in accordance with their individual calibration functions, all temperature sensors are identical, all pressure sensors are identical, and all sensors produce a high level of noise in their outputs
• Example 2: all sensors are assumed to operate at all times in accordance with their individual calibration functions, but temperature sensors are different from each other, as are pressure sensors, and sensor noise levels are generally small– three temperature sensors become “faulty” at different times
and remain faulty until end of simulation
Sunday, 13 June 2010
39
Example 1

Sunday, 13 June 2010
40
Example 2
Sunday, 13 June 2010
41
Limitations of our approach
• Have not been concerned with computational effort to perform analysis– we do not give any recommendations about suitability of
algorithms for real time applications
• Have not addressed determination of largest number of sensors to which these methods can be reasonably applied without producing intractably long computation times
• Both data fusion methods treat each data point in time series independently of other data points

Sunday, 13 June 2010
42
Next stages
• Include sensors for which bandwidth limitations are important– convolution and deconvolution methods may be
needed
• New SSfM programme work– time series with missing data points– more methods of sensor fusion– more sensor network applications

Sunday, 13 June 2010
43
Conclusions
Sunday, 13 June 2010
44
Conclusions
• Distributed measurement systems are posing interesting new challenges in uncertainty analysis and data fusion
• Techniques that have been applied to single measurements can be extended to networks of sensors
• Simulation is a powerful tool for network design and prediction of network behaviour