Metrology for Precision Motion / Positoning Systems at PI Part
18
Measuring Environment / Measuring Equipment Portfolio / Data Evaluation Metrology for Precision Motion / Positoning Systems at PI - Part
Transcript of Metrology for Precision Motion / Positoning Systems at PI Part

Measuring Environment / Measuring Equipment Portfolio / Data Evaluation
Metrology for Precision Motion / Positoning Systems at PI - Part L

WHITEPAPER – This is how PI Does Measuring - Part I -- Claus Mansmann --
Page 2 of 6
For PI, each individual measurement and qualification of a positioning and motion system is an instrument for quality assurance. This makes sure that only those products leave the premises that are within the guaranteed specifications. High-precision measuring is necessary for qualifying as well as for final inspection and approval checks of all motion and positioning systems. Both the selection of the measuring environment and setup of the measuring equipment are adapted to the requirements of the respective product line.
The desired resolution, measuring accuracy, tolerances, and sampling rate are the criteria for selection. In addition, the stability of the measuring setup over time plays a decisive role and makes special demands on avoiding drift effects, e.g., by using adequate temperature and vibration isolation.
1 Measuring Environment
1.1 Measuring Laboratories
Precision measuring is done on honeycomb tables that are isolated passively from vibration. The foundation of every measuring room is in turn, isolated from the rest of the building and therefore suppresses seismic influences. All measuring laboratories are air-conditioned.
15 special measuring laboratories with an overall surface of 750 m2 are available at PI's headquarters in Karlsruhe. Five measuring laboratories with upstream areas for preliminary temperature regulation have special seismic, electro-magnetic, and thermal isolation, which ensures temperature stability better than 0.25 Kelvin over a period of 24 hours. This makes accurate measuring possible down to the picometer range. Long-term measuring of the positional stability is only possible under such conditions.
Fig. 1 View into a nanometrology laboratory with six-fold isolation.
Measuring is done fully automatically under controlled ambient conditions.
Number of laboratories for measuring
Air conditioned and simple seismic base isolation
Multiple seismic, acoustic, and thermal base isolation
VC classification*
VC-D, VC-E, VC-F, VC-G
VC-G, VC-H, VC-I
5 276 m2 82 m2
10 481 m2 -
Fig. 2 Laboratories available for measuring. *The VC classification is different for each room. Simple seismic-decoupled rooms achieve classes VC-D to VC-G. That corresponds to maximum vibration of <6.25 µm/s in a frequency range of 1 to 100 Hz. Multiple seismic-decoupled rooms achieve classes VC-F to VC-I. That corresponds to a maximum vibration of <0.78 µm/s in a frequency range of 1 to 100 Hz.
Fig. 3 Temperature stability of a measuring room over several days
1.2 Measuring Technology in the Production Environment
In (large) series production, a large part of the measuring takes place directly in the production environment. This allows deviations in the process to be detected quickly, which helps to prevent rejects or costs for reworking.
For this purpose, PI develops fully and semiautomatic measuring and test stations that are validated for their suitability with the help of a measuring system analysis before they are used in production ("Gage Repeatability & Reproducibility").
Email [email protected], www.pi.ws ϭ Physik Instrumente (PI)

WHITEPAPER – This is how PI Does Measuring - Part I -- Claus Mansmann --
Page 3 of 6
Fig. 4 View of semiautomatic test stations for large series production
1.3 Overview of Measuring Capabilities under Specifically Designed Environmental Conditions
In extensively equipped application laboratories, a large number of measurements can be made under specific ambient conditions.
Vacuum chambers with a base pressure to 10-11 hPa allow function tests and residual gas analysis. Depending on the application, not only the pressure area is decisive, but also the permissible residual materials inside the vacuum chamber such as for example, in the crystallography or the optical coating.
Cryogenic chambers for measuring to 77 °K (condensation point of nitrogen) allow startup and function checking at extremely low temperatures.
Even long-term examinations and lifetime testing are possible under these special conditions.
Special environmental conditions
Measuring equipment
Temperature range
Humidity range
Test chamber volume
Climate chamber
-72 °C to +180 °C
10 ... 95 % rel.
190 / 275 l
Cryogenic chamber
77 °K to 300 °K
- 21.2 l
Vacuum chamber
20 °C to approx. 70 °C
- 98 / 106 l
Glovebox - approx. 5 ppm
748 l
1.4 Special Equipment
Lifting and tilting equipment with a load capacity of 5000 kg allows qualifying of positioning systems at any angle with application-specific alignment and load.
Qualification of a two-ton hexapod assumes that masses up to five tons can be safely attached for measuring. In the heavy-load hall, three gantry cranes span the working area, and lift and transport the components of the positioning systems.
Fig. 5 At PI in Karlsruhe, lifting and tilting equipment specifically for
measuring or qualifying products according to application is available. In this picture, a hexapod with load is measured interferometrically
2 Measuring equipment
All measuring equipment is subject to recalibration and therefore, it is possible to perform suitable measuring with minimal uncertainty. This means that the resulting measurement and the actual value correspond to each other at all times, and can be reproduced with respect to national and international standards. Interferometric measuring systems are frequently used that are particularly distinguished by high resolution, short measuring times, and noncontact, wear-free measuring.
Not all locations have measuring equipment for every resolution.
Email [email protected], www.pi.ws ϭ Physik Instrumente (PI)

WHITEPAPER – This is how PI Does Measuring - Part I -- Claus Mansmann --
Page 4 of 6
2.1 Measuring Equipment According to Measurand
Length / Path
Measuring equipment Measuring principle Resolution/DPMI Measuring range
Tactile measuring sensor Inductive (incremental) to 5 nm to 50 mm
Laser interferometer Optical (incremental) to 0.151 nm to 10 m
Vibrometer Optical (Doppler effect) 2 nm 40 mm
Multi-sensor measuring machine Optical and tactile 0.1 µm 300 mm × 300 mm × 160 mm
CNC coordinate measuring machine
Incremental sensor with glass scale
0.1 µm 900 mm × 1800 mm × 800 mm
PISeca Capacitive sensor 0.001 % of the travel range to 100 µm
Angle
Measuring equipment Measuring principle Resolution/DPMI Measuring range
Laser interferometer Optical (incremental) to 34 nrad ± 0.11°
Autocollimator (AKF) Optical (autocollimation) to 0.05 arcsec ± 0.29° (up to ± 2.3°)
Angle measuring device / rotary encoder
Incremental to 0.4 arcsec 360°
Velocity
Measuring equipment Measuring principle Velocity resolution Vmax
Laser interferometer Optical (incremental) to 10 nm/s up to 4 mm/s
Vibrometer Optical (Doppler effect) to 0.005 µm/s up to 10 mm/s
Surface finish / surface flatness
Measuring equipment Measuring principle Resolution/DPMI Measuring range
White light interferometer Optical (incremental) λ/25 80 mm × 80 mm
White light interferometer Optical (scanning white light interferometry)
to 1 nm for smooth surfaces
Z=70 mm X=38 mm Y =28 mm
Laser scanning microscope Optical X=100 mm; Y=100 mm; 1× - 8× objective
Eccentricity / wobble
Measuring equipment Measuring principle Resolution/DPMI Measuring range
Static spindle analyzer Capacitive 80 µV/µm Low ±125 µm High ±6.5 µm
Email [email protected], www.pi.ws ϭ Physik Instrumente (PI)

WHITEPAPER – This is how PI Does Measuring - Part I -- Claus Mansmann --
Page 5 of 6
3 Evaluation of the Measured Data
The DIN ISO 230-2 and VDI/DGQ 3441 standards are the basis for qualification of PI products and evaluation of the measurands.
The qualification data is always verifiable for each individual product. The measured data is compiled in a database and used for process control. Traceability at product level is particularly interesting for large production runs.
The measurement log is provided with many systems such as hexapods or piezo systems. It is therefore possible for the customer to verify the measured performance of the system before it was dispatched and also to see which system components belong together.
Fig. 6 Typical measurands in a measuring log showing the linearity and
impulse response of a piezo system
3.1 Acquiring Measuring Data and Statistical Process Control
The measuring data is transmitted in real time automatically, saved to a database, and then visualized on a web-based user interface. Access to the control charts and the analysis tool is done via a web browser. The technical experts have immediate access to all process data and if required, can intervene immediately.
Automatic saving of the measured data after measuring Real-time display of the measured values in the control
charts Multi-control charts for maximum process control Dynamic calculation of warning and intervention limits Download of raw data and customer log Calculation of process capability Cpk level Pareto chart for process analysis and optimization Correlation chart to check the dependence of two
measurands Various export functions
Fig. 7 Examples of visualizations from the database of measurement
results
3.2 Measuring Software
The software for controlling the fully or semiautomatic measuring and test stations is developed in-house by PI. All measuring equipment can be configured directly and read from the software, which means that there are no unnecessary sources of error for the measured values, storing in databases, and creating the log.
Software development makes use of current development standards such as version control systems, bug tracking, automatic build systems, static code analysis, unit tests, and code reviews. This ensures that the software is always traceable and the quality standards are adhered to.
Fig. 8 Standardized process control with full documentation of the
individual measuring logs
Email [email protected], www.pi.ws ϭ Physik Instrumente (PI)

Metrology for Precision Motion / Positoning Systems at PI - Part LI Positioning Accuracy, Repeatability, and similar Measurements: Measurement Procedure and Data Preparation at PI

WHITEPAPER – This is How PI Does Measuring – Part II -- Dr. Axel Grabowski, Peter Diez, Birgit Schulze --
Page 2 of 13
1 Qualification of Positioning Equipment
Measurements are carried out on prototypes, individual products and series-production products to qualify the positioning axes produced by PI (Physik Instrumente). In the case of series-production products, valid specifications are derived based on these measured values and then published in the datasheets. These specifications describe the fundamental positioning characteristics for a product type, such as e.g. positioning accuracy, angular error in multiple axes, and unidirectional and bidirectional repeatability.
It is important particularly in the design of customer-specific solutions that there is a common understanding of what the specifications are because it is only in this way that the design can be clearly defined.
This document describes
which measurements are carried out and which measurement methods are used,
which standards are considered to this process, how the data acquired from the measurements is
prepared, how measurement results are derived from the data and
what terminology is used to describe them. In addition, this document provides a brief overview of the measurement protocol and the measurement results that are reported and how both are structured.
2 Applicable Standards and Special Features of Precision Positioning
The measurement rules described here are mainly based on the ISO 230 series of international standards, whereby the standards ISO 230-1 (2012-03) and ISO 230-2 (2014-05) are primarily relevant, as well as the American standard ASME B5.54 (2005). This standard is to a large extent identical to the
ISO 230 series of standards with respect to the measurements described in this document.
A major disadvantage of the stated standards for the qualification of micropositioning and nanopositioning systems is the fact that they were actually designed for larger turning lathes, milling machines, and similar products. Therefore, the explanations and detailed descriptions for the methods described in these standards are not always applicable for the qualification of products that are produced for high-precision micropositioning and nanopositioning. If it was not possible to transfer the ideas from these standards directly to the qualification of PI products, the measurement rules described in these standards were modified.
This means that the measurement rules used at PI are not a direct copy of the stated standards but rather they include specific adaptations and, in particular, enhancements of them with the aim of being able to test micropositioning and nanopositioning axes in the best way possible.
PI actively takes part in the current ASME B5.64 standardization committee which works on the development of a measuring standard for micro and nanopositioning systems.
3 Basic Measurement Procedure and the Measuring Equipment Used
3.1 General Measurement Procedure
The positioning axes produced by PI are designed and specified for a defined travel range.
Email [email protected], www.pi.ws ϭ Physik Instrumente (PI)

WHITEPAPER – This is How PI Does Measuring – Part II -- Dr. Axel Grabowski, Peter Diez, Birgit Schulze --
Page 3 of 13
Definitions: The travel range is the range within which the controller can move the system to different positions. The measuring range lies within this travel range or corresponds to the maximum travel range. The end points on each measuring range are always approached unidirectionally. All other measurement points can be approached bidirectionally. The classification "unidirectional" indicates a measurement series in which the movement to a target position is always carried out in the same direction, while "bidirectional" indicates that the movement to a target position is from both directions (forwards and backwards).
In order to determine a measurand, positions within the travel range are approached bidirectionally and a measurement is taken at the position. This is not possible at the end points of the travel range because these points represent the end of the numerically controllable range and these positions can only be reached coming from one direction. The so-called bidirectional measuring range excludes the end points and is thereby always a bit shorter than the entire measuring range.
The data measured unidirectionally at the end points of the measuring range are only used for determining selected measurands. For example, this data is used to determine the stroke, which ensures that the positioning axes can also be traversed along the specified path.
The positions within the measuring range at which measurement data are recorded are named target position Pi. As standard, target positions at the measurement points at the ends of the measuring range (two points) and another 18 points distributed equidistantly along the measuring range are measured, which makes 20 target positions in total.
The axes are traversed to these target positions to record the measurement data in a meandering pattern (see Figure 1) and the positioning data is recorded using suitable measuring equipment. The entire bidirectional cycle is completed five times as standard so that it is possible to record five sets of unidirectional measurements in both directions.
The entire measurement process only uses static measurements. This means that the axes are traversed to a target position, the moving platform is allowed to come to a
standstill and only then is the measurement data recorded using corresponding measuring equipment.
Illustrative representation of the cycle used to record the measurement data.
Using these measurements, the positioning error is calculated for every target position. These positioning error xij↑ or xij↓ thus correspond to the difference between the current position actually reached Pij and the target position Pi. The corresponding positioning error is calculated for every cycle j at the target position i as follows:
𝑥𝑥𝑖𝑖𝑖𝑖 = 𝑃𝑃𝑖𝑖𝑖𝑖 − 𝑃𝑃𝑖𝑖
The symbols ↑ and ↓ indicate the direction from which the target position was reached.
3.2 Measuring Equipment
The measurement data is usually recorded using interferometers to determine the linear deflection and autocollimators to determine the angular error.
Email [email protected], www.pi.ws ϭ Physik Instrumente (PI)

WHITEPAPER – This is How PI Does Measuring – Part II -- Dr. Axel Grabowski, Peter Diez, Birgit Schulze --
Page 4 of 13
A typical measurement setup, from left: an autocollimator to measure angular errors, a positioning axis on which two reflecting mirrors are mounted, and an interferometer setup to measure the displacement.
This type of setup is shown in Figure 2. An interferometer is used from one direction to determine the linear displacement of the axis being tested, while an autocollimator is used to determine the angular error from the opposite direction at the same time. The positioning axis is equipped with two reflector mirrors, which are used by the interferometer and autocollimator for their measurements. The measuring equipment used by PI is described in more detail in the Whitepaper “This is how PI Does Measuring - Part I”.
3.3 Correction of the Raw Data
3.3.1 Correction of the Abbe Error
An Abbe error occurs when an angular error has caused an error in the linear measurement (e.g. positioning accuracy).
Abbe errors for both angles α, β: red = measuring beam, lα and lβ describe the distance to the axes with respect to the interferometer's measuring point. A correction is made to arrive at a point located at the surface of the moveable platform.
This is illustrated in Figure 3: Due to the tilt of the moveable platform, there is an angular error when the beam from the interferometer hits the measurement mirror. The effect on the linear measurement value depends on the distance between the mirror and the platform. There is thus an error in the measurement value that can be corrected accordingly and eliminated from the data.
Depending on the setup of the measuring equipment relative to the moveable platform, there can be an Abbe error in one or two directions.
To calculate the correction, the linear measurement values are adjusted based on the angular data measured using the autocollimator. The distance between the moveable mirror and the surface of the moveable platform is determined and used for the calculation. This distance is also stated in the measurement protocol. Therefore, the measurement protocol shows whether or not a tilt correction of the measurement data has been carried out.
The angular and linear measurements are carried out separately from one another at PI. This means that the linear and angular errors can be distinguished from one another and are reported separately.
If an Abbe error has been corrected during the test procedure, the surface of the moveable platform is used as the reference surface. The correction is calculated based on this surface.
Email [email protected], www.pi.ws ϭ Physik Instrumente (PI)

WHITEPAPER – This is How PI Does Measuring – Part II -- Dr. Axel Grabowski, Peter Diez, Birgit Schulze --
Page 5 of 13
Using this information, the resulting positioning error for points at any distance to the platform can also be calculated.
3.3.2 Correction of Thermal Drift
It is not always possible to fully compensate for the influence of thermal fluctuations by monitoring and managing the ambient conditions. This is especially the case for positioning axes with resolutions and accuracies down to the subnanometer range. Even the smallest change in temperature during the measurement procedure can cause changes in position due to thermal expansion of the measurement setup or measuring equipment. Also mechanical tension in the measurement setup and the resulting relaxation processes lead to such changes in position. If the highest level of accuracy is required, these effects can have a massive influence on the measurement results. Therefore, it may be necessary to correct for these thermal effects.
The measurement data is corrected based on the following assumptions:
The positioning axis that is being tested does not itself change over time, except for the mechanical changes resulting from changes in temperature.
If the temperature were stable, the first measurement point would always be measured at an identical position.
Thermal drift is not position-dependent but rather time-dependent.
To make the correction, a straight line is calculated through the first measurement points of repeated sets of measurements taken one after another. This straight line (temporal) can then be subtracted from the measurement data for one set of measurements. This makes it possible to compensate for thermal drift.
The protocol indicates whether or not a correction has been carried out for thermal drift.
3.3.3 Linear Correction of Raw Data
If only the deviation from an ideal straight line is of interest for an evaluation, the raw data have to be initially corrected linearly. This means that a regression line is subtracted from the positioning error xij with respect to the commanded target position Pi. This is calculated according to the method of least squares.
The measurement protocol indicates whether or not a linear correction has been carried out.
4 Data Analysis
The calculation rules and the corresponding calculation formulae used to evaluate the measurement data are presented here.
4.1 Basic Data for the Positioning Error
Firstly, the unidirectional positioning error is determined at every measured target position for both directions 𝑥𝑥𝑖𝑖 ↑ and 𝑥𝑥𝑖𝑖 ↓. This data is then used to calculate the mean positioning errors �̅�𝑥𝑖𝑖 ↑ and �̅�𝑥𝑖𝑖 ↓ for both directions at every individual position:
�̅�𝑥𝑖𝑖 ↑=1𝑛𝑛�𝑥𝑥𝑖𝑖𝑖𝑖 ↑
𝑛𝑛
𝑖𝑖=1
and
�̅�𝑥𝑖𝑖 ↓=1𝑛𝑛�𝑥𝑥𝑖𝑖𝑖𝑖 ↓
𝑛𝑛
𝑖𝑖=1
Using the mean positioning error at the points �̅�𝑥𝑖𝑖 ↑ and �̅�𝑥𝑖𝑖 ↓, which only measure the two individual directions (forwards and backwards), the mean value is determined. This is the mean bidirectional positioning error at every individual position �̅�𝑥𝑖𝑖:
�̅�𝑥𝑖𝑖 =�̅�𝑥𝑖𝑖 ↑ +�̅�𝑥𝑖𝑖 ↓
2
The calculated values can be used to plot a mean curve that shows the mean errors of the axis across the entire travel range (see Figure 4).
The mean values show the systematic deviation. Other variables for a positioning axis can be attributed to statistical deviations. For this reason, the standard deviations at the respective target positions Pi are determined separately for the forwards and backwards directions. This is carried out using the following formulae:
Email [email protected], www.pi.ws ϭ Physik Instrumente (PI)

WHITEPAPER – This is How PI Does Measuring – Part II -- Dr. Axel Grabowski, Peter Diez, Birgit Schulze --
Page 6 of 13
𝑠𝑠𝑖𝑖 ↑= �1
𝑛𝑛 − 1��𝑥𝑥𝑖𝑖𝑖𝑖 ↑ −�̅�𝑥𝑖𝑖 ↑�2
𝑛𝑛
𝑖𝑖=1
and
𝑠𝑠𝑖𝑖 ↓= �1
𝑛𝑛 − 1��𝑥𝑥𝑖𝑖𝑖𝑖 ↓ −�̅�𝑥𝑖𝑖 ↓�2
𝑛𝑛
𝑖𝑖=1
These five datasets together provide a good overview of the size of the statistical deviations and how the positioning axis behaves over the measuring range. Figure 4 shows an example overview of the complete data. Other variables can be calculated on this basis.
The positioning error for an axis for both the forwards and backwards directions
4.2 The Mean Bidirectional Positioning Error M
The mean bidirectional positioning error M is the difference between the maximum and minimum values for the mean bidirectional positioning errors at the points �̅�𝑥𝑖𝑖
𝑀𝑀 = 𝑚𝑚𝑚𝑚𝑥𝑥( �̅�𝑥𝑖𝑖) −𝑚𝑚𝑚𝑚𝑛𝑛 ( �̅�𝑥𝑖𝑖)
The mean bidirectional positioning error M is the maximum deviation (peak-peak) of the mean curve as described above, meaning the mean positioning error of the axis.
This is shown in red in Figure 5.
The mean bidirectional positioning error M
If a correction line (see 3.3.3) has been subtracted from the raw data when calculating M, this value is designated as ML .
4.3 The Backlash B
To determine the size of the error between the positioning processes in the forwards and backwards directions, the maximum positioning backlash B is calculated. It represents the maximum deviation between the forwards and backwards directions.
𝐵𝐵 = 𝑚𝑚𝑚𝑚𝑥𝑥 [|�̅�𝑥𝑖𝑖 ↑ −�̅�𝑥𝑖𝑖 ↓|] This is shown in red in Figure 6.
Email [email protected], www.pi.ws ϭ Physik Instrumente (PI)
WHITEPAPER – This is How PI Does Measuring – Part II -- Dr. Axel Grabowski, Peter Diez, Birgit Schulze --
Page 7 of 13
The maximum positioning backlash B
A mean backlash can also be determined on this basis. This indicates the size of the mean deviation between the forwards and backwards directions. To determine the mean positioning backlash 𝐵𝐵� , the sum of the mean values for the backlash at all individual positions is determined as follows:
𝐵𝐵� = �1𝑚𝑚�(�̅�𝑥𝑖𝑖 ↑ −�̅�𝑥𝑖𝑖 ↓)
𝑚𝑚
𝑖𝑖=1
�
The backlash B indicates how the positioning axis behaves if the direction is reversed.
4.4 Unidirectional and Bidirectional Repeatability R
Another important characteristic of a positioning device is repeatability.
To calculate the repeatability, the bidirectional positioning repeatability 𝑅𝑅𝑖𝑖 is first calculated for one position. It is calculated as follows:
𝑅𝑅𝑖𝑖 = max[𝑠𝑠𝑖𝑖 ↑ +𝑠𝑠𝑖𝑖 ↓ +|𝐵𝐵𝑖𝑖|; 2𝑠𝑠𝑖𝑖 ↑; 2𝑠𝑠𝑖𝑖 ↓] with 𝐵𝐵𝑖𝑖 = �̅�𝑥𝑖𝑖 ↑ −�̅�𝑥𝑖𝑖 ↓
The bidirectional repeatability indicates how "well" each individual target position will always be "hit" from different directions.
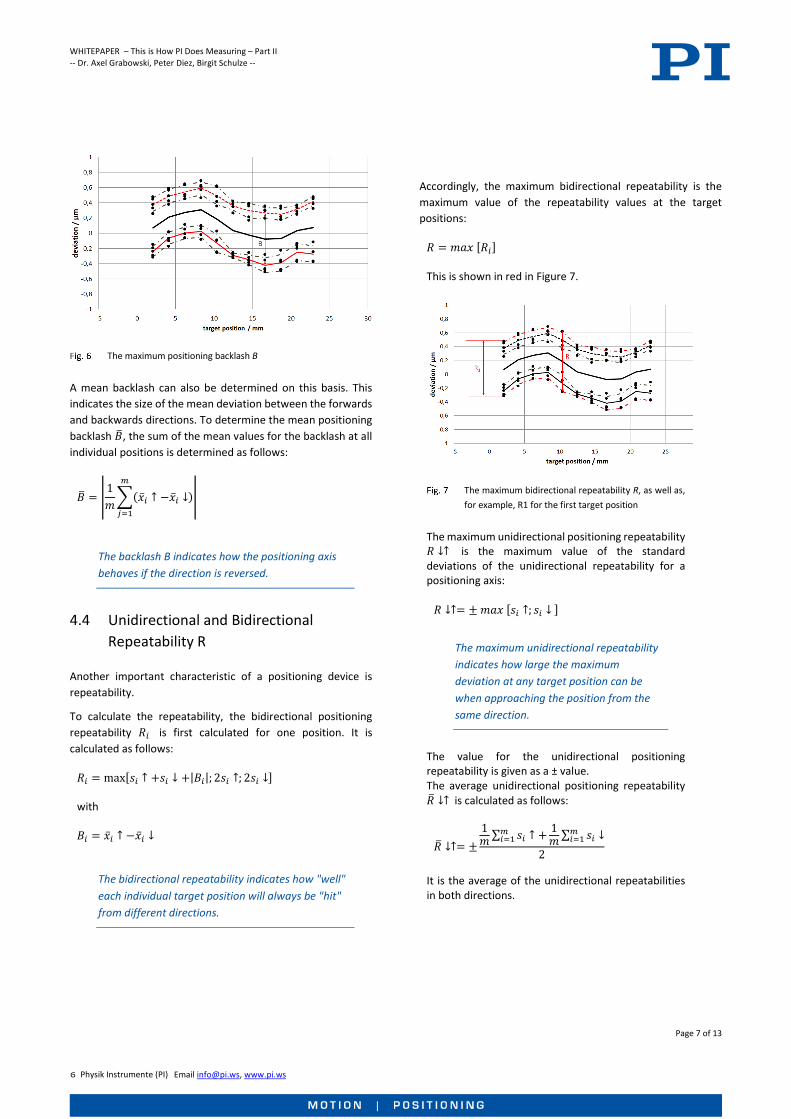
Accordingly, the maximum bidirectional repeatability is the maximum value of the repeatability values at the target positions:
𝑅𝑅 = 𝑚𝑚𝑚𝑚𝑥𝑥 [𝑅𝑅𝑖𝑖] This is shown in red in Figure 7.
The maximum bidirectional repeatability R, as well as, for example, R1 for the first target position
The maximum unidirectional positioning repeatability 𝑅𝑅 ↓↑ is the maximum value of the standard deviations of the unidirectional repeatability for a positioning axis: 𝑅𝑅 ↓↑= ± 𝑚𝑚𝑚𝑚𝑥𝑥 [𝑠𝑠𝑖𝑖 ↑; 𝑠𝑠𝑖𝑖 ↓ ]
The maximum unidirectional repeatability indicates how large the maximum deviation at any target position can be when approaching the position from the same direction.
The value for the unidirectional positioning repeatability is given as a ± value. The average unidirectional positioning repeatability 𝑅𝑅� ↓↑ is calculated as follows:
𝑅𝑅� ↓↑= ±1𝑚𝑚∑ 𝑠𝑠𝑖𝑖𝑚𝑚
𝑖𝑖=1 ↑ + 1𝑚𝑚∑ 𝑠𝑠𝑖𝑖 ↓𝑚𝑚
𝑖𝑖=1
2
It is the average of the unidirectional repeatabilities in both directions.
Email [email protected], www.pi.ws ϭ Physik Instrumente (PI)

WHITEPAPER – This is How PI Does Measuring – Part II -- Dr. Axel Grabowski, Peter Diez, Birgit Schulze --
Page 8 of 13
4.5 The Bidirectional Positioning Accuracy A
The bidirectional positioning accuracy A is a measurand that combines all of the errors that arise and thus represents the maximum error that can
occur during positioning.
The bidirectional positioning accuracy is the range that is calculated by combining the bidirectional systematic deviations with the statistical deviations:
𝐴𝐴 = 𝑚𝑚𝑚𝑚𝑥𝑥 [�̅�𝑥𝑖𝑖 ↑ +𝑠𝑠𝑖𝑖 ↑; �̅�𝑥𝑖𝑖 ↓ + 𝑠𝑠𝑖𝑖 ↓] −𝑚𝑚𝑚𝑚𝑛𝑛 [�̅�𝑥𝑖𝑖 ↑ − 𝑠𝑠𝑖𝑖 ↑; �̅�𝑥𝑖𝑖 ↓ − 𝑠𝑠𝑖𝑖 ↓]
This is shown in red in Figure 8.
The bidirectional positioning accuracy A
To ensure the consistency of the bidirectional repeatability, the calculation for the bidirectional positioning accuracy uses only one standard deviation and not two standard deviations.
4.6 The Stroke S
The testing of a positioning axis shall prove that the entire travel range can be used, which means that the axis being tested can reach every numerically controlled target position if the travel range was also selected as the measuring range. For this purpose, the mean values for the positions at the end points of the measuring range are determined. The difference between these values is the stroke S of the positioning axis.
4.7 The Linearity L
The linearity describes the maximum deviation from the measured values for an ideal straight line.
To calculate the linearity, the measured values at the target positions P0 to Pm+1 are used. A straight line is taken that passes through the end points of the measuring range and is subtracted from the calculated deviations. These calculated errors are then designated xlij.
Accordingly, the positioning linearity L is calculated as follows:
𝐿𝐿 = 𝑚𝑚𝑚𝑚𝑥𝑥 ��1𝑛𝑛�𝑥𝑥𝑥𝑥𝑖𝑖𝑖𝑖 ↑
𝑛𝑛
𝑖𝑖=1
��
This is shown in red in Figure 9.
Determination of the positioning linearity L
This can be used to calculate the percentage linearity Lp (in percent) where Lm denotes the measuring range:
𝐿𝐿𝑝𝑝 = 100 ∙𝐿𝐿𝐿𝐿𝑚𝑚
Email [email protected], www.pi.ws ϭ Physik Instrumente (PI)

WHITEPAPER – This is How PI Does Measuring – Part II -- Dr. Axel Grabowski, Peter Diez, Birgit Schulze --
Page 9 of 13
4.8 The Hysteresis H
The hysteresis H of an axis is the maximum difference of forwards and backwards values at all target positions:
𝐻𝐻 = 𝑚𝑚𝑚𝑚𝑥𝑥 ��1𝑛𝑛�𝑥𝑥𝑥𝑥𝑖𝑖𝑖𝑖 ↑
𝑛𝑛
𝑖𝑖=1
−1𝑛𝑛�𝑥𝑥𝑥𝑥𝑖𝑖𝑖𝑖 ↓
𝑛𝑛
𝑖𝑖=1
��
The calculation of H is carried out in the same way as the calculation of the backlash B.
Accordingly, the percentage hysteresis Hp (in percent) is calculated as follows
𝐻𝐻𝑝𝑝 = 100 ∙𝐻𝐻𝐿𝐿𝑚𝑚
5 Annex 1: The Coordinate Systems Used and Designations of the Axes of Motion
In general, PI uses a right-handed coordinate system to designate the axes of motion. The linear axes are thus labeled with X, Y, and Z and the rotational axes with A, B, and C. The rotational axes are assigned according to the linear axes, e.g. A is the rotational axis around the linear axis X.
In places where further clarification is necessary, the rotational axes are also labeled with an explicit reference to the linear axes, e.g. A (rot X). To illustrate how the axes are designated, the coordinate system is once again shown in Figure 10.
Right-handed coordinate system
Email [email protected], www.pi.ws ϭ Physik Instrumente (PI)

WHITEPAPER – This is How PI Does Measuring – Part II -- Dr. Axel Grabowski, Peter Diez, Birgit Schulze --
Page 10 of 13
6 Annex 2: Mechanical Crosstalk of a Movement and Designation of the Error
In the case of mechanical positioning axes, it is usually not just the positioning error in the direction of motion that is relevant but also the mechanical crosstalk of a linear motion in the other linear and rotational directions. To determine this mechanical crosstalk, linear measurements orthogonal to the direction of motion and corresponding angle measurements are carried out. Here, a measurement is carried out according to the motion profile of the measurement procedure described in chapter 3.1. The same methods as for the positional data are used to analyze these data. However, the analysis does not subtract the actual position from the target position but uses the raw data.
Straightness and flatness are calculated from the mean bidirectional positioning error after a linear correction ML has been carried out.
It is still important to note here that the rotational error can transfer to a translational error at the functional point in certain circumstances, depending on where the zero point for the parasitic tilt lies.
The errors themselves have a clear nomenclature. The various measurable errors for linear motion are shown in Figure 11.
Nomenclature of errors in the various axes for a linear motion.
The nomenclature used at PI for these different errors is thus as follows:
E <Axis designation where the error has been measured><commanded axis>
X Axis of the commanded linear motion EAX Angular error around the X-axis (roll) EBX Angular error around the Y-axis (pitch) ECX Angular error around the Z-axis (yaw) EXX Positioning error of the X-axis EXXL Positioning error of the X-axis, minus regression line EYX Straightness error in the direction of the Y-axis
(straightness) EZX Straightness error in the direction of the Z-axis (flatness)
If two axes are moving (e.g. X and Y), it is still possible for a combined parasitic motion to occur in the Z-axis. This error is called the out-of-plane error.
Similar errors can also be found on rotational positioning axes. Accordingly, Figure 12 shows the various measurable errors for rotational motion.
Email [email protected], www.pi.ws ϭ Physik Instrumente (PI)

WHITEPAPER – This is How PI Does Measuring – Part II -- Dr. Axel Grabowski, Peter Diez, Birgit Schulze --
Page 11 of 13
Nomenclature of errors in the various axes for a rotary motion.
EXC Radial error in the direction of the X-axis EYC Radial error in the direction of the Y-axis EZC Axial error from C EAC Tilt error around the X-axis EBC Tilt error around the Y-axis ECC Angular positioning error of C
A combined rotatory error, i.e. a radial error motion, is described as follows:
EXYC Radial error of C
Accordingly, a combined tilt deviation is referred to as follows:
EABC Tilt error of C
7 Annex 3: Example Measurement Protocol
The data from the measurements and calculations can be accessed by outputting them to a measurement protocol. An example protocol is shown in Figure 13. The protocol is split into different sections:
1. General description, e.g. of the system components and parameters
2. Description of the measurement, e.g. axes, measuring range, measuring parameters, corrections
3. Measurement results, e.g. the linear deviations
4. Measurement results, e.g. the angular deviations
5. Graphical representation of the measurement results
The calculation rules for the measurement values given in 3. and 4. are described in chapter 4 and can thus be derived from the stated formulae. This applies for both linear deviations and angular deviations.
Email [email protected], www.pi.ws ϭ Physik Instrumente (PI)

WHITEPAPER – This is How PI Does Measuring – Part II -- Dr. Axel Grabowski, Peter Diez, Birgit Schulze --
Page 12 of 13
1.
2.
3.
4.
5.
Fig. 13 Example measurement protocol
Email [email protected], www.pi.ws ϭ Physik Instrumente (PI)

WHITEPAPER – This is How PI Does Measuring – Part II -- Dr. Axel Grabowski, Peter Diez, Birgit Schulze --
Page 13 of 13
8 Other Documents and Links
ISO 230-1
https://www.din.de/de/mitwirken/normenausschuesse/nwm/normen/wdc-beuth:din21:151552174
ISO 230-2
https://www.din.de/de/mitwirken/normenausschuesse/nwm/normen/wdc-beuth:din21:206720855
ASME B.5.54 - 2005
https://www.asme.org/codes-standards/find-codes-standards/b5-54-methods-performance-evaluation-computer-numerically-controlled-machining-centers
9 Authors
Dr. Axel Grabowski, Head of R&D Department Sensor Technologies at Physik Instrumente (PI) GmbH & Co. KG
Peter Diez, Senior Industrial Engineer in the Measurement and Production Technology Group at Physik Instrumente (PI) GmbH & Co. KG
Birgit Schulze, Product Marketing Manager for Parallel Kinematics at Physik Instrumente (PI) GmbH & Co. KG
PI in Brief
For many years, PI (Physik Instrumente), founded in 1970, has been a market and technology leader for high-precision positioning technology and piezo applications in the semiconductor industry, life sciences; photonics, and in industrial automation. In close cooperation with customers from all over the world and for 50 years now, PI's specialists (approx. 1,300) have been pushing, again and again, the boundaries of what is technically possible and developing customized solutions from scratch. Technologies from PI achieve reproducible accuracies in the millionth of a millimeter range. More than 350 granted and registered patents underline the company's claim to innovation.
PI develops, manufactures, and qualifies all core technologies in-house, thereby constantly setting new standards for precision positioning: Piezoceramic patch transducers and actuators, electromagnetic drives, and sensors working in the nanometer range. As the majority owner of ACS Motion Control, PI is also a leading global manufacturer of modular motion control systems for multi-axis drive systems and develops customized complete systems for industrial applications with the highest precision and dynamics.
With six manufacturing sites and 15 sales and service offices in Europe, North America, and Asia, PI is represented wherever high-tech solutions are developed and manufactured.
WP4
032E
Pos
ition
ing
Accu
racy
, Rep
eata
bilit
y, a
nd si
mila
r Mea
sure
men
ts 1
2/20
20 0
Sub
ject
to c
hang
es. ©
Phy
sik In
stru
men
te (P
I) G
mbH
& C
o. K
G 2
020
Email [email protected], www.pi.ws ϭ Physik Instrumente (PI)