METROBANK, S.A. AND SUBSIDIARIES...METROBANK, S.A. AND SUBSIDIARIES Panama City, Panama October...
12
Translation Equilibrium Calificadora de Riesgo, S.A. Rating Report Contact: Fernando Arroyo [email protected] Reynaldo Coto [email protected] (507) 214-3790 The designation .pa reflects risks comparable only in Panama METROBANK, S.A. AND SUBSIDIARIES Panama City, Panama October 15th, 2015 Rating Category Definition of Rating Entity A-.pa Reflects high capacity to pay principal and interest in the terms and conditions agreed upon. The ability to pay is more susceptible to possible adverse changes in the economic conditions than the higher categories. Outlook (changed) To Positive from Stable “This rating is not a suggestion or recommendation to invest, nor an endorsement or guarantee of the issuance or the solvency of the rated entity”. --------------------------Millions of US$------------------------- Jun.15 Dec.14 Jun.15 Dec.14 Assets: 1,119.7 1,073.1 Income*: 13.4 11.1 Liabilities: 1,009.3 964.8 ROAA*: 1.3% 1.1% Equity: 110.4 108.2 ROAE*: 12.9% 10.9% *Takes into account performance during the last 12 months. The information used for the present analysis included the audited financial statements as of December 31 st , 2012, 2013 and 2014, and interim financial statements as of June 30, 2014 and 2015, as well as additional information furnished by Metrobank, S.A. and Subsidiaries. The Financial Statements for 2014 were prepared in accordance with the International Financial Reporting Standards (IFRS). The rating is performed pursuant to what is established in Agreements 2-2010 and 6-2010, issued by the Superintendency of Banks of Panama (SBP). Rationale: Equilibrium's Rating Committee affirms the rating A-.pa to Metrobank, S.A. and Subsidiaries, after evaluating interim information as of June 30, 2015. The outlook is changed to Positive from Stable. The rating assigned is supported by Metrobank's increasing base of earning assets, which in turn means reaching a higher positioning of its franchise in the local banking market. In this sense, Equilibrium also values the consistency of its business strategy focused mainly in the Corporate Banking segment, at the same time that the Entity makes efforts to enhance other lines of business to produce recurring income, in addition to the operating income typical from the financial intermediation business, supported by the competitive advantages derived from its technological infrastructure. Likewise, the conservative liquidity ratios in case of possible financial stress situations stand out, as shown by the legal liquidity ratio and the historic coverage of funds available for immediate exigibility of deposits; all these accompanied by an investments portfolio with a reasonable convertibility degree, good renewal ratios of its liability funding sources and a depositors' base with low concentration taking into account its business focus. Equilibrium also considers the good credit quality of the loans granted throughout the years, that together with the moderate backing of tangible collateral, allows it to diminish the requirement to create specific reserves under the current regulatory criteria. Regardless, the Bank's rating is restricted by its spread comparatively lower than the industry average, in turn highly influenced by the strong competition of the local banking environment, mainly in the segments served by the Bank. In this same line, Equilibrium also ponders the sensitivity of results before adverse unforeseen changes in default ratios, especially taking into account the exposure to the cumulative balance corresponding to the Top 20 economic groups debtors. This is combined with its lesser degree of capital adequacy compared to its peers in the market, albeit it should be noted that the capitalization is fully supported by Tier 1 capital elements. The Entity also faces challenges to continue diversifying its loan portfolio by economic sector, as well increasing the use of alternate funding sources, which participation on liabilities is still below its peers. The Positive outlook captures the plan for the future capitalization of the Bank recently approved by the Board of Directors, estimated to be completed at the closing of 2015. This will allow support the growth goals in the medium term, under a context of gradual growth in the generation of income and the expectation that the Bank will show little variation in its performance ratios. The annual growth of Metrobank's consolidated assets has averaged 18.4% during the last 3 and a half years, that, albeit it shows a slight gradual deceleration, it has allowed the Bank to increase its market share in the National Banking System (NBS). The strategy continues to favor gross loans, which represent 69.2% of total balance and which dynamism during the first 6 months of 2015 fully explains the asset growth for said period. The Bank has given special emphasis to the allocation of loans abroad, mainly Central America and the Caribbean, thus the participation of local loans has decreased from 90.1% to 84.9% during the last 12 months. On the other hand, the distribution of loans continues to favor the local commercial sector (participation of 38.0% as of June 2015), albeit it shows a slight contraction in balances granted to this activity since 2014, because of the circumstances of some related segments (for example, Colon Free Zone); this has been compensated by allocations to the services, construction and industrial sectors. Rating History: Entity → BBB.pa (05.30. 08), ↑ BBB+.pa (10.19.09), ↑ A-.pa (10.31.14).
Transcript of METROBANK, S.A. AND SUBSIDIARIES...METROBANK, S.A. AND SUBSIDIARIES Panama City, Panama October...

Translation
Equilibrium Calificadora de Riesgo, S.A.
Rating Report
Contact:
Fernando Arroyo
Reynaldo Coto
(507) 214-3790
The designation .pa reflects risks comparable only in Panama
METROBANK, S.A. AND SUBSIDIARIES Panama City, Panama October 15th, 2015
Rating Category Definition of Rating
Entity A-.pa Reflects high capacity to pay principal and interest in the terms and conditions
agreed upon. The ability to pay is more susceptible to possible adverse
changes in the economic conditions than the higher categories.
Outlook (changed)
To Positive from Stable
“This rating is not a suggestion or recommendation to invest, nor an endorsement or guarantee of the issuance or the solvency of the rated entity”.
--------------------------Millions of US$-------------------------
Jun.15 Dec.14 Jun.15 Dec.14
Assets: 1,119.7 1,073.1 Income*: 13.4 11.1
Liabilities: 1,009.3 964.8 ROAA*: 1.3% 1.1% Equity: 110.4 108.2 ROAE*: 12.9% 10.9%
*Takes into account performance during the last 12 months.
The information used for the present analysis included the audited financial statements as of December 31st, 2012, 2013 and 2014, and interim
financial statements as of June 30, 2014 and 2015, as well as additional information furnished by Metrobank, S.A. and Subsidiaries. The Financial
Statements for 2014 were prepared in accordance with the International Financial Reporting Standards (IFRS). The rating is performed pursuant to what is established in Agreements 2-2010 and 6-2010, issued by the Superintendency of Banks of Panama (SBP).
Rationale: Equilibrium's Rating Committee affirms the
rating A-.pa to Metrobank, S.A. and Subsidiaries, after
evaluating interim information as of June 30, 2015. The
outlook is changed to Positive from Stable.
The rating assigned is supported by Metrobank's increasing
base of earning assets, which in turn means reaching a
higher positioning of its franchise in the local banking
market. In this sense, Equilibrium also values the
consistency of its business strategy focused mainly in the
Corporate Banking segment, at the same time that the
Entity makes efforts to enhance other lines of business to
produce recurring income, in addition to the operating
income typical from the financial intermediation business,
supported by the competitive advantages derived from its
technological infrastructure. Likewise, the conservative
liquidity ratios in case of possible financial stress situations
stand out, as shown by the legal liquidity ratio and the
historic coverage of funds available for immediate
exigibility of deposits; all these accompanied by an
investments portfolio with a reasonable convertibility
degree, good renewal ratios of its liability funding sources
and a depositors' base with low concentration taking into
account its business focus. Equilibrium also considers the
good credit quality of the loans granted throughout the
years, that together with the moderate backing of tangible
collateral, allows it to diminish the requirement to create
specific reserves under the current regulatory criteria.
Regardless, the Bank's rating is restricted by its spread
comparatively lower than the industry average, in turn
highly influenced by the strong competition of the local
banking environment, mainly in the segments served by
the Bank. In this same line, Equilibrium also ponders the
sensitivity of results before adverse unforeseen changes in
default ratios, especially taking into account the exposure
to the cumulative balance corresponding to the Top 20
economic groups debtors. This is combined with its lesser
degree of capital adequacy compared to its peers in the
market, albeit it should be noted that the capitalization is
fully supported by Tier 1 capital elements. The Entity also
faces challenges to continue diversifying its loan portfolio
by economic sector, as well increasing the use of alternate
funding sources, which participation on liabilities is still
below its peers.
The Positive outlook captures the plan for the future
capitalization of the Bank recently approved by the Board
of Directors, estimated to be completed at the closing of
2015. This will allow support the growth goals in the
medium term, under a context of gradual growth in the
generation of income and the expectation that the Bank
will show little variation in its performance ratios.
The annual growth of Metrobank's consolidated assets has
averaged 18.4% during the last 3 and a half years, that,
albeit it shows a slight gradual deceleration, it has allowed
the Bank to increase its market share in the National
Banking System (NBS).
The strategy continues to favor gross loans, which
represent 69.2% of total balance and which dynamism
during the first 6 months of 2015 fully explains the asset
growth for said period. The Bank has given special
emphasis to the allocation of loans abroad, mainly Central
America and the Caribbean, thus the participation of local
loans has decreased from 90.1% to 84.9% during the last
12 months. On the other hand, the distribution of loans
continues to favor the local commercial sector
(participation of 38.0% as of June 2015), albeit it shows a
slight contraction in balances granted to this activity since
2014, because of the circumstances of some related
segments (for example, Colon Free Zone); this has been
compensated by allocations to the services, construction
and industrial sectors.
Rating History: Entity → BBB.pa (05.30. 08), ↑ BBB+.pa
(10.19.09), ↑ A-.pa (10.31.14).

2
As of June 30, 2015, the balances granted to the Top 20
economic groups debtors (net of pledged deposits)
represent 24.2% of gross loans, an amount close to the
average shown by banks in its risk category. The exposure
level on this debtors group has remained at 1.9 times the
Tier 1 capital for the last 4 semesters, which level is
considered moderate taking into account the profile of
customers serviced by the Entity.
Regarding the credit quality of loans, non-performing
balances represent 0.6% of the portfolio as of the closing
of June 2015, a level that is below the NBS average
(0.9%). At the same time, the addition of loans classified in
B, C, D and E categories represent 0.9% of total loans, also
better than the system's average (3.4%). The above,
together with the value of tangible collateral that represents
approximately 101% of the total consolidated loan
portfolio, allows reducing possible expenses for specific
reserves. Indeed, the specific reserve for US$5.7 million
registered in the asset side is the result of the calculations
based in the IFRS methodology that takes into account the
concept of loss incurred on the portfolio.
As of June 30, 2015, total deposits received amount to
US$944.9 million after showing a 15.1% annual growth.
The composition of deposits by modality show a slight
increase in the participation of time deposits, as this
liability source has explained the greater part of the asset
growth throughout the last five-year period. The depositors'
base has been historically expanding and stable, also
showing an average annual renewal rate of time deposits
around 85% for the last 6 months, while the volatility rate
of demand and savings deposits is about 3.5%. Added to
this, the concentration of the Top 20 depositors over total
deposits is equivalent to 20.1% as of the closing of June
2015, a level that indicates a low exposure on the main
customers, taking into account their business focus.
Regarding other liability funding sources, the joint balance
of received financings and repos is equivalent to US$39.7
million, which means 4.0% of financial liabilities. This
level is lower when compared to the average of other
financial institutions rated in similar risk category, albeit it
should also be noted that Metrobank maintains available
lines for US$32.6 million.
The aggregate of cash, due from banks and financial
investments represent 139.9% of demand and savings
deposits as of the closing of June 2015, a percentage above
the NBS average (95.7%), an outstanding fact since this
coverage level has maintained relative consistency
throughout the years. Should the investments that guarantee
the repos in the liability side for an amount of US$39.7
million were excluded from the ratio, then the ratio would
change to 122.1%. On the other hand, the legal liquidity
ratio has averaged 64.5% during the first semester of 2015,
comparing favorably to the average of the local banking
industry.
Regarding liquidity matching under contractual scenarios,
the analysis takes into account demand and savings
deposits in the shortest term (0-30 days) bucket, while
investments are registered according to their maturity date
in the terms originally agreed upon, as well as the rest of
the items. In this way, 41.6% of the Bank's total assets have
maturity dates under 12 months, while 73.2% of liabilities
mature in the same interval, creating liquidity gaps. In the
very low probability of occurrence of financial stress
scenarios, the Bank would have the option to liquidate a
significant portion of its investments portfolio or use
available borrowing lines.
The book value of investments amounts to US$231.3
million as of the closing of June 2015 and is totally
comprised of securities available for sale of which 68.4%
are securities with local and international investment grade.
Historically, Management has favored the acquisition of
fixed rent securities issued in Panama and, to a lesser
degree, the United States. On the other hand, Sovereign
Debt of the Republic of Panama amount to 30.0% of
securities, thus it is the main issuer of the portfolio.
Regarding the market risk of the portfolio, unrealized gains
amount to US$278.4 thousand, that is distributed in a few
issuers which individual unrealized losses are not greater
than 1.6%, while securities issued in Brazil or other
economies from South America are not recorded.
As for the figures from the Statement of Income for the six
months ended as of June 30, 2015, the Bank accumulated a
net income of US$7.1 million, a 48.2% interannual
variation, thus the profitability ratios showed slight
increases, consistent with its business model.
Among the main aspects to highlight from the semester
performance and its interannual comparison, the financial
spread remained almost similar, given that the slight
increase in the funding cost was offset through a slight
adjustment to increase the average yield on gross loans.
This allowed the spread to remain at 2.1%, albeit it is below
the system average, given the nature of the corporate
customers serviced by the Bank.
It should be noted that the Bank is experiencing gradual
increases in net fees, where it has accumulated US$3.0
million during the first semester of 2015, acknowledging a
26.8% interannual increase, driven, in turn, -to a great
extent- by income from merchant acquisition and points of
sale services. The Entity also earns other income from the
Financiera Govimar operation and for advisory services and
referred customers, for a total amount of US$1.6 million.
General and administrative expenses represent 38.1% of
total interest on earning assets, a proportion that has
showed little variation during the last years. Said operating
expenses also showed a 16.2% annual increase in the
comparison between fiscal periods, slightly less than the
17.7% reflected by the gross financial income.
On the other hand, the Bank recognized gains on sale of
securities equivalent to US$1.4 million during the semester,
since it took advantage of opportunities in the securities
market, increasing, in turn, the extraordinary component in
net profit from 3.9% to 20.5% in the interannual
comparison.
Retained earnings have supported the net equity increase
during the last 18 months. Even if this contribution is
marginal regarding asset growth, it has provided for the
slow increase of the dynamic reserve, for up to US$11.9
million. On the other hand, the Capital Adequacy Ratio
(CAR) is equivalent to 12.8% as of June 30, 2015, a figure
below the NBS (14.9%) average and other banks in its risk
category, albeit it also stands out that the Bank's capital
funds fully compute as Tier 1 capital.

3
Strengths
1. Good quality of loans during the last years, reflected in the low balance of past-due and non-performing loans, prudential
coverages on expected loan losses, good tangible collateral backing, as well as low proportion of write-offs.
2. Prudential position regarding liquidity and moderate concentrations of depositors.
3. Growth of productive assets generates greater scale and allows the increasing generation of recurring income.
Weaknesses
1. Tight spread which limits the ability to absorb possible unexpected losses, as well as internal contribution to equity
growth.
2. The capital adequacy level tends to decrease as a result of strong growth.
3. Relative concentration in deposits as liability funding source.
Opportunities
1. Technological and service infrastructure that would allow cross-selling.
2. Synergies between the Bank and its subsidiaries’ operations.
3. Gradual increase of geographic loan portfolio diversification.
Threats
1. Strong competition in local market exerts pressure on spreads and demands permanent renewal of comparative advantages
that will allow the reduction of interest rate risks.
2. Local and international credit and price variation risks.
3. At the Panamanian banking sector level, possible impacts due to the inclusion of Panama in the Financial Action Task
Force on Money Laundering (FATF) Gray List.
4
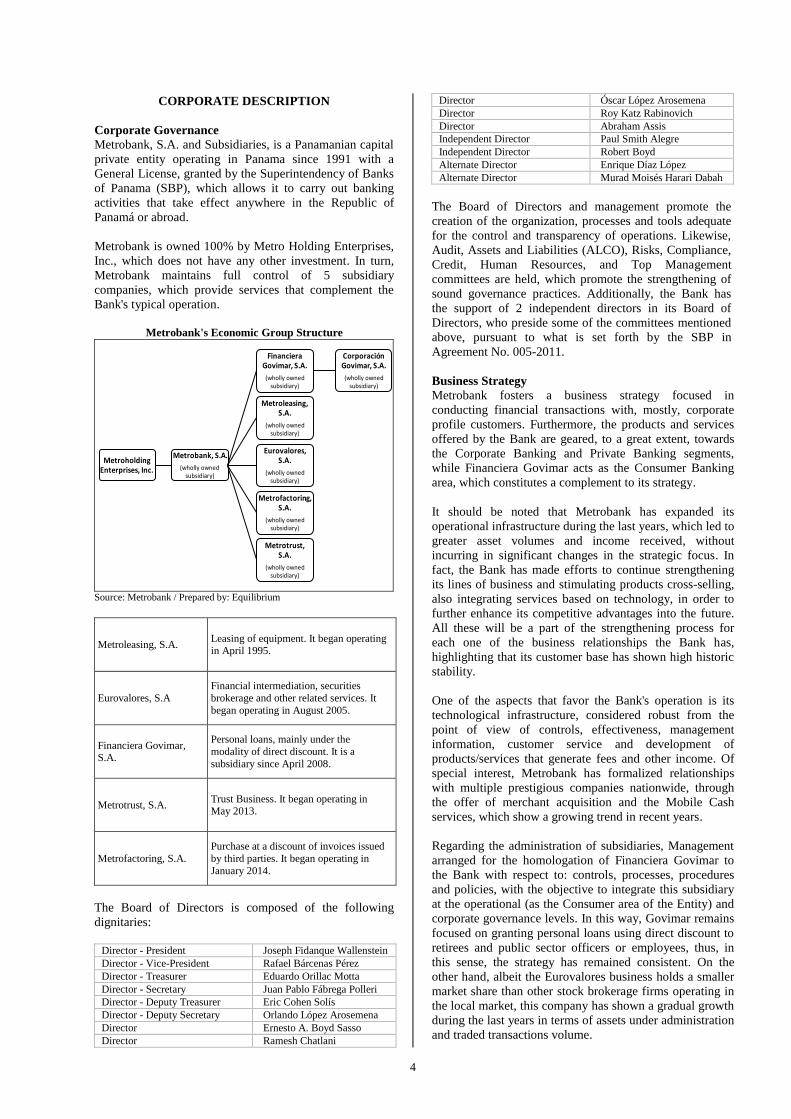
CORPORATE DESCRIPTION
Corporate Governance
Metrobank, S.A. and Subsidiaries, is a Panamanian capital
private entity operating in Panama since 1991 with a
General License, granted by the Superintendency of Banks
of Panama (SBP), which allows it to carry out banking
activities that take effect anywhere in the Republic of
Panamá or abroad.
Metrobank is owned 100% by Metro Holding Enterprises,
Inc., which does not have any other investment. In turn,
Metrobank maintains full control of 5 subsidiary
companies, which provide services that complement the
Bank's typical operation.
Metrobank's Economic Group Structure
Metroholding Enterprises, Inc.
Metrobank, S.A.
(wholly owned subsidiary)
Financiera Govimar, S.A.
(wholly owned subsidiary)
Corporación Govimar, S.A.
(wholly owned subsidiary)
Metroleasing, S.A.
(wholly owned subsidiary)
Eurovalores, S.A.
(wholly owned subsidiary)
Metrofactoring, S.A.
(wholly owned subsidiary)
Metrotrust, S.A.
(wholly owned subsidiary)
Source: Metrobank / Prepared by: Equilibrium
Metroleasing, S.A. Leasing of equipment. It began operating in April 1995.
Eurovalores, S.A
Financial intermediation, securities
brokerage and other related services. It
began operating in August 2005.
Financiera Govimar, S.A.
Personal loans, mainly under the
modality of direct discount. It is a
subsidiary since April 2008.
Metrotrust, S.A. Trust Business. It began operating in May 2013.
Metrofactoring, S.A.
Purchase at a discount of invoices issued
by third parties. It began operating in
January 2014.
The Board of Directors is composed of the following
dignitaries:
Director - President Joseph Fidanque Wallenstein
Director - Vice-President Rafael Bárcenas Pérez
Director - Treasurer Eduardo Orillac Motta
Director - Secretary Juan Pablo Fábrega Polleri
Director - Deputy Treasurer Eric Cohen Solís
Director - Deputy Secretary Orlando López Arosemena
Director Ernesto A. Boyd Sasso
Director Ramesh Chatlani
Director Óscar López Arosemena
Director Roy Katz Rabinovich
Director Abraham Assis
Independent Director Paul Smith Alegre
Independent Director Robert Boyd
Alternate Director Enrique Díaz López
Alternate Director Murad Moisés Harari Dabah
The Board of Directors and management promote the
creation of the organization, processes and tools adequate
for the control and transparency of operations. Likewise,
Audit, Assets and Liabilities (ALCO), Risks, Compliance,
Credit, Human Resources, and Top Management
committees are held, which promote the strengthening of
sound governance practices. Additionally, the Bank has
the support of 2 independent directors in its Board of
Directors, who preside some of the committees mentioned
above, pursuant to what is set forth by the SBP in
Agreement No. 005-2011.
Business Strategy
Metrobank fosters a business strategy focused in
conducting financial transactions with, mostly, corporate
profile customers. Furthermore, the products and services
offered by the Bank are geared, to a great extent, towards
the Corporate Banking and Private Banking segments,
while Financiera Govimar acts as the Consumer Banking
area, which constitutes a complement to its strategy.
It should be noted that Metrobank has expanded its
operational infrastructure during the last years, which led to
greater asset volumes and income received, without
incurring in significant changes in the strategic focus. In
fact, the Bank has made efforts to continue strengthening
its lines of business and stimulating products cross-selling,
also integrating services based on technology, in order to
further enhance its competitive advantages into the future.
All these will be a part of the strengthening process for
each one of the business relationships the Bank has,
highlighting that its customer base has shown high historic
stability.
One of the aspects that favor the Bank's operation is its
technological infrastructure, considered robust from the
point of view of controls, effectiveness, management
information, customer service and development of
products/services that generate fees and other income. Of
special interest, Metrobank has formalized relationships
with multiple prestigious companies nationwide, through
the offer of merchant acquisition and the Mobile Cash
services, which show a growing trend in recent years.
Regarding the administration of subsidiaries, Management
arranged for the homologation of Financiera Govimar to
the Bank with respect to: controls, processes, procedures
and policies, with the objective to integrate this subsidiary
at the operational (as the Consumer area of the Entity) and
corporate governance levels. In this way, Govimar remains
focused on granting personal loans using direct discount to
retirees and public sector officers or employees, thus, in
this sense, the strategy has remained consistent. On the
other hand, albeit the Eurovalores business holds a smaller
market share than other stock brokerage firms operating in
the local market, this company has shown a gradual growth
during the last years in terms of assets under administration
and traded transactions volume.

5
FINANCIAL PERFORMANCE
Assets and Credit Quality
Metrobank's consolidated assets growth rhythm registered
a slight deceleration for the last 12 months ended as of June
30, 2015, almost matching the average shown by the
individual base of the National Banking System (NBS).
This is linked to the budget contemplated by the Entity for
2015, which considered factors such as the economic
deceleration of Panama and other international factors
prompting a more conservative growth rhythm.
0%
5%
10%
15%
20%
25%
30%
35%
0
200
400
600
800
1,000
1,200
Dec. 12
Dec. 13
Jun. 14
Dec. 14
Jun. 15
Gro
wth
rate
In U
S$ m
illi
on
s
Assets evolution and composition
Other assets
Loans
Investments
Cash and due from banks
Assets interannual growth % -MetrobankAssets growth % -NBS
Sources: Metrobank and SBP / Prepared by: Equilibrium
Regarding the balance structure, even if no significant
changes have been observed in the participation of earning
assets, there is a decrease in the participation of liquid
assets (cash + due from banks) from 11.4% to 10.0%
during the 6 first months of 2015, which was compensated
through an increase in the proportion of gross loans in the
same period. Therefore, the Bank has placed a greater
emphasis in the growth of its loan portfolio, since the
variation for this period is equivalent to US$46.6 million,
an amount that explains 100% of the growth of total assets
in absolute terms.
The loan portfolio totals US$774.6 million as of the closing
of June 2015, after showing a 15.7% annual increase, in
turn equivalent to US$104.9 million in terms of balances.
Interestingly, loans to the foreign sector contributed 48.4%
of said interannual growth, which meant a decrease of the
portfolio exposure degree to the local market during this
time lapse (from 90.1% down to 84.9%). The Bank's
Management contemplates maintaining the foreign loans
growth rhythm, mostly destined to highly prestigious
corporate groups in Central America, under the syndicated
loans modality and structured by top-rated prestigious
international financial entities as a counterbalance measure
against the deceleration of some sectors of the local
market.
Concerning the distribution by economic sector, the
balance granted to the commercial sector groups 38.1% of
the portfolio, thus it still predominates in the loan mix.
However, the balance allocated to said sector shrank during
the last 12 months, causing a drop in its relative
participation from 45.6% as of the closing of June 2014.
0%
5%
10%
15%
20%
25%
30%
0%
10%
20%
30%
40%
50%
60%
70%
80%
90%
100%
Dec. 12
Dec. 13
Jun. 14
Dec. 14
Jun. 15
ann
ual
var
iati
on
%
bal
ance
par
tici
pat
ion
%
Distribution of Loan Portfolio by Economic Sector
Other
Construction
Industrial
Consumer
Services
Commercial CFZ
Commercial non -CFZ
Source: Metrobank / Prepared by: Equilibrium
As shown in the previous graph, Metrobank focused in
granting facilities to the sectors: services, construction and
industrial (mainly to Central America and the Caribbean),
which has allowed to reflect a rise in the annual growth
rhythm as of the June 2015 closing.
Due to its focus in the Corporate Banking sectors,
Metrobank shows a relative concentration of loan balances
(net of pledged deposits) corresponding to its Top 20
debtors, equivalent to 24.2% of total loans and 1.7 times
the Tier 1 capital, both as of June 30, 2015, where said
levels have reflected a slight upward trend.
0.0
0.5
1.0
1.5
2.0
2.5
0%
5%
10%
15%
20%
25%
30%
Dec. 12
Dec. 13
Jun. 14
Dec. 14
Jun. 15
Pro
po
rtio
n o
f Tie
r 1
cap
ital
Par
tici
pat
ion
% o
n lo
ans
Concentration of Top 20 debtors*
Top 20 debtors /
Loans
Top 20 debtors /
Equity
* Net of pledged deposits
Source: Metrobank / Prepared by: Equilibrium
Regarding the credit quality, the non-performing balances
ratio is equivalent to 0.6% as of June 30, 2015, a
percentage that continues comparing favorably in relation
to the NBS average (0.9%), while the addition of non-
performing and past-due loans represents 0.8% of total
loans, also below the NBS average (2.0%). Also, the total
of loans classified in the “Special Mention” “Substandard”,
“Doubtful” and “Loss” (B, C, D and E) categories
according to Agreement 04-2013 represent 0.9% of the
loan portfolio; it stands out that said percentage has shown
consistency during the last years. This is particularly
advantageous to lighten possible additional specific
reserves requirements that could arise upon unexpected
events.

6
On the other hand, the market value of the tangible
collateral (pledged deposits; mortgages over personal
property and real estate and pledged securities) is
equivalent to approximately 101% of the total balance of
loans as of June 20, 2015. If we take into account the value
of collateral up to the loan balance they guarantee, the
coverage percentage is equivalent to 58.6% of the
consolidated portfolio (including Financiera Govimar),
indicating a favorable guarantee position, taking into
account the regulatory requirements in effect included in
Agreement 04-2013. It is precisely this condition, together
with the low default, that allows the recognition of specific
reserves, which total US$5.7 million as of the June 2015
closing, in turn obtained from the calculation under the
incurred loss principles, established by the International
Financial Reporting Standards (IFRS).
Liability Funding Structure
As of June 30, 2015, deposits taken from customers add up
to US$944.9 million, after reflecting a 5.1% increase
compared to December 2014 and 15.1% compared to June
2014. Particularly, time deposits have shown a greater
dynamism during the last year than the rest of modalities
(demand and savings deposits), which has allowed its
relative participation increase over the total takings. Time
deposits have contributed more than 100% of the asset
annual growth for the July 2014 - June 2015 period, which
also indicates a lower degree of funding diversification for
the last period. Favorably, the current funding strategy
allows extending the maturity terms of liabilities.
0%
5%
10%
15%
20%
25%
30%
0
200
400
600
800
1,000
1,200
Dec. 12
Dec. 13
Jun. 14
Dec. 14
Jun. 15
Gro
wth
rate
In U
S$ m
illio
ns
Liabilities evolution and composition
Other liabilities
Received financings + repos
Time deposits
Savings deposits
Demand deposits
Deposits interannual growth % - Metrobank
Deposits growth % - NBS
Sources: Metrobank and SBP / Prepared by: Equilibrium
On the other hand, the use of borrowing lines granted by
other financial entities, including securities sold under
repurchase agreement (repos), have maintained a low
representation on financial liabilities, as the management
strategy favors takings of resources through deposits from
the general public. Albeit the use of these financial
liabilities add up to US$39.7 million as of June 30, 2015,
the Bank holds available lines for another US$32.6 million.
It should be noted that the repo lines for US$27.5 million
are secured by Sovereign Debt from the Republic of
Panama registered in the Bank's investment portfolio,
which market value represent 144.2% of these facilities.
The Bank shows a low concentration degree in its top
depositors, which is consistent with its focus on the
Corporate Banking business. As of June 30, 2015, 20.1%
of total deposits correspond to the amounts taken through
the Top 20 depositors, a level close to the average reflected
by the banks in its risk category that have similar business
focus.
0%
5%
10%
15%
20%
25%
Dec.12 Dec.13 Jun.14 Dec.14 Jun.15
Exp
osu
re %
Top depositors / Total deposits
Top 10 depositors
Top 20 depositors
Source: Metrobank / Prepared by: Equilibrium
In a favorable light, the Bank has maintained a good
renewal percentage on its time deposits (around 85%
during the 6 months elapsed of 2015); additionally, the
average volatility ratios on demand and savings deposits
have remained below 3.5% during the last 2 years.
Liquidity and Maturity Matching
As of June 30, 2015, the amount of cash, due from banks
and financial investments (liquid funds available) represent
34.1% of total liabilities; even though said percentage is
slightly below the NBS average (35.2%), the high degree
of consistency during the last years stands out.
It should be noted that the legal liquidity ratio for
Metrobank averaged 64.5% during the first semester of
2015, a figure above the average of the Panamanian
banking industry; furthermore, the Bank has shown an
upward trend in this ratio. The above is consistent with the
type of funding used by the Bank, together with the
conservative quality of its investments portfolio.
30%
35%
40%
45%
50%
55%
60%
65%
70%
Dec. 12 Dec. 13 Jun. 14 Dec. 14 Jun. 15
Leg
al L
iqu
idit
y %
Average legal liquidity ratio evolution
Metrobank
Panamanian Private Banking
National Banking System
Sources: Metrobank and SBP / Prepared by: Equilibrium
On the other hand, the liquid funds available over demand
and savings deposits ratio is equivalent to 139.9% as of the
June 2015 closing, a percentage that is above the NBS
average (95.7%) on the same date. If the investments
securing repos were excluded from the numerator, the ratio
would be 122.1%, a level that continues being favorable
from the point of view of coverage of liquidity risk before
financial stress scenarios.

7
Regarding the liquidity matching as of June 30, 2015,
Metrobank reflects -under the contractual measurement-
gaps between assets and liabilities that exceed the equity
amount in the 0-30 days time interval. It should be taken
into account that the contractual analysis places the
demand and savings deposits in the shortest term bucket,
due to their free exigibility quality; additionally, the
financial investments are placed in the maturities originally
agreed upon (typically greater than 1 year), assuming that
the Bank will maintain its positions in the long term.
Nevertheless, the gaps can be remedied once the option to
liquidate securities with good market depth for up to
approximately US$141.2 million is considered. The above
is considered feasible, given the conservative profile of the
portfolio regarding both credit and market risk.
Investments Portfolio Profile
The aggregate of the market value corresponding to the
Bank's financial investments is equivalent to US$231.3
million as of June 30, 2015, in turn it is totally comprised
of securities available for sale. The variation rate of
investments was 4.7% compared to December 2014,
influenced to a great extent by a greater degree of sale of
securities, in order to recognize capital gains.
From the point of view of credit quality, we observe that
local and international investment grade securities
represent 68.4% of the total portfolio. It also stands out that
the securities corresponding to Sovereign Bonds and
Treasury Notes represent 36.6% of the portfolio, a majority
of which correspond to Sovereign Debt issue directly by
the Government of the Republic of Panama. This issuer is
the greatest individual protagonist in the portfolio, since it
represents 62.8% of the net shareholders' equity. Taking
this into account, the aggregate of the Top 10 issuers of the
portfolio groups 69.8% of the investments and represents
1.5 times the net shareholders' equity.
Corporate bonds
62.9%
Sovereign Debt
20.1%
Treasury Notes
16.6%
Other0.5%
Distribution of securities by type of instrument(as of June 30, 2015)
Source: Metrobank / Prepared by: Equilibrium
The above falls within the acquisition of securities strategy
established by the Board of Directors of Metrobank, since
that in addition of emphasizing fixed rate securities with
good convertibility degree (high component of Sovereign
Debt), it also favors securities issued from Panama, and, to
a lesser extent, the United States, resulting in a
geographical distribution very focused in these two
countries, consistent with the last years. Also, it should be
noted that the securities without investment grade group
24.5% of the portfolio, which in turn consist of securities
issued by prestigious Panamanian corporations and that
generally have good tangible collateral backing.
Regarding its market risk, the Bank registers an unrealized
gain of US$278.4 thousand in its securities available for
sale as of June, 2015 closing. Albeit this figure represents
an 89.5% decrease compared to December 2014, the above
is closely related to the sale of investments that took place
during the first semester of 2015 for the sum of US$57.1
million, taking into advantage the recognition of increases
in the value of some Panamanian and international
securities generated during prior periods. Currently, the
highest unrealized loss registered by an individual issuer is
equivalent to US$252.1 thousand, and the greatest loss
percentage is only 2.1%, with ample slack regarding the
stop-loss limits established by the Bank.
Solvency
As of the closing of June 2015, the Bank's net stockholders'
equity shows a 2.0% variation compared to December
2014, supported by retained earnings during the semester,
that later on contributed to increase the dynamic reserve, as
established in current the banking regulation. However, we
also observed some decreases in specific items, for instance
the decrease mentioned in unrealized gains on securities
available for sale; also, the Bank distributed dividends to
its common stock shareholders for the sum of US$2.5
million during the last semester, that is, 22.5% of the 2014
net profit, which is consistent with the management
practice for the past 5-year period (between 20% and 30%).
Therefore, the leverage ratio (liabilities / equity) remained
almost similar between the analyzed periods, as well as the
Capital Adequacy Ratio (CAR), while assets presented a
slightly slower growth rhythm than in 2014. Of particular
interest, Metrobank's CAR is below the NBS average and
the average shown by banks in its risk category. In spite of
this condition, we value that the computable capital funds
for the capital adequacy calculation consist totally of
ordinary Tier 1 capital elements in the case of Metrobank,
which is more favorable compared to some financial
institutions rated by Equilibrium, that could even have
CAR levels above the current regulation in effect
(Agreement 05-2008). Additionally, the Bank contemplates
receiving capital contributions from its shareholders as of
the closing of 2015, which could support at least 2 years of
growth.
0%
2%
4%
6%
8%
10%
12%
14%
16%
18%
0
20
40
60
80
100
120
Dec.12Dec.13 Jun.14Dec.14 Jun.15
CAR
In U
S$ m
illio
ns
CAR evolution
Tier 1 Capital Funds
CAR -Metrobank
CAR - NBS
Sources: Metrobank y SBP / Prepared by: Equilibrium
It should be noted that the Goodwill generated by the
acquisition of Financiera Govimar and other financial
companies for an amount of US$10.1 million in 2008, has
8
been deducted from the computable capital funds,
according to the SBP's current regulations. If this
regulatory adjustment did not exist, the CAR as of June
2015 would have been 14.1%.
Results and Profitability
For the 6-month period ended as of June 30, the Bank's net
profit totaled US$7.1 million, which means a 48.2%
interannual improvement. This allowed the profitability on
average assets and risk-weighted assets ratios (ROAA and
ROARWA) to reflect a rise up to 1.3% and 1.9%,
respectively, favorable when compared to some banking
entities rated in its risk category.
It should be noted that the sale of securities contributed
income for US$1.4 million, representing 20.5% of net
profit, thus registering an increase in said extraordinary
component, from the 3.9% presented during the first
semester of 2014.
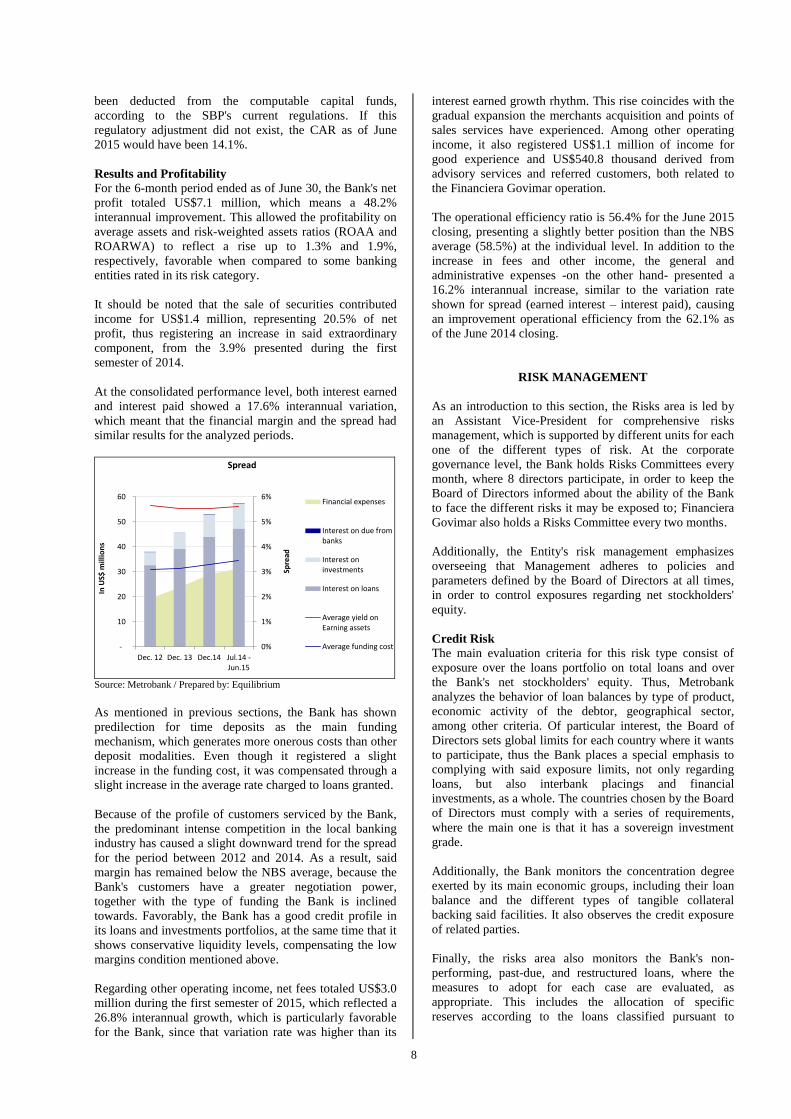
At the consolidated performance level, both interest earned
and interest paid showed a 17.6% interannual variation,
which meant that the financial margin and the spread had
similar results for the analyzed periods.
0%
1%
2%
3%
4%
5%
6%
-
10
20
30
40
50
60
Dec. 12 Dec. 13 Dec.14 Jul.14 -Jun.15
Spre
ad
In U
S$ m
illio
ns
Spread
Financial expenses
Interest on due frombanks
Interest oninvestments
Interest on loans
Average yield onEarning assets
Average funding cost
Source: Metrobank / Prepared by: Equilibrium
As mentioned in previous sections, the Bank has shown
predilection for time deposits as the main funding
mechanism, which generates more onerous costs than other
deposit modalities. Even though it registered a slight
increase in the funding cost, it was compensated through a
slight increase in the average rate charged to loans granted.
Because of the profile of customers serviced by the Bank,
the predominant intense competition in the local banking
industry has caused a slight downward trend for the spread
for the period between 2012 and 2014. As a result, said
margin has remained below the NBS average, because the
Bank's customers have a greater negotiation power,
together with the type of funding the Bank is inclined
towards. Favorably, the Bank has a good credit profile in
its loans and investments portfolios, at the same time that it
shows conservative liquidity levels, compensating the low
margins condition mentioned above.
Regarding other operating income, net fees totaled US$3.0
million during the first semester of 2015, which reflected a
26.8% interannual growth, which is particularly favorable
for the Bank, since that variation rate was higher than its
interest earned growth rhythm. This rise coincides with the
gradual expansion the merchants acquisition and points of
sales services have experienced. Among other operating
income, it also registered US$1.1 million of income for
good experience and US$540.8 thousand derived from
advisory services and referred customers, both related to
the Financiera Govimar operation.
The operational efficiency ratio is 56.4% for the June 2015
closing, presenting a slightly better position than the NBS
average (58.5%) at the individual level. In addition to the
increase in fees and other income, the general and
administrative expenses -on the other hand- presented a
16.2% interannual increase, similar to the variation rate
shown for spread (earned interest – interest paid), causing
an improvement operational efficiency from the 62.1% as
of the June 2014 closing.
RISK MANAGEMENT
As an introduction to this section, the Risks area is led by
an Assistant Vice-President for comprehensive risks
management, which is supported by different units for each
one of the different types of risk. At the corporate
governance level, the Bank holds Risks Committees every
month, where 8 directors participate, in order to keep the
Board of Directors informed about the ability of the Bank
to face the different risks it may be exposed to; Financiera
Govimar also holds a Risks Committee every two months.
Additionally, the Entity's risk management emphasizes
overseeing that Management adheres to policies and
parameters defined by the Board of Directors at all times,
in order to control exposures regarding net stockholders'
equity.
Credit Risk
The main evaluation criteria for this risk type consist of
exposure over the loans portfolio on total loans and over
the Bank's net stockholders' equity. Thus, Metrobank
analyzes the behavior of loan balances by type of product,
economic activity of the debtor, geographical sector,
among other criteria. Of particular interest, the Board of
Directors sets global limits for each country where it wants
to participate, thus the Bank places a special emphasis to
complying with said exposure limits, not only regarding
loans, but also interbank placings and financial
investments, as a whole. The countries chosen by the Board
of Directors must comply with a series of requirements,
where the main one is that it has a sovereign investment
grade.
Additionally, the Bank monitors the concentration degree
exerted by its main economic groups, including their loan
balance and the different types of tangible collateral
backing said facilities. It also observes the credit exposure
of related parties.
Finally, the risks area also monitors the Bank's non-
performing, past-due, and restructured loans, where the
measures to adopt for each case are evaluated, as
appropriate. This includes the allocation of specific
reserves according to the loans classified pursuant to
9
Agreement 04-2013, review of guarantees, and legal
procedures to initiate, if necessary.
The Bank has implemented an internal scoring system for
the Corporate Banking loan portfolio, with the objective of
assigning an internal rating based on determined qualitative
and quantitative criteria, according to its risk profile. This
would be particularly useful when submitting loan
proposals to the different committees, as well as when
following-up the credit behavior of each debtor.
It is worth mentioning that the Bank exercises a periodic
monitoring of customers' files, both at Head Office and
branch offices levels, as a quality control measure.
Market Risk
Metrobank's market risk is focused on its investment
portfolio. Therefore, the Assistant Vice-President monitors
specific portfolio variables, such as: average yield, type of
instrument, type of industry of the Issuer, risk rating,
average duration, participation of investments on total
loans, proportion of securities issued abroad, unrealized
gain/loss amount, among others. Albeit the foreign
securities (other than Latin America) are managed by an
external custodian, the Bank monitors its positions in these
securities the same way it does its local investments.
In addition, the Bank oversees the evolution of the VaR
and CVaR (Conditional Value at Risk), so that the
maximum loss limits allowed regarding the net
stockholders' equity are complied with.
Liquidity Risk
The risks area has prepared procedures for the activation of
the Contingency Plan, which has several levels depending
on the need for liquidity at a given time. The use of repos,
lines of credit, and the renewal of bank borrowings would
be contemplated in case the legal liquidity rate approaches
the regulatory limit.
At the same time, the Board of Directors is kept informed
about the evolution of the concentration degree of Top
depositors, including the different types of deposits they
have in the Bank and those that are pledged as collateral of
the loan portfolio.
Additionally, the Bank conducts a periodic review of
liquidity levels it maintains in the balance sheet, including
the average legal liquidity ratios (regulatory) and the
immediate liquidity ratio, which is an internal measure of
the institution that takes into consideration a more stringent
deposits base. This analysis is complemented through the
monthly monitoring of the liquidity matching position
under contractual and under renewal statistics scenarios, in
turn supported by overseeing the renewal percentages of
time deposits and the volatility ratios of the different types
of financial liabilities.
Operational Risk
The Assistant Vice-President has homologated the
incidents reporting system for both Metrobank and
Financiera Govimar, in order to monitor the operational
risk of both entities simultaneously.
The Entity has a software through which each area reports
materialized operational risks events, in order to duly
follow-up afterwards with the help of a preventive actions
matrix. Management indicated that the Bank is in the
process of updating the tool that measures potential losses.
As part of its main objectives, the operational risks area has
been able to evaluate all the risks inherent to the identified
processes. The Bank presents its Board of Directors a
summary of these processes by credit product or
management area, as they are updated in the risk matrix.
This way, a constant update of the corresponding risk
matrixes is maintained, so that the areas that own the
processes, implement measures to control the possible risks
observed, supervised by the Comprehensive Risks area.
After considering the controls applied to the inherent
losses, the Bank obtains a residual loss figure, which is
compared to the limit assigned by the Board of Directors.
This allows showing a refined analysis of the main areas or
processes that should be reinforced, in order to reduce
future residual losses.
Metrobank continues developing the Business Impact
Analyses (BIA) for each one of the Bank's processes with
the objective to continue reinforcing its current Business
Continuity Plan to ensure operability in case of
technological failures or external events.
REGULATORY ASPECTS
Regulatory Framework for Capital Adequacy
On February 3, 2015, the SBP issued Agreement 01-2015,
which sets forth new requirements for the categorization of
the computable capital funds for the calculation of the
Capital Adequacy Ratio (CAR). This Agreement will be
applicable to all official banks, all General License Banks,
all International License Banks where the SBP is a home
country supervisor and to all the owners of bank stock
from banking groups that consolidate in Panama and that
the SBP is the home country supervisor.
This Agreement will require compliance with minimum
percentages of adequacy, according to the classification of
capital funds parameters. The components of each one of
the types of capital accepted by the regulation: ordinary
Tier 1 capital, additional Tier 1 capital, and Tier 2 capital,
will be determined.
The minimum percentage of Capital Adequacy will
continue being 8%, as it is required under Agreement 05-
2008, currently in effect. However, the new Agreement
sets forth limits for the Tier 1 capital, which will increase
gradually, until the adequation periods have elapsed.
The ordinary Tier 1 capital will consist of common shares,
retained and current period earnings, regulatory reserves,
and other elements included in the Agreement. The
calculation of Tier 1 capital according to the new
Agreement deducts Goodwill, in addition to other items or
regulatory adjustments that are not taken into account in
the current regulation. For example, the following are
mentioned:
10
Accumulated and current period
losses Other intangible assets
Shareholdings greater than 10% in the stockholders' equity of financial
entities that do not consolidate to in
the Bank
Shareholdings in non-
financial entities included
in the financial consolidation (greater than
10%)
Unrealized losses on securities
available for sale
Other adjustments
contemplated in the Agreement
It is worth mentioning that retained and current period
earnings must be validated by the external auditors, in
order to ensure the deduction of every possible,
foreseeable expense, interest, or dividend from said profits.
After applying the corresponding regulatory adjustments,
the resulting ordinary Tier 1 capital must be greater than
4.5% of risk-weighted assets as of January 1, 2019, at the
same time that the total Tier 1 capital must be, as a
minimum, 6% on that date. The SBP will grant an
adequation period to the norm according to the following
table, in which the requirement dates are indicated, starting
January 1, 2016:
Type of
capital 01/01/16 01/01/17 01/01/18 01/01/19
Ordinary Tier 1 Capital
3.75% 4.00% 4.25% 4.50%
Total Tier 1 Capital
5.25% 5.50% 5.75% 6.00%
Total capital 8.00% 8.00% 8.00% 8.00%
Source: Superintendency of Banks of Panama
The additional Tier 1 capital will consist of equity
instruments with certain characteristics, among which the
non-cumulative preferred stock, without early redemption
clauses, perpetual, among other characteristics, will be
contemplated. The Bank can comply with the total Tier 1
capital requirement using these instruments, as long as it
complies with the ordinary Tier 1 capital percentage.
On the other hand, Tier 2 capital will continue consisting
of the subordinated bonds or other hybrid capital
instruments that do not meet the characteristics to be
considered additional Tier 1 capital. The Bank can reach
the minimum 8% adequacy using these instruments, as
long as it complies with the total Tier 1 capital levels
required.
The aforementioned will also apply for all the banks that
are subsidiaries of regulated banks, which home country
supervisor is the SBP. That is, the Bank not only has to
comply with the percentage on a consolidated basis, but
also individually, including all the banks that are a part of
the economic group.
The new Agreement will also establish compliance with a
Leverage Coefficient, which is calculated dividing the
ordinary Tier 1 capital by the sum of on- and off-balance
sheet non-weighted assets established by the SBP. The
minimum of this coefficient will be 3.00%.
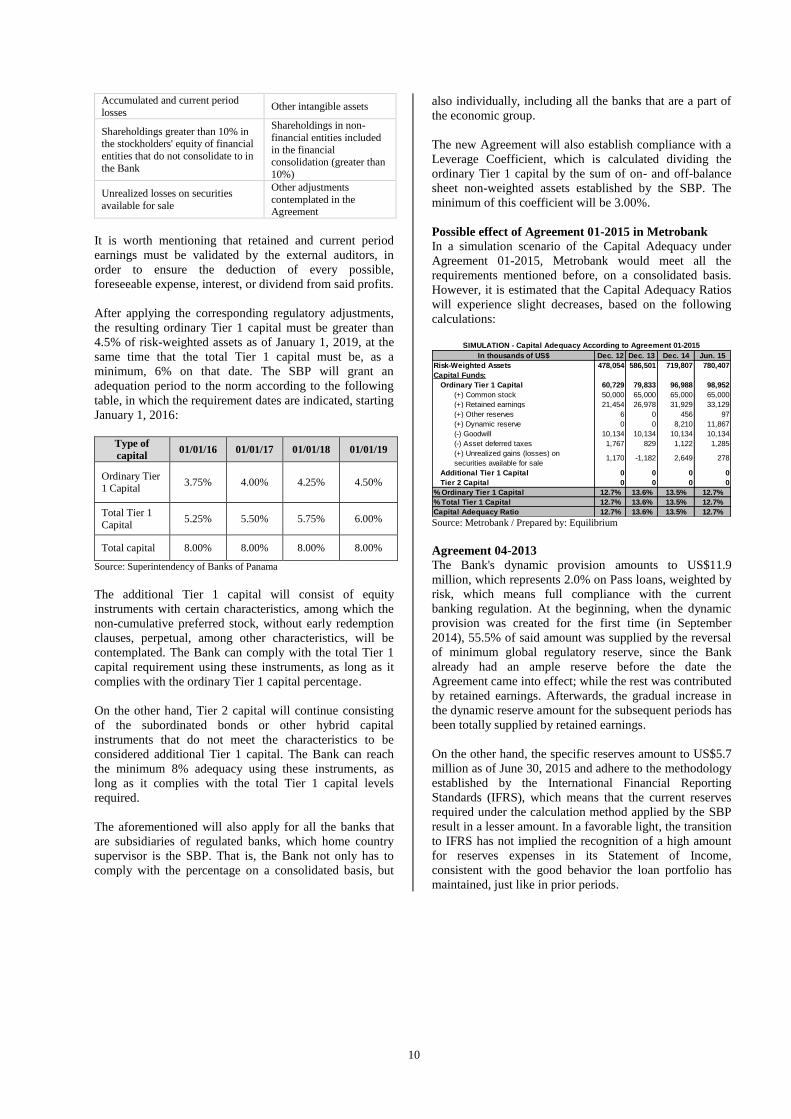
Possible effect of Agreement 01-2015 in Metrobank
In a simulation scenario of the Capital Adequacy under
Agreement 01-2015, Metrobank would meet all the
requirements mentioned before, on a consolidated basis.
However, it is estimated that the Capital Adequacy Ratios
will experience slight decreases, based on the following
calculations:
In thousands of US$ Dec. 12 Dec. 13 Dec. 14 Jun. 15
Risk-Weighted Assets 478,054 586,501 719,807 780,407
Capital Funds:
Ordinary Tier 1 Capital 60,729 79,833 96,988 98,952
(+) Common stock 50,000 65,000 65,000 65,000
(+) Retained earnings 21,454 26,978 31,929 33,129
(+) Other reserves 6 0 456 97
(+) Dynamic reserve 0 0 8,210 11,867
(-) Goodwill 10,134 10,134 10,134 10,134
(-) Asset deferred taxes 1,767 829 1,122 1,285
(+) Unrealized gains (losses) on
securities available for sale1,170 -1,182 2,649 278
Additional Tier 1 Capital 0 0 0 0
Tier 2 Capital 0 0 0 0
% Ordinary Tier 1 Capital 12.7% 13.6% 13.5% 12.7%
% Total Tier 1 Capital 12.7% 13.6% 13.5% 12.7%
Capital Adequacy Ratio 12.7% 13.6% 13.5% 12.7%
SIMULATION - Capital Adequacy According to Agreement 01-2015
Source: Metrobank / Prepared by: Equilibrium
Agreement 04-2013
The Bank's dynamic provision amounts to US$11.9
million, which represents 2.0% on Pass loans, weighted by
risk, which means full compliance with the current
banking regulation. At the beginning, when the dynamic
provision was created for the first time (in September
2014), 55.5% of said amount was supplied by the reversal
of minimum global regulatory reserve, since the Bank
already had an ample reserve before the date the
Agreement came into effect; while the rest was contributed
by retained earnings. Afterwards, the gradual increase in
the dynamic reserve amount for the subsequent periods has
been totally supplied by retained earnings.
On the other hand, the specific reserves amount to US$5.7
million as of June 30, 2015 and adhere to the methodology
established by the International Financial Reporting
Standards (IFRS), which means that the current reserves
required under the calculation method applied by the SBP
result in a lesser amount. In a favorable light, the transition
to IFRS has not implied the recognition of a high amount
for reserves expenses in its Statement of Income,
consistent with the good behavior the loan portfolio has
maintained, just like in prior periods.

11
METROBANK, S.A. AND SUBSIDIARIES
CONSOLIDATED BALANCE SHEET
in thousands of dollars
ASSETS:
Cash and cash items 5,565 0.7% 5,970 0.6% 12,045 1.2% 6,862 0.6% 5,165 0.5% -1,697 -24.7%
Demand deposits due from banks 44,945 5.7% 72,360 7.8% 86,549 8.7% 76,172 7.1% 75,361 6.7% -811 -1.1%
Time deposits due from banks 40,645 5.1% 37,336 4.0% 36,369 3.7% 39,804 3.7% 31,901 2.8% -7,903 -19.9%
Total Cash and Due from Banks 91,155 11.5% 115,666 12.4% 134,962 13.6% 122,838 11.4% 112,427 10.0% -10,411 -8.5%
Investments in securities available for sale 137,040 17.3% 165,092 17.7% 190,636 19.2% 220,975 20.6% 231,324 20.7% 10,350 4.7%
Total Investments 137,040 17.3% 165,092 17.7% 190,636 19.2% 220,975 20.6% 231,324 20.7% 10,350 4.7%
Total Funds Available 228,195 28.9% 280,757 30.1% 325,598 32.8% 343,813 32.0% 343,751 30.7% -62 0.0%
Loans 569,145 72.0% 657,277 70.4% 669,683 67.4% 727,951 67.8% 774,554 69.2% 46,603 6.4%
Current loans 565,876 71.6% 652,926 70.0% 666,808 67.1% 720,670 67.2% 768,172 68.6% 47,502 6.6%
Non-performing loans 1,844 0.2% 3,980 0.4% 1,239 0.1% 5,122 0.5% 4,599 0.4% -523 -10.2%
Past-due loans 1,425 0.2% 371 0.0% 1,635 0.2% 2,160 0.2% 1,783 0.2% -377 -17.4%
Less:
Loan Loss Reserve 6,425 0.8% 3,343 0.4% 8,755 0.9% 5,196 0.5% 5,707 0.5% 511 9.8%
Discounted unearned interest, fees and insurance 29,492 3.7% 31,042 3.3% 30,447 3.1% 28,599 2.7% 28,651 2.6% 52 0.2%
Net loans and discounts 533,228 67.4% 622,892 66.8% 630,481 63.5% 694,156 64.7% 740,196 66.1% 46,040 6.6%
Property, Furniture, Equipment and Improvements 6,503 0.8% 10,348 1.1% 10,721 1.1% 10,759 1.0% 10,668 1.0% (91) -0.8%
Goodwill 10,134 1.3% 10,134 1.1% 10,134 1.0% 10,134 0.9% 10,134 0.9% 0 0.0%
Accrued interest receivable 2,639 0.3% 2,702 0.3% 3,027 0.3% 3,586 0.3% 3,525 0.3% (62) -1.7%
Other assets 10,123 1.3% 6,288 0.7% 9,614 1.0% 6,567 0.6% 7,342 0.7% 775 11.8%
Assets held for sale 0 0.0% 0 0.0% 4,035 0.4% 4,035 0.4% 4,035 0.4% 0 0.0%
TOTAL ASSETS 790,822 100.0% 933,122 100.0% 993,609 100.0% 1,073,052 100.0% 1,119,652 100.0% 46,600 4.3%
LIABILITIES:
Demand deposits 83,578 10.6% 89,247 9.6% 97,625 9.8% 113,910 10.6% 99,753 8.9% (14,158) -12.4%
Savings deposits 88,572 11.2% 101,009 10.8% 117,312 11.8% 124,784 11.6% 123,104 11.0% (1,679) -1.3%
Customers' certificates of deposits 434,069 54.9% 540,635 57.9% 571,145 57.5% 636,245 59.3% 705,332 63.0% 69,087 10.9%
Interbank certificates of deposits 30,642 3.9% 29,012 3.1% 35,110 3.5% 24,243 2.3% 16,759 1.5% -7,484 -30.9%
Total deposits 636,862 80.5% 759,903 81.4% 821,192 82.6% 899,182 83.8% 944,948 84.4% 45,766 5.1%
Borrowings 28,058 3.5% 25,965 2.8% 23,639 2.4% 17,517 1.6% 12,190 1.1% (5,327) -30.4%
Securities sold under repurchase agreement 37,199 4.7% 32,074 3.4% 32,074 3.2% 27,500 2.6% 27,500 2.5% 0 0.0%
Cashiers' checks and certified checks 3,833 0.5% 5,882 0.6% 3,707 0.4% 4,525 0.4% 8,608 0.8% 4,083 90.2%
Accrued interest payable 3,343 0.4% 3,596 0.4% 4,367 0.4% 4,457 0.4% 4,934 0.4% 477 10.7%
Pending acceptances 277 0.0% 0 0.0% 2,297 0.2% 746 0.1% 24 0.0% (723) -96.8%
Other liabilities 8,621 1.1% 9,992 1.1% 8,957 0.9% 10,879 1.0% 11,076 1.0% 198 1.8%
TOTAL LIABILITIES 718,192 90.8% 837,411 89.7% 896,233 90.2% 964,807 89.9% 1,009,280 90.1% 44,473 4.6%
STOCKHOLDERS' EQUITY:
Common stock 50,000 6.3% 65,000 7.0% 65,000 6.5% 65,000 6.1% 65,000 5.8% 0 0.0%
Change in securities available for sale 1,170 0.1% -1,182 -0.1% 2,135 0.2% 2,649 0.2% 278 0.0% -2,371 -89.5%
Reserve for foreclosed assets 6 0.0% 0 0.0% 81 0.0% 8 0.0% 4 0.0% -4 -49.4%
Regulatory reserve for assets under administration 0 0.0% 0 0.0% 0 0.0% 91 0.0% 94 0.0% 3 3.2%
Difference between regulatory specific reserve and IFRS reserve 0 0.0% 4,915 0.5% 0 0.0% 358 0.0% 0 0.0% -358 -100.0%
Dynamic reserve for loan losses 0 0.0% 0 0.0% 0 0.0% 8,210 0.8% 11,867 1.1% 3,657 44.5%
Net income for the period 6,873 0.9% 9,848 1.1% 4,768 0.5% 11,118 1.0% 7,067 0.6% (4,051) -36.4%
Retained earnings 14,581 1.8% 17,129 1.8% 25,393 2.6% 20,811 1.9% 26,062 2.3% 5,251 25.2%
TOTAL STOCKHOLDERS' EQUITY 72,630 9.2% 95,711 10.3% 97,376 9.8% 108,244 10.1% 110,372 9.9% 2,128 2.0%
TOTAL LIABILITIES AND STOCKHOLDERS' EQUITY 790,822 100.0% 933,122 100.0% 993,609 100.0% 1,073,052 100.0% 1,119,652 100.0% 46,600 4.3%
7.5% 26.1% 1.7% #¡DIV/0! 2.0%
METROBANK, S.A. AND SUBSIDIARIES
CONSOLIDATED STATEMENT OF INCOME
(in thousands of dollars)
Financial Income 37,990 100.0% 45,649 100.0% 25,105 100.0% 53,022 100.0% 29,530 100.0% 4,425 17.6%
Interest earned on loans 32,677 86.0% 39,288 86.1% 20,975 83.5% 43,962 82.9% 24,347 82.4% 3,372 16.1%
Interest earned on due from banks 99 0.3% 82 0.2% 39 0.2% 105 0.2% 93 0.3% 54 137.4%
Interest earned on investments in securities 5,214 13.7% 6,279 13.8% 4,091 16.3% 8,955 16.9% 5,090 17.2% 999 24.4%
Financial Expenses 19,238 50.6% 23,847 52.2% 13,790 54.9% 28,922 54.5% 16,212 54.9% 2,422 17.6%
Gross financial results 18,752 49.4% 21,802 47.8% 11,315 45.1% 24,100 45.5% 13,317 45.1% 2,003 17.7%
Net fees 2,958 7.8% 4,289 9.4% 2,373 9.5% 5,300 10.0% 3,008 10.2% 635 26.8%
Financial results before reserves 21,710 57.1% 26,092 57.2% 13,687 54.5% 29,400 55.4% 16,325 55.3% 2,638 19.3%
Loan loss reserve 1,339 3.5% 1,652 3.6% 603 2.4% 2,588 4.9% 689 2.3% 86 14.3%
Reserve for impairment losses on investments in securities 204 0.5% 0 0.0% 0 0.0% 0 0.0% 0 0.0% 0 -
Financial results after reserves 20,167 53.1% 24,440 53.5% 13,085 52.1% 26,812 50.6% 15,636 53.0% 2,552 19.5%
Dividends income 4 0.0% 4 0.0% 2 0.0% 5 0.0% 2 0.0% (1) -27.9%
Gain on sale of securities 1,045 2.7% 932 2.0% 185 0.7% 676 1.3% 1,448 4.9% 1,263 682.4%
Other 1,480 3.9% 2,564 5.6% 1,700 6.8% 5,299 10.0% 2,138 7.2% 438 25.7%
Other income (expenses) 2,529 6.7% 3,500 7.7% 1,888 7.5% 5,980 11.3% 3,588 12.1% 1,700 90.1%
Total operating income, net 22,695 59.7% 27,940 61.2% 14,972 59.6% 32,792 61.8% 19,224 65.1% 4,252 28.4%
General and administrative expenses 14,488 38.1% 17,013 37.3% 9,669 38.5% 20,661 39.0% 11,239 38.1% 1,570 16.2%
General operating expenses 6,450 17.0% 6,438 14.1% 3,780 15.1% 8,384 15.8% 4,743 16.1% 963 25.5%
Employee expenses and other compensations 7,541 19.8% 9,085 19.9% 5,101 20.3% 10,622 20.0% 5,625 19.0% 524 10.3%
Depreciation and amortization 497 1.3% 1,490 3.3% 788 3.1% 1,654 3.1% 871 3.0% 84 10.6%
Profits before income taxes 8,208 21.6% 10,927 23.9% 5,303 21.1% 12,131 22.9% 7,984 27.0% 2,681 50.6%
Income taxes 1,335 3.5% 1,079 2.4% 535 2.1% 1,013 1.9% 917 3.1% 382 71.3%
NET INCOME 6,873 18.1% 9,848 21.6% 4,768 19.0% 11,118 21.0% 7,067 23.9% 2,300 48.2%
%
Dec.12 % Dec.14 %
Dec.14Dec.13 %%Dec.12 Jun.14 %Jun.15 /
Jun.14
%
Variation
Jun.14 %Jun.15 /
Dec.14Jun.15 %
Jun.15 %
Dec.13 %%
Variation
12
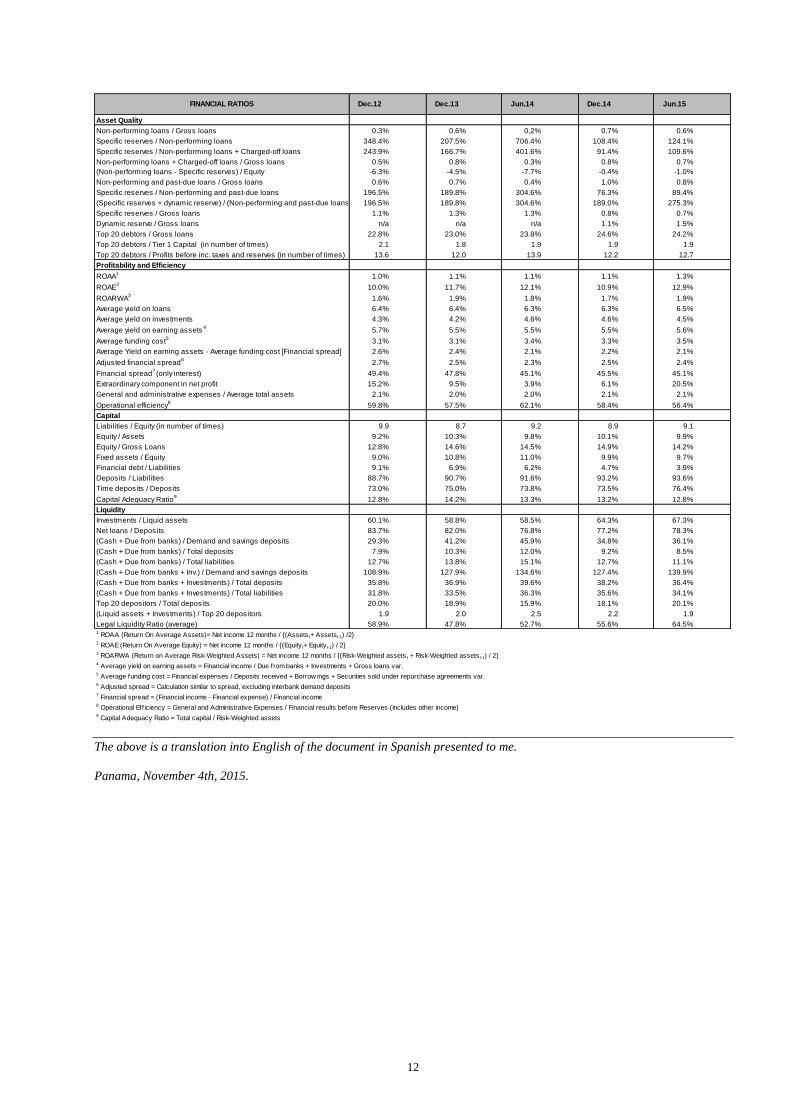
Asset Quality
Non-performing loans / Gross loans 0.3% 0.6% 0.2% 0.7% 0.6%
Specific reserves / Non-performing loans 348.4% 207.5% 706.4% 108.4% 124.1%
Specific reserves / Non-performing loans + Charged-off loans 243.9% 166.7% 401.6% 91.4% 109.6%
Non-performing loans + Charged-off loans / Gross loans 0.5% 0.8% 0.3% 0.8% 0.7%
(Non-performing loans - Specific reserves) / Equity -6.3% -4.5% -7.7% -0.4% -1.0%
Non-performing and past-due loans / Gross loans 0.6% 0.7% 0.4% 1.0% 0.8%
Specific reserves / Non-performing and past-due loans 196.5% 189.8% 304.6% 76.3% 89.4%
(Specific reserves + dynamic reserve) / (Non-performing and past-due loans) 196.5% 189.8% 304.6% 189.0% 275.3%
Specific reserves / Gross loans 1.1% 1.3% 1.3% 0.8% 0.7%
Dynamic reserve / Gross loans n/a n/a n/a 1.1% 1.5%
Top 20 debtors / Gross loans 22.8% 23.0% 23.8% 24.6% 24.2%
Top 20 debtors / Tier 1 Capital (in number of times) 2.1 1.8 1.9 1.9 1.9
Top 20 debtors / Profits before inc. taxes and reserves (in number of times) 13.6 12.0 13.9 12.2 12.7
Profitability and Efficiency
ROAA1
1.0% 1.1% 1.1% 1.1% 1.3%
ROAE2
10.0% 11.7% 12.1% 10.9% 12.9%
ROARWA3
1.6% 1.9% 1.8% 1.7% 1.9%
Average yield on loans 6.4% 6.4% 6.3% 6.3% 6.5%
Average yield on investments 4.3% 4.2% 4.6% 4.6% 4.5%
Average yield on earning assets4
5.7% 5.5% 5.5% 5.5% 5.6%
Average funding cost5
3.1% 3.1% 3.4% 3.3% 3.5%
Average Yield on earning assets - Average funding cost [Financial spread] 2.6% 2.4% 2.1% 2.2% 2.1%
Adjusted financial spread6
2.7% 2.5% 2.3% 2.5% 2.4%
Financial spread7 (only interest) 49.4% 47.8% 45.1% 45.5% 45.1%
Extraordinary component in net profit 15.2% 9.5% 3.9% 6.1% 20.5%
General and administrative expenses / Average total assets 2.1% 2.0% 2.0% 2.1% 2.1%
Operational efficiency8
59.8% 57.5% 62.1% 58.4% 56.4%
Capital
Liabilities / Equity (in number of times) 9.9 8.7 9.2 8.9 9.1
Equity / Assets 9.2% 10.3% 9.8% 10.1% 9.9%
Equity / Gross Loans 12.8% 14.6% 14.5% 14.9% 14.2%
Fixed assets / Equity 9.0% 10.8% 11.0% 9.9% 9.7%
Financial debt / Liabilities 9.1% 6.9% 6.2% 4.7% 3.9%
Deposits / Liabilities 88.7% 90.7% 91.6% 93.2% 93.6%
Time deposits / Deposits 73.0% 75.0% 73.8% 73.5% 76.4%
Capital Adequacy Ratio9
12.8% 14.2% 13.3% 13.2% 12.8%
Liquidity
Investments / Liquid assets 60.1% 58.8% 58.5% 64.3% 67.3%
Net loans / Deposits 83.7% 82.0% 76.8% 77.2% 78.3%
(Cash + Due from banks) / Demand and savings deposits 29.3% 41.2% 45.9% 34.8% 36.1%
(Cash + Due from banks) / Total deposits 7.9% 10.3% 12.0% 9.2% 8.5%
(Cash + Due from banks) / Total liabilities 12.7% 13.8% 15.1% 12.7% 11.1%
(Cash + Due from banks + Inv.) / Demand and savings deposits 108.9% 127.9% 134.6% 127.4% 139.9%
(Cash + Due from banks + Investments) / Total deposits 35.8% 36.9% 39.6% 38.2% 36.4%
(Cash + Due from banks + Investments) / Total liabilities 31.8% 33.5% 36.3% 35.6% 34.1%
Top 20 depositors / Total deposits 20.0% 18.9% 15.9% 18.1% 20.1%
(Liquid assets + Investments) / Top 20 depositors 1.9 2.0 2.5 2.2 1.9
Legal Liquidity Ratio (average) 58.9% 47.8% 52.7% 55.6% 64.5%1 ROAA (Return On Average Assets)= Net income 12 months / {(Assets t+ Assets t-1) /2}2 ROAE (Return On Average Equity) = Net income 12 months / {(Equity t+ Equityt-1) / 2}3 ROARWA (Return on Average Risk-Weighted Assets) = Net income 12 months / {(Risk-Weighted assets t + Risk-Weighted assets t-1) / 2}4 Average yield on earning assets = Financial income / Due from banks + Investments + Gross loans var.5 Average funding cost = Financial expenses / Deposits received + Borrow ings + Securities sold under repurchase agreements var.6 Adjusted spread = Calculation similar to spread, excluding interbank demand deposits7 Financial spread = (Financial income - Financial expense) / Financial income8 Operational Eff iciency = General and Administrative Expenses / Financial results before Reserves (Includes other income)9 Capital Adequacy Ratio = Total capital / Risk-Weighted assets
Dec.14FINANCIAL RATIOS Dec.12 Jun.14Dec.13 Jun.15
The above is a translation into English of the document in Spanish presented to me.
Panama, November 4th, 2015.