METRO MANILA - Knight Frankcontent.knightfrank.com/research/1257/documents/en/metro-manila... ·...
10
RESEARCH METRO MANILA REAL ESTATE SECTOR REVIEW METRO MANILA MARKET UPDATE Q2 2017
Transcript of METRO MANILA - Knight Frankcontent.knightfrank.com/research/1257/documents/en/metro-manila... ·...

RESEARCH
METRO MANILA REAL ESTATE SECTOR REVIEW
METRO MANILAMARKET UPDATE Q2 2017
REAL ESTATE BOOM STRENGTHENS AMIDST GLOBAL CONCERNS AND ISSUESGoing through the newspapers every day, you will come across various articles that speak of fears offinancial market destabilization brought about by new administrations and their corresponding planned policychanges, continuing warfare and conflict in the Middle East and Mindanao, and rising reports of crime andterrorism. Nevertheless, the negative effect on perception is deemed short term and reactions fade overtime. Moreover, the constant increase in local real estate property prices, comparing second quarternumbers from previous periods, and several other continuously improving indicators clearly demonstrate thatinvestor confidence in Metro Manila and the rest of the country remains solid and unwavering.
The Office Market The upward momentum of theoffice market is still credited to thecountry’s bullish economy, youngdemographics and consumption-driven market. Despite the varioushappenings in the international andlocal environment, investors appearto keep the “business as usual”mindset. The financial gains,income potential and theattractiveness of doing business inthe Philippines remain pervasiveand unparalleled. The Philippinelabor force’s proficiency in English,flexibility in work schedules andcheap labor cost are consistentlysought after by employers andcompany owners.
Take up of office spaces in MetroManila remained fast as overallvacancy rate continued to declineto 3.51% in the second quarter of2017 from 4.60% in the sameperiod last year.
The Residential MarketThe Philippine real estate marketstays mainly driven by the vigorousoffice sector. Residential demandcomes from office workers lookingto rent space near their respectiveplaces of work, especially due tothe worsening traffic situation inMetro Manila.
Residential prices continue toescalate across all marketsegments as residential demandsimilarly rises. Selling prices averagePHP74,000 per square meter,PHP115,000 per square meter,PHP171,000 per square meter, andPHP225,000 per square meter forAffordable, Middle, High-end andLuxury projects, respectively.
The Retail Market
The Retail Market grows togetherwith the Office and ResidentialSectors. Convenience remains tobe a major factor considered byproperty developers in theconceptualization and planning ofvarious real estate projects. AyalaLand Inc. (ALI) has about 150,000square meters of Gross LeasableArea in its 2017 Metro Manilaconstruction pipeline.
Retail openings continue with majormall developers announcing variousprovincial expansions. Vista Landtargets to construct commercialcenters in 200 cities andmunicipalities as an integralcomponent of its mixed-useprojects. In addition, RobinsonsLand Corporation (RLC) is set toopen two new shopping malls inLeyte, one in Naga and another onein Iligan this year. At the end of2016, RLC shopping malls had aGross Leasable Area of 1.3 Millionsquare meters. With the scheduledopening of new RLC shopping mallsthis year, the total GLA will increaseby 9% to 1.39 Million squaremeters.
Further to this, SM InvestmentsCorp. wishes to widen its marketpenetration across all retail formats,not limited to shopping malls andsupermarkets, in 2017. SM aspiresto cater to the evolving needs andpreferences of its customersthrough diverse and qualityproduces and enhanced customerexperience.
The Industrial Market
Further to the growth of the RetailSector, the need for warehouses,storage areas and betterdistribution channels fortifies.Around 160 operating enterpriseswere registered with the PhilippineEconomic Zone Authority (PEZA) asof April 30, 2017. These arebusinesses engaged in activitiessuch as Business ProcessOutsourcing, Food Products &Beverages, IT Research &Development, and Real EstateServices and Development.
The Hospitality Market
The Hospitality Market experiencesprogress as the number of visitorarrivals in the country continues toincrease. Latest reports show ayear-to-date year-on-year visitorarrivals growth of almost 15%. Thisbullishness draws investments inoffice, residential and retaildevelopments nationwide thattarget the growing touristpopulation.
2
6.4% y-o-y Q1 2017 GDP
2.8% (Jun 2017)Inflation Rate
4.5% (Jan-May 2017)OFW Remittances
5.6% (Jun 2017)Avg. Bank Lending
2.09% (Jun 2017)91-day T-Bill
49.86 (Q2 2017)Avg. PHP-USD
SNAPSHOTS | Economic Indicators
OFFICE MARKET DISPLAYS CONTINUOUS GROWTH, NO SIGNS OF SLOWING DOWN
3
Office | Makati office market outperforming the other Central Business Districts
The office sector continues toexpand with new buildings recentlydelivered and several others forturnover this year. Over 1.2 millionsquare meters of office GrossLeasable Area (GLA) are presentlyin the supply pipeline. In addition,office space take-up remainspositive as the Philippines maintainsits position of being an attractiveinbound investment destination.Moreover, the office rental rateshave been constantly growingannually at a rate of 5-6%, asinvestors capitalize on the country’sfavorable demographics, strongdollar, competitive labor cost andcontinuous infrastructuredevelopment.
The office market is mainly drivenby the robust IT-BPO industry. Asreported by the InformationTechnology and Business ProcessAssociation of the Philippines(IBPAP), the number of Full TimeEmployees (FTE) in the IT-BPOsector almost doubled from777,000 employees in 2013 to1,146,000 employees in 2016 (5years) and by 2022, the number ofFTEs would have gone up to1,800,000 employees.
The Offshore Gaming Industry is anemerging industry that is likewiseboosting office market growth. In2016, the Philippine Amusementand Gaming Corporation (PAGCOR)issued 35 offshore gaming licenses.PAGCOR’s reported that a total of75 applications are presently beingevaluated.
The office sector rises above thevarious issues and concerns withinthe market. In the second quarter of2017, a slight increase in quarter-on-quarter vacancy was registered.Metro Manila’s vacancy
rose to 3.51% from the firstquarter’s 2.85% vacancy rate. Thenumber of vacant spaces in mostbusiness districts grew, with specialnote on Bonifacio Global City (BGC)and Bay area, due to the newsupply from recently completedoffice buildings.
Vacancy in BGC was pegged at2.23%, lower than last year’s2.60%. Newly turned over buildingsinclude Ore Central, Inoza Tower,and World Plaza. These new officeprojects added a total of 74,158square meters of GLA. The largestvacancy can be attributed to OreCentral, with an availability of about52.11% since its opening in May ofthis year.
Bay Area’s vacancy rose to above1% in the second quarter of 2017,with vacancy recorded at 1.67%.Bay Area had an additional 58,758square meters of office GLA comingfrom 3 newly constructed buildings.These projects include iMet byFederal Land Inc., and FilinvestCyberzone Buildings B and C byFilinvest Land Inc.
Filinvest Land Inc. recently turnedover Buildings B and C, which areboth fully leased out. Buildings Aand D are scheduled to becompleted by Q2 2018. FilinvestCyberzone in Pasay features fouroffice towers, having seven floorseach. The first two office buildingshave a combined GLA of 36,438.30square meters while the remainingtwo towers have 28,220.90 squaremeters of GLA.
No buildings were turned over andno new supply was added to theMakati, Alabang, Ortigas, andQuezon City office markets. Whilethe vacancy of the other CBDmarginally grew in the second
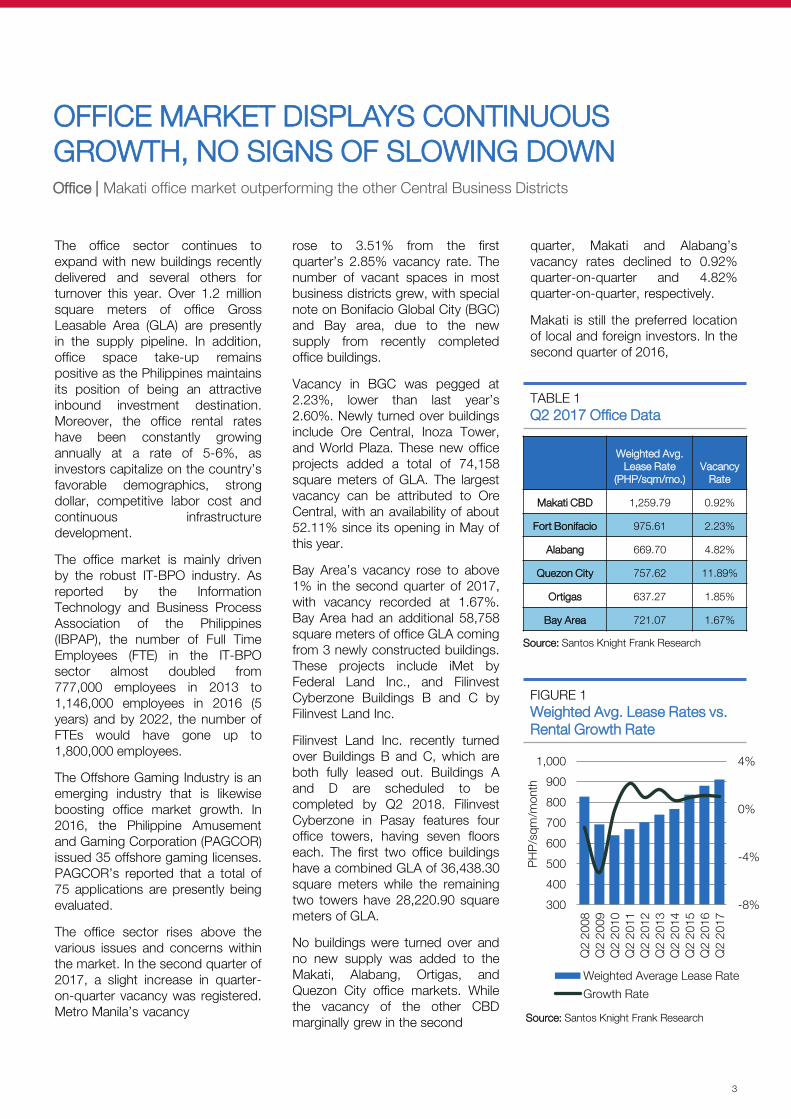
TABLE 1Q2 2017 Office Data
Source: Santos Knight Frank Research
FIGURE 1Weighted Avg. Lease Rates vs. Rental Growth Rate
Weighted Avg. Lease Rate
(PHP/sqm/mo.)Vacancy
Rate
Makati CBD 1,259.79 0.92%
Fort Bonifacio 975.61 2.23%
Alabang 669.70 4.82%
Quezon City 757.62 11.89%
Ortigas 637.27 1.85%
Bay Area 721.07 1.67%
-8%
-4%
0%
4%
300
400
500
600
700
800
900
1,000
Q2
2008
Q2
2009
Q2
2010
Q2
2011
Q2
2012
Q2
2013
Q2
2014
Q2
2015
Q2
2016
Q2
2017
PH
P/s
qm/m
onth
Weighted Average Lease Rate
Growth Rate
Source: Santos Knight Frank Research
quarter, Makati and Alabang’svacancy rates declined to 0.92%quarter-on-quarter and 4.82%quarter-on-quarter, respectively.
Makati is still the preferred locationof local and foreign investors. In thesecond quarter of 2016,
4
Rental rates in Bonifacio GlobalCity, Ortigas, and Bay area werenoted at PHP975.61, PHP637.27,and PHP721.07 per square meterper month, respectively. The askinglease rates are continuously rising,with Bay Area leading all the otherMetro Manila CBD. The lease ratesin Bay City grew by 11.25% year-on-year, coming from a prolongedperiod of zero price increase. BayArea was distantly followed byBonifacio Global City with a 6.76%year-on-year rental growth rate.Furthermore, no movement wasnoted in the weighted average leaserates of Alabang and Quezon City,which are at PHP669.70 andPHP757.62 per square meter permonth, respectively.
Makati’s vacancy was recorded at2.35%. At present, this number hassignificantly decreased to below1%. Additionally, the Q2 2017 rentalgrowth rate of the Makati CentralBusiness District (CBD) wasmeasured at 9.68% year-on-year,which is higher compared to lastyear’s 4.66%. Weighted averagelease rate was documented atPHP1,259.79, still the highestamongst the Metro Manila CBD.The average lease rate of primeoffices in Makati was pegged atPHP1,492.64 per square meter permonth, while the rental rates ofGrade A buildings were at anaverage of PHP1,078.05 per squaremeter per month.
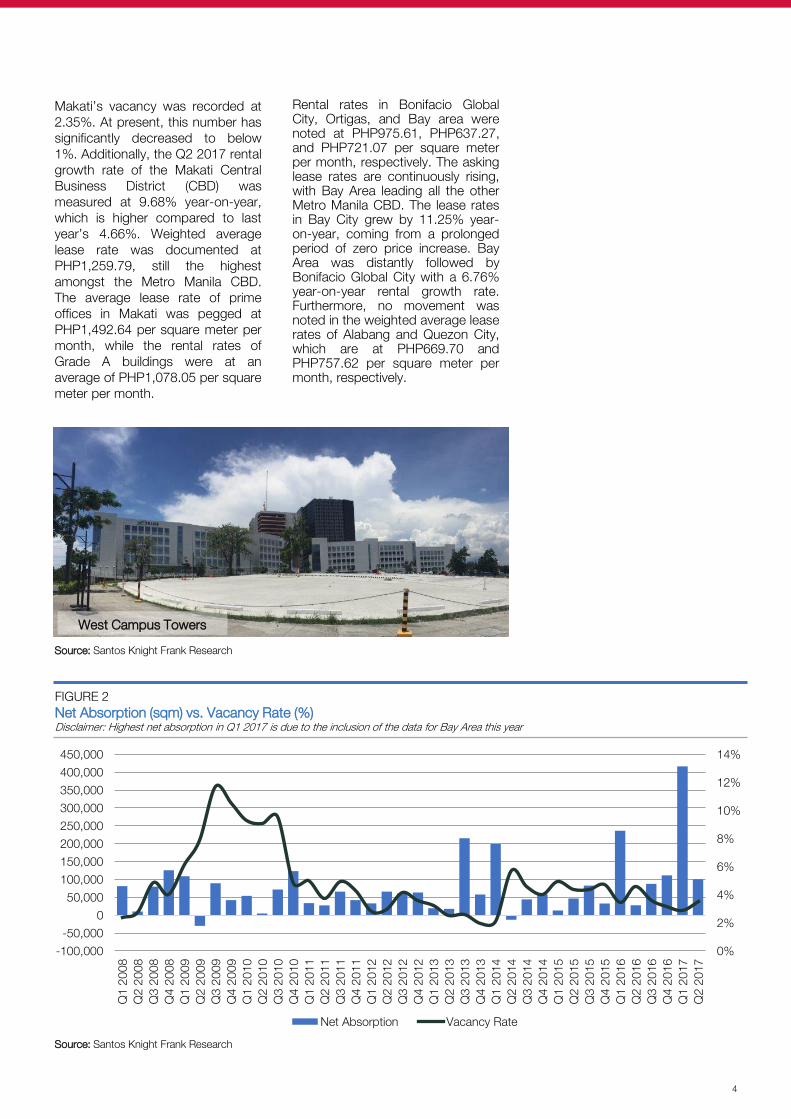
FIGURE 2 Net Absorption (sqm) vs. Vacancy Rate (%)Disclaimer: Highest net absorption in Q1 2017 is due to the inclusion of the data for Bay Area this year
0%
2%
4%
6%
8%
10%
12%
14%
-100,000
-50,000
0
50,000
100,000
150,000
200,000
250,000
300,000
350,000
400,000
450,000
Q1
2008
Q2
2008
Q3
2008
Q4
2008
Q1
2009
Q2
2009
Q3
2009
Q4
2009
Q1
2010
Q2
2010
Q3
2010
Q4
2010
Q1
2011
Q2
2011
Q3
2011
Q4
2011
Q1
2012
Q2
2012
Q3
2012
Q4
2012
Q1
2013
Q2
2013
Q3
2013
Q4
2013
Q1
2014
Q2
2014
Q3
2014
Q4
2014
Q1
2015
Q2
2015
Q3
2015
Q4
2015
Q1
2016
Q2
2016
Q3
2016
Q4
2016
Q1
2017
Q2
2017
Net Absorption Vacancy Rate
Source: Santos Knight Frank Research
Source: Santos Knight Frank Research
West Campus Towers
MARKET PLAYERS BANK ON EMERGING BUSINESS CENTERSResidential | Central Business Districts enjoy double-digit demand
5
Investor-driven demand continuedto bolster the local condominiumsales market in the second quarterof 2017. Residential sales demandacross major central businessdistricts (CBD) in Metro Manilaremained vigorous despite theslower-than-expected growth of thePhilippines Gross Domestic Product(GDP) in the previous quarter.Foreign and local investors took intoaccount not only the country’sbroadest measure of economicperformance but also otherrelatively significant factors, whichprove that the Philippines is aworthy choice for residentialinvestment.
Among the factors include thecountry’s positive and stableinvestment grade ratings, the ‘build,build, build’ infrastructure programof the current administration,modest employment rateunderpinned by the growingmillennial workforce, and also thesustained performance of other realestate segments. These droveproperty investors to maintain apositive outlook on the residentialmarket and, most importantly, todelve into the huge investmentpotential of emerging businesscenters in Metro Manila.
In Pasay City, the immense marketactivity in Bay Area continued topush average monthly take-up rateson an upward course. Afterregistering an average monthly saleof 51 units as of October last year,units sold per month now stands atan average of 70 units. About 91%were already absorbed, mostly byinvestors in which some werereported to have purchased units inbulk or on a per floor basis. SResidences, the three-towerdevelopment of SMDC, was alreadysold out after it was launched a yearago.
Residential developments in ArcaSouth, on the other hand, alsoenjoy brisk take-up. Envisioned tobe the country’s next BonifacioGlobal City (BGC) in Taguig, thefuture developments, particularlyoffice buildings that will cater to theBusiness Process Outsourcing(BPO) industry, captured a lot ofproperty investors and buyers. Theupcoming middle income project ofAvida Land, Avida Towers OneUnion Place, already fully exhaustedits inventory introduced in 2014.The second building, Avida TowersVireo, will be launched this yearfurther catering to the still hugeunserved demand. Approximately55% of the Vireo inventory hasalready received interests, throughLetter of Intent (LOI), mostly frominvestment buyers.
On the high-end segment, about95% of Alveo Land’s The Verandais presently taken-up by the market.AyalaLand Premier, meanwhile,recently launched the third block ofits Arbor Lanes project in which61% of the units were sold duringthe first month alone. Other thaninvestors, demand for such projectsmostly came from Overseas FilipinoWorkers (OFW),
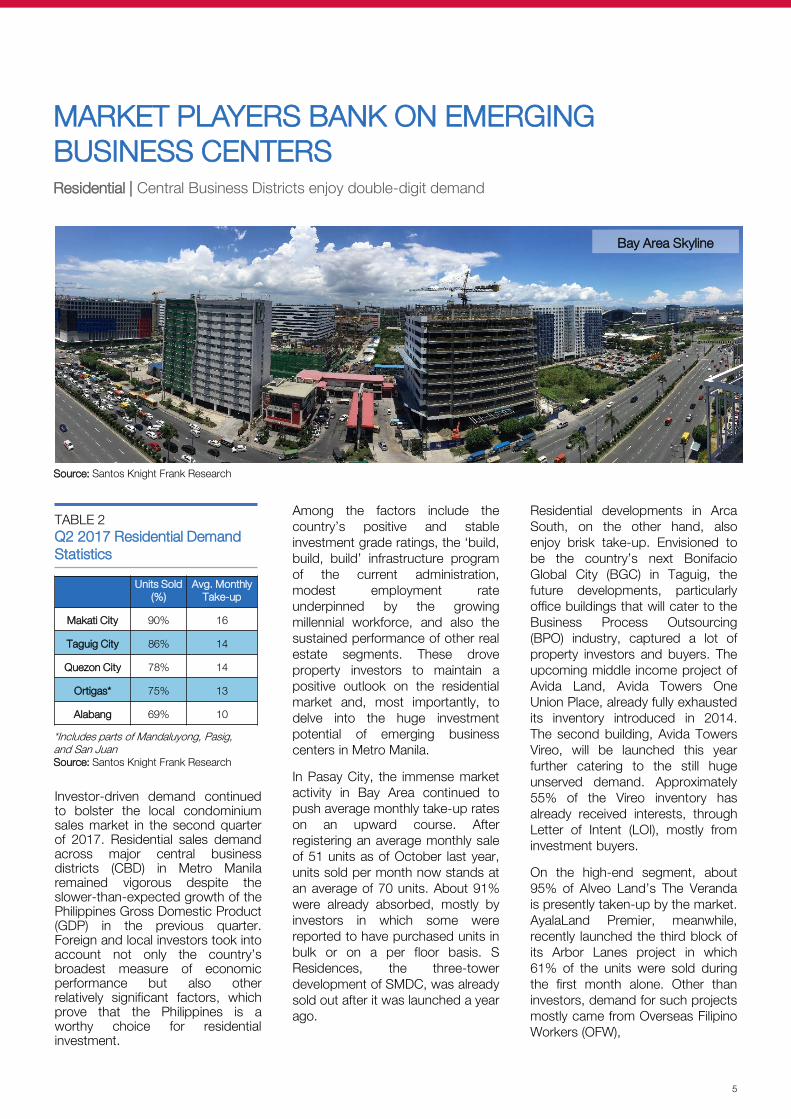
Bay Area Skyline
Source: Santos Knight Frank Research
TABLE 2Q2 2017 Residential Demand Statistics
Units Sold (%)
Avg. Monthly Take-up
Makati City 90% 16
Taguig City 86% 14
Quezon City 78% 14
Ortigas* 75% 13
Alabang 69% 10
*Includes parts of Mandaluyong, Pasig, and San JuanSource: Santos Knight Frank Research
6
in Arca South grew by acompounded annual growth rate of15% from approximatelyPHP150,000 per sq.m. in 2013.This latest transaction reflectscapital appreciation in the realestate market and is also one of thereasons that market playerscontinue to post an optimisticviewpoint of Philippine Real Estate.
and expatriates who wanted to ownunits instead of rent.
Supported by the robust demand,selling prices of residentialcondominiums in the Bay Area andArca South are continuouslybecoming competitive. Dominatedby middle and high-end projects,prices range from approximatelyPHP117,000 to PHP175,200 andPHP132,400 up to PHP190,400 persquare meter (sq.m.) in the saidemerging business centers,respectively.
On the development side, propertydevelopers continue their search foravailable developable lands in theMetro. While properties situatedwithin CBDs remain a top priority,venturing into emerging businesscenters that follow township-likeconcepts proves to be a viableoption for desired expansion anddiversification activities. Althoughthe locations might be consideredas fringe areas, emerging businesscenters are still in close proximity toCBDs and commercial areas, andtransportation is readily availableand easily accessible.
In the middle of the second quarter,Megaworld Corporation was able totap the upscale market through thelaunching of its luxury residentialdevelopment in McKinely West. TheKingsley at The Albany is a mid-riseluxury condominium offering only 64units, with sizes ranging from 123 to349 square meters. Selling pricesstart at approximately PHP243,600per sq.m. and are expected toreach around PHP300,000 persq.m. in the coming quarters.
In addition, Arthaland recentlyacquired a 4,000-sq.m. landbank inArca South as part of its portfolioexpansion and diversificationstrategy. The land is intended fordevelopment of a commercial or amixed-use project. The Company’sacquisition of the land was reportedto cost about PHP1.05 Billion oraround PHP262,500 per sq.m.,suggesting that land values
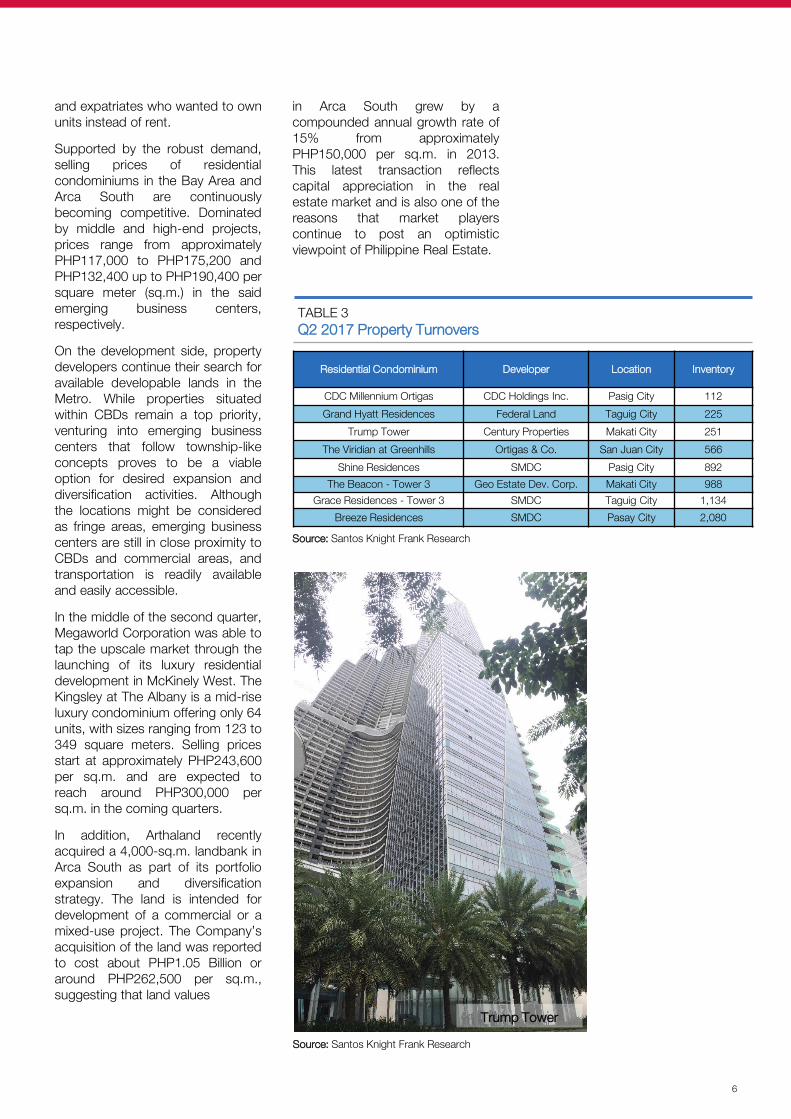
Residential Condominium Developer Location Inventory
CDC Millennium Ortigas CDC Holdings Inc. Pasig City 112
Grand Hyatt Residences Federal Land Taguig City 225
Trump Tower Century Properties Makati City 251
The Viridian at Greenhills Ortigas & Co. San Juan City 566
Shine Residences SMDC Pasig City 892
The Beacon - Tower 3 Geo Estate Dev. Corp. Makati City 988
Grace Residences - Tower 3 SMDC Taguig City 1,134
Breeze Residences SMDC Pasay City 2,080
TABLE 3Q2 2017 Property Turnovers
Source: Santos Knight Frank Research
Source: Santos Knight Frank Research
Trump Tower
BULLISH RETAIL ACTIVITIES RAMP UP EXPANSION
Retail | Young demographics to bolster active consumption
7
Business activities in the Philippineretail market was buoyant in thesecond quarter of the year, asconsumer spending increasedbacked by the rising tourist arrivalsand foreign remittances during thesummer season. Higher level ofsalaries and flourishing businessescreated and supported the growingconsumer demand.
Expenditures for food and non-alcoholic beverages dominated thetotal household expenditurefollowed by housing utilities andtransport costs. Spending on othernon-essential goods is projected toincrease in the short run, particularlyspending on clothing and footwear,and personal health care.
Several retail malls in the Metrowere opened targeting the hugedemand generated from mixed-usedevelopments. Moreover, thecountry’s young demographics isexpected to further push retaildemand. Majority of the luxuryconsumption spending were by themillennials and they make up mostof today’s workforce.
Entry of luxury brands is veryevident especially in the clothingand footwear industry.Nevertheless, openings in the foodand beverages industry have beenwidely noticeable and constitutemost of the demand coming fromhouseholds.
Portfolio diversifications andexpansions are still recurring trendsin the retail industry. Some of thenewer trends are the inclusion ofmore green areas, parks andrecreational activity centers, publicart museum or arts and craftssection, and al-fresco restaurantsand other culinary concepts.Opening of homeware brands is avery popular emerging trend ashomeware products are marketedas “must haves” to jump start yourpersonal home space or officespace.
Galleon Museum in SM Mall of Asiais an example of an innovativeconcept that is becoming anoticeable trend. The museum isexpected to be finished andunveiled within the year. It willfeature the rich history of globaltrade in the country and will occupya gross floor area of more than200,000 sqm, making SM Mall ofAsia regain its title of being thelargest mall in the Philippines.
Robinsons Magnolia, the retailsegment of the mixed-use projectMagnolia Residences, will also beexpanding its area, encouragingmore family-oriented activitiesthrough an open-air green plaza, al-fresco dining and more foodchoices, additional cinemas, familyamusement center, and an air-conditioned chapel. The expansionwill also include a five-storey officesegment and is expected to becompleted by 2018.
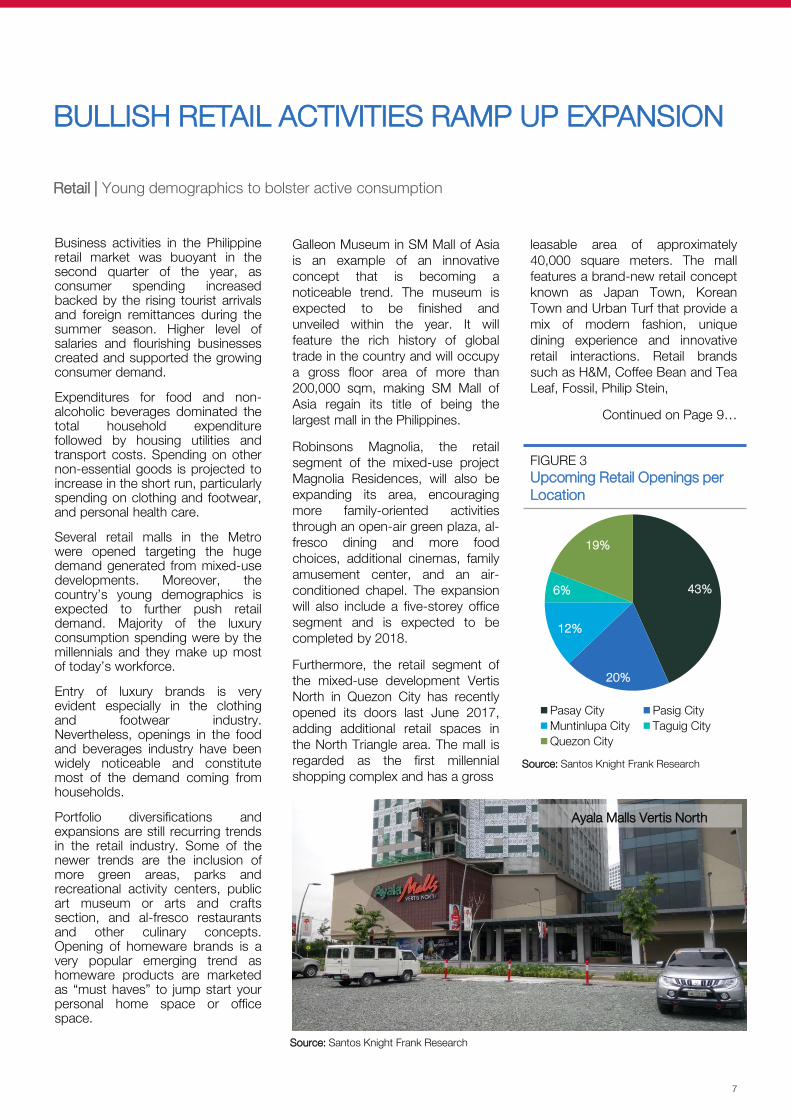
Furthermore, the retail segment ofthe mixed-use development VertisNorth in Quezon City has recentlyopened its doors last June 2017,adding additional retail spaces inthe North Triangle area. The mall isregarded as the first millennialshopping complex and has a gross
leasable area of approximately40,000 square meters. The mallfeatures a brand-new retail conceptknown as Japan Town, KoreanTown and Urban Turf that provide amix of modern fashion, uniquedining experience and innovativeretail interactions. Retail brandssuch as H&M, Coffee Bean and TeaLeaf, Fossil, Philip Stein,
Continued on Page 9…
Source: Santos Knight Frank Research
Ayala Malls Vertis North
FIGURE 3Upcoming Retail Openings per Location
Source: Santos Knight Frank Research
43%
20%
12%
6%
19%
Pasay City Pasig CityMuntinlupa City Taguig CityQuezon City
INVESTMENT PLEDGES TO RAMP UP ECOZONE DEVELOPMENTIndustrial | Sector growth and positive outlook sustained
8
The Philippines continues to be oneof the most attractive foreigninvestment destination amongSouth East Asian countries. Withthe government’s thrust of rampingup infrastructure projects, investoroptimism is sustained, backed bystrong macroeconomicfundamentals. Economic forecastsfor the industrial market remainpositive, attributed by the bullishbehavior of foreign investors andthe notable high influx of foreigninvestment pledges. With thecurrent state of the economy andplanned reforms, the businessenvironment in the countrybecomes more conducive forinvestments.
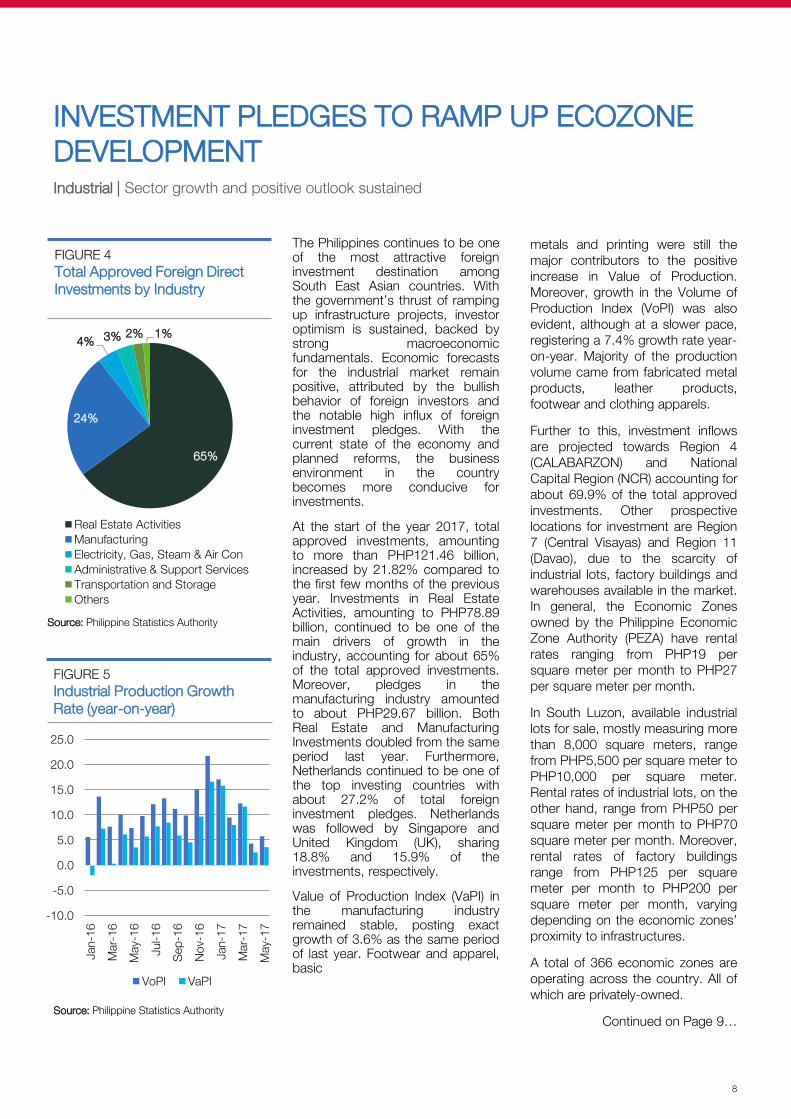
At the start of the year 2017, totalapproved investments, amountingto more than PHP121.46 billion,increased by 21.82% compared tothe first few months of the previousyear. Investments in Real EstateActivities, amounting to PHP78.89billion, continued to be one of themain drivers of growth in theindustry, accounting for about 65%of the total approved investments.Moreover, pledges in themanufacturing industry amountedto about PHP29.67 billion. BothReal Estate and ManufacturingInvestments doubled from the sameperiod last year. Furthermore,Netherlands continued to be one ofthe top investing countries withabout 27.2% of total foreigninvestment pledges. Netherlandswas followed by Singapore andUnited Kingdom (UK), sharing18.8% and 15.9% of theinvestments, respectively.
Value of Production Index (VaPI) inthe manufacturing industryremained stable, posting exactgrowth of 3.6% as the same periodof last year. Footwear and apparel,basic
metals and printing were still themajor contributors to the positiveincrease in Value of Production.Moreover, growth in the Volume ofProduction Index (VoPI) was alsoevident, although at a slower pace,registering a 7.4% growth rate year-on-year. Majority of the productionvolume came from fabricated metalproducts, leather products,footwear and clothing apparels.
Further to this, investment inflowsare projected towards Region 4(CALABARZON) and NationalCapital Region (NCR) accounting forabout 69.9% of the total approvedinvestments. Other prospectivelocations for investment are Region7 (Central Visayas) and Region 11(Davao), due to the scarcity ofindustrial lots, factory buildings andwarehouses available in the market.In general, the Economic Zonesowned by the Philippine EconomicZone Authority (PEZA) have rentalrates ranging from PHP19 persquare meter per month to PHP27per square meter per month.
In South Luzon, available industriallots for sale, mostly measuring morethan 8,000 square meters, rangefrom PHP5,500 per square meter toPHP10,000 per square meter.Rental rates of industrial lots, on theother hand, range from PHP50 persquare meter per month to PHP70square meter per month. Moreover,rental rates of factory buildingsrange from PHP125 per squaremeter per month to PHP200 persquare meter per month, varyingdepending on the economic zones’proximity to infrastructures.
A total of 366 economic zones areoperating across the country. All ofwhich are privately-owned.
Continued on Page 9…
65%
24%
4% 3% 2% 1%
Real Estate ActivitiesManufacturingElectricity, Gas, Steam & Air ConAdministrative & Support ServicesTransportation and StorageOthers
FIGURE 5Industrial Production Growth Rate (year-on-year)
FIGURE 4Total Approved Foreign Direct Investments by Industry
Source: Philippine Statistics Authority
-10.0
-5.0
0.0
5.0
10.0
15.0
20.0
25.0
Jan-
16
Mar
-16
May
-16
Jul-1
6
Sep
-16
Nov
-16
Jan-
17
Mar
-17
May
-17
VoPI VaPI
Source: Philippine Statistics Authority
9
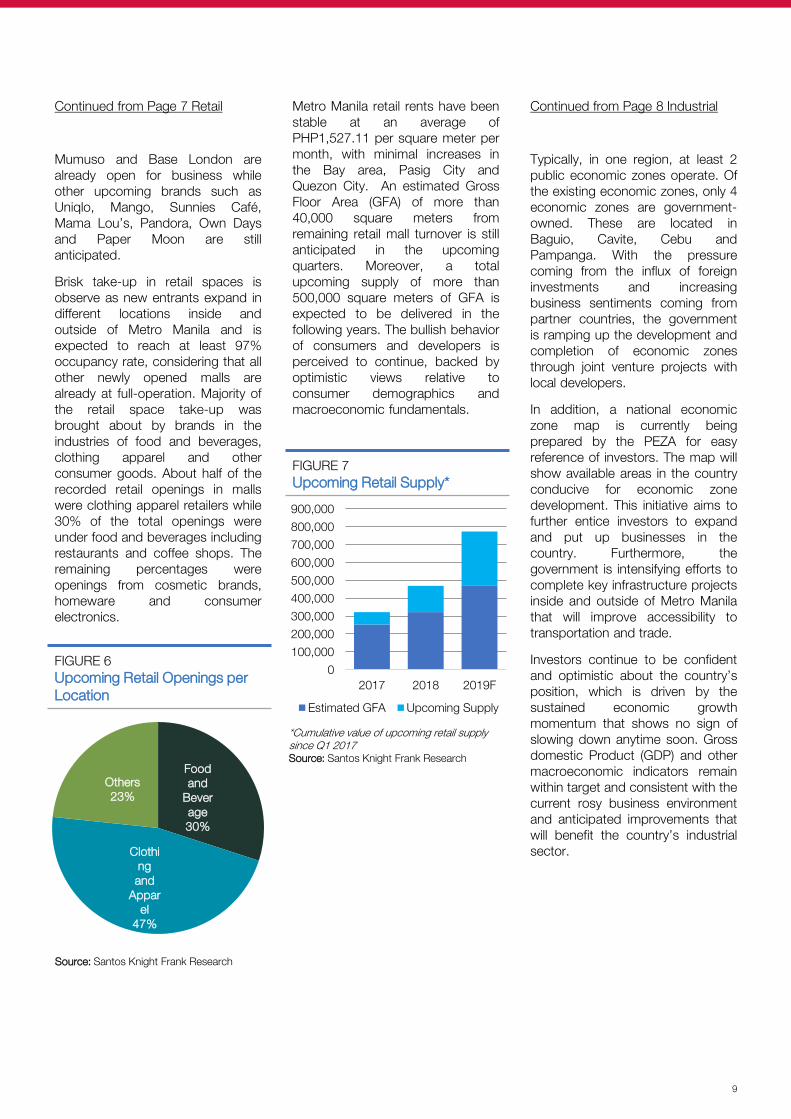
Metro Manila retail rents have beenstable at an average ofPHP1,527.11 per square meter permonth, with minimal increases inthe Bay area, Pasig City andQuezon City. An estimated GrossFloor Area (GFA) of more than40,000 square meters fromremaining retail mall turnover is stillanticipated in the upcomingquarters. Moreover, a totalupcoming supply of more than500,000 square meters of GFA isexpected to be delivered in thefollowing years. The bullish behaviorof consumers and developers isperceived to continue, backed byoptimistic views relative toconsumer demographics andmacroeconomic fundamentals.
Continued from Page 8 Industrial
Typically, in one region, at least 2public economic zones operate. Ofthe existing economic zones, only 4economic zones are government-owned. These are located inBaguio, Cavite, Cebu andPampanga. With the pressurecoming from the influx of foreigninvestments and increasingbusiness sentiments coming frompartner countries, the governmentis ramping up the development andcompletion of economic zonesthrough joint venture projects withlocal developers.
In addition, a national economiczone map is currently beingprepared by the PEZA for easyreference of investors. The map willshow available areas in the countryconducive for economic zonedevelopment. This initiative aims tofurther entice investors to expandand put up businesses in thecountry. Furthermore, thegovernment is intensifying efforts tocomplete key infrastructure projectsinside and outside of Metro Manilathat will improve accessibility totransportation and trade.
Investors continue to be confidentand optimistic about the country’sposition, which is driven by thesustained economic growthmomentum that shows no sign ofslowing down anytime soon. Grossdomestic Product (GDP) and othermacroeconomic indicators remainwithin target and consistent with thecurrent rosy business environmentand anticipated improvements thatwill benefit the country’s industrialsector.
Continued from Page 7 Retail
Mumuso and Base London arealready open for business whileother upcoming brands such asUniqlo, Mango, Sunnies Café,Mama Lou’s, Pandora, Own Daysand Paper Moon are stillanticipated.
Brisk take-up in retail spaces isobserve as new entrants expand indifferent locations inside andoutside of Metro Manila and isexpected to reach at least 97%occupancy rate, considering that allother newly opened malls arealready at full-operation. Majority ofthe retail space take-up wasbrought about by brands in theindustries of food and beverages,clothing apparel and otherconsumer goods. About half of therecorded retail openings in mallswere clothing apparel retailers while30% of the total openings wereunder food and beverages includingrestaurants and coffee shops. Theremaining percentages wereopenings from cosmetic brands,homeware and consumerelectronics.
FIGURE 6Upcoming Retail Openings per Location
Source: Santos Knight Frank Research
FIGURE 7Upcoming Retail Supply*
0
100,000
200,000
300,000
400,000
500,000
600,000
700,000
800,000
900,000
2017 2018 2019F
Estimated GFA Upcoming Supply
*Cumulative value of upcoming retail supply since Q1 2017Source: Santos Knight Frank Research
Food and
Beverage30%
Clothing and
Apparel
47%
Others23%
Santos Knight Frank Research provides strategic advice, consultancy services and forecasting to awide range of clients worldwide including developers, investors, funding organizations, corporateinstitutions and the public sector. All our clients recognize the need for expert independent advicecustomized to their specific needs.
© Santos Knight Frank 2017This report is published for general information only and not to be relied upon in any way. Although high standardshave been used in the preparation of the information, analysis, views and projections presented in this report, noresponsibility or liability whatsoever can be accepted by Santos Knight Frank for any loss or damage resultant fromany use of, reliance on or reference to the contents of this document. As a general report, this material does notnecessarily represent the view of Santos Knight Frank in relation to particular properties or projects. Reproductionof this report in whole or in part is not allowed without prior written approval of Santos Knight Frank to the form andcontent within which it appears. Santos Knight Frank is a long-term franchise partnership registered in thePhilippines with registered number A199818549. Our registered office is 10/F Ayala Tower One, Ayala Ave., MakatiCity where you may look at a list of members’ names.
MANAGEMENT
Rick SantosChairman and CEO+63 917 528 [email protected]
TENANT REPRESENTATION &OFFICE AGENCY
Joey RadovanVice Chairman+63 920 906 [email protected]
INVESTMENTS AND CAPITAL MARKETS
Calvin JaviniarSenior Director+63 917 574 [email protected]
VALUATIONS
Mabel LunaDirector+63 917 865 [email protected]
RESIDENTIAL SERVICES
Yvette AcebedoDirector+63 917 574 [email protected]
ASSET SERVICES GROUP
Nelson Del MundoVice President+63 917 574 [email protected]
PROJECT MANAGEMENT
Allan NapolesExecutive Director+63 917 [email protected]
RESEARCH & CONSULTANCY
Jan CustodioSenior Director+63 917 574 [email protected]
Emlin JavillonarResearch Manager+63 917 888 [email protected]
Von SalazarResearch [email protected]
Christian OcampoResearch [email protected]
RECENT MARKET-LEADING RESEARCH PUBLICATIONS
Santos Knight Frank Research Reports are available at santos.knightfrank.ph/research
Manila Office10th Floor, Ayala Tower One & Exchange PlazaAyala Avenue, Makati City, 1226t: (632) 752-2580 / 848-7388f: (632) 752-2571w: www.santos.knightfrank.ph
Cebu OfficeUnit 30, 11th Floor, AppleOne Equicom Tower Mindanao Avenue & Biliran Road,Cebu Business Park, Cebu City 6000t: (6332) 318-0070 / 236-0462
Active Capital The Report 2017
The Wealth Report 2017
Asia Pacific Prime Office Rental Index Q1 2017
Metro Cebu Market Update 2H 2016