Metro Detroit is Singing the Blues, and Greens, and ... · “Metro Detroit is Singing the Blues,...
47
“Metro Detroit is Singing the Blues, and Greens, and creating a more sustainable place…” Gerard Santoro, AICP, Macomb County Brent Geurink, Macomb County
Transcript of Metro Detroit is Singing the Blues, and Greens, and ... · “Metro Detroit is Singing the Blues,...
“Metro Detroit is Singing the Blues, and Greens, and creating a more sustainable place…”
Gerard Santoro, AICP, Macomb County Brent Geurink, Macomb County
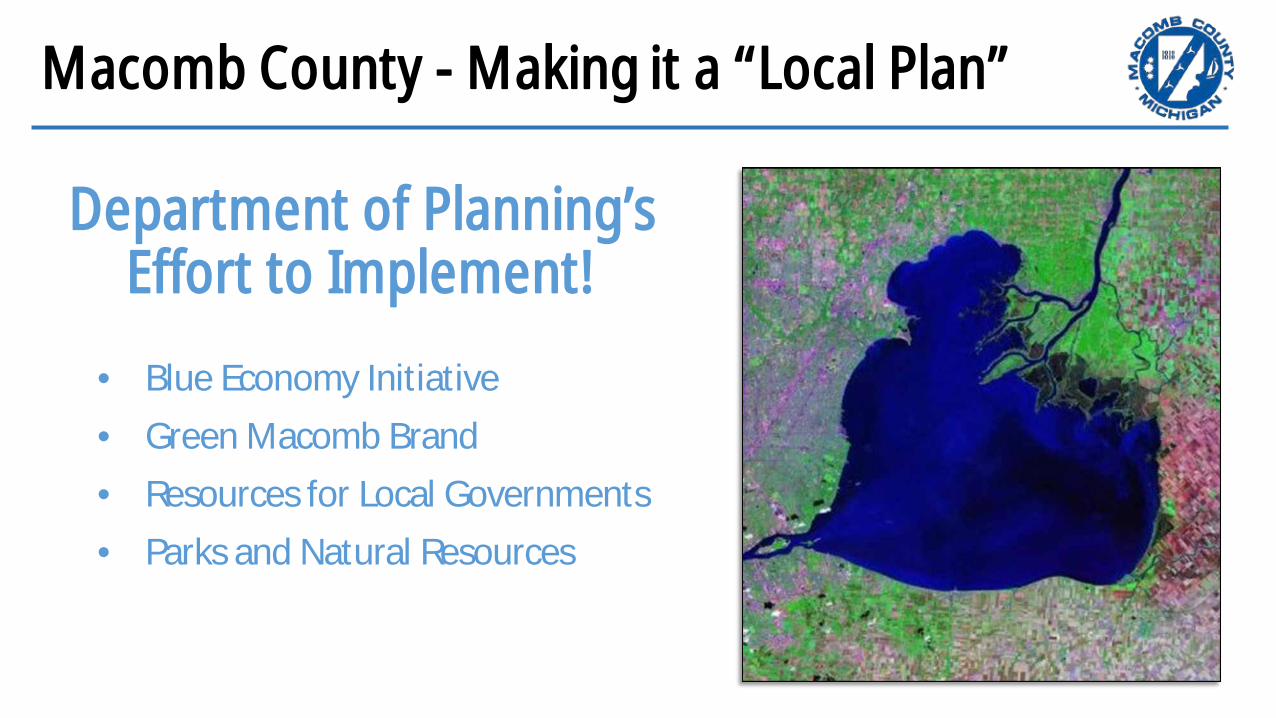
Department of Planning’s Effort to Implement!
• Blue Economy Initiative • Green Macomb Brand • Resources for Local Governments • Parks and Natural Resources
Macomb County - Making it a “Local Plan”
Macomb County Department of Planning & Economic Development
Gerard Santoro Land & Water Resources Program Manager

What We Have is the Envy of the World!
• Less than 1% of the World’s water supply is available for human use
• The Great Lakes has 1/5 of that water supply in our backyard!
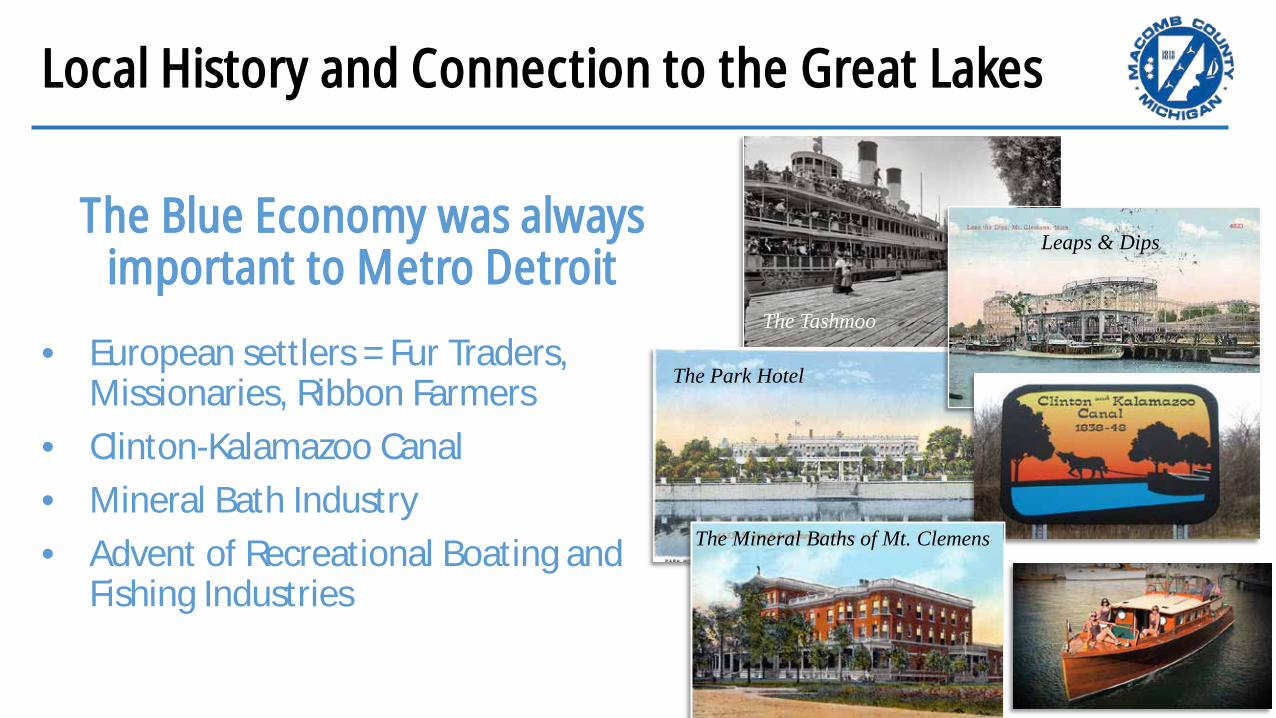
The Blue Economy was always important to Metro Detroit
• European settlers = Fur Traders, Missionaries, Ribbon Farmers
• Clinton-Kalamazoo Canal • Mineral Bath Industry • Advent of Recreational Boating and
Fishing Industries
Local History and Connection to the Great Lakes
The Tashmoo
The Park Hotel
Leaps & Dips
The Mineral Baths of Mt. Clemens
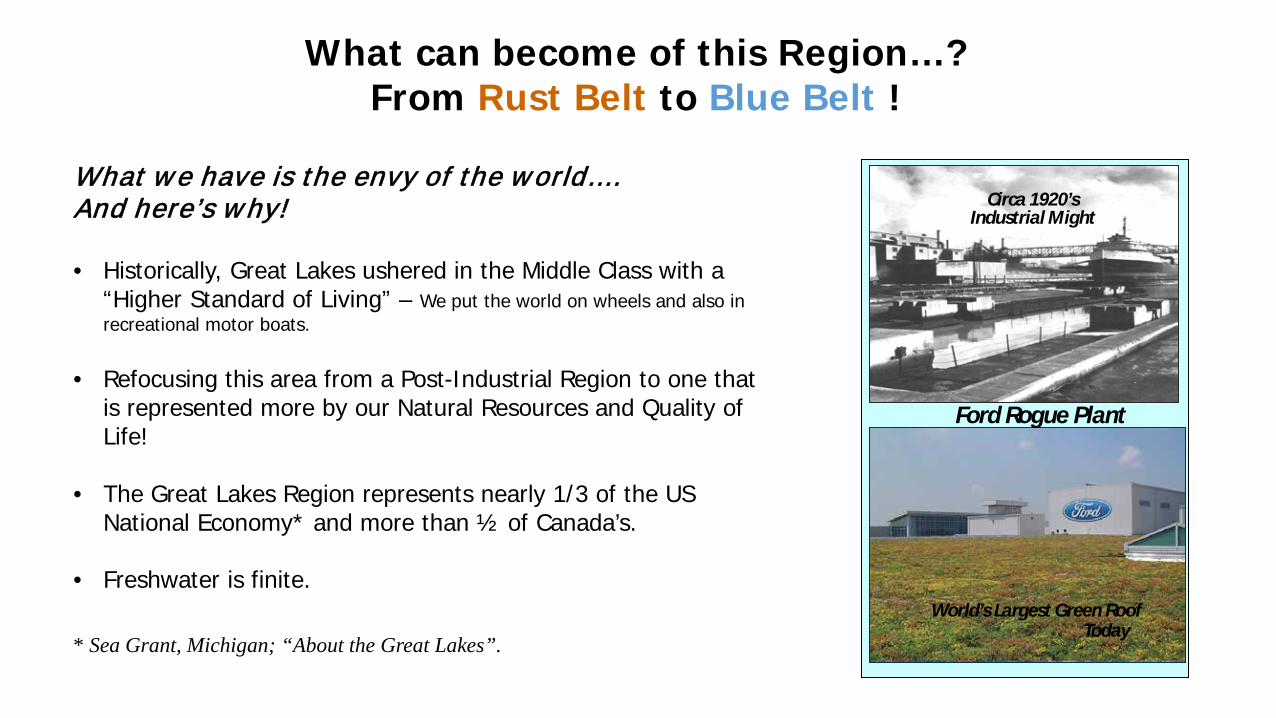
What we have is the envy of the world… . And here’s why!
• Historically, Great Lakes ushered in the Middle Class with a“Higher Standard of Living” – We put the world on wheels and also inrecreational motor boats.
• Refocusing this area from a Post-Industrial Region to one thatis represented more by our Natural Resources and Quality ofLife!
• The Great Lakes Region represents nearly 1/3 of the USNational Economy* and more than ½ of Canada’s.
• Freshwater is finite.
* Sea Grant, Michigan; “About the Great Lakes”.
What can become of this Region…? From Rust Belt to Blue Belt !
Today
World’s Largest Green Roof
Circa 1920’s Industrial Might
Ford Rogue Plant
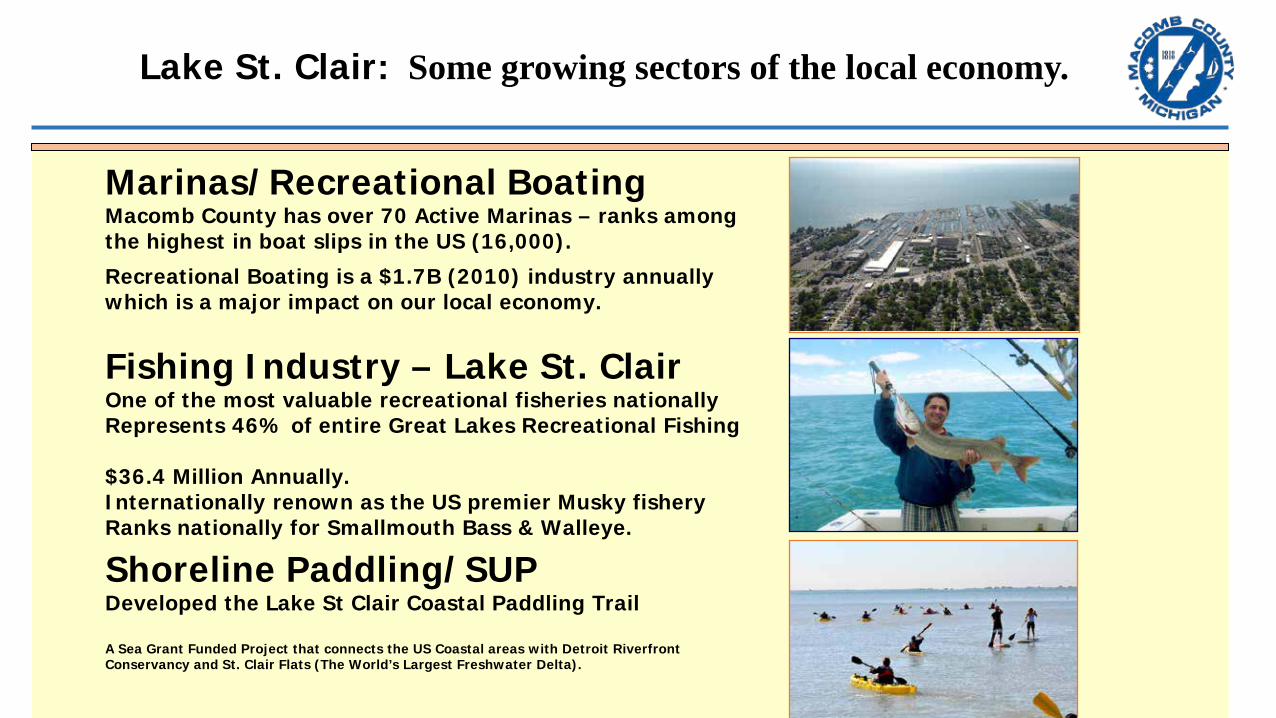
Lake St. Clair: Some growing sectors of the local economy.
Fishing Industry – Lake St. Clair One of the most valuable recreational fisheries nationally Represents 46% of entire Great Lakes Recreational Fishing
$36.4 Million Annually. Internationally renown as the US premier Musky fishery Ranks nationally for Smallmouth Bass & Walleye. Shoreline Paddling/SUP Developed the Lake St Clair Coastal Paddling Trail
A Sea Grant Funded Project that connects the US Coastal areas with Detroit Riverfront Conservancy and St. Clair Flats (The World’s Largest Freshwater Delta).
Marinas/Recreational Boating Macomb County has over 70 Active Marinas – ranks among the highest in boat slips in the US (16,000).
Recreational Boating is a $1.7B (2010) industry annually which is a major impact on our local economy.
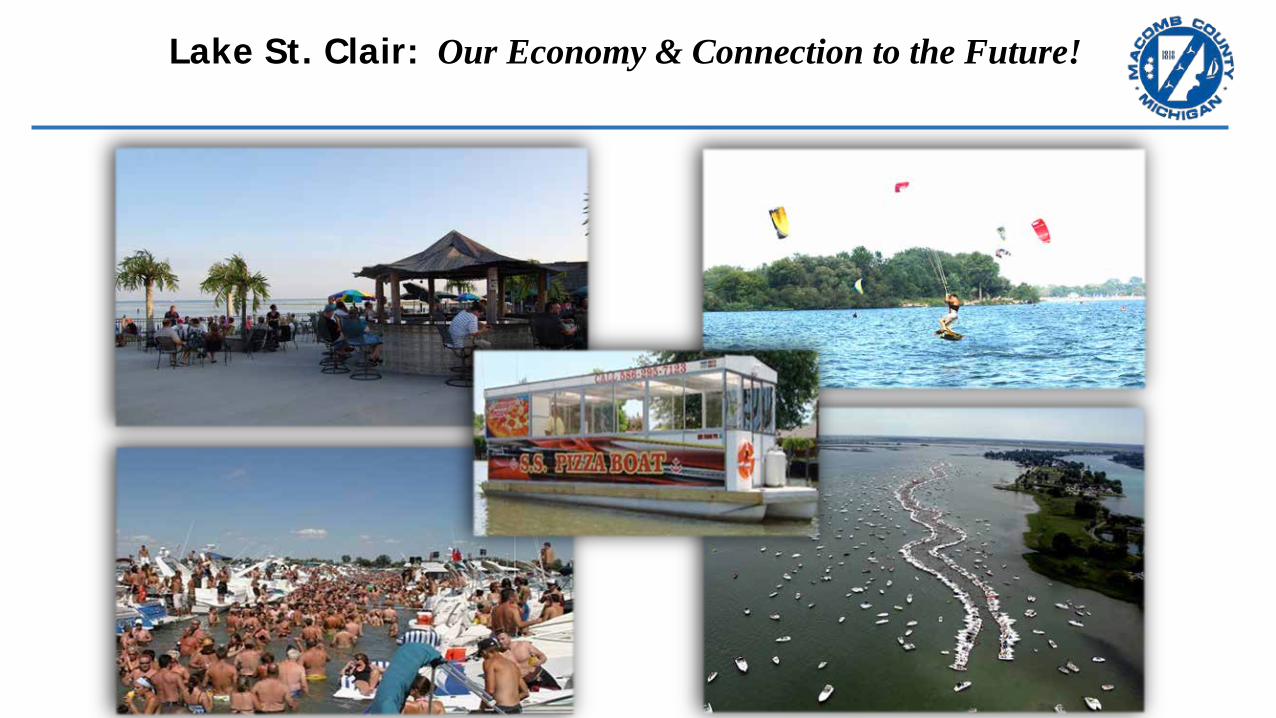
Lake St. Clair: Our Economy & Connection to the Future!

Programming for the Blue Economy
The Three Pillars of a Sustainable Place:
1. Environmental Stewardship
2. Economic Development
3. Quality of Life
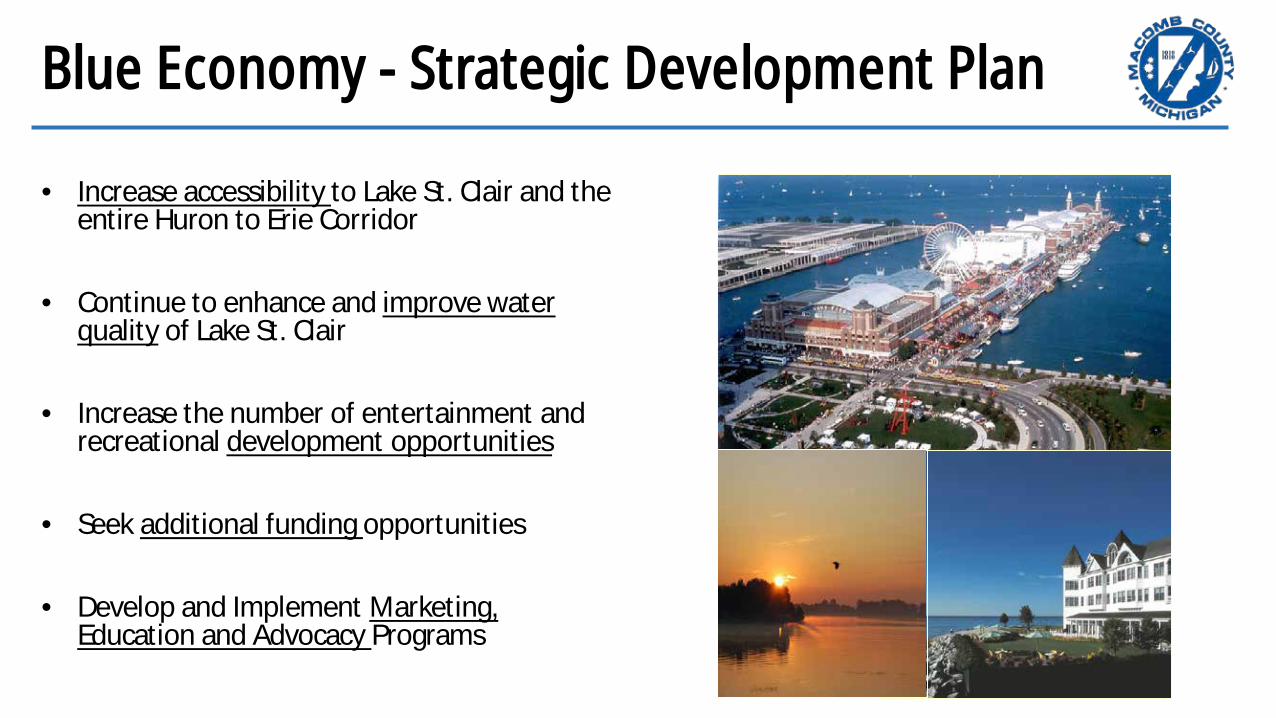
Blue Economy - Strategic Development Plan
• Increase accessibility to Lake St. Clair and the entire Huron to Erie Corridor
• Continue to enhance and improve water quality of Lake St. Clair
• Increase the number of entertainment and recreational development opportunities
• Seek additional funding opportunities
• Develop and Implement Marketing, Education and Advocacy Programs
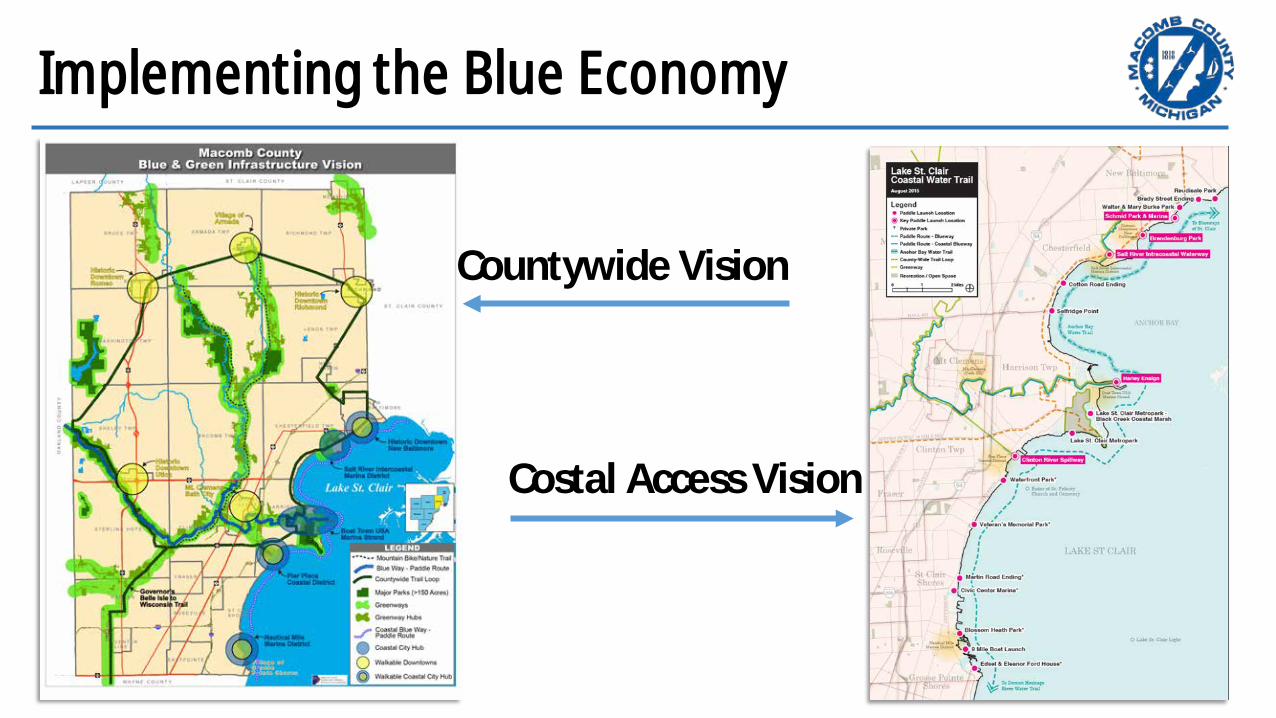
Implementing the Blue Economy
Countywide Vision
Costal Access Vision

Implementing the Blue Economy: Example #1
Lake St. Clair Metropark
• Coastal Marshland Restoration
• Parking Lot Retrofit
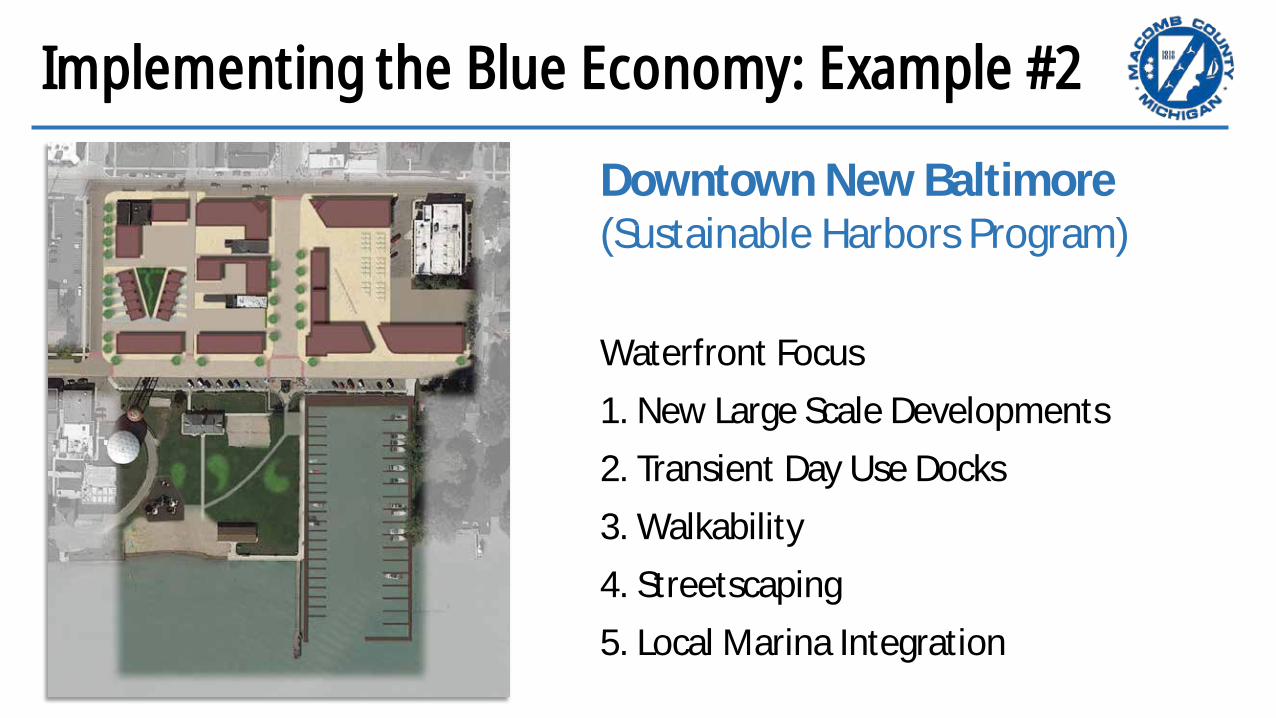
Implementing the Blue Economy: Example #2
Downtown New Baltimore (Sustainable Harbors Program) Waterfront Focus 1. New Large Scale Developments 2. Transient Day Use Docks 3. Walkability 4. Streetscaping 5. Local Marina Integration
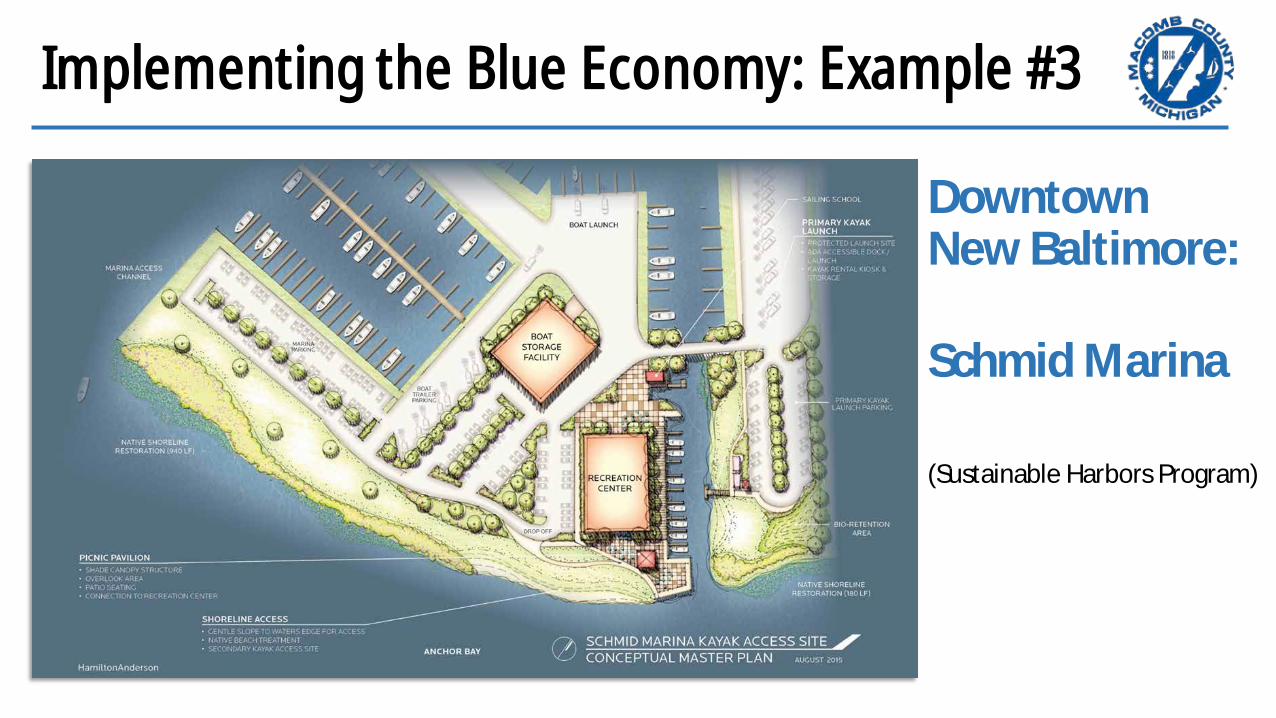
Implementing the Blue Economy: Example #3
Downtown New Baltimore:
Schmid Marina
(Sustainable Harbors Program)

Implementing the Blue Economy: Example #4
Chesterfield Township
• Intercoastal Marshland
Restoration
• Recreation Plan
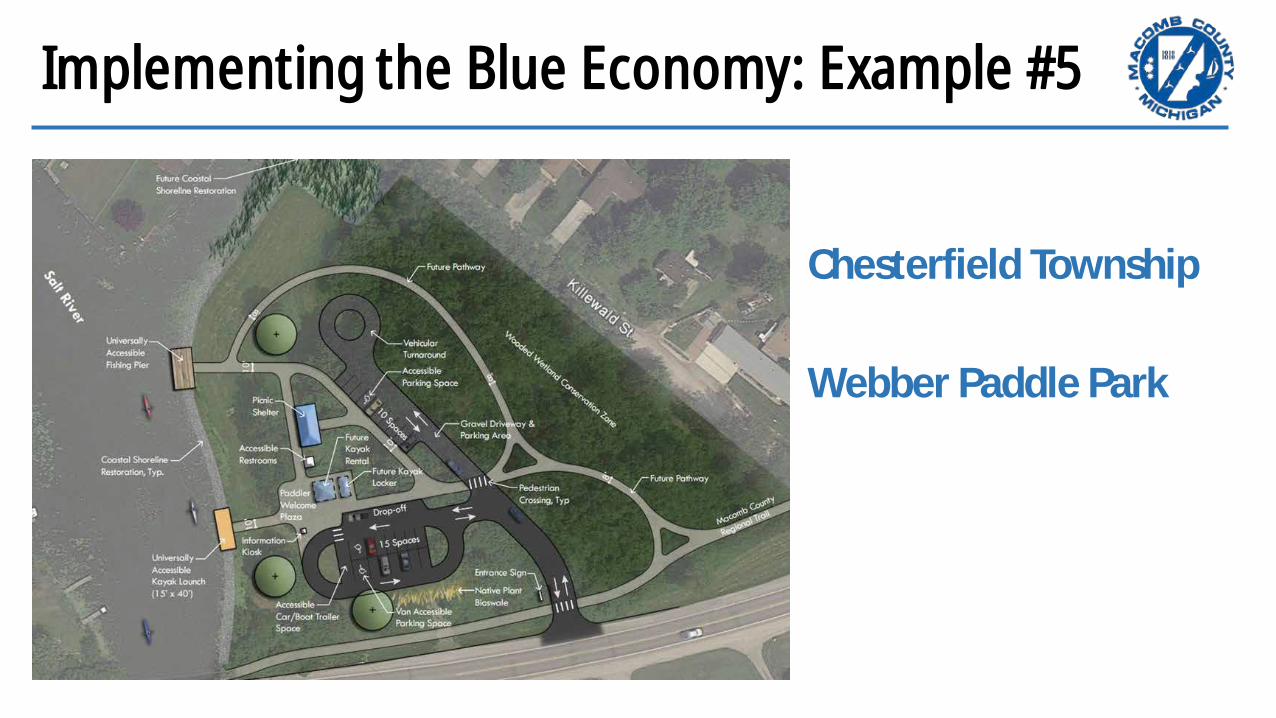
Implementing the Blue Economy: Example #5
Chesterfield Township Webber Paddle Park

Implementing the Blue Economy: Example #6
Harrison Township Waterfront Redevelopment Plan

Implementing the Blue Economy: Example #7
St Clair Shores “Nautical Mile” Resiliency Implementation Waterfront Focus 1. Show Me the Water 2. Welcome Visitors 3. Stop, Shop, and Explore 4. By Land or Sea & By Car or Foot
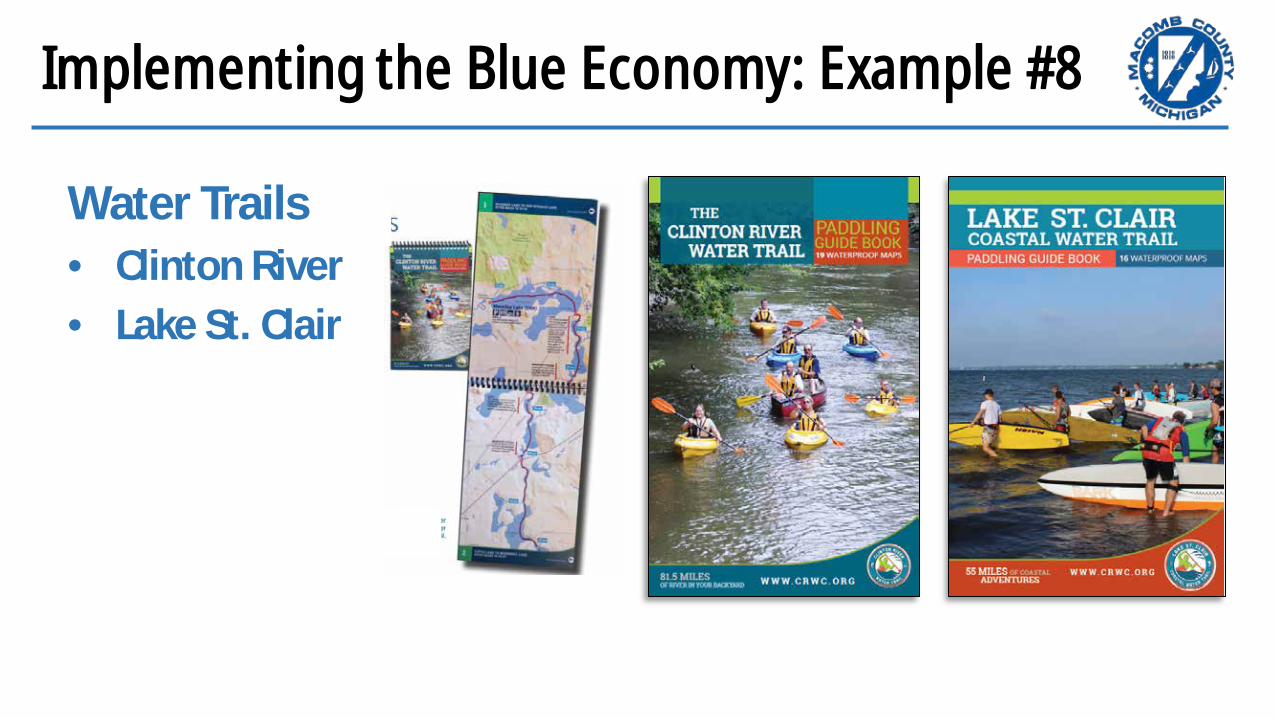
Implementing the Blue Economy: Example #8
Water Trails • Clinton River • Lake St. Clair
Our Mission is to cultivate strong
partnerships that foster targeted research, training, and actions that will continue to
improve community awareness of and support for the health of our precious
waters an the lives that depend on them.

Macomb County Department of Planning & Economic Development
Brent Geurink Land & Water Resources Associate Planner
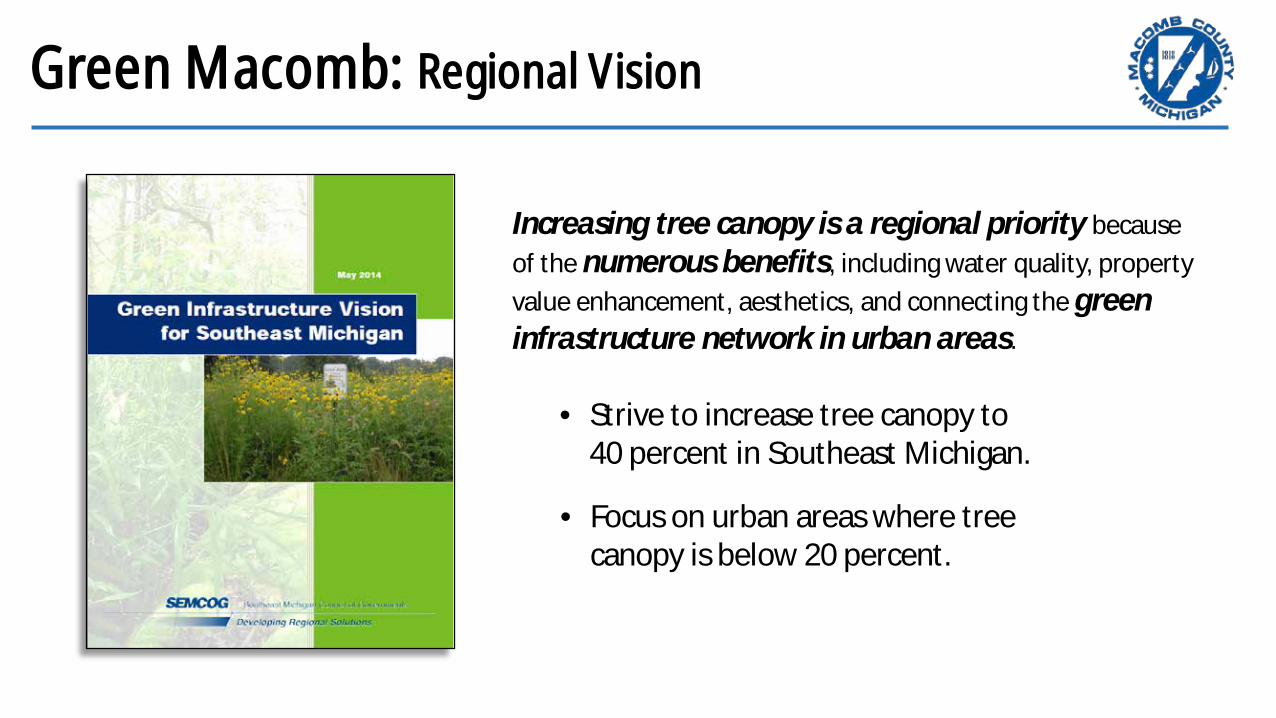
Green Macomb: Regional Vision
Increasing tree canopy is a regional priority because of the numerous benefits, including water quality, property value enhancement, aesthetics, and connecting the green infrastructure network in urban areas.
• Strive to increase tree canopy to 40 percent in Southeast Michigan.
• Focus on urban areas where tree canopy is below 20 percent.
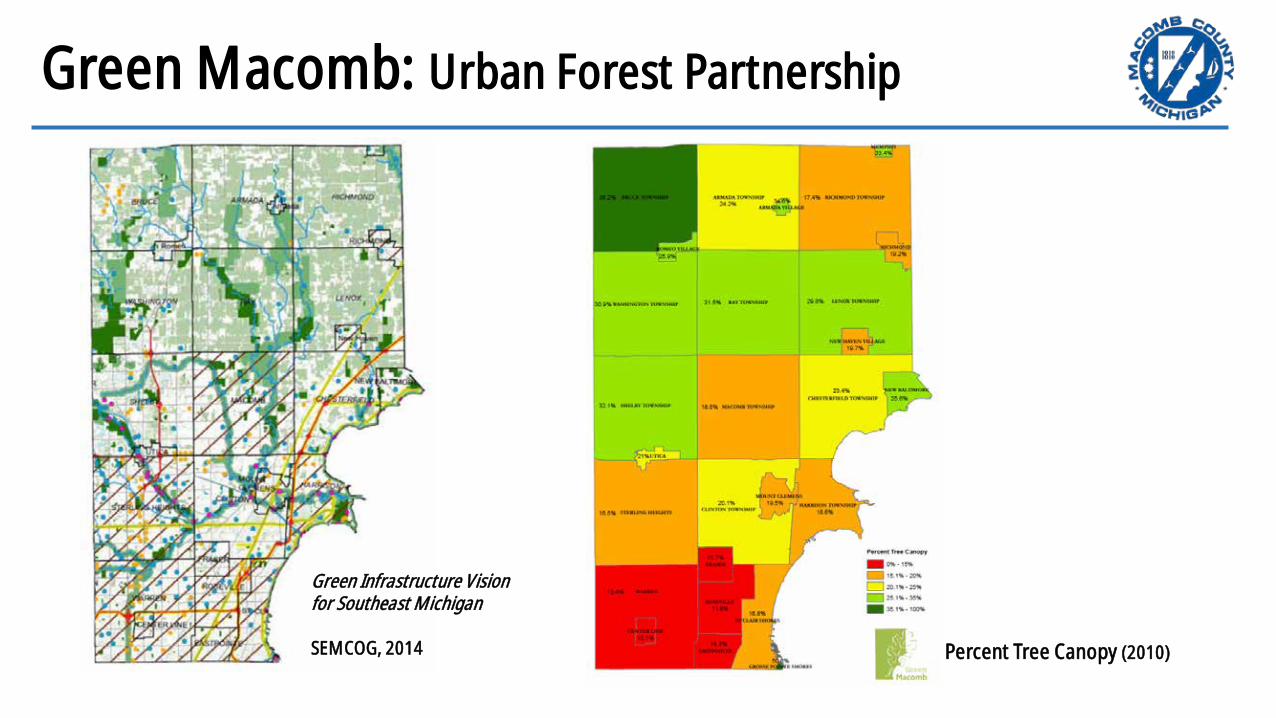
Green Macomb: Urban Forest Partnership
Percent Tree Canopy (2010)
Green Infrastructure Vision for Southeast Michigan SEMCOG, 2014
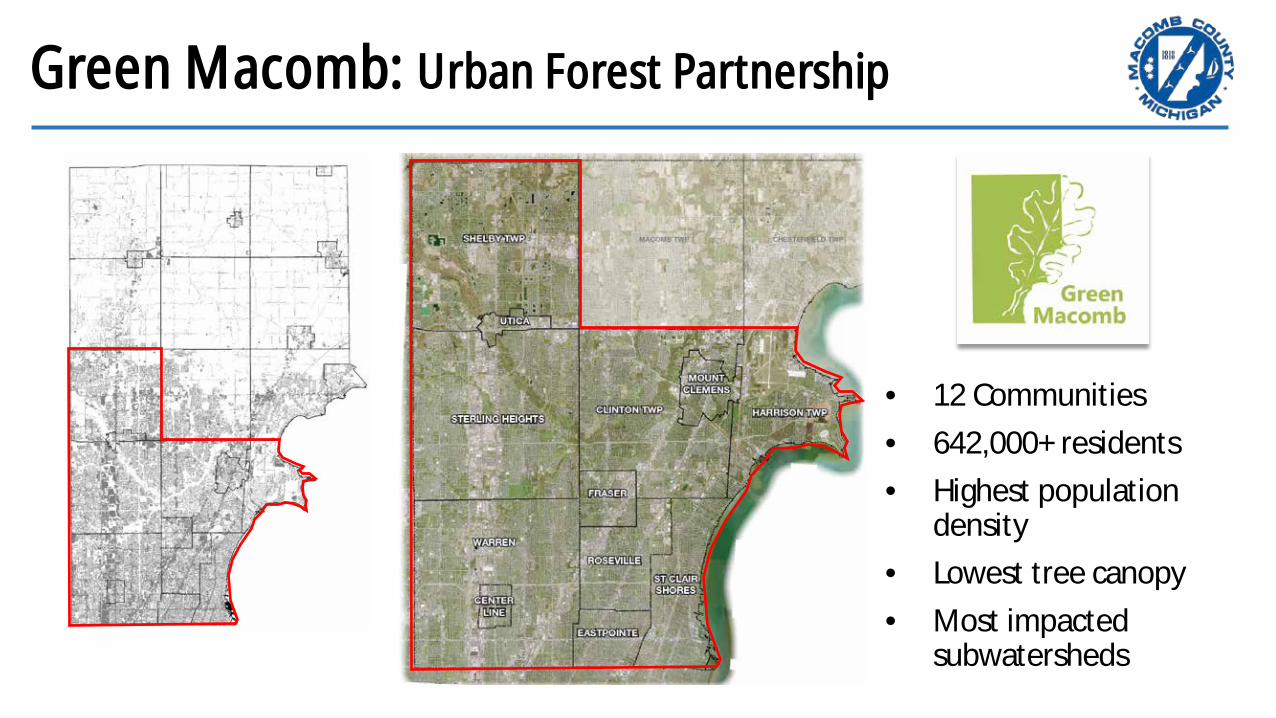
Green Macomb: Urban Forest Partnership
• 12 Communities • 642,000+ residents • Highest population
density • Lowest tree canopy • Most impacted
subwatersheds
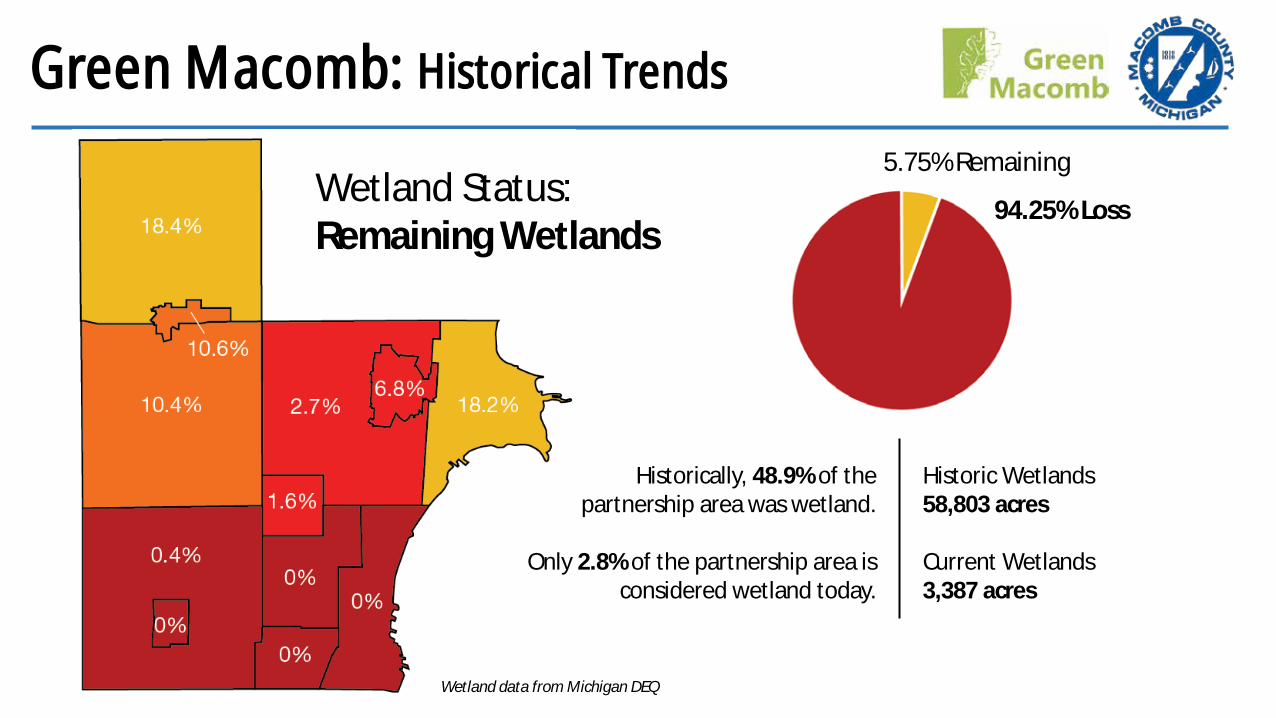
Green Macomb: Historical Trends
Wetland Status: Remaining Wetlands
5.75% Remaining
94.25% Loss
Historically, 48.9% of the partnership area was wetland.
Only 2.8% of the partnership area is
considered wetland today.
Wetland data from Michigan DEQ
Historic Wetlands 58,803 acres Current Wetlands 3,387 acres

Green Macomb: Current Trends
Land Cover: Impervious Surfaces
Impervious Hot Spots
Percent Impervious
41.3% Overall
Green Macomb: Urban Forest Partnership
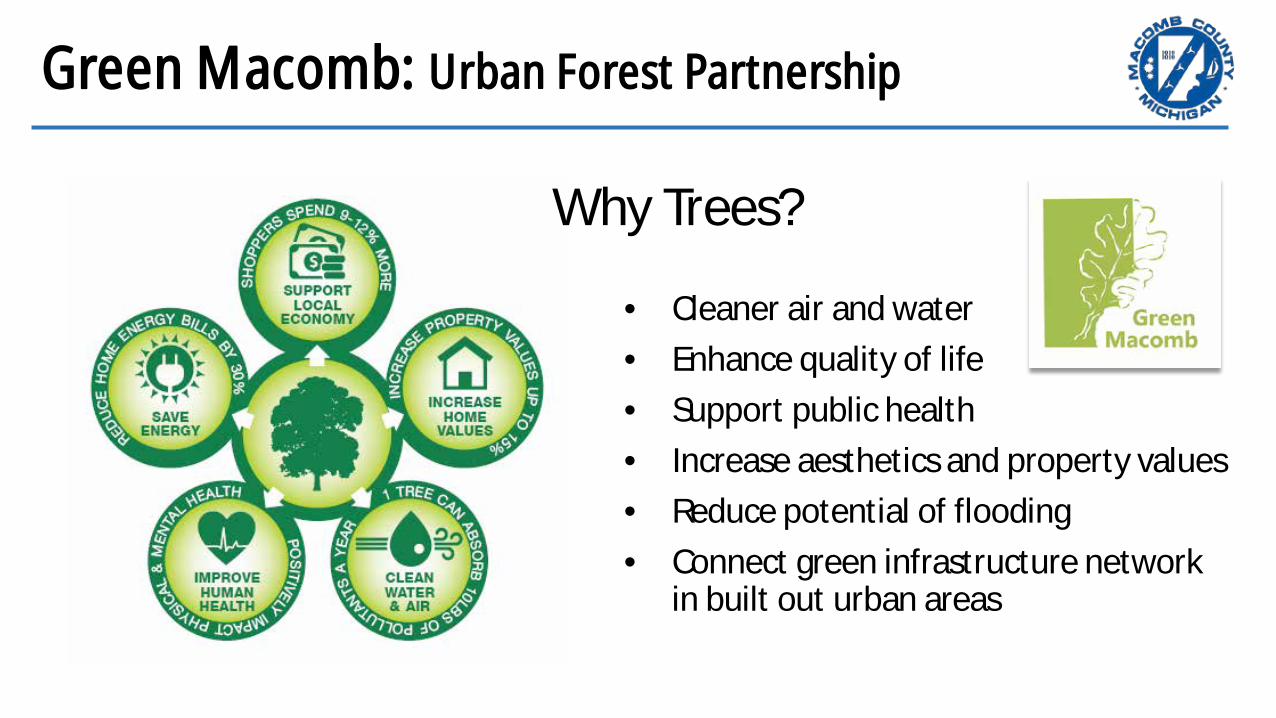
• Cleaner air and water • Enhance quality of life • Support public health • Increase aesthetics and property values • Reduce potential of flooding • Connect green infrastructure network
in built out urban areas
Why Trees?
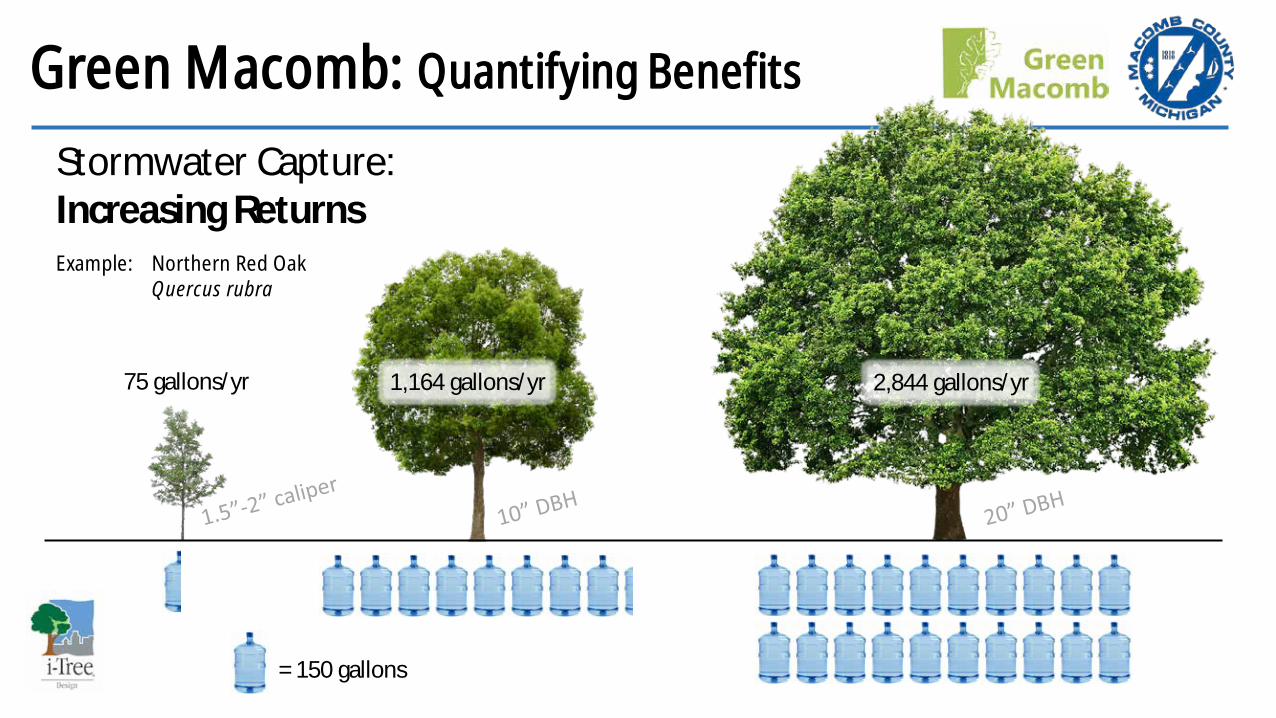
Green Macomb: Quantifying Benefits
Stormwater Capture: Increasing Returns
75 gallons/yr 1,164 gallons/yr 2,844 gallons/yr
Example: Northern Red Oak Quercus rubra
= 150 gallons

Green Macomb: Existing Conditions
Percent Tree Canopy Tree Canopy
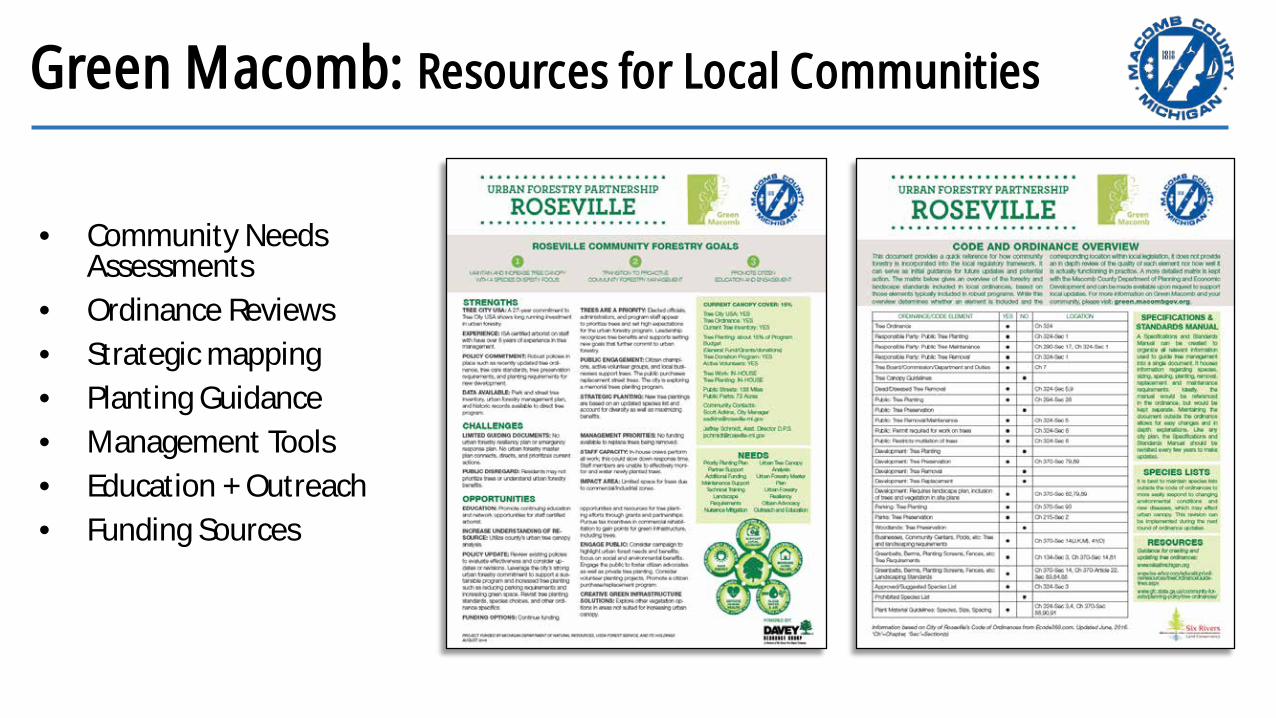
Green Macomb: Resources for Local Communities
• Community Needs Assessments
• Ordinance Reviews • Strategic mapping • Planting Guidance • Management Tools • Education + Outreach • Funding Sources
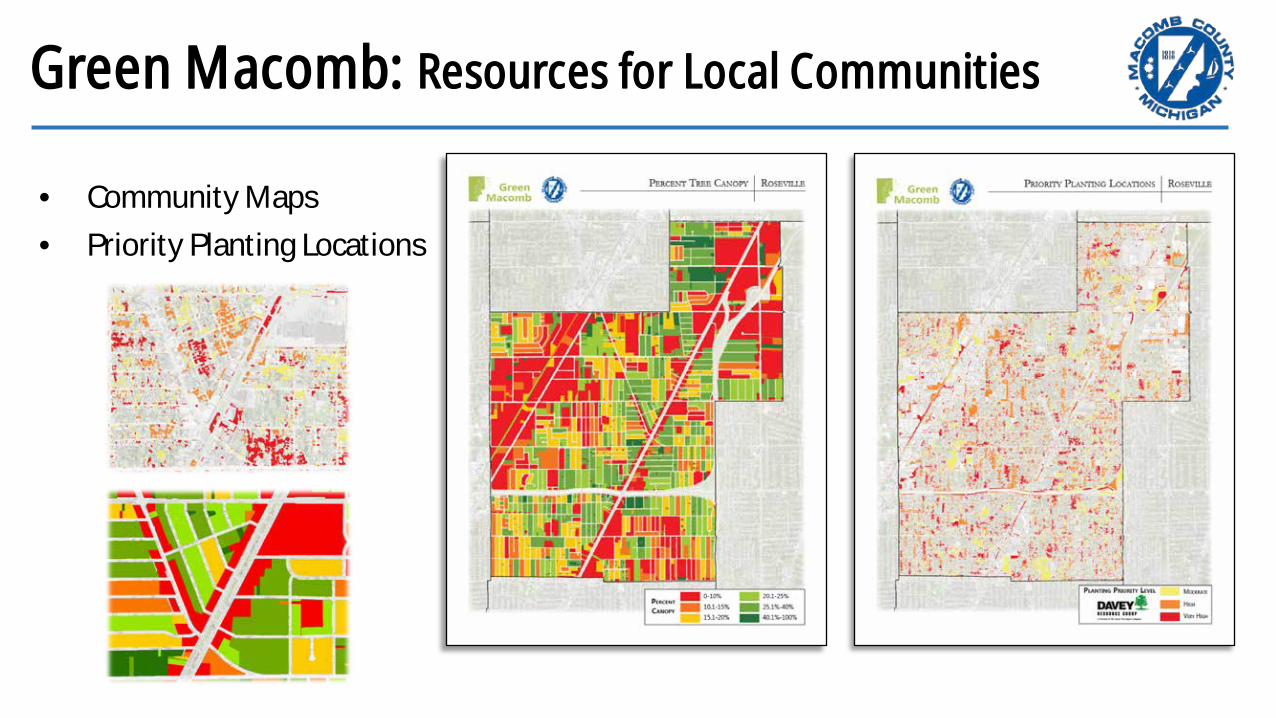
Green Macomb: Resources for Local Communities
• Community Maps • Priority Planting Locations
Green Macomb: Resources for Local Communities
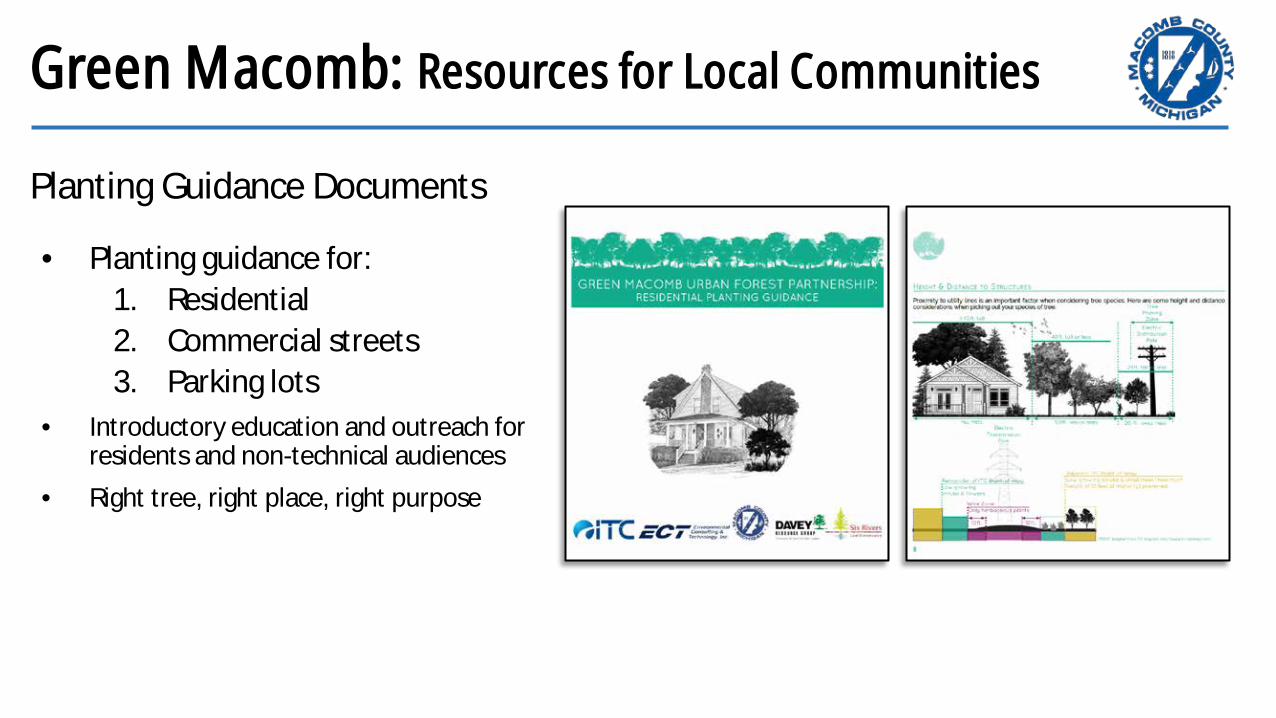
• Planting guidance for: 1. Residential 2. Commercial streets 3. Parking lots
• Introductory education and outreach for residents and non-technical audiences
• Right tree, right place, right purpose
Planting Guidance Documents
Green Macomb: Resources for Local Communities
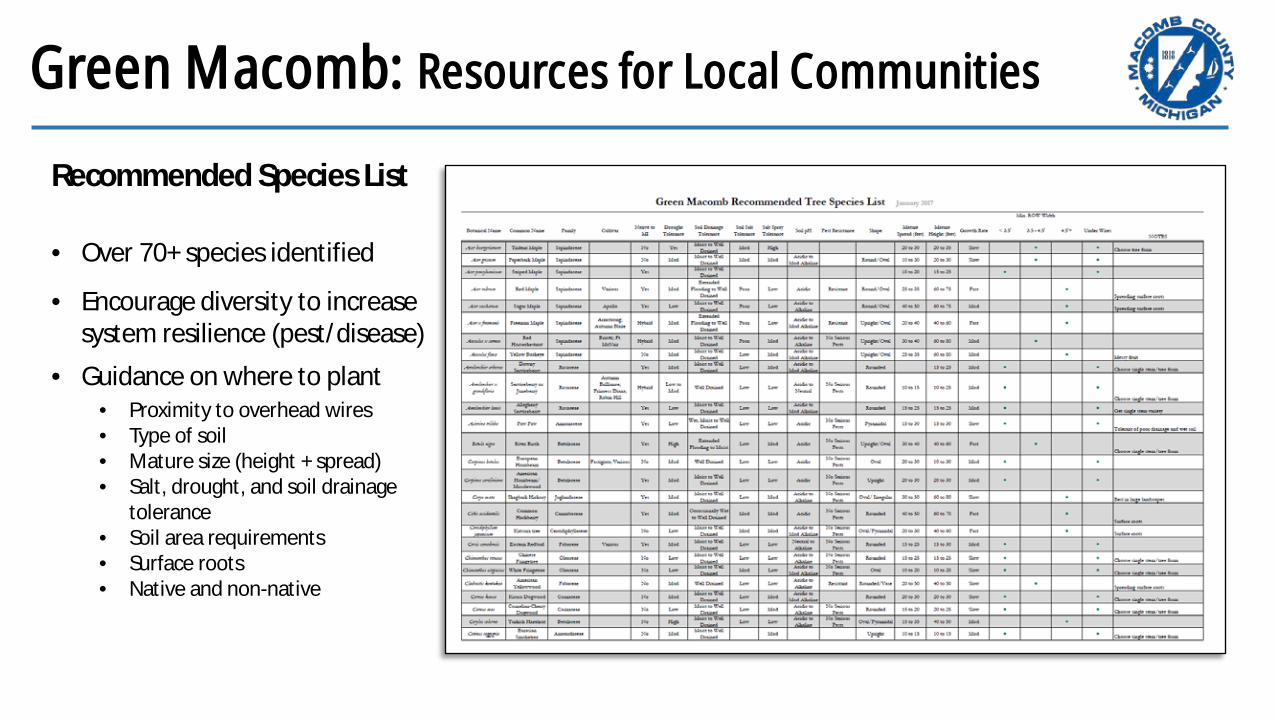
• Over 70+ species identified
• Encourage diversity to increase system resilience (pest/disease)
• Guidance on where to plant • Proximity to overhead wires • Type of soil • Mature size (height + spread) • Salt, drought, and soil drainage
tolerance • Soil area requirements • Surface roots • Native and non-native
Recommended Species List

Green Macomb: Road Map for Local Governments
Baseline resources, tools, and data – the groundwork for implementation.
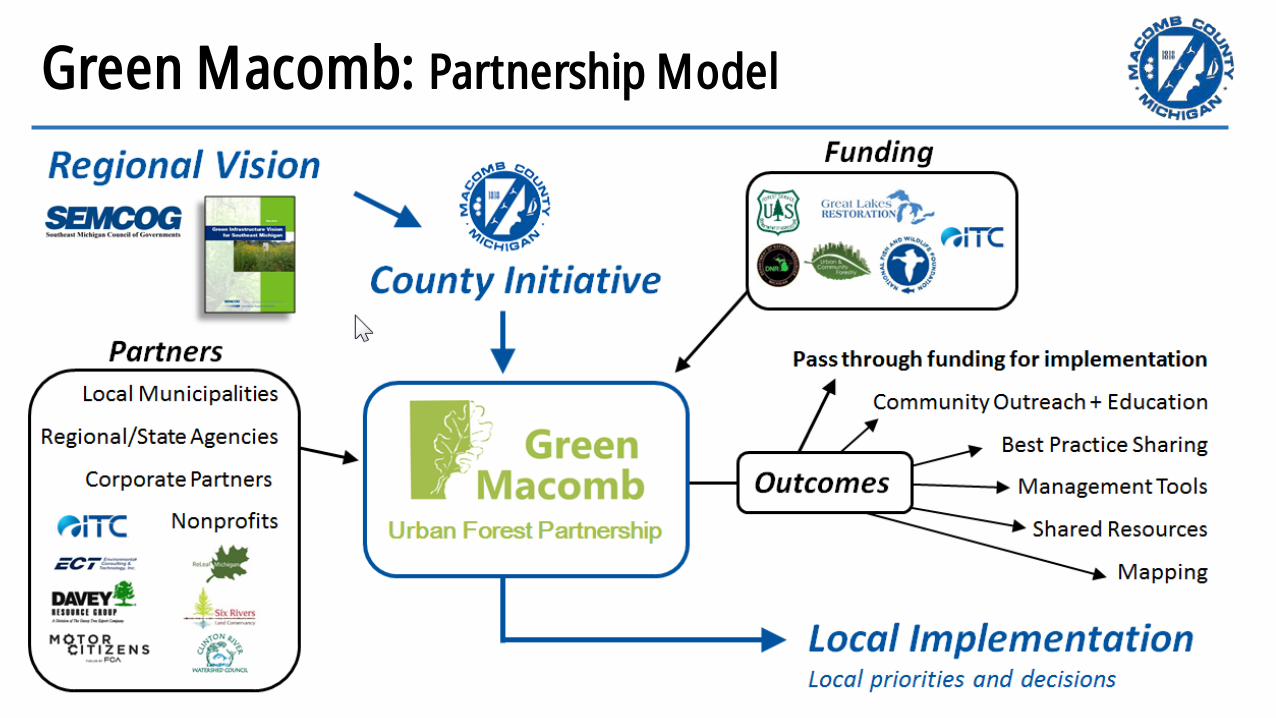
Green Macomb: Partnership Model
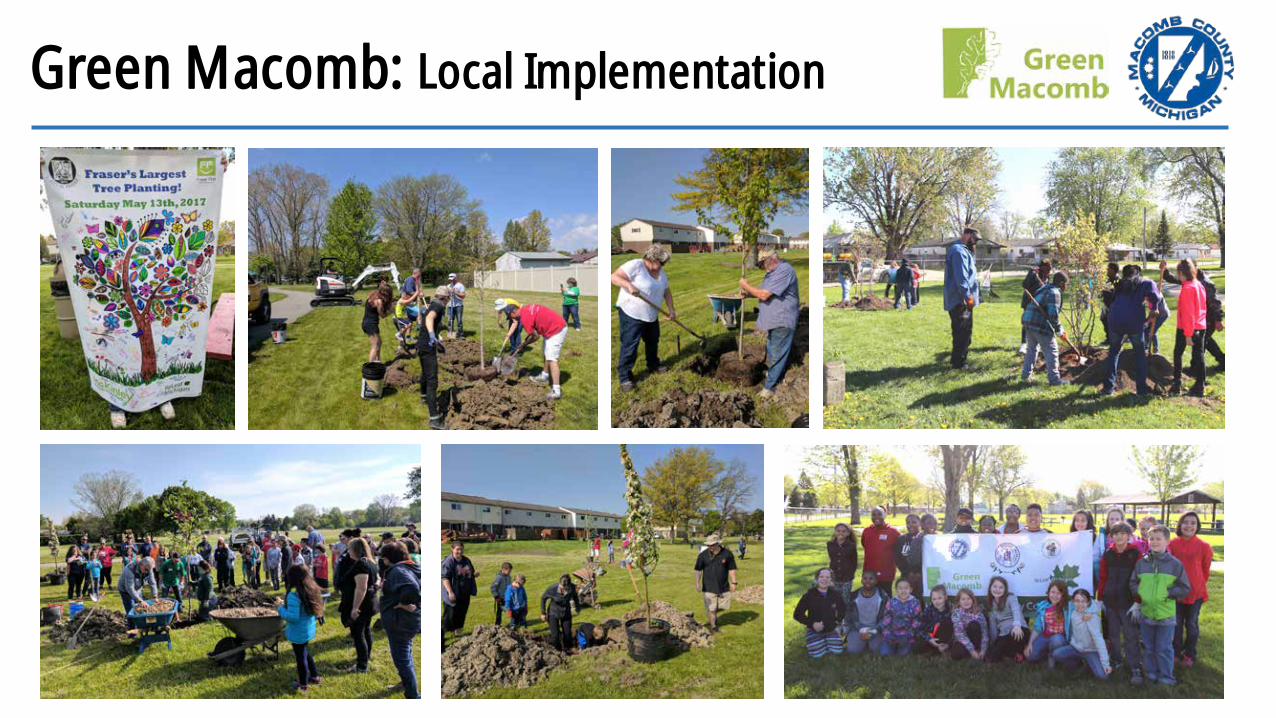
Green Macomb: Local Implementation
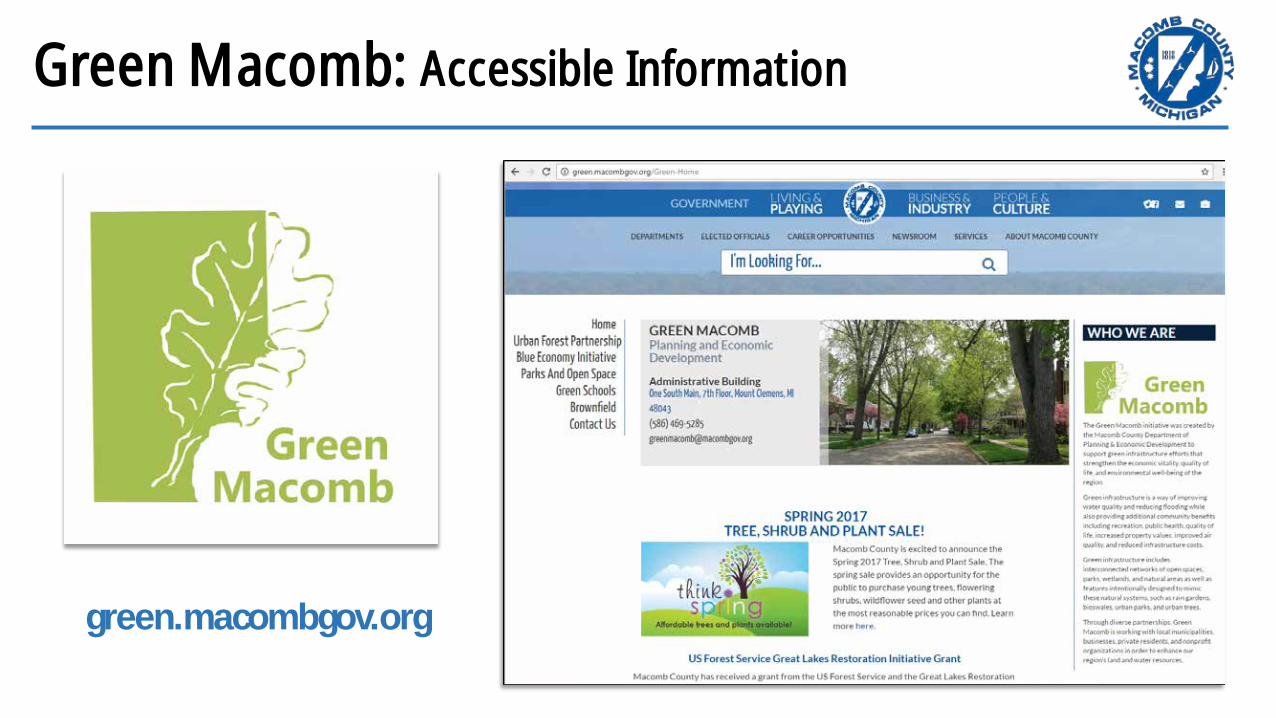
Green Macomb: Accessible Information
green.macombgov.org
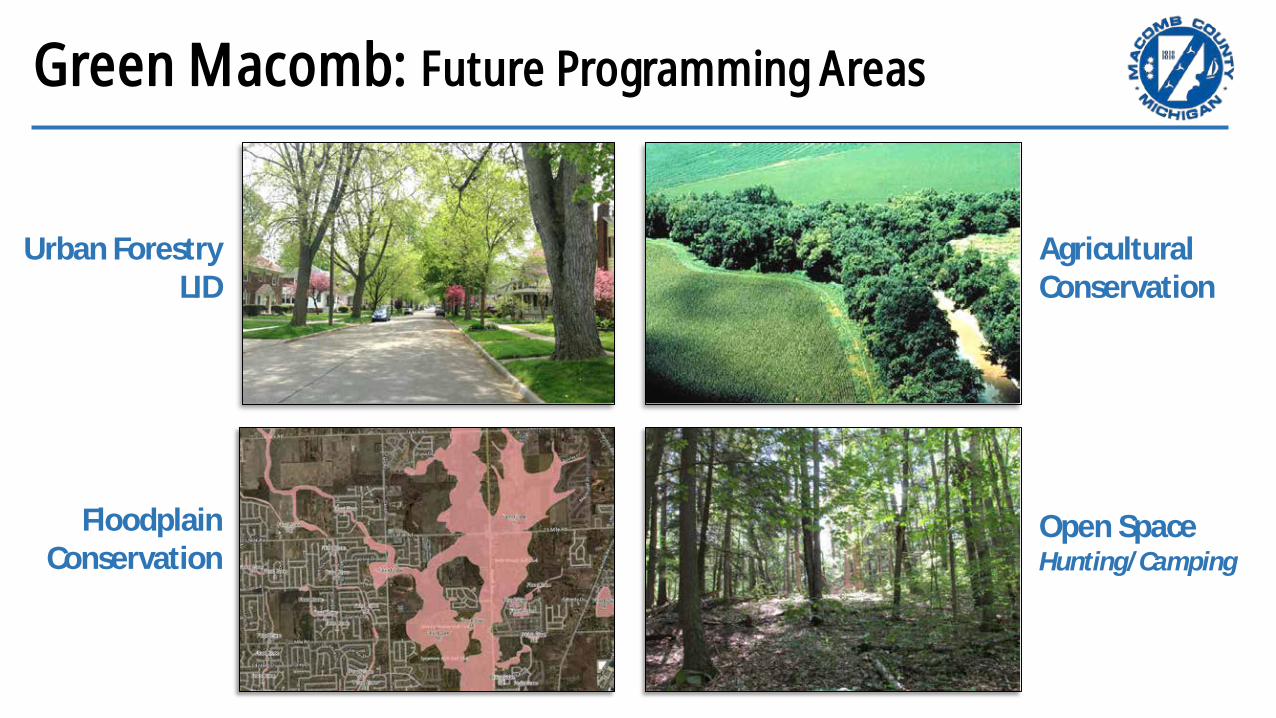
Green Macomb: Future Programming Areas
Urban Forestry LID
Floodplain Conservation
Agricultural Conservation
Open Space Hunting/Camping
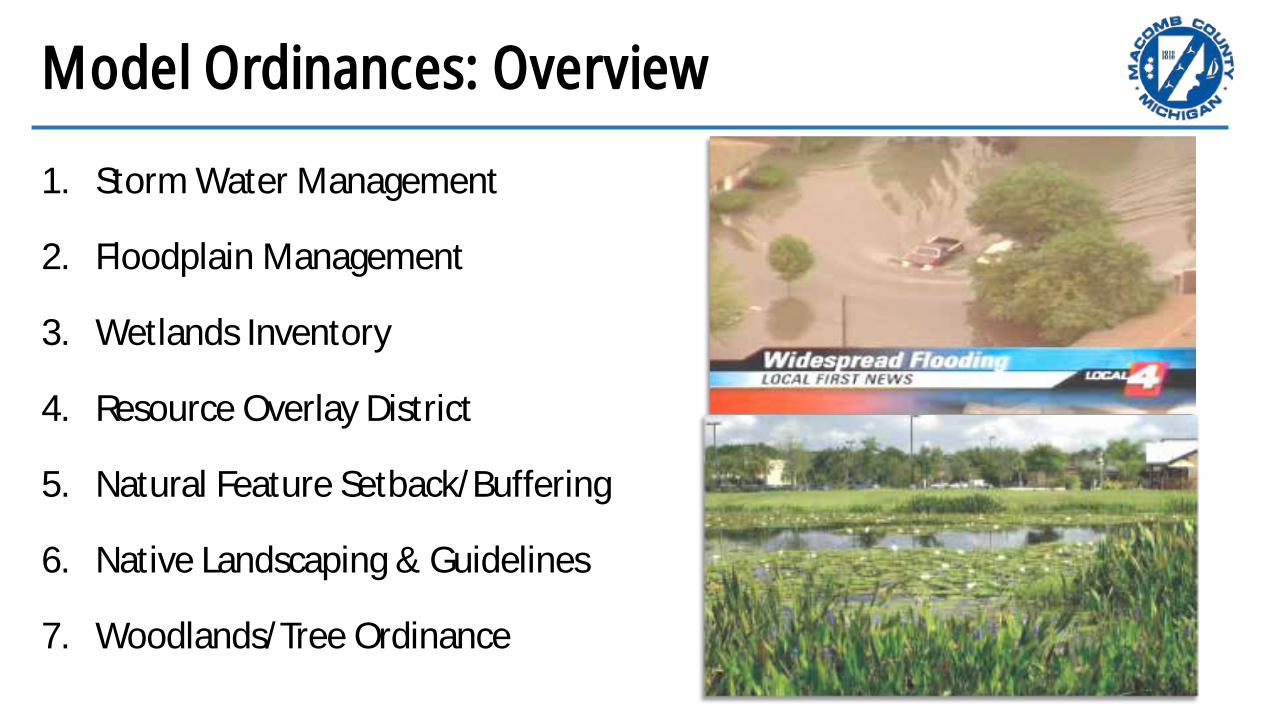
Model Ordinances: Overview
1. Storm Water Management
2. Floodplain Management
3. Wetlands Inventory
4. Resource Overlay District
5. Natural Feature Setback/Buffering
6. Native Landscaping & Guidelines
7. Woodlands/Tree Ordinance
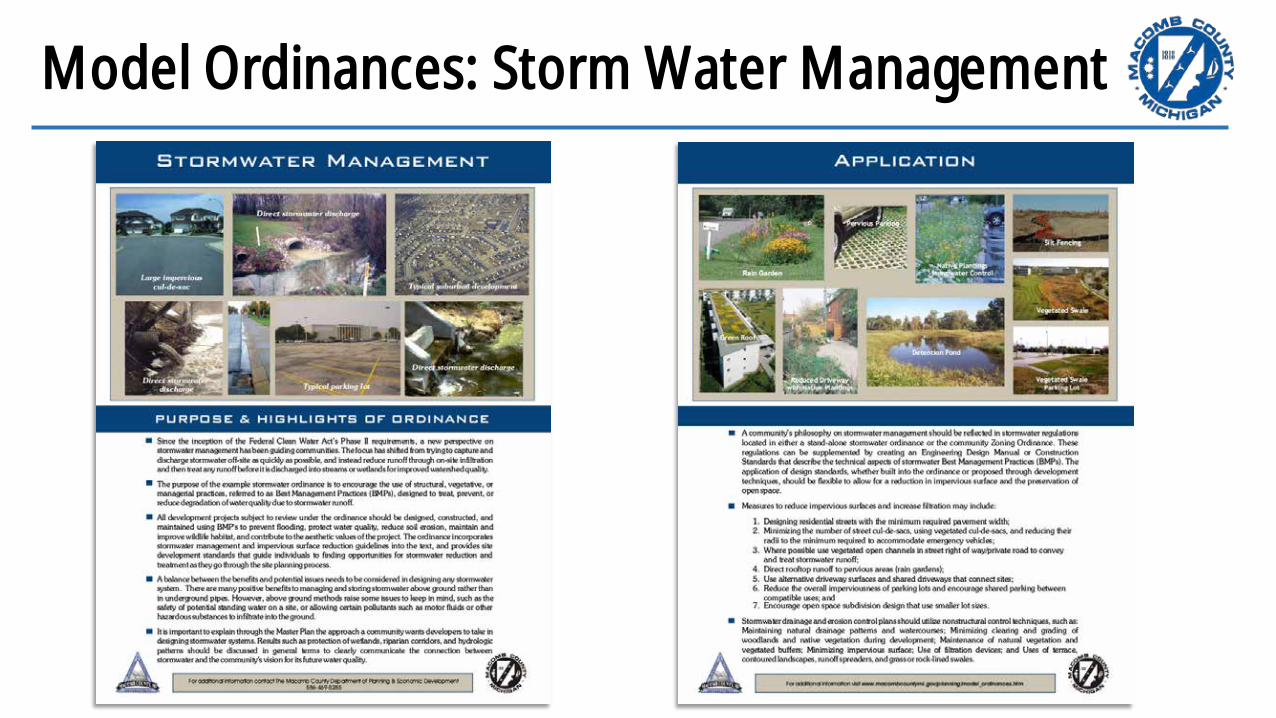
Model Ordinances: Storm Water Management
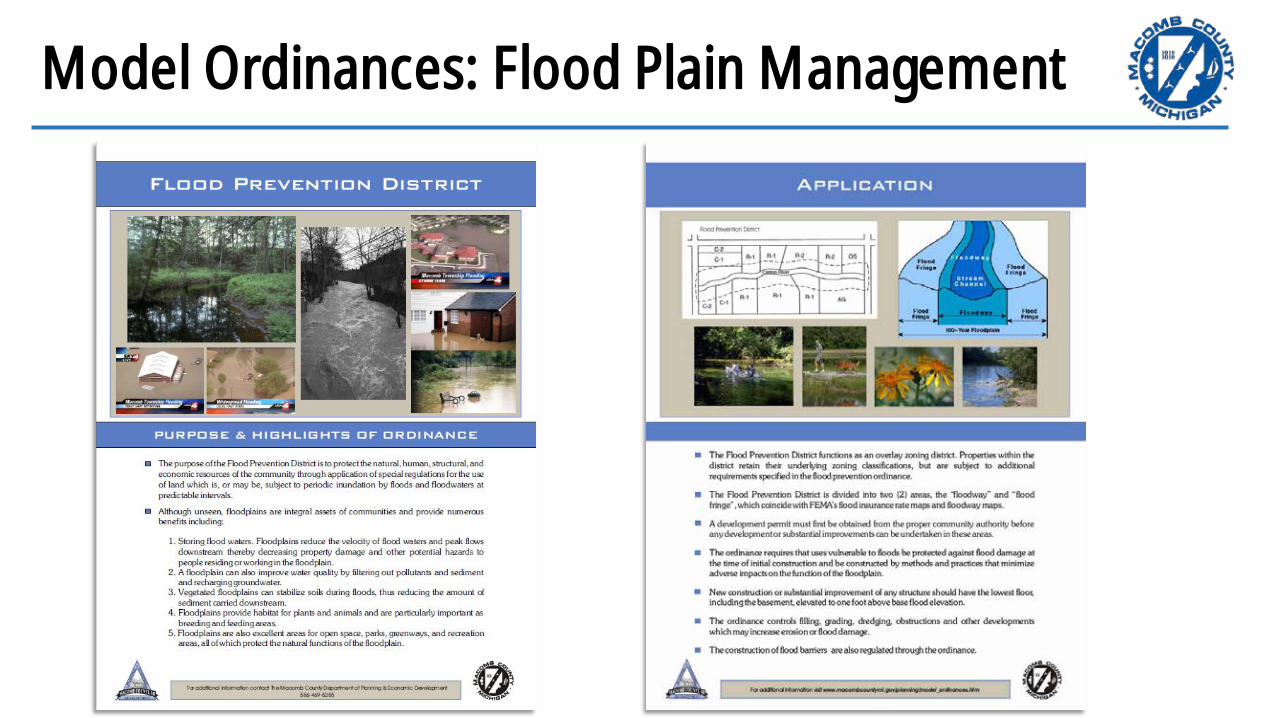
Model Ordinances: Flood Plain Management
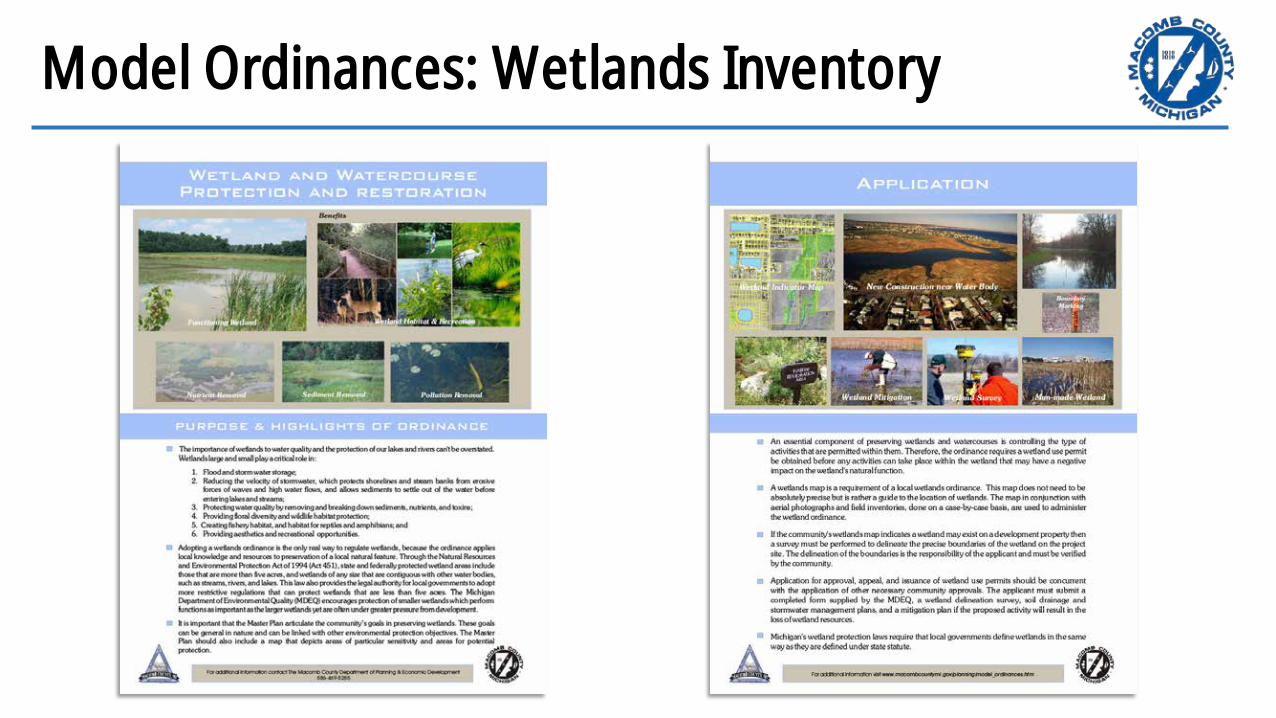
Model Ordinances: Wetlands Inventory
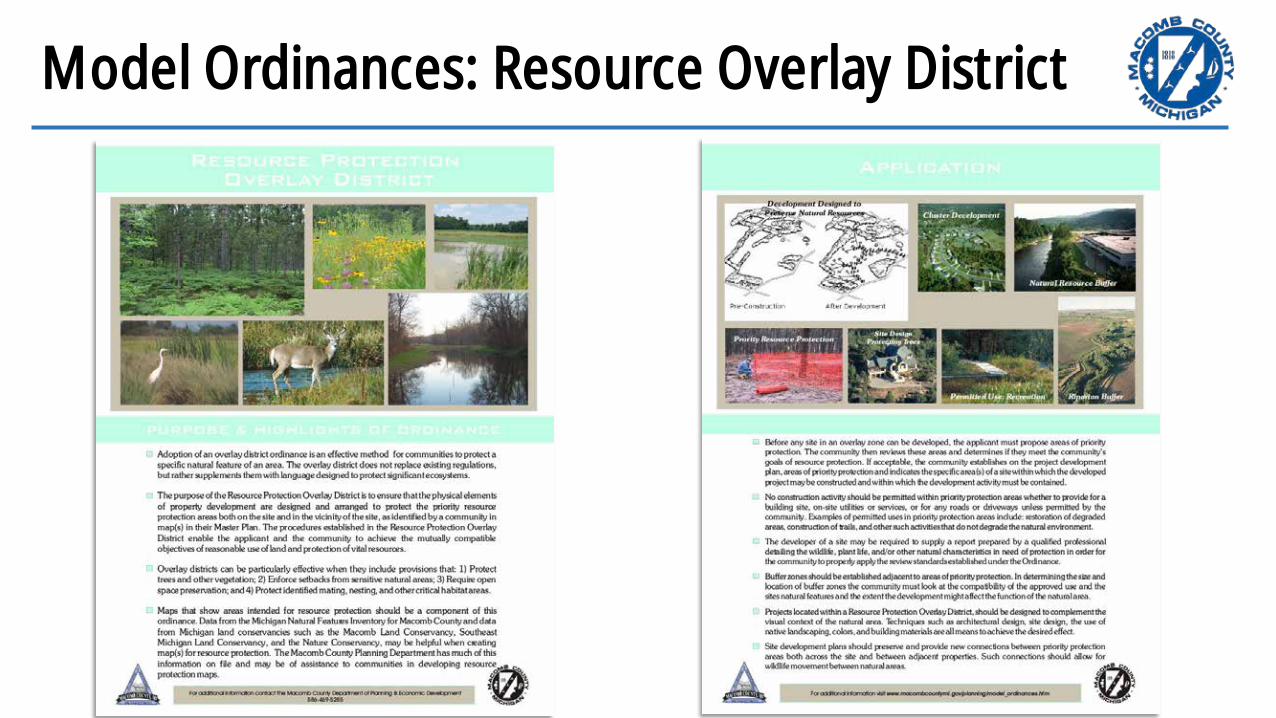
Model Ordinances: Resource Overlay District
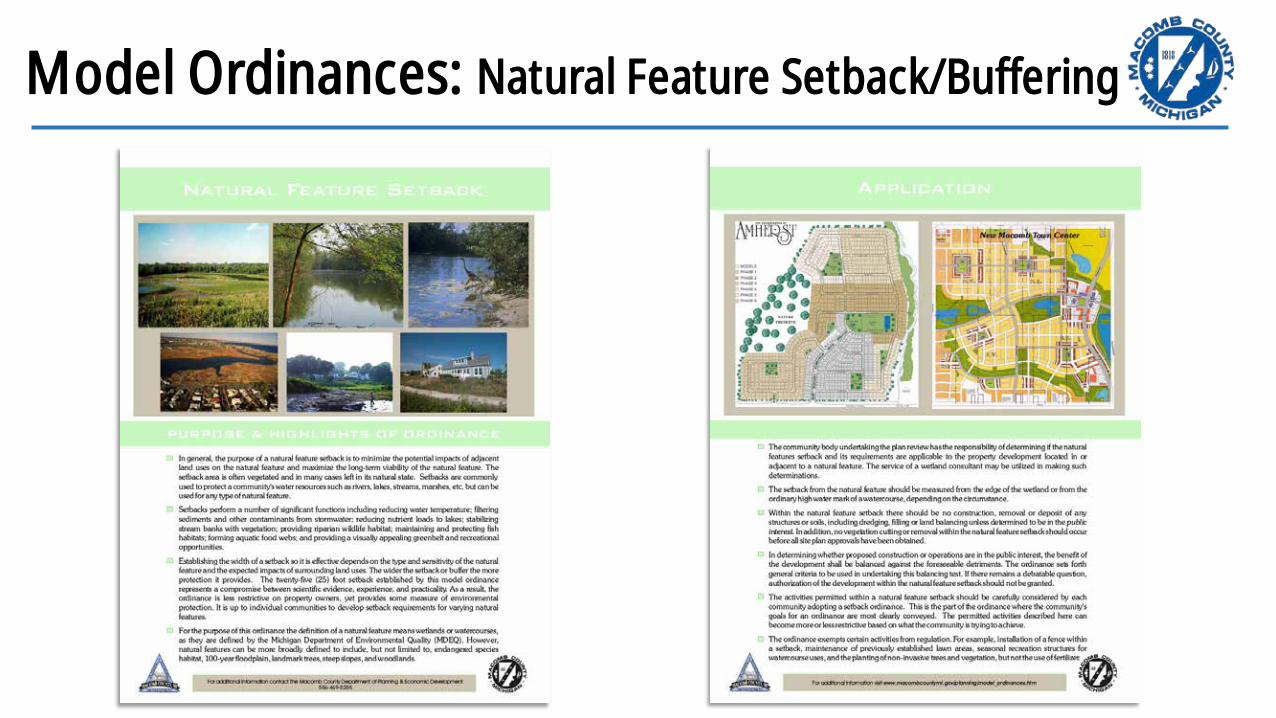
Model Ordinances: Natural Feature Setback/Buffering
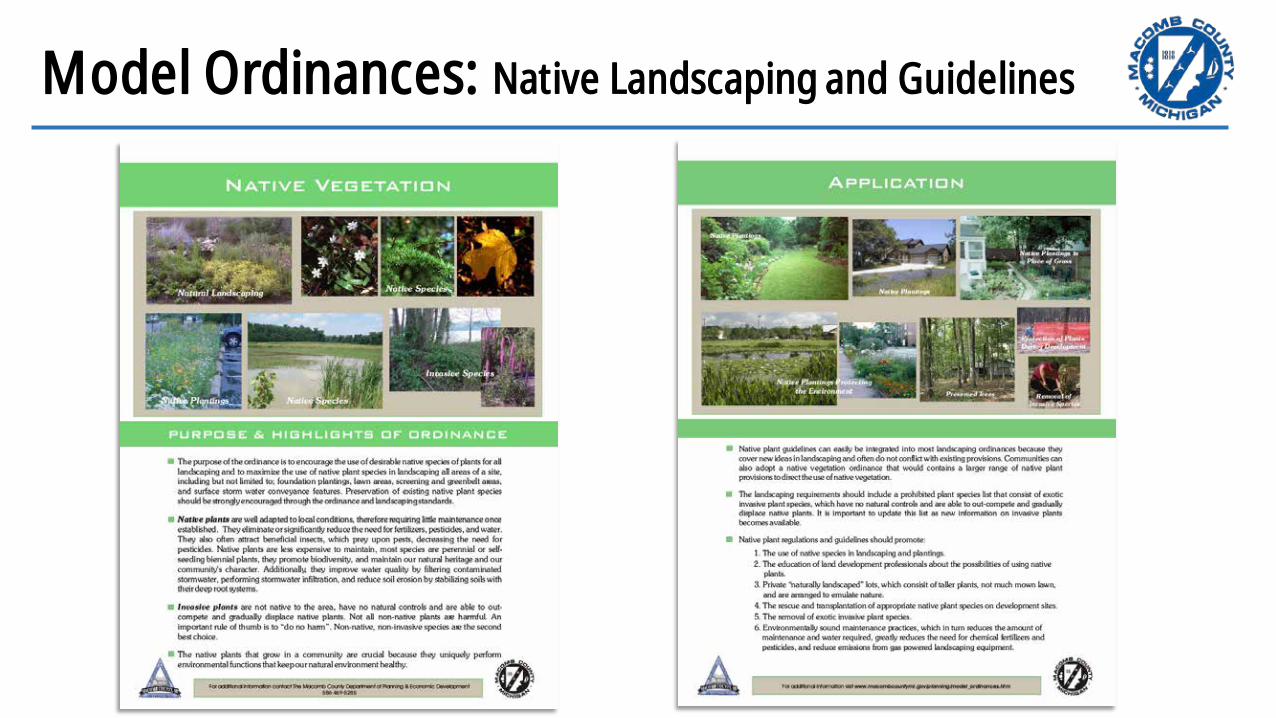
Model Ordinances: Native Landscaping and Guidelines
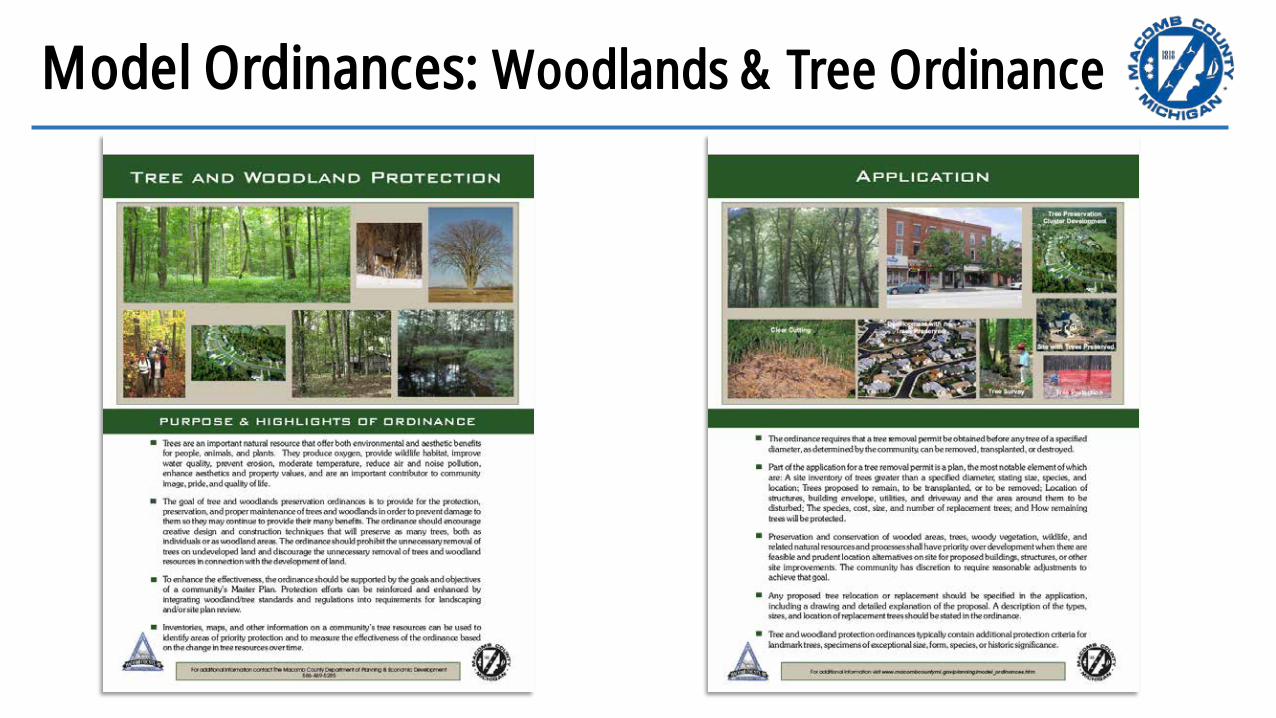
Model Ordinances: Woodlands & Tree Ordinance
PED.MacombGov.org MakeMacombYourHome.com