Metro Mining · The BFS, released by Metro in March 2017, outlines a A$601 million ... expanding...
22
Metro Mining Emerging Low Cost Bauxite Producer MMI AU 2 August 2017 Last price: A$0.17 Target price: A$0.42 Prepared by Tamesis Partners LLP See final two pages for important disclosures 1 Price Target: A$0.42/share The investment case for Metro is simple, ultra-low risk and potentially high returning. The company is fully financed and has begun construction of the 6Mtpa bauxite mine, Bauxite Hills. Located in the world class Weipa bauxite region in Cape York, Australia, the mine is due to come on stream in Q2/2018. At the bottom of the second quartile of the cost curve, Metro will export a DSO product over a 17 year life of mine. Our NAV of the fully funded company is A$0.42; equivalent to 147% upside from the current share price. Key points: Substantially de-risked project Following the recent capital raises of approximately A$40 million debt and A$38 million equity, the construction of the mine is fully funded through to first production of 2Mtpa (A$35.8 million capex) and subsequent A$36.7 million expansion to 6Mtpa. Metro will mine DSO which will be transported onto a barge using a new barge loading facility which is currently being constructed. It is then transhipped to ocean going vessels and loaded using cranes and grabs. There are few operations in mining that could be easier to ramp up. Simple low cost mining First production is due in Q2 2018 after the next rainy season. Mining of the 92.2Mt reserve is as simple as it gets; firstly removing the 0.5m overburden and then mining the 1.75m bauxite horizon. The product is then screened and loaded on a barge. Life of mine cash costs are A$23/t, including total royalties, which at current bauxite pricing delivers a c.38% margin. This also implies that the mine will sit near the bottom of the second quartile of the cost curve on a CFR basis delivered into China. Whilst contractor mining was assumed in the BFS, following the recent capital raise Metro is exploring an owner operator model which we estimate to be accretive to NPV, and funded with the current cash balance. We have not included this potential upside in our numbers at this stage. Sought after product We note that the neighbouring Amrun bauxite project was one of only three projects to which Rio Tinto has recently allocated capital. Clearly, they recognise that China is running out of decent quality bauxite and Australia is literally the first port of call. Metro has secured a 7Mt over four years’ foundation off-take agreement with Xinfa, China’s second largest private bauxite importer. Proven “fit for purpose” management team Metro’s management team is highly experienced including Simon Finnis (CEO), 30yrs experience, having recently overseen construction of the US$650 million Grand Côte mineral sands operation in Senegal. GM of operations, Charles Easton, had five years at Weipa. Norman Ting was the former marketing manager for Comalco (Rio Tinto Alcan) Bauxite and has 30 years’ experience in the bauxite industry. A Cash Cow in Queensland We would expect Metro, like all high margin single mine companies, to become a cash dispensing machine fairly early on in its profile. Estimated project free cashflow of c.A$18 million for June YE 2019 will be used in part to fund the expansion to 6Mtpa. EBITDA is forecast to grow from A$1.6 million in the 2018 financial year to A$65.9 million in 2021 delivering a steady state free cashflow of A$50 million plus. Private Equity Style Returns We believe the current NAV is A$0.42/share rising to A$0.56/share in 2020. Our forward looking EV/EBITDA profile moves from 108.2x in the 2018 financial year (capturing just the start of production) to 3.8x two years later. The market normally attributes high single digit multiples to stable cash flows so we believe a near term price target of A$0.42 is justifiable. Analyst: David Butler Summary Last price (A$): 0.17 Target price (A$): 0.42 Projected return (%) 147% Project Details Project name Bauxite Hills Commodity Bauxite Production (Mtpa) 2.0 -> 6.0 Tamesis NPV10% (A$m) 525 Share Data Shares o/s (mm) 1,286* 52 week high/low (A$) 0.185/0.096 3-mth avg. daily vol (mm) 0.78 3-mth avg. daily vol (A$) 0.12 Market cap (A$m) 205 Net cash/(debt)* (A$m) 33 Enterprise value (A$m) 172 *post tranche 2 equity raise June Year End Financial Data 2018 2019 2020 Revenue (A$m) 31 110 171 EBITDA (A$m) 2 22 45 Net income (A$m) (7) 12 33 EPS (A$ ¢/share) (0.54) 0.91 2.55 P/E (x) - 18.7 6.7 EV/EBITDA (x) 108.2 7.8 3.8 Share Price Performance Contact Details David Butler [email protected] David Baker [email protected] Charlie Bendon [email protected] Richard Greenfield [email protected] Mitch Limb [email protected] Charles Vaughan [email protected] 0.0 2.0 4.0 6.0 8.0 10.0 0.08 0.10 0.12 0.14 0.16 0.18 0.20 07-16 10-16 01-17 04-17 07-17
Transcript of Metro Mining · The BFS, released by Metro in March 2017, outlines a A$601 million ... expanding...

Metro Mining
Emerging Low Cost Bauxite Producer
MMI AU
2 August 2017
Last price: A$0.17
Target price: A$0.42
Prepared by Tamesis Partners LLP See final two pages for important disclosures
1
Price Target: A$0.42/share
The investment case for Metro is simple, ultra-low risk and potentially high returning. The company is fully financed and has begun construction of the 6Mtpa bauxite mine, Bauxite Hills. Located in the world class Weipa bauxite region in Cape York, Australia, the mine is due to come on stream in Q2/2018. At the bottom of the second quartile of the cost curve,
Metro will export a DSO product over a 17 year life of mine. Our NAV of the fully funded company is A$0.42; equivalent to 147% upside from the current share price. Key points:
Substantially de-risked project
Following the recent capital raises of approximately A$40 million debt and A$38 million equity, the construction of the mine is fully funded through to first production of 2Mtpa (A$35.8 million capex) and subsequent A$36.7 million expansion to 6Mtpa. Metro will mine DSO which will be transported onto a barge using a new barge loading facility which is currently being constructed. It is then transhipped to ocean going vessels and loaded using cranes and grabs. There are few operations in mining that could be easier to ramp up.
Simple low cost mining
First production is due in Q2 2018 after the next rainy season. Mining of the 92.2Mt reserve is as simple as it gets; firstly removing the 0.5m overburden and then mining the 1.75m bauxite horizon. The product is then screened and loaded on a barge. Life of mine cash costs are A$23/t, including total royalties, which at current bauxite pricing delivers a c.38% margin. This also implies that the mine will sit near the bottom of the second quartile of the cost curve on a CFR basis delivered into China. Whilst contractor mining was assumed in the BFS, following the recent capital raise Metro is exploring an owner operator model which we estimate to be accretive to NPV, and funded with the current cash balance. We have not included this potential upside in our numbers at this stage.
Sought after product
We note that the neighbouring Amrun bauxite project was one of only three projects to which Rio Tinto has recently allocated capital. Clearly, they recognise that China is running out of decent quality bauxite and Australia is literally the first port of call. Metro has secured a 7Mt over four years’ foundation off-take agreement with Xinfa, China’s second largest private bauxite importer.
Proven “fit for purpose” management team
Metro’s management team is highly experienced including Simon Finnis (CEO), 30yrs experience, having recently overseen construction of the US$650 million Grand Côte mineral sands operation in Senegal. GM of operations, Charles Easton, had five years at Weipa. Norman Ting was the former marketing manager for Comalco (Rio Tinto Alcan) Bauxite and has 30 years’ experience in the bauxite industry.
A Cash Cow in Queensland
We would expect Metro, like all high margin single mine companies, to become a cash dispensing machine fairly early on in its profile. Estimated project free cashflow of c.A$18 million for June YE 2019 will be used in part to fund the expansion to 6Mtpa. EBITDA is forecast to grow from A$1.6 million in the 2018 financial year to A$65.9 million in 2021 delivering a steady state free cashflow of A$50 million plus.
Private Equity Style Returns
We believe the current NAV is A$0.42/share rising to A$0.56/share in 2020. Our forward looking EV/EBITDA profile moves from 108.2x in the 2018 financial year (capturing just the start of production) to 3.8x two years later. The market normally attributes high single digit multiples to stable cash flows so we believe a near term price target of A$0.42 is justifiable.
Analyst: David Butler
Summary
Last price (A$): 0.17
Target price (A$): 0.42
Projected return (%) 147%
Project Details
Project name Bauxite Hills
Commodity Bauxite
Production (Mtpa) 2.0 -> 6.0
Tamesis NPV10% (A$m) 525
Share Data
Shares o/s (mm) 1,286*
52 week high/low (A$) 0.185/0.096
3-mth avg. daily vol (mm) 0.78
3-mth avg. daily vol (A$) 0.12
Market cap (A$m) 205
Net cash/(debt)* (A$m) 33
Enterprise value (A$m) 172
*post tranche 2 equity raise June Year End
Financial Data 2018 2019 2020
Revenue (A$m) 31 110 171
EBITDA (A$m) 2 22 45
Net income (A$m) (7) 12 33
EPS (A$ ¢/share) (0.54) 0.91 2.55
P/E (x) - 18.7 6.7
EV/EBITDA (x) 108.2 7.8 3.8
Share Price Performance
Contact Details
David Butler
David Baker
Charlie Bendon
Richard Greenfield
Mitch Limb
Charles Vaughan
0.0
2.0
4.0
6.0
8.0
10.0
0.08
0.10
0.12
0.14
0.16
0.18
0.20
07-16 10-16 01-17 04-17 07-17

Prepared by Tamesis Partners LLP See final two pages for important disclosures
2
Table of Contents
Price Target: A$0.42/share .................................................................................................................................................... 1
Company Summary .............................................................................................................................................................. 3
Valuation ............................................................................................................................................................................. 8
Financials........................................................................................................................................................................... 13
Bauxite Market ................................................................................................................................................................... 16

Prepared by Tamesis Partners LLP See final two pages for important disclosures
3
Company Summary
Overview
The Bauxite Hills project is c.95km north of Weipa in Northern Queensland, on the west side of Cape York and consists of a number
of bauxite plateaus located next to the Skardon River. The region is renowned for its export-grade bauxite, an aluminium ore.
Figure 1 – Location Map and Key Project Information
Key Statistics
Ownership Metro (100%)
Commodity Bauxite
Product Type DSO
Reserves 92.2Mt
Resources 144.8Mt
Status In construction
BFS Highlights
Construction H2/2017
Production April 2018
Start-up Production 2Mtpa
Steady state Production 6Mtpa
Pre-production Capex* A$35.8m
Expansion Capex* A$36.7m
Costs (LoM average) A$16.4/t on site A$23.0/t +royalty
Mine Life 17 years (initial)
*Assumes contractor mining Source: Metro Mining
Metro acquired the Bauxite Hills project in 2014 through a merger with Cape Alumina, and completed a pre-feasibility study in
February 2015. After completing the acquisition of neighbouring deposits owned by Gulf Alumina in early 2017, a bankable feasibility
study was completed by MEC Mining in March 2017. Pre-construction work has already commenced on site and first production is
expected in Q2/2018.
Project Highlights
Bauxite Hills’ reserves support an initial 17 year mine life producing export-quality DSO bauxite. Production is expected to commence
in Q2/2018 at an initial run rate of 2Mtpa which will ramp up to 6Mtpa over the first four years. The operation itself is fairly
straightforward: free-dig bauxite is mined by front end loaders and hauled by truck to port infrastructure.
At the port, the bauxite ore will be screened to a maximum size of 100mm and loaded onto barges. Tugs will tow the barges down
the Skardon River and the ore will be transhipped to freighters at a point beyond the river month. One quirk of the location is the
seasonality of the weather. During the wet season (January to March), all mining ceases with operations resuming in April.

Prepared by Tamesis Partners LLP See final two pages for important disclosures
4
Figure 2 – Simple mining method
Source: Metro Mining
Geology and Mineralisation
The deposit is a lateritic bauxite forming part of the Weipa plateau. The deposit typically consists of a single layer of bauxite, 0.5m
– 3m thick, underlain by a kaolin clay and ironstone. Bauxite occurs naturally over the majority of the plateau areas, is pisolithic in
form and is generally only covered by a small layer of soil overburden. Most of the bauxite is loose and free flowing, suitable for free
digging and DSO operation. It is expected that any cemented bauxite will break up as it is handled by the mining fleet or through
screening. Any oversized material will be collected at the port and will be campaign crushed if economic to do so. Otherwise the
oversize will be back-loaded to the mining areas.
Reserves and Resources
As part of the BFS, MEC calculated a Proven and Probable reserve of 92.2Mt at 49.4% total Al2O3 and 13.2% silica. The reserves are
reported on a 10% moisture basis to reflect the run of mine marketable product tonnes. Bauxite Hills also reports a resource of
144.8Mt at 49.2% Al2O3 and 13.9% silica.
Figure 3 – Metro Mining Reserves and Resources
Reserves Wet Tonnes
(Mt) Al2O3 (%)
SiO2 (%)
Proven 48.3 49.8 12.0
Probable 43.9 49.0 14.6
Total 92.2 49.4 13.2
Resources Dry Tonnes
(Mt) Al2O3 (%)
SiO2 (%)
Measured 54.7 50.0 11.9
Indicated 66.4 49.2 14.7
Inferred 23.7 47.4 16.0
Total 144.8 49.2 13.9
Source: Metro Mining
Regional Consolidation: Gulf Alumina Acquisition
Metro acquired the neighbouring tenements at Bauxite Hills through a A$50 million takeover of privately held Gulf Alumina in February
2017. Having previously acquired 39% of Gulf Alumina in a previous takeover attempt, the acquisition process was disrupted by Moly
Mines (MOL:ASX) – which at the time was suspended from the ASX. The bid by Chinese-controlled Moly was controversial as its
major shareholder, Hanlong Mining, had a former managing director jailed in Australia for insider trading in connection with Hanlong’s
failed bid for Sundance Resources.
This was resolved in November 2016 when the ASX ruled that it would not allow Moly to resume trading.
The Gulf acquisition effectively doubled the resource base of the company:

Prepared by Tamesis Partners LLP See final two pages for important disclosures
5
Figure 4 – Pre-acquisition resource statement
Reserves Dry DSO Tonnes
(Mt) Al2O3 (%)
SiO2 (%)
Available Al2O3 % (THA)
Reactive SiO2 (%)
Metro Reserves 48.2 50.5 11.2 38.4 6.4
Gulf Reserves 48.4 49.4 14.7 40.3 6.1
Total 96.5 49.9 12.9 39.4 6.3
Source: Metro Mining
Additionally, the acquisition included critical infrastructure for the Bauxite Hills project, including airstrip, haul roads and port location,
previously used by a kaolin mine.
Bankable Feasibility Study
The BFS, released by Metro in March 2017, outlines a A$601 million (US$451 million) NPV at a 10% discount rate. Initial capital
expenditure was estimated at A$35.8 million over a 5 month construction period. Additionally, there is estimated expansion capital
of A$36.7 million in years two and three, expanding capacity through integrated truck dumps and screens, upgraded haul roads and
transhipment upgrades.
Figure 5 – BFS Key Results and Assumptions
Description Result
Assumption Result
NPV (10%) A$601m Annual Production Rate (Steady State) 6Mtpa
IRR 81% LOM Production 92.2Mt
Payback Period of Initial Capital 1.7 years Mine Life 17 years
LOM revenue A$5.6b Bauxite Price US$36.36-53.88/t
LOM EBITDA A$2.5b Exchange Rate (AUD/USD) 0.75
LOM Average Annual EBITDA A$145m Discount Rate 10%
LOM on-site Average Opex A$16.42/t Initial Capital Expenditure* A$35.8m
LOM Average Opex including Royalty A$23.00/t LOM Average Operating Margin A$26.69/t
*Assumes contractor mining
Source: Metro Mining
Costs are expected to be competitive due to the straightforward free-dig DSO haul and barge operation and the transportation
advantage to China from the north of Australia. Metro forecasts the Bauxite Hills mine to be towards the front of the second quartile
of the cost curve on a seaborne value-in-use adjusted basis:
Figure 6 – China Seaborne Bauxite Supply Cost Curve 2019 – Value-in-use Adjusted (US$/Dmt CFR)
Source: CM Group, Metro Mining

Prepared by Tamesis Partners LLP See final two pages for important disclosures
6
Off-take Agreements
Metro has announced two off-take agreements with bauxite importers in Shandong Province, China. The first is a binding take or
pay off-take with Xinfa Group, China’s second largest private bauxite importer, for 7Mt of bauxite, or approximately 50% of the first
4 years’ production. Pricing has been agreed through an established alumina index and shipping rates and product specifications are
agreed in advance.
A letter of intent has been received by Shandong Lubei Enterprise Group General Company (“Lubei”), where Lubei has indicated that
they would take 0.5-1.0Mtpa bauxite for a minimum of three years under a market-linked pricing structure. The letter is currently
non-binding; binding terms and conditions are being negotiated.
Licencing and Permitting
The final environmental approvals for Bauxite Hills were received in June 2017 from the Australian Federal Government. This followed
receipt of the Queensland State Government approvals earlier that month. The approvals allow for production of 10Mtpa, well above
forecast steady state production of 6Mtpa. Previously, the company had received approvals from the Queensland Department of
Environment and Heritage for the Skardon River Project in December 2016 and Commonwealth Environmental Approval in September
2016.
Following the acquisition of Gulf Alumina, the company has consolidated the Native Title agreements that were previously in place
at both Bauxite Hills and Gulf’s Skardon River project. The new agreement has continued the company’s strong relations with the
Ankamuthi People, Traditional Owners and OMAC, the trustee owner of the land. The company has a Cultural Heritage Plan and
rehabilitation plan in place. In a positive for community relations, Metro expects in the longer term to employ 200 people with a 30%
indigenous target.
Shareholders
Metro has a strong mix of private equity and institutional investors on its register. Greenstone (20% shareholder) is a specialist
mining private equity fund who typically take strategic long-term positions in mining projects. Another cornerstone investor, Balanced
Property (16%), has been a shareholder since 2014. DADI (6%) is China’s largest coal industry engineering group. Prominent mining
funds including Blackrock and Colonial First State Investments are included amongst the institutional investors.
Figure 7 – Metro Mining Shareholders
Source: Metro Mining
Greenstone20%
DADI6%
Balanced Property16%
Institutions26%
Other Shareholders32%

Prepared by Tamesis Partners LLP See final two pages for important disclosures
7
Management
In our view, Metro’s management is well suited to develop and operate the Bauxite Hills mine. The board and management have
collectively been involved in the development and operation of over 30 mines globally. Key individuals are:
Figure 8 – Key Management
Management Biography
Simon Finnis (MD & CEO)
• Joined Metro as CEO in 2015 • Mining executive with 30+ years’ experience • Former CEO of Grande Cote Mineral Sands operations in Senegal and responsible
for $650m greenfield project development
Scott Waddell (CFO & Company Secretary)
• Past senior roles with Anglo American and Rio Tinto Alcan • Senior roles with Metro since 2010 • CPA with extensive experience in global bauxite and alumina
Charles Easton (GM, Bauxite Hills Mine)
• Geologist with 30+ years’ experience • Previous GM at Theiss • 5 years at Weipa managing mine planning and refinery performance
Mike O’Brien (Project Manager)
• Mining engineer with 40+ years’ experience • 25+ years senior management experience with Anglo American and Shell
Duane Woodbury
(Finance and Business Development)
• 20+ years’ experience in banking and finance
• Senior roles with Macquarie and CFO of Kingsgate (KCN:ASX) • Significant equity and debt capital raising experience
Norman Ting (GM, Marketing)
• 30+ years bauxite industry and marketing experience • Former Chairman of Traxys China and senior executive of WOGEN UK, HK and
China • Former Marketing Manager for Comalco (Rio Tinto Alcan)
Colleen Fish (Environmental Manager)
• Environmental scientist with 25+ years’ experience • Former environmental manager for Peabody Coal (BTU:NYSE) in Queensland
Source: Metro Mining

Prepared by Tamesis Partners LLP See final two pages for important disclosures
8
Valuation
Overview – Initiating with a Target Price of A$0.42/share
We value Metro Mining using a sum of the parts (SotP) valuation, combining a discounted cashflow (DCF) valuation of the Bauxite
Hills project, cash (including the net proceeds of the cash from the recent debt and equity financing), debt, and the present value of
Metro’s corporate costs and SG&A. Our assumptions are primarily in line with the company’s BFS; key changes are primarily due to
foreign exchange rates. We are using a discount rate of 10% which is in line with our estimated cost of Metro’s debt.
Figure 9 – Metro Mining Valuation
Metro Mining Valuation Ownership NPV
(A$m) Multiple
(x) NAV
(A$/sh)
Bauxite Hills 100% 525 1.0 0.41
Cash 100% 73 1.0 0.06
Debt 100% (40) 1.0 (0.03)
SG&A & central 100% 17.4 1.0 (0.01)
Total 541 0.42
Source: Tamesis
Following the close of the second tranche of the A$38 million equity raise we forecast Metro will have 1,271 million shares outstanding.
On a per share basis, our NAV of A$541 million equates to A$0.42/share, a 148% premium to the current share price of A$0.17/share.
Net Asset Value Progression
Over time, we would expect the Metro NAV and NAV/share to increase as the capital is spent and the company moves into a cash
generation phase. Our forecast is for the NAV/share to move to A$0.47/share by June 2018 and A$0.51/share by June 2019, a 2.7x
and 3.0x multiple of the current Metro share price.
Figure 10 – Metro Production Schedule (June Year End)
Source: Tamesis
The rate of NAV appreciation is fairly consistent over the life of the project, with a CAGR of 9.8% to 2021 and 8.8% to 2026. This
appears attractive given the minimal risk of dilution from this point in time, the current price discount to NAV, and the near term
profitability of the company.
Sensitivity
We have varied a number of our input parameters by 10% to see the effect on the base case NPV at Bauxite Hills. Naturally the
change in bauxite price has the largest impact, followed by the Australian dollar exchange rate as nearly all on-site costs are in
Australian dollars whilst revenue is in US dollars. The next most sensitive impact is the rate of production.
Naturally the 10% change in discount rate has an equivalent effect on NPV, whilst site operating costs, ocean freight, product
discount and capex all are relatively less sensitive.
2.5x2.7x
3.0x3.3x
3.6x3.9x
4.2x4.6x
4.9x5.3x
5.6x5.9x
6.2x6.4x
6.7x 6.8x 7.0x 7.0x
(0.20)
0.00
0.20
0.40
0.60
0.80
1.00
1.20
1.40
1.60
1.80
2.00
(200)
0
200
400
600
800
1,000
1,200
1,400
1,600
1,800
2,000
2017 2018 2019 2020 2021 2022 2023 2024 2025 2026 2027 2028 2029 2030 2031 2032 2033 2034
Bauxite Hills NPV (A$m) Cash (A$m)
Debt (A$m) SG&A (A$m)
NAV/Share (A$/share, multiple to spot price)

Prepared by Tamesis Partners LLP See final two pages for important disclosures
9
Figure 11 – Bauxite Hills NPV Sensitivities
Source: Tamesis
Production
Metro’s production is forecast to increase to a run rate of 6Mtpa by the 2022 financial year. This will require the second tranche of
expansion capital to upgrade the onshore facilities and barge capacity, this can be funded through cash flow. We note that Metro
has environmental permitting to increase production to 10Mtpa and that the inferred resources are not included in the mine plan, so
there is potential both to bring reserves already in the mine plan forward and to add new tonnes and mine life extension.
Figure 12 – Metro Production Schedule (June Year End)
Source: Tamesis
Revenue
Revenue naturally increases with production volumes, and we are assuming an increasing net bauxite price received reflecting
price forecasts from CBIX, a "value in use" CFR reference price for a standard gibbsitic bauxite (5% reacting silica, 10% moisture,
50% reacting alumina). We have adjusted this reference price down by 10% to account for an expected product quality discount
against this reference price in line with the assumptions set out in the company’s BFS.
Figure 13 – Bauxite Price Deck
2017 2018 2019 2020 2021 2022 2023 2024 2025 2026
Bauxite Reference Price (US$/t) 40 39 42 40 40 39 42 44 50 58
Discount 10% 10% 10% 10% 10% 10% 10% 10% 10% 10%
Metro Realised Price (US$/t) 36 35 38 36 36 35 38 40 45 52
FX (AUD/USD) 0.8 0.8 0.8 0.8 0.8 0.8 0.8 0.8 0.8 0.8
Metro Realised Price (A$/t) 45 44 47 45 45 44 47 50 56 65
Source: Tamesis
0% 5% 10% 15% 20% 25% 30%
Capex
Product discount
Ocean freight
Site operating costs
Discount rate
Production rate
AUD:USD
Bauxite price
0
1,000
2,000
3,000
4,000
5,000
6,000
7,000
2018 2020 2022 2024 2026 2028 2030 2032 2034
Ore mined (kt)

Prepared by Tamesis Partners LLP See final two pages for important disclosures
10
We note that the current spot price of bauxite is currently trading at c.US$48/t according to the same CBIX reference index so there
is potential upside to our commodity price forecasts if market conditions remain.
Figure 14 – Revenue and bauxite price
Source: Tamesis
Operating Costs
Operating costs are dominated by on-site costs, transhipping, royalties and ocean freight. On a unit basis, we are expecting costs
to remain fairly constant over the life of mine.
Figure 15 – Operating costs
Source: Tamesis
Interestingly, ocean freight is the single greatest expense, totalling 34% of operating costs. This underlines the structural competitive
advantage Metro has over other mines which have longer shipping distances, in particular the emerging Guinean projects which
would be worse off if global shipping rates were to rise from current lows.
On-site mining, hauling and loading, transhipping and royalties are all approximately 20% of operating costs.
0
20
40
60
0
200
400
600
2018 2020 2022 2024 2026 2028 2030 2032 2034
Net revenue (A$m) Net bauxite price (CFR China) (US$/wmt)
0
10
20
30
40
50
60
0
50
100
150
200
250
300
2018 2019 2020 2021 2022 2023 2024 2025 2026 2027 2028 2029 2030 2031 2032 2033 2034 2035
Mining, haulage, barge loading (A$m) Transhipment (A$m)
Site SG&A (A$m) Ocean freight (A$m)
Total royalties (A$m) Total site costs (A$/t)

Prepared by Tamesis Partners LLP See final two pages for important disclosures
11
Figure 16 – Operating cost split
Source: Tamesis
Capital Costs
Capital expenditure is naturally weighted towards the beginning of the mine life, with expansion capital of A$35.8 million in the 2018
financial year and US$36.7 million in 2020. We are assuming sustaining capital of A$1.3 million at steady state production and an
environmental bond of A$6 million taken in two tranches and returned at the end of the mine life.
Funding
Metro is fully financed to 6Mtpa through a combination of debt and equity fundraising, and cash flow from initial operations.
Debt
In June, Metro announced that Sprott Private Resource Lending and Ingatus (a related party to major shareholder Balanced Property)
had agreed to provided debt finance facilities of approximately A$40 million. The proceeds are to be used towards capital expenditure,
working capital purposes and repayment of a A$15 million short term facility through Namrog Pty Ltd (also a related party to Balanced
Property).
The key terms of the debt are as follows:
• Tenor of approximately 3 years
• Attractive annual interest rate – we estimate 10%
• No principal amortisation before January 2019 and A$20 million payment at end of loan
• No commitment fees
• No hedging requirements
• Low level of cash reserving and no mandatory cash sweep
• Low number of Metro options (number not yet disclosed) with strike price to reflect 25% premium to Metro share price
Equity
In addition, Metro has raised a total of A$38 million in new equity over two tranches. The first tranche raised A$33.9 million for 251
new shares which utilised the company’s placement capacity. The remaining A$4.1 million has been subscribed for and will be issued
subject to shareholder approval at a General Meeting scheduled for late August 2017. Positively, the equity placement was heavily
oversubscribed, with participation from both existing key shareholders and new institutions.
Fundraising – Sources and Uses
The cash raised from the debt and equity fundraising will be used for the remaining costs to first production. A table of sources and
uses from the July 2017 company presentation is below:
Mining, Hauling, Loading20%
Transhipment19%
Site SG&A7%
Ocean Freight34%
Royalties20%

Prepared by Tamesis Partners LLP See final two pages for important disclosures
12
Figure 17 – Sources and uses of funds to first production
Sources Amount (A$m)
Uses
Amount (A$m)
Equity Raising 38.0 Remaining Capital Costs (Including truck haulage fleet) 38.0
Debt Financing Package 40.0 Drilling (exploration and grade control) 4.0
Cash on hand (30-June 2017) 15.3 Financial Assurance & Environmental Costs 4.0
Pre-production Costs 5.0
Corporate Office 4.0
Financing Costs (including 12 months’ interest) 5.1
Refinanced Short Term Loan Facility 15.0
Working Capital & Liquidity Reserves 16.3
Costs of the Equity Raising 1.9
Total 93.3 Total 93.3
Source: Metro Mining
In the company’s most recent presentation we note that Metro are assessing a hybrid owner mining/contracting model which would
explain the difference between our capital expenditure estimate to first production (A$35.8 million). We are not including this in our
valuation at this stage but expect it to be accretive in NPV terms should the company choose to proceed.
The published uses of funds include full allowance for pre-production costs, drilling, corporate and finance costs, as well as working
capital and liquidity requirements.
Ongoing Cash Balance
This fundraising has left Metro with enough of a cash buffer in the near term, without taking into account any contingencies in the
capital estimates, to be able to weather any delays or unforeseen issues. We highlight that the A$38 million remaining capex budget
includes a contingency of 10%, in addition to the A$16.3 million liquidity and working capital reserves raised as part of the recent
fundraising. This cash buffer is particularly attractive when compared to the modest capital required to first production of 2Mtpa and
the subsequent expansion to 6Mtpa in 2020.
Figure 18 – Metro estimated cash balance
Source: Tamesis
15
38
26
42
31
55
10
3932
93
-
20
40
60
80
100
Jun-17 Dec-17 Jun-18 Dec-18 Jun-19 Dec-19 Jun-20 Dec-20 Jun-21 Dec-21
Cash and cash equivalents (A$m)

Prepared by Tamesis Partners LLP See final two pages for important disclosures
13
Financials
Income Statement
Figure 19 – Income Statement
June Year End 2018 2019 2020 2021 2022
Revenue A$m 31.5 109.8 171.4 243.5 273.2
COGS A$m (24.1) (72.5) (103.5) (146.7) (166.5)
Operating profit A$m 7.4 37.4 67.8 96.8 106.7
Admin expenses A$m (2.0) (2.0) (2.0) (2.0) (2.0)
Depreciation A$m (5.2) (6.5) (7.5) (9.4) (9.5)
Royalties A$m (3.8) (13.4) (20.7) (28.9) (32.2)
Other expenses A$m - - - - -
Profit before interest & tax A$m (3.6) 15.4 37.6 56.5 63.1
Interest paid A$m (3.3) (3.9) (2.9) (0.2) -
Interest received A$m 0.1 0.2 0.2 0.1 0.3
Corporate tax A$m - - (2.2) (17.5) (19.5)
Profit after tax A$m (6.8) 11.7 32.7 38.9 43.9
Non-controlling interests A$m - - - - -
Foreign exchange A$m - - - - -
Net income A$m (6.8) 11.7 32.7 38.9 43.9
EBITDA A$m 1.6 22.0 45.2 65.9 72.5
Earnings per share A$ cents (0.5) 0.9 2.5 3.0 3.4
Cash flow per share A$ cents 0.8 0.4 (1.6) 1.7 4.1
Source: Tamesis, Metro Mining
Revenues are first expected in the 2018 financial year and are expected to grow to A$119.6 million in 2022, a CAGR of 72%.
Additionally, EBITDA is forecast to grow from A$2.9 million in 2018 to A$83.4 million in 2022, a CAGR of 160%. Australian federal
corporate tax of 30% will become payable in 2019 after a carried tax loss of approximately A$50 million is covered.
Figure 20 – Net Revenue, EBITDA and Net Income
Source: Tamesis
0
50
100
150
200
250
300
350
400
450
500
2018 2020 2022 2024 2026 2028 2030 2032 2034
Net revenue (A$m) EBITDA ($Am) Net income (A$m)

Prepared by Tamesis Partners LLP See final two pages for important disclosures
14
Cashflow Statement
Figure 21 – Cashflow Statement
June Year End 2018 2019 2020 2021 2022
Profit / (loss) A$m (3.6) 15.4 37.6 56.5 63.1
Depreciation A$m 5.2 6.5 7.5 9.4 9.5
Interest received A$m 0.1 0.2 0.2 0.1 0.3
Interest paid A$m (3.3) (3.9) (2.9) (0.2) -
Foreign exchange A$m - - - - -
Movement in working capital A$m (10.1) (5.5) (7.9) (4.3) 0.8
Corporate tax A$m - - (2.2) (17.5) (19.5)
Cash flow from operations A$m (11.7) 12.8 32.3 44.0 54.1
Capital expenditure (PP&E) A$m (36.0) (0.9) (37.7) (1.3) (1.3)
Environmental bond A$m (3.0) - (3.0) - -
Cash flow from investing A$m (39.0) (0.9) (40.7) (1.3) (1.3)
Proceeds of equity offering A$m 36.1 - - - -
Borrowings / (repayments) A$m 25.0 (6.3) (12.6) (21.1) -
Cash flow from financing A$m 61.1 (6.3) (12.6) (21.1) -
Net change in cash A$m 10.4 5.6 (21.0) 21.6 52.8
Cash balance A$m 25.7 31.2 10.2 31.8 84.7
Source: Tamesis, Metro Mining
We forecast the company to have negative A$10.8 million cashflow from operations in the year to June 2018, primarily due to a
working capital outflow of A$10.5 million as the mine ramps up to first production. This, and the A$36 million of capital expenditure
will be funded by the net proceeds of the equity raising (c.A$36.1m) and the net proceeds of the new A$40 million Sprott and Ingatus
facility after repaying the A$15 million short term facility.
We expect repayments of the new debt facilities over the next three year and the company to be debt free by the 2021 financial
year.
Figure 22 – Net Cash Position
Source: Tamesis
(100)
(50)
-
50
100
150
200
250
2017 2018 2019 2020 2021 2022 2023
Cash and cash equivalents (A$m) Debt (A$m) Net Cash (A$m)
Prepared by Tamesis Partners LLP See final two pages for important disclosures
15
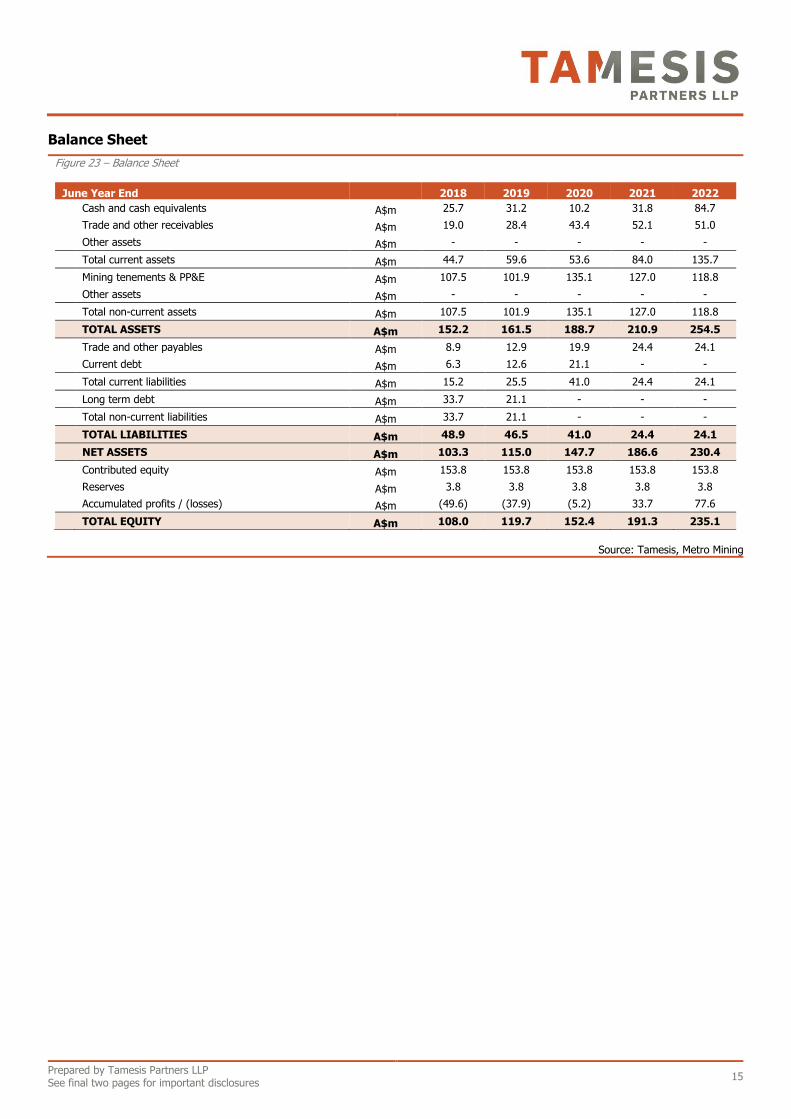
Balance Sheet
Figure 23 – Balance Sheet
June Year End 2018 2019 2020 2021 2022
Cash and cash equivalents A$m 25.7 31.2 10.2 31.8 84.7
Trade and other receivables A$m 19.0 28.4 43.4 52.1 51.0
Other assets A$m - - - - -
Total current assets A$m 44.7 59.6 53.6 84.0 135.7
Mining tenements & PP&E A$m 107.5 101.9 135.1 127.0 118.8
Other assets A$m - - - - -
Total non-current assets A$m 107.5 101.9 135.1 127.0 118.8
TOTAL ASSETS A$m 152.2 161.5 188.7 210.9 254.5
Trade and other payables A$m 8.9 12.9 19.9 24.4 24.1
Current debt A$m 6.3 12.6 21.1 - -
Total current liabilities A$m 15.2 25.5 41.0 24.4 24.1
Long term debt A$m 33.7 21.1 - - -
Total non-current liabilities A$m 33.7 21.1 - - -
TOTAL LIABILITIES A$m 48.9 46.5 41.0 24.4 24.1
NET ASSETS A$m 103.3 115.0 147.7 186.6 230.4
Contributed equity A$m 153.8 153.8 153.8 153.8 153.8
Reserves A$m 3.8 3.8 3.8 3.8 3.8
Accumulated profits / (losses) A$m (49.6) (37.9) (5.2) 33.7 77.6
TOTAL EQUITY A$m 108.0 119.7 152.4 191.3 235.1
Source: Tamesis, Metro Mining

Prepared by Tamesis Partners LLP See final two pages for important disclosures
16
Bauxite Market
Introduction
Bauxite is the primary mineral for producing alumina, which is used to produce aluminium. Approximately 4 to 7 tonnes of bauxite
are needed to produce two tonnes of alumina which can produce one tonne of aluminium. Bauxite is typically located close to the
earth’s surface formed by weathering aluminium rich rocks. Total world resources are c.29 billion tonnes, primarily in Guinea,
Australia, Brazil, Vietnam and Jamaica.
Mineralogy
The major minerals that occur in bauxite are Gibbsite (Al2OH3), Boehmite (γ-AlO(OH)), and Diaspore (α-AlO(OH)). There are many
deleterious materials that can have an impact on pricing but the key impurity is the level of silica. In general, any silica that reacts
in the refining process will cause increased consumption of caustic soda and equal losses of alumina in the refinery.
Gibbsite requires the lowest refining temperatures (c.150°C), Boehmite requires higher refining temperatures (c.240-260°C), whilst
Diaspore required the highest refining temperatures (>260°C).
Mining
Given the relatively low value of the ore, most production is near surface with low strip ratios. Most ore mined is suitable for DSO
with little to no beneficiation. Any processing on site is typically limited to crushing, screening and washing to remove clay minerals.
The mined out areas can then be backfilled with the removed overburden and re-vegetated.
Ore Processing
The Bayer process is the most economic process of obtaining alumina oxide from bauxite, invented by Karl Josef Bayer in 1887.
There are four main steps in this process: digestion, clarification, precipitation and calcination.
Figure 24 – Processing Alumina
Source: Australian Aluminium Council
The key input drivers are bauxite, caustic soda and electricity. As discussed earlier, the gibbsite bauxite is preferred by refineries as
it is able to be refined at lower temperatures than the other minerals.
The alumina is then processed into aluminium through smelting. The main method of smelting aluminium is the Hall-Héroult
process and consists of five steps: adding bath and alumina; anode; electrolysis; tapping; and primary casting. Electricity is the key
cost input, outside the alumina, so smelters are typically located in areas with reliable, low-cost electricity supply.

Prepared by Tamesis Partners LLP See final two pages for important disclosures
17
Figure 25 – Smelting Aluminium
Source: Australian Aluminium Council
Supply
The majority of world bauxite production is through integrated producers like Rusal, Rio Tinto, Alcoa, and Norsk Hydro. As a result,
emerging Chinese production dominates the non-integrated seabourne bauxite trade. Demand, primarily from China, has been
estimated to reach nearly 130Mtpa by 2026, growing at an average rate of 8% a year:
Figure 26 – Key bauxite/alumina freight routes
Source: Alumina Limited
Disruptions to supply, including the withdrawal of Indonesian from the export market (now relaxed but with very strict regulatory
requirements) and the Malaysian moratorium on mining due to environmental damage have left Chinese refineries seeking alternative
supply. This supply has come from Guinea or Brazil at higher freight costs, leaving a deficit in the Pacific region:
Prepared by Tamesis Partners LLP See final two pages for important disclosures
18
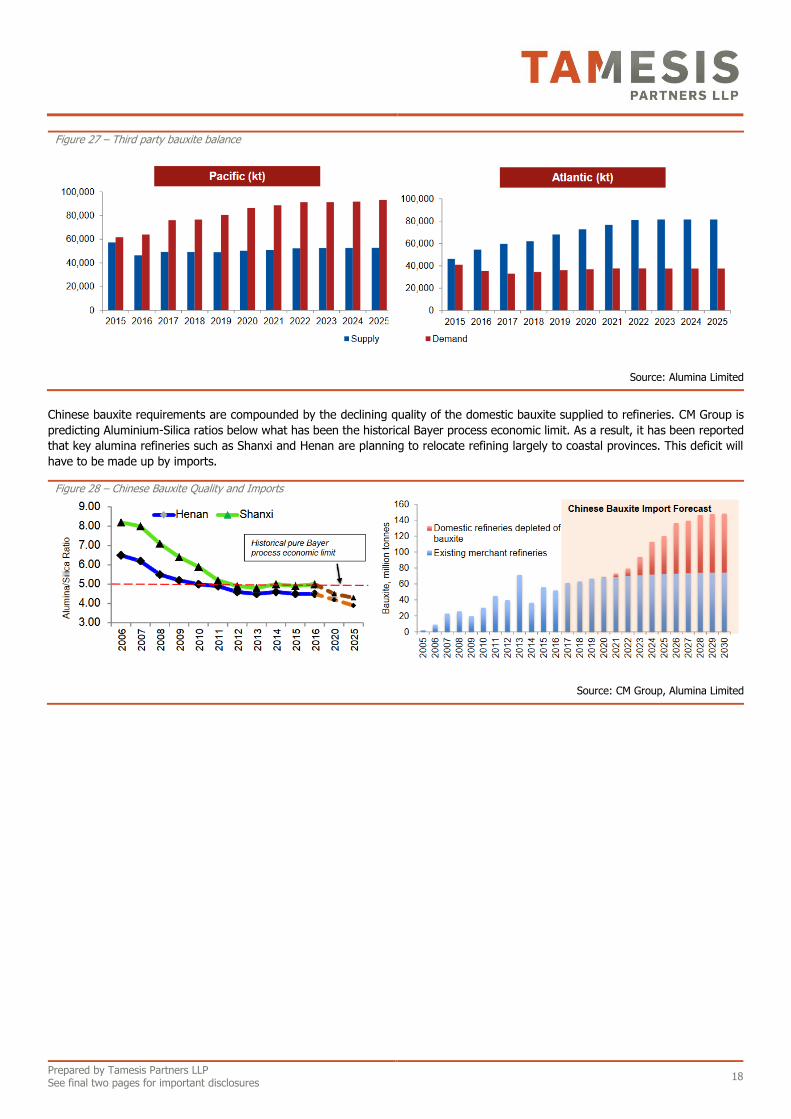
Figure 27 – Third party bauxite balance
Source: Alumina Limited
Chinese bauxite requirements are compounded by the declining quality of the domestic bauxite supplied to refineries. CM Group is
predicting Aluminium-Silica ratios below what has been the historical Bayer process economic limit. As a result, it has been reported
that key alumina refineries such as Shanxi and Henan are planning to relocate refining largely to coastal provinces. This deficit will
have to be made up by imports.
Figure 28 – Chinese Bauxite Quality and Imports
Source: CM Group, Alumina Limited

Prepared by Tamesis Partners LLP See final two pages for important disclosures
19
Demand
Aluminium is typically a mid-to-late cycle commodity, integral to industrialisation, urban growth and technological advances. Countries
with a high aluminium consumption typically have high GDP and well developed economies.
Figure 29 – Aluminium consumption per capita
Source: Cornerstone
Global aluminium demand remains strong, led by the transportation and construction sector.
Figure 30 – Aluminium consumption per capita
Source: Harbour Aluminium, Alumina Limited

Prepared by Tamesis Partners LLP See final two pages for important disclosures
20
Metro Mining MMI CASH FLOW ANALYSIS - A$m
ASX (June Year end) 2018E 2019E 2020E 2021E 2022E
As at 2-Aug-17
Profit / (loss) (A$m) (3.6) 15.4 37.6 56.5 63.1
Depreciation (A$m) 5.2 6.5 7.5 9.4 9.5
Share Price (AUD) 0.17 Target Price (AUD/sh) 0.42 Interest received (A$m) 0.1 0.2 0.2 0.1 0.3
Interest paid (A$m) (3.3) (3.9) (2.9) (0.2) -
Foreign exchange (A$m) - - - - -
Model Derived: Movement in working capital (A$m) (10.1) (5.5) (7.9) (4.3) 0.8
NAV (US$m, 10%) 541.0 Corporate tax (A$m) - - (2.2) (17.5) (19.5)
Cash flow from operations (A$m) (11.7) 12.8 32.3 44.0 54.1
Ordinary Shares (M) 1286* Capital expenditure (PP&E) (A$m) (36.0) (0.9) (37.7) (1.3) (1.3)
Market Cap (A$M) 205* Environmental bond (A$m) (3.0) - (3.0) - -
Enterprise Value (A$M) 172* Cash flow from investing (A$m) (39.0) (0.9) (40.7) (1.3) (1.3)
*post tranche 2
Proceeds of equity offering (A$m) 36.1 - - - -
Borrowings / (repayments) (A$m) 25.0 (6.3) (12.6) (21.1) -
Cash flow from financing (A$m) 61.1 (6.3) (12.6) (21.1) -
Price Assumptions
(June Year end) 2018E 2019E 2020E 2021E 2022E Net change in cash (A$m) 10.4 5.6 (21.0) 21.6 52.8
Cash balance (A$m) 25.7 31.2 10.2 31.8 84.7
AUD:USD Exchange Rate 0.80 0.80 0.80 0.80 0.80
CBIX Reference Price (US$/t) 39 42 40 40 39 BALANCE SHEET ANALYSIS - A$m
Net Realised Price (A$/t) 45 46 46 45 45 (June Year end) 2018E 2019E 2020E 2021E 2022E
Current Assets
Cash and Liquids 25.7 31.2 10.2 31.8 84.7
Inventory, Prepaid and Recievables 19.0 28.4 43.4 52.1 51.0
FINANCIAL SUMMARY - A$m Other 0.0 0.0 0.0 0.0
(June Year end) 2018E 2019E 2020E 2021E 2022E
Revenue 31.5 109.8 171.4 243.5 273.2 Non-Current Assets
EBITDA 1.6 22.0 45.2 65.9 72.5 Investments 0.0 1.0 2.0 3.0 4.0
Profit before Tax (3.6) 15.4 37.6 56.5 63.1 Fixed Assets 107.5 101.9 135.1 127.0 118.8
Net Income (6.8) 11.7 32.7 38.9 43.9 Other 0.0 0.0 0.0 0.0 0.0
EPS (A$ cents/sh) (0.54) 0.91 2.55 3.03 3.41 Current Liabilities
CFPS (A$ cents/sh) 0.81 0.43 (1.64) 1.68 4.11 Borrowings 6.3 12.6 21.1 0.0 0.0
FCF yield (%) - 5% - 20% 24% Creditors 8.9 12.9 19.9 24.4 24.1
Other 0.0 1.0 2.0 3.0 4.0
P/E - 18.7x 6.7x 5.6x 5.0x
EV/EBITDA 108.2x 7.8x 3.8x 2.6x 2.4x Non-Current Liabilities
Borrowings 33.7 21.1 0.0 0.0 0.0
Other 0.0 1.0 2.0 3.0 4.0
Equity 108.0 119.7 152.4 191.3 235.1
Net Cash/(Debt) -14.3 -2.4 -10.8 31.8 84.7
PROFIT AND LOSS STATEMENT - A$M
(June Year end) 2018E 2019E 2020E 2021E 2022E
Revenue 31.5 109.8 171.4 243.5 273.2 DIVISIONAL CASHFLOW - A$m 2018E 2019E 2020E 2021E 2022E
COGS (24.1) (72.5) (103.5) (146.7) (166.5)
Operating profit 7.4 37.4 67.8 96.8 106.7 Bauxite Hills (45.5) 17.6 (3.7) 44.7 54.5
Admin (2.0) (2.0) (2.0) (2.0) (2.0)
Depreciation (5.2) (6.5) (7.5) (9.4) (9.5)
Royalties (3.8) (13.4) (20.7) (28.9) (32.2) Total (45.5) 17.6 (3.7) 44.7 54.5
PBIT (3.6) 15.4 37.6 56.5 63.1
Interest (3.2) (3.7) (2.7) (0.1) 0.3
Tax - - (2.2) (17.5) (19.5)
Net income (6.8) 11.7 32.7 38.9 43.9
EBITDA 1.6 22.0 45.2 65.9 72.5
VALUATION A$m BAUXITE PRODUCTION (kt) 2018E 2019E 2020E 2021E 2022E
Bauxhite Hills 525 Bauxite Hills 750 2375 3713 5388 6125
Cash 73
Debt (40)
SG&A (17) Total 750 2375 3713 5388 6125
TOTAL NAV 541
Operating margin (%) 11% 22% 28% 28% 27%
NPV per Share 0.42 Total site costs (A$/t) 23.1 20.7 17.6 16.3 15.9
Total operating costs (A$/t) 39.0 35.7 33.5 32.6 32.5

Prepared by Tamesis Partners LLP See final two pages for important disclosures
21
Copyright and Risk Warnings
Metro Mining Limited (“Metro Mining” or the “Company”) is a corporate client of Tamesis Partners LLP.
Metro Mining is a corporate client of Tamesis Partners LLP (“Tamesis”). Tamesis may receive compensation for providing investment banking services to the Company and has received compensation for such services in the last 12 months.
This note is a marketing communication and NOT independent research. As such, it has not been prepared in accordance with legal requirements designed to promote the independence of investment research and this note is NOT subject to the prohibition on dealing ahead of the dissemination of investment research.
Not an offer to buy or sell
Under no circumstances is this note to be construed to be an offer to buy or sell or deal in any security and/or derivative instruments. It is not an initiation or an inducement to engage in investment activity under section 21 of the Financial Services and Markets Act 2000.
Note prepared in good faith and in reliance on publicly available information
Comments made in this note have been arrived at in good faith and are based, at least in part, on current public information that Tamesis considers reliable, but which it does not represent to be accurate or complete, and it should not be relied on as such. The information, opinions, forecasts and estimates contained in this document are current as of the date of this document and are subject to change without prior notification. No representation or warranty either actual or implied is made as to the accuracy, precision, completeness or correctness of the statements, opinions and judgements contained in this document.
Tamesis’ and related interests
The persons who produced this note may be partners, employees and/or associates of Tamesis. Tamesis and/or its employees and/or partners and associates may or may not hold shares, warrants, options, other derivative instruments or other financial interests in Metro Mining and reserve the right to acquire, hold or dispose of such positions in the future and without prior notification to Metro Mining, or any other person.
Information purposes only
This document is intended to be for background information purposes only and should be treated as such. This note is furnished on the basis and understanding that Tamesis is under no responsibility or liability whatsoever in respect thereof, to Metro Mining, or any other person.
Investment Risk Warning
The value of any potential investment made in relation to companies mentioned in this document may rise or fall and sums realised may be less than those originally invested. Any reference to past performance should not be construed as being a guide to future performance.
Investment in small companies, and especially mineral exploration companies, carries a high degree of risk and investment in the companies or minerals mentioned in this document may be affected by related currency variations. Changes in the pricing of related currencies and or commodities mentioned in this document may have an adverse effect on the value, price or income of the investment.
Distribution
This note is not for public distribution, nor for distribution to, or to be used by, or to be relied upon by any person other than the Company. Without limiting the foregoing, this note may not be distributed to any persons (or groups of persons), to whom such distribution would contravene the UK Financial Services and Markets Act 2000 or would constitute a contravention of the corresponding statute or statutory instrument in any other jurisdiction.
Disclaimer
This note has been forwarded to you solely for information purposes only and should not be considered as an offer or solicitation of an offer to sell, buy or subscribe to any securities or any derivative instrument or any other rights pertaining thereto (“financial instruments”). This note is intended for use by professional and business investors only. This note may not be reproduced without the prior written consent of Tamesis.
The information and opinions expressed in this note have been compiled from sources believed to be reliable but, neither Tamesis, nor any of its partners, officers, or employees accept liability from any loss arising from the use hereof or makes any representations as to its accuracy and completeness. Any opinions, forecasts or estimates herein constitute a judgement as at the date of this note. There can be no assurance that future results or events will be consistent with any such opinions, forecasts or estimates. Past performance should not be taken as an indication or guarantee of future performance, and no representation or warranty, express or implied is made regarding future performance. This information is subject to change without notice, its accuracy is not guaranteed, it may be incomplete or condensed and it may not contain all material information concerning the company and its subsidiaries. Tamesis is not agreeing to nor is it required to update the opinions, forecasts or estimates contained herein.
The value of any securities or financial instruments mentioned in this note can fall as well as rise. Foreign currency denominated securities and financial instruments are subject to fluctuations in exchange rates that may have a positive or adverse effect on the value, price or income of such securities or financial instruments. Certain transactions, including those involving futures, options and other derivative instruments, can give rise to substantial risk and are not suitable for all investors. This note does not have regard to the specific instrument objectives, financial situation and the particular needs of any specific person who may receive this note.
Tamesis (or its partners, officers or employees) may, to the extent permitted by law, own or have a position in the securities or financial instruments (including derivative instruments or any other rights pertaining thereto) of any company or related company referred to herein, and may add to or dispose of any such position or may make a market or act as principle in any transaction in such securities or financial instruments. Partners of Tamesis may also be directors of any of the companies mentioned in this note. Tamesis may, from time to time, provide or solicit investment banking or other financial services to, for or from any company referred to herein. Tamesis (or its partners, officers or employees) may, to the extent permitted by law, act upon or use the information or opinions presented herein, or research or analysis on which they are based prior to the material being published.

Prepared by Tamesis Partners LLP See final two pages for important disclosures
22
Further Disclosures for the United Kingdom
This note has been issued by Tamesis Partners LLP, an Appointed Representative of Arlington Group Asset Management Limited, a firm authorised and regulated by the Financial Conduct Authority. This note is not for distribution to private customers.
This note is not intended for use by, or distribution to, US corporations that do not meet the definition of a major US institutional investor in the United States or for use by any citizen or resident of the United States.
This publication is confidential for the information of the addressee only and may not be reproduced in whole or in part, copies circulated, or disclosed to another party, without the prior written consent of Tamesis. Securities referred to in this note may not be eligible for sale in those jurisdictions where Tamesis is not authorised or permitted by local law to do so. In particular, Tamesis does not permit the distribution or redistribution of this note to non-professional investors or other persons to whom disclosure would contravene local securities laws. Tamesis expressly disclaims and will not be held responsible in any way, for third parties who affect such redistribution. © 2017