Metrics That Matter - c.ymcdn.com · PDF fileMetrics That Matter . Supporting IT Decision and...
43
LIG Name goes here © 2012 Migration Technologies Inc. Randy Steinberg – Migration Technologies January 23, 2012 Metrics That Matter Supporting IT Decision and Strategy at the Senior Executive Level Pittsburgh itSMF Local Interest Group
-
Upload
truongkiet -
Category
Documents
-
view
214 -
download
1
Transcript of Metrics That Matter - c.ymcdn.com · PDF fileMetrics That Matter . Supporting IT Decision and...

LIG Name goes here © 2012 Migration Technologies Inc.
Randy Steinberg – Migration Technologies January 23, 2012
Metrics That Matter Supporting IT Decision and Strategy at the Senior Executive Level
Pittsburgh itSMF Local Interest Group
. Pittsburgh Local Interest Group © 2012 Migration Technologies 2
• The Metrics Problem
• The Metrics Model
• A Tour Through Metrics Hell
• 7 Killer IT Metrics
• Implementing A Metrics Program
Agenda:

© 2012 Migration Technologies Inc.
Key Challenges Many IT Organizations Have With Metrics
The Metrics Problem

. Pittsburgh Local Interest Group © 2012 Migration Technologies 4
This Happens All Too Often….
“We Can’t Convince Management How Important Our Incident Management Project Is”
“Our ITIL/ITSM Effort Is Losing Steam”
“No One Recognizes the IT Value We Are Delivering”
Management: “Where’s The Value? What Are We Getting For Our Money?”

. Pittsburgh Local Interest Group © 2012 Migration Technologies 5
Actual IT Excuses For Not Measuring What they sometimes say… What they are really saying…
“We have other priorities…” “We don’t have the tools…” “We don’t want others to see how well or poorly we are doing…” “We’re uncomfortable about letting others see our performance levels…”
“We know what’s good for the business and prefer to operate without validating our value “We expect the tools to tell us what to measure and if we can’t be perfect we can’t be responsible…” “We prefer to keep our management totally blind about what we are doing…” “We’ve gotten away with this for years – we intend to continue to get away with this…”
When asked – most IT organizations generate metrics “because management asked us to…”

. Pittsburgh Local Interest Group © 2012 Migration Technologies 6
© 2007 OGC – ITIL Continual Service Improvement
Measuring IT – Best Practices Per ITIL Why does IT start here (the 2nd step) most of the time?
. Pittsburgh Local Interest Group © 2012 Migration Technologies 7
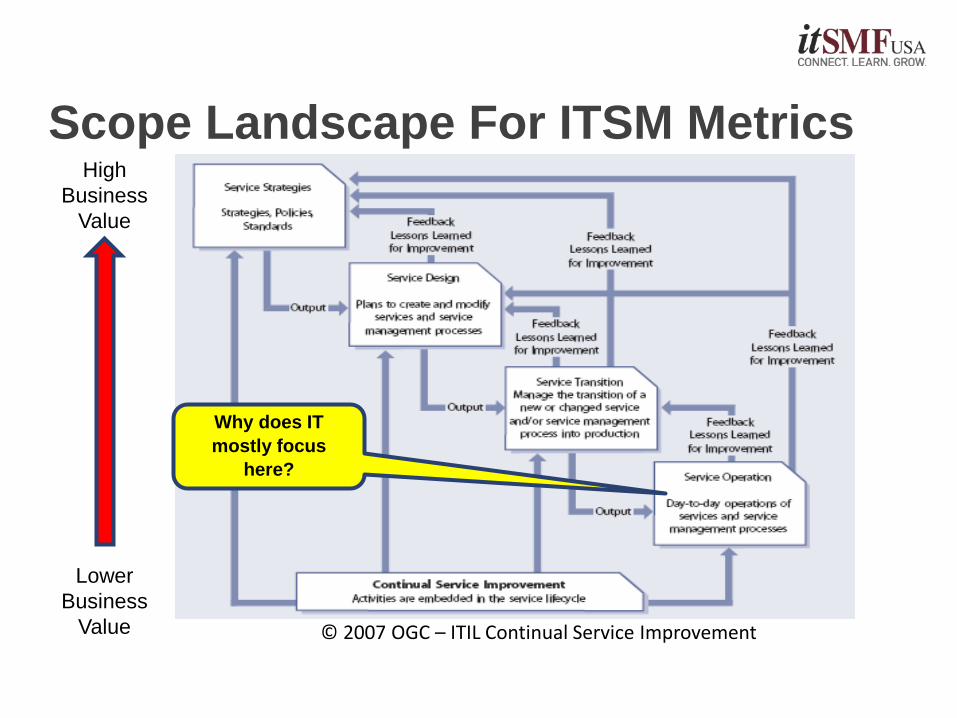
© 2007 OGC – ITIL Continual Service Improvement
Scope Landscape For ITSM Metrics High
Business Value
Lower Business
Value
Why does IT mostly focus
here?
. Pittsburgh Local Interest Group © 2012 Migration Technologies 8
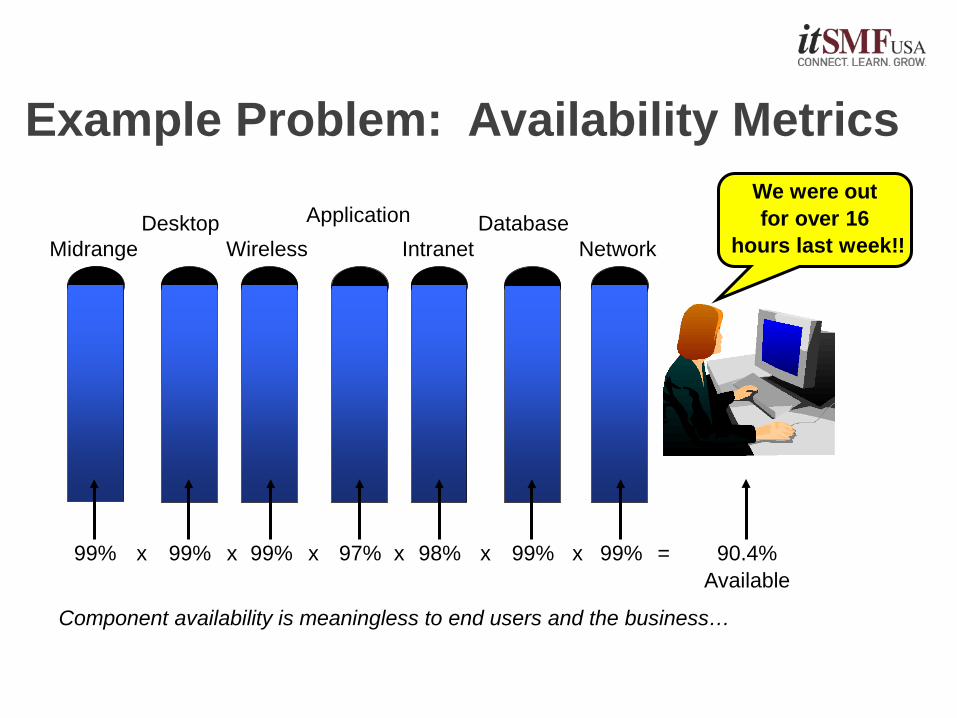
Example Problem: Availability Metrics
Desktop Application Network Intranet
Database Wireless Midrange
99% 99% 99% 97% 98% 99% 99% x x x x x x = 90.4% Available
We were out for over 16
hours last week!!
Component availability is meaningless to end users and the business…
. Pittsburgh Local Interest Group © 2012 Migration Technologies 9
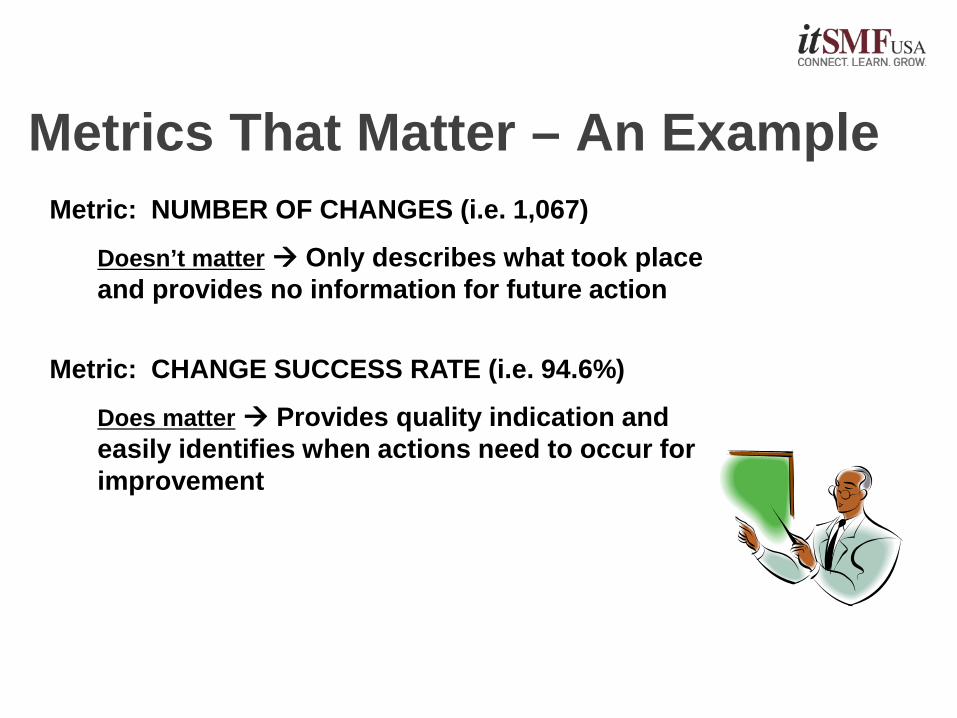
Metrics That Matter – An Example Metric: NUMBER OF CHANGES (i.e. 1,067)
Doesn’t matter Only describes what took place and provides no information for future action
Metric: CHANGE SUCCESS RATE (i.e. 94.6%)
Does matter Provides quality indication and easily identifies when actions need to occur for improvement
. Pittsburgh Local Interest Group © 2012 Migration Technologies 10
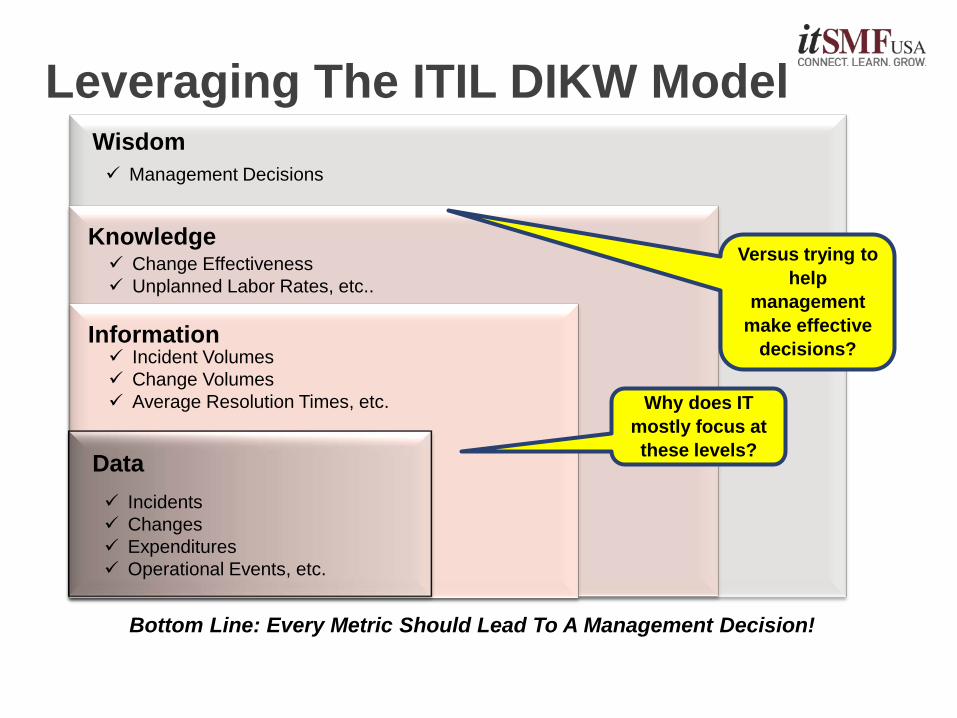
Leveraging The ITIL DIKW Model
Data
Information
Knowledge
Wisdom
Incidents Changes Expenditures Operational Events, etc.
Incident Volumes Change Volumes Average Resolution Times, etc.
Change Effectiveness Unplanned Labor Rates, etc..
Management Decisions
Why does IT mostly focus at these levels?
Versus trying to help
management make effective
decisions?
Bottom Line: Every Metric Should Lead To A Management Decision!
© 2012 Migration Technologies Inc.
Assembling the types of metrics that can be used for providing value
The Metrics Model
. Pittsburgh Local Interest Group © 2012 Migration Technologies 12
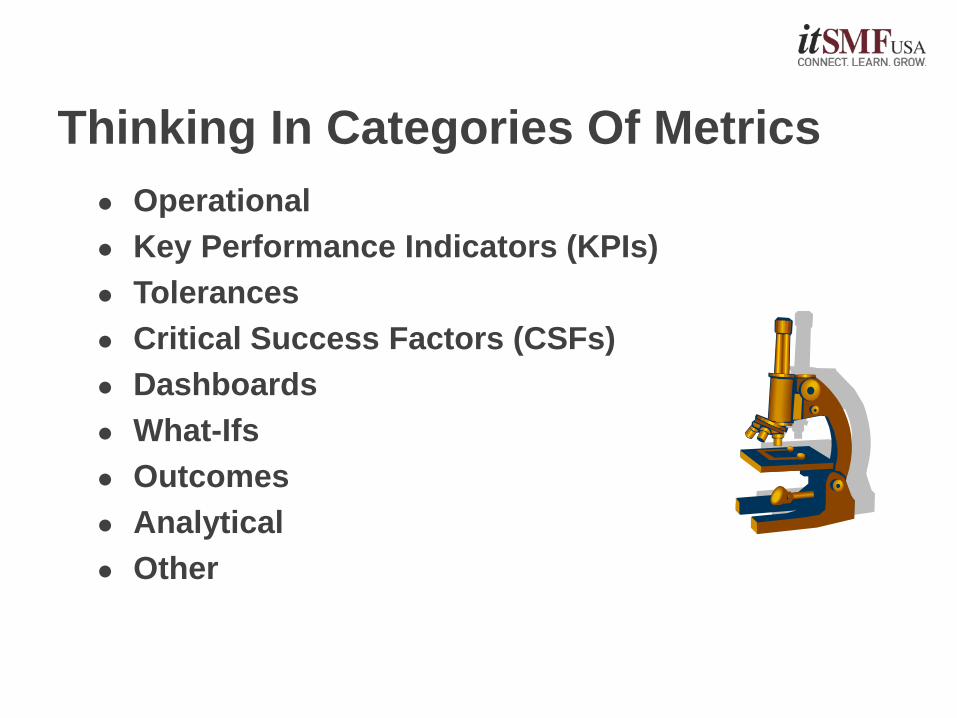
Thinking In Categories Of Metrics Operational Key Performance Indicators (KPIs) Tolerances Critical Success Factors (CSFs) Dashboards What-Ifs Outcomes Analytical Other

. Pittsburgh Local Interest Group © 2012 Migration Technologies 13
Operational Key
Performance Indicators
Critical Success Factors
Tolerances
Example: • # incidents • # changes
Example: • % of changes
causing incidents
Example: • Protect services when
making changes
Example: • 0% Target • 5% Threshold
Dashboards and Reports
Putting Metrics Categories Together

. Pittsburgh Local Interest Group © 2012 Migration Technologies 14
Metrics Category: Operational Metrics that reflect day to day observations of operational events
Used as input for Key Performance Indicators (KPIs)
Mistakenly used by IT when reporting to executives
Examples: • Total Number Of Changes Implemented • Number Of Incidents Reopened • Number Of Problems In Pipeline • Number Of Calls Handled • Customer Survey Results • Total Expended IT Costs

. Pittsburgh Local Interest Group © 2012 Migration Technologies 15
Metrics Category: - KPIs Metrics that indicate the key performance level of an operation or process to provide that basis for actionable management decisions
Calculated or derived from one or more Operational Metrics
Indicates whether one or more Critical Success Factors (CSFs) are being met
Falls within a target and acceptance range (Tolerance)
Examples: • Change Efficiency Rate • Change Labor Workforce Utilization • Incident Repeat Rate • Capacity Management Process Maturity • Total Service Penalties Paid
. Pittsburgh Local Interest Group © 2012 Migration Technologies 16
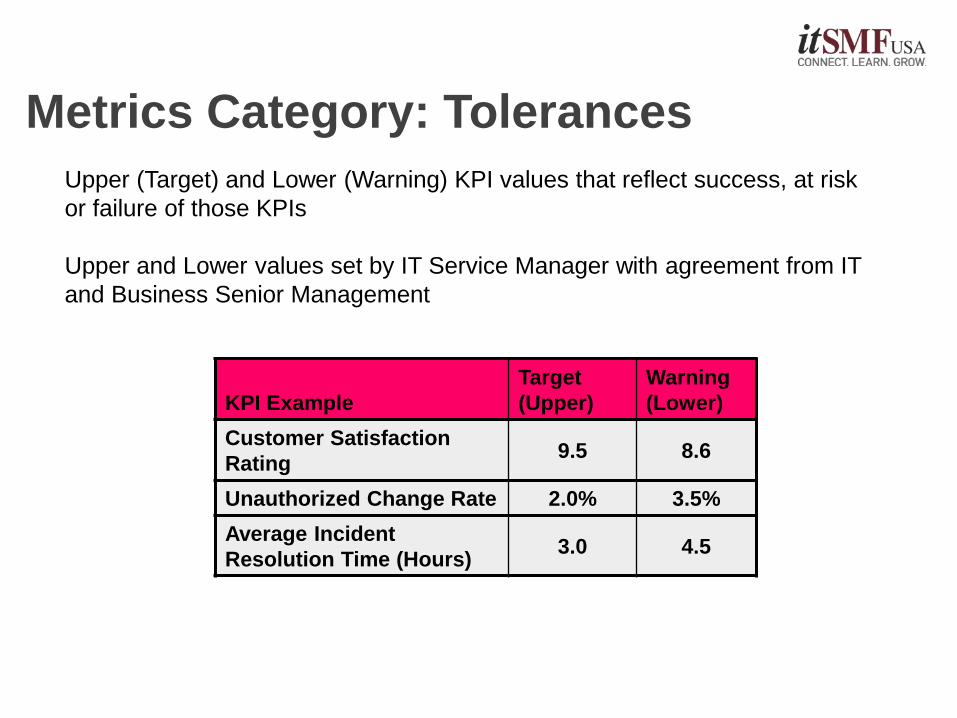
Metrics Category: Tolerances Upper (Target) and Lower (Warning) KPI values that reflect success, at risk or failure of those KPIs
Upper and Lower values set by IT Service Manager with agreement from IT and Business Senior Management
KPI Example Target (Upper)
Warning (Lower)
Customer Satisfaction Rating 9.5 8.6
Unauthorized Change Rate 2.0% 3.5% Average Incident Resolution Time (Hours) 3.0 4.5

. Pittsburgh Local Interest Group © 2012 Migration Technologies 17
Metrics Category: CSFs Metrics that represent key operational performance requirements which indicate whether a process or operation is performing successfully from a customer or business perspective
Calculated or derived from one or more KPIs and how those KPIs performed within tolerance levels
Indicated with a Performance Level
CSF Performance Level Protect Services When Making Changes High Provide Services At Acceptable Cost Medium

. Pittsburgh Local Interest Group © 2012 Migration Technologies 18
Metrics Category: Dashboards and Reports
Key metrics that are represented on a report or graphical interface that indicate whether the success, at risk or failure of a business operation
Used to quickly assess state of operation and take timely actions to correct operational deficiencies
May include drill down capabilities to determine more detailed performance issues

. Pittsburgh Local Interest Group © 2012 Migration Technologies 19
Other Metrics Categories: Outcomes Key indicators of business risk areas with performance indicators resulting from the success, at risk or failure of KPIs or CSFs
Used to quickly assess the level of risks created by process or operational deficiencies

. Pittsburgh Local Interest Group © 2012 Migration Technologies 20
Other Metrics Categories: What-Ifs Use cases derived from impending business decisions that will be used to “model” the impacts of those decisions on KPIs and CSFs
Associated with a Decision Impact Level
Characterized by increases/decreases in KPI/CSF results and whether they remain or fall outside of tolerances
What-If Impact Characterization Decision Impact
Level Impacts
Implement new ERP system
Increase in changes to infrastructure Low To Medium All Change KPIs
x +20%
Go through with ABC merger
Increase in infrastructure complexity
Medium To High All Service
Delivery KPIs x +30%

. Pittsburgh Local Interest Group © 2012 Migration Technologies 21
Other Metrics Categories: Analytical Metrics used to aid research into an issue, incident or service problem
Typically collected and reported on for ONE-TIME ONLY or SPECIAL PURPOSES
Examples • Number of incidents incurred by business unit ABC • Number of delta releases included in package releases • Number of incidents with resolution times > 8 hours
IT frequently makes the mistake of including these in regular reporting to senior management “just in case”. This results in a lot of wasted labor in building reports and clouds real management issues that need to be addressed!
. Pittsburgh Local Interest Group © 2012 Migration Technologies 22
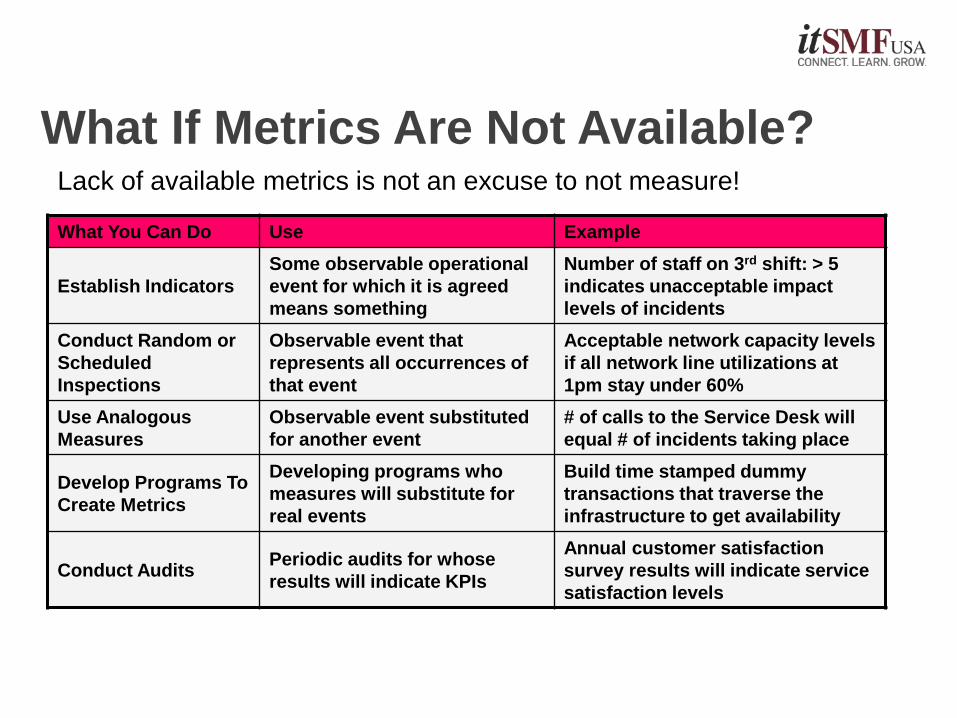
What If Metrics Are Not Available?
What You Can Do Use Example
Establish Indicators Some observable operational event for which it is agreed means something
Number of staff on 3rd shift: > 5 indicates unacceptable impact levels of incidents
Conduct Random or Scheduled Inspections
Observable event that represents all occurrences of that event
Acceptable network capacity levels if all network line utilizations at 1pm stay under 60%
Use Analogous Measures
Observable event substituted for another event
# of calls to the Service Desk will equal # of incidents taking place
Develop Programs To Create Metrics
Developing programs who measures will substitute for real events
Build time stamped dummy transactions that traverse the infrastructure to get availability
Conduct Audits Periodic audits for whose results will indicate KPIs
Annual customer satisfaction survey results will indicate service satisfaction levels
Lack of available metrics is not an excuse to not measure!

. Pittsburgh Local Interest Group © 2012 Migration Technologies 23
Metrics Modeling Tool
RANDY STEINBERG
Email: [email protected]
Easy To Use Excel-Based Provides Metrics For Many
ITIL Processes Provides Sources For Metrics Follows The Concepts In This
Presentation Provides Dashboard Results

© 2012 Migration Technologies Inc.
Things That Actual IT Organizations Have Run Into
A Tour Through Metrics Hell

. Pittsburgh Local Interest Group © 2012 Migration Technologies 25
“Fox In The Henhouse” Syndrome
The people doing the work should not be the people reporting about it!
Yes ma’am – just keep rebooting your PC when that happens!
Guess we can count this one as a closed problem!
. Pittsburgh Local Interest Group © 2012 Migration Technologies 26
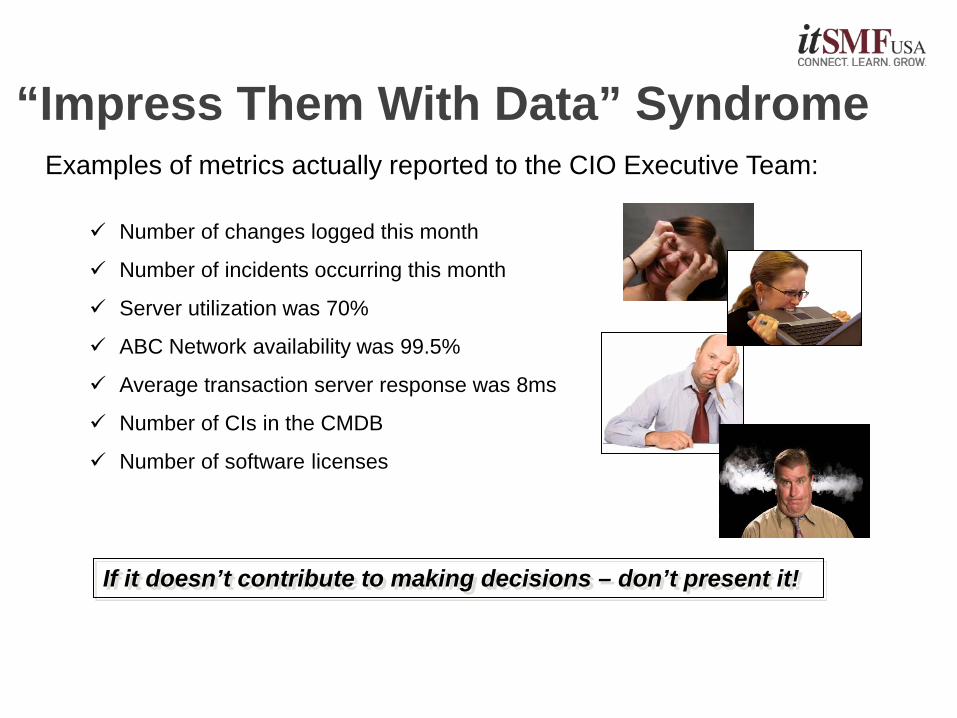
If it doesn’t contribute to making decisions – don’t present it!
Number of changes logged this month
Number of incidents occurring this month
Server utilization was 70%
ABC Network availability was 99.5%
Average transaction server response was 8ms
Number of CIs in the CMDB
Number of software licenses
Examples of metrics actually reported to the CIO Executive Team:
“Impress Them With Data” Syndrome

. Pittsburgh Local Interest Group © 2012 Migration Technologies 27
If it can’t be understood in 5 seconds or less – don’t do it!
“Creative Charts” Syndrome

. Pittsburgh Local Interest Group © 2012 Migration Technologies 28
Don’t expect that tools will tell you what to measure!
Services Bill ABC Dashboard Tool Collection Agent Licenses ODCB Server License Database License Server Platforms Integration Services Annual Maintenance Gold-Level Support Operations Staff
$85,000.00 $7,500.00 $1,080.00
$24,500.00 $72,500.00
$124,850.00 $15,500.00 $24,200.00
$178,500.00
“The Tool Is Everything” Syndrome

. Pittsburgh Local Interest Group © 2012 Migration Technologies 29
Don’t use metrics that require significant labor to produce!
Collection Correlation Extraction
RMF/SMF SNMP/MIB SAR Other
Aggregation and Collection
“Seemed Like A Good Idea” Syndrome
© 2012 Migration Technologies Inc.
Metrics That IT Hates Yet Senior Executives Love
7 Killer IT Metrics

. Pittsburgh Local Interest Group © 2012 Migration Technologies 31
Killer Measurement #1 – Incident Business Impact Ratio
Target Threshold
100% 90%
If Within Targets Demonstrates wonderful work IT is doing to keep things running
Demonstrates little or no value from investments in monitoring tools
Primary Improvement ITSM Focus Areas Event Management Availability Management Problem Management Incident Management
Service Design Service Operation
Number of incidents resolved Number of incidents reported to service desk
Calculated As
If Below Target Suggested Targets

. Pittsburgh Local Interest Group © 2012 Migration Technologies 32
Killer Measurement #2 – Unplanned Labor Ratio
Target Threshold
0% 10%
If Within Targets
IT is running efficiently and maximizing its investment in labor
IT labor is being diverted to non-value activities and may also be a root cause for project delays and inability to react to business needs
Primary Improvement ITIL Focus Areas
Calculated As
If Below Target Suggested Targets
Number of monthly hours spent on incidents and rework Total labor hours available
Problem Management Change Management Incident Management Capacity Management Availability Management
Service Design Service Operation Service Transition
. Pittsburgh Local Interest Group © 2012 Migration Technologies 33
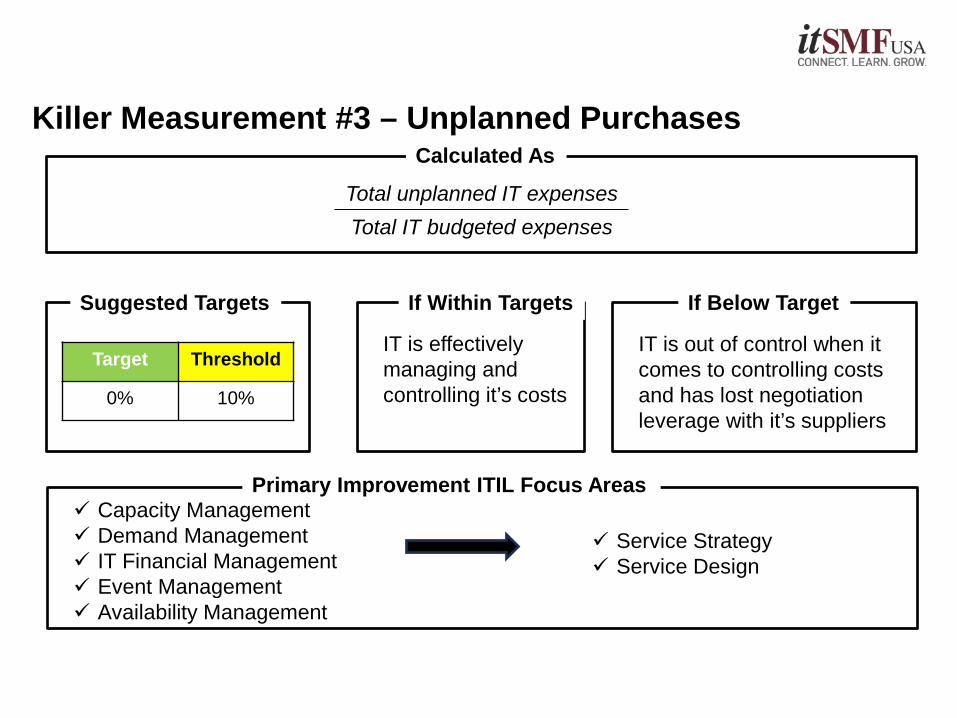
Killer Measurement #3 – Unplanned Purchases
Target Threshold
0% 10%
If Within Targets
IT is effectively managing and controlling it’s costs
IT is out of control when it comes to controlling costs and has lost negotiation leverage with it’s suppliers
Primary Improvement ITIL Focus Areas
Calculated As
If Below Target Suggested Targets
Total unplanned IT expenses Total IT budgeted expenses
Capacity Management Demand Management IT Financial Management Event Management Availability Management
Service Strategy Service Design
. Pittsburgh Local Interest Group © 2012 Migration Technologies 34
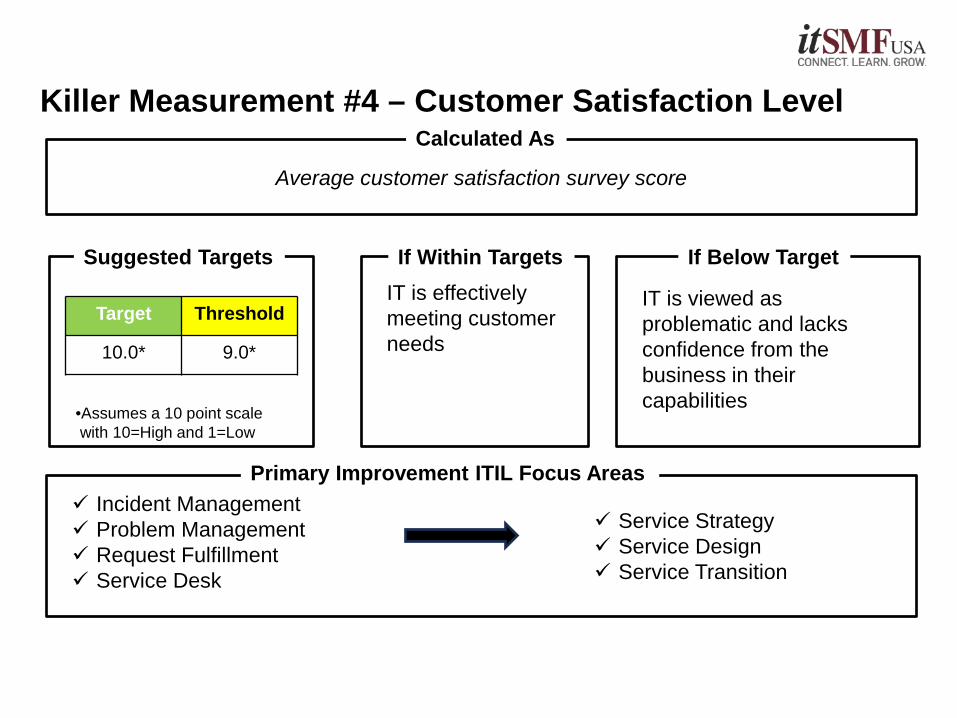
Killer Measurement #4 – Customer Satisfaction Level
Target Threshold
10.0* 9.0*
If Within Targets IT is effectively meeting customer needs
IT is viewed as problematic and lacks confidence from the business in their capabilities
Primary Improvement ITIL Focus Areas
Calculated As
If Below Target Suggested Targets
Incident Management Problem Management Request Fulfillment Service Desk
Service Strategy Service Design Service Transition
Average customer satisfaction survey score
•Assumes a 10 point scale with 10=High and 1=Low

. Pittsburgh Local Interest Group © 2012 Migration Technologies 35
Killer Measurement #5 – Change Efficiency Ratio
Target Threshold
100% 90%
If Within Targets
IT is effectively meeting and adapting to business needs and changes
IT is a bottleneck to the business and may be constraining business capabilities to open new markets and services
Primary Improvement ITIL Focus Areas
Calculated As
If Below Target Suggested Targets
Number of changes implemented defect free on time Total changes that have been requested
Change Management Release and Deployment Service Validation and Testing Request Fulfillment Demand Management
Service Strategy Service Transition
. Pittsburgh Local Interest Group © 2012 Migration Technologies 36
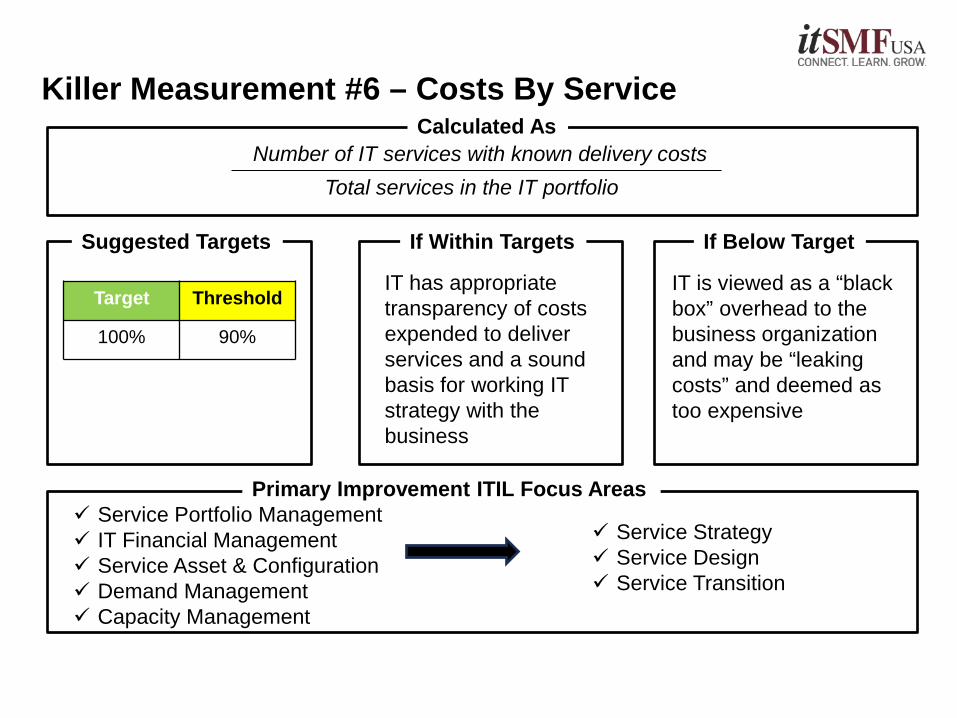
Killer Measurement #6 – Costs By Service
Target Threshold
100% 90%
If Within Targets
IT has appropriate transparency of costs expended to deliver services and a sound basis for working IT strategy with the business
IT is viewed as a “black box” overhead to the business organization and may be “leaking costs” and deemed as too expensive
Primary Improvement ITIL Focus Areas
Calculated As
If Below Target Suggested Targets
Number of IT services with known delivery costs Total services in the IT portfolio
Service Portfolio Management IT Financial Management Service Asset & Configuration Demand Management Capacity Management
Service Strategy Service Design Service Transition

. Pittsburgh Local Interest Group © 2012 Migration Technologies 37
Killer Measurement #7 – Availability By Service
Target Threshold
100% 90%
If Within Targets
IT services are available at levels that meet business needs
IT is providing little value and in extreme cases could be putting business revenue and reputation at risk
Primary Improvement ITIL Focus Areas
Calculated As
If Below Target Suggested Targets
Number of IT services meeting availability targets Total services in the IT portfolio
Service Portfolio Management Availability Management Problem Management Incident Management Event Management
Service Strategy Service Design Service Operation

© 2012 Migration Technologies Inc.
Establishing Your Metrics Capabilities
Implementing A Metrics Program
. Pittsburgh Local Interest Group © 2012 Migration Technologies 39
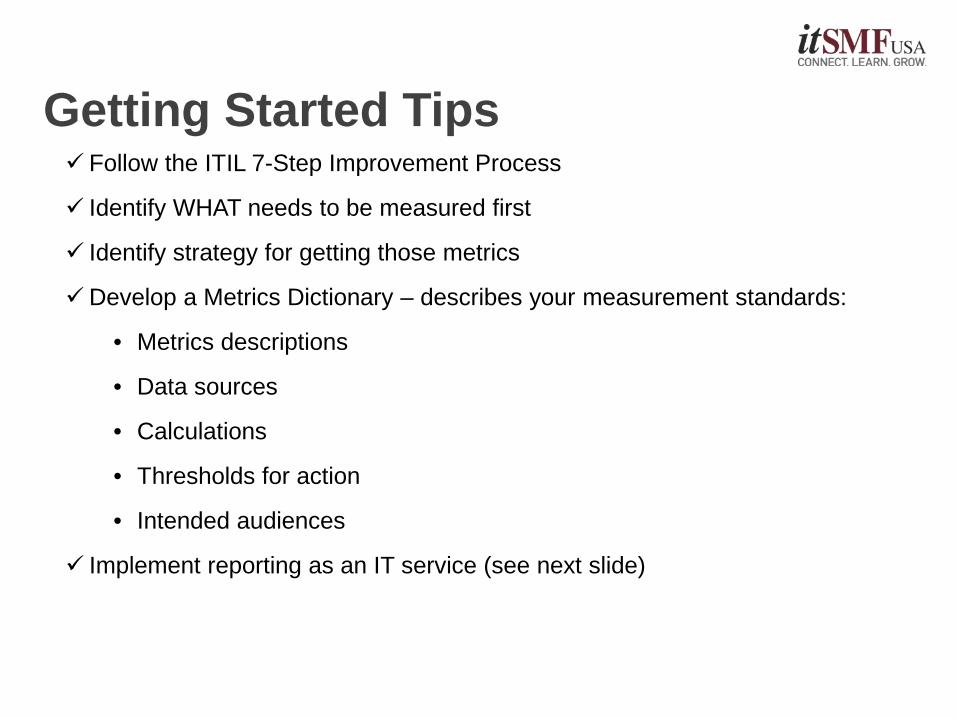
Getting Started Tips Follow the ITIL 7-Step Improvement Process
Identify WHAT needs to be measured first
Identify strategy for getting those metrics
Develop a Metrics Dictionary – describes your measurement standards:
• Metrics descriptions
• Data sources
• Calculations
• Thresholds for action
• Intended audiences
Implement reporting as an IT service (see next slide)

. Pittsburgh Local Interest Group © 2012 Migration Technologies 40
Build A Metrics Reporting Service Build and maintain a catalog of standard service reports that describe how well
services are being delivered and the overall quality of service delivery and support activities
Plan, design, build, test, implement and maintain strategies, procedures and technologies to assemble result data, create and distribute reports
Plan, design, build, test, implement and maintain strategies and technologies to provide management dashboards and reporting web sites
Build and maintain report distribution lists Plan, build, manage, maintain and coordinate a master set of service metrics,
calculations and assumptions Provide consulting services to identify and implement a best practice set of key
performance indicators, critical success factors and service targets for services Periodically conduct service audits to identify how well services are being delivered
and potential opportunities for improvement Periodically conduct reporting reviews with management to identify improvements
over the quality and use of reports provided
. Pittsburgh Local Interest Group © 2012 Migration Technologies 41
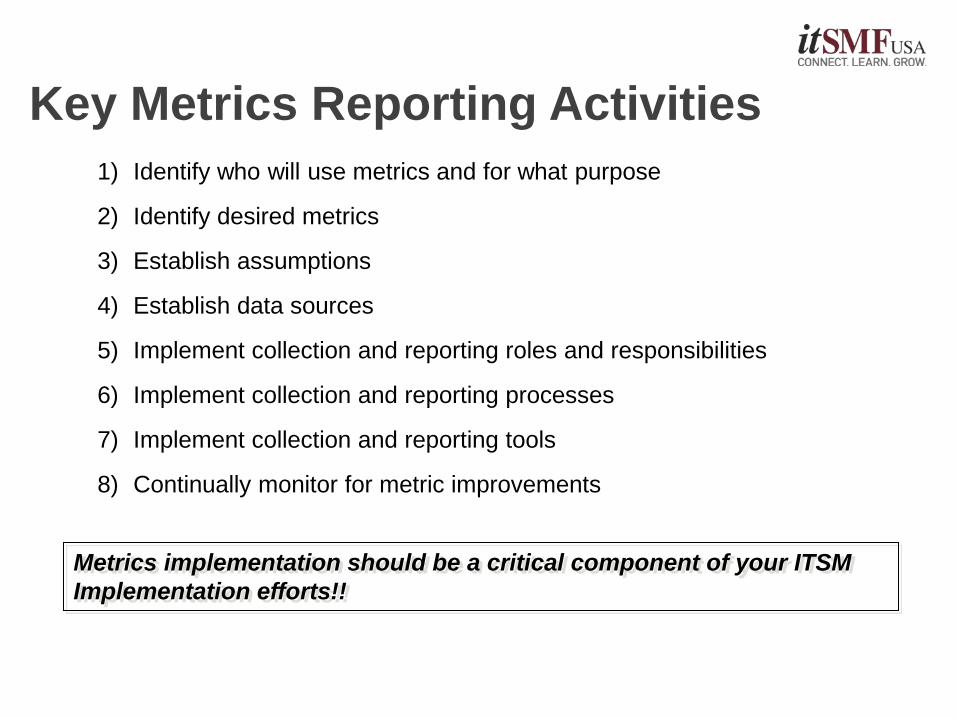
Key Metrics Reporting Activities 1) Identify who will use metrics and for what purpose
2) Identify desired metrics
3) Establish assumptions
4) Establish data sources
5) Implement collection and reporting roles and responsibilities
6) Implement collection and reporting processes
7) Implement collection and reporting tools
8) Continually monitor for metric improvements
Metrics implementation should be a critical component of your ITSM Implementation efforts!!

. Pittsburgh Local Interest Group © 2012 Migration Technologies 42
Key Takeaways Focus on metrics that lead to management decisions
Consider using categories of metrics that work together
Establish a metrics reporting “service”
Remember: ‒ “If you don't measure it, you can't manage it” ‒ “If you don't measure it, you can't improve it”

. Pittsburgh Local Interest Group © 2012 Migration Technologies 43
Discussion
RANDY STEINBERG
Email: [email protected]